Embed Size (px)
Citation preview

EFFECT OF FIRM LEVEL FACTORS ON FINANCIAL
PERFORMANCE OF LISTED FIRMS IN THE NAIROBI
SECURITIES EXCHANGE
ANTHONY MUGETHA IRUNGU
DOCTOR OF PHILOSOPHY
(Finance)
JOMO KENYATTA UNIVERSITY OF
AGRICULTURE AND TECHNOLOGY
2019
Effect of Firm Level Factors on Financial Performance of Listed Firms
in the Nairobi Securities Exchange
Anthony Mugetha Irungu
A Thesis Submitted in Partial Fulfilment for the Degree of Doctor of
Philosophy in Finance in the Jomo Kenyatta University of Agriculture
and Technology
2019
ii
DECLARATION
This thesis is my original work and has not been presented for a degree in any other
University.
Signature………………………………………….. Date ……………………………
Anthony Mugetha Irungu
This thesis has been submitted for examination with our approval as the University
supervisors
Signature………………………………………….. Date ……………………………
Prof. Willy Muturi, PhD
JKUAT, Kenya
Signature………………………………………….. Date ……………………………
Dr. Tabitha Nasieku, PhD
JKUAT, Kenya
Signature………………………………………….. Date ……………………………
Dr. Patrick Ngumi, PhD
JKUAT, Kenya

iii
DEDICATION
I dedicate this thesis to God Almighty for the guidance, strength, power of mind,
protection and skills and for giving me a healthy life. He has been the source of my
strength throughout this program and on His wings only have I soared. I also
wholeheartedly dedicated this work to my beloved parents (Mr. Simon Irungu and Mrs.
Mary Irungu), who have been my source of inspiration and strength when I thought of
giving up. To my lovely wife; Carol who has encouraged me all the way and whose
encouragement has made sure that I give it all it takes to finish that which I have started.
To my son Ryan who have been affected in every way possible by this quest. To my
brothers, sister, relatives, mentor, friends, and classmates who shared their words of
advice and encouragement to finish this study. Thank you. My love for you all can never
be quantified. God bless you.

iv
ACKNOWLEDGEMENT
I take this opportunity to express my sincere gratitude to my supervisors Prof. Willy
Muturi, Dr. Tabitha Nasieku and Dr.Patrick Ngumi for their continuous support of my
PhD study and related research, for their patience, motivation, and immense knowledge.
They have been there providing heartfelt support and guidance at all times and have
given me invaluable guidance, inspiration and suggestions in my quest for knowledge.
They have given me all the freedom to pursue my research, while silently and non-
obtrusively ensuring that I stay on course and do not deviate from the core of my
research. Without their able guidance, this thesis would not have been possible and I
shall eternally be grateful to them for their assistance.
I equally express my gratitude and heartfelt thanks to the entire staff and management of
JKUAT Main Campus who have been so helpful and cooperative in giving their support
at all times to help me achieve my goal. God bless you all.

v
TABLE OF CONTENTS
DECLARATION ........................................................................................................ ii
DEDICATION ........................................................................................................... iii
ACKNOWLEDGEMENT ......................................................................................... iv
TABLE OF CONTENTS ............................................................................................ v
LIST OF TABLES ................................................................................................... xiii
LIST OF FIGURES ................................................................................................. xvi
LIST OF APPENDICES ......................................................................................... xvii
ABBREVIATIONS AND ACRONYMS ............................................................... xviii
DEFINITION OF TERMS ...................................................................................... xix
ABSTRACT ............................................................................................................. xxi
CHAPTER ONE ......................................................................................................... 1
INTRODUCTION ...................................................................................................... 1
1.1 Background of the Study ..................................................................................... 1
1.1.1 Relationship between Firm Characteristics and Financial Performance ......... 2
1.1.2 Global Perspective of Firm Level Characteristics and Financial Performance 3
1.1.3 Regional Perspective of Firm Level Characteristics and Financial
Performance .......................................................................................................... 5
1.1.4 Local Perspective of Firm Level Characteristics and Financial Performance . 6

vi
1.1.5 Firms listed in Nairobi Securities Exchange (NSE) ....................................... 6
1.2 Statement of the Problem .................................................................................... 8
1.3 Research Objectives .......................................................................................... 10
1.3.1 General Objective ....................................................................................... 10
1.3.2 Specific Objectives ..................................................................................... 10
1.4 Research Hypotheses ......................................................................................... 10
1.5 Justification of the Study ................................................................................... 11
1.6 Scope of the Study ............................................................................................ 12
CHAPTER TWO ...................................................................................................... 13
LITERATURE REVIEW ......................................................................................... 13
2.1 Introduction ....................................................................................................... 13
2.2 Theoretical Review ........................................................................................... 13
2.2.1 Trade-off Theory ........................................................................................ 13
2.2.2 Liquidity Preference Theory ....................................................................... 15
2.2.3 Economies of Scale Theory ........................................................................ 16
2.2.4 Financial Distress Theory ........................................................................... 18
2.3 Conceptual Framework ..................................................................................... 19
2.3.1 Leverage ..................................................................................................... 20
2.3.2 Liquidity..................................................................................................... 22

vii
2.3.3 Asset Tangibility ........................................................................................ 24
2.3.4 Firm Size .................................................................................................... 25
2.3.5 Firm Age .................................................................................................... 27
2.3.6 Financial Performance ................................................................................ 28
2.4 Empirical Studies .............................................................................................. 30
2.4.1 Leverage and Financial Performance .......................................................... 30
2.4.2 Liquidity and Financial Performance .......................................................... 41
2.4.3 Asset Tangibility and Financial Performance .............................................. 47
2.4.4 Firm Size and Financial Performance ......................................................... 50
2.4.5 Firm Age and Financial Performance .......................................................... 56
2.4.6 Financial Performance ................................................................................ 58
2.5 Critique of the Literature ................................................................................... 59
2.6 Research Gaps ................................................................................................... 61
2.7 Summary of the Chapter .................................................................................... 63
CHAPTER THREE .................................................................................................. 65
RESEARCH METHODOLOGY ............................................................................. 65
3.1 Introduction ....................................................................................................... 65
3.2 Research Philosophy ......................................................................................... 65
3.3 Research Design ................................................................................................ 66
viii
3.4 Target Population .............................................................................................. 66
3.5 Sample and Sampling Technique ....................................................................... 67
3.6 Data Collection Procedure ................................................................................. 67
3.7 Data Analysis .................................................................................................... 68
3.7.1 Measure of Study Variables ........................................................................ 70
3.8 Diagnostic Tests ................................................................................................ 70
3.8.1 Panel Unit Root Test................................................................................... 70
3.8.2 Normality Tests .......................................................................................... 71
3.8.3 Multicollinearity ......................................................................................... 71
3.8.4 Heteroscedasticity ...................................................................................... 71
3.8.5 Autocorrelation........................................................................................... 71
3.8.6 Test for Fixed or Random Effects ............................................................... 72
3.9 Hypothesis Testing ............................................................................................ 74
CHAPTER FOUR..................................................................................................... 75
RESEARCH FINDINGS AND DISCUSSIONS ...................................................... 75
4.1 Introduction ....................................................................................................... 75
4.2 Descriptive Statistics ......................................................................................... 75
4.3 Trend Analysis .................................................................................................. 77
4.4 Correlation Analysis .......................................................................................... 81
ix
4.5 Diagnostic Tests ................................................................................................ 84
4.5.1 Panel Unit Root Tests ................................................................................. 84
4.5.2 Test for Normality ...................................................................................... 85
4.5.3 Test for Multicollinearity ............................................................................ 87
4.5.4 Heteroskedasticity Test ............................................................................... 87
4.5.5 Test for Autocorrelation.............................................................................. 88
4.5.6 Hausman Test ............................................................................................. 89
4.6 Panel Regression Analysis Results .................................................................... 92
4.6.1 Effect of Leverage on ROA ........................................................................ 92
4.6.2 Effect of Leverage on ROE ......................................................................... 94
4.6.3 Effect of Liquidity on ROA ........................................................................ 97
4.6.4 Effect of Liquidity on ROE ......................................................................... 99
4.6.5 Effect of Asset Tangibility on ROA .......................................................... 102
4.6.6 Effect of Asset Tangibility on ROE .......................................................... 104
4.6.7 Effect of Firm Size on ROA ..................................................................... 107
4.6.8 Effect of Firm Size on ROE ...................................................................... 110
4.6.9 Multiple Regression of Firm Level Factors on ROA ................................. 112
4.6.10 Multiple Regression of Firm Level Factors on ROE ................................ 117
4.6.11 Moderation Effect of Firm Age on ROA ................................................. 121
x
4.6.12 Moderation Effect of Firm Age on ROE ................................................. 124
4.7 Hypotheses Testing ......................................................................................... 128
4.7.1 Objective One........................................................................................... 128
4.7.2 Objective Two .......................................................................................... 129
4.7.3 Objective Three ........................................................................................ 130
4.7.4 Objective Four .......................................................................................... 131
4.7.5 Objective Five .......................................................................................... 131
4.8 Discussion of Key Findings ............................................................................. 133
4.8.1 Effects of Leverage on Financial Performance .......................................... 133
4.8.2 Effects of Liquidity on Financial Performance .......................................... 133
4.8.3 Effects of Asset Tangibility on Financial Performance .............................. 134
4.8.4 Effects of Firm Size on Financial Performance ......................................... 136
4.8.5 Effects of Firm Age as a Moderator of Firm Level Factors on Financial
Performance ...................................................................................................... 137
4.9 Summary of Hypotheses .................................................................................. 138
4.10 Model Optimization and Revised Conceptual Framework ............................. 139
4.11 Summary of the Chapter ................................................................................ 142

xi
CHAPTER FIVE .................................................................................................... 143
SUMMARY, CONCLUSION AND RECOMMENDATIONS ............................. 143
5.1 Introduction ..................................................................................................... 143
5.2 Summary of Major Findings ............................................................................ 143
5.2.1 Effect of Leverage on Financial Performance ........................................... 143
5.2.2 Effect of Liquidity on Financial Performance ........................................... 144
5.2.3 Effect of Asset Tangibility on Financial Performance ............................... 144
5.2.4 Effect of Firm Size on Financial Performance ........................................... 145
5.2.5 Moderating Effect of Firm Age and Firm Level Factors on Financial
Performance ...................................................................................................... 145
5.3 Conclusion ...................................................................................................... 146
5.3.1 Leverage ................................................................................................... 146
5.3.2 Liquidity................................................................................................... 146
5.3.3 Asset Tangibility ...................................................................................... 147
5.3.4 Firm Size .................................................................................................. 148
5.3.5 Moderating Effect of Firm Age ................................................................. 148
5.4 Recommendations ........................................................................................... 149
5.4.1 Recommendations for Management .......................................................... 149
5.4.2 Policy Recommendations ......................................................................... 150

xii
5.4.3 Academic Recommendations .................................................................... 150
5.5 Contribution to the Body of Knowledge .......................................................... 150
5.6 Areas for further research ................................................................................ 151
REFERENCES ....................................................................................................... 152
APPENDICES ......................................................................................................... 175

xiii
LIST OF TABLES
Table 3.1 Measurement of variables ........................................................................... 70
Table 3.2: Summary of Statistical Test of Hypotheses ................................................ 74
Table 4.1: Descriptive Statistics for Financial Sector .................................................. 75
Table 4.2: Descriptive Statistics for Non-Financial Sector .......................................... 76
Table 4.3: Correlation Matrix for Financial Firms ...................................................... 81
Table 4.4: Correlation Matrix for Non-Financial Firms .............................................. 83
Table 4.5: Multicollinearity Results ........................................................................... 87
Table 4.6: Unit root .................................................................................................... 85
Table 4.7: Normality Test for Financial Sector ........................................................... 86
Table 4.8: Normality Test for Non-Financial Sector ................................................... 86
Table 4.9: Heteroskedasticity Test Results ................................................................. 88
Table 4.10: Serial Correlation Tests ........................................................................... 89
Table 4.11: Hausman Test for ROA ........................................................................... 90
Table 4.12: Hausman Test for ROE ............................................................................ 91
Table 4.13: Leverage on ROA for Financial Firms ..................................................... 92
Table 4.14: Leverage on ROA for Non-Financial Firms ............................................. 93
Table 4.15: Leverage on ROE for Financial Firms ..................................................... 95
xiv
Table 4.16: Leverage on ROE for Non-Financial Firms.............................................. 96
Table 4.17: Liquidity on ROA for Financial Firms ..................................................... 97
Table 4.18: Liquidity on ROA for Non-Financial Firms ............................................. 98
Table 4.19: Liquidity on ROE for Financial Firms ................................................... 100
Table 4.20: Liquidity on ROE for Non-financial Firms ............................................ 101
Table 4.21: Asset Tangibility on ROA for Financial ................................................. 102
Table 4.22: Asset Tangibility on ROA for Non-Financial Firms ............................... 103
Table 4.23: Asset Tangibility on ROE for Financial Firms ....................................... 105
Table 4.24: Asset Tangibility on ROE for Non-financial firms ................................. 106
Table 4.25: Firm Size on ROA for Financial Firms .................................................. 107
Table 4.26: Firm Size on ROA for Non-financial Firms ........................................... 109
Table 4.27: Firm Size on ROE for Non-financial Firms ............................................ 110
Table 4.28: Firm Size on ROE for Non-Financial Firms ........................................... 111
Table 4.29: Multiple Regression on ROA for Financial Firms .................................. 113
Table 4.30: Multiple Regression on ROA for Non-Financial Firms .......................... 115
Table 4.31: Multiple Regression on ROE for Financial Firms................................... 117
Table 4.32: Multiple Regression on ROE for Non-Financial Firms ........................... 119
Table 4.33: Moderation Effect of Firm Age Results on ROA for Financial Firms ..... 122
xv
Table 4.34: Moderation Effect of Firm Age Results on ROA for Non-Financial Firms
............................................................................................................. 123
Table 4.35: Moderation Effect of Firm Age Results on ROE for Financial Firms ..... 125
Table 4.36: Moderation Effect of Firm Age Results on ROE for Non-Financial Firms
............................................................................................................. 127
Table 4.37: Summary of Hypotheses ........................................................................ 138
Table 4.38: Summary of Findings ............................................................................ 141
xvi
LIST OF FIGURES
Figure 2.1: Conceptual Framework ............................................................................ 20
Figure 4.1: Trend Analysis ......................................................................................... 78
Figure 4.2: Revised Conceptual Framework ............................................................. 140

xvii
LIST OF APPENDICES
Appendix I: Target Population ................................................................................. 175
Appendix II: Secondary Data Collection Template .................................................. 178

xviii
ABBREVIATIONS AND ACRONYMS
CEOs Chief Executive Officers
CMA Capital Market Authority
EA East Africa
NSE Nairobi Securities Exchange
ROA Return on Assets
ROE Return on Equity
SOX Sarbanes Oxley Act
SPSS Statistical Package for Social Sciences
SWM Shareholder Wealth Maximization
OECD: Organization for Economic Co-operation and Development
xix
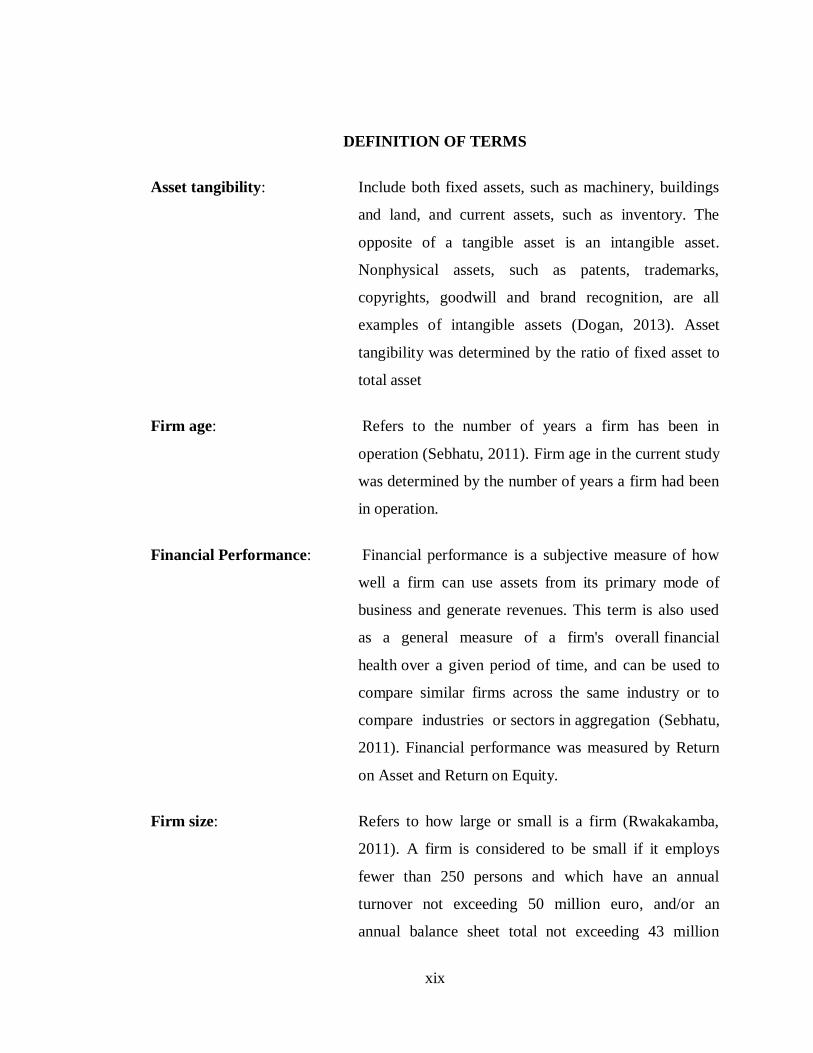
DEFINITION OF TERMS
Asset tangibility: Include both fixed assets, such as machinery, buildings
and land, and current assets, such as inventory. The
opposite of a tangible asset is an intangible asset.
Nonphysical assets, such as patents, trademarks,
copyrights, goodwill and brand recognition, are all
examples of intangible assets (Dogan, 2013). Asset
tangibility was determined by the ratio of fixed asset to
total asset
Firm age: Refers to the number of years a firm has been in
operation (Sebhatu, 2011). Firm age in the current study
was determined by the number of years a firm had been
in operation.
Financial Performance: Financial performance is a subjective measure of how
well a firm can use assets from its primary mode of
business and generate revenues. This term is also used
as a general measure of a firm's overall financial
health over a given period of time, and can be used to
compare similar firms across the same industry or to
compare industries or sectors in aggregation (Sebhatu,
2011). Financial performance was measured by Return
on Asset and Return on Equity.
Firm size: Refers to how large or small is a firm (Rwakakamba,
2011). A firm is considered to be small if it employs
fewer than 250 persons and which have an annual
turnover not exceeding 50 million euro, and/or an
annual balance sheet total not exceeding 43 million
xx
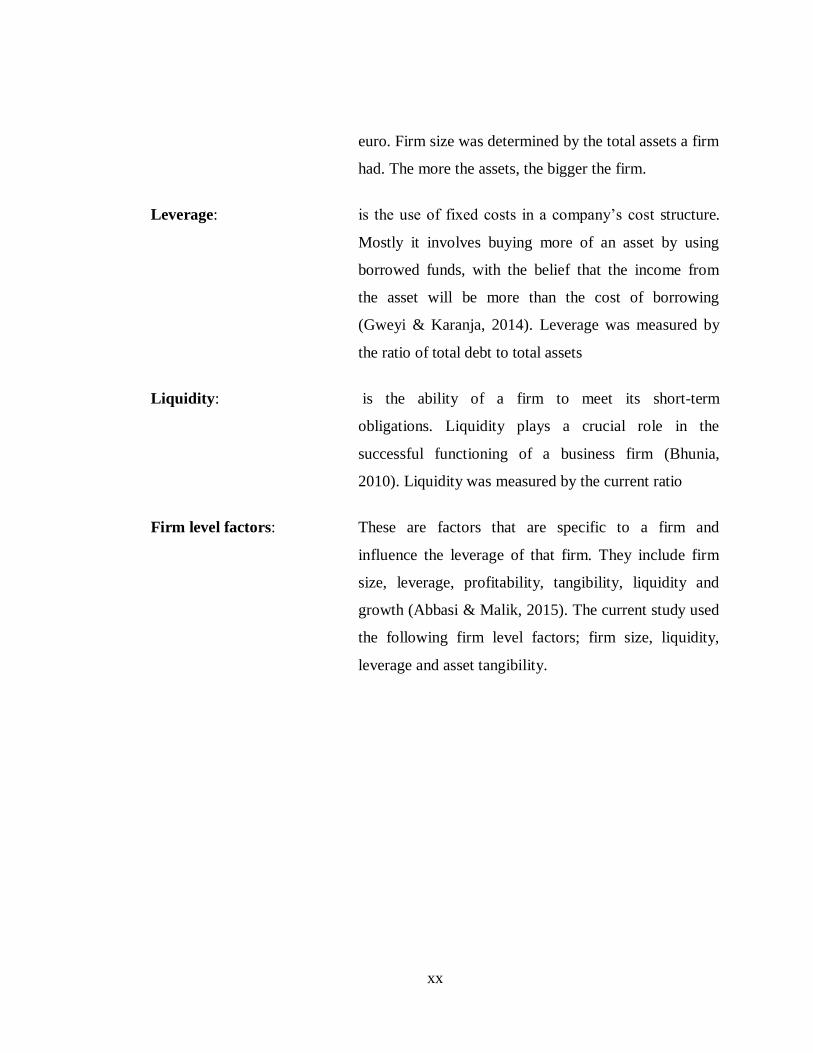
euro. Firm size was determined by the total assets a firm
had. The more the assets, the bigger the firm.
Leverage: is the use of fixed costs in a company’s cost structure.
Mostly it involves buying more of an asset by using
borrowed funds, with the belief that the income from
the asset will be more than the cost of borrowing
(Gweyi & Karanja, 2014). Leverage was measured by
the ratio of total debt to total assets
Liquidity: is the ability of a firm to meet its short-term
obligations. Liquidity plays a crucial role in the
successful functioning of a business firm (Bhunia,
2010). Liquidity was measured by the current ratio
Firm level factors: These are factors that are specific to a firm and
influence the leverage of that firm. They include firm
size, leverage, profitability, tangibility, liquidity and
growth (Abbasi & Malik, 2015). The current study used
the following firm level factors; firm size, liquidity,
leverage and asset tangibility.
xxi
ABSTRACT
The Kenya government and the private companies have put great efforts in ensuring the
existence of a favorable environment for doing business in the country and more so for
listed firms. Consequently, while some firms listed in the NSE have improved in
performance, there are others that have experienced declining fortunes and some have
even been delisted from the NSE over the last decade. The general objective of the study
was to determine the effect of Selected Firm Level Factors on Financial Performance of
financial and non-financial firms in the Nairobi Securities Exchange. The specific
objectives of the study was to determine the effect of leverage, liquidity, asset
tangibility, firm size and to determine the moderating effect of firm age on the
relationship between firm level factors and financial performance of listed firms in the
Nairobi securities exchange. The study employed cross sectional research design. This
study targeted all the 64 firms listed on the Nairobi Securities Exchange. A census of all
the 64 firms listed in Nairobi Securities Exchange was used as a unit of analysis.
Secondary data extracted from the financial statements was used to compute the relevant
ratios and encompassed panel data. The study employed a dynamic panel data regression
and spearman’s correlation to test the relationship between the variables across the
sectors. Test of hypothesis was done at 95% confidence interval. The study found out
that there was a negative and significant relationship between leverage and financial
performance of financial and non-financial firms. There was a positive and significant
relationship between liquidity, assets tangibility, firm size with financial performance of
financial and non-financial firms. Firm age was revealed to be a good moderator on the
relationship between firm level factors and financial performance. Based on the findings,
the study concluded that liquidity, asset tangibility and firm size have a positive and
significant effect on financial performance while leverage has negative and significant
effect on financial performance as measured using ROA and ROE for both financial and
non-financial firms listed in NSE. The study recommended for policy makers of the
listed firms to embrace leverage, liquidity, asset tangibility and firm size on their
strategic decision-making. These indicators will further guide in expanding the
interpretation of the financial dynamics in the listed firms at the Nairobi securities
exchange and other related firms. Since the study concentrated only on firms listed at the
NSE, further studies can explore non-listed firms and incorporate other variables that
influence financial performance such as exchange rates, economic growth, interest rates
and inflation.
1
CHAPTER ONE
INTRODUCTION
1.1 Background of the Study
Firm characteristics are usually associated to firm financial performance and these
include firm size (Dogan, 2013), leverage (Dogan, 2013), firm age (Yazdanfar, 2013),
liquidity (Dogan, 2013), board size (Vafeas, 1999), asset tangibility, unique technology,
human capital and market power (Bresnahan, Brynjolfsson & Hitt, 2002). There are two
diverse opinions on what really influences firm performance. The first viewpoint is that
it is actually firm characteristics that highly influence performance (Galbreath &
Galvins, 2008) whereas the second point view is that industry characteristics are the
ones influencing firm performance.
Performance in a firm reflects the implementation of strategies that give competitive
advantage over other firms. Whilst performance measurement is financial and non-
financial, firm’s characteristics do contribute to firm’s performance. Decision making
process of a firm relies heavily on its financial performances that determine the direction
the firm can take in the future. Decisions may therefore be base (Robert Baum & Wally,
2003) on firm factors such as firm size, leverage, liquidity, firm age, asset tangibility and
market power.
Financial performance plays an imperative role in the firm performance that is expressed
in monetary term. Financial performance emphasizes on variables related directly to the
financial report. It is prudent that before investing their funds, investors should first have
knowledge about the performance of the firm (Deitiana & Habibuw, 2015). The modest
way to determine the performance of a firm is to look at the company’s financial
statement. Due to intense competition among the firms, a firm is expected to be able to
maintain and/or improve its performance in order to compete with others. Consequently,
the firm can be able to increase its market share as well as reduce its operational costs.
2
This is the direction the firm can take to edge its competitors and remain viable;
conversely it can register dismal performance and be edged out of the business (Porter,
2011).
Stiff competition among firms has resulted to unhealthy business operations leading to
loses. This is despite the favorable environment guaranteed for firms to operate on, and
strategies employed by the firms to stay afloat (Yahaya, Farouk, Yusuf & Dania, 2015).
Firm’s internal systems can be attributed to the nonperformance in spite of favorable
environment. Firm’s characteristics play an important role in its internal systems that
may be attributing to non-performance in spite of favorable business environment.
1.1.1 Relationship between Firm Characteristics and Financial Performance
Firm characteristics have been widely associated with its performance, both financially
and non-financially. One of the firm characteristic that is constantly associated to firm
performance is firm size commonly measured by either natural logarithm of assets, or
sales or employees. Bigger firms are presumed to be more efficient than smaller ones
(Hawawini, Subramanian & Verdin, 2003). The market power and access to capital
markets of large firms may give them access to investment opportunities that are not
available to smaller ones. Therefore, firm size helps in achieving economies of scale
(Kaguri, 2013).
Leverage allows a greater potential returns to the investor than otherwise would have
been available, but the potential loss is also greater: if the investment becomes
worthless, the loan principal and all accrued interest on the loan still need to be repaid.
This constitutes financial risk. The degree of this financial risk is related to the firm’s
financial structure. The total combination of common equity, preferred stock and short
and long-term liabilities is referred to as financial structure. That is, the manner in which
the firm finances its assets constitutes its financial structure. If short-term liabilities are
subtracted from the firm’s financial structure, we obtain its capital structure (Naceur &
Goaied, 2008). Leverage therefore opens up opportunities for rivalry predation in
3
concentrated product markets, thus conditioning the performance effect of leverage on
the degree of competition in the financial performance of a firm.
There are three liquidity ratios that are used for this purpose, including the current ratio,
the quick ratio and the capital ratio. Liquidity not only helps to ensure that a person or
business always has a reliable supply of cash close at hand, but it is a powerful tool
when it comes to determining the financial health of future investments as well
(Clementi, 2001).
Firm age (measured as the number of years a company is operating in the market since it
was founded) is an important determinant of financial performance. According to the life
cycle effect, younger companies are more dynamic and more volatile in their growth
experience than older companies are (Evans, 1987). Maturity brings stability in growth
as firms learn more precisely their market positioning, cost structures and efficiency
levels.
Firm characteristics are potential factors contributing to financial performance. Firm size
can determine efficiency, market power, access to capital and achievement of economies
of scale. Leverage allows a greater potential returns to the investor which constitutes a
financial risk. The degree of this financial risk is related to the firm’s financial structure.
Similarly, liquidity influences the successful functioning of a business firm by
determining the financial health of future investments. The probability of firm growth,
firm failure, and the variability of firm growth decreases as firm’s age. This can be
attributed to the improvement of strategies to suite the changing business environments
(Kioko, 2013).
1.1.2 Global Perspective of Firm Level Characteristics and Financial Performance
There has been reported collapses and scandals of the high profile listed firms such as
Enron, WorldCom and others in the US (Iraya, Mwangi & Muchoki, 2015). This has
been as a result of inadequate liquidity levels in the firms. In addition, a considerable
4
amount of listed firms funds were tied up in current assets to an extent that the assets are
idle and thus making performance to suffer of listed firms suffer (Baum, Caglayan,
Stephan & Talavera, 2008).
In Japan, there has also been a reported general increase in performance of listed firms.
The improved performance has been attributed to the reduced debts of the listed firms in
the last decades. In addition, Japanese firms rely on internally generated funds and
precautionary cash holdings to have lower leverage. Ueda (2012) also reported that
average leverage of listed firms in Japan fell from 27.49% to 19.34 from the year 1990
to 2012. Khoo and Durand (2014) also reported a remarkable increase in listed firms’
assets which has led to improved performance.
As the stock market of China has been developing for 20 years, the listed firm has
become the leading role in the Chinese economy (Xu, & Banchuenvijit, 2014). Binti
and Binti (2010) reported a tremendous increase in performance of the listed firms in
China. Fafchamps and Quinn (2016) stated that the average production per listed firm in
china produces about US$6,500 of output per worker. Fafchamps and Quinn (2016) also
indicated that firms in China are more productive than firms in Vietnam and that the
latter, in turn, are more productive than firms in the African countries. Fafchamps and
Quinn (2016) reported that the improvement in performance of the listed firms was as a
result of increase in their total assets. Eljely (2004) empirically examined the
relationship of liquidity and profitability as measured by current ratio and cash gap on a
sample of 29 joint stock companies in Saudi Arabia and found significant negative
relation between the firm’s profitability and its liquidity level, as measured by current
ratio using correlation and regression analysis.
5
1.1.3 Regional Perspective of Firm Level Characteristics and Financial
Performance
Firms of different sizes have access to different sources of finance. For instance, large
firms often have access to both bank and market finance in countries with financial
markets, while small and medium size firms have limited access to market finance, given
the stringent listing requirements. Firms in Sub Saharan Africa are as diverse as the
countries in this region. Furthermore, this diversity is also seen in the financial systems,
on the other hand firm financing is dependent on the level of financial development in a
country, the quality of institutions as well as the legal and financial environment (Beck,
Demirguc‐Kunt, Laeven, & Levine, 2008).
In South Africa, listed firms have recorded declining performance. Long-term debt and
total debt has been reported to negatively affect performance of firms in South Africa
(Abata, Migiro, Akande & Layton, 2017). Fatoki, George and Mornay (2010) also
found a significant negative association between return on assets of listed firms in South
Africa and long-term debt, and total debt sales growth had a significant positive
association with the gross profit margin for all metrics of debt.
The Nigerian stock exchange (NSE) earlier called the Lagos Stock Exchange (LSE) was
registered on 1st March 1959, incorporated on 15th , September 1960 and started
business on 5th June 1961. In December 1977, its name was changed from the Lagos
Stock Exchange to the Nigerian Stock Exchange (NSE) and additional branches have
since then been opened in Kaduna, Port Harcourt, Kano, Ibadan, Onitsha and Abuja. The
major recent developments in the NSE include the following; the transition from the
Callover trading system to the Automated Trading System (ATS) on April 27, 1999, the
commissioning of the Electronic Business (e-business) platform in July, 2003 and lastly,
the trade alert information system launched in 2005 providing text messages on mobile
phones of stockholders of any transactions in their stock within 24 hours. Sakai and
Asaoka (2003) in a panel data of over 400 Japanese firms find that higher debt-asset
6
ratio improves firm performance. Agrawal and Knoeber (1996) also showed that
leverage had a negative effect on firm performance in Nigeria.
Companies listed at the Dar es Salaam Stock Exchange (DSE) has been reported to face
turbulences from the market due to shortages of liquidity, unpredictable business
environment and increased debts levels. The market report (2013) showed that the
majority of listed companies saw their share prices dipping down, with only three firms
recorded a share price gain. This prompted investors to sell their shares in large numbers
and thus leading to decreased performance of the firms.
1.1.4 Local Perspective of Firm Level Characteristics and Financial Performance
In Kenya, most companies listed at the Nairobi Securities Exchange have had improved
in performance while others have experienced declining performance which has been
attributed to the fact that corporate managers another practitioner lack adequate guidance
required to attain optimal financing decisions (Ayako, Kungu & Githui, 2015). In
addition, most collapse of many listed firms in Kenya has been due to financing issues
or behavior of firms in general.
Oduol (2011) further argued that in a competitive market, the realizable market value for
liquid assets is less than their face value thus in cases of financial distress, the cost of
liquidation will decrease. In addition, ability of a listed firm to sell its assets had an
impact on the level of financing and high liquid firms will employ more debt. Kihara
(2006) showed that change in firm ownership lead to more debt usage of firms listed in
NSE in order to spur growth levels and take up more business opportunities.
1.1.5 Firms listed in Nairobi Securities Exchange (NSE)
The NSE is Africa's fifth largest securities exchange in terms of market capitalization as
a percentage of Gross Domestic Product (GDP); which stood at 25.4% as at 2009 and
30.35% in 2012; and fourth largest in terms of trading volumes (World Bank, 2012). The
NSE assists the Kenyan economy by facilitating the transfer of savings to investment in
7
productive enterprises, assisting in the rational and efficient allocation of capital, which
is a scarce resource and improves the access to finance by different types of users by
providing the flexibility for customization. The publicly quoted companies in Kenya
operate in various sectors of the economy.
The NSE groups these firms under three market segments namely: Main investment
Market Segment (MIMS), Alternative Investment Market Segment (AIMS) and the
Fixed Income Security Market Segment (FISM). At the time of this study, there were
fifty-eight companies listed on the MIMS and AIMS that has grown from forty-seven in
2005. Companies listed on the MIMS are categorized into 4 segments namely
agriculture, commercial and services, finance and investment; and industrial and allied
(Musuva, 2013). A list of publicly quoted companies in Kenya is provided in Appendix
I.
Kenya is strategically located within the East African region and plays a major role in
regional and international trade and development. Kenya’s membership in the East
Africa Community (EAC) and the Common Market for Eastern and Southern Africa
(COMESA) has opened up opportunities for businesses operating in Kenya to participate
in international business and benefit from performance gains from economic integration
of trade and investment. The government of Kenya has reiterated the need for more
involvement in international trade and investment by Kenyan companies. The
liberalization of the Kenyan economy in the 1980s and 1990s resulted in changes in
Kenya’s trade policy from import substitution to outward export promotion programs
(Gertz, 2009).
Listed companies contribute to international trade in Kenya and they represent firms that
have sought growth opportunities locally through established capital markets and
internationally through international trade. While national international performance is
an area of interest at a macro-level, firm level analysis forms the basis of micro level
analysis and provides better understanding of what the determinants of international
success and failure for companies. The international success of firms has been argued to
8
contribute to the national economic growth and development of countries (Rutashobya
& Jaensson, 2004).
This study focused on NSE listed firms because these companies have well-established
formal systems and publicly available information containing data on financial and
operational performance. These reports are regulated by the Capital Markets Authority
(CMA) and have been audited by reputable audit firms. This provides objective and
reliable economic and financial performance data for analysis. The consistency in the
reporting requirements also provides an opportunity for the investigation of an
international performance framework through a cross-sectional study while controlling
for industry effects.
1.2 Statement of the Problem
The Kenya government and the private companies have put great efforts in ensuring the
existence of a favorable environment for doing business in the country and more so for
listed firms. Consequently, while some firms listed in the NSE have improved in
performance, there are others that have experienced declining fortunes and some have
even been delisted from the NSE over the last decade (Kibet, Kibet, Tenai & Muthol,
2011).
Two-thirds of the listed firms that are active on the Nairobi Securities Exchange reported
losses or reduced earnings in the year 2011 (World Bank, 2012). Ali (2013) also
reported that some listed firms underperformed and faced financial problems in the year
2012. For example CMC Holdings faced boardroom challenges and Mumias Sugar
moved into losses, while Unga group and Uchumi profits fell by 43%. The profits of
Uchumi further fell by 35% in the year 2013. In addition, fifteen of the sixty-four listed
firms that traded on the stock exchange reported losses, two less than in the 2015
financial year, while 25 of the listed firms, or 39%, recorded falling after-tax profits in
the year 2016 (NSE Report, 2016). The analysis also finds that a third of the companies
announced reduced revenues including eight firms that were profitable in the year 2015.
9
The poor performance of the firms listed in NSE has been majorly associated with the
firm level factors. Banafa, Muturi, and Ngugi (2015) indicated that the poor performance
of the NSE firms is as a result of their debt levels. Omesa (2015) further stated that
liquidity level and total assets were also a major contribution to the performance of the
listed firms. The firms had not fully appreciated the importance of liquidity management
and the implications of such risk to the firms themselves, as well as the wider financial
system. Significant efforts to turn around such companies or even liquidate them have
focused mainly on restructuring of firm level factors.
Many studies have been done to investigate the effect of certain firm characteristics on
financial performance, but only concentrated on a few firm characteristic. Omondi and
Muturi (2013) conducted a study on factors affecting the financial performance of listed
companies at the Nairobi Securities Exchange in Kenya. The study was informed by
trade off and the agency theories thus presenting a theoretical gap. The current study was
informed by tradeoff theory, liquidity preference theory, economies of scale theory and
financial distress theory. The study also did not consider asset tangibility as a factor that
affects financial performance. In addition, Ayako, Kungu and Githui (2015) conducted a
study on determinants of the performance of firms listed at the Nairobi Securities
Exchange. The study found that firm size and liquidity were found to be insignificantly
related to financial performance. In addition, the study focused on non-financial listed
firms only. Mahfoudh (2013) conducted a study on effect of selected firm characteristics
on financial performance of firms listed in the agricultural sector at the Nairobi
securities exchange. The study evidenced that the only variables that were statistically
significant were liquidity and board size and the other three variables that were not
statistically significant were namely firm size, leverage and firm age. The study used
firm age as an independent variable while the current study used it as a moderating
variable. This study sought to determine the effect of firm level factors on financial
performance of Listed Firms in the Nairobi Securities Exchange

10
1.3 Research Objectives
1.3.1 General Objective
The general objective of the study was to determine the effect of Firm Level Factors on
Financial Performance of Listed Firms in the Nairobi Securities Exchange
1.3.2 Specific Objectives
The specific objectives of the study are;
i. To determine the effect of leverage on financial performance of listed firms in the
Nairobi securities exchange.
ii. To establish the effect of liquidity on financial performance of listed firms in the
Nairobi securities exchange.
iii. To investigate the effect of asset tangibility on financial performance of listed
firms in the Nairobi securities exchange.
iv. To establish the effect of firm size on financial performance of listed firms in the
Nairobi securities exchange.
v. To determine the moderating effect of firm age on the relationship between firm
level factors and financial performance of listed firms in the Nairobi securities
exchange.
1.4 Research Hypotheses
The study pursued the following hypotheses;
i. H01: Leverage has no significant effect on financial performance of listed firms
in the Nairobi securities exchange.
ii. H02: Liquidity has no significant effect on financial performance of listed firms
in the Nairobi securities exchange.
11
iii. H03: Asset tangibility has no significant effect on financial performance of listed
firms in the Nairobi securities exchange.
iv. H04: Firm size has no significant effect on financial performance of listed firms
in the Nairobi securities exchange.
v. H05: Firm age does not moderate the relationship between firm level factors and
financial performance of listed firms in the Nairobi securities exchange.
1.5 Justification of the Study
The outcome of this study will help listed firms’ financial managers in Kenya in
understanding the firm level factors that affect their financial performance, as such make
better decision on these factors as well as concentrate on them in order to improve
financial performance in the industry and the sector at large.
Policymakers will also be guided on the formulation of rules and regulations proposed to
help the industries whose firms are listed to perform better as well as the sector in
general. They will be able to formulate policies that give listed firms in Kenya a
conducive atmosphere for enabling them to craft strategies that might boost their firm
financial performance.
The results of this study will be beneficial to investors and lenders as it may provide
insight into the effect of certain operational style of firms’ management in covering the
interest of the managers and the shareholders, since the capital market set securities’
prices based on reported firm performance.
Similarly, creditors and other providers of finance would be able to draw a line as to the
recovery of their fund or otherwise through firms’ performance indicators. Thus, both
investors and creditors can rely on the information drawn from this research to access
and make informed decision on their investment position.
12
Lastly, given the limited knowledge in the same field, the findings of this study may also
be used as a source of reference for other researchers. Similarly, this study will be of
great significance to the academician who seek to increase their knowledge on the firm
level factors that affect listed firms in NSE performance
1.6 Scope of the Study
The study sought to determine the effect of Firm Level Factors on Financial
Performance of Listed financial and non-financial firms in the Nairobi Securities
Exchange. The study looks at firm level factors which include leverage, liquidity, asset
tangibility, firm size and firm age. Firms listed in Nairobi Securities Exchange (NSE)
were used for study. A census of all the NSE listed firms that have submitted audited
financial statement was selected. The study targeted all the 64 firms listed in Nairobi
Securities Exchange since 2012. The study did not consider the firms that are not listed
at any particular year between 2012 and 2016. This is because the data for the periods
are current data and easily available. In addition, the period of 2012 to 2016 was selected
because most NSE firms performed so poorly within this period causing a public outcry.
13
CHAPTER TWO
LITERATURE REVIEW
2.1 Introduction
This chapter addressed and reviewed past studies on the subject and critically reviewed
relevant literature. Attempt was made to do an empirical study, which critiques the
fundamental theories of firm level factors and financial performance. The chapter
comprised of six sections; in the first section, theoretical framework was elaborated, the
second section was the conceptual framework, the third sections reviewed empirical
research studies, the fourth section presented a summary of the literature, the fifth
section presented the critique of the literature while section six brought out any research
gaps in the subject which the literature had not addressed.
2.2 Theoretical Review
A theoretical framework is a collection of interrelated concepts. It guides research to
determine what things to measure, and what statistical relationships to look for (Defee,
Randal, Thomas & Williams, 2010). Esper, Mentzer and Stank (2008) emphasizes that a
good research should be grounded on theory. This study was built on the underpinning
theories, including the tradeoff theory, liquidity preference theory, economies of scale
theory and financial distress theory.
2.2.1 Trade-off Theory
Kraus and Litzenberger (1973) proposed this theory. According to Kraus and
Litzenberger (1973), debt financing offers the firm a tax shield, and that firms that
pursue higher levels of debt gain the maximum tax benefit and ultimately enhance
profitability, though higher levels of debt financing in the firm may also increase the
possibility and adverse effects of bankruptcy. The trade-off theory emphasizes on the
fact that a firm will choose a financial leverage level by balancing the costs and benefits
14
of both the debt and equity financing. That is as the firm increases their debt, the
marginal benefit of the debt begins to decline as the marginal cost increases. Therefore
the managers needs to establish an optimal mix that will ensure that the marginal cost
remain minimum as the marginal benefit move to maximum (Topal, 2011). The Static
Trade-off Theory argued that although the benefit of tax shields may encourage the
firms to employ more debt than other external sources available to them, this mode of
finance is not free from costs. Myers (1977) observed that as much as levered firms
enjoy tax deductibility as a benefit of their leverage, care needs to be taken such that the
cost of financial distress associated with the inclusion of debt financing in the capital
structure. Myers (1977) observed that the firm’s capital structure is at optimal at the
point where the cost of using debt and equity is at minimum as compared to the benefit
that accrues as a result of using the mix, to allow the firms to trade them off. The firms
therefore should seek to establish this optimal point in their capital structure irrespective
of their size and earnings.
Dynamic Trade off Theory on the other hand argues that the firm’s capital structures
may not always be as per their target leverage ratios, but firms may allow the ratio to
vary considering the costs and the benefits of the use of debt and equity and also the
financing margin that the firm anticipates in the next period. Fischer, Heinkel and
Zechner (1989) argued that a dynamic optimal capital structure is an appropriate choice
in a case where the firm requires recapitalization. Unlike the static trade off theory
where the emphasis is on the targeted leverage ratio that the firm will not be willing to
deviate from, the dynamic trade off theory emphasizes on the firm having an optimal
leverage range within which they let their leverage ratios vary. The firm only adjusts
their capital structure when leverage reaches either of the two boundaries defining the
range. The levels of the boundaries vary cross-sectional with firm characteristics such as
the volatility of cash flows, size, earnings of the firm, interest rates and bankruptcy costs
(Davydenko, 2012)
15
This theory is deemed relevant to this study. This is because it assumes that there are
benefits to leverage within a capital structure up until the optimal capital structure is
reached. In addition the theory recognizes the tax benefit from interest payments.
2.2.2 Liquidity Preference Theory
This theory was proposed by John Maynard Keynes (1989).According to Keynes,
investors demand a premium for securities with longer maturities, which entail greater
risk, because they would prefer to hold cash, which entails less risk; hence, the more
liquid an investment is, the easier it is to sell quickly for its full value .The theory further
holds that since interest rates are more volatile in the short term, the premium on short-
term versus medium-term securities will be greater than the premium on medium-term
versus long-term securities (Amihud, & Mendelson, 1991). According to Runde (1994),
people value money for both the transaction of current business and its use as a store of
wealth. Thus, they will sacrifice the ability to earn interest on money that they want to
spend in the present, and that they want to have it on hand as a precaution; on the other
hand, when interest rates increase, they become willing to hold less money for these
purposes in order to secure a profit.
According to Runde (1994), the rate of interest is determined by the demand for, and
supply of, money; and demand for money (or liquidity preference) means the desire of
the public to hold liquid cash for the following three motives. The transactions motive,
which relates to the demand for money or the need of cash for the current transactions of
individual and business exchanges. The precautionary motive, which refers to the desire
to hold cash balances for unforeseen contingencies (such as illness, accident and
unemployment); and The speculative motive, which relates to the desire to hold one’s
resources in liquid form to take advantage of future changes in the rate of interest or
bond prices. The higher the rate of interest, the lower the speculative demand for money,
while the lower the rate of interest, the higher the speculative demand for money (Taylor
& O'Connell, 1985)
16
The theory was deemed relevant to this study. This is because according to the theory a
firm needs to hold more cash for investment; hence, the rate at which a financial
institution charges interest on loans borrowed, especially in the short term, is key in
promoting the investment agenda for such a firm. The theory is therefore relevant to the
current study since it informs one of the independent variable that is liquidity.
2.2.3 Economies of Scale Theory
Marshall (1890) laid out the theory of Economies of Scale. Marshall (1890) assigned the
key role to external economies in his attempt to reconcile increasing returns and
competitive equilibrium. It is argued that Marshall’s chief purpose in creating the
category of external economies was to explain the great historical reduction in
production costs associated with increase in output. To the extent that Marshall
envisaged the advantages available to small firms as arising from the general progress of
industries, and although he clearly distinguished between external and internal
economies, there was a clear conclusion that the two sources were seen to co-exist. The
availability of external economies to firms is seen to increase with the scale of industry
output, a factor that also induces the average size of firms to increase, and therefore the
availability of internal economies (Melitz & Ottaviano, 2008). Economies of scale refer
to the cost advantages that enterprises obtain due to size, output or scale of operations.
Economies of scale are internal, external, national, international, aggregative or dis-
aggregative (Hitt & Ireland, 1987).
Frequently attributed to Stefanou (2006), the association of firm size with scale and
scope economies, market power, and the ability to aggregate inputs is widely believed to
confer performance advantages on large firms. This discussion has been interpreted by
many to mean that there are increasing returns in research and development (R&D), both
to R&D establishment size and to firm size. For several reasons, size may also provide
advantages in the conduct of a firms’ R&D efforts (Gomes, Kruglianskas & Scherer,
2009) or innovative activities (Gay, 1981). First, capital market imperfections confer
advantages to large firms in securing financing for R&D projects and in providing
17
mitigation strategies against adverse selection and moral hazard in the raising of capital.
Secondly, large firms may be better able to spread the fixed costs of research over a
larger sales base in the absence of fully functioning markets for innovation (Colburn &
Talley, 1992). Thirdly, large firms are able to exploit economies of scale in the conduct
of the R&D activity itself (Panzar & Willig, 1981). Finally, large firms may have greater
access to the complementary technologies and downstream capabilities (i.e., marketing
and finance) that are presumed to make R&D more productive (Cohen, 1995). Despite
these persuasive arguments, empirical findings are mixed (Colburn & Talley, 1992).
Some researchers note that inconsistent findings result from difficulty in developing
good measures of innovation (Cohen, 1995), while others argue that a lack of
sufficiently detailed data make it difficult to distinguish between measures of economies
of scale and economies of scope (Cockburn, & Henderson, 2001).
This theory is relevant to this study since it informs firm size that is one of the
independent variables in this study. Firms that are larger are believed to enjoy
economies of scale. Economies of scope are present if cost savings or performance
benefits are realized when two or more activities are conducted jointly in comparison to
when these activities are conducted separately (Panzar & Willig, 1981). In the standard
analysis of production, scope economies result when activities share productive inputs at
little or no additional cost. Henderson and Cockburn (1996) identify internal spillovers
of knowledge as a second source of returns that results from a more diverse R&D
program. They argue that the knowledge developed and accumulated in one R&D
activity can be transferred to other R&D activities at little cost, but with significant
performance benefits. Some research suggests that beyond a certain point, however,
escalating coordination and agency costs eventually lead to diseconomies of scope
(Henderson & Cockburn, 1996). Therefore, the economies of scale theory explain the
cost advantages that enterprises obtain due to size and output or scale of operation.
18
2.2.4 Financial Distress Theory
Financial distress theory was proposed by Gordon (1971). Financial distress can be
subdivided into four sub-intervals: deterioration of performance, failure, insolvency, and
default. Whereas deterioration and failure affect the profitability of the company,
insolvency and default are rooted in its liquidity. Theoretically, the outcome of each
interval can be positive, implying that the company breaks the downward trend, or
negative indicating the continuing deterioration of the firm value and a movement
downwards from one sub-interval of the spiral to another. In many real cases, when
entering financial distress, the company traverses all the stages of decline (Muller,
Steyn-Bruwer, & Hamman, 2009).).
Financial distress is characterized by a sharp decline in the firm’s performance and value
(Opler & Titman, 1994). This part of the overall process has two important
characteristics; moving down the spiral from one phase to another the sharp decline
accelerates, whereas the length of each stage becomes shorter and shorter. Obviously,
this decline of performance can continue longer than the economic failure of the
company. The length of insolvency depends on the maturity structure of the firm’s debt,
whereas default is dependent on the date of maturity followed by renegotiation and
turnaround or liquidation and is, therefore, the shortest stage of financial distress.
The biggest challenge in financial distress is to recognize adverse processes as early as
possible in order to gain more time for response. The later financial distress is
anticipated, the more time pressure and the more questionable is the success of counter
measures (Opler & Titman, 1994).
This study was deemed relevant to this study. This is because it informed the dependent
variable which was financial performance. In addition the theory of financial distress
was useful in explaining the causes of financial challenges facing firms listed in NSE.
19
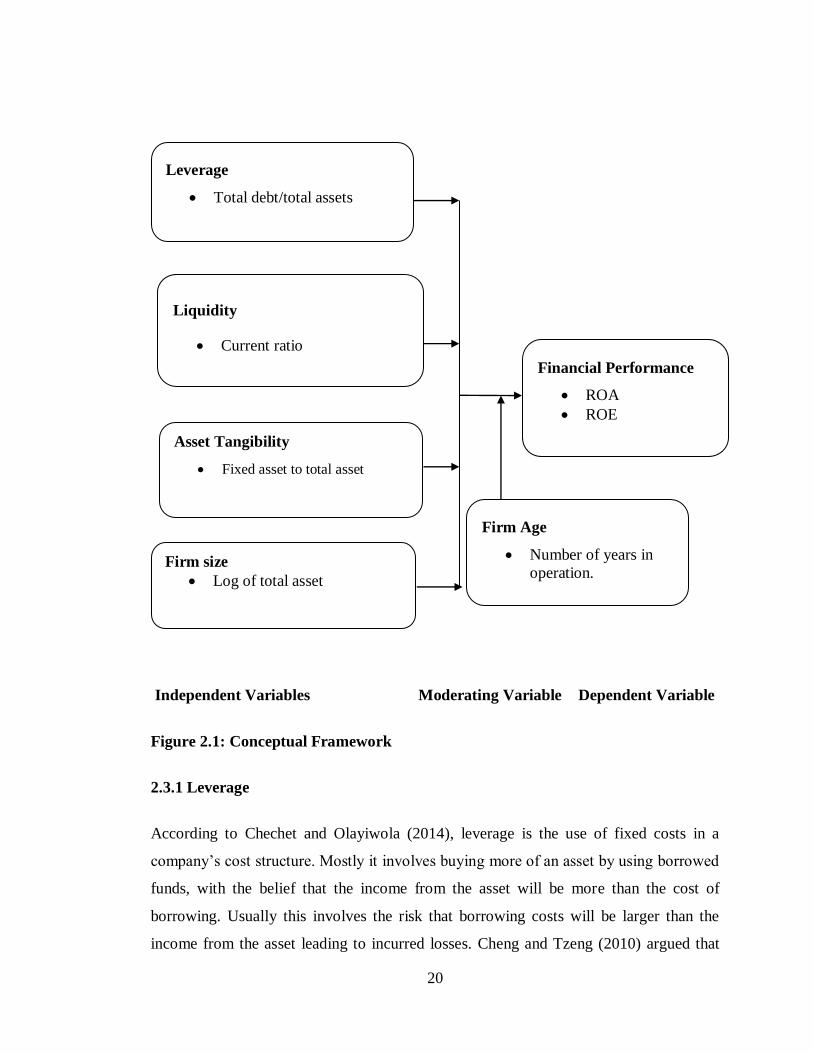
2.3 Conceptual Framework
According to Kombo and Tromp (2009), a concept is an abstract or general idea inferred
or derived from specific instances. A conceptual framework is a set of broad ideas and
principles taken from relevant fields of enquiry and used to structure a subsequent
presentation. Mugenda and Mugenda (2003) and Smith (2003), define a conceptual
framework a hypothesized model identifying the model under study and the relationship
between the dependent and independent variables. Kothari (2004) defines an
independent variable also known as the explanatory variable is the presumed cause of
the changes of the dependent variable, while a dependent variable refers to the variable
that the researcher wishes to explain. The goal of a conceptual framework is to
categorize and describe concepts relevant to the study and map relationships among
them. Such a framework would help researchers define the concept, map the research
terrain or conceptual scope, systematize relations among concepts, and identify gaps in
literature (Camp, 2003). Below is a figurative representation of the variables to be
explored by this study.
20
Independent Variables Moderating Variable Dependent Variable
Figure 2.1: Conceptual Framework
2.3.1 Leverage
According to Chechet and Olayiwola (2014), leverage is the use of fixed costs in a
company’s cost structure. Mostly it involves buying more of an asset by using borrowed
funds, with the belief that the income from the asset will be more than the cost of
borrowing. Usually this involves the risk that borrowing costs will be larger than the
income from the asset leading to incurred losses. Cheng and Tzeng (2010) argued that
Leverage
Total debt/total assets
Liquidity
Current ratio
Financial Performance
ROA
ROE
Firm size
Log of total asset
Asset Tangibility
Fixed asset to total asset
Firm Age
Number of years in
operation.
21
leverage allows a financial institution to increase the potential gains or losses on a
position or investment beyond what would be possible through a direct investment of its
own funds.
There are three types of leverage; balance sheet, economic, and embedded. Balance
sheet leverage is the most visible and widely recognized form (Hall & Vila, 2002).The
leverage ratio can thus be thought of as a measure of balance sheet or, to the extent that
it also includes off-balance-sheet exposures of economic leverage. A firm can finance its
investment by debt and/or equity. The use of fixed-charged funds, such as debt and
preference capital along with the owner’s equity in the capital structure is described as
financial leverage or gearing (Kanu, 2015).An unlevered firm is an all-equity firm,
whereas a levered firm is made up of ownership equity and debt. Financial leverage
takes the form of a loan or other borrowing (debt), the proceeds of which are
(re)invested with the intent to earn a greater rate of return than the cost of interest. If the
firm’s marginal rate of return on asset (ROA) is higher than the rate of interest payable
on the loan, then its overall return on equity (ROE) will be higher than if it did not
borrow (Molyneux & Thorton, 1992).
Leverage allows a greater potential returns to the investor than otherwise would have
been available, but the potential loss is also greater: if the investment becomes
worthless, the loan principal and all accrued interest on the loan still need to be repaid.
This constitutes financial risk. The degree of this financial risk is related to the firm’s
financial structure. The total combination of common equity, preferred stock and short
and long-term liabilities is referred to as financial structure. That is, the manner in which
the firm finances its assets constitutes its financial structure. If short-term liabilities are
subtracted from the firm’s financial structure, we obtain its capital structure (Naceur &
Goaied, 2008).
Gupta (2010) cited some studies showing contradictory results about the relationship
between increased uses of debt in capital structure and financial performance. Berger
and Di Patti (2006) reported a positive relationship between leverage and financial
22
performance. Simerly and Li (2000) showed negative relationship between financial
performance and leverage level. Similarly, Zeitun and Tian (2007) found that debt level
is negatively related with financial performance. Several researchers have 3 studied
firms’ debt use and suggested the determinants of financial leverage by reporting that
firm’s debt-equity decision is generally based on a trade-off between interest tax shields
and the costs of financial stress (Upneja & Dalbor, 2001). According to the tradeoff
theory of capital structure, optimal debt level balances the benefits of debt against the
costs of debt hence, use of debt to a certain debt ratio results in higher return on equity,
however, the benefit of debt would be lower than the cost after this level of capital
structure. In other words, the more a company uses debt, the less income tax the
company pays, but the greater its financial risk.
2.3.2 Liquidity
Liquidity of the firm is a key determinant of the firm’s financial performance. According
to Bhunia (2010), liquidity is the ability of a firm to meet its short-term obligations.
Liquidity plays a crucial role in the successful functioning of a business firm. Mwangi
and Iraya (2014) further stated that liquidity is the term used to describe how easy it is to
convert assets to cash. The most liquid asset, and what everything else is compared to, is
cash. This is because it can always be used easily and immediately. Liquid assets are
important to have in times of crisis or emergency because they are so easily converted
into cash. Without liquidity, money can become tied up in systems that are difficult to
cash out of and even more difficult to assess for actual cash value. During times of
emergency, large financial institutions shut down, making it difficult for people to
access the cash they need to buy essentials like food, gasoline and other emergency
supplies
There are three liquidity ratios that are used for this purpose, including the current ratio,
the quick ratio and the capital ratio. Liquidity not only helps to ensure that a person or
business always has a reliable supply of cash close at hand, but it is a powerful tool
when it comes to determining the financial health of future investments as well

23
(Clementi, 2001). Liargovas and Skandalis (2008) argued that firm can use liquid assets
to finance its activities and investments when external finance are not available. On the
other hand, higher liquidity can allow a firm to deal with unexpected incidences and to
cope with its obligations during periods of low earnings.
Vishnani and Shah (2007) affirmed that the most common measures of liquidity are the
current ratio and return on investment for profitability. The current ratio is used to test a
firm’s liquidity, that is, its current or working capital position by deriving the proportion
of the firm’s current assets available to cover its current liability. A higher current ratio
indicates a larger investment in current assets which means, a low rate of return on
investment for the firm, as excess investment in current assets will not yield enough
returns. A low current ratio means smaller investment in current assets that means a high
rate of return on investment for the firm, as no unused investment is tied up in current
assets. However, there is consensus in theoretical literatures that the higher the ratio, the
better.
Mwangi and Iraya (2014) state that many of the funding resources are invested in the
short term liquid assets. This provides a buffer against the liquidity shocks. Diamond
and Rajan (2001) emphasize that a mismatch in depositors demand and production of
resources force a firm to generate the resources at a higher cost. Liquidity has a greater
impact on the tradable securities and portfolios. Broadly, it refers to the loss emerging
from liquidating a given position. It is essential for a bank to be aware of its liquidity
position from a marketing perspective. It helps to expand its customer loans in case of
attractive market opportunities (Falconer, 2001). A bank with liquidity problems loses a
number of business opportunities. This places a bank at a competitive disadvantage, as a
contrast to those of the competitors (Chaplin et al., 2000).
Almajali, Alamro and Al-Soub (2012) found that firm liquidity had significant effect on
Financial Performance of firms. The liquidity is essential for company existence. It
principally has an effect on financial costs reduction or growth, changes in the sales
dynamic, as well as it influences on company risk level. The decisive significance of
24
liquidity means that it is important for company development and at the same is one of
the fundamental endogenous factors which are responsible for company market position.
The significance of liquidity to company performance might lead to the conclusion that
it determines the profitability level of company.
2.3.3 Asset Tangibility
Giambina (2011) measured overall tangibility as the ratio of total tangible assets to book
value of assets. La Rocca, La Rocca, Gerace and Smark (2009) measured tangibility as
the ratio of property, plant and equipment to total book assets. Degryse, de Goeij and
Kappert (2012) measured tangible assets as ratio of tangible fixed assets to total assets.
According to the authors mentioned in this paper, tangibility is measured as the ratio of
tangible assets to total assets. Herciu and Ogrean (2012) argued that a firm is highly
competitive as long as its managers are able to mix tangible and intangible assets in the
most effective and efficient manner. Therefore, a firm can get the same score of
competitiveness by using a different combination of assets and by giving different
importance coefficients to the tangible and intangible assets.
According to Köksal, Orman and Oduncu (2013) tangible assets are positively related to
firm performance and the trade-off theory predicts a positive relation between leverage
and tangibility. This relationship exists because tangible assets are easier to collateralize
and they suffer a smaller loss of value when firms go into distress. Since firms tend to
match the maturity of assets with maturity of liabilities, tangibility should be positively
related with leverage (Koksal et al., 2013). Harris and Raviv (1991) argue that the larger
share of tangible assets increases the liquidation value of a company. This is because the
tangible assets constitute collateral for the debt in case of bankruptcy. Morellec (2001)
argues that when a firm is solvent, tangible asset increase the firm value by allocating
assets to better uses. He also argues that when the firm is in distress, tangible asset sales
represent the cheapest source of funds for the firm. Moreover, asset sales allow the firm
to finance continued operation of its remaining assets without requiring external capital.
25
2.3.4 Firm Size
There are different approaches of measuring firm size including natural log of assets,
sales, number of employees and log of market capitalization. This study employed log of
total assets as measures of firm size. Log of total asset is the most popular firm size
proxy in empirical corporate finance research. Some of the studies which have used log
of the total assets include Pervan, & Višić, (2012); Vijayakumar andTamizhselvan
(2010); Linck, Netter, & Yang (2008); Lemmon, Roberts, and Zender (2008); (Graham,
Li & Qiu, 2012).
Firm size has become such a routine to use as a control variable in empirical corporate
finance studies that it receives little to no discussion in most research papers even
though not uncommonly it is among the most significant variables. Firms of different
size distinguish themselves along different observable and unobservable dimensions.
Therefore, there are many different ways of defining a firm's size category. The OECD
(2005) classification defined SMEs as firms with between 10 and 250 employees. Firms
with less than 10 employees are micro firms and those with more than 250 are large
firms. The OECD notes that this definition may vary by country. In the US, for example,
the upper limit is set at 500 employees instead of 250. Micro-sized companies are also
often defined to have up to 49 employees and hence SMEs to have between 50 and 249
employees. The European Union also uses financial data to define size bands. Firms
with turnover between over EUR 2 million and EUR 50 million are classified as SMEs.
Firms with less than EUR 2 million in turnover are micro companies and firms with
more than EUR 50 million are large firms.
Another critical element in the classification of firm size categories is the ownership
structure of firms. It is necessary to treat subsidiaries of large companies that fall into the
micro firm or SME categories according to their turnover or number of employees
differently from independent micro firms or SMEs. This uses the net assets employed by
the firm to be the measure of size.
26
According to Heshmati and Kim (2011) listed companies have easier access to the
equity market, in comparison with the smaller companies, because of low fixed costs.
Transaction cost and asymmetric information problem are lesser in big firms in
comparison with small firms. Therefore, large firms prefer to raise fund from equity
rather than debt. Most financiers do not agree to offer small firms capital, or the price of
the offered capital is too high for small firms. Another reason, which makes small firms
reluctant to use outside financing, is the market access limitations. In many cases, the
minimum volume of capital is required in order to raise external fund. This idea is
supported by empirical evidence that concludes SMEs are often forced to use internal
source, and then short-term debt contracts due to the limited access to the long term
financing.
Many authors have suggested a positive relationship between a firm leverage and its size
(Fama & French, 2002). Rajan and Subramanian (2005) stressed out, that when the value
of the firm increases; the ratio of direct bankruptcy costs to the firm value would
decrease. The effect of these expected bankruptcy costs might be little on large firms’
borrowing decisions, which empower them to take on more leverage. On the other side,
smaller firms face a different reality in raising the long term debt. Asymmetric
information is not the main reason, but the reason is the significant negative correlation
between firm size and the probability of bankruptcy (Hall et al., 2004). One explanation
could be that relatively large firms tend to be more diversified; therefore, they are less
prone to insolvency (Titman & Wessels, 2008). Chittenden et al. (2006) believed in the
large companies the cost of monitoring is much lower than small firms. They argued that
moral hazard and adverse selection problems are decreased reasonably in large
companies, subsequently using debt as an external funding is much better in listed
companies than SMEs. Hence there is a positive relationship between the level of debt
and the firm’s size. (Riportella, & Cazorla Papis, 2001) stressed out that there is a
positive relationship between borrowing and size of the firm.
27
Daskalakis and Psollaki (2010) further found three reasons to confirm the positive
relationship between level of debt and the firm size. They found that there is a strong
relationship between the size of the firms and the risk of bankruptcy. This means a large
company has a lower risk of default than small firms. They also found that listed
companies might be able to incur lower transaction costs associated with debt. They also
found out that due to transparency and accuracy in a large company the cost of
information asymmetry is lower than in SMEs. It is assumed that large firms are less
likely to default because they are more 40 diversified than smaller firms; therefore, large
firms should have a greater debt capacity (Titman & Wessels, 2008).
2.3.5 Firm Age
The conceptual basis for treating firm age as a moderator variable in the relationship
between firm characteristics and financial performance can be attributed to the liability
of newness. The liability of newness suggests that newer firms are disadvantaged vis-à-
vis older firms because newer firms lack experience, lack external ties and lack
legitimacy. The return on investment in older firms is likely to be higher because it has
benefited from exposure, repetition and learning by doing that assist older firms to refine
their strategies and build firm-specific human capital (Rafiq, Salim & Smyth, 2016).
Firm age measured as the number of years a company is operating in the market
since it was founded is an important determinant of financial performance. Past
research shows that the probability of firm growth, firm failure, and the
variability of firm growth decreases as firm’s age (Evans, 1987; Yasuda, 2005).
According to the life cycle effect, younger companies are more dynamic and more
volatile in their growth experience than older companies (Evans,
1987).Maturity brings stability in growth as firms learn more precisely their market
positioning, cost structures and efficiency levels.
28
According to Liargovas, and Skandalis, (2008), older firms are prone to inertia, and the
bureaucratic ossification that goes along with age; they might have developed routines,
which are out of touch with changes in market conditions, in which case an inverse
relationship between age and profitability or growth could be observed (Liargovas, and
Skandalis, 2008). Newer and smaller firms, as a result, take away market share in spite
of disadvantages like lack of capital, brand names and corporate reputation with older
firms .
Past studies shows a relationship between the age of the firm and firm’s growth, failure
and variability in growth decreases with age (Yasuda, 2005). Young firms are more
flexible and dynamic and more volatile in their growth compared to older firms. As the
firm ages they are likely to become more stable in growth, gain more knowledge and
innovations, position itself better in the market, develop a better structure that increases
efficiency and help lower costs and are more likely to have better investment plans
2.3.6 Financial Performance
Financial performance can be described as a measurement of how well a firm uses its
assets from its primary mode of business to generate revenue. The term is also used as
general measure of firm’s overall financial health over a given period of time. The
business dictionary (2013) defines financial performance as measuring results of a firm’s
polices and operations in monetary terms and these results are reflected in firm’s return
on investment, return on assets, value added etc. Birya (2009) also defined financial
performance as the business’ capability to generate liquidity, that is, finances from the
investments it already has through which other processes are kept running. In other
words, financial performance may be used to mean the extent of safety and stability in
handling deposited funds (Mutua, 2013).
Neely (2011) observes that financial performance measures mainly serve three purposes.
Firstly, they serve as a tool of financial management, secondly they serve as major
objectives of business e.g. to have a 40% ROA and lastly they serve as a mechanism for
29
motivation and control within an organization. Many researchers have used different
financial performance measures.
The level of significance in the performance of a financial institution can be measured in
both micro and macro perspectives. In the micro perspective, the most fundamental
prerequisite is profit as well as the best source of funds. Despite being a result, profits
are also a requirement in an era of increasing competition in money markets. As a matter
of fact, the prime aim of financial firms is basically to make profit as the main reason for
doing business (Bobakova, 2003).
Financial performance is measured in different methods. One method is the use of
Return on Assets (ROA). ROA is the ability of firm’s assets to gain profit. It is arrived at
after the division of net annual income by the asset value. The other indicator is Return
on Equity (ROE) that refers to the profit contributed by the owners capital share in a
firm. It is gotten by dividing net income by the total equity capital. The other commonly
used measure as upheld by Hendrikse (2009) is Net Interest Margin (NIM) which is the
interest earned out of income from the assets. All these measures tend to explain the
extent to which the company performs financially which as well steers up other
perspectives of performance. The current study used ROA and ROE to measure financial
performance.
Financial goals drive higher profits, but non-financial company objectives also aid in
improving the company as a whole. The non-financial improvements help round out the
company's strengths in areas like customer service, production quality and employee
satisfaction. These areas create a stronger company as a whole that is able to perform
better in the market, increasing profits. A study by Kim, MacDuffie and Pil (2010)
observed that focusing on employee satisfaction allows firms to create a workforce of
engaged, loyal employees. With increased employees morale, often comes better
attendance and effort. By aiming to improve the workplace for employees, firm
management should show employees that the firm cares about more than simply making
money. The study also found that the quality of work produced by the firm affects
30
reputation and amount of business you receive. When a firm offers consistently high
quality products or services, the firm gains a positive reputation that potentially leads to
more business and repeat customers.
Ayako, Kungu and Githui (2015) conducted a study on determinants of the performance
of firms listed at the Nairobi Securities Exchange. This study analyzed the factors
affecting the performance of 41 non-financial companies listed on the Nairobi Securities
Exchange (NSE) using panel data over the period 2003 to 2013. The results indicated
that corporate governance was statistically significant in determining the performance of
firms and it had the expected sign (Positive). The leverage of the firm also had the
expected negative sign and was statistically significant in explaining the performance of
companies. Firm size and liquidity were however found to be statistically insignificant in
determining the performance of these firms. Any limitations/suggestions for areas of
further research/cross-reference!!
2.4 Empirical Studies
2.4.1 Leverage and Financial Performance
Al-Tally (2014) investigated on the effect of financial leverage on firm financial
performance in Saudi Arabia's public listed companies. The overall results of this study
were that, in the long term, in the absence of acute economic downturns, lower leverage
levels tend to lead to higher profit margins and returns on both assets and equity. It also
provides evidence to recommend that, under normal economic conditions, Saudi
Arabian firms could attempt to improve their financial performance by balancing their
zakat liabilities with their leverage borrowing levels.
Perinpanatha (2014) investigated the impact of financial leverage on financial
performance special reference to John Keels Holdings PLC Sri Lanka. The study
intended to test the hypothesis and to measure a relationship between the financial
leverage and the financial performance of the John Keells Holdings plc in Sri Lanka
31
during the periods of 2006-2012. The findings of the study showed a negative
relationship between the financial leverage and the financial performance of the John
Keells Holdings plc. However, the financial leverage had a significant impact on the
financial performance of the John Keells Holdings plc in Sri Lanka.
Wainaina (2014) conducted a study on the relationship between leverage and financial
performance of top 100 small and medium enterprises in Kenya. The study used
descriptive cross sectional research design. The study found that for the year 2009
liquidity had a greater effect to financial performance followed by leverage while firm
size had a minimal impact on financial performance of SMEs. The study also found out
that for 2012 leverage, liquidity and firm size explained 62.4% of changes in the
financial performance of the SMEs. The study concluded that leverage had a significant
influence on the financial performance; the study also concluded that there was a
positive relationship between leverage (debt equity ratio) and financial performance of
small and medium enterprises in Kenya. The study recommended that for SMEs to
effectively determine the funding mix to employ and to maintain a good debt equity
ratio, there is need for capacity building of SMEs in areas of business management.
Ali (2014) conducted a study on the impact of financial leverage on firm performance:
the case of non-financial firms in Kenya. The study took performance measures in a
wider perspective using ROA, ROE and Tobin’s Q. In addition to financial leverage the
study expanded its explanatory variables by controlling for liquidity, firm size and firm
age. The study analyzed the data from the three models using random effect model after
the Hausman test results preferred the random effect model while Levin Lin Chu test
results for unit roots indicated that the data was stationary. The results revealed that
there is a significant negative relationship between leverage and return on assets. The
result is also buttressing that profitable firms uses pecking order theory in its financing,
the more profitable a firm is, the more likely they are going to reduce its debts hence
internal financing is preferred. Findings from the Tobin’s Q model indicated that large
firms have a positive insignificant relationship between financial leverage and firm
performance while the older firms showed an increase in its market value; this is an
32
indication of investors’ confidence on the older firms who have built their reputation
over a long period.
Ebiringa and Ezeji (2012) studied the effect of financial leverage on bank performance
using six banks from Nigeria. The study made use of secondary data from Nigerian
Stock Exchange fact book and the financial statements of the sampled banks. Debt-
equity and coverage ratios were used to measure financial leverage which was the
independent variable, while earning per share (EPS) represented performance as the
dependent variable. Multiple regression technique was used to establish whether
relationship exist between financial advantage and performance of sampled banks. The
findings showed mixed results. While some banks reported positive relationship between
leverage and performance, others revealed negative relationship between leverage
and performance.
Njeri and Kagiri (2013) examined the effect of capital structure to the company’s
financial performance of listed banking institutions in Nairobi Securities Exchange. The
study determined whether capital structure have effect on financial performance of
the firm by considering the debt, leverage risk, debt equity ratio and interest rates and
how they are related to Return on Equity (ROE), Return on Assets (ROA), Gross Profit
Margin and Net Profit Margin (NPM) at determined significant level. The research
findings indicated that there was a positive relationship (R= 0.608) between the
variables. The study also revealed that capital structure aspects under study could
explain 56.4% of financial performance of commercial banks listed at the NSE. The
study findings revealed that the combined effect of the four aspects under study on
financial performance of commercial banks listed at the NSE was statistically
significant. This was revealed by the ANOVA findings where high F values and log p
values were registered at 95% confidence interval.
Enekwe, Agu and Eziedo (2014) determined the effect of financial leverage on
financial performance of the Nigeria pharmaceutical companies over a period of
twelve (12) years (2001-2012) for the three companies. This work employed three
33
financial leverage ratios for the independent variable which were: debt ratio (DR);
debt-equity ratio (DER) and interest coverage ratio (ICR). Financial performance on
the other hand was measured using Return on Assets (ROA). The ex-post facto research
design was used for this study. Secondary data were obtained from the financial
statements of the selected pharmaceutical companies’ quoted on the Nigerian Stock
Exchange (NSE). Descriptive statistics, Pearson correlation and regressions were
employed and used for this study. The results of the analysis showed that debt ratio (DR)
and debt-equity ratio (DER) have negative relationship with Return on Assets
(ROA) while interest coverage ratio (ICR) has a positive relationship with Return
on Assets (ROA) in Nigeria pharmaceutical industry. The analysis also revealed that
all the independent variables have no significant effect on financial performance of the
sampled companies. Based on the above findings, the researchers recommended that
companies’ management should ensure that financial decisions made by them are in
consonance with the shareholders’ wealth maximization objectives which
encompasses the profit maximization objective of the firm. The amount of debt finance
in the financial mix of the firm should be at the optimal level to ensure adequate
utilisation of the firms’ assets.
Wabwile, Chitiavi, Alala, Douglas and Islam (2014) analyzed and compared
performance amongst tier 1 commercial banks listed on NSE (that is banks with an asset
base above 100 billion by the year 2011) in relation to their financial leverage. Specific
indicators were used to measure and compare variance in their performance were
profitability Return on assets (ROA) and Return on capital employed (ROCE),
growth of the firm Earnings per share (EPS) and Dividend yield (DY) and value of the
firm Price book value (PBV) was preferred over price/earnings ratio because
earnings can be erratic, and hence vary depending on the season of the business but
assets on the other hand are less volatile and relatively easy to value. Pearson
correlation analysis and regression analysis were used to test correlation of data, F-test,
Durbin Watson test, adjusted R2, mean and standard error of the data. There is a
negative correlation between debt asset ratio and ROAC and ROCEC (-.642) and (-.494)
34
respectively though not significant. That is as the debt ratio increases, it means the
banks’ most assets are being financed by both long-term and short-term liabilities and
hence the return on such assets as well as that on capital employed is reduced to
cater for the outstanding liabilities. There is positive correlation between the debt
asset ratio and the EPS (.096) though not significant.
Abubakar (2015) investigated the relationship between financial leverage and
financial performance of deposit money banks in Nigeria, with specific reference to how
debt-equity ratio and debt ratio affect return on equity of deposit money banks in
Nigeria. Eleven deposit money banks from Tier 1, Tier 2 and Tier 3 classification
of banks were sampled using convenience sampling technique for the period 2005-
2013. This study adopted both descriptive and correlation analysis. Findings from the
descriptive analysis show that about 84% of total assets of deposit money banks in
Nigeria are financed by debts confirming that banks are highly levered financial
institutions. The correlation analysis revealed a significant relationship between debt-
equity ratio and financial performance proxy by return on equity. However, no
significant relationship was found between debt ratio and ROE. The study
recommends among others that an appropriate debt-equity mix should be adopted
by banks if they must improve their financial performance, survive and remain
competitive.
Maghanga and Kalio (2012) studied the impact of leverage on performance of the Kenya
power and lighting company. The study used a sample of 55 respondents and structured
questionnaires to collect primary data and secondary data was obtained from firm’s
annual reports. The study concluded that leverage has a great impact on performance as
far as financing is concerned. Thus, the study revealed that an optimal debt financing is
crucial in ensuring that companies realize improved financial performance. The study
recommended that companies should work on reducing some operational costs by going
for relative cheaper sources of financing to improve greatly on their financial
performance.
35
Zubair and Sajid (2014) examined the effect leverage on company’s performance from
Karachi Stock Exchange. Panel data methodology was used for companies listed at
Karachi Stock Exchange for the year 2004-2009. The study finding established a
negative relation between performance and leverage hence a conclusion that long-term
debt was more expensive thus utilization of debt in a high level results in a low
profitability.
Matemilola, Bany-Ariffin and Azman-Saini (2013) examined the effect of leverage and
managerial skills on returns for shareholders. The study used the fixed effects model and
multiple linear regression to analyze data collected. Regression analysis results
established that leverage had a positive relationship with shareholders’ return. Moreover,
it was established that managerial skills had a positive relationship with shareholders’
return. The study concluded that leverage and managerial skills may be priced in equity
valuation.
Gweyi and Karanja (2014) investigated the impact of leverage on performance of
Kenyan registered deposit-taking SACCOs using a sample of 40 Savings and Credit Co-
operative Societies. The study used secondary data for period of 2 years from the year
2010 to 2012. The findings of the study established that a positive correlation exists
between the debt-equity ratio with return on equity and after tax profits.
Banafa, Muturi and Ngugi (2015) examined impacts of leverage on financial
performance of listed Kenyan non-financial firms. The study employed a causal research
design and to examined the effect of leverage of the 42 listed non - financial firms at
NSE. Secondary data from firms’ financial statements was used for a period of five
years from the year 2009-2013. The study used the regression model to analyze the
collected data. The study revealed that leverage had a negative and significant impact on
corporate financial performance.
36
Rao, Al-Yahyaee and Syed (2007) investigated impact of financial leverage on corporate
financial performance using panel data in a textile sector of economy in Pakistan for a
period of 13 years beginning in the year 1999 to 2012. The study employed accounting
ratios ROA and Tobin Q to measures of corporate financial performance and total debt
to total assets ratio, long-term debt to total assets ratio, short-term debt to total assets and
debt to equity ratios to determine financial leverage. The study established that leverage
had a negative impact on ROA while Tobin Q has a positive coefficient with SDTA. The
study concluded that due to high cost of borrowing in Pakistan and the less development
of capital markets, firms are forced to borrow from banks to finance projects, which in
turn they pay huge amount of interest and principal, which affects their performance
Study by Mule and Mukras (2015) investigated the relationship between financial
leverage and financial performance of listed Kenyan firms. The study used annual data
for a 5 years period starting from the year 2007 to the year 2011. The study using panel
data analysis found strong evidence that financial leverage significantly and negatively
affects the performance measured using ROA and Tobin Q. Moreover, the study found
that financial leverage negative and insignificant effect on performance measured using
ROE. The study also revealed that asset tangibility and ownership concentration are
important determinants of performance.
Rehman (2013) employed a sample of 35 listed companies from Food Producer sector of
KSE. The research was conducted to find out the Relationship between financial
leverage and financial performance. The main variable used for test of Hypothesis
Comprise of Independent variable which is financial leverage whereas dependent
variable is Financial performance of listed sugar companies at KSE. Debt to equity ratio
was used to measure financial leverage whereas financial performance is measured using
Return on Asset, Earning per share, Net Profit margin, Sales growth and return on
equity. Results of the study show mix results. There was positive relation of debt to
equity ratio with return on Asset and Sales growth and negative relationship of debt to
equity ratio with Earning per share, Return on equity and Net profit margin.
37
Saini (2012) conducted a study on Impact of Financial Leverage on Shareholders Return
and business sector underwriting from the Indian Telecom part organizations. Study
period consisted of years 2004-2010. Hypothetical framework comprise of Independent
variable as financial leverage and dependent variable comprise of Shareholder return &
market capitalization. Telecommunication Industry. It was concluded that a Positive
Correlation is found between budgetary influence and shareholders return for
Telecommunication Industry and negative connection is found between monetary power
and business promotion for telecom Industry. The total valuation of a firm can be
Increased by the different bounding of three variables as Financial leverage, Shareholder
return & market capitalization.
Kahiga (2014) quantify the impact of deposit taking savings & credit cooperative in
Kenya. Study was an attempt to investigate the impact and the influence on execution of
store taking places in different Sacco’s in Kenya. They adopted the Analytical &
descriptive designs for research and the correlation analyses was done using Pearson’s
correlation method. SPSS was brought in to play to find out the significant relationship
among variables which consisted of financial performance as dependent & financial
leverage as independent variable. Study time period comprise of years 2010-2012.
Outcomes of the research showed that there is strong correlation financial performance
of Saccos in Kenya & the financial leverage. Pearson correlation between debt to equity
ratio & profitability variables was 0.994 and exhibited a strong relationship between the
two variables while on the other side Pearson correlation between debt to equity ratio &
profitability variables was 0.662 and showed strong relationship between the variables
since Sigma 2 tailed value S < 0.05.
Mahmoudi (2014) presented an empirical insight on the effect of leverage on cement
industry profitability. The study was an attempt to highlight the crucial issue that the
managers are confronting today, that how to choose the combination of debt & equity to
achieve the optimal capital structure that would minimize the firms cost of capital &
improves returns to the business owners. Using leverage on capital structure as
Independent variable and profitability as dependent variable and time period comprised
38
of years 2008-2011.They used descriptive and regression models to test the theory.
Results of the exploration demonstrate that there is critical negative relationship between
firm’s profitability & leverage. It was evidenced through this research that top
management of every firm should be focused on making prudent financing decisions in
order to remain profitable and competitive and therefore managers should realize to
what extent leverage had an influence on the financial performance.
Asif, Rasool and Kamal (2011) in their research finding regarding Impact of financial
leverage on dividend policy evidence from listed companies at Karachi Stock exchange,
examines the relationship between dividend policy & the financial leverage of 403
companies, listed in the Karachi stock exchange during the period 2002-2008. The
strategy for the profit that is trailed by the organizations is tried by utilizing broadened
model of Linter (1956) .Data utilized was gathered from investigation reports, online
information base of overall stock data, SBP website, Business Recorder website and
annual reports of the listed companies. Islamabad Stock exchange and Security
exchange commission of Pakistan was brought into play for the collection of data for the
year 2002 and 2003. Dividend yield and debt ratio were used as Independent variable
and dividend per share as dependent variables. First descriptive statistics for all the
variables are collected and after that association lattice was computed to distinguish a
preparatory relationship among all the variables emulated by relapse examination on
board information to look at the extent and criticalness through settled and irregular
impact model. It were demonstrated through hypothetical attestations and were defended
through Random impact display that broadly practiced dividend approach and level of
corporate obligation influence the profit arrangement of Pakistani firms. While on the
other side it has been observed that financial leverage was found to have negative effect
on profit payout, demonstrating that less profit installments are made by the
organizations that are under high leverage.
Bhatti, Majeed, Rehman and Khan (2010) had examined the effect of leverage on risk
and stock returns evidence from Pakistani companies. The paper had attempted to make
an Investigation on the influence of power on efficient hazard and stock return in the
39
corporate sector of Pakistan. Data was gathered from eight commercial enterprises that
are cotton, designing, Fuel and vitality, Chemicals, Transport and correspondence, sugar
and partnered concrete, paper &board. Data was collected from the period Jan 2005-Dec
2009. Primary data was collected due to limited time and resources are collected from
eight industries, researcher has not covered all the industries due to limitations.
Researchers analyzed the data by utilizing the recipes of return, Standard deviation,
Leverage and connected these entire recipe in Ms Excel. Results provided that despite of
many reforms brought by the Government, Corporate part still conveys an abnormal
state of influence making abnormal state of methodical danger prompting high
instability in stock costs of these commercial ventures exchanged on Karachi Stock
Exchange.
Jude Leon (2013) in his work on the Impact of capital structure on financial performance
of listed manufacturing firms in Srilanka explained that Capital structure is the most
significant discipline of Company’s operation Capital decision has the greatest
importance regarding the firm’s sustainability. The capability of an organization in
satisfying the needs of stakeholders is in close relation to capital structure. Study period
chosen for this study is from the years 2008-2012.Data was collected using secondary
sources such as Colombo stock exchange handbook, CD record of Colombo stock
exchange, Colombo stock exchange monthly report and CSE annual report. Study has
focused on the manufacturing sector, as the population had been taken from 30 firms and
there had been 150 firm-Years (30*5) for the panel data analysis purpose. SPSS
software version 13.0 has been used for the processing of data, further correlation,
regression and descriptive statistics were also utilized for data analysis. Independent and
dependent variables are measured using leverage, ROE and ROA. Results showed that
by correlation analysis leverage is negatively correlated with both ROA and ROE. There
is negatively relation prevalent between leverage and ROE which is significant at 0.001
levels. Here leverage has a significant relationship with ROE. On the other side there is
no significance between ROA and Leverage at significance level 0.097. Hence, there is

40
negative relationship prevalent between Leverage and ROE and no significant
relationship between leverage and ROA.
Moradi, Salehi and Erfanian (2010) in their research work on the study of effect of
financial leverage on earnings response coefficient throughout income approach: Iranian
evidence aimed to find out relationship between budgetary influence and profit reaction
coefficient through a wage approach. Companies raise their value by distinctive systems
to touch base on the choice that give better techniques are a test that most money related
directors of the partnership face. In organizations with remarkable obligation the
response of stock costs to sudden income will be influenced by company's liquidation
hazard. This incorporates organizations recorded on Tehran Stock Exchange and the
data of seven year period from 2002-2008 was used. Degree of financial leverage and
unexpected earnings were taken as Independent and abnormal stock return as dependent
variable. Analysis of data was performed by using multiple regressions. Outcomes of the
study portrays that the profit reaction coefficient for the low power firms gathering is
bigger than high influence ones, with contrasts in the methods among gatherings
factually noteworthy.
Taani (2012) investigated the Impact of working Capital management policy and
financial leverage on financial performance. This study had decided the Impact of
working capital administration approach and budgetary power on monetary execution of
Jordanian organizations measured regarding ROE, ROA and Net Income. Sample size
consisted of 45 Jordanian companies and time period of 5 years from 2005- 2009.By
taking N.I, ROE and ROA for measure of profitability and are used as dependent
variables whereas working capital management policy and debt ratio which are proxy
variable of financial leverage are used as Independent variables. To test the hypothesis
and to analyze the data of present research SPSS software was used. Whereas Test of
correlation using scatter graph, Pearson rank correlation, ANOVA & multiple regression
analysis were performed. Study results demonstrate that Test of obligation proportion
has moderate negative direct relationship to net Income and ROA yet a frail positive
association with ROE. Working capital administration approach test outcomes
41
characterized a moderate positive straight relationship to net salary. Further, there was
frail positive straight relationship between living up to expectations capital
administration arrangement and ROA; however it shows up there was no direct
relationship between living up to expectations capital administration approach and ROE.
Adongo (2012) studied the effect of financial leverage on profitability and risk of firms
listed at the Nairobi securities exchange. A casual research design was adopted for the
study. Population consisted of fifty eight companies out of which thirty companies were
sampled. The sample excluded fifteen companies listed under banks and insurance
because these companies are regulated and are to meet certain liquidity and leverage
ratios. Six companies were suspended. The study covered a five year period January
2007 to December 2011. Three companies were newly listed and therefore not
continuously listed over the period of study. Four companies had information missing
for some years required for the computation of the variables. Secondary data was used
and data was collected from thirty sampled firms. Source data included NSE database,
Capital Markets Authority (CMA) and Annual Audited Financial Statements of sampled
companies. Data was analyzed using Statistical Packages for Social Sciences (SPSS)
version 17. Cross-sectional time series fixed model was used with the regression and
correlation analysis to determine the nature and the strength of the relationship between
the independent and dependent variables. The findings revealed an insignificant
relationship between returns adjusted by risk and financial leverage. This contradicted
with the hypothesis of the study which had predicted a positive relationship between
financial leverage, profitability and risk of listed firms.
2.4.2 Liquidity and Financial Performance
Omesa (2015) conducted a study on effect of liquidity on the financial performance of
financial institutions listed in the Nairobi securities exchange. The study adopted
descriptive research design where secondary data was retrieved from the balance sheets,
income statements and notes of 19 financial institutions in the NSE for period covering
2010-2014. The results indicated that the relationship between liquidity and financial
42
performance is weak with an adjusted R2 of 55.17% and that capital structure had a
significant relationship with ROA while liquidity had an insignificant relationship. The
results further show that there is a negative relationship between NSE listed financial
institutions’ cash position indicator with ROA. This might be explained with the view
that with inadequate cash position, then the firm will borrow at possible high interest
rate costs and thus reduce the firm’s financial performance. The study concluded that
liquidity management is not a contributor alone of the firm’s financial performance and
there exist other variable that will influence ROA.
Njeri (2014) conducted a study on the effects of liquidity on financial performance of
deposit taking microfinance institutions in Kenya. This study used inferential statistics to
explain the main features of a collection of data in quantitative terms while correlation
and linear regression analysis are used for analyzing the data. The results revealed that
there is a positive relationship between liquidity and financial performance as the
coefficient of determination was found to be .910 explaining that the liquidity explains
91% of the variance in the financial performance. The correlation revealed a significant
association of .941 at 5% level of significant. The study concluded that efforts to
stimulate the MFIs’ liquidity would see the micro financial sector realize increased
financial performance that would result to increased efficiency in the sector’s operations.
Recommendations made include; strategies to facilitate increased liquidity of MFIs to be
adopted, emphasize on asset growth as a stimulator of financial performance and
competitiveness as well as improvements in operational efficiency through application
of modern technology and innovative operational strategies.
Sanghani (2014) investigated the effect of liquidity on the financial performance of non-
financial companies listed at the Nairobi securities exchange. Secondary data was
collected from NSE and multiple regression analysis used in the data analysis. The study
revealed that liquidity positively affect the financial performance of non-financial
companies listed at the NSE. The study established that current ratio positively affects
the financial performance of non-financial companies listed at the NSE. The study also
revealed that an increase in operating cash flow ratio positively affects the financial
43
performance of non-financial companies listed at the NSE. The study found that an
increase in debt to equity positively affects the financial performance of non-financial
companies listed at the NSE. The study recommends that there is need for non-financial
companies listed at the NSE to increase their current assets so as to increase their
liquidity as it was found that an increase in current ratio positively affect the financial
performance.
Maaka (2013) conducted a study on the relationship between liquidity risk and financial
performance of commercial banks in Kenya. The study adopted descriptive research
design. The study findings was that there has been an increase in value of cash balance
over the five year period studied though there has been an increase in the volume of
liquidity gap in commercial banks of Kenya over the five year period studied. It was also
found that there was positive correlation coefficient between return on assets and
customer deposits, cash balance and size of firm though a weak positive correlation
between return on assets and liquidity gap existed. The study concluded that liquidity
risk not only affects the performance of a bank but also its reputation and this might
result in the loss of confidence among the depositors if funds are not timely provided to
them. In addition to this, a poor liquidity position may cause penalties from the regulator
and therefore it becomes imperative that banks maintain a sound liquidity position at all
times. The study recommends that banks should maintain adequate liquidity levels
though in the form of short-term marketable securities in order to realize profits for the
banks.
Alshatti (2015) conducted a research to find empirical evidence of the degree to which
effective liquidity management affects profitability in Jordanian commercial banks and
how commercial banks can enhance their liquidity and profitability positions. Based on
the research findings, the researcher concluded that, there is an effect of the liquidity
management on profitability as measured by ROE or ROA, where the effect of the
investment ratio and quick ratios on the profitability is positive when measured by ROE,
and the effect of capital ratio on profitability is positive as measured by ROA.
44
A study by Dong and Su (2010) concluded that a firm’s profitability and liquidity are
affected by working capital management. The study used pooled data for the period
between 2006 and 2008 to assess the companies listed in the Vietnam Stock Exchange.
The study focused on cash conversion cycle (CCC) and related elements to measure
working capital management. The study found that the relationships among these
variables were strongly negative, suggesting that profit is negatively influenced by an
increase in CCC. The study also found that profitability increases as the debtor’s
collection period and inventory conversion period reduce. The present study
operationalized working capital management in terms of aggressiveness and
conservatism as measured by the proportion of current liabilities to total assets and total
liabilities.
Maina (2011) researched on relationship between liquidity and profitability of oil
companies in Kenya covering the period 2007 - 2010. Secondary data was used in the
analysis that was obtained from the firm’s financial statements. A regression model was
developed to determine the relationship between the dependent variable (Profitability of
the firms) and independent variables (liquidity position). The independent variable used
in the model consisted of current ratio, quick ratio, cash conversion cycle, while
leverage and the age of the firm were used as control variables. The study found that that
liquidity management is not a significant contributor alone of the firm’s profitability and
there exist other variable that will influence ROA. However, it is important for a firm to
understand the effect of each of the liquidity components on the firm’s profitability and
undertake deliberate measures to optimize its liquidity level.
Qian (2002) investigated association involving a measure of the cash gap and company
financial performance in their study of a large sample of listed American businesses for
a twenty year duration starting from 1975 to 1994; the results indicated a negative
relationship. This shows that shareholders wealth is maximized by reducing the cash
conversion cycle. Owolabi and Obida (2012) carried out a study of manufacturing
companies quoted on the Nigerian stock exchange on the effects liquidity have on
company financial performance. Using descriptive research they found that liquidity as
45
measured in terms of cash conversion cycle, cash flows and credit policy have a
significant effect on company financial performance and they concluded that financial
performance as measured by profits may be improved by having short cash conversion
cycle, employing good credit policy and having an efficient cash management policies.
Njure (2014) examined the association linking the policies put in place in the
management of working capital and business profitability for companies quoted at the
NSE. Using a sample of 19 listed joint stock entities for a five-year duration and the
findings were that company’s profitability as measured by ROA increases with firm’s
size, efficient working capital and with a lesser aggressiveness of the asset management.
Thus, contrary to the traditional theory of asset management, where a conservative
policy is expected to sacrifice profitability at the cost of liquidity, the research study
found a positive association amid a conservative management of current asset and
current liabilities and the financial performance of firms quoted at the NSE.
Akoto, Awunyo-Vitor & Angmor (2013), in their studies found out that, Working
capital management affect company’ liquidity. Palepu, Healy and Bernard (2015)
recommended financial ratios and cash flow analysis as methods of measuring financial
performance, Ooghe and De Prijcker (2008) agreed that debts of the companies increase
companies’ illiquidity and impairs the companies’ financial performance.
Al-khatib and Al-Horani (2012) investigated the role of a set of financial ratios
in predicting liquidity of publicly listed companies in Jordan. The authors used logistic
regression and discriminant analysis a comparison to determine which is more
appropriate to use as well as which of the financial ratios are statistically significant in
predicting the liquidity of Jordanian companies. During the period between 2007 and
2011, the results show that both logistic regression and discriminant analysis can predict
liquidity, and that Return on Equity (ROE) and Return on Assets (ROA) are the most
important ratios, which help in predict the liquidity of public companies listed on
Amman Stock Exchange.
46
In his study, Eljelly (2014) found that there was a significant negative relationship
between a firm’s profitability and its liquidity level. When firms have more assets than
liabilities, this might be a sign that they are losing investment opportunities that could
return in profits for the company. Having fewer current assets is risky. However, in the
long term, it is profitable. This retains more cash leads to lower profit due to missing
profitability investment opportunities. Illiquid firms are risky, yet profitable. However,
this cannot be the case in all situations, as other factors can affect these propositions.
The size and age of the firm affects the effect of liquidity on profitability. Small firms
with high liquid assets might be more profitable than larger firms in the short term.
Conversely, larger firms with illiquid assets might be more profitable than smaller firms
in the long term.
Sur, Maji and Banerjee (2013) made a comparative analysis of liquidity management of
four major companies in Indian power sector, covering a period from 1987-88 to 1996-
97. The techniques of radio analysis, Motaal’s comprehensive rank test, and simple
statistical techniques like measures of central tendency and spearman’s rank correlation
analysis have been used for the analysis. The liquidity ratios such current ratio, quick
ratio, current assets to total assets ratio, inventory turnover ratio and debtors’ turnover
ratio have been used for comparison and suitable interpretations have been made
Motaal’s comprehensive test is used to analysis the liquidity more precisely. To measure
the closeness of association between liquidity and financial performance of the
companies, Spearman’s rank correlation co-efficient has been applied. The study has
revealed that the inventory turnover ratio has a positive impact on firms’ financial
performance whereas the liquidity ratio, working capital turnover ratio and working
capital to total asset have negatively influenced the profitability.
Khidmat and Rehman (2014) analyzed the relationship between the liquidity, solvency
and performance which plays a vital role in the Return on Assets of the chemical sector
in Pakistan. The analysis explained the relationship between liquidity and solvency with
ROA and is conducted on the data of 10 chemical companies for the past nine years
47
(2000-2009) in the chemical sector of Pakistan. Conclusions drawn were that liquidity
ratio affects ROA positively while it impacts negatively on solvency.
Suhaila (2014) investigated the effect of liquidity and leverage on financial performance
of commercial state corporations in the tourism industry in Kenya. The study adopted
descriptive research design where data was retrieved from the Balance Sheets, Income
Statements and Notes of ten (10) Commercial State Corporations in the tourism industry
in Kenya during the study period 2008-2012. A regression model was used to assess the
impact of liquidity and leverage on financial 18 performance measured with
profitability. A positive relationship was found to exist between tourism industry
liquidity and profitability of Commercial State Corporations in the tourism sector in
Kenya.
2.4.3 Asset Tangibility and Financial Performance
Harc (2015) conducted a study on the relationship between tangible assets and capital
structure of small and medium-sized companies in Croatia. The study found out that the
relationship between tangible assets and long-term leverage is positive in all observed
years and statistically significant. The results show that small and medium-sized
companies use their collateral to attract long-term debt, which means that small and
medium-sized companies use lower costs and the interest rate of long-term debt in
relation to short-term debt. These findings correspond with the maturity matching
principle, according to which long-term assets are financed with long-term financing and
short-term assets are financed with short-term funds. These results suggest that tangible
assets have a positive impact on the long-term debt of Croatian SMEs because tangible
assets constitute a positive signal to the financial institutions, which can request the
selling of these assets in case of bankruptcy. These findings are consistent with the
trade-off theory that predicts a positive relation between leverage and tangibility, but
also with the pecking order theory, which is generally interpreted as predicting a
negative relation between leverage and tangibility.
48
Koksal et al. (2013) investigated the factors that determine the capital structure choices
in Turkey. They used tangibility as a proxy for the type of assets. They found that
tangibility appears to be the key determinant of long-term leverage (positive
relationship), but is not important for short-term leverage (negative relationship). Their
empirical findings suggested that the trade-off theory is a better description of the capital
structure of Turkish firms then the pecking order theory.
Campello and Giambina (2011) examined the relation between corporate asset structure
and capital structure by exploiting variation in the salability of tangible assets. They
argued that tangible assets are often illiquid, so they show that redeployability of
tangible assets is the main determinant of corporate leverage for firms that are more
likely to face credit frictions, especially during periods of tight credit. Their evidence
shows that tangible assets drive capital structure to the extent that they are redeployable.
Only the component of asset tangibility that responds to salability has explanatory power
over firm leverage. They found that the relation between redeployability and leverage is
important and pronounced in firms for which the collateral resource is particularly
important in the borrowing process. For large firms, in contrast, redeployability is an
irrelevant driver for leverage.
Sanyal and Mann (2010) examined the financial structure of start-up firms. They found
that start-ups with more tangible assets as potential collateral are more likely to use
external debt in the financial structure, since these assets have a high liquidation value.
Psillaki and Daskalakis (2008) investigated the capital structure of Greek, French, Italian
and Portuguese small and medium-sized enterprises. They argue that the costs of
financial distress depend on the types of assets that a firm employs. If a firm retains
large investments in land, equipment and other tangible assets, it will have smaller costs
of financial distress than a firm that relies on intangible assets. Thus, firms with more
tangible assets should issue more debt. On the other hand, large holdings of tangible
assets may imply that a firm has already a stable source of return, which provides more
internally generated funds and discourages it from turning to external financing.
Therefore, the negative relationship between leverage and asset structure indicates that
49
firms employ lots of tangible assets and seem to rely more on internal funds generated
from these assets, which is predicted by the pecking order theory. They found that asset
structure is significant and negatively correlated with leverage. A possible explanation is
that firms with lots of tangible assets may have already found a stable source of return,
which provides them more internally generated funds and discourages them from turning
to external financing.
The study by Okwo et al. (2012) assessed the impact of a company's investment in fixed
assets on its operating profit margin. The study is based on a sample four companies in
the Nigerian brewery sector over an eleven year period from 1999 to 2009. The
operating profit margin was taken as the dependent variable while the independent
variables were Sales/Net Fixed Assets ratio, Interest Rates, Foreign Exchange Rate, and
Inventory/Cost of Sale ratio. The findings of the study was that though the relationship
between the level of investment in fixed assets and its impact on the operating profit was
positive, the result was not statistically significant. Therefore, the result did not suggest
any strong positive impact of investment in fixed assets on the operating profit of
brewery firms in Nigeria.
Olatunji et al. (2014) examined the effect of investment in fixed assets on profitability of
selected Nigerian banks. Data were obtained from annual reports and accounts of
thirteen selected Nigerian commercial Banks for the period from 2000-2012. The
relationship between the dependent variable (Net profit) and independent variables
(Building, Land, Leasehold premises, fixtures and fitting, and investment in computers.)
indicated that there was a significant relationship between them. The study concluded
that investments in fixed assets had strong and positive statistical impact on the
profitability of banking sector in Nigeria Further, the overall result of the study by
Ahmad, Abdullah, Sulong and Abdullahi (2015) on some listed manufacturing
companies indicated that the fixed assets had impact on ROE but not on ROA.
50
Campello (2006) conducted a study on asset tangibility and corporate performance under
external financing. It’s obvious that the overall performance of externally-funded
funding is pushed by the post-financing value/redeploy ability of the firm belongings
outdoor of the company. In addition, the thing of funding that is explained through
external financing is associated with superior firm product market overall performance,
valuation, and accounting returns when, eventually to financing, asset tangibility turns
out to be high. in evaluation, economic consequences associated with outside investment
are markedly poorer whilst asset tangibility is ex put up low. Crucially, those dynamics
are not discovered for internally-funded investment. Inferences that the firm observes
superior enterprise performance below external financing whilst belongings are greater
tangible keep for each new outside fairness and debt financing.
Baloch, Ihsan, Kakakhel and Sethi (2015) conducted a study on impact of Firm Size,
Asset Tangibility and Retained Earnings on Financial Leverage: Evidence from Auto
Sector, Pakistan. Data from 22 companies from an analysis of the financial statements
published by the State bank of Pakistan (SBP). The relationship between the underlying
variables was determined by use of multiple regression analysis. Analyzed data show
that the size of the firm and tangibility of assets have significant impact on leverage. In
addition, it also mentioned there exist a negative relationship between the individual
variables. It is stated that retained earnings have no significant effect on leverage.
2.4.4 Firm Size and Financial Performance
Abbasi and Malik (2015) pinpointed the effect of firm size between the relationship of
firm growth and firm performance. In the study null and alternative hypothesis was
constructed. The secondary cross-sectional data was gathered from 50 firms listed in
Karachi stock Exchange. Before application of regression equation the formality of
stationary of data was fulfilled, in addition the issue of the multi-co-linearity was
resolved. The results of the regression analysis were demonstrating that the alternative
hypothesis of the research that firm size had inspiration between independent variable
(Firm growth) and dependent variable (Firm performance) was accepted. The study is
51
cooperative for the management to keep an eye on firm size along with firm growth
while enhancing the firm performance.
Mahfoudh (2013) sought to find the effect of selected firm characteristics namely firm
size, leverage, firm age, liquidity, and board size on firm financial performance as
measured by return on assets. The study used correlational research design in an attempt
to investigate the effect of firm characteristics on firm financial performance and the
extent of causation was documented by running a multivariate linear regression analysis.
The target population was seven agricultural firms listed at the Nairobi Securities
Exchange and the researcher selected six out of the seven listed firms due to
inaccessibility of the seventh listed firm from the year 2007 to 2012. The study
evidenced that the only variables that were statistically significant were liquidity and
board size and the other three variables that were not statistically significant were
namely firm size, leverage and firm age. However, firm size, leverage, firm age, and
liquidity were positively related to firm financial performance and board size was the
only variable that was negatively related to firm financial performance.
Naran (2013) investigated the effects of voluntary disclosure and company size on the
financial performance of commercial banks in Kenya. Specifically, the study examined
general and strategic disclosure, financial disclosure, forward looking disclosure, board
disclosure as a proxy for measuring voluntary disclosure and company size and how
they affect the financial performance of commercial banks in Kenya. Financial
performance was measured using Return on Equity (ROE). The study adopted a
descriptive research design. The study found that a strong relationship exist between the
voluntary disclosure, firm size and financial performance. Financial disclosure, board
disclosure and forward looking disclosure was found to positively affect the financial
performance while general and strategic disclosures was found to negatively affect
financial performance of commercial banks in Kenya. There was a positive relationship
between asset a proxy for company size and firm financial performance.
52
Njoroge (2014) conducted a study on the effect of firm size on financial performance of
pension schemes in Kenya. The objective of this study was to determine the effects of
firm size on financial performance of pension schemes in Kenya, to determine the effect
of market share; to the assess the effect of the number of employees; to establish the
effect of book assets; to establish the effect of the number of branches and to establish
the effect of retained earnings on the financial performance of pension schemes in
Kenya. The research was conducted through a descriptive research design. The study
concluded that that there has been significant market volatility as evident from the NSE
index, Treasury bill rate movement and offshore indices. The study recommended that
RBA should ensure all schemes, particularly those with segregated investments, have up
to date investment policies and that the strategic asset allocation is included within the
investment policy. It also recommended compulsory saving for all in employment, and
the introduction of a flexible scheme for those in the informal sector, who can make
periodic payments.
Pervan and Višić (2012) conducted a study on a firm may use different methods and
diverse (non) financial analysis/indicators in order to evaluate its business success.
However, one of the most widely applied methods refers to financial analyses that use
profitability ratios as the key measures of firm’s overall efficiency and performance. In
their research, they focused attention on firm size and evaluated its influence on firm
profitability. Other than, by the size of a firm, a firm performance was affected by a
variety of internal and external variables. Therefore, apart from mere investigating the
relationship between firm size and performance, they also explored the impact of some
other variables crucial in determining firm profitability. The analysis was conducted for
the 2002-2010 period and the results revealed that firm size had a significant positive
(although weak) influence on firm profitability. Additionally, results showed that assets
turnover and debt ratio also statistically significantly influence firms’ performance while
current ratio did not prove to be an important explanatory variable of firms’ profitability.
53
Tahir and Razali (2011) using the firm size as one of the predictor variable, examined
the relationship between enterprise risk management and firm value. The findings from
the study indicated that there is positive relationship between firm size and firm value.
The size influences a firm performance because large firm can increase their current size
very fast by accumulating earnings from past performance and this enhances their value.
In terms of structure which is firm’s characteristics, institutional shareholders can
influence any decision by management of firms. The accumulation of funds assists in
putting up effective risk management structures.
Liargovas and Skandalis (2008) did a study on the financial performance and size of
manufacturing firms in Greece. They found that financial performance of majority of the
firms was affected by firm size. They argued that firm size is a basis of competitive
advantage in the sense that larger companies tend to be more efficient than their smaller
counterparts and have better resources to survive economic downturns. According to
Shen and Rin (2012), cited by Mule, Mukras and Nzioka (2015) in their study found that
firm size had a positive relationship with performance, implying that bigger firms are
expected to achieve better performance. However, in the case of UK firms, size had a
negative and significant effect on performance of the companies. This implies that, small
companies sometimes suffer less from agency problems and more flexible structure to fit
the change. They further argued that management efficiency reflects the capability of the
management to deploy its resources efficiently and can be measured by financial ratios.
The higher the ratio, the more the efficient management is in terms of operational
efficiency, income generation and asset utilisation.
DeJong, Kabir and Nguyen (2008) analysed the influence factors of firm size,
profitability, tangibility, no debt tax shield and sales growth of the capital structure of
companies listed on the Stock Exchange. The study tried to see the differences of the
results from the previous research with the research. The purpose of this study is to
examine and determine the effect of firm size, profitability, tangibility, non-debt tax
shield and sales growth of the capital structure on Banking Firms listed in Indonesian
Stock Exchange period 2007-2012. Banking companies used in this study are all
54
banking companies’ listings in 2007-2012, due to the limited number of listed
companies, the census conducted by using all listed companies as much as 21 banks
were analyzed using descriptive statistic and panel data regression with fixed effect
model to test the hypotheses. The result of this research reveal that firm size,
profitability, non-debt tax shield and growth has any effect to the capital structure, while
tangibility were found has no effect to the capital structure. Overall, the independent
variables have any effect to capital structure simultaneously. The magnitude of the
coefficient of determination (Adjusted R Square) is equal to 0.874. This means that
87.4% of capital structure of the dependent variable can be explained by the five
independent variables, namely firm size, profitability, tangibility, non-debt tax-shield
and sales growth. While the remaining 12.6% of capital structure is explained by
variables or other causes outside the model.
Ramasamy, Ong and Yeung (2005) suggested that size is positively related to a firm's
ability to produce technologically complicated products that in turn leads to
concentration. Such markets are supplied by few competitors and are therefore, more
profitable. Thus, larger firms have access to the most profitable market segments. The
empirical relationship between a firm's size, structure, and profitability has found that
size is positively correlated with profitability (Abor, 2005).Additionally, profit rate of
the market is positively correlated with the concentration ratio and negatively correlated
with the marginal concentration ratio (Kioko, 2013). Also it shows that the positive
association between firm size and profitability stems from implementing greater
differentiation and specialization strategies, and should therefore lead to higher
efficiency. Further studies also suggest that larger firms are able to leverage on
economies of scale.
Aroni (2011) tested the influence of return on assets for the firms listed on the Nairobi
stock exchange. The data collected covered the period covering 2002 December to 2008
December. The focus was to come up with the geometric stock returns on the stock
prices for each year. The independent variables which were used in the research were the
book to market, cash flow ratio, the dividend yield, firm size and the profitability ratio.
55
The conclusion drawn from the research was that in Kenya, stock returns are weakly
driven by the firm specific factors. The study found a weak positive relationship
between firm size and return for the firms under study.
Storey (2002) even found a negative association between firm size and profitability for
U.K. based listed manufacturing companies. While no suitable reasoning can be used to
explain such a link, organizational theory may perhaps solve part of this quandary.
Furthermore, Henri (2004) suggests that larger firms can lead to increased coordination
requirements, which in turn, makes the managerial task more difficult leading to
organizational inefficiencies and lower profit rates. Further, it has been suggested that
increased size tends to be associated with higher bureaucratization (Liargovas &
Skandalis, 2008). Larger firms may have overly bureaucratic management structures,
thereby inhibiting swift and efficient decision-making process. It is also possible that
with the additional management layers needed to organize an increasingly large and
diverse workforce, management may be affected by the agency problems.
Salim (2012) studied the relationship between bank size and financial performance of
commercial banks in Kenya. The study specifically aimed at determining the
relationship between bank size factors, namely, total deposits, total loans, and total
assets, and financial performance, and went further to investigate the relationship
between branch network size and financial performance. The main findings of the study
established strong correlations between all the studied factors of bank size.
Lee (2009) examined the role that firm size plays in profitability. He used fixed effect
dynamic panel data model and performed analysis on a sample of more than 7000 US
publicly-held firms. Results showed that absolute firm size plays an important role in
explaining profitability. However, this relationship was nonlinear meaning that gains in
profitability reduced for larger firms. Amato and Burson (2007) tested size-profit
relationship for firms operating in the financial services sector. The authors examined
both linear and cubic form of the relationship. With the linear specification in firm size,
the authors revealed negative influence of firm size on its profitability. However, this
56
influence wasn’t statistically significant. On the other hand, the authors found evidence
of a cubic relationship between ROA and firm size.
Using financial and economic data, Ammar, Hanna, Nordheim, and Russell (2003)
examined the nature of the size-profitability relationship on a sample of electrical
contractors. Using a first-order autoregressive model built into the error term, the
authors found a significant difference in terms of profitability between small, medium
and large firms. Namely, they revealed that profitability drops as firms grow larger than
$50 million in sales. On a sample of a US manufacturing firms, Amato and Wilder
(1985) tested size-profitability relationship in linear as well as quadratic form. However,
the results of their analysis showed that there is no relationship between firm size and
profit rate.
A positive relationship between firm size and profitability was found by Vijayakumar
and Tamizhselvan (2010). In their study, which was based on a simple semi-logarithmic
specification of the model, the authors used different measures of size (sales and total
assets) and profitability (profit margin and profit on total assets) while applying model
on a sample of 15 companies operating in South India. Papadognas (2017) conducted
analysis on a sample of 3035 Greek manufacturing firms. After dividing firms into four
size classes he applied regression analysis which revealed that for all size classes, firms’
profitability is positively influenced by firm size. Using a sample of 1020 Indian firms,
Majumdar (1997) investigated the impact that firm size has on profitability and
productivity of a firm. While controlling for other variables that can influence firm
performance, he found evidence that larger firms are less productive but more profitable.
2.4.5 Firm Age and Financial Performance
Rafiq, Salim and Smyth (2016) studied the moderating role of firm age in the
relationship between research and development (R&D) expenditure and financial
performance. The study examined the impact of research and development (R&D) on
the profitability and sales of mining firms in China and the United States (US) and the
57
moderating effect of firm age using Coarsened Exact Matching (CEM). Findings
indicated that in the mining industry, firm age moderates the relationship between R&D
activities and financial performance. In general, a comparatively mature R&D active
firm earns 4.4% more profit and generates 7.2% more sales than a younger non-
innovative firm. Further, the findings indicated that the turning point at which R&D
activities switch from making a negative, to positive, contribution to profit and sales was
37 years and 22 years, respectively.
Pervan, Pervan and Ćurak (2017) determined the moderating influence of age on firm
performance with evidence from the Croatian Food Industry. The study performed
dynamic panel analysis based on a sample of 956 firms operating in Croatian food
industry during the 2005-2014 period. The result of the analysis showed that age
negatively affects firm’s performance. As firms get older, benefits of their accumulated
knowledge in all crucial aspects of the business (technology, supply channels, customers
relations, human capital and financing costs) become overcome with their inertia,
inflexibility and osseous by accumulated rules, routines and organizational structure.
Beside firm’s age, other firm specific factors influencing profitability of the firms
operating in Croatian food industry include size, liquidity and solvency.
Kristiansen, Furuholt and Wahid (2013) found that long time in operation was
significantly linked to business success. These studies found that microfinance
efficiency and profitability were strongly related to its age. The large pool of
customers with an old microfinance and the resulting efficiency is therefore, likely to
make it achieve a higher growth in outreach and higher ROA and financial self-
sufficiency.
Kaguri (2013) conducted a study using firm age as a moderating variable on the
relationship between firm characteristics and financial performance of life insurance
companies in Kenya. The study used size, diversification, leverage, liquidity, age,
premium growth and claim experience as the independent variables and financial
performance as the dependent variable. The study findings indicate that the joint effect
58
of variables are statistically significance to influencing financial performance of life
insurance companies as indicated by the positive and strong Pearson correlation
coefficients. This implies that premium growth is relied upon to make conclusions about
the financial performance of life insurance companies’ as shown by its strong and
positive correlation coefficients. Based on the findings, the study recommends that
insurers must work towards improving the premiums earned to increase profits. Further
studies should be undertaken to analyze the different sectors in the economy to
determine any significant differences in the relationship between firm characteristics and
financial performance in the different sectors incorporating more independent variables.
According to the life cycle effect, younger companies are more dynamic and more
volatile in their growth experience than older companies (Evans, 1987) are. Very often,
the emergence of those companies is based on some innovations. Maturity brings
stability in growth as firms learn more precisely their market positioning, cost structures
and efficiency levels, are less frequently surprised by profit outcomes, and consequently
are less likely to revise their investment plans.
Borghesi, Houston and Naranjo (2007) indicated that older firms are incapable of quick
response to any changes in the environment and thus does not easily adapt to changing
business environments which affects their financial performance.
2.4.6 Financial Performance
The concept of financial performance has been used widely to measure financial
performance. In different studies both market measures such as Tobin’s Q (Karaca &
Ekşi, 2012; Abdullah, Shah & Hassan, 2008). Tobin’s Q is estimated as the ratio of the
market capitalization plus total debts divided by total asset of the company. Market
value added (MVA) which is calculated as the absolute difference between market value
and book value of equity (Abdullah, Shah & Hassan, 2008; Kula, 2005). In addition, Al
Farooque, Van Zijl, Dunstan and Karim (2007) measured financial performance using
the ratio of market value to book value ratio.
59
Other studies measured financial performance using financial ratios such as dividend
yield, return on equity, return on assets, price earnings ratio, abnormal returns and
superior cumulative abnormal returns (Braun & Sharma, 2007; Obiyo, Ofurum & Lenee,
2011; Al Farooque, Van Zijl, Dunstan & Karim, 2007). According to Braun and Sharma
(2007), financial performance can be improved about how a firm performs the activities
it is mandated to perform. In this regard if commercial recruits more loan members who
have low chances of default then there are high chances of superior performance.
As indicated by Sebhathu (2011) if an institution is able to recruit and retain more
customers then there are chances of attaining superior financial performance. As
indicated by this study through development of an organization there are chances of
poverty reduction, increased levels of financial sustainability among residents seeking
services from a particular institution. In addition, an institution financial performance
can be evaluated on the level of percentage change as influenced by several parameters
of interest. Consequently, the current study seeks to examine the percentage change on
profitability measures and customer satisfaction measurers as a result of an organization
adoption and usage of enterprise risk management measurers.
Omondi and Muturi (2013) conducted a study on factors affecting the financial
performance of listed companies at the Nairobi Securities Exchange in Kenya. The study
adopted an explanatory research design and 29 listed firms (excluding listed banks and
insurance companies) which have consistently been operating at the Nairobi securities
exchange during the period 2006-2012 were sampled. Study findings showed that
leverage had a significant negative effect on financial performance. Company size also
had a significant positive effect on financial performance
2.5 Critique of the Literature
Past studies have been conducted on the relationship between leverage and performance.
However, there has not been clear consensus on the effect of leverage on financial
performance. Perinpanatha (2014) investigated the impact of financial leverage on
60
financial performance Special Reference to John Keels Holdings PLC Sri Lanka. The
findings of the study showed a negative relationship between the financial leverage and
the financial performance. Wainaina (2014) conducted a similar study on the
relationship between leverage and financial performance of top 100 small and medium
enterprises in Kenya but found different results. The study found a positive relationship
between leverage (debt equity ratio) and financial performance. Both study investigated
the relationship between leverage and financial performance but their results were
different. Ali (2014) conducted a study on the impact of financial leverage on firm
performance: the case of non-financial firms in Kenya. The studies found that financial
leverage have a negative impact on firm performance.
In addition, there is no consensus on the effect of liquidity on performance. Njeri (2014)
conducted a study on the effects of liquidity on financial performance of deposit taking
microfinance institutions in Kenya. The results revealed that there is a positive
relationship between liquidity and financial performance. This study was not clear on the
measure of liquidity. Omesa (2015) conducted a similar study on effect of liquidity on
the financial performance of financial institutions listed in the Nairobi securities
exchange but found different results. According to the study, liquidity has no significant
effect on financial performance. Sanghani (2014) investigated the effect of liquidity on
the financial performance of non-financial companies listed at the Nairobi securities
exchange. The study revealed that liquidity positively affect the financial performance of
non-financial companies listed at the NSE.
Mahfoudh (2013) sought to find the effect of selected firm characteristics namely firm
size, leverage, firm age, liquidity, and board size on firm financial performance as
measured by return on assets. The study found that firm size, leverage, firm age, and
liquidity were positively related to firm financial performance and board size was the
only variable that was negatively related to firm financial performance. The study used
correlational research design. The study used firm age as an independent variable. Other
studies for example Rafiq, Salim and Smyth (2016) studied the moderating role of firm
age in the relationship between research and development (R&D) expenditure and
61
financial performance. The study found that firm age moderates the relationship between
R&D activities and financial performance. Pervan, Pervan and Ćurak (2017) determined
the moderating influence of age on firm performance with evidence from the Croatian
Food Industry. This study used age as a moderating variable.
2.6 Research Gaps
Al-Tally (2014) investigated on the effect of financial leverage on firm financial
performance in Saudi Arabia's public listed companies. The study was conducted in
Saudi Arabia thus presenting a scope gap. The current study was conducted in Kenya. In
addition the study focused on financial leverage as the only firm level factor that affects
financial performance thus presenting a conceptual gap. The current study focused on
four firm level factors which included; leverage, liquidity, asset tangibility and firm size.
Perinpanatha (2014) investigated the impact of financial leverage on financial
performance special reference to John Keels Holdings PLC Sri Lanka. The study was
conducted in Sri Lanka thus presenting a scope gap. The current study was conducted in
Kenya. Wainaina (2014) conducted a study on the relationship between leverage and
financial performance of top 100 small and medium enterprises in Kenya. The study
focused on small and medium enterprises thus presenting a contextual gap. The current
study will focus on financial and non-financial firms listed in NSE.
Banafa, Muturi and Ngugi (2015) examined impacts of leverage on financial
performance of listed Kenyan non-financial firms. The study employed a causal research
design thus presenting a methodological gap. The current study employed a cross-
sectional research design. Omesa (2015) conducted a study on effect of liquidity on the
financial performance of financial institutions listed in the Nairobi securities exchange.
The study adopted descriptive research design thus presenting a methodological gap.
The current study employed a cross-sectional research design. Njeri (2014) conducted a
study on the effects of liquidity on financial performance of deposit taking microfinance
institutions in Kenya. The study focused on financial leverage as the only firm level
62
factor that affects financial performance thus presenting a conceptual gap. The current
study focused on four firm level factors which included; leverage, liquidity, asset
tangibility and firm size.
Maaka (2013) conducted a study on the relationship between liquidity risk and financial
performance of commercial banks in Kenya. The study adopted descriptive research
design thus presenting a methodological gap. The current study employed a cross-
sectional research design. Harc (2015) conducted a study on the relationship between
tangible assets and capital structure of small and medium-sized companies in Croatia.
The study was conducted in Croatia thus presenting a scope gap. The current study was
conducted in Kenya. Koksal et al. (2013) investigated the factors that determine the
capital structure choices in Turkey. The study was conducted in Turkey thus presenting
a scope gap. The current study was conducted in Kenya.
Abbasi and Malik (2015) pinpointed the effect of firm size between the relationship of
firm growth and firm performance. The study focused on firm size as a moderating
variable of the relationship between firm growth and firm performance thus presenting a
conceptual gap. The current study focused on firm size as a firm level factor that affects
financial performance.
Mahfoudh (2013) sought to find the effect of selected firm characteristics namely firm
size, leverage, firm age, liquidity, and board size on firm financial performance as
measured by return on assets. The study used correlational research design thus
presenting a methodological gap. The current study used cross-sectional research design.
Naran (2013) investigated the effects of voluntary disclosure and company size on the
financial performance of commercial banks in Kenya. The study focused on commercial
banks thus presenting a scope gap. The current study focused on financial and non-
financial firms listed in NSE.
63
Pervan, Pervan and Ćurak (2017) determined the moderating influence of age on firm
performance with evidence from the Croatian Food Industry. The study was conducted
in Croatia thus presenting a scope gap. The current study was conducted in Kenya.
Kaguri (2013) conducted a study using firm age as a moderating variable on the
relationship between firm characteristics and financial performance of life insurance
companies in Kenya. The study focused on life insurance firms thus presenting a
contextual gap. The current study focused on financial and non-financial firms listed in
NSE.
2.7 Summary of the Chapter
This chapter reviewed the various theories that explain the independent and dependent
variables.
To start with is the trade – off theory. The theory discusses the various corporate finance
choices that a corporation experiences. It also describes that the companies or firms are
generally financed by both equities and debts. This theory is deemed relevant to this
study. This is because it informs the dependent variable which is performance. Secondly
is the liquidity preference theory. The theory holds the idea that investors demand a
premium for securities with longer maturities, which entail greater risk, because they
would prefer to hold cash, which entails less risk. This theory is deemed relevant to this
study as it informs one of the independent variables which is liquidity. Concerning
Economies of Scale theory, the association of firm size with scale and scope economies,
market power, and the ability to aggregate inputs is widely believed to confer
performance advantages on large firms. This discussion has been interpreted by many to
mean that there are increasing returns in research and development (R&D). This is both
to size establishment and to firm size.
The chapter also posits the conceptual framework that presented diagrammatically the
independent variables showing the specific constituents that influence a particular
variable. Independent variables included leverage, liquidity, asset tangibility and firm
64
size. The dependent variable (financial performance) was depicted by return on asset and
return on equity. The moderating variable is firm age, since the firm age has a direct
influence on the financial performance of firms listed in the NSE.
It is evident from the review that leverage, liquidity, firm size and asset tangibility affect
financial performance of firms listed in the NSE. This effect can either be positive or
negative. Finally, an empirical review was conducted where past studies both global and
local was reviewed into a critique. It is from these critiques that the research gap was
identified.
65
CHAPTER THREE
RESEARCH METHODOLOGY
3.1 Introduction
This chapter describes the methodology that was used in undertaking the study. It starts
by explaining the research design that was adopted; according to Ritchie, Lewis,
Nicholls and Ormston (2013) a central part of research is to develop an efficient research
strategy. Based on the model and variables developed in Chapter two, this chapter
covered the research design and research methodology used to test the variables. In
particular, issues related to research design, the population, the type of data collected,
sampling frame, sample and sampling techniques, data collection instrument, data
collection procedure, and the data analysis will be discussed.
3.2 Research Philosophy
Research philosophy relates to the development of knowledge and the nature of that
knowledge, and contains important assumptions about the way in which researchers
view the world (Saunders, Lewis & Thornhill, 2007). There are two extreme
philosophical views regarding knowledge and reality (schools of thought). These are
Positivism (sometimes referred to as deduction research) and Phenomenology (also
known as induction research). Phenomenology is a philosophy of science that focuses on
the immediate experience. A phenomenology researcher starts from the unknown, is
open and trusts experience. It describes things as they are and not as a researcher thinks
they are. Phenomenological analysis is holistic rather than reductionist. They do not
break down phenomena but study it as it is.
Positivistic research is undertaken in a value-free way as the researcher is external to the
process of data collection as there is little that can be done to alter the substance of the
data collected (Saunders et al., 2007). The researcher is independent of and neither
affects or is affected by the subject of the research. Emphasis is on quantifiable
66
observations that lend themselves to statistical analysis. This study inclines more to the
positivistic philosophy. The choice is because in order to empirically establish the
relationships between the variables, hypotheses was formulated and tested and findings
generalized. In this positivist paradigm, the scientific processes was followed in
hypothesizing fundamental laws then deducing the observations so as to determine the
truth or falsify the said hypothesis about the relationship that exists between value based
management model and competitive advantage while taking into account the moderating
effect of firm age on the determinants of financial performance. The study therefore
sought to verify the propositions through empirical tests by operationalizing variables in
the conceptual framework to allow for measurement.
3.3 Research Design
This study adopted a cross-sectional research design to analyze the effect of Firm Level
Factors on Financial Performance of Listed Firms in the Nairobi Securities Exchange.
Cross-sectional research design is a scientific method which comprises of observing and
describing the behavior of a subject without influencing it in any way (Saunders et al.,
2009). This design is suitable where the researcher is attempting to expound on how the
phenomenon operates by identifying the underlying factors that produce change in it in
which case there is no manipulation of the independent variable
3.4 Target Population
Population refers to the aggregation of elements from which the sample is selected
(Rubin & Babbie, 2016). Target population represents the collection of cases the
researcher is interested and which they intend to make generalizations (Sim & Wright,
2000). This study targeted all the 64 firms listed in Nairobi Securities Exchange. These
firms were analyzed differently that is financial firms and non-financial firms. The years
covered were 5 years from 2012-2016. A period of five years was selected because most
NSE firms performed so poorly within this period causing a public outcry, For instance,
the Kenya Airways, Mumias Sugar, Uchumi Supermarket, Trancentury among others. In
67
addition five years period was adequate to measure any significant change. This
generated a total of 320 firm year observations.
3.5 Sample and Sampling Technique
Sampling is the process of selecting units (people, organizations) from accessible
population to fairly generalize results to the target population (Orodho, 2009). A sample
is a subset of a population (Kothari, 2004). No sampling was done and thus the study
conducted a census of all the 64 firms listed in Nairobi Securities Exchange. The
justification was on the basis that there were only a few firms. Census approach increase
confidence interval. Data collection through census method gives opportunity to the
researcher to have an intensive study about a problem. Census is more accurate when the
universe is small and is suitable for Heterogeneous Units.
3.6 Data Collection Procedure
The researcher used a document review guide to extract and compile the required
secondary data for analysis from the financial statements. The secondary data
encompassed panel data. There are two types of panel data which includes balanced and
unbalanced panel data. The current study used balanced panel data. In a balanced panel,
the number of time periods, t, is the same for all individuals i. A combination of time
series with cross-sections enhances the quality and quantity of data to levels that would
otherwise be impossible to achieve with only one of the two dimensions (Gujarati &
Porter, 2003). The cross sectional data consisted of the firms while the time series data
were the years between 2012 and 2016. This is because the data for the periods are
current data and easily available. The data for all the variables in the study was extracted
from the annual published and audited annual reports and financial statements of the
firms listed in NSE covering the years 2012-2016.
68
The specific financial statements from which the data was extracted from include the
income statement, statement of financial position and the notes to the accounts.
Consequently, the sample data begins in 2012 and ends in 2016. Consistent with
Mathuva (2010), a number of filters were applied in order to ensure accuracy of the
collected data. Observations of firms with anomalies such as negative values in their
total assets, current assets, fixed assets, capital, depreciation or the interest paid were
purged. Observations of items from the statement of financial position and statement of
financial performance showing signs contrary to reasonable expectations was eradicated.
Since the panel data analyzed had a number of influential observations and data errors as
pointed out by Fama and French (1998), each year was treated as having missing values
1% of the observations in each tail of the distribution for each variable.
3.7 Data Analysis
The study employed a dynamic panel data regression model. Panel data contain
observations of multiple phenomena obtained over multiple time periods for the same
firms or individuals (Hsiao, 2007). The data was preferred because it revealed changes at
the individual firms’ level, established time order of variables and showed how
relationships emerged (Frees, 2004).
Panel data regression was chosen for a number of reasons: Firstly, panel data allowed for
the control of individual heterogeneity, making it possible to exclude biases deriving
from the existence of individual effects (Hsiao, 2007). Secondly, panel data yielded
more informative data, more variability and less collinearity among variables than was
characteristic of cross-section or time-series data, more degree of freedom and more
efficiency (Baltagi, 2005). Thirdly, panel data was used to obtain consistent estimators
in the presence of omitted variables (Wooldridge, 2005). Panel data sets were also able
to recognize and estimate the effects that could not be merely detected in pure cross-
sections or pure time-series data (Baltagi, 2005). Since the study focused on 64 firms
listed at the Nairobi Securities Exchange using cross-section data alone gave a small
sample but incorporating the time series of 5 years, the sample expanded to 320
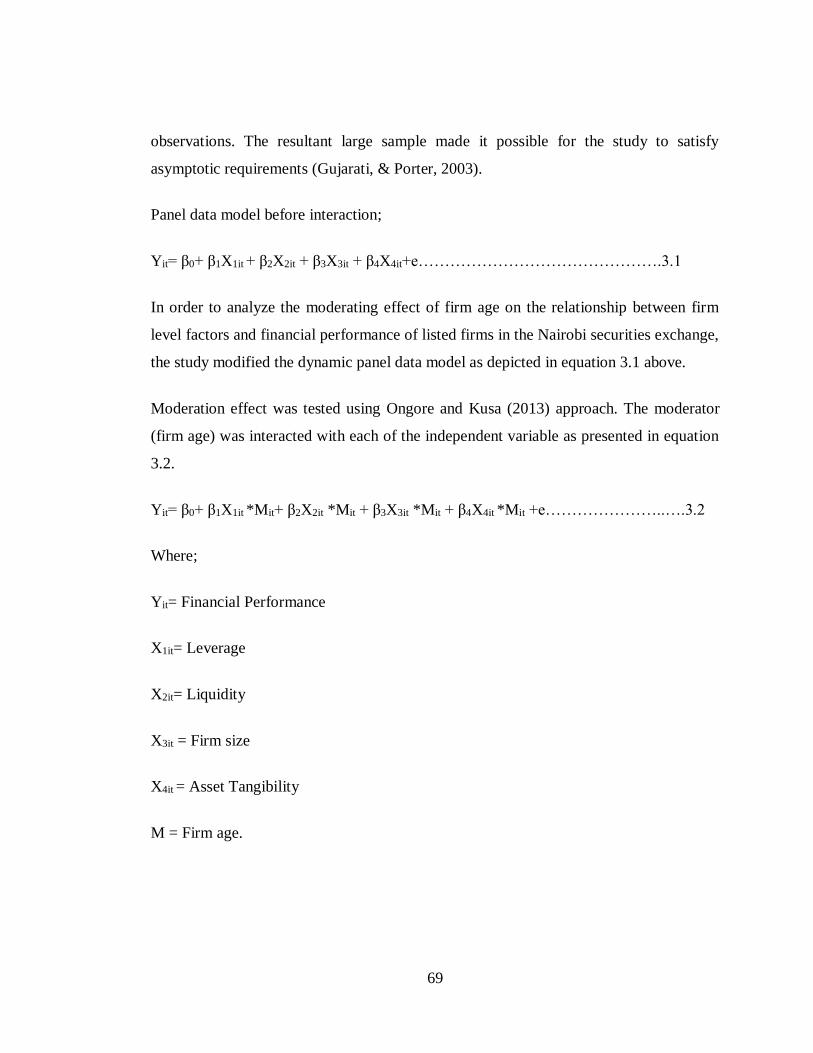
69
observations. The resultant large sample made it possible for the study to satisfy
asymptotic requirements (Gujarati, & Porter, 2003).
Panel data model before interaction;
Yit= β0+ β1X1it + β2X2it + β3X3it + β4X4it+e……………………………………….3.1
In order to analyze the moderating effect of firm age on the relationship between firm
level factors and financial performance of listed firms in the Nairobi securities exchange,
the study modified the dynamic panel data model as depicted in equation 3.1 above.
Moderation effect was tested using Ongore and Kusa (2013) approach. The moderator
(firm age) was interacted with each of the independent variable as presented in equation
3.2.
Yit= β0+ β1X1it *Mit+ β2X2it *Mit + β3X3it *Mit + β4X4it *Mit +e…………………..….3.2
Where;
Yit= Financial Performance
X1it= Leverage
X2it= Liquidity
X3it = Firm size
X4it = Asset Tangibility
M = Firm age.
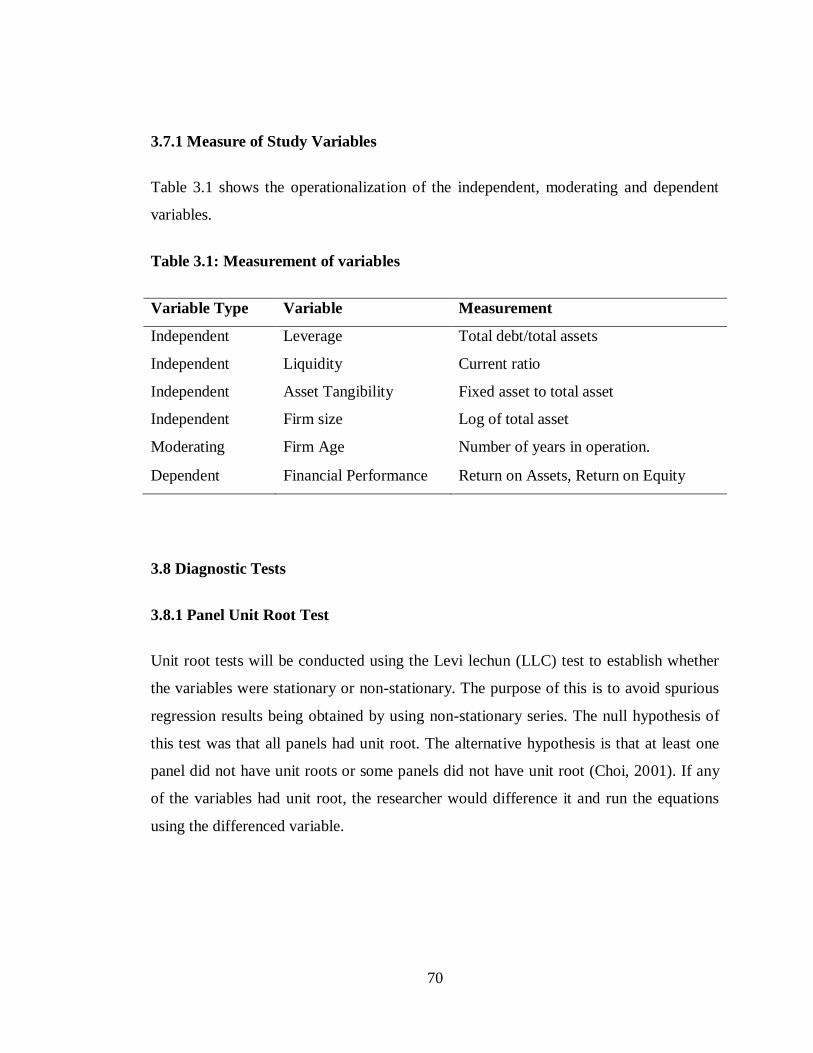
70
3.7.1 Measure of Study Variables
Table 3.1 shows the operationalization of the independent, moderating and dependent
variables.
Table 3.1: Measurement of variables
Variable Type Variable Measurement
Independent Leverage Total debt/total assets
Independent Liquidity Current ratio
Independent Asset Tangibility Fixed asset to total asset
Independent Firm size Log of total asset
Moderating Firm Age Number of years in operation.
Dependent Financial Performance Return on Assets, Return on Equity
3.8 Diagnostic Tests
3.8.1 Panel Unit Root Test
Unit root tests will be conducted using the Levi lechun (LLC) test to establish whether
the variables were stationary or non-stationary. The purpose of this is to avoid spurious
regression results being obtained by using non-stationary series. The null hypothesis of
this test was that all panels had unit root. The alternative hypothesis is that at least one
panel did not have unit roots or some panels did not have unit root (Choi, 2001). If any
of the variables had unit root, the researcher would difference it and run the equations
using the differenced variable.
71
3.8.2 Normality Tests
The normality assumption (ut ~ N (0, σ2)) was required in order to conduct single or
joint hypothesis tests about the model parameters (Brooks, 2008). This study used a
Skewness and Kurtosis test to check whether the data was normally distributed or not.
The researcher tested the null hypothesis that the independent variables are not normally
distributed. The researcher rejected the null hypothesis at the 5% level of significance, if
the p-value is less than 0.05.
3.8.3 Multicollinearity
Multicollinearity is usually a situation in which there is a high degree of association
between independent variables. Multicollinearity was tested using variance inflation
factor (VIF). According to Myres (1990) VIF ≥10 indicate presence of multicollinearity.
3.8.4 Heteroscedasticity
Since the data for this research was a cross-section of firms, this raised concerns about
the existence of heteroscedasticity. The CLRM assumed that the error term is
homoskedastic, that is, it had constant variance. If the error variance was not constant,
then there was heteroscedasticity in the data. Running a regression model without
accounting for heteroscedasticity would lead to unbiased parameter estimates. To test for
heteroscedasticity, the Breusch-Pagan test was used. The null hypothesis of this study
was that the error variance was homoskedastic. If the null hypothesis was rejected and a
conclusion made that heteroscedasticity was present in the panel data, then this would be
accounted for by running a FGLS model.
3.8.5 Autocorrelation
Since the data involved both cross section and time-series, it raised the suspicion of the
existence of serial correlation. The presence of serial correlation indicated that the
variables in the model violated the assumptions of the regression (Anderson et al.,
72
2007). To cater for serial correlation, the Woodridge test for autocorrelation was
employed. Serial correlation is a common problem experienced in panel data analysis
and has to be accounted for in order to achieve the correct model specification.
According to Wooldridge (2003), failure to identify and account for serial correlation in
the idiosyncratic error term in a panel model would result into biased standard errors and
inefficient parameter estimates. The null hypothesis of this test was that the data has no
serial correlation.
3.8.6 Test for Fixed or Random Effects
When performing panel data analysis, the study determined whether to run a fixed
effects model or a random effects model. Whereas the fixed effect model assumed firm
specific intercepts and captured effects of those variables that are specific to each firm
and constant over time, the random effect model assumed that there was a single
common intercept and it varied from firm to firm in a random manner (Baltagi, 2005).
Thus, for estimating the models, first it was important to determine whether there exists
a correlation between the independent variables. If the correlation existed then a fixed
effect model gave consistent results otherwise random effect model were efficient
estimators and it was estimated by generalized least square. To determine which of these
two models was appropriate, both fixed and random effects were estimated. Hausman’s
specification test (1978) was used to determine whether fixed or random effect were to
be used. If the null hypothesis that is E (µi/ xit) = 0 is accepted, then random effect were
an efficient estimator otherwise in case of rejection of null hypothesis, fixed effect
estimation gave better or efficient estimation of betas. If Hausman test rejects the null
hypothesis, therefore decision was taken to use fixed effect model. STATA was used to
estimate the above models.

73
In the event that the Hausman test identified the fixed effects model as appropriate, then
the researcher tested for inclusion of time-fixed effects in the study estimation. The time
fixed effects tested if the dummies for all years are equal to zero and if they are, then
there was no need for time fixed effects in the specification of the model to be estimated.
To test whether the dummies for all years were equal to zero, F-test was used as
proposed by Greene (2008). On the other hand, if the Hausman test selected the random
effects model as the more suitable one then there was need to test whether the panel
effects to determine whether to run a simple Ordinary Least Square (OLS) regression or
the random effects model. Breusch-Pagan multiplier test proposed by Breusch and
Pagan (1980) was used to choose between the simple Ordinary Least Square (OLS)
regression and the random effects model. The null hypothesis of this test was that
variance across the entities is zero, that is, there were no panel effects.
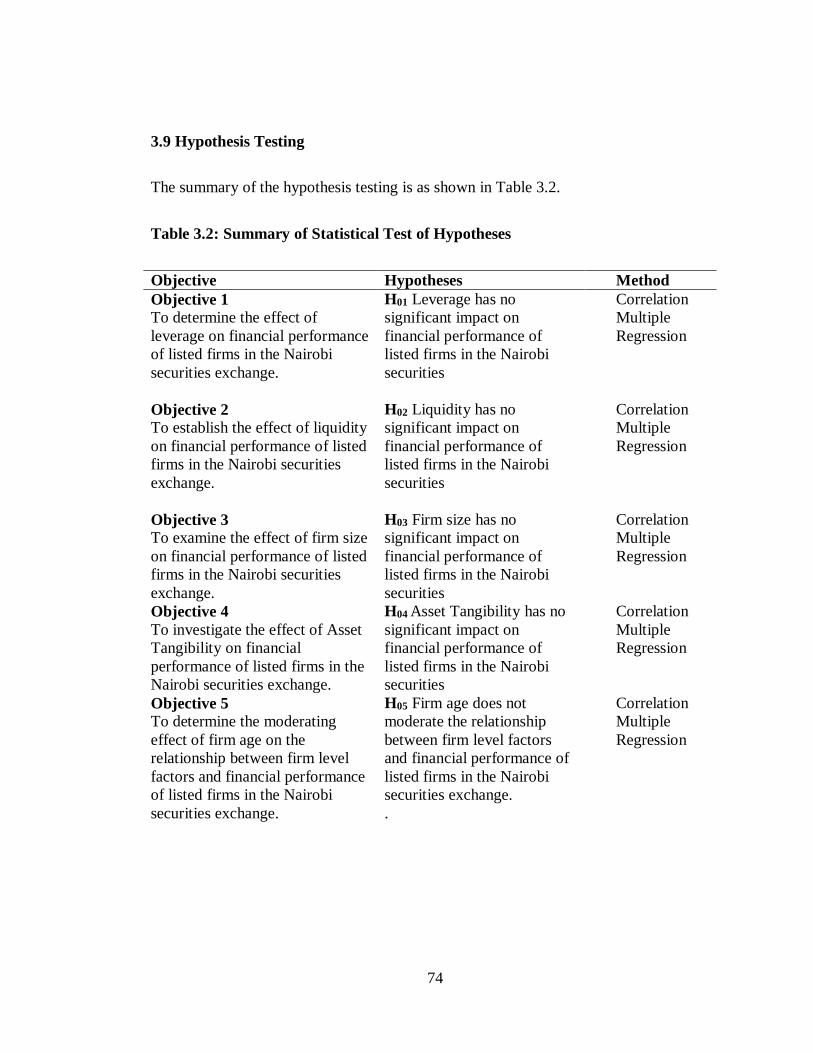
74
3.9 Hypothesis Testing
The summary of the hypothesis testing is as shown in Table 3.2.
Table 3.2: Summary of Statistical Test of Hypotheses
Objective Hypotheses Method
Objective 1
To determine the effect of
leverage on financial performance
of listed firms in the Nairobi
securities exchange.
H01 Leverage has no
significant impact on
financial performance of
listed firms in the Nairobi
securities
Correlation
Multiple
Regression
Objective 2
To establish the effect of liquidity
on financial performance of listed
firms in the Nairobi securities
exchange.
H02 Liquidity has no
significant impact on
financial performance of
listed firms in the Nairobi
securities
Correlation
Multiple
Regression
Objective 3
To examine the effect of firm size
on financial performance of listed
firms in the Nairobi securities
exchange.
H03 Firm size has no
significant impact on
financial performance of
listed firms in the Nairobi
securities
Correlation
Multiple
Regression
Objective 4
To investigate the effect of Asset
Tangibility on financial
performance of listed firms in the
Nairobi securities exchange.
H04 Asset Tangibility has no
significant impact on
financial performance of
listed firms in the Nairobi
securities
Correlation
Multiple
Regression
Objective 5
To determine the moderating
effect of firm age on the
relationship between firm level
factors and financial performance
of listed firms in the Nairobi
securities exchange.
H05 Firm age does not
moderate the relationship
between firm level factors
and financial performance of
listed firms in the Nairobi
securities exchange.
.
Correlation
Multiple
Regression
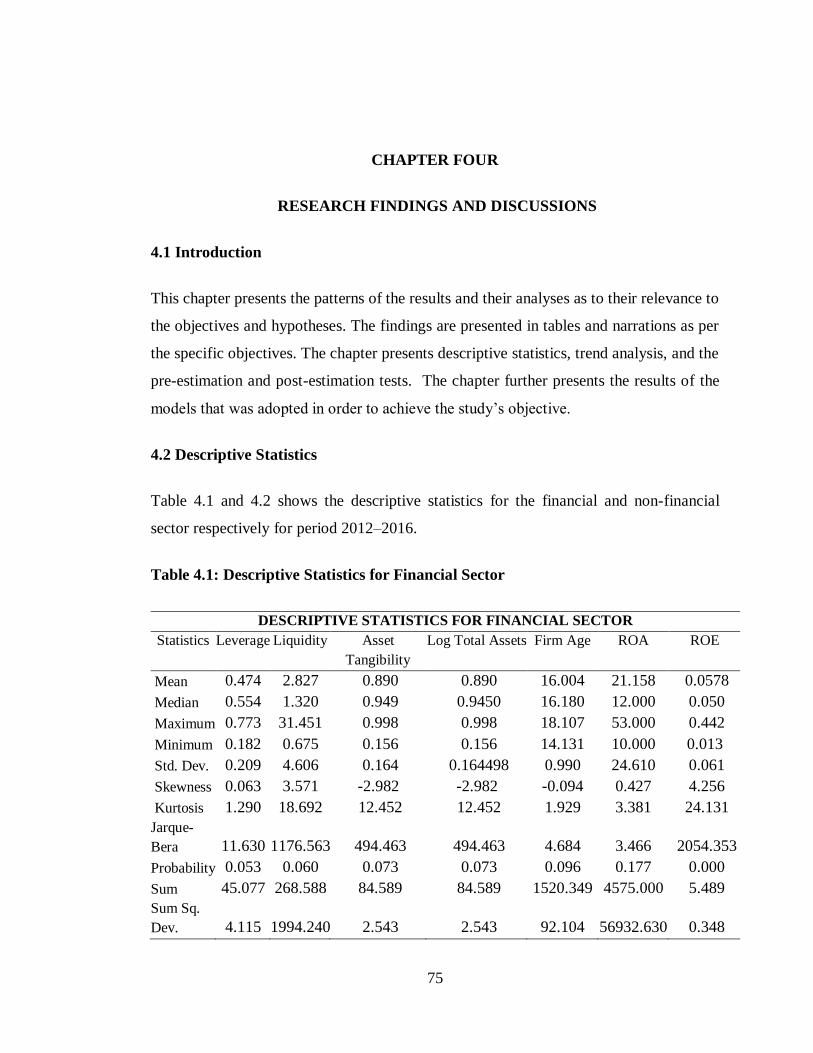
75
CHAPTER FOUR
RESEARCH FINDINGS AND DISCUSSIONS
4.1 Introduction
This chapter presents the patterns of the results and their analyses as to their relevance to
the objectives and hypotheses. The findings are presented in tables and narrations as per
the specific objectives. The chapter presents descriptive statistics, trend analysis, and the
pre-estimation and post-estimation tests. The chapter further presents the results of the
models that was adopted in order to achieve the study’s objective.
4.2 Descriptive Statistics
Table 4.1 and 4.2 shows the descriptive statistics for the financial and non-financial
sector respectively for period 2012–2016.
Table 4.1: Descriptive Statistics for Financial Sector
DESCRIPTIVE STATISTICS FOR FINANCIAL SECTOR
Statistics Leverage Liquidity Asset
Tangibility
Log Total Assets Firm Age ROA ROE
Mean 0.474 2.827 0.890 0.890 16.004 21.158 0.0578
Median 0.554 1.320 0.949 0.9450 16.180 12.000 0.050
Maximum 0.773 31.451 0.998 0.998 18.107 53.000 0.442
Minimum 0.182 0.675 0.156 0.156 14.131 10.000 0.013
Std. Dev. 0.209 4.606 0.164 0.164498 0.990 24.610 0.061
Skewness 0.063 3.571 -2.982 -2.982 -0.094 0.427 4.256
Kurtosis 1.290 18.692 12.452 12.452 1.929 3.381 24.131
Jarque-
Bera 11.630 1176.563 494.463 494.463 4.684 3.466 2054.353
Probability 0.053 0.060 0.073 0.073 0.096 0.177 0.000
Sum 45.077 268.588 84.589 84.589 1520.349 4575.000 5.489
Sum Sq.
Dev. 4.115 1994.240 2.543 2.543 92.104 56932.630 0.348
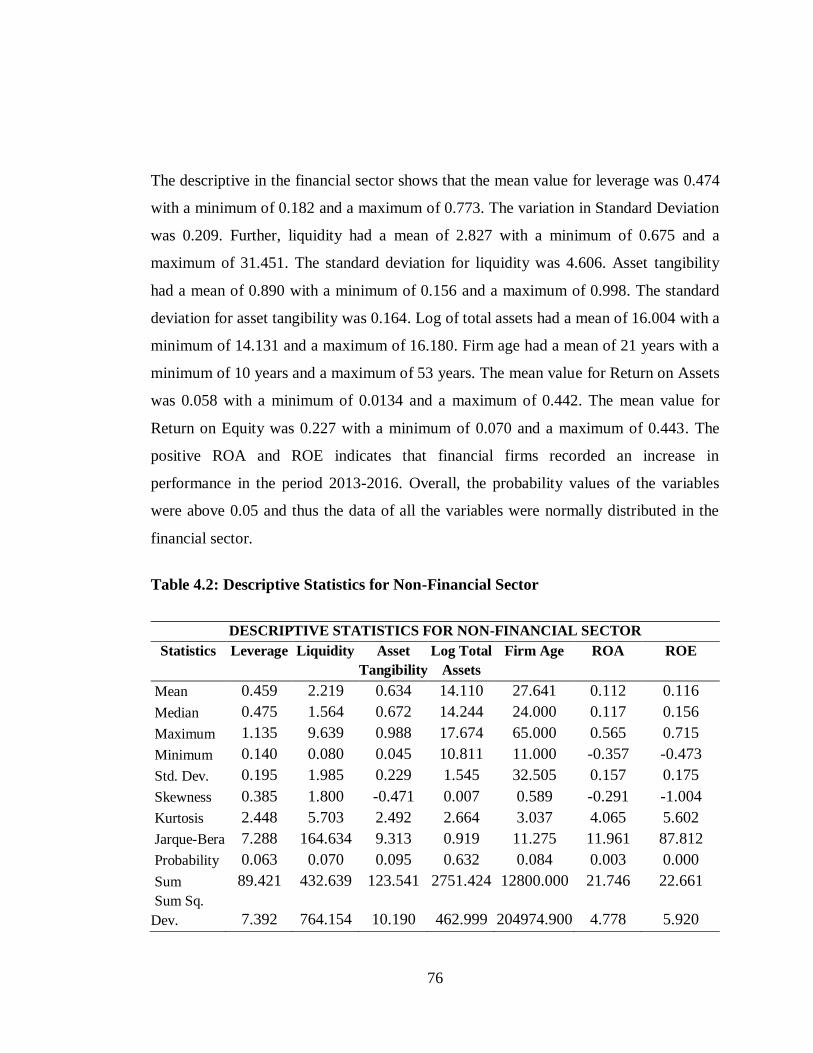
76
The descriptive in the financial sector shows that the mean value for leverage was 0.474
with a minimum of 0.182 and a maximum of 0.773. The variation in Standard Deviation
was 0.209. Further, liquidity had a mean of 2.827 with a minimum of 0.675 and a
maximum of 31.451. The standard deviation for liquidity was 4.606. Asset tangibility
had a mean of 0.890 with a minimum of 0.156 and a maximum of 0.998. The standard
deviation for asset tangibility was 0.164. Log of total assets had a mean of 16.004 with a
minimum of 14.131 and a maximum of 16.180. Firm age had a mean of 21 years with a
minimum of 10 years and a maximum of 53 years. The mean value for Return on Assets
was 0.058 with a minimum of 0.0134 and a maximum of 0.442. The mean value for
Return on Equity was 0.227 with a minimum of 0.070 and a maximum of 0.443. The
positive ROA and ROE indicates that financial firms recorded an increase in
performance in the period 2013-2016. Overall, the probability values of the variables
were above 0.05 and thus the data of all the variables were normally distributed in the
financial sector.
Table 4.2: Descriptive Statistics for Non-Financial Sector
DESCRIPTIVE STATISTICS FOR NON-FINANCIAL SECTOR
Statistics Leverage Liquidity Asset
Tangibility
Log Total
Assets
Firm Age ROA ROE
Mean 0.459 2.219 0.634 14.110 27.641 0.112 0.116
Median 0.475 1.564 0.672 14.244 24.000 0.117 0.156
Maximum 1.135 9.639 0.988 17.674 65.000 0.565 0.715
Minimum 0.140 0.080 0.045 10.811 11.000 -0.357 -0.473
Std. Dev. 0.195 1.985 0.229 1.545 32.505 0.157 0.175
Skewness 0.385 1.800 -0.471 0.007 0.589 -0.291 -1.004
Kurtosis 2.448 5.703 2.492 2.664 3.037 4.065 5.602
Jarque-Bera 7.288 164.634 9.313 0.919 11.275 11.961 87.812
Probability 0.063 0.070 0.095 0.632 0.084 0.003 0.000
Sum 89.421 432.639 123.541 2751.424 12800.000 21.746 22.661
Sum Sq.
Dev. 7.392 764.154 10.190 462.999 204974.900 4.778 5.920
77
In the non-financial sector, descriptive showed that the mean value for leverage was
0.459 with a minimum of 0.140 and a maximum of 1.135. The variation in Standard
Deviation was 0.195. Liquidity had a mean of 2.218 with a minimum of 0.080 and a
maximum of 9.638. The standard deviation for liquidity was 1.985. Asset tangibility had
a mean of 0.634 with a minimum of 0.0445 and a maximum of 0.988. The standard
deviation for asset tangibility was 0.229. Log of total assets had a mean of 14.110 with a
minimum of 10.8106 and a maximum of 17.674. Firm age had a mean of 27 years with a
minimum of 11 years and a maximum of 65 years. The mean value for Return on Assets
was 0.112 with a minimum of -0.357 and a maximum of 0.565. The mean value for
Return on Equity was 0.116 with a minimum of -0.473 and a maximum of 0.715. The
negative ROA and ROE indicates that some non-financial firms recorded a decrease in
performance in the period 2013-2016. Overall, the probability values of the variables
were above 0.05 and thus the data of all the variables were normally distributed in the
non-financial sector
4.3 Trend Analysis
This section presents the analysis of the trends of the variables. The study conducted a
trend analysis to establish the movement of the variables overtime.
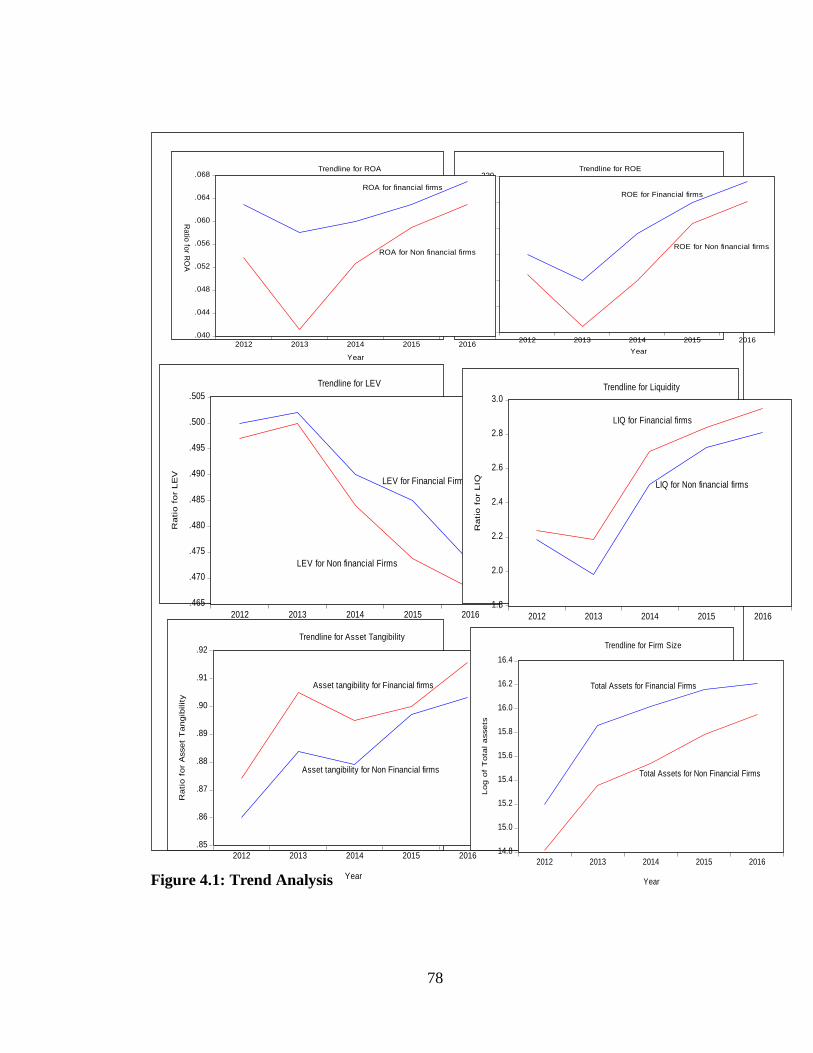
78
Figure 4.1: Trend Analysis
.190
.195
.200
.205
.210
.215
.220
2012 2013 2014 2015 2016
ROE for Financial firms
ROE for Non financial firms
YearR
atio
for R
OE
Trendline for ROE
.465
.470
.475
.480
.485
.490
.495
.500
.505
2012 2013 2014 2015 2016
LEV for Financial Firms
LEV for Non financial Firms
Year
Ra
tio
fo
r L
EV
Trendline for LEV
1.8
2.0
2.2
2.4
2.6
2.8
3.0
2012 2013 2014 2015 2016
LIQ for Financial firms
LIQ for Non financial firms
Year
Ra
tio
fo
r L
IQ
Trendline for Liquidity
.85
.86
.87
.88
.89
.90
.91
.92
2012 2013 2014 2015 2016
Year
Ra
tio
fo
r A
sse
t T
an
gib
ilit
y
Asset tangibility for Financial firms
Asset tangibility for Non Financial firms
Trendline for Asset Tangibility
14.8
15.0
15.2
15.4
15.6
15.8
16.0
16.2
16.4
2012 2013 2014 2015 2016
Year
Lo
g o
f T
ota
l a
sse
ts
Total Assets for Financial Firms
Total Assets for Non Financial Firms
Trendline for Firm Size
.040
.044
.048
.052
.056
.060
.064
.068
2012 2013 2014 2015 2016
ROA for financial firms
ROA for Non financial firms
Year
Ra
tio fo
r RO
A
Trendline for ROA
79
The trend line shows that ROA for financial firms was higher than that of non-financial
firms for the period 2012 to 2014. The average in ROA for financial firms in 2012 was
0.63 where it had a sharp drop to 0.58 and maintained an increasing trend until 2016 to
the highest average at 0.67. The average in ROA for non-financial firms in 2012 was
0.54 where is had a sharp drop to 0.42 and maintained an increasing trend until 2016 to
the highest average at 0.62. The sharp decreases in ROA in both the financial and non-
financial firms for the period 2013 can be attributed to the instability in the markets as a
result of the election environment in 2013. According to Pervan and Višić (2012), return
on assets gives investors an idea of how effectively the company is converting the
money it has to invest into net income. The higher the ROA number, the better, because
the company is earning more money on less investment.
The trend line shows that ROE for financial firms was higher than that of non-financial
firms for the period 2012 to 2014. The average in ROE for financial firms in 2012 was
0.205 where is had a sharp drop to 0.200 and maintained an increasing trend until 2016
to the highest average at 0.218. The average in ROE for non-financial firms in 2012 was
0.200 where it had a sharp drop to 0.192 and maintained an increasing trend until 2016
to the highest average at 0.215. Again, the sharp decreases in ROA in both the financial
and non-financial firms for the period 2013 can be attributed to the instability in the
markets as a result of the election environment. Ali (2014) points out that return on
equity is an important measure for a company because it compares it against its peers.
With return on equity, it measures performance and generally the higher the better.
The leverage level for financial firms was higher than that of non-financial firms. Both
the financial and non-financial firms had a decreasing trend from 0.50 and 0.495
respectively to 0.475 and 0.470. Cheng and Tzeng (2010) argue that leverage allows a
financial institution to increase the potential gains or losses on a position or investment
beyond what would be possible through a direct investment of its own funds.
80
The trend line shows that liquidity for financial firms was higher than that of non-
financial firms for the period 2012 to 2014. The average in liquidity for financial firms
in 2012 was 2.3 where it had a slight drop to 2.1 and maintained an increasing trend until
2016 to the highest average at 2.9. The average in liquidity for non-financial firms in
2012 was 2.2 where it had a sharp drop to 1.9 and maintained an increasing trend until
2016 to the highest average at 2.7. The drop in liquidity in 2013 can be associated with
firms’ conversion of liquid money to assets in the period. Vishnani and Shah (2007)
affirmed that a higher current ratio indicates a larger investment in current assets which
means, a low rate of return on investment for the firm, as excess investment in current
assets will not yield enough returns.
Asset tangibility for both financial and non-financial firms rose sharply from year 2012
to 2013 from 87.5 and 86 to 90.5 and 88.5 respectively. The trend then increased
steadily up to the year 2016 where financial and non-financial firms recorded 91.5 and
90 respectively. The sharp increase of in 2013 can be associated with increased
acquiring of fixed assets that led to increase on asset tangibility during the period.
Herciu and Ogrean (2012) argues that a firm is highly competitive as long as its
managers are able to mix tangible and intangible assets in the most effective and
efficient manner. Therefore, a firm can get the same score of competitiveness by using a
different combination of assets and by giving different importance coefficients to the
tangible and intangible assets.
The trend line shows that the log total asset measured by logarithm of total assets have
been increasing overtime since 2012 to 2016. Financial firms had a record of 15.2 in
2012 and increased steadily to record 16.2 in the year 2016. Non-financial firms had a
record of 14.8 in 2012 and increased steadily to record 16 in the year 2016. Tahir and
Razali (2011) points out that size influences a firm performance because large firm can
increase their current size very fast by accumulating earnings from past performance and
this enhances their value.
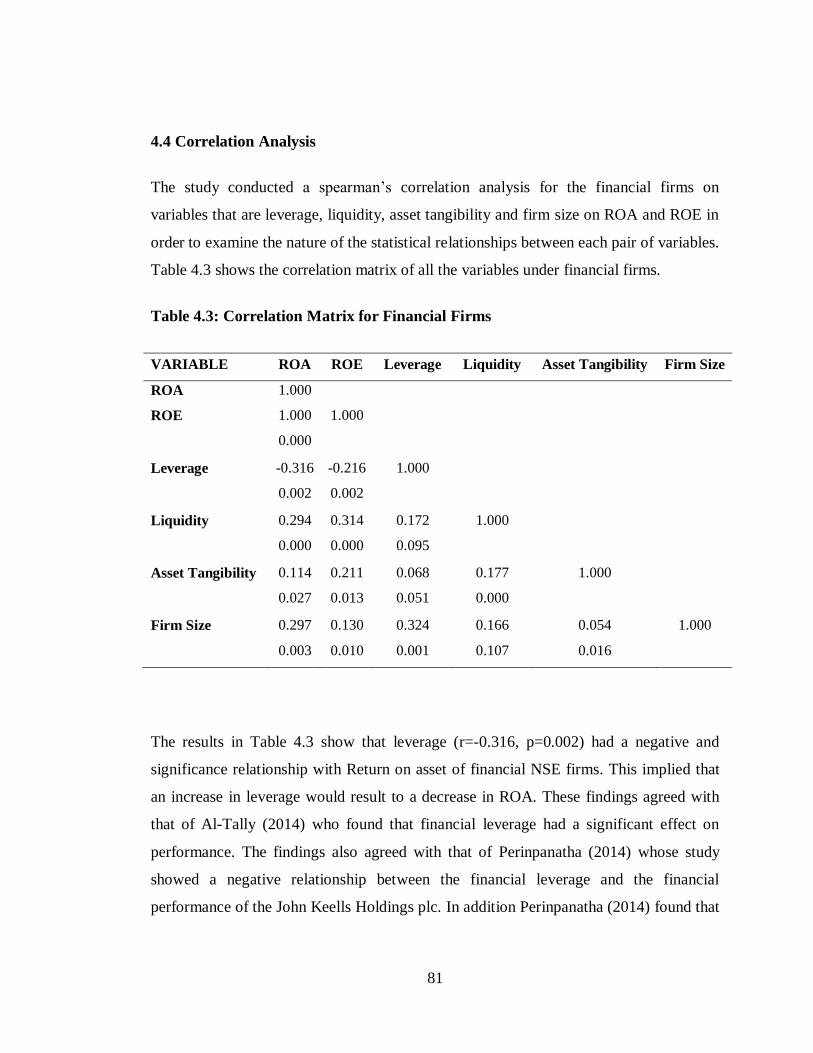
81
4.4 Correlation Analysis
The study conducted a spearman’s correlation analysis for the financial firms on
variables that are leverage, liquidity, asset tangibility and firm size on ROA and ROE in
order to examine the nature of the statistical relationships between each pair of variables.
Table 4.3 shows the correlation matrix of all the variables under financial firms.
Table 4.3: Correlation Matrix for Financial Firms
VARIABLE ROA ROE Leverage Liquidity Asset Tangibility Firm Size
ROA 1.000
ROE 1.000 1.000
0.000
Leverage -0.316 -0.216 1.000
0.002 0.002
Liquidity 0.294 0.314 0.172 1.000
0.000 0.000 0.095
Asset Tangibility 0.114 0.211 0.068 0.177 1.000
0.027 0.013 0.051 0.000
Firm Size 0.297 0.130 0.324 0.166 0.054 1.000
0.003 0.010 0.001 0.107 0.016
The results in Table 4.3 show that leverage (r=-0.316, p=0.002) had a negative and
significance relationship with Return on asset of financial NSE firms. This implied that
an increase in leverage would result to a decrease in ROA. These findings agreed with
that of Al-Tally (2014) who found that financial leverage had a significant effect on
performance. The findings also agreed with that of Perinpanatha (2014) whose study
showed a negative relationship between the financial leverage and the financial
performance of the John Keells Holdings plc. In addition Perinpanatha (2014) found that
82
financial leverage had a significant impact on the financial performance of the John
Keells Holdings plc in Sri Lanka.
The study also found that liquidity had a positive and significance relationship with
Return on asset (r=0.294, p=0.000). This implied that an increase in liquidity would
result to an increase in ROA. These findings agreed with that of Omesa (2015) who
found a weak relationship between liquidity and financial performance. The findings
also agreed with that of Njeri (2014) whose findings revealed that there is a positive
relationship between liquidity and financial performance. The study also found that asset
tangibility had a positive and significance relationship with Return on asset (r=0.114,
p=0.027). This implied that an increase in asset tangibility would result to an increase in
ROA. These findings agreed with that of Campello (2006) who found that asset
tangibility positively affects corporate performance under external financing.
The study also found that firm size had a positive and significant relationship with return
on assets (r=0.297, p=0.003). This implied that an increase in firm size would result to
an increase in ROA. These findings agreed with that of Mahfoudh (2013) who found
that firm size were positively related to firm financial performance. These findings also
agreed with that of Njoroge (2014) whose study indicated that firm size was positively
related to financial performance.
The study further conducted correlation analysis for the non-financial firms on variables
that are leverage, liquidity, asset tangibility and firm size on ROA and ROE in order to
examine the nature of the statistical relationships between each pair of variables. Table
4.4 shows the correlation matrix of all the variables under financial firms.
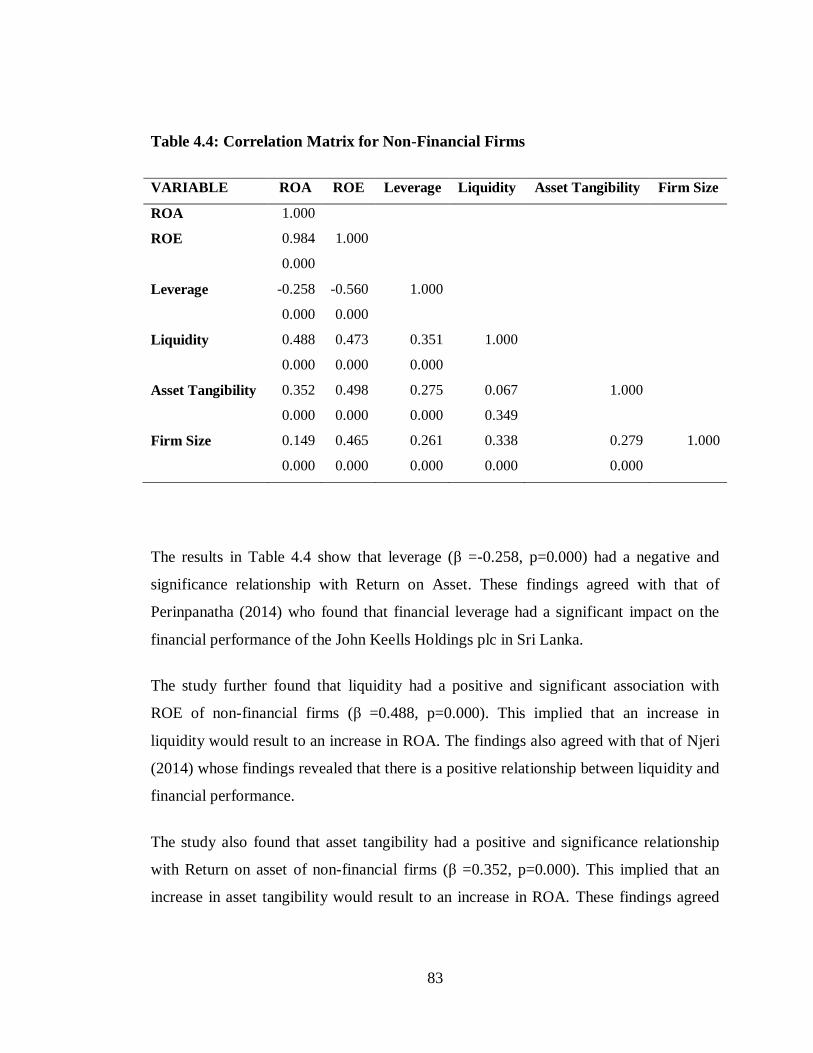
83
Table 4.4: Correlation Matrix for Non-Financial Firms
VARIABLE ROA ROE Leverage Liquidity Asset Tangibility Firm Size
ROA 1.000
ROE 0.984 1.000
0.000
Leverage -0.258 -0.560 1.000
0.000 0.000
Liquidity 0.488 0.473 0.351 1.000
0.000 0.000 0.000
Asset Tangibility 0.352 0.498 0.275 0.067 1.000
0.000 0.000 0.000 0.349
Firm Size 0.149 0.465 0.261 0.338 0.279 1.000
0.000 0.000 0.000 0.000 0.000
The results in Table 4.4 show that leverage (β =-0.258, p=0.000) had a negative and
significance relationship with Return on Asset. These findings agreed with that of
Perinpanatha (2014) who found that financial leverage had a significant impact on the
financial performance of the John Keells Holdings plc in Sri Lanka.
The study further found that liquidity had a positive and significant association with
ROE of non-financial firms (β =0.488, p=0.000). This implied that an increase in
liquidity would result to an increase in ROA. The findings also agreed with that of Njeri
(2014) whose findings revealed that there is a positive relationship between liquidity and
financial performance.
The study also found that asset tangibility had a positive and significance relationship
with Return on asset of non-financial firms (β =0.352, p=0.000). This implied that an
increase in asset tangibility would result to an increase in ROA. These findings agreed
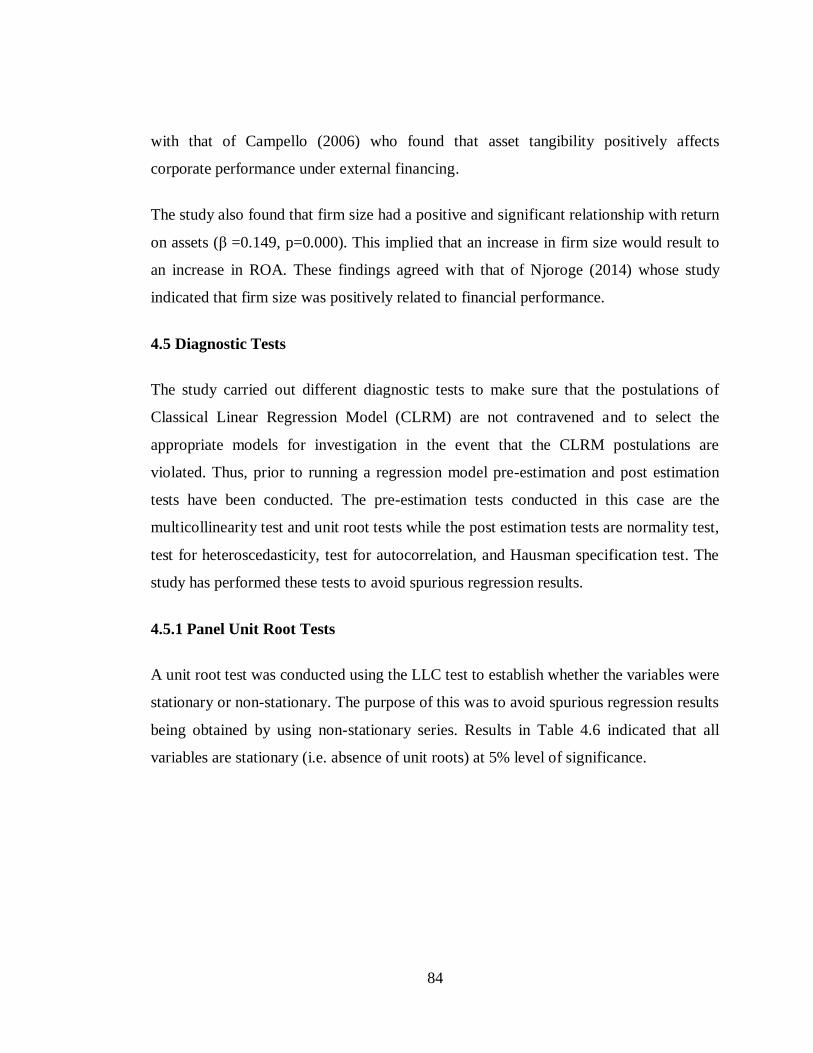
84
with that of Campello (2006) who found that asset tangibility positively affects
corporate performance under external financing.
The study also found that firm size had a positive and significant relationship with return
on assets (β =0.149, p=0.000). This implied that an increase in firm size would result to
an increase in ROA. These findings agreed with that of Njoroge (2014) whose study
indicated that firm size was positively related to financial performance.
4.5 Diagnostic Tests
The study carried out different diagnostic tests to make sure that the postulations of
Classical Linear Regression Model (CLRM) are not contravened and to select the
appropriate models for investigation in the event that the CLRM postulations are
violated. Thus, prior to running a regression model pre-estimation and post estimation
tests have been conducted. The pre-estimation tests conducted in this case are the
multicollinearity test and unit root tests while the post estimation tests are normality test,
test for heteroscedasticity, test for autocorrelation, and Hausman specification test. The
study has performed these tests to avoid spurious regression results.
4.5.1 Panel Unit Root Tests
A unit root test was conducted using the LLC test to establish whether the variables were
stationary or non-stationary. The purpose of this was to avoid spurious regression results
being obtained by using non-stationary series. Results in Table 4.6 indicated that all
variables are stationary (i.e. absence of unit roots) at 5% level of significance.
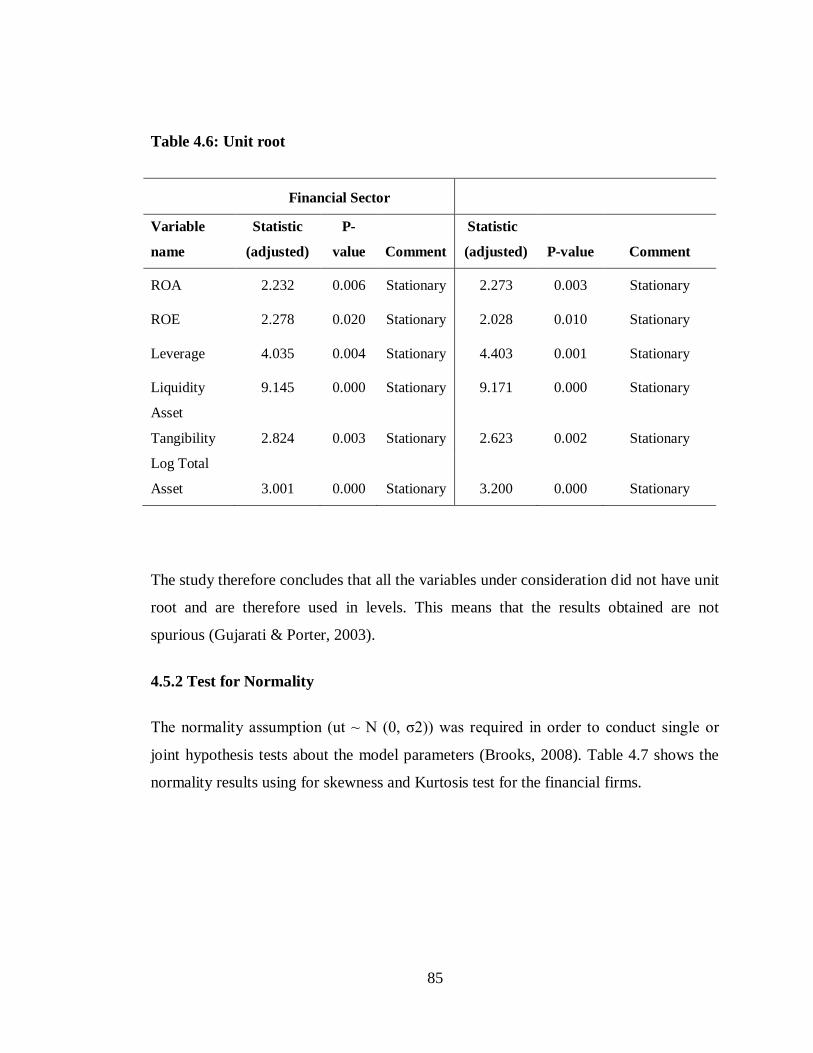
85
Table 4.6: Unit root
Financial Sector
Non-Financial Sector Variable
name
Statistic
(adjusted)
P-
value Comment
Statistic
(adjusted) P-value Comment
ROA 2.232 0.006 Stationary 2.273 0.003 Stationary
ROE 2.278 0.020 Stationary 2.028 0.010 Stationary
Leverage 4.035 0.004 Stationary 4.403 0.001 Stationary
Liquidity 9.145 0.000 Stationary 9.171 0.000 Stationary
Asset
Tangibility 2.824 0.003 Stationary 2.623 0.002 Stationary
Log Total
Asset 3.001 0.000 Stationary 3.200 0.000 Stationary
The study therefore concludes that all the variables under consideration did not have unit
root and are therefore used in levels. This means that the results obtained are not
spurious (Gujarati & Porter, 2003).
4.5.2 Test for Normality
The normality assumption (ut ~ N (0, σ2)) was required in order to conduct single or
joint hypothesis tests about the model parameters (Brooks, 2008). Table 4.7 shows the
normality results using for skewness and Kurtosis test for the financial firms.
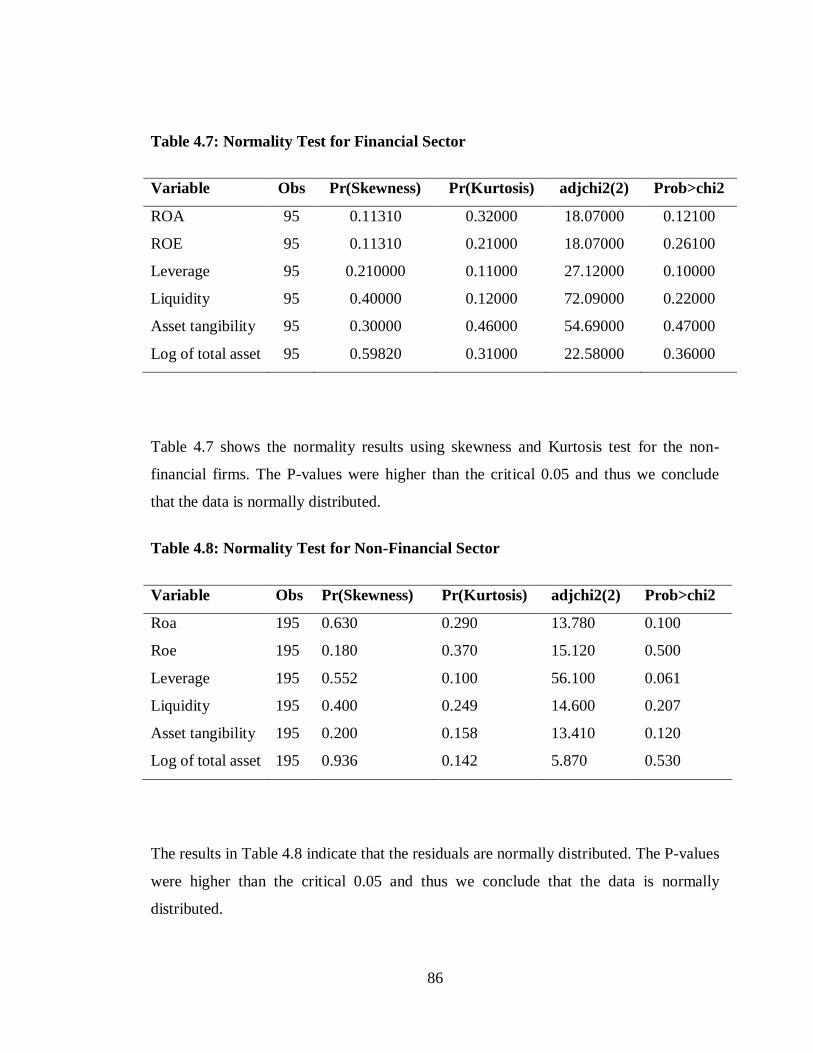
86
Table 4.7: Normality Test for Financial Sector
Variable Obs Pr(Skewness) Pr(Kurtosis) adjchi2(2) Prob>chi2
ROA 95 0.11310 0.32000 18.07000 0.12100
ROE 95 0.11310 0.21000 18.07000 0.26100
Leverage 95 0.210000 0.11000 27.12000 0.10000
Liquidity 95 0.40000 0.12000 72.09000 0.22000
Asset tangibility 95 0.30000 0.46000 54.69000 0.47000
Log of total asset 95 0.59820 0.31000 22.58000 0.36000
Table 4.7 shows the normality results using skewness and Kurtosis test for the non-
financial firms. The P-values were higher than the critical 0.05 and thus we conclude
that the data is normally distributed.
Table 4.8: Normality Test for Non-Financial Sector
Variable Obs Pr(Skewness) Pr(Kurtosis) adjchi2(2) Prob>chi2
Roa 195 0.630 0.290 13.780 0.100
Roe 195 0.180 0.370 15.120 0.500
Leverage 195 0.552 0.100 56.100 0.061
Liquidity 195 0.400 0.249 14.600 0.207
Asset tangibility 195 0.200 0.158 13.410 0.120
Log of total asset 195 0.936 0.142 5.870 0.530
The results in Table 4.8 indicate that the residuals are normally distributed. The P-values
were higher than the critical 0.05 and thus we conclude that the data is normally
distributed.
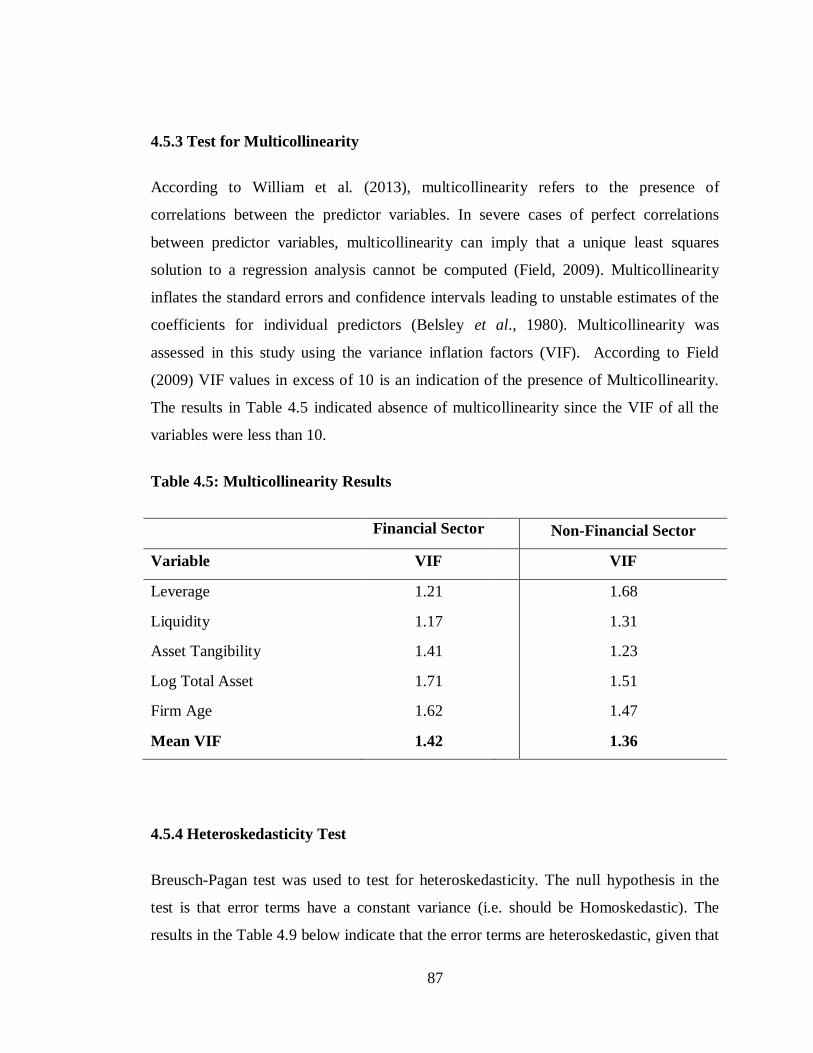
87
4.5.3 Test for Multicollinearity
According to William et al. (2013), multicollinearity refers to the presence of
correlations between the predictor variables. In severe cases of perfect correlations
between predictor variables, multicollinearity can imply that a unique least squares
solution to a regression analysis cannot be computed (Field, 2009). Multicollinearity
inflates the standard errors and confidence intervals leading to unstable estimates of the
coefficients for individual predictors (Belsley et al., 1980). Multicollinearity was
assessed in this study using the variance inflation factors (VIF). According to Field
(2009) VIF values in excess of 10 is an indication of the presence of Multicollinearity.
The results in Table 4.5 indicated absence of multicollinearity since the VIF of all the
variables were less than 10.
Table 4.5: Multicollinearity Results
Financial Sector Non-Financial Sector
Variable VIF VIF
Leverage 1.21 1.68
Liquidity 1.17 1.31
Asset Tangibility 1.41 1.23
Log Total Asset 1.71 1.51
Firm Age 1.62 1.47
Mean VIF 1.42 1.36
4.5.4 Heteroskedasticity Test
Breusch-Pagan test was used to test for heteroskedasticity. The null hypothesis in the
test is that error terms have a constant variance (i.e. should be Homoskedastic). The
results in the Table 4.9 below indicate that the error terms are heteroskedastic, given that
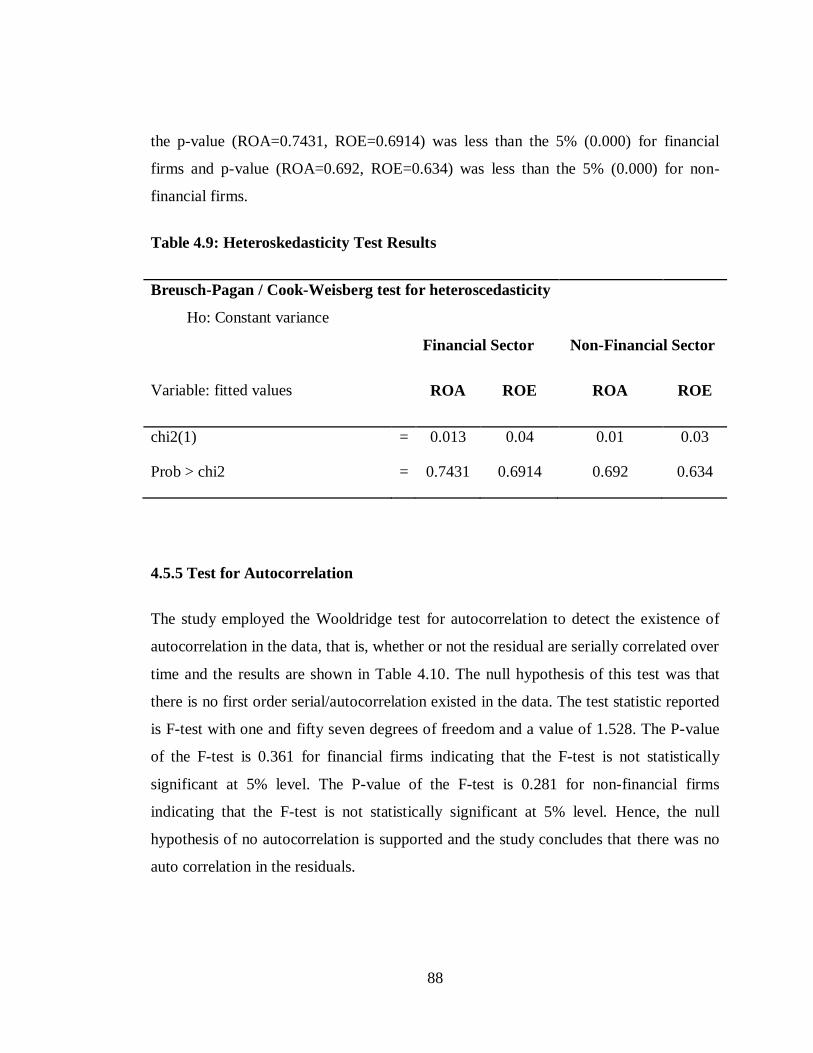
88
the p-value (ROA=0.7431, ROE=0.6914) was less than the 5% (0.000) for financial
firms and p-value (ROA=0.692, ROE=0.634) was less than the 5% (0.000) for non-
financial firms.
Table 4.9: Heteroskedasticity Test Results
Breusch-Pagan / Cook-Weisberg test for heteroscedasticity
Ho: Constant variance
Financial Sector Non-Financial Sector
Variable: fitted values
ROA ROE ROA ROE
chi2(1) = 0.013 0.04 0.01 0.03
Prob > chi2 = 0.7431 0.6914 0.692 0.634
4.5.5 Test for Autocorrelation
The study employed the Wooldridge test for autocorrelation to detect the existence of
autocorrelation in the data, that is, whether or not the residual are serially correlated over
time and the results are shown in Table 4.10. The null hypothesis of this test was that
there is no first order serial/autocorrelation existed in the data. The test statistic reported
is F-test with one and fifty seven degrees of freedom and a value of 1.528. The P-value
of the F-test is 0.361 for financial firms indicating that the F-test is not statistically
significant at 5% level. The P-value of the F-test is 0.281 for non-financial firms
indicating that the F-test is not statistically significant at 5% level. Hence, the null
hypothesis of no autocorrelation is supported and the study concludes that there was no
auto correlation in the residuals.

89
Table 4.10: Serial Correlation Tests
Financial Firms
Wooldridge test for autocorrelation in panel data
H0: no first-order autocorrelation
F( 1, 57) = 2.394
Prob > F = 0.361
Non- Financial Firms
Wooldridge test for autocorrelation in panel data
H0: no first-order autocorrelation
F( 1, 57) = 1.528
Prob > F = 0.281
4.5.6 Hausman Test
When performing panel data analysis, one has to determine whether to run a random
effects model or a fixed effects model (Baltagi, 2005). In order to make a decision on the
most suitable model to use, whether random and fixed effects estimate coefficients. The
study used the Hausman’s specification test (1978) to choose between fixed and random
effect models. Table 4.10 and 4.11 shows the results of Hausman test.
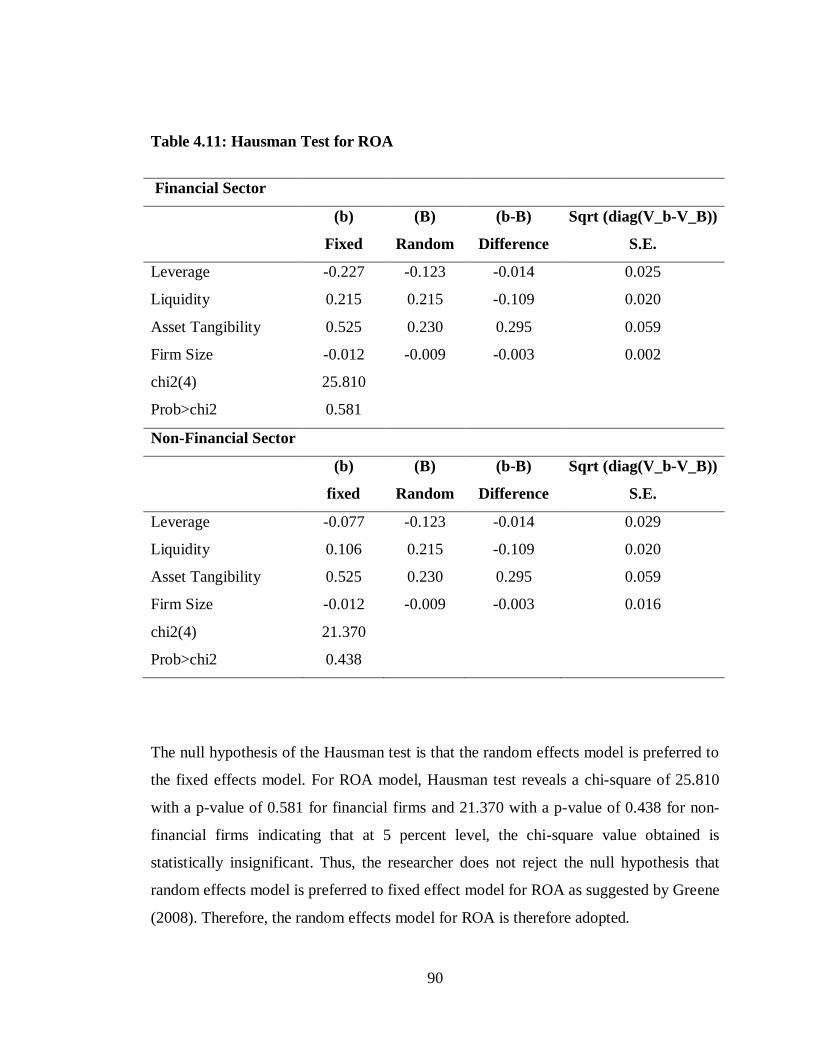
90
Table 4.11: Hausman Test for ROA
Financial Sector
(b) (B) (b-B) Sqrt (diag(V_b-V_B))
Fixed Random Difference S.E.
Leverage -0.227 -0.123 -0.014 0.025
Liquidity 0.215 0.215 -0.109 0.020
Asset Tangibility 0.525 0.230 0.295 0.059
Firm Size -0.012 -0.009 -0.003 0.002
chi2(4) 25.810
Prob>chi2 0.581
Non-Financial Sector
(b) (B) (b-B) Sqrt (diag(V_b-V_B))
fixed Random Difference S.E.
Leverage -0.077 -0.123 -0.014 0.029
Liquidity 0.106 0.215 -0.109 0.020
Asset Tangibility 0.525 0.230 0.295 0.059
Firm Size -0.012 -0.009 -0.003 0.016
chi2(4) 21.370
Prob>chi2 0.438
The null hypothesis of the Hausman test is that the random effects model is preferred to
the fixed effects model. For ROA model, Hausman test reveals a chi-square of 25.810
with a p-value of 0.581 for financial firms and 21.370 with a p-value of 0.438 for non-
financial firms indicating that at 5 percent level, the chi-square value obtained is
statistically insignificant. Thus, the researcher does not reject the null hypothesis that
random effects model is preferred to fixed effect model for ROA as suggested by Greene
(2008). Therefore, the random effects model for ROA is therefore adopted.
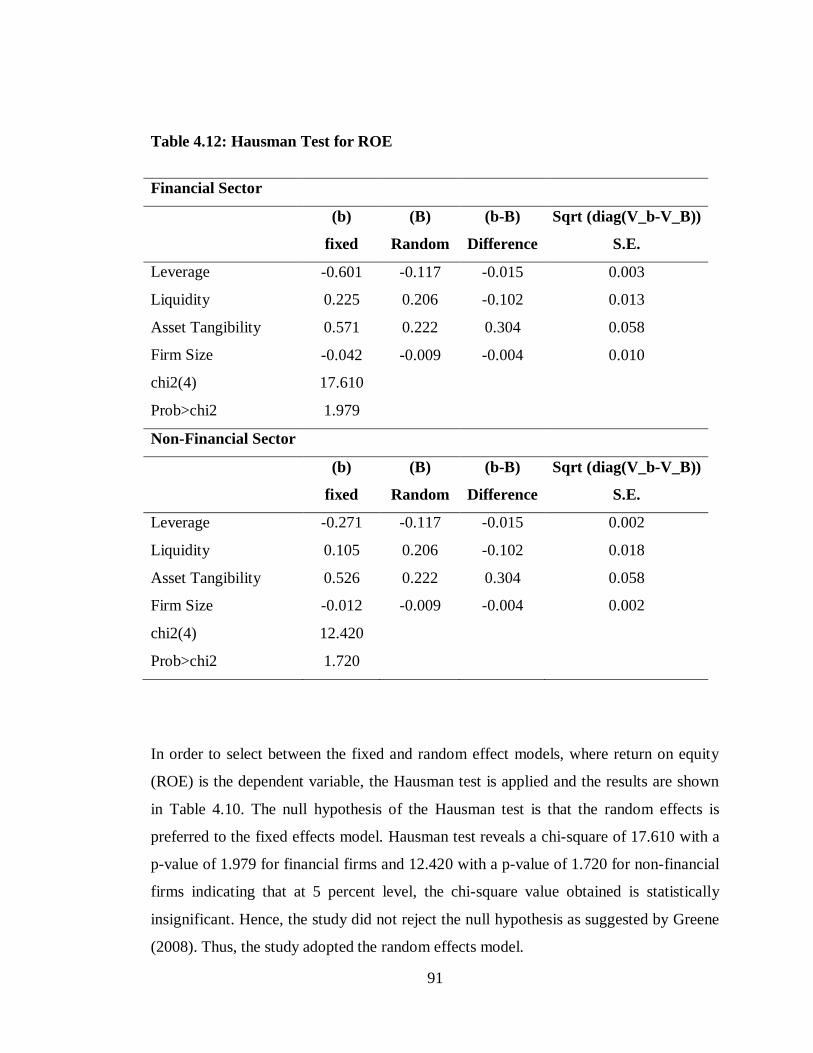
91
Table 4.12: Hausman Test for ROE
Financial Sector
(b) (B) (b-B) Sqrt (diag(V_b-V_B))
fixed Random Difference S.E.
Leverage -0.601 -0.117 -0.015 0.003
Liquidity 0.225 0.206 -0.102 0.013
Asset Tangibility 0.571 0.222 0.304 0.058
Firm Size -0.042 -0.009 -0.004 0.010
chi2(4) 17.610
Prob>chi2 1.979
Non-Financial Sector
(b) (B) (b-B) Sqrt (diag(V_b-V_B))
fixed Random Difference S.E.
Leverage -0.271 -0.117 -0.015 0.002
Liquidity 0.105 0.206 -0.102 0.018
Asset Tangibility 0.526 0.222 0.304 0.058
Firm Size -0.012 -0.009 -0.004 0.002
chi2(4) 12.420
Prob>chi2 1.720
In order to select between the fixed and random effect models, where return on equity
(ROE) is the dependent variable, the Hausman test is applied and the results are shown
in Table 4.10. The null hypothesis of the Hausman test is that the random effects is
preferred to the fixed effects model. Hausman test reveals a chi-square of 17.610 with a
p-value of 1.979 for financial firms and 12.420 with a p-value of 1.720 for non-financial
firms indicating that at 5 percent level, the chi-square value obtained is statistically
insignificant. Hence, the study did not reject the null hypothesis as suggested by Greene
(2008). Thus, the study adopted the random effects model.
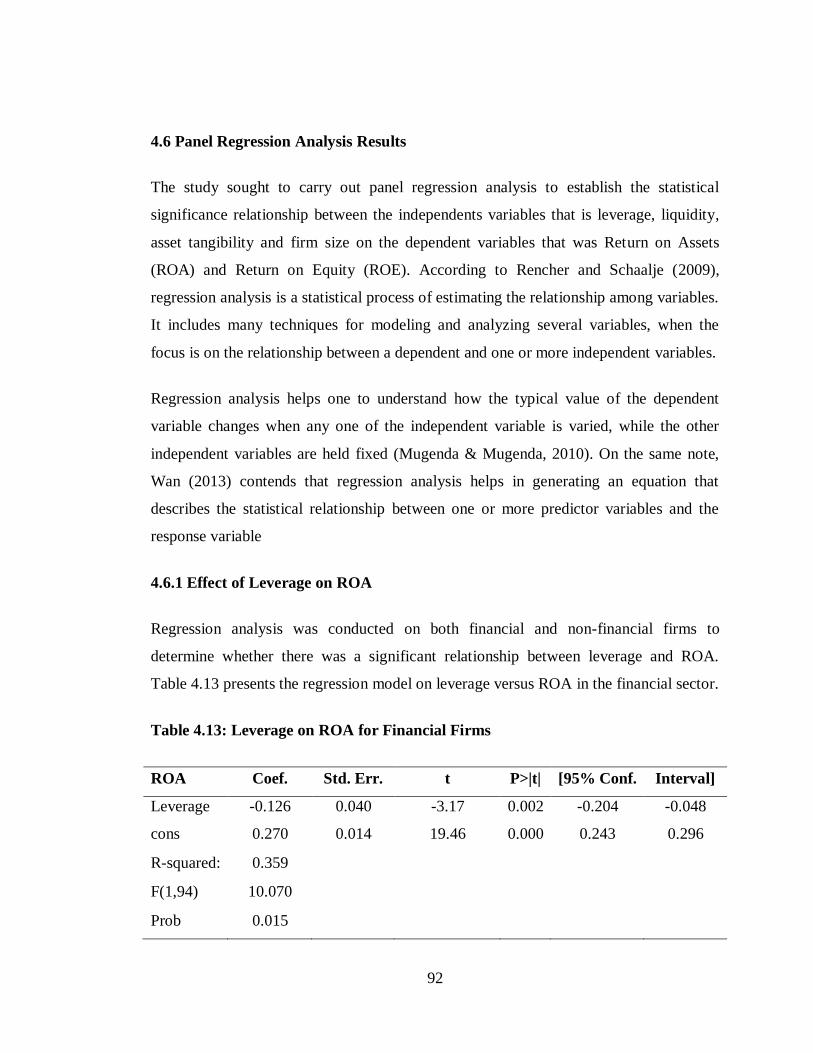
92
4.6 Panel Regression Analysis Results
The study sought to carry out panel regression analysis to establish the statistical
significance relationship between the independents variables that is leverage, liquidity,
asset tangibility and firm size on the dependent variables that was Return on Assets
(ROA) and Return on Equity (ROE). According to Rencher and Schaalje (2009),
regression analysis is a statistical process of estimating the relationship among variables.
It includes many techniques for modeling and analyzing several variables, when the
focus is on the relationship between a dependent and one or more independent variables.
Regression analysis helps one to understand how the typical value of the dependent
variable changes when any one of the independent variable is varied, while the other
independent variables are held fixed (Mugenda & Mugenda, 2010). On the same note,
Wan (2013) contends that regression analysis helps in generating an equation that
describes the statistical relationship between one or more predictor variables and the
response variable
4.6.1 Effect of Leverage on ROA
Regression analysis was conducted on both financial and non-financial firms to
determine whether there was a significant relationship between leverage and ROA.
Table 4.13 presents the regression model on leverage versus ROA in the financial sector.
Table 4.13: Leverage on ROA for Financial Firms
ROA Coef. Std. Err. t P>|t| [95% Conf. Interval]
Leverage -0.126 0.040 -3.17 0.002 -0.204 -0.048
cons 0.270 0.014 19.46 0.000 0.243 0.296
R-squared: 0.359
F(1,94) 10.070
Prob 0.015
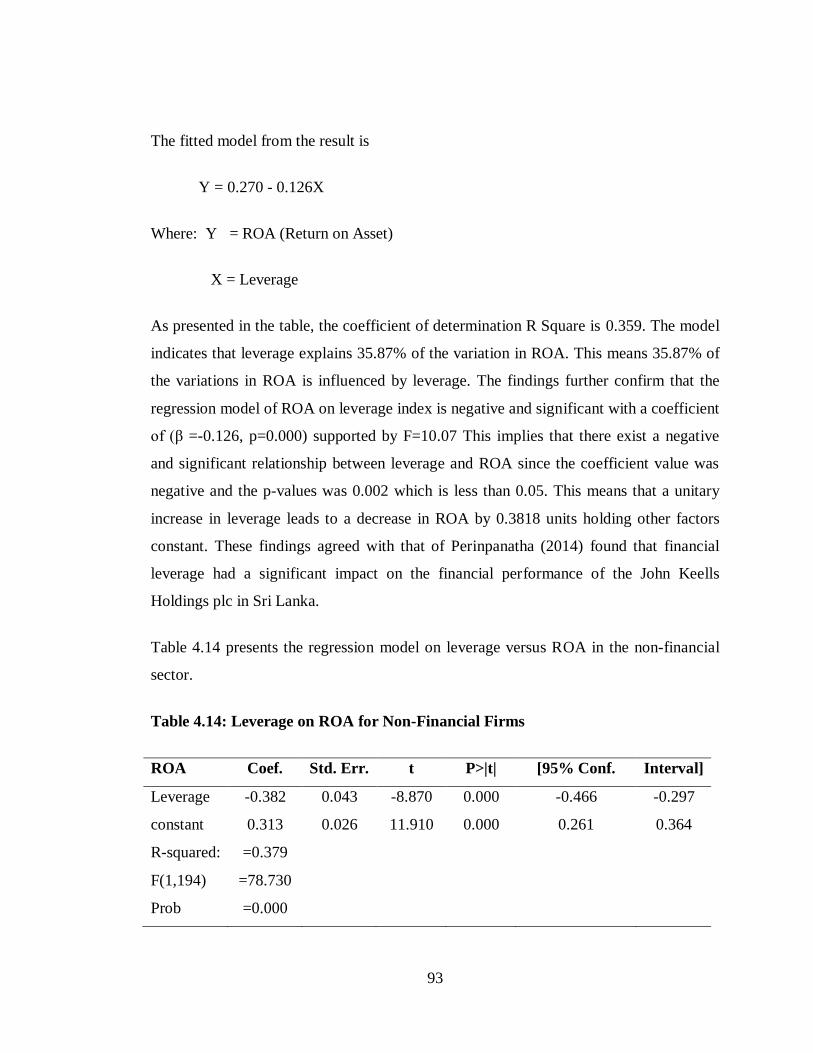
93
The fitted model from the result is
Y = 0.270 - 0.126X
Where: Y = ROA (Return on Asset)
X = Leverage
As presented in the table, the coefficient of determination R Square is 0.359. The model
indicates that leverage explains 35.87% of the variation in ROA. This means 35.87% of
the variations in ROA is influenced by leverage. The findings further confirm that the
regression model of ROA on leverage index is negative and significant with a coefficient
of (β =-0.126, p=0.000) supported by F=10.07 This implies that there exist a negative
and significant relationship between leverage and ROA since the coefficient value was
negative and the p-values was 0.002 which is less than 0.05. This means that a unitary
increase in leverage leads to a decrease in ROA by 0.3818 units holding other factors
constant. These findings agreed with that of Perinpanatha (2014) found that financial
leverage had a significant impact on the financial performance of the John Keells
Holdings plc in Sri Lanka.
Table 4.14 presents the regression model on leverage versus ROA in the non-financial
sector.
Table 4.14: Leverage on ROA for Non-Financial Firms
ROA Coef. Std. Err. t P>|t| [95% Conf. Interval]
Leverage -0.382 0.043 -8.870 0.000 -0.466 -0.297
constant 0.313 0.026 11.910 0.000 0.261 0.364
R-squared: =0.379
F(1,194) =78.730
Prob =0.000
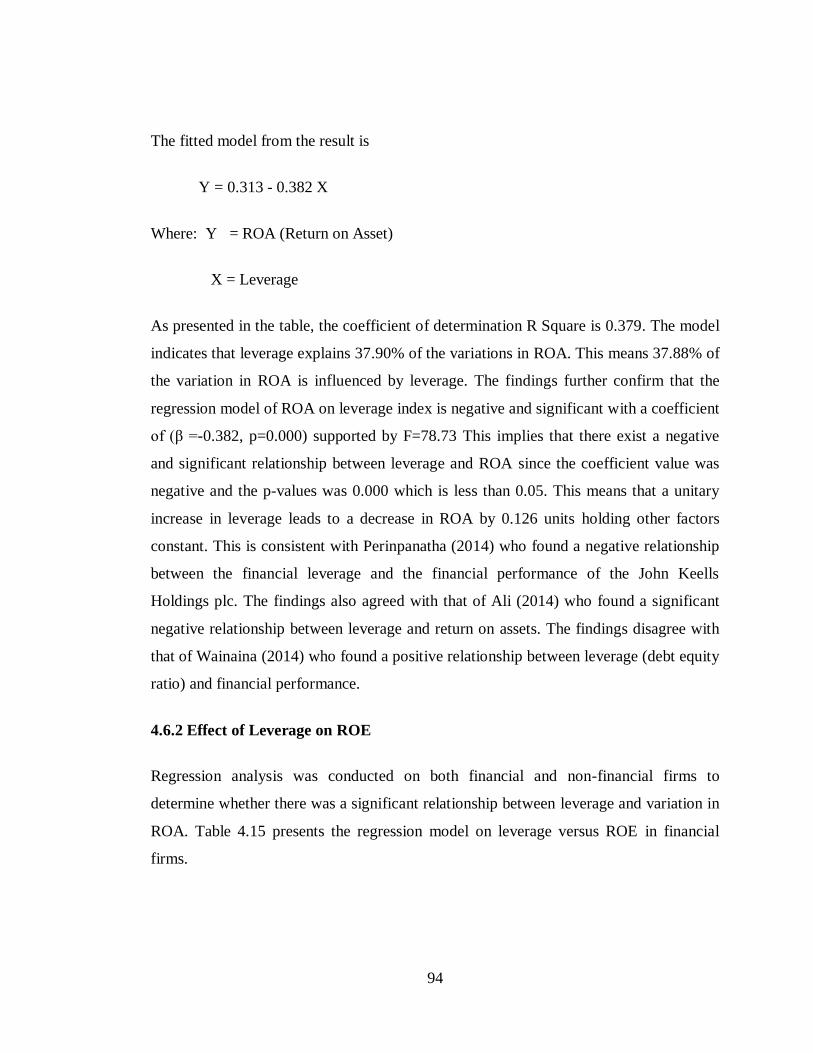
94
The fitted model from the result is
Y = 0.313 - 0.382 X
Where: Y = ROA (Return on Asset)
X = Leverage
As presented in the table, the coefficient of determination R Square is 0.379. The model
indicates that leverage explains 37.90% of the variations in ROA. This means 37.88% of
the variation in ROA is influenced by leverage. The findings further confirm that the
regression model of ROA on leverage index is negative and significant with a coefficient
of (β =-0.382, p=0.000) supported by F=78.73 This implies that there exist a negative
and significant relationship between leverage and ROA since the coefficient value was
negative and the p-values was 0.000 which is less than 0.05. This means that a unitary
increase in leverage leads to a decrease in ROA by 0.126 units holding other factors
constant. This is consistent with Perinpanatha (2014) who found a negative relationship
between the financial leverage and the financial performance of the John Keells
Holdings plc. The findings also agreed with that of Ali (2014) who found a significant
negative relationship between leverage and return on assets. The findings disagree with
that of Wainaina (2014) who found a positive relationship between leverage (debt equity
ratio) and financial performance.
4.6.2 Effect of Leverage on ROE
Regression analysis was conducted on both financial and non-financial firms to
determine whether there was a significant relationship between leverage and variation in
ROA. Table 4.15 presents the regression model on leverage versus ROE in financial
firms.
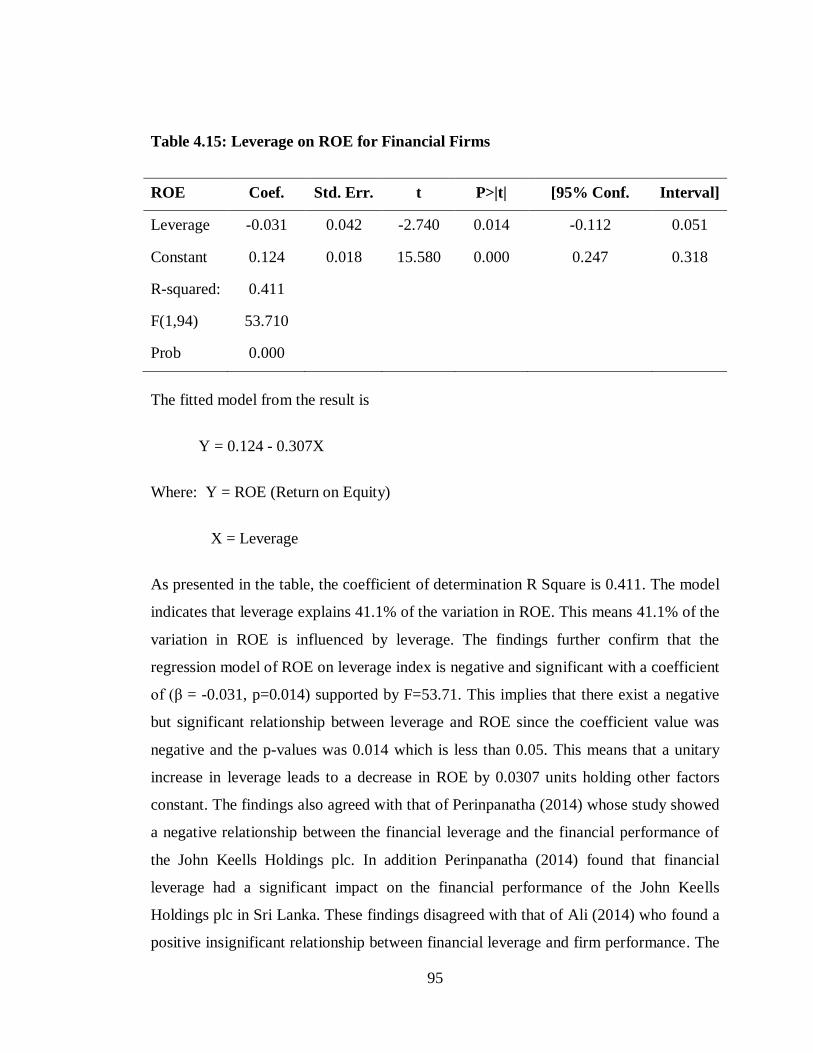
95
Table 4.15: Leverage on ROE for Financial Firms
ROE Coef. Std. Err. t P>|t| [95% Conf. Interval]
Leverage -0.031 0.042 -2.740 0.014 -0.112 0.051
Constant 0.124 0.018 15.580 0.000 0.247 0.318
R-squared: 0.411
F(1,94) 53.710
Prob 0.000
The fitted model from the result is
Y = 0.124 - 0.307X
Where: Y = ROE (Return on Equity)
X = Leverage
As presented in the table, the coefficient of determination R Square is 0.411. The model
indicates that leverage explains 41.1% of the variation in ROE. This means 41.1% of the
variation in ROE is influenced by leverage. The findings further confirm that the
regression model of ROE on leverage index is negative and significant with a coefficient
of (β = -0.031, p=0.014) supported by F=53.71. This implies that there exist a negative
but significant relationship between leverage and ROE since the coefficient value was
negative and the p-values was 0.014 which is less than 0.05. This means that a unitary
increase in leverage leads to a decrease in ROE by 0.0307 units holding other factors
constant. The findings also agreed with that of Perinpanatha (2014) whose study showed
a negative relationship between the financial leverage and the financial performance of
the John Keells Holdings plc. In addition Perinpanatha (2014) found that financial
leverage had a significant impact on the financial performance of the John Keells
Holdings plc in Sri Lanka. These findings disagreed with that of Ali (2014) who found a
positive insignificant relationship between financial leverage and firm performance. The
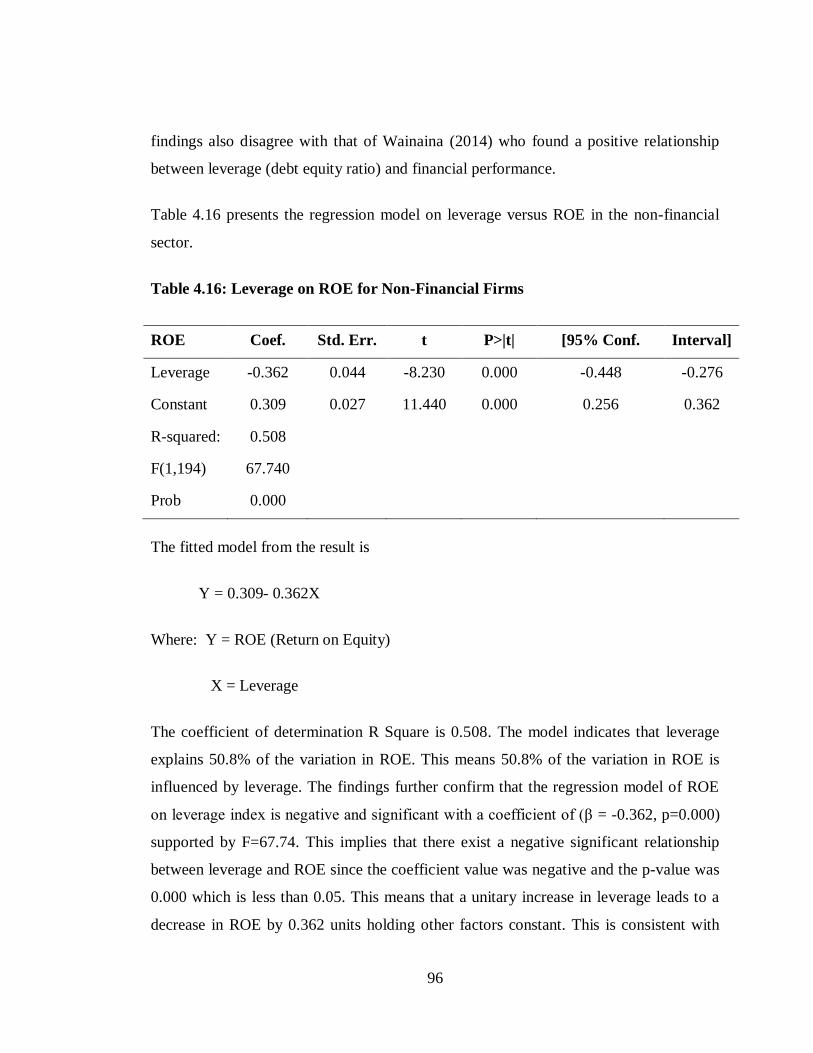
96
findings also disagree with that of Wainaina (2014) who found a positive relationship
between leverage (debt equity ratio) and financial performance.
Table 4.16 presents the regression model on leverage versus ROE in the non-financial
sector.
Table 4.16: Leverage on ROE for Non-Financial Firms
ROE Coef. Std. Err. t P>|t| [95% Conf. Interval]
Leverage -0.362 0.044 -8.230 0.000 -0.448 -0.276
Constant 0.309 0.027 11.440 0.000 0.256 0.362
R-squared: 0.508
F(1,194) 67.740
Prob 0.000
The fitted model from the result is
Y = 0.309- 0.362X
Where: Y = ROE (Return on Equity)
X = Leverage
The coefficient of determination R Square is 0.508. The model indicates that leverage
explains 50.8% of the variation in ROE. This means 50.8% of the variation in ROE is
influenced by leverage. The findings further confirm that the regression model of ROE
on leverage index is negative and significant with a coefficient of (β = -0.362, p=0.000)
supported by F=67.74. This implies that there exist a negative significant relationship
between leverage and ROE since the coefficient value was negative and the p-value was
0.000 which is less than 0.05. This means that a unitary increase in leverage leads to a
decrease in ROE by 0.362 units holding other factors constant. This is consistent with
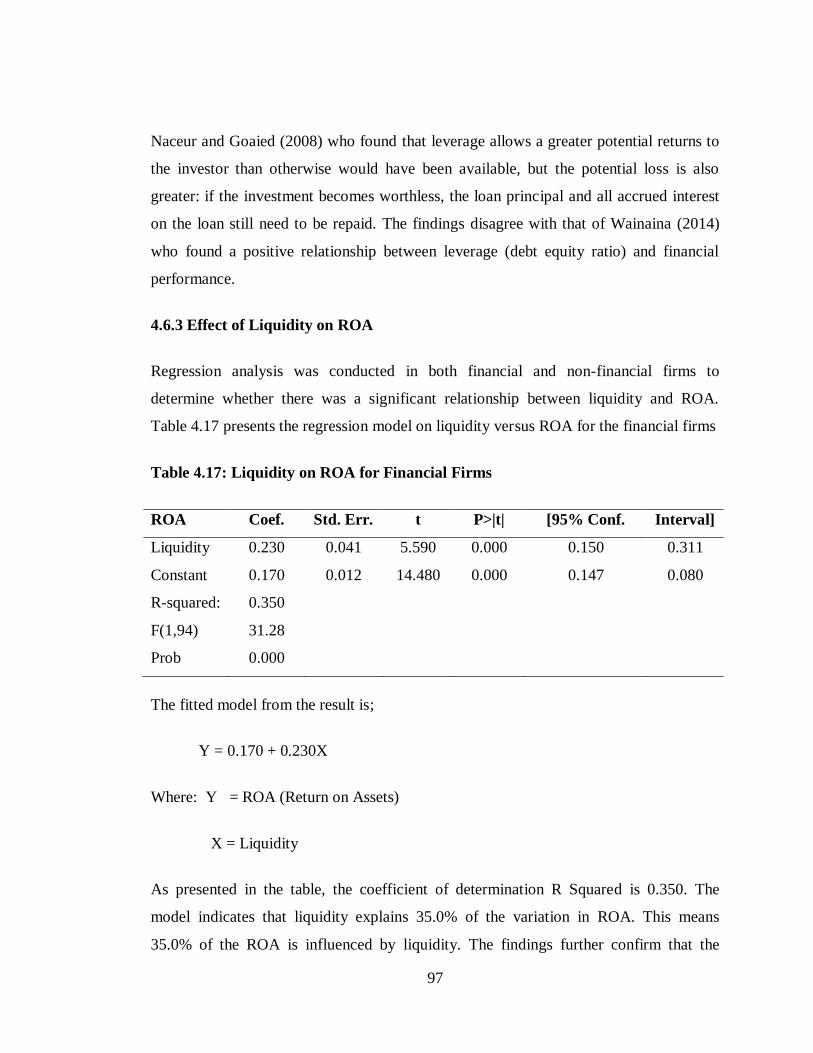
97
Naceur and Goaied (2008) who found that leverage allows a greater potential returns to
the investor than otherwise would have been available, but the potential loss is also
greater: if the investment becomes worthless, the loan principal and all accrued interest
on the loan still need to be repaid. The findings disagree with that of Wainaina (2014)
who found a positive relationship between leverage (debt equity ratio) and financial
performance.
4.6.3 Effect of Liquidity on ROA
Regression analysis was conducted in both financial and non-financial firms to
determine whether there was a significant relationship between liquidity and ROA.
Table 4.17 presents the regression model on liquidity versus ROA for the financial firms
Table 4.17: Liquidity on ROA for Financial Firms
ROA Coef. Std. Err. t P>|t| [95% Conf. Interval]
Liquidity 0.230 0.041 5.590 0.000 0.150 0.311
Constant 0.170 0.012 14.480 0.000 0.147 0.080
R-squared: 0.350
F(1,94) 31.28
Prob 0.000
The fitted model from the result is;
Y = 0.170 + 0.230X
Where: Y = ROA (Return on Assets)
X = Liquidity
As presented in the table, the coefficient of determination R Squared is 0.350. The
model indicates that liquidity explains 35.0% of the variation in ROA. This means
35.0% of the ROA is influenced by liquidity. The findings further confirm that the
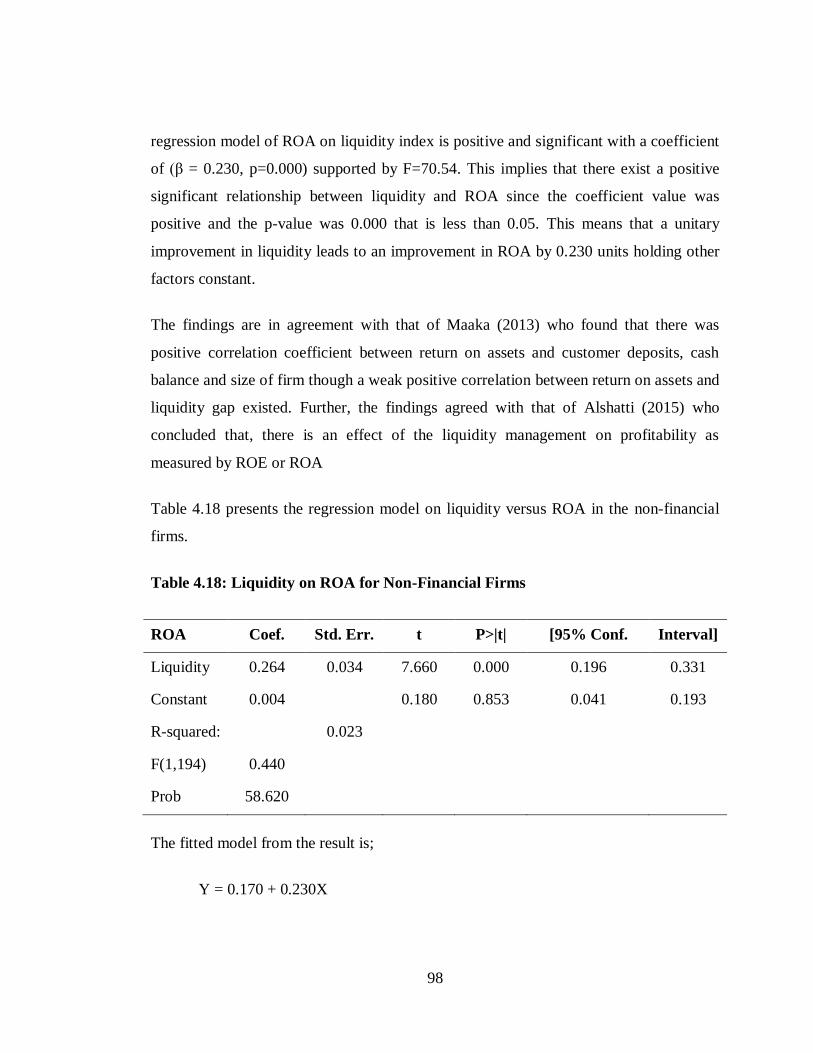
98
regression model of ROA on liquidity index is positive and significant with a coefficient
of (β = 0.230, p=0.000) supported by F=70.54. This implies that there exist a positive
significant relationship between liquidity and ROA since the coefficient value was
positive and the p-value was 0.000 that is less than 0.05. This means that a unitary
improvement in liquidity leads to an improvement in ROA by 0.230 units holding other
factors constant.
The findings are in agreement with that of Maaka (2013) who found that there was
positive correlation coefficient between return on assets and customer deposits, cash
balance and size of firm though a weak positive correlation between return on assets and
liquidity gap existed. Further, the findings agreed with that of Alshatti (2015) who
concluded that, there is an effect of the liquidity management on profitability as
measured by ROE or ROA
Table 4.18 presents the regression model on liquidity versus ROA in the non-financial
firms.
Table 4.18: Liquidity on ROA for Non-Financial Firms
ROA Coef. Std. Err. t P>|t| [95% Conf. Interval]
Liquidity 0.264 0.034 7.660 0.000 0.196 0.331
Constant 0.004
0.180 0.853 0.041 0.193
R-squared:
0.023
F(1,194) 0.440
Prob 58.620
The fitted model from the result is;
Y = 0.170 + 0.230X
99
Where: Y = ROA (Return on Assets)
X = Liquidity
The coefficient of determination R Squared is 0.440. The model indicates that liquidity
explains 44% of the variation in ROA. This means 44% of the variations in ROA are
influenced by liquidity. The findings further confirm that the regression model of ROA
on liquidity index is positive and significant with a coefficient of (β = 0.264, p=0.000)
supported by F=58.62. This implies that there exist a positive significant relationship
between liquidity and ROA since the coefficient value was positive and the p-value was
0.000 that is less than 0.05. This means that a unitary improvement in liquidity leads to
an improvement in ROA by 0.264 units holding other factors constant. This is in
agreement with Maaka (2013) who found a positive correlation coefficient between
return on assets and liquidity. The results also agree with Njeri (2014) who found that
there is a positive relationship between liquidity and financial performance. The findings
further concurs with the study by Sanghani (2014) also found that liquidity positively
affect the financial performance of non-financial companies listed at the NSE.
4.6.4 Effect of Liquidity on ROE
Regression analysis was conducted on financial and non-financial firms to determine
whether there was a significant relationship between liquidity and ROE. Table 4.19
presents the regression model on liquidity versus ROE for financial firms.
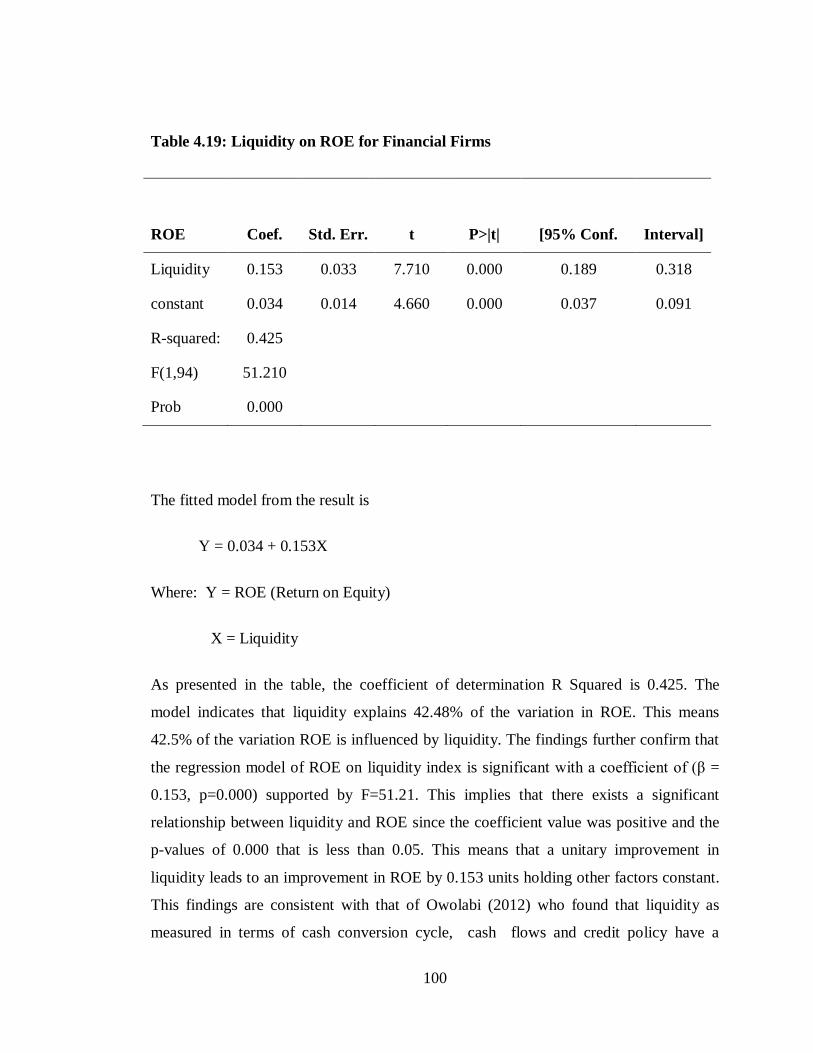
100
Table 4.19: Liquidity on ROE for Financial Firms
ROE Coef. Std. Err. t P>|t| [95% Conf. Interval]
Liquidity 0.153 0.033 7.710 0.000 0.189 0.318
constant 0.034 0.014 4.660 0.000 0.037 0.091
R-squared: 0.425
F(1,94) 51.210
Prob 0.000
The fitted model from the result is
Y = 0.034 + 0.153X
Where: Y = ROE (Return on Equity)
X = Liquidity
As presented in the table, the coefficient of determination R Squared is 0.425. The
model indicates that liquidity explains 42.48% of the variation in ROE. This means
42.5% of the variation ROE is influenced by liquidity. The findings further confirm that
the regression model of ROE on liquidity index is significant with a coefficient of (β =
0.153, p=0.000) supported by F=51.21. This implies that there exists a significant
relationship between liquidity and ROE since the coefficient value was positive and the
p-values of 0.000 that is less than 0.05. This means that a unitary improvement in
liquidity leads to an improvement in ROE by 0.153 units holding other factors constant.
This findings are consistent with that of Owolabi (2012) who found that liquidity as
measured in terms of cash conversion cycle, cash flows and credit policy have a
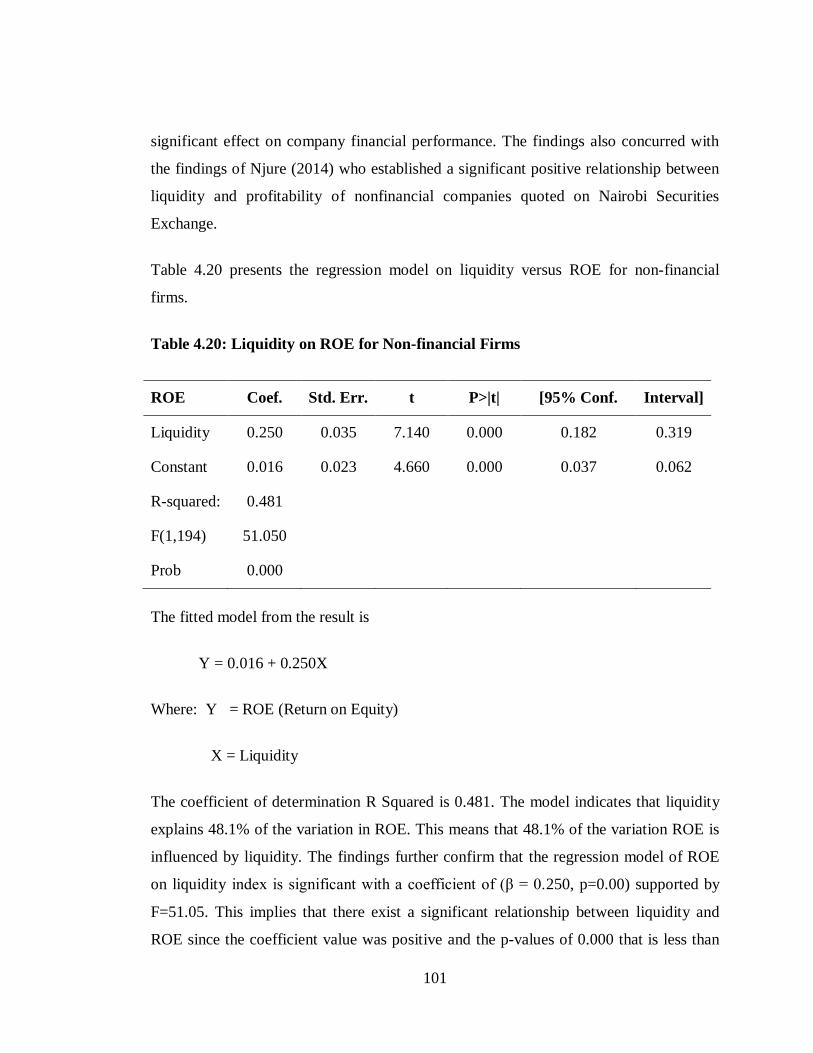
101
significant effect on company financial performance. The findings also concurred with
the findings of Njure (2014) who established a significant positive relationship between
liquidity and profitability of nonfinancial companies quoted on Nairobi Securities
Exchange.
Table 4.20 presents the regression model on liquidity versus ROE for non-financial
firms.
Table 4.20: Liquidity on ROE for Non-financial Firms
ROE Coef. Std. Err. t P>|t| [95% Conf. Interval]
Liquidity 0.250 0.035 7.140 0.000 0.182 0.319
Constant 0.016 0.023 4.660 0.000 0.037 0.062
R-squared: 0.481
F(1,194) 51.050
Prob 0.000
The fitted model from the result is
Y = 0.016 + 0.250X
Where: Y = ROE (Return on Equity)
X = Liquidity
The coefficient of determination R Squared is 0.481. The model indicates that liquidity
explains 48.1% of the variation in ROE. This means that 48.1% of the variation ROE is
influenced by liquidity. The findings further confirm that the regression model of ROE
on liquidity index is significant with a coefficient of (β = 0.250, p=0.00) supported by
F=51.05. This implies that there exist a significant relationship between liquidity and
ROE since the coefficient value was positive and the p-values of 0.000 that is less than
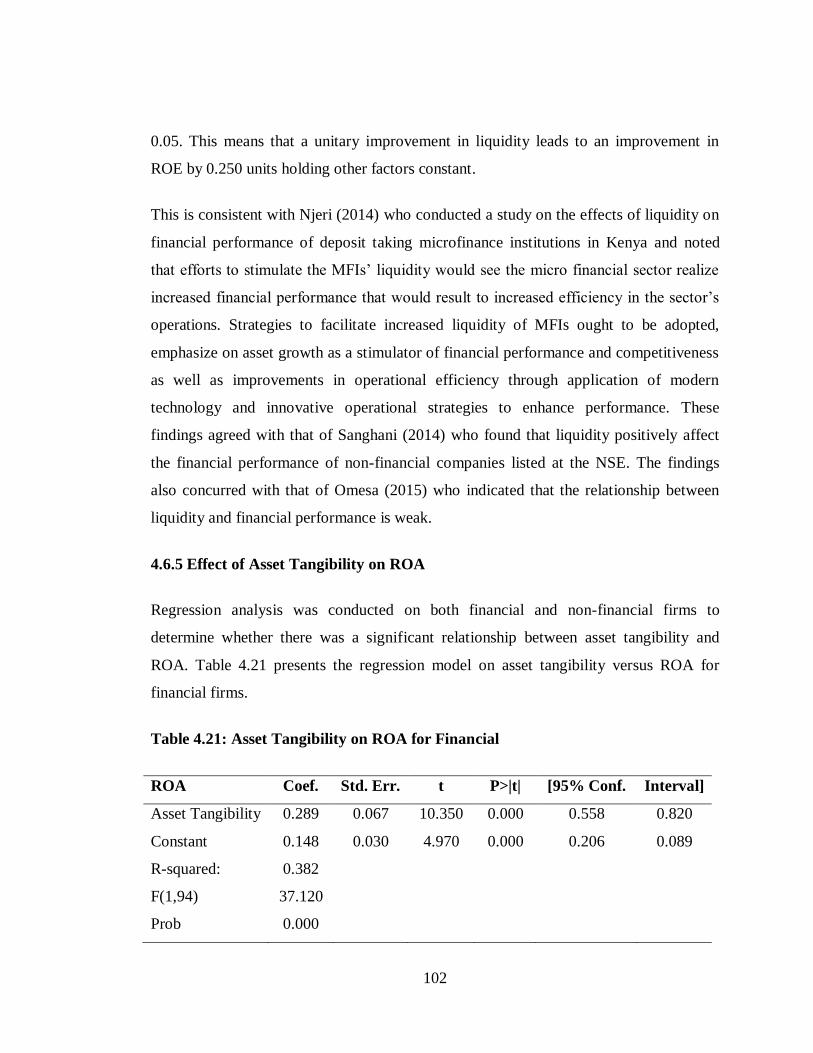
102
0.05. This means that a unitary improvement in liquidity leads to an improvement in
ROE by 0.250 units holding other factors constant.
This is consistent with Njeri (2014) who conducted a study on the effects of liquidity on
financial performance of deposit taking microfinance institutions in Kenya and noted
that efforts to stimulate the MFIs’ liquidity would see the micro financial sector realize
increased financial performance that would result to increased efficiency in the sector’s
operations. Strategies to facilitate increased liquidity of MFIs ought to be adopted,
emphasize on asset growth as a stimulator of financial performance and competitiveness
as well as improvements in operational efficiency through application of modern
technology and innovative operational strategies to enhance performance. These
findings agreed with that of Sanghani (2014) who found that liquidity positively affect
the financial performance of non-financial companies listed at the NSE. The findings
also concurred with that of Omesa (2015) who indicated that the relationship between
liquidity and financial performance is weak.
4.6.5 Effect of Asset Tangibility on ROA
Regression analysis was conducted on both financial and non-financial firms to
determine whether there was a significant relationship between asset tangibility and
ROA. Table 4.21 presents the regression model on asset tangibility versus ROA for
financial firms.
Table 4.21: Asset Tangibility on ROA for Financial
ROA Coef. Std. Err. t P>|t| [95% Conf. Interval]
Asset Tangibility 0.289 0.067 10.350 0.000 0.558 0.820
Constant 0.148 0.030 4.970 0.000 0.206 0.089
R-squared: 0.382
F(1,94) 37.120
Prob 0.000
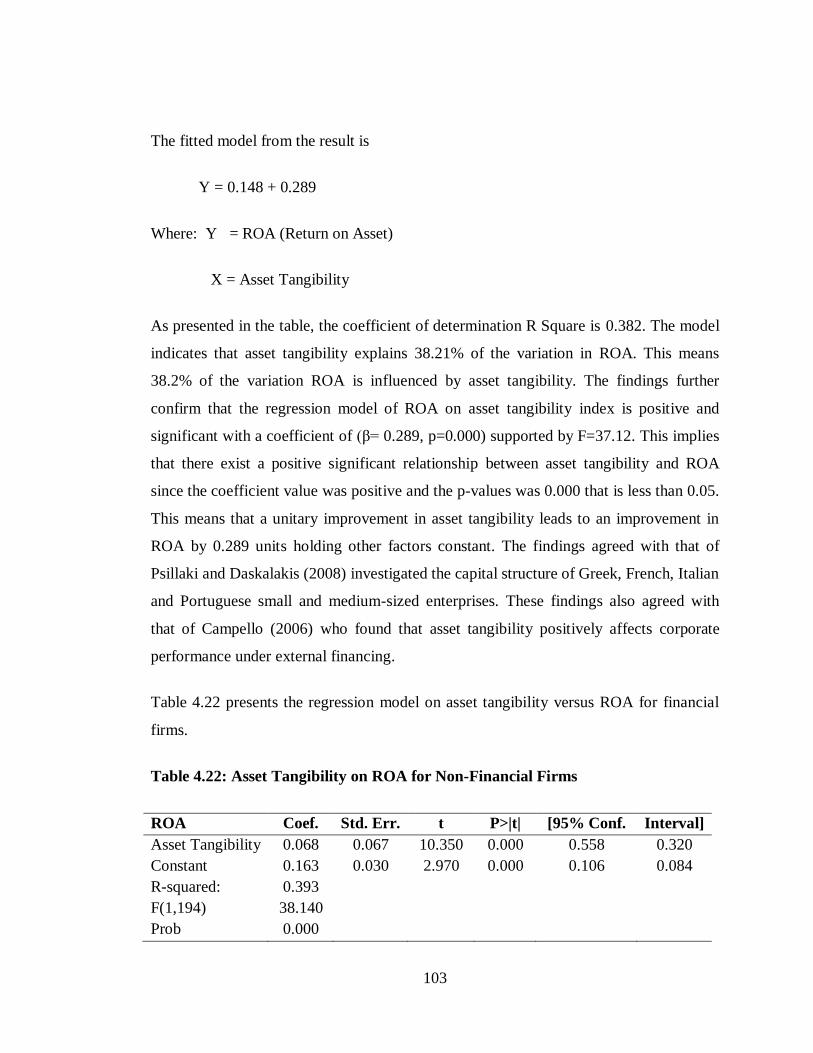
103
The fitted model from the result is
Y = 0.148 + 0.289
Where: Y = ROA (Return on Asset)
X = Asset Tangibility
As presented in the table, the coefficient of determination R Square is 0.382. The model
indicates that asset tangibility explains 38.21% of the variation in ROA. This means
38.2% of the variation ROA is influenced by asset tangibility. The findings further
confirm that the regression model of ROA on asset tangibility index is positive and
significant with a coefficient of (β= 0.289, p=0.000) supported by F=37.12. This implies
that there exist a positive significant relationship between asset tangibility and ROA
since the coefficient value was positive and the p-values was 0.000 that is less than 0.05.
This means that a unitary improvement in asset tangibility leads to an improvement in
ROA by 0.289 units holding other factors constant. The findings agreed with that of
Psillaki and Daskalakis (2008) investigated the capital structure of Greek, French, Italian
and Portuguese small and medium-sized enterprises. These findings also agreed with
that of Campello (2006) who found that asset tangibility positively affects corporate
performance under external financing.
Table 4.22 presents the regression model on asset tangibility versus ROA for financial
firms.
Table 4.22: Asset Tangibility on ROA for Non-Financial Firms
ROA Coef. Std. Err. t P>|t| [95% Conf. Interval]
Asset Tangibility 0.068 0.067 10.350 0.000 0.558 0.320
Constant 0.163 0.030 2.970 0.000 0.106 0.084
R-squared: 0.393
F(1,194) 38.140
Prob 0.000
104
The fitted model from the result is
Y = 0.163 + 0.689X
Where: Y = ROA (Return on Asset)
X = Asset Tangibility
The coefficient of determination R Square is 0.393. The model indicates that asset
tangibility explains 39.3% of the variation in ROA. This means 39.3% of the variation
ROA is influenced by asset tangibility. The findings further confirm that the regression
model of ROA on asset tangibility index is positive and significant with a coefficient of
(β= 0.068, p=0.000) supported by F=37.12. This implies that there exist a positive
significant relationship between asset tangibility and ROA since the coefficient value
was positive and the p-values was 0.000 that is less than 0.05. This means that a unitary
improvement in asset tangibility leads to an improvement in ROA by 0.068 units
holding other factors constant.
This is in agreement with Harc (2015) who found that tangible assets have a positive
impact on the long-term debt of SMEs.
4.6.6 Effect of Asset Tangibility on ROE
Regression analysis was conducted on financial and non-financial firms to determine
whether there was a significant relationship between asset tangibility and ROE. Table
4.23 presents the regression model on asset tangibility versus ROE for the financial
firms.
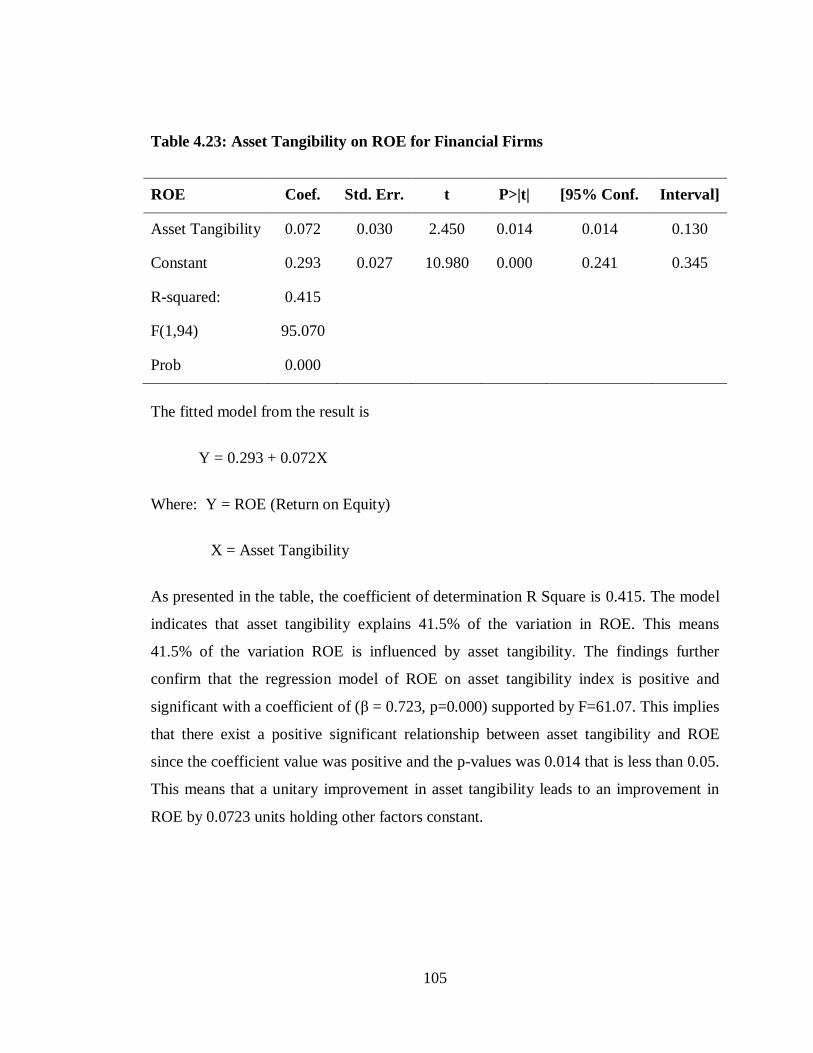
105
Table 4.23: Asset Tangibility on ROE for Financial Firms
ROE Coef. Std. Err. t P>|t| [95% Conf. Interval]
Asset Tangibility 0.072 0.030 2.450 0.014 0.014 0.130
Constant 0.293 0.027 10.980 0.000 0.241 0.345
R-squared: 0.415
F(1,94) 95.070
Prob 0.000
The fitted model from the result is
Y = 0.293 + 0.072X
Where: Y = ROE (Return on Equity)
X = Asset Tangibility
As presented in the table, the coefficient of determination R Square is 0.415. The model
indicates that asset tangibility explains 41.5% of the variation in ROE. This means
41.5% of the variation ROE is influenced by asset tangibility. The findings further
confirm that the regression model of ROE on asset tangibility index is positive and
significant with a coefficient of (β = 0.723, p=0.000) supported by F=61.07. This implies
that there exist a positive significant relationship between asset tangibility and ROE
since the coefficient value was positive and the p-values was 0.014 that is less than 0.05.
This means that a unitary improvement in asset tangibility leads to an improvement in
ROE by 0.0723 units holding other factors constant.
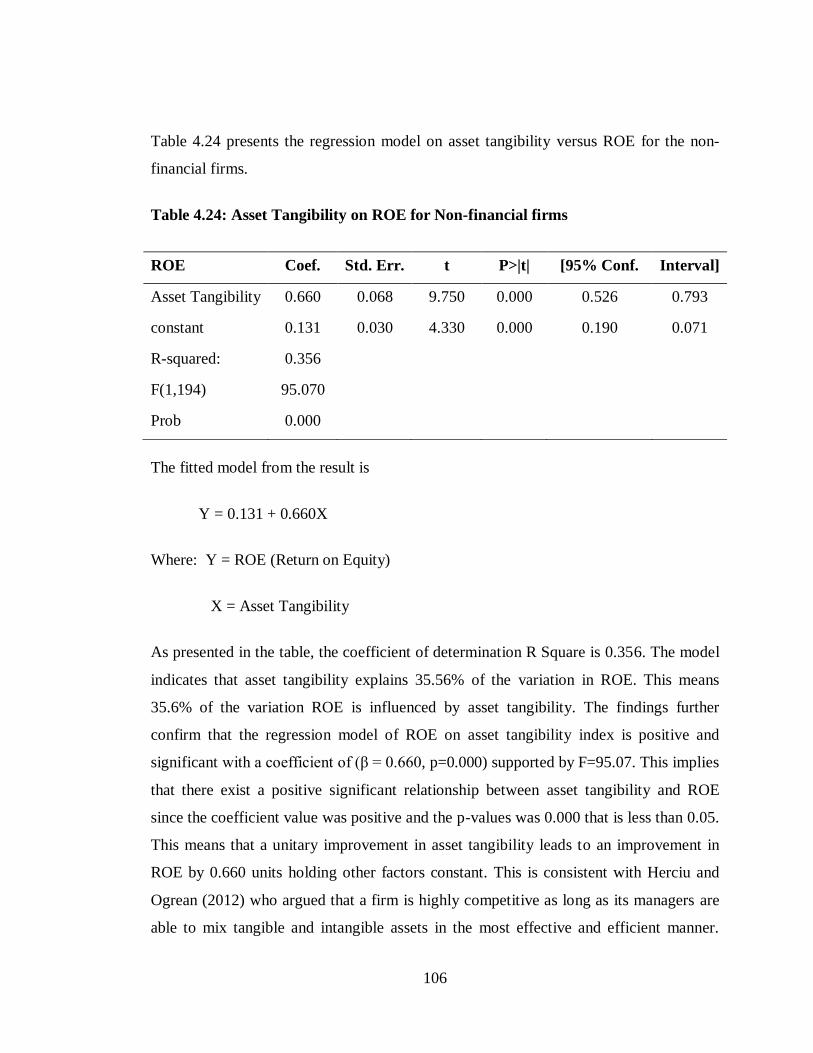
106
Table 4.24 presents the regression model on asset tangibility versus ROE for the non-
financial firms.
Table 4.24: Asset Tangibility on ROE for Non-financial firms
ROE Coef. Std. Err. t P>|t| [95% Conf. Interval]
Asset Tangibility 0.660 0.068 9.750 0.000 0.526 0.793
constant 0.131 0.030 4.330 0.000 0.190 0.071
R-squared: 0.356
F(1,194) 95.070
Prob 0.000
The fitted model from the result is
Y = 0.131 + 0.660X
Where: Y = ROE (Return on Equity)
X = Asset Tangibility
As presented in the table, the coefficient of determination R Square is 0.356. The model
indicates that asset tangibility explains 35.56% of the variation in ROE. This means
35.6% of the variation ROE is influenced by asset tangibility. The findings further
confirm that the regression model of ROE on asset tangibility index is positive and
significant with a coefficient of (β = 0.660, p=0.000) supported by F=95.07. This implies
that there exist a positive significant relationship between asset tangibility and ROE
since the coefficient value was positive and the p-values was 0.000 that is less than 0.05.
This means that a unitary improvement in asset tangibility leads to an improvement in
ROE by 0.660 units holding other factors constant. This is consistent with Herciu and
Ogrean (2012) who argued that a firm is highly competitive as long as its managers are
able to mix tangible and intangible assets in the most effective and efficient manner.
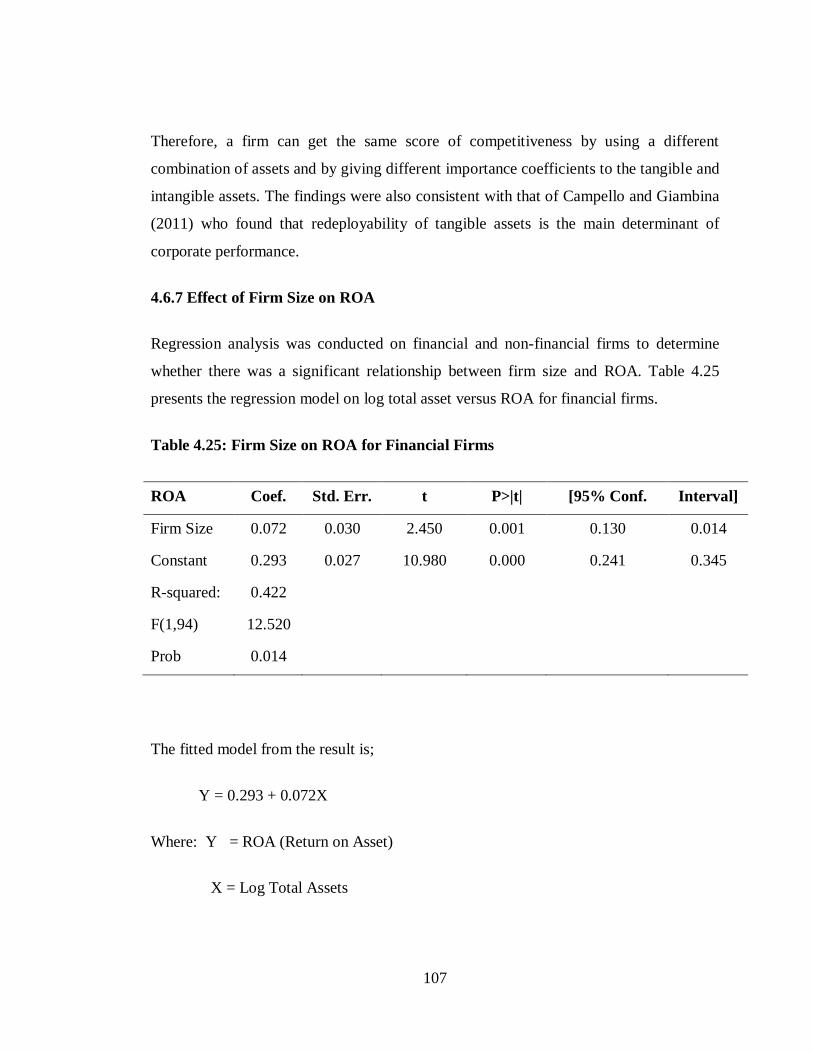
107
Therefore, a firm can get the same score of competitiveness by using a different
combination of assets and by giving different importance coefficients to the tangible and
intangible assets. The findings were also consistent with that of Campello and Giambina
(2011) who found that redeployability of tangible assets is the main determinant of
corporate performance.
4.6.7 Effect of Firm Size on ROA
Regression analysis was conducted on financial and non-financial firms to determine
whether there was a significant relationship between firm size and ROA. Table 4.25
presents the regression model on log total asset versus ROA for financial firms.
Table 4.25: Firm Size on ROA for Financial Firms
ROA Coef. Std. Err. t P>|t| [95% Conf. Interval]
Firm Size 0.072 0.030 2.450 0.001 0.130 0.014
Constant 0.293 0.027 10.980 0.000 0.241 0.345
R-squared: 0.422
F(1,94) 12.520
Prob 0.014
The fitted model from the result is;
Y = 0.293 + 0.072X
Where: Y = ROA (Return on Asset)
X = Log Total Assets
108
As presented in the table, the coefficient of determination R Square is 0.422. The model
indicates that log total asset explains 42.2% of the variation in ROA. This means 42.2%
of the ROA is influenced by firm size. The findings further confirm that the regression
model of ROA on log total asset index is positive and significant with a coefficient of (β
= 0.072, p=0.000) supported by F=12.52. This implies that there exist a positive
significant relationship between firm size and ROA since the coefficient value was
positive and the p-value was 0.000 that is less than 0.05. This means that a unitary
improvement in firm size leads to an improvement in ROA by 0.072 units holding other
factors constant. This finding is consistent with that of Pervan and Višić (2012) who
found that firm size had a significant positive (although weak) influence on firm
profitability. Additionally, results showed that assets turnover and debt ratio also
statistically significantly influence firms’ performance while current ratio did not prove
to be an important explanatory variable of firms’ profitability. These findings agreed
with that of Tahir and Razali (2011) who indicated that there is positive relationship
between firm size and firm value. The size influences a firm performance because large
firm can increase their current size very fast by accumulating earnings from past
performance and this enhances their value. The findings also concurred with that of
Liargovas and Skandalis (2008) who did a study on the financial performance and size
of manufacturing firms in Greece and found out that financial performance of majority
of the firms was affected by firm size. In addition, the study argued that firm size is a
basis of competitive advantage in the sense that larger companies tend to be more
efficient than their smaller counterparts and have better resources to survive economic
downturns.
Table 4.26 presents the regression model on log total asset versus ROA for non-financial
firms.
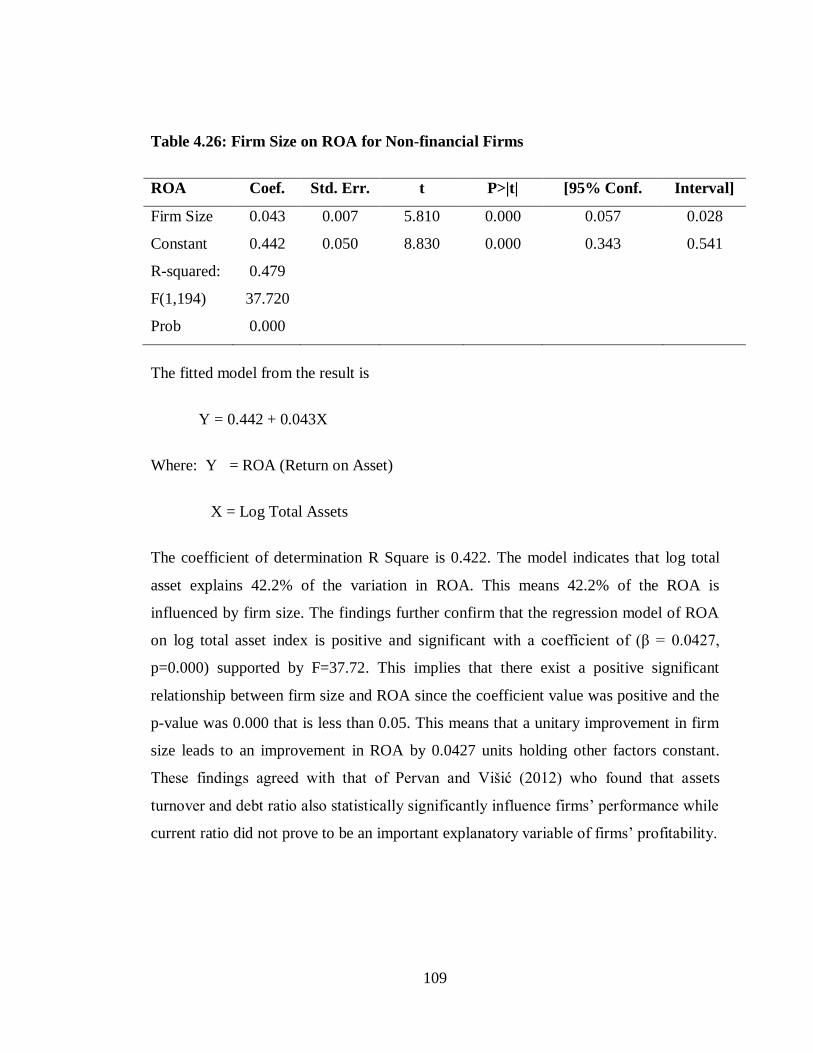
109
Table 4.26: Firm Size on ROA for Non-financial Firms
ROA Coef. Std. Err. t P>|t| [95% Conf. Interval]
Firm Size 0.043 0.007 5.810 0.000 0.057 0.028
Constant 0.442 0.050 8.830 0.000 0.343 0.541
R-squared: 0.479
F(1,194) 37.720
Prob 0.000
The fitted model from the result is
Y = 0.442 + 0.043X
Where: Y = ROA (Return on Asset)
X = Log Total Assets
The coefficient of determination R Square is 0.422. The model indicates that log total
asset explains 42.2% of the variation in ROA. This means 42.2% of the ROA is
influenced by firm size. The findings further confirm that the regression model of ROA
on log total asset index is positive and significant with a coefficient of (β = 0.0427,
p=0.000) supported by F=37.72. This implies that there exist a positive significant
relationship between firm size and ROA since the coefficient value was positive and the
p-value was 0.000 that is less than 0.05. This means that a unitary improvement in firm
size leads to an improvement in ROA by 0.0427 units holding other factors constant.
These findings agreed with that of Pervan and Višić (2012) who found that assets
turnover and debt ratio also statistically significantly influence firms’ performance while
current ratio did not prove to be an important explanatory variable of firms’ profitability.
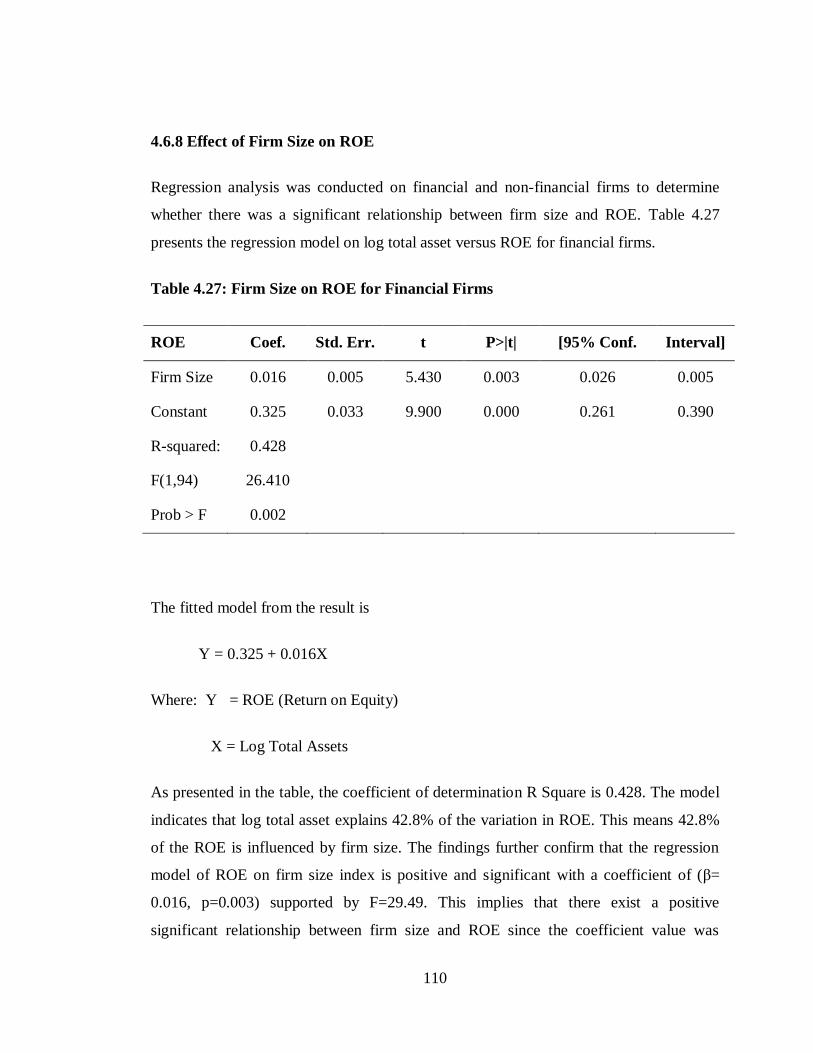
110
4.6.8 Effect of Firm Size on ROE
Regression analysis was conducted on financial and non-financial firms to determine
whether there was a significant relationship between firm size and ROE. Table 4.27
presents the regression model on log total asset versus ROE for financial firms.
Table 4.27: Firm Size on ROE for Financial Firms
ROE Coef. Std. Err. t P>|t| [95% Conf. Interval]
Firm Size 0.016 0.005 5.430 0.003 0.026 0.005
Constant 0.325 0.033 9.900 0.000 0.261 0.390
R-squared: 0.428
F(1,94) 26.410
Prob > F 0.002
The fitted model from the result is
Y = 0.325 + 0.016X
Where: Y = ROE (Return on Equity)
X = Log Total Assets
As presented in the table, the coefficient of determination R Square is 0.428. The model
indicates that log total asset explains 42.8% of the variation in ROE. This means 42.8%
of the ROE is influenced by firm size. The findings further confirm that the regression
model of ROE on firm size index is positive and significant with a coefficient of (β=
0.016, p=0.003) supported by F=29.49. This implies that there exist a positive
significant relationship between firm size and ROE since the coefficient value was
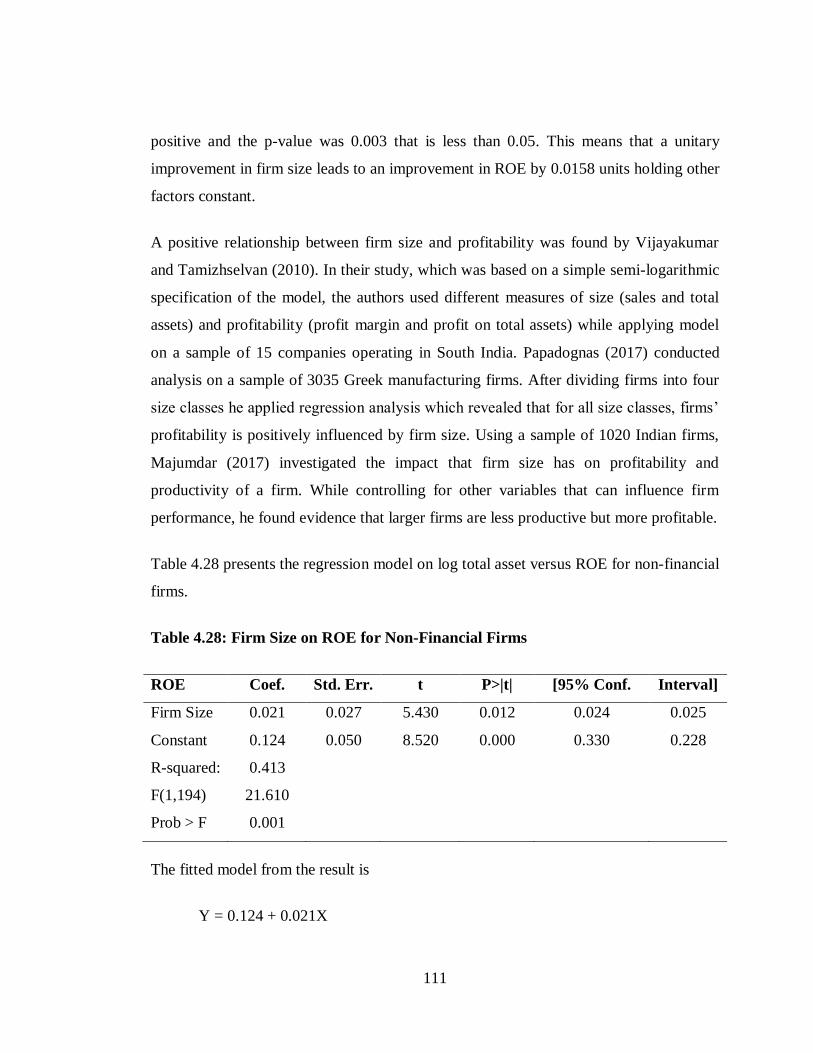
111
positive and the p-value was 0.003 that is less than 0.05. This means that a unitary
improvement in firm size leads to an improvement in ROE by 0.0158 units holding other
factors constant.
A positive relationship between firm size and profitability was found by Vijayakumar
and Tamizhselvan (2010). In their study, which was based on a simple semi-logarithmic
specification of the model, the authors used different measures of size (sales and total
assets) and profitability (profit margin and profit on total assets) while applying model
on a sample of 15 companies operating in South India. Papadognas (2017) conducted
analysis on a sample of 3035 Greek manufacturing firms. After dividing firms into four
size classes he applied regression analysis which revealed that for all size classes, firms’
profitability is positively influenced by firm size. Using a sample of 1020 Indian firms,
Majumdar (2017) investigated the impact that firm size has on profitability and
productivity of a firm. While controlling for other variables that can influence firm
performance, he found evidence that larger firms are less productive but more profitable.
Table 4.28 presents the regression model on log total asset versus ROE for non-financial
firms.
Table 4.28: Firm Size on ROE for Non-Financial Firms
ROE Coef. Std. Err. t P>|t| [95% Conf. Interval]
Firm Size 0.021 0.027 5.430 0.012 0.024 0.025
Constant 0.124 0.050 8.520 0.000 0.330 0.228
R-squared: 0.413
F(1,194) 21.610
Prob > F 0.001
The fitted model from the result is
Y = 0.124 + 0.021X
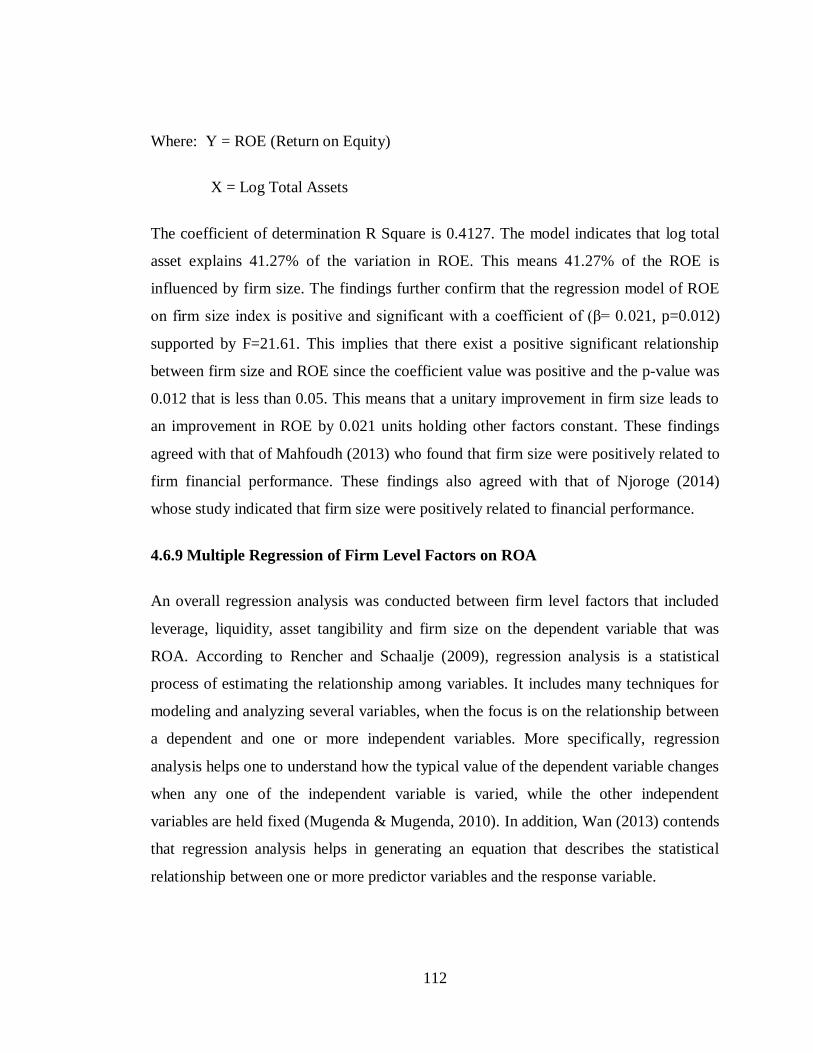
112
Where: Y = ROE (Return on Equity)
X = Log Total Assets
The coefficient of determination R Square is 0.4127. The model indicates that log total
asset explains 41.27% of the variation in ROE. This means 41.27% of the ROE is
influenced by firm size. The findings further confirm that the regression model of ROE
on firm size index is positive and significant with a coefficient of (β= 0.021, p=0.012)
supported by F=21.61. This implies that there exist a positive significant relationship
between firm size and ROE since the coefficient value was positive and the p-value was
0.012 that is less than 0.05. This means that a unitary improvement in firm size leads to
an improvement in ROE by 0.021 units holding other factors constant. These findings
agreed with that of Mahfoudh (2013) who found that firm size were positively related to
firm financial performance. These findings also agreed with that of Njoroge (2014)
whose study indicated that firm size were positively related to financial performance.
4.6.9 Multiple Regression of Firm Level Factors on ROA
An overall regression analysis was conducted between firm level factors that included
leverage, liquidity, asset tangibility and firm size on the dependent variable that was
ROA. According to Rencher and Schaalje (2009), regression analysis is a statistical
process of estimating the relationship among variables. It includes many techniques for
modeling and analyzing several variables, when the focus is on the relationship between
a dependent and one or more independent variables. More specifically, regression
analysis helps one to understand how the typical value of the dependent variable changes
when any one of the independent variable is varied, while the other independent
variables are held fixed (Mugenda & Mugenda, 2010). In addition, Wan (2013) contends
that regression analysis helps in generating an equation that describes the statistical
relationship between one or more predictor variables and the response variable.
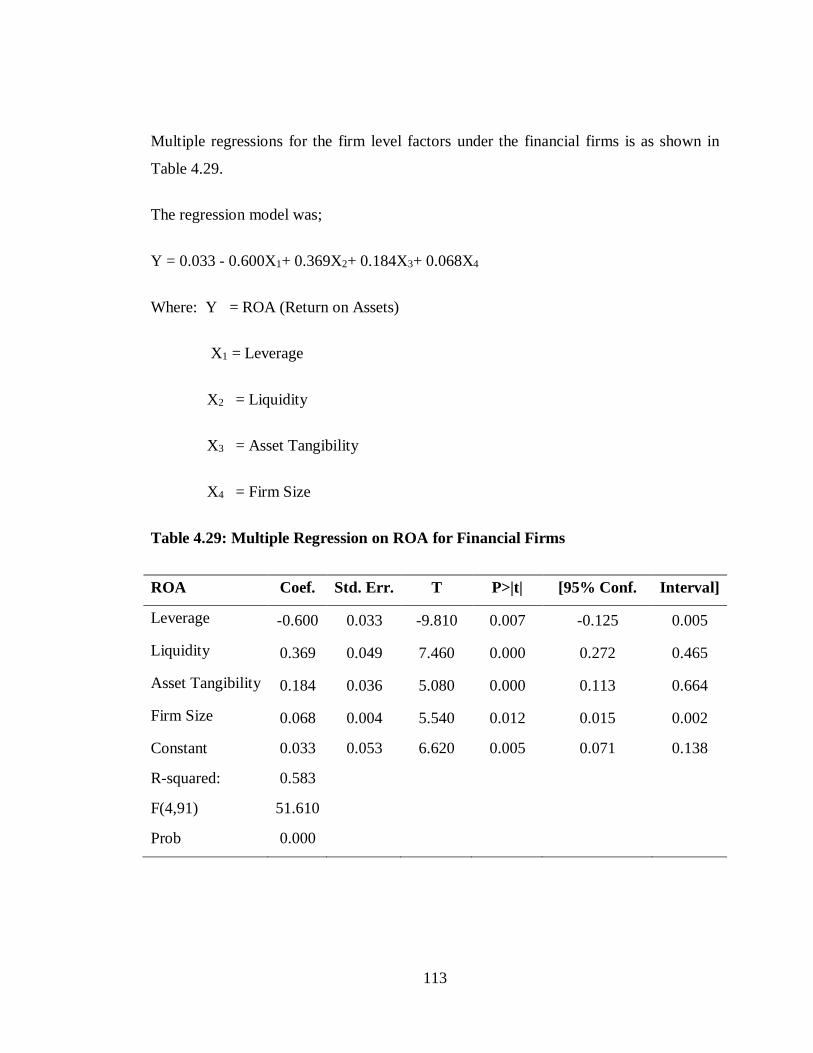
113
Multiple regressions for the firm level factors under the financial firms is as shown in
Table 4.29.
The regression model was;
Y = 0.033 - 0.600X1+ 0.369X2+ 0.184X3+ 0.068X4
Where: Y = ROA (Return on Assets)
X1 = Leverage
X2 = Liquidity
X3 = Asset Tangibility
X4 = Firm Size
Table 4.29: Multiple Regression on ROA for Financial Firms
ROA Coef. Std. Err. T P>|t| [95% Conf. Interval]
Leverage -0.600 0.033 -9.810 0.007 -0.125 0.005
Liquidity 0.369 0.049 7.460 0.000 0.272 0.465
Asset Tangibility 0.184 0.036 5.080 0.000 0.113 0.664
Firm Size 0.068 0.004 5.540 0.012 0.015 0.002
Constant 0.033 0.053 6.620 0.005 0.071 0.138
R-squared: 0.583
F(4,91) 51.610
Prob 0.000
114
The R squared was used to check how well the model fitted the data. The study was
supported by coefficient of determination R square of 0.583. This means that leverage,
liquidity, asset tangibility and firm size explain 58.3% of the variations in the dependent
variable that is ROA. The results revealed that there was a negative and significant
relationship between leverage and ROA (β =-0.600, p=0.007). This was supported by a
calculated t-statistic of 9.810 that is larger than the critical t-statistic of 1.96. Thaddeus
and Chigbu (2012) studied the effect of financial leverage on bank performance using
six banks from Nigeria. The findings showed mixed results. While some banks reported
positive relationship between leverage and performance, others revealed negative
relationship between leverage and performance. The findings disagree with that of
Wainaina (2014) who found a positive relationship between leverage (debt equity ratio)
and financial performance.
There was a positive and significant relationship between liquidity and ROA (β =0.369,
p=0.000). This was supported by a calculated t-statistic of 7.460 that is larger than the
critical t-statistic of 1.96. The findings are in agreement with that of Maaka (2013) who
found that there was positive correlation coefficient between return on assets and
customer deposits, cash balance and size of firm though a weak positive correlation
between return on assets and liquidity gap existed. Further, the findings agreed with that
of Alshatti (2015) who concluded that, there is an effect of the liquidity management on
profitability as measured by ROE or ROA. The findings also concurred with that of
Njure (2014) who established a significant positive relationship between liquidity and
profitability of nonfinancial companies quoted on Nairobi Securities Exchange.
Further, the results revealed that there was a positive and significant relationship
between asset tangibility and ROA (β =0.184, p=0.000). This was supported by a
calculated t-statistic of 5.080 that is larger than the critical t-statistic of 1.96. This
implied that an increase in asset tangibility would result to an increase in ROA. These
findings agreed with that of Campello (2006) who found out that asset tangibility
positively affects corporate performance under external financing.
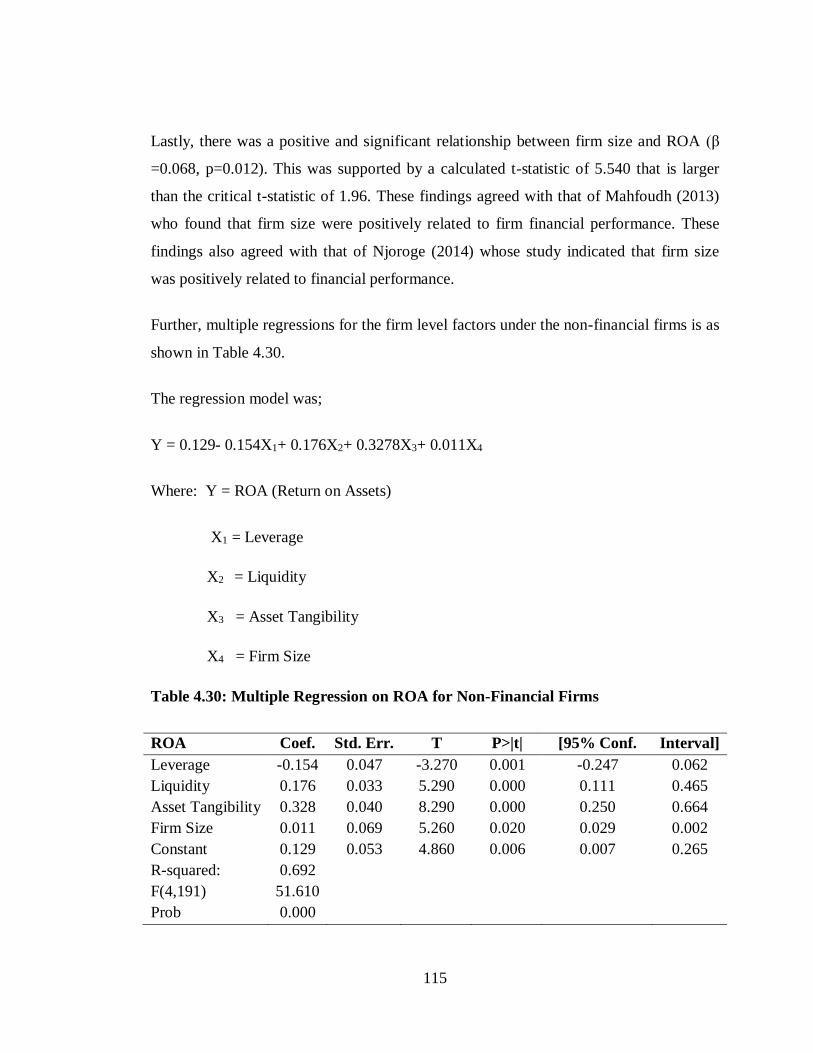
115
Lastly, there was a positive and significant relationship between firm size and ROA (β
=0.068, p=0.012). This was supported by a calculated t-statistic of 5.540 that is larger
than the critical t-statistic of 1.96. These findings agreed with that of Mahfoudh (2013)
who found that firm size were positively related to firm financial performance. These
findings also agreed with that of Njoroge (2014) whose study indicated that firm size
was positively related to financial performance.
Further, multiple regressions for the firm level factors under the non-financial firms is as
shown in Table 4.30.
The regression model was;
Y = 0.129- 0.154X1+ 0.176X2+ 0.3278X3+ 0.011X4
Where: Y = ROA (Return on Assets)
X1 = Leverage
X2 = Liquidity
X3 = Asset Tangibility
X4 = Firm Size
Table 4.30: Multiple Regression on ROA for Non-Financial Firms
ROA Coef. Std. Err. T P>|t| [95% Conf. Interval]
Leverage -0.154 0.047 -3.270 0.001 -0.247 0.062
Liquidity 0.176 0.033 5.290 0.000 0.111 0.465
Asset Tangibility 0.328 0.040 8.290 0.000 0.250 0.664
Firm Size 0.011 0.069 5.260 0.020 0.029 0.002
Constant 0.129 0.053 4.860 0.006 0.007 0.265
R-squared: 0.692
F(4,191) 51.610
Prob 0.000
116
The R squared was used to check how well the model fitted the data. The study was
supported by coefficient of determination R square of 0.692. This means that leverage,
liquidity, asset tangibility and firm size explain 69.2% of the variations in the dependent
variable that is ROA. The results revealed that there was a negative and significant
relationship between leverage and ROA (β =-0.154, p=0.001). This was supported by a
calculated t-statistic of 3.27 that is larger than the critical t-statistic of 1.96. These
findings disagreed with that of Ali (2014) who found a positive insignificant relationship
between financial leverage and firm performance while the older firms showed an
increase in its market value; this is an indication of investors’ confidence on the older
firms who have built their reputation over a long period. There was a positive and
significant relationship between liquidity and ROA (β =0.1757, p=0.000). This was
supported by a calculated t-statistic of 5.29 that is larger than the critical t-statistic of
1.96. These findings agreed with that of Sanghani (2014) who found that an increase in
debt to equity ratio positively affects the financial performance of non-financial
companies listed at the NSE. These findings further agreed with that of Njure (2014)
who established a significant positive relationship between liquidity and profitability of
non-financial companies quoted on Nairobi Securities Exchange.
Further, the results revealed that there was a positive and significant relationship
between asset tangibility and ROA (β =0.328, p=0.000). This was supported by a
calculated t-statistic of 8.29 that is larger than the critical t-statistic of 1.96. These
findings agreed with that of Campello (2006) who found out that asset tangibility
positively affects corporate performance under external financing. Lastly, there was a
positive and significant relationship between firm size and ROA (β =0.011, p=0.020).
This was supported by a calculated t-statistic of 5.26 that is larger than the critical t-
statistic of 1.96. These findings agreed with that of Mahfoudh (2013) who found out that
firm size was positively related to firm financial performance. These findings also
agreed with that of Njoroge (2014) whose study indicated that firm size was positively
related to financial performance.
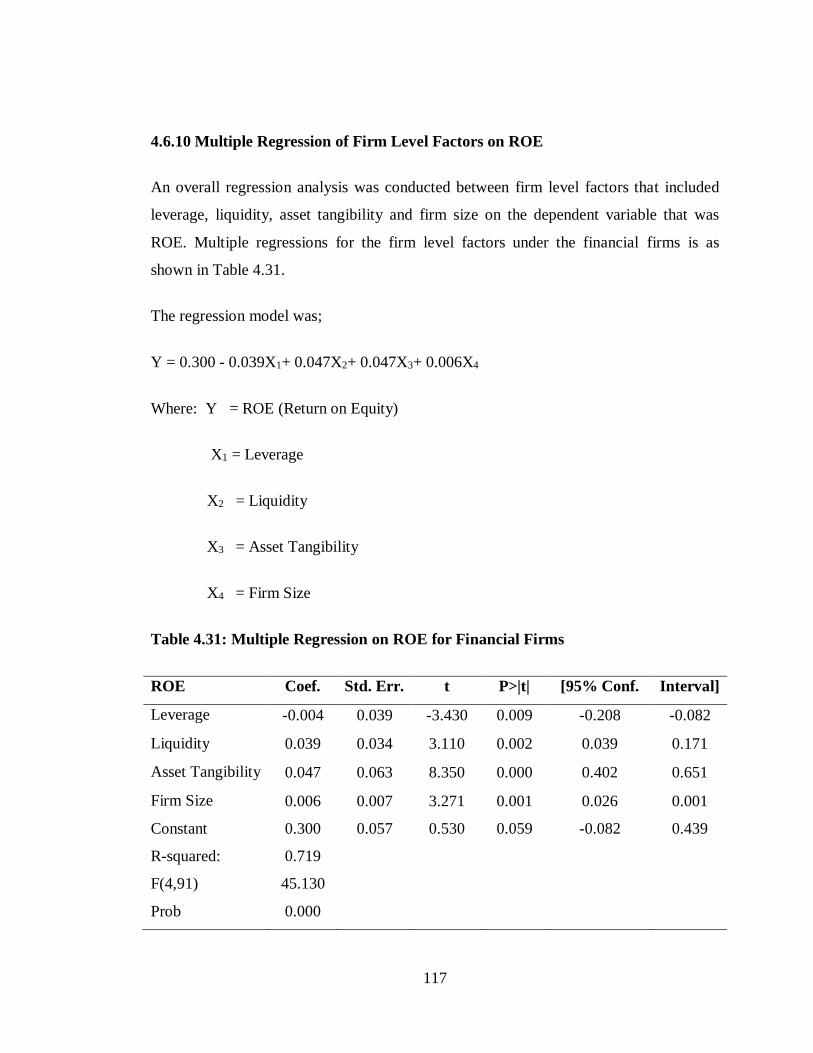
117
4.6.10 Multiple Regression of Firm Level Factors on ROE
An overall regression analysis was conducted between firm level factors that included
leverage, liquidity, asset tangibility and firm size on the dependent variable that was
ROE. Multiple regressions for the firm level factors under the financial firms is as
shown in Table 4.31.
The regression model was;
Y = 0.300 - 0.039X1+ 0.047X2+ 0.047X3+ 0.006X4
Where: Y = ROE (Return on Equity)
X1 = Leverage
X2 = Liquidity
X3 = Asset Tangibility
X4 = Firm Size
Table 4.31: Multiple Regression on ROE for Financial Firms
ROE Coef. Std. Err. t P>|t| [95% Conf. Interval]
Leverage -0.004 0.039 -3.430 0.009 -0.208 -0.082
Liquidity 0.039 0.034 3.110 0.002 0.039 0.171
Asset Tangibility 0.047 0.063 8.350 0.000 0.402 0.651
Firm Size 0.006 0.007 3.271 0.001 0.026 0.001
Constant 0.300 0.057 0.530 0.059 -0.082 0.439
R-squared: 0.719
F(4,91) 45.130
Prob 0.000
118
The R squared was used to check how well the model fitted the data. The study was
supported by coefficient of determination R square of 0.719. This means that leverage,
liquidity, asset tangibility and firm size explain 71.9% of the variations in the dependent
variable that is ROE.
The results further revealed that there was a negative and significant relationship
between leverage and ROE (β =-0.004, p=0.009). This was supported by a calculated t-
statistic of 3.43 that is larger than the critical t-statistic of 1.96. These findings agreed
with that of Al-Tally (2014) who found that financial leverage had a significant effect on
performance. The findings also agreed with that of Perinpanatha (2014) whose study
showed a negative relationship between the financial leverage and the financial
performance of the John Keells Holdings plc. In addition Perinpanatha (2014) found that
financial leverage had a significant impact on the financial performance of the John
Keells Holdings plc in Sri Lanka. These findings disagreed with that of Ali (2014) who
found a positive insignificant relationship between financial leverage and firm
performance while the older firms showed an increase in its market value; this is an
indication of investors’ confidence on the older firms who have built their reputation
over a long period.
There was a positive and significant relationship between liquidity and ROE (β =0.040,
p=0.002). This was supported by a calculated t-statistic of 3.110 that is larger than the
critical t-statistic of 1.96. These findings agreed with that of Omesa (2015) a weak
relationship between liquidity and financial performance. The findings also agreed with
that of Njeri (2014) whose findings revealed that there is a positive relationship between
liquidity and financial performance.
Further, the results revealed that there was a positive and significant relationship
between asset tangibility and ROE (β =0.047, p=0.000). This was supported by a
calculated t-statistic of 8.350 that is larger than the critical t-statistic of 1.96. These
findings agreed with that of Campello (2006) conducted who found that asset tangibility
positively affects corporate performance under external financing.
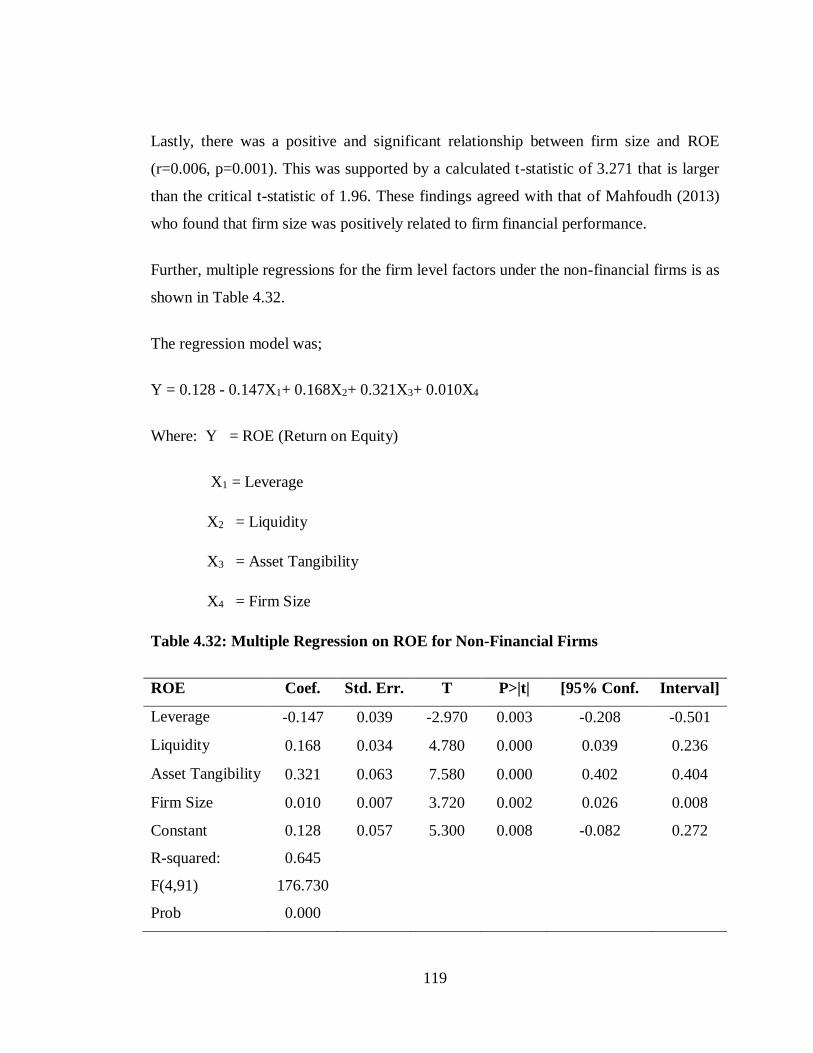
119
Lastly, there was a positive and significant relationship between firm size and ROE
(r=0.006, p=0.001). This was supported by a calculated t-statistic of 3.271 that is larger
than the critical t-statistic of 1.96. These findings agreed with that of Mahfoudh (2013)
who found that firm size was positively related to firm financial performance.
Further, multiple regressions for the firm level factors under the non-financial firms is as
shown in Table 4.32.
The regression model was;
Y = 0.128 - 0.147X1+ 0.168X2+ 0.321X3+ 0.010X4
Where: Y = ROE (Return on Equity)
X1 = Leverage
X2 = Liquidity
X3 = Asset Tangibility
X4 = Firm Size
Table 4.32: Multiple Regression on ROE for Non-Financial Firms
ROE Coef. Std. Err. T P>|t| [95% Conf. Interval]
Leverage -0.147 0.039 -2.970 0.003 -0.208 -0.501
Liquidity 0.168 0.034 4.780 0.000 0.039 0.236
Asset Tangibility 0.321 0.063 7.580 0.000 0.402 0.404
Firm Size 0.010 0.007 3.720 0.002 0.026 0.008
Constant 0.128 0.057 5.300 0.008 -0.082 0.272
R-squared: 0.645
F(4,91) 176.730
Prob 0.000
120
The R squared was used to check how well the model fitted the data. The study was
supported by coefficient of determination R square of 0.645. This means that leverage,
liquidity, asset tangibility and firm size explain 64.48% of the variations in the
dependent variable that is ROE.
The results further revealed that there was a negative and significant relationship
between leverage and ROE (β =-0.147, p=0.003). This was supported by a calculated t-
statistic of 2.97 that is larger than the critical t-statistic of 1.96. These findings agreed
with that of Al-Tally (2014) who found that financial leverage had a significant effect on
performance. The findings also agreed with that of Perinpanatha (2014) whose study
showed a negative relationship between the financial leverage and the financial
performance of the John Keells Holdings plc. In addition Perinpanatha (2014) found that
financial leverage had a significant impact on the financial performance of the John
Keells Holdings plc in Sri Lanka. There was a positive and significant relationship
between liquidity and ROE (β =0.168, p=0.000). This was supported by a calculated t-
statistic of 4.78 that is larger than the critical t-statistic of 1.96. These findings agreed
with that of Sanghani (2014) who revealed that liquidity positively affect the financial
performance of non-financial companies listed at the NSE. The study established that
current ratio positively affects the financial performance of non-financial companies
listed at the NSE. The findings also concurred with that of Khidmat and Rehman (2014)
who concluded that liquidity ratio affects ROA positively while it impacts negatively on
solvency. Further, the results revealed that there was a positive and significant
relationship between asset tangibility and ROE (β =0.321, p=0.000). This was supported
by a calculated t-statistic of 7.58 that is larger than the critical t-statistic of 1.96. These
findings agreed with that of Sanyal and Mann (2010) who found that start-ups with more
tangible assets as potential collateral are more likely to use external debt in the financial
structure, since these assets have a high liquidation value. The findings also agreed with
that of Psillaki and Daskalakis (2008) who argued that the costs of financial distress
depend on the types of assets that a firm employs. If a firm retains large investments in
land, equipment and other tangible assets, it will have smaller costs of financial distress
121
than a firm that relies on intangible assets. Thus, firms with more tangible assets should
issue more debt. Lastly, there was a positive and significant relationship between firm
size and ROE (r=0.0100, p=0.002). This was supported by a calculated t-statistic of 3.72
that is larger than the critical t-statistic of 1.96. These findings agreed with that of
Mahfoudh (2013) who found that firm size were positively related to firm financial
performance. These findings also agreed with that of Njoroge (2014) whose study
indicated that firm size were positively related to financial performance.
4.6.11 Moderation Effect of Firm Age on ROA
The objective was to establish the moderating effect of firm age on the relationship
between firm level factors and ROA of listed firms in the Nairobi securities exchange.
Each of the independent variables was moderated by the variable firm age. Results for
the financial firms are presented in Table 4.33.
Y = 0.124– 0.025X1 *M + 0.004X2*M + 0.004X3*M + 0.006X4*M
Where: Y = ROA (Return on Asset)
X1 = Leverage
X2 = Liquidity
X3 = Asset Tangibility
X4 = Firm Size
M = Firm Age (Moderator)
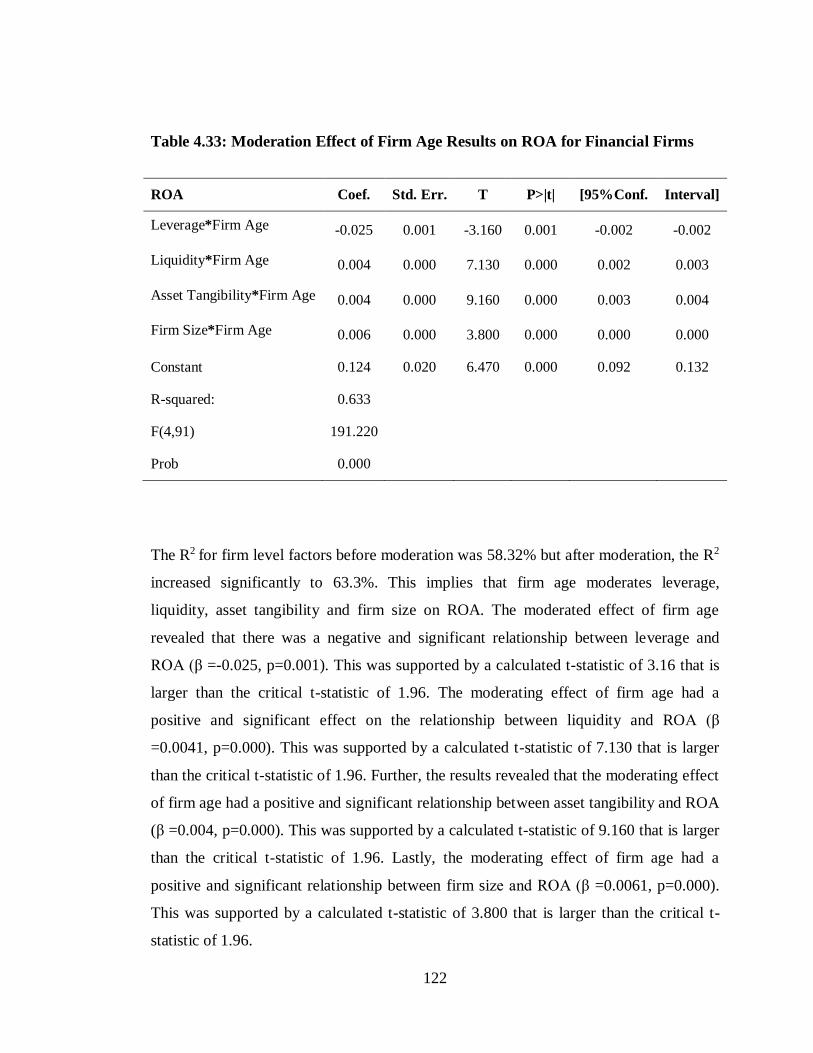
122
Table 4.33: Moderation Effect of Firm Age Results on ROA for Financial Firms
ROA Coef. Std. Err. T P>|t| [95%Conf. Interval]
Leverage*Firm Age -0.025 0.001 -3.160 0.001 -0.002 -0.002
Liquidity*Firm Age 0.004 0.000 7.130 0.000 0.002 0.003
Asset Tangibility*Firm Age 0.004 0.000 9.160 0.000 0.003 0.004
Firm Size*Firm Age 0.006 0.000 3.800 0.000 0.000 0.000
Constant 0.124 0.020 6.470 0.000 0.092 0.132
R-squared: 0.633
F(4,91) 191.220
Prob 0.000
The R2 for firm level factors before moderation was 58.32% but after moderation, the R2
increased significantly to 63.3%. This implies that firm age moderates leverage,
liquidity, asset tangibility and firm size on ROA. The moderated effect of firm age
revealed that there was a negative and significant relationship between leverage and
ROA (β =-0.025, p=0.001). This was supported by a calculated t-statistic of 3.16 that is
larger than the critical t-statistic of 1.96. The moderating effect of firm age had a
positive and significant effect on the relationship between liquidity and ROA (β
=0.0041, p=0.000). This was supported by a calculated t-statistic of 7.130 that is larger
than the critical t-statistic of 1.96. Further, the results revealed that the moderating effect
of firm age had a positive and significant relationship between asset tangibility and ROA
(β =0.004, p=0.000). This was supported by a calculated t-statistic of 9.160 that is larger
than the critical t-statistic of 1.96. Lastly, the moderating effect of firm age had a
positive and significant relationship between firm size and ROA (β =0.0061, p=0.000).
This was supported by a calculated t-statistic of 3.800 that is larger than the critical t-
statistic of 1.96.
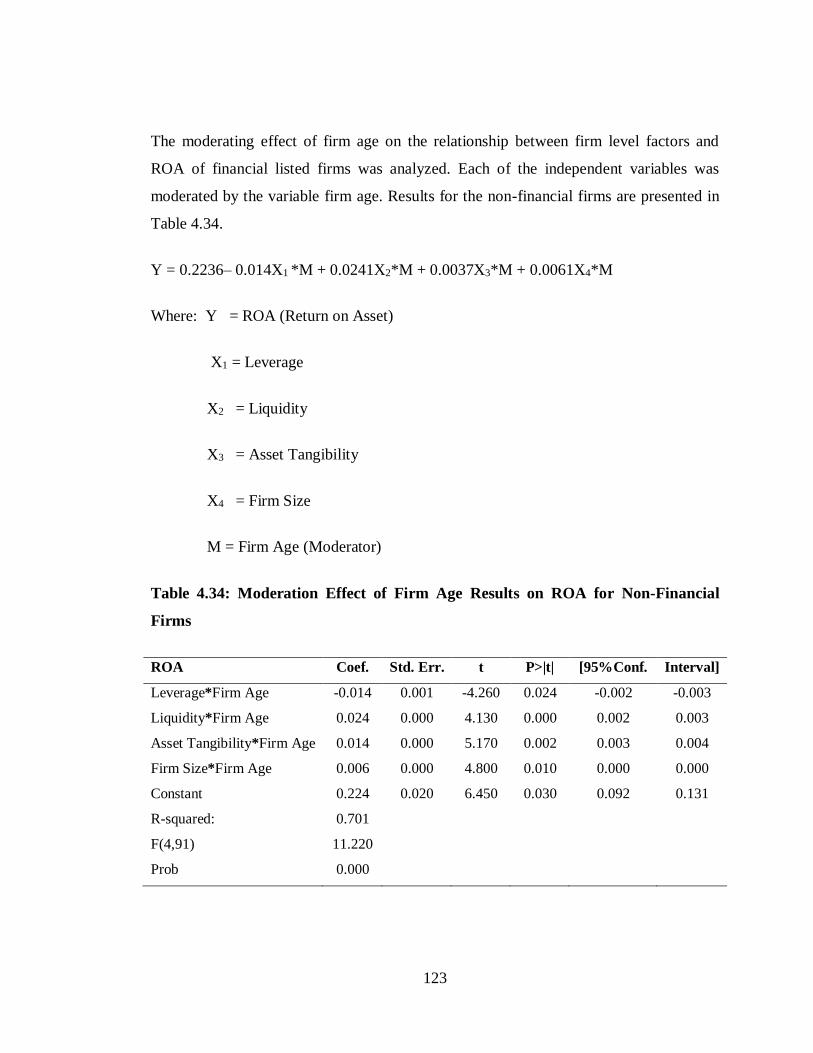
123
The moderating effect of firm age on the relationship between firm level factors and
ROA of financial listed firms was analyzed. Each of the independent variables was
moderated by the variable firm age. Results for the non-financial firms are presented in
Table 4.34.
Y = 0.2236– 0.014X1 *M + 0.0241X2*M + 0.0037X3*M + 0.0061X4*M
Where: Y = ROA (Return on Asset)
X1 = Leverage
X2 = Liquidity
X3 = Asset Tangibility
X4 = Firm Size
M = Firm Age (Moderator)
Table 4.34: Moderation Effect of Firm Age Results on ROA for Non-Financial
Firms
ROA Coef. Std. Err. t P>|t| [95%Conf. Interval]
Leverage*Firm Age -0.014 0.001 -4.260 0.024 -0.002 -0.003
Liquidity*Firm Age 0.024 0.000 4.130 0.000 0.002 0.003
Asset Tangibility*Firm Age 0.014 0.000 5.170 0.002 0.003 0.004
Firm Size*Firm Age 0.006 0.000 4.800 0.010 0.000 0.000
Constant 0.224 0.020 6.450 0.030 0.092 0.131
R-squared: 0.701
F(4,91) 11.220
Prob 0.000
124
The R2 for firm level factors before moderation was 69.2% but after moderation, the R2
increased significantly to 70.1%. This implies that firm age moderates leverage,
liquidity, asset tangibility and firm size on ROA. The moderated effect of firm age
revealed that there was a negative and significant relationship between leverage and
ROA (β =-0.014, p=0.024). This was supported by a calculated t-statistic of 4.26 that is
larger than the critical t-statistic of 1.96. The moderating effect of firm age had a
positive and significant effect on the relationship between liquidity and ROA (β =0. 024,
p=0.000). This was supported by a calculated t-statistic of 4.130 that is larger than the
critical t-statistic of 1.96. Further, the results revealed that the moderating effect of firm
age had a positive and significant relationship between asset tangibility and ROA (β =0.
014, p=0.002). This was supported by a calculated t-statistic of 5.17 that is larger than
the critical t-statistic of 1.96. Lastly, the moderating effect of firm age had a positive and
significant relationship between firm size and ROA (β =0.006, p=0.010). This was
supported by a calculated t-statistic of 4.800 that is larger than the critical t-statistic of
1.96. This is in agreement with Kaguri (2013), who indicate that the joint effect of size,
diversification, leverage, liquidity, age, premium growth and claim experience are
statistically significance to influencing financial performance of life insurance
companies as indicated by the positive and strong Pearson correlation coefficients. This
implies that premium growth is relied upon to make conclusions about the financial
performance of life insurance companies’ as shown by its strong and positive correlation
coefficients.
4.6.12 Moderation Effect of Firm Age on ROE
The objective was to establish the moderating effect of firm size on the relationship
between firm level factors and ROE of listed firms in the Nairobi securities exchange.
Each of the independent variables was moderated by the variable firm age. Results for
the financial firms are presented in Table 4.35.
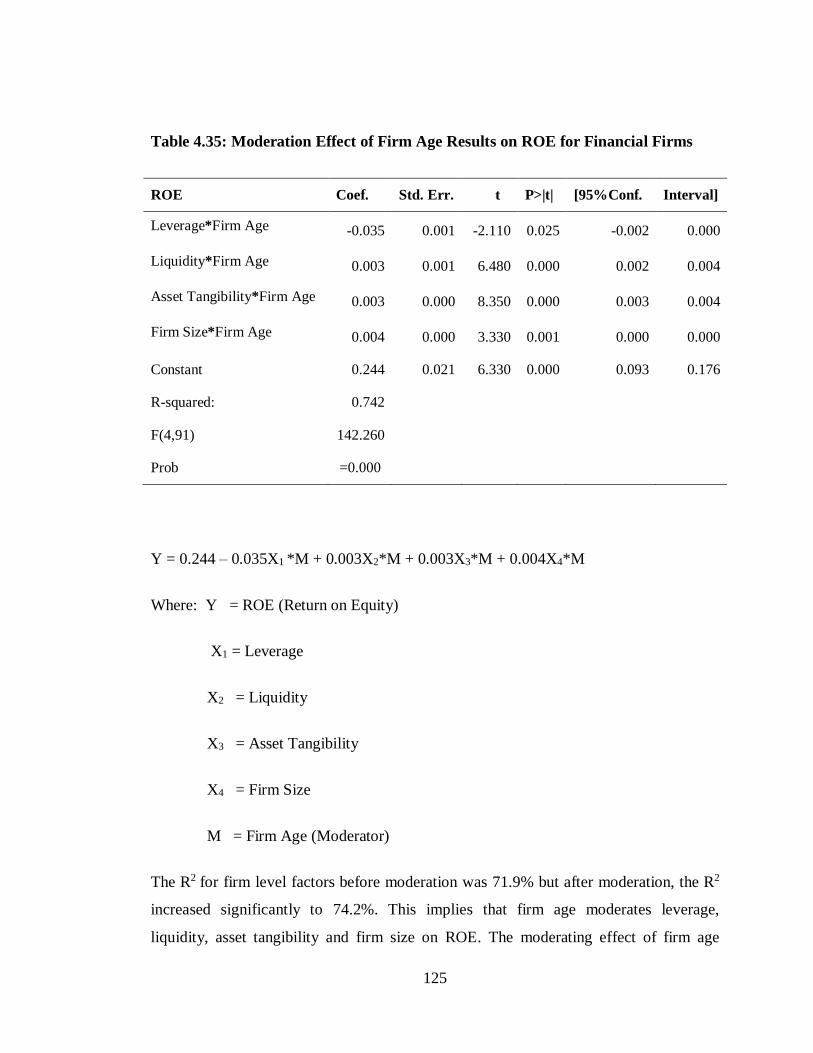
125
Table 4.35: Moderation Effect of Firm Age Results on ROE for Financial Firms
ROE Coef. Std. Err. t P>|t| [95%Conf. Interval]
Leverage*Firm Age -0.035 0.001 -2.110 0.025 -0.002 0.000
Liquidity*Firm Age 0.003 0.001 6.480 0.000 0.002 0.004
Asset Tangibility*Firm Age 0.003 0.000 8.350 0.000 0.003 0.004
Firm Size*Firm Age 0.004 0.000 3.330 0.001 0.000 0.000
Constant 0.244 0.021 6.330 0.000 0.093 0.176
R-squared: 0.742
F(4,91) 142.260
Prob =0.000
Y = 0.244 – 0.035X1 *M + 0.003X2*M + 0.003X3*M + 0.004X4*M
Where: Y = ROE (Return on Equity)
X1 = Leverage
X2 = Liquidity
X3 = Asset Tangibility
X4 = Firm Size
M = Firm Age (Moderator)
The R2 for firm level factors before moderation was 71.9% but after moderation, the R2
increased significantly to 74.2%. This implies that firm age moderates leverage,
liquidity, asset tangibility and firm size on ROE. The moderating effect of firm age
126
revealed that there was a negative and significant relationship between leverage and
ROE (β =-0.035, p=0.025). This was supported by a calculated t-statistic of 2.110 that is
larger than the critical t-statistic of 1.96. The moderating effect of firm age had a
positive and significant on the relationship between liquidity and ROE (β =0.003,
p=0.000). This was supported by a calculated t-statistic of 6.48 that is larger than the
critical t-statistic of 1.96. Further, the results revealed that the moderating effect of firm
age had a positive and significant relationship between asset tangibility and ROE (β
=0.003, p=0.000). This was supported by a calculated t-statistic of 8.35 that is larger
than the critical t-statistic of 1.96. Lastly, the moderating effect of firm age had a
positive and significant relationship between firm size and ROE (β =0.0002, p=0.001).
This was supported by a calculated t-statistic of 3.330 that is larger than the critical t-
statistic of 1.96.
These findings agreed with that of Pervan, Pervan and Ćurak (2017) who found that age
negatively affects firm’s performance. As firms get older, benefits of their accumulated
knowledge in all crucial aspects of the business (technology, supply channels, customers
relations, human capital and financing costs) become overcome with their inertia,
inflexibility and osseous by accumulated rules, routines and organizational structure.
These findings also agreed with that of Kaguri (2013) who indicated that joint effect of
variables are statistically significance to influencing financial performance of life
insurance companies as indicated by the positive and strong Pearson correlation
coefficients. The moderating effect of firm age on the relationship between firm level
factors and ROE of non-financial listed firms was analyzed. Each of the independent
variables was moderated by the variable firm age. Results for the non-financial firms are
presented in Table 4.36.
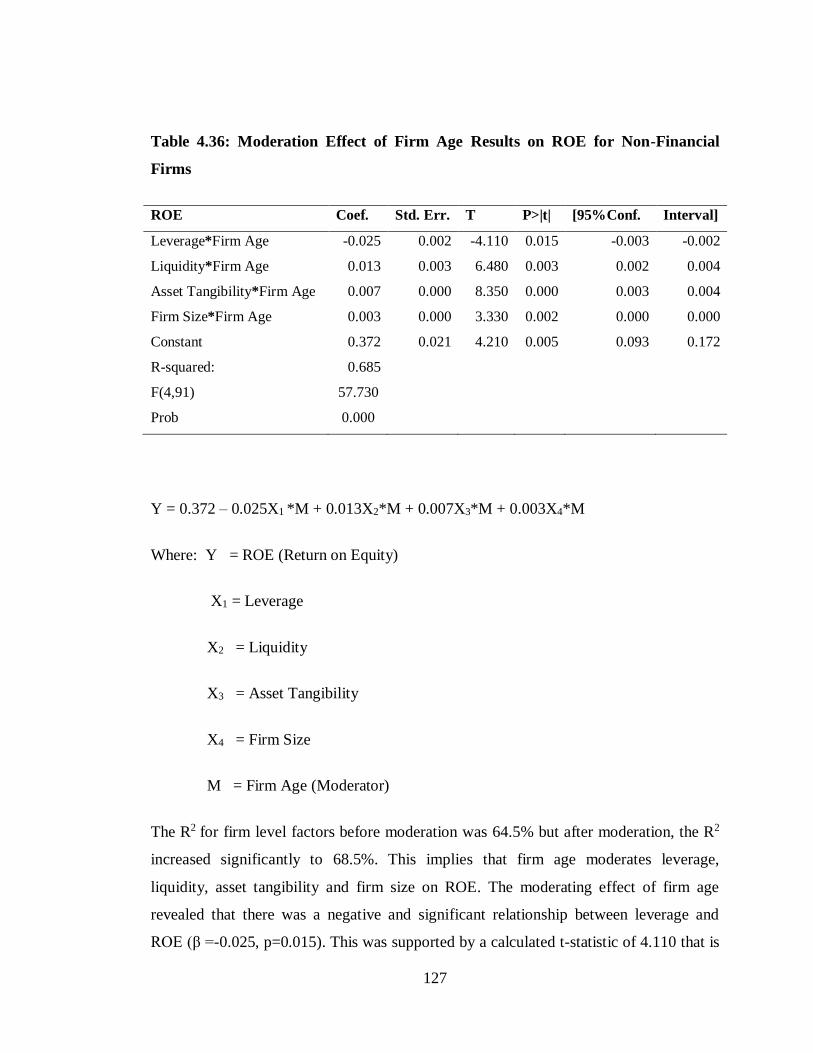
127
Table 4.36: Moderation Effect of Firm Age Results on ROE for Non-Financial
Firms
ROE Coef. Std. Err. T P>|t| [95%Conf. Interval]
Leverage*Firm Age -0.025 0.002 -4.110 0.015 -0.003 -0.002
Liquidity*Firm Age 0.013 0.003 6.480 0.003 0.002 0.004
Asset Tangibility*Firm Age 0.007 0.000 8.350 0.000 0.003 0.004
Firm Size*Firm Age 0.003 0.000 3.330 0.002 0.000 0.000
Constant 0.372 0.021 4.210 0.005 0.093 0.172
R-squared: 0.685
F(4,91) 57.730
Prob 0.000
Y = 0.372 – 0.025X1 *M + 0.013X2*M + 0.007X3*M + 0.003X4*M
Where: Y = ROE (Return on Equity)
X1 = Leverage
X2 = Liquidity
X3 = Asset Tangibility
X4 = Firm Size
M = Firm Age (Moderator)
The R2 for firm level factors before moderation was 64.5% but after moderation, the R2
increased significantly to 68.5%. This implies that firm age moderates leverage,
liquidity, asset tangibility and firm size on ROE. The moderating effect of firm age
revealed that there was a negative and significant relationship between leverage and
ROE (β =-0.025, p=0.015). This was supported by a calculated t-statistic of 4.110 that is

128
larger than the critical t-statistic of 1.96. The moderating effect of firm age had a
positive and significant on the relationship between liquidity and ROE (β =0.013,
p=0.003). This was supported by a calculated t-statistic of 6.480 that is larger than the
critical t-statistic of 1.96. Further, the results revealed that the moderating effect of firm
age had a positive and significant relationship between asset tangibility and ROE (β
=0.007, p=0.000). This was supported by a calculated t-statistic of 8.35 that is larger
than the critical t-statistic of 1.96. Lastly, the moderating effect of firm age had a
positive and significant relationship between firm size and ROE (β =0.003, p=0.002).
This was supported by a calculated t-statistic of 3.33 that is larger than the critical t-
statistic of 1.96. These findings agreed with that of Liargovas and Skandalis (2008) who
stated that older firms are prone to inertia, and the bureaucratic ossification that goes
along with age; they might have developed routines, which are out of touch with
changes in market conditions, in which case an inverse relationship between age and
profitability or growth could be observed. In addition, newer and smaller firms, as a
result, take away market share in spite of disadvantages like lack of capital, brand names
and corporate reputation with older firms.
4.7 Hypotheses Testing
Hypotheses were tested using multiple linear regression analysis as represented in Table
4.29, 4.30, 4.31 and 4.32.
4.7.1 Objective One
The first hypothesis to be tested was:
H01: Leverage has no significant effect on financial performance of listed firms in
the Nairobi securities exchange.
The hypothesis was tested by using multiple linear regression and determined using p-
value. The acceptance/rejection criterion was that, if the p value is less than 0.05, we
reject the H01 but if it is more than 0.05, the Ho1 is not rejected. The results in Table
129
4.29, 4.30, 4.31 and 4.32 for ROA and ROE indicate that leverage had a negative and
significant relationship on ROA for financial and non-financial firms respectively (β= -
0.600, 0.007; β= -0.1542, 0.001) and ROE for financial and non-financial firms
respectively (β =-0.004, 0.009, β =-0.147, 0.003). The null hypothesis was therefore
rejected. The study therefore adopted the alternative hypothesis that leverage has a
significant effect on financial performance of listed firms in the Nairobi securities
exchange. These findings agreed with that of Al-Tally (2014) who found that financial
leverage had a significant effect on performance. The findings also agreed with that of
Perinpanatha (2014) whose study showed a negative relationship between the financial
leverage and the financial performance of the John Keells Holdings plc. In addition
Perinpanatha (2014) found that financial leverage had a significant impact on the
financial performance of the John Keells Holdings plc in Sri Lanka.
4.7.2 Objective Two
The second hypothesis to be tested was:
H02: Liquidity has no significant effect on financial performance of listed firms in
the Nairobi securities exchange.
The hypothesis was tested by using multiple linear regression and determined using p-
value. The acceptance/rejection criterion was that, if the p value is less than 0.05, we
reject the H02 but if it is more than 0.05, the Ho2 is not rejected. The results in Table
4.29, 4.30, 4.31 and 4.32 for ROA and ROE in financial and for financial firms indicate
that liquidity had a positive and significant relationship on ROA for financial and non-
financial firms respectively (β =0.3685, 0.000; β =0.1757, 0.000) and ROE for financial
and non-financial firms respectively (β =0.0393, 0.002; β = 0.1676, 0.000). The null
hypothesis was therefore rejected. The study therefore adopted the alternative hypothesis
that liquidity has significant effect on financial performance of listed firms in the
Nairobi securities exchange. These findings agreed with that of Omesa (2015)who
established a weak relationship between liquidity and financial performance. The
130
findings also agreed with that of Njeri (2014) whose findings revealed that there is a
positive relationship between liquidity and financial performance.
4.7.3 Objective Three
The third hypothesis to be tested was:
H03: Asset Tangibility has no significant effect on financial performance of listed
firms in the Nairobi securities exchange.
The hypothesis was tested by using multiple linear regression and determined using p-
value. The acceptance/rejection criterion was that, if the p value is less than 0.05, we
reject the H03 but if it is more than 0.05, the Ho3 is not rejected. The results in Table
4.29, 4.30, 4.31 and 4.32 for ROA and ROE in financial and for financial firms indicate
that asset tangibility had a positive and significant relationship on ROA for financial and
non-financial firms respectively (β=0.1838, 0.000; β=0.328, 0.000) and ROE for
financial and non-financial firms respectively (β=0.0472, 0.000; β=0.321, 0.000). The
null hypothesis was therefore rejected. The study therefore adopted the alternative
hypothesis that asset tangibility has a significant effect on financial performance of
listed firms in the Nairobi Securities Exchange. These findings agreed with that of
Omesa (2015) who found a weak relationship between liquidity and financial
performance. The findings also agreed with that of Njeri (2014) whose findings revealed
that there is a positive relationship between liquidity and financial performance.
131
4.7.4 Objective Four
The fourth hypothesis to be tested was:
H04: Firm Size has no significant effect on financial performance of listed firms in
the Nairobi securities exchange.
The hypothesis was tested by using multiple linear regression and determined using p-
value. The acceptance/rejection criterion was that, if the p value is less than 0.05, we
reject the H04 but if it is more than 0.05, the Ho4 is not rejected. The results in Table
44.29, 4.30, 4.31 and 4.32 for ROA and ROE in financial and for financial firms indicate
that firm size had a positive and significant relationship on ROA for financial and non-
financial firms respectively (β =0.068, 0.012; β=0.011, 0.020) and ROE for financial and
non-financial firms respectively (β =0.006, 0.001; β=0.010, 0.002). The null hypothesis
was therefore rejected. The study therefore adopted the alternative hypothesis that firm
size has a significant effect on financial performance of listed firms in the Nairobi
securities exchange. These findings agreed with that of Mahfoudh (2013) who found that
firm size were positively related to firm financial performance. These findings also
agreed with that of Njoroge (2014) whose study indicated that firm size were positively
related to financial performance.
4.7.5 Objective Five
The fifth hypothesis to be tested was:
H05: Firm age does not moderate the relationship between the firm level factors and
financial performance of listed firms in the Nairobi securities exchange.
The hypothesis was tested by using multiple linear regression and determined using p-
value. The acceptance/rejection criterion was that, if the p value is less than 0.05, we
reject the H05 but if it is more than 0.05, the H05 is not rejected. Firm age had a negative
and significant moderating effect on the relationship between leverage and ROA for
132
financial and non-financial firms respectively at 0.001<0.05; 0.024<0.05 and ROE for
financial and non-financial firms at 0.025<0.05; 0.015<0.05. In addition, firm age had a
positive and significant moderating effect on the relationship between liquidity with
ROA for financial and non-financial firms at 0.000<0.05; 0.000<0.05 and ROE for
financial and non-financial firms respectively at 0.000<0.05; 0.003<0.05.
Firm age had a positive and significant moderating effect on the relationship between
asset tangibility with ROA for financial and non-financial firms respectively at
0.000<0.05; 0.002<0.05 and ROE for financial and non-financial firms respectively at
0.000<0.050; 0.002<0.050. Finally, firm age had a positive and significant moderating
effect on the relationship between firm size with ROA for financial and non-financial
firms respectively at 0.000<0.05; 0.010<0.05 and ROE for financial and non-financial
firms respectively at 0.001<0.050; 0.002<0.050.
Firm age as a moderator of firm level factors on ROA in financial firms improved R2
from 58.32% to 63.26%. Firm age as a moderator of firm level factors on ROA in non-
financial firms improved R2 from 69.19% to 70.12%. Further, Firm age as a moderator
of firm level factors on ROE in financial firms improved R2 from 71.91% to 74.16%.
Lastly, firm age as a moderator of firm level factors on ROE in non-financial firms
improved R2 from 64.48% to 68.47%. These findings agreed with that of Pervan,
Pervan and Ćurak (2017) who found that age negatively affects firm’s performance. As
firms get older, benefits of their accumulated knowledge in all crucial aspects of the
business (technology, supply channels, customers relations, human capital and financing
costs) become overcome with their inertia, inflexibility and osseous by accumulated
rules, routines and organizational structure.
133
4.8 Discussion of Key Findings
4.8.1 Effects of Leverage on Financial Performance
The first objective of the study was to determine the effect of leverage on financial
performance of listed firms in the Nairobi securities exchange. Regression of coefficient
results on financial firms revealed that there was a negative and significant relationship
between leverage and ROA (β=-0.600, p=0.007). The results on non-financial revealed
that there was a negative and significant relationship between leverage and ROA (β=-
0.154, p=0.001). Under ROE, Regression of coefficient results on financial firms further
revealed that there was a negative and significant relationship between leverage and
ROE (β =-0.004, p=0.009). The results further revealed that for non-financial there was
a negative and significant relationship between leverage and ROE (β =-0.147, p=0.003).
This means that a unitary increase in leverage leads to a reduction in financial
performance by 0.600 and 0.154 units for ROA in financial and non-financial firms
respectively and 0.004 and 0.147for ROE in financial and non-financial firms
respectively holding other factors constant.
This is in agreement with Ali (2014) who conducted a study on the impact of financial
leverage on firm performance: the case of non-financial firms in Kenya. The study took
performance measures in a wider perspective using ROA, ROE and Tobin’s Q. Findings
from the Tobin’s Q model indicated that large firms have a positive insignificant
relationship between financial leverage and firm performance while the older firms
showed an increase in its market value; this is an indication of investors’ confidence on
the older firms who have built their reputation over a long period.
4.8.2 Effects of Liquidity on Financial Performance
The second objective of the study was to determine the effect of liquidity on financial
performance of listed firms in the Nairobi securities exchange. Regression of coefficient
results revealed there was a positive and significant relationship between liquidity and
134
ROA for financial firms (β =0.369, p=0.000). This was supported by a calculated t-
statistic of 7.460 that is larger than the critical t-statistic of 1.96. There was a positive
and significant relationship between liquidity and ROA for nonfinancial firms (β =0.176,
p=0.000). This was supported by a calculated t-statistic of 7.460 that is larger than the
critical t-statistic of 1.96.
In ROE, there was a positive and significant relationship between liquidity and ROE for
financial firms (β =0.039, p=0.002). This was supported by a calculated t-statistic of
3.110 that is larger than the critical t-statistic of 1.96. There was a positive and
significant relationship between liquidity and ROE for non-financial firms (β=0.168,
p=0.000). This was supported by a calculated t-statistic of 4.78 that is larger than the
critical t-statistic of 1.96. This means that a unitary improvement in liquidity leads to an
improvement in financial performance by 0.3685 and 0.176 units in ROA for financial
and non-financial firms 0.039 and 0.168 in ROE for financial and non-financial firms
respectively holding other factors constant.
This is consistent with Sanghani (2014) who investigated the effect of liquidity on
financial performance of non-financial companies listed at the NSE. The study
established that current ratio positively affects the financial performance of non-
financial companies listed at the NSE. The study also revealed that an increase in
operating cash flow ratio positively affects the financial performance of non-financial
companies listed at the NSE. The study found that an increase in debt to equity
positively affects the financial performance of non-financial companies listed at the
NSE.
4.8.3 Effects of Asset Tangibility on Financial Performance
The third objective of the study was to determine the effect of asset tangibility on
financial performance of listed firms in the Nairobi securities exchange. Regression of
coefficient for results revealed that there was a positive and significant relationship
between asset tangibility and ROA for financial firms (β =0.184, p=0.000). This was
135
supported by a calculated t-statistic of 5.080 that is larger than the critical t-statistic of
1.96. The results further revealed that there was a positive and significant relationship
between asset tangibility and ROA for non-financial firms (β =0.328, p=0.000). This
was supported by a calculated t-statistic of 8.29 that is larger than the critical t-statistic
of 1.96.
Regression results showed that there was a positive and significant relationship between
asset tangibility and ROE for financial firms (β =0.047, p=0.000). This was supported by
a calculated t-statistic of 8.350 that is larger than the critical t-statistic of 1.96. Further,
results revealed that there was a positive and significant relationship between asset
tangibility and ROE for non-financial firms (β =0.321, p=0.000). This was supported by
a calculated t-statistic of 7.58 that is larger than the critical t-statistic of 1.96. This means
that a unitary improvement in asset tangibility leads to an improvement in financial
performance by 0.1838 and 0.328 units in ROA in financial and non-financial firms
respectively and 0.047, 0.321 in ROE for financial and non-financial firms respectively
holding other factors constant.
This in agreement with Harc (2015) conducted a study on the relationship between
tangible assets and capital structure of small and medium-sized companies in Croatia.
The study found out that the relationship between tangible assets and long-term leverage
is positive in all observed years and statistically significant. The results show that small
and medium-sized companies use their collateral to attract long-term debt, which means
that small and medium-sized companies use lower costs and the interest rate of long-
term debt in relation to short-term debt. These findings correspond with the maturity
matching principle, according to which long-term assets are financed with long-term
financing and short-term assets are financed with short-term funds. These findings are
consistent with the trade-off theory, which predicts a positive relation between leverage
and tangibility, but also with the pecking order theory, which is generally interpreted as
predicting a negative relation between leverage and tangibility.
136
4.8.4 Effects of Firm Size on Financial Performance
The fourth objective of the study was to determine the effect of firm size on financial
performance of listed firms in the Nairobi securities exchange. Regression of coefficient
revealed there was a positive and significant relationship between firm size and ROA for
financial firms (β =0.068, p=0.012). This was supported by a calculated t-statistic of
5.540 that is larger than the critical t-statistic of 1.96. There was a positive and
significant relationship between firm size and ROA for non-financial firms (β =0.011,
p=0.020). This was supported by a calculated t-statistic of 4.86 that is larger than the
critical t-statistic of 1.96.
In ROE, there was a positive and significant relationship between firm size and ROE for
financial firms (β =0.0062, p=0.001). This was supported by a calculated t-statistic of
3.271 that is larger than the critical t-statistic of 1.96. There was a positive and
significant relationship between firm size and ROE for non-financial firms (β =0.010,
p=0.002). This was supported by a calculated t-statistic of 3.72 that is larger than the
critical t-statistic of 1.96. This means that a unitary improvement in firm size leads to an
improvement in financial performance by 0.0681 and 0.011 units in ROA for financial
and non-financial firms, 0.006 and 0.010 in ROE for financial and non-financial firms
respectively holding other factors constant.
This is consistent with Abbasi and Malik (2015) who pinpointed the effect of firm size
between the relationship of firm growth and firm performance. The results of the
regression analysis were demonstrating that the alternative hypothesis of the research
that firm size had inspiration between independent variable (Firm growth) and
dependent variable (Firm performance) was accepted. The study is cooperative for the
management to keep an eye on firm size along with firm growth while enhancing the
firm performance.
137
4.8.5 Effects of Firm Age as a Moderator of Firm Level Factors on Financial
Performance
The fifth objective of the study was to establish the moderating effect of firm age on the
relationship between firm level factors and financial performance, of listed firms in the
Nairobi securities exchange. Firm age was a significant moderating variable for leverage
and ROA for financial and non-financial firms respectively at 0.001<0.05, 0.024<0.05
and ROE 0.025<0.05, 0.015<0.05 for financial and non-financial firms respectively. In
addition, firm age had a positive and significant moderating effect on the relationship
between liquidity with ROA for financial and non-financial firms at 0.00<0.05;
0.00<0.05 and ROE for financial and non-financial firms at 0.00<0.05; 0.03<0.05.
Firm age had a positive and significant moderating effect on the relationship between
asset tangibility with ROA for financial and non-financial firms at 0.00<0.05; 0.02<0.05
and ROE for financial and non-financial firms at 0.00<0.05; 0.00<0.05. Finally, firm age
had a positive and significant moderating effect on the relationship between firm size
with ROA for financial and non-financial firms at 0.00<0.05; 0.010<0.05 and ROE for
financial and non-financial firms at 0.001<0.05; 0.02<0.05.
Firm age as a moderator of firm level factors on ROA in financial firms improved R2
from 58.32% to 63.26%. Firm age as a moderator of firm level factors on ROA in non-
financial firms improved R2 from 69.19% to 70.12%. Further, Firm age as a moderator
of firm level factors on ROE in financial firms improved R2 from 71.91% to 74.16%.
Lastly, firm age as a moderator of firm level factors on ROE in non-financial firms
improved R2 from 64.48% to 68.47%.
This is in agreement with Kaguri (2013), who conducted a study using firm age as a
moderating variable on the relationship between firm characteristics and financial
performance of life insurance companies in Kenya. The study used size, diversification,
leverage, liquidity, age, premium growth and claim experience as the independent
variables and financial performance as the dependent variable. The study findings
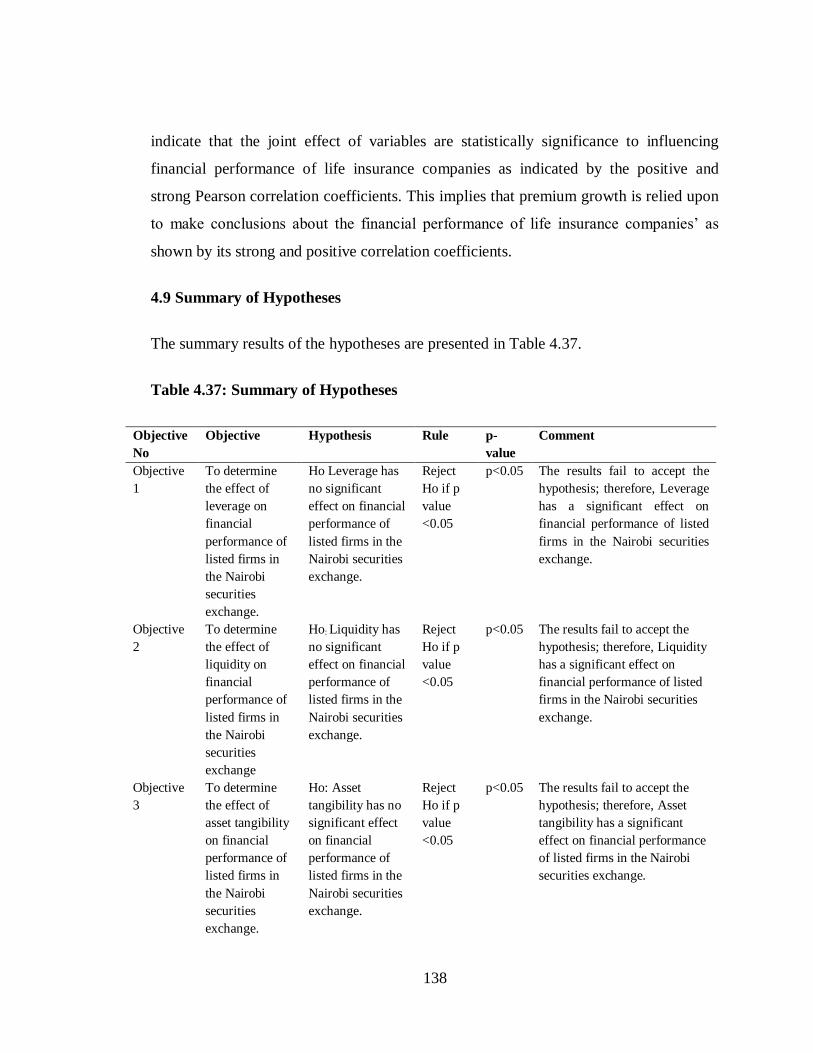
138
indicate that the joint effect of variables are statistically significance to influencing
financial performance of life insurance companies as indicated by the positive and
strong Pearson correlation coefficients. This implies that premium growth is relied upon
to make conclusions about the financial performance of life insurance companies’ as
shown by its strong and positive correlation coefficients.
4.9 Summary of Hypotheses
The summary results of the hypotheses are presented in Table 4.37.
Table 4.37: Summary of Hypotheses
Objective
No
Objective Hypothesis Rule p-
value
Comment
Objective
1
To determine
the effect of
leverage on
financial
performance of
listed firms in
the Nairobi
securities
exchange.
Ho Leverage has
no significant
effect on financial
performance of
listed firms in the
Nairobi securities
exchange.
Reject
Ho if p
value
<0.05
p<0.05 The results fail to accept the
hypothesis; therefore, Leverage
has a significant effect on
financial performance of listed
firms in the Nairobi securities
exchange.
Objective
2
To determine
the effect of
liquidity on
financial
performance of
listed firms in
the Nairobi
securities
exchange
Ho: Liquidity has
no significant
effect on financial
performance of
listed firms in the
Nairobi securities
exchange.
Reject
Ho if p
value
<0.05
p<0.05 The results fail to accept the
hypothesis; therefore, Liquidity
has a significant effect on
financial performance of listed
firms in the Nairobi securities
exchange.
Objective
3
To determine
the effect of
asset tangibility
on financial
performance of
listed firms in
the Nairobi
securities
exchange.
Ho: Asset
tangibility has no
significant effect
on financial
performance of
listed firms in the
Nairobi securities
exchange.
Reject
Ho if p
value
<0.05
p<0.05 The results fail to accept the
hypothesis; therefore, Asset
tangibility has a significant
effect on financial performance
of listed firms in the Nairobi
securities exchange.
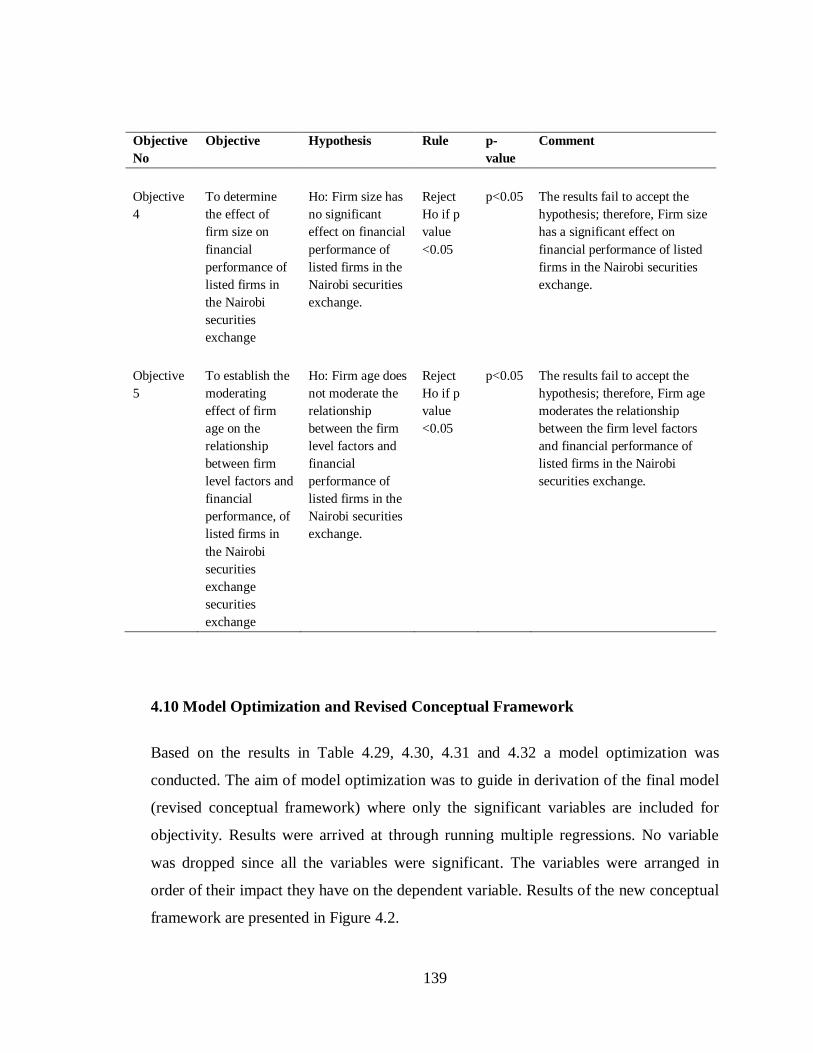
139
Objective
No
Objective Hypothesis Rule p-
value
Comment
Objective
4
To determine
the effect of
firm size on
financial
performance of
listed firms in
the Nairobi
securities
exchange
Ho: Firm size has
no significant
effect on financial
performance of
listed firms in the
Nairobi securities
exchange.
Reject
Ho if p
value
<0.05
p<0.05 The results fail to accept the
hypothesis; therefore, Firm size
has a significant effect on
financial performance of listed
firms in the Nairobi securities
exchange.
Objective
5
To establish the
moderating
effect of firm
age on the
relationship
between firm
level factors and
financial
performance, of
listed firms in
the Nairobi
securities
exchange
securities
exchange
Ho: Firm age does
not moderate the
relationship
between the firm
level factors and
financial
performance of
listed firms in the
Nairobi securities
exchange.
Reject
Ho if p
value
<0.05
p<0.05 The results fail to accept the
hypothesis; therefore, Firm age
moderates the relationship
between the firm level factors
and financial performance of
listed firms in the Nairobi
securities exchange.
4.10 Model Optimization and Revised Conceptual Framework
Based on the results in Table 4.29, 4.30, 4.31 and 4.32 a model optimization was
conducted. The aim of model optimization was to guide in derivation of the final model
(revised conceptual framework) where only the significant variables are included for
objectivity. Results were arrived at through running multiple regressions. No variable
was dropped since all the variables were significant. The variables were arranged in
order of their impact they have on the dependent variable. Results of the new conceptual
framework are presented in Figure 4.2.
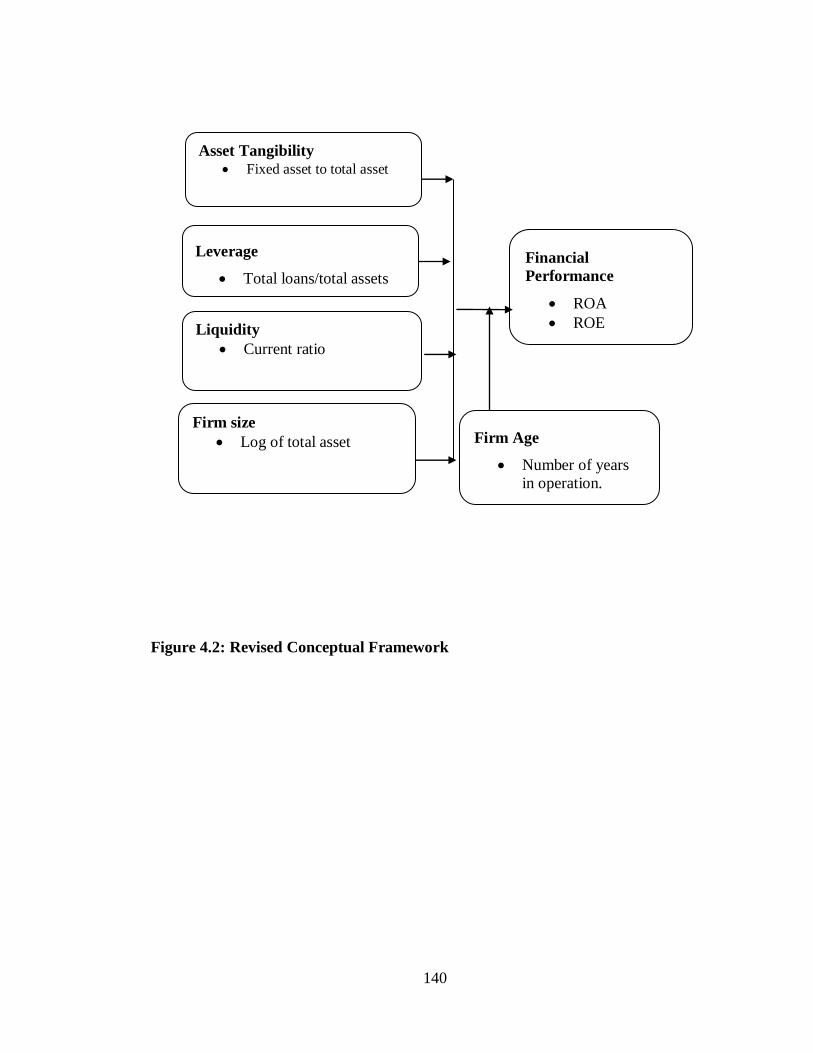
140
Figure 4.2: Revised Conceptual Framework
Leverage
Total loans/total assets
Liquidity
Current ratio
Financial
Performance
ROA
ROE
Firm size
Log of total asset
Asset Tangibility
Fixed asset to total asset
Firm Age
Number of years
in operation.
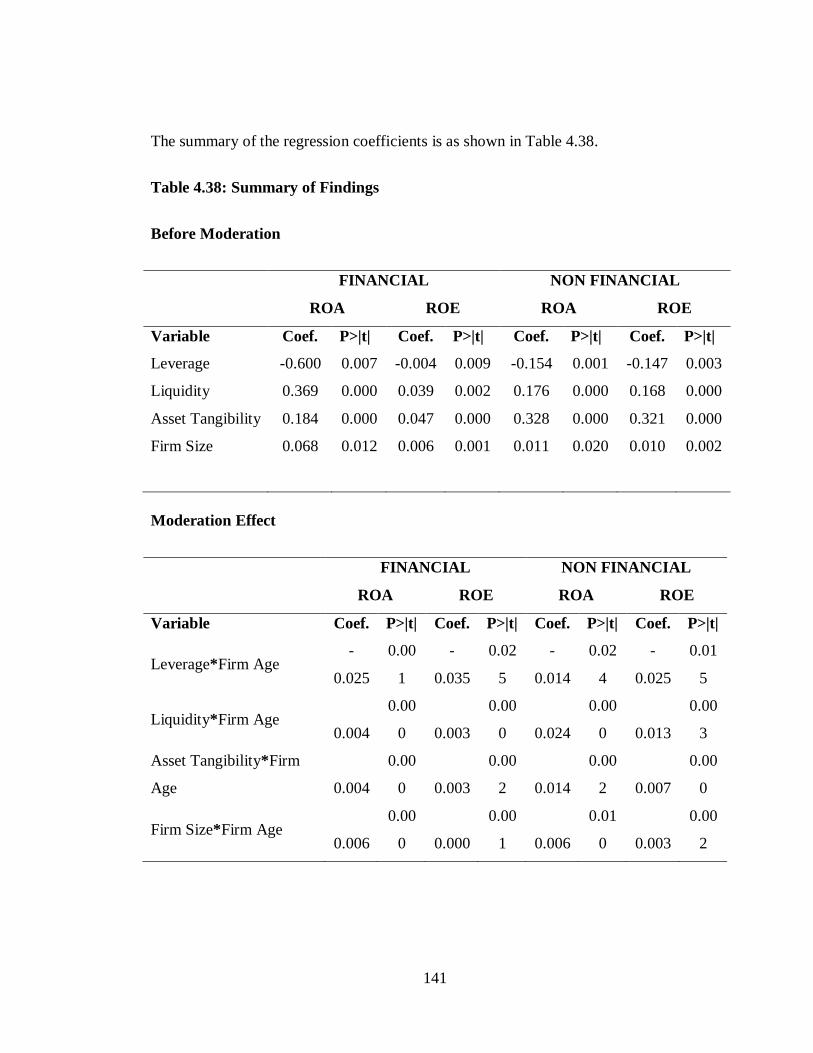
141
The summary of the regression coefficients is as shown in Table 4.38.
Table 4.38: Summary of Findings
Before Moderation
FINANCIAL NON FINANCIAL
ROA ROE ROA ROE
Variable Coef. P>|t| Coef. P>|t| Coef. P>|t| Coef. P>|t|
Leverage -0.600 0.007 -0.004 0.009 -0.154 0.001 -0.147 0.003
Liquidity 0.369 0.000 0.039 0.002 0.176 0.000 0.168 0.000
Asset Tangibility 0.184 0.000 0.047 0.000 0.328 0.000 0.321 0.000
Firm Size 0.068 0.012 0.006 0.001 0.011 0.020 0.010 0.002
Moderation Effect
FINANCIAL NON FINANCIAL
ROA ROE ROA ROE
Variable Coef. P>|t| Coef. P>|t| Coef. P>|t| Coef. P>|t|
Leverage*Firm Age -
0.025
0.00
1
-
0.035
0.02
5
-
0.014
0.02
4
-
0.025
0.01
5
Liquidity*Firm Age 0.004
0.00
0 0.003
0.00
0 0.024
0.00
0 0.013
0.00
3
Asset Tangibility*Firm
Age 0.004
0.00
0 0.003
0.00
2 0.014
0.00
2 0.007
0.00
0
Firm Size*Firm Age 0.006
0.00
0 0.000
0.00
1 0.006
0.01
0 0.003
0.00
2
142
4.11 Summary of the Chapter
This chapter has presented the analysis of the data collected and discussion of the
findings. The study utilized descriptive statistics, correlation analysis and regression
analysis. The regression analysis results revealed that leverage had a negative and
significant relationship with financial performance whereas liquidity, asset tangibility
and firm size had a positive and significant relationship with financial performance of
listed firms in the Nairobi Securities Exchange.
143
CHAPTER FIVE
SUMMARY, CONCLUSION AND RECOMMENDATIONS
5.1 Introduction
This chapter presents a summary of major findings of this study, sets out the relevant
conclusions and makes recommendations for practice and suggestions for further
research based on the findings of this study. The study sought to establish the effect of
firm level factors on financial performance of listed firms in the Nairobi Securities
Exchange. It established the relationship between leverage, liquidity, asset tangibility
and firm size, moderated by firm age on financial performance.
5.2 Summary of Major Findings
This section contained the summary of the findings.
5.2.1 Effect of Leverage on Financial Performance
The first objective of the study was to establish the influence of leverage on Financial
Performance of Listed Firms in the Nairobi Securities Exchange. Leverage was found to
be satisfactory in explaining financial performance. Further, results showed that leverage
is a good predictor of financial performance. Correlation analysis revealed that leverage
was negatively and significantly associated to financial performance. Regression of
coefficient results on financial firms revealed that there was a negative and significant
relationship between leverage and ROA. The results revealed that for non-financial
firms, there was a negative and significant relationship between leverage and ROA.
Under ROE, Regression of coefficient results on financial firms revealed that there was
a negative and significant relationship between leverage and ROE. The results further
revealed that there was a negative and significant relationship between leverage and
ROE for non-financial firms. This means that a unitary increase in leverage leads to a
reduction in financial performance.
144
5.2.2 Effect of Liquidity on Financial Performance
The second objective of the study was to establish the influence of liquidity on Financial
Performance of Listed Firms in the Nairobi Securities Exchange. Liquidity was found to
be satisfactory in explaining financial performance. Further, results showed that liquidity
is a good predictor of financial performance. Correlation analysis revealed that liquidity
was positive and significantly associated to financial performance. Regression of
coefficient results revealed there was a positive and significant relationship between
liquidity and ROA for financial firms. There was a positive and significant relationship
between liquidity and ROA for nonfinancial firms.
On ROE, there was a positive and significant relationship between liquidity and ROE for
financial firms. There was a positive and significant relationship between liquidity and
ROE for non-financial firms. This means that a unitary improvement in liquidity leads to
an improvement in financial performance.
5.2.3 Effect of Asset Tangibility on Financial Performance
The third objective of the study was to establish the influence of asset tangibility on
Financial Performance of Listed Firms in the Nairobi Securities Exchange. Asset
tangibility was found to be satisfactory in explaining financial performance. Further,
results showed that asset tangibility is a good predictor of financial performance.
Correlation analysis revealed that asset tangibility was positive and significantly
associated to financial performance. Regression of coefficient for results revealed that
there was a positive and significant relationship between asset tangibility and ROA for
financial firms. The results further revealed that there was a positive and significant
relationship between asset tangibility and ROA for non-financial firms.
Regression results showed that there was a positive and significant relationship between
asset tangibility and ROE for financial firms. Further, results revealed that there was a
positive and significant relationship between asset tangibility and ROE for non-financial
145
firms. This means that a unitary improvement in asset tangibility leads to an
improvement in financial performance.
5.2.4 Effect of Firm Size on Financial Performance
The fourth objective of the study was to establish the influence of firm size on Financial
Performance of Listed Firms in the Nairobi Securities Exchange. Firm size was found to
be satisfactory in explaining financial performance. Further, results showed that firm
size is a good predictor of financial performance. Correlation analysis revealed that firm
size was positive and significantly associated to financial performance. Regression of
coefficient revealed there was a positive and significant relationship between firm size
and ROA for financial firms. There was a positive and significant relationship between
firm size and ROA for non-financial firms.
In ROE, there was a positive and significant relationship between firm size and ROE for
financial firms. There was a positive and significant relationship between firm size and
ROE for non-financial firms. This means that a unitary improvement in firm size leads
to an improvement in financial performance.
5.2.5 Moderating Effect of Firm Age and Firm Level Factors on Financial
Performance
The fifth objective of the study was to assess the moderating effect of firm age on the
relationship between the firm level factors and financial performance of Listed Firms in
the Nairobi Securities Exchange. Firm age was a significant moderating variable for
leverage and ROA for financial and non-financial firms. In addition, firm age had a
positive and significant moderating effect on the relationship between liquidity with
ROA for financial and non-financial firms.
146
Firm age had a positive and significant moderating effect on the relationship between
asset tangibility with ROA for financial and non-financial firms. Finally, firm age had a
positive and significant moderating effect on the relationship between firm size with
ROA for financial and non-financial firms.
5.3 Conclusion
5.3.1 Leverage
Based on the findings, the study concluded that leverage has a negative and significant
effect on financial performance of Listed Firms in the Nairobi Securities Exchange.
Leverage allows a financial institution to increase the potential gains or losses on a
position or investment beyond what would be possible through a direct investment of its
own funds. The leverage ratio can thus be thought of as a measure of balance sheet or, to
the extent that it also includes off-balance-sheet exposures economic leverage. A firm
can finance its investment by debt and/or equity. The use of fixed-charged funds, such as
debt and preference capital along with the owner’s equity in the capital structure is
described as financial leverage or gearing. Leverage allows a greater potential returns to
the investor than otherwise would have been available, but the potential loss is also
greater: if the investment becomes worthless, the loan principal and all accrued interest
on the loan still need to be repaid. This constitutes financial risk. The degree of this
financial risk is related to the firm’s financial structure
5.3.2 Liquidity
Based on the findings, the study concluded that liquidity has a positive and significant
effect on financial performance of Listed Firms in the Nairobi Securities Exchange.
Liquidity plays a crucial role in the successful functioning of a business firm. Liquidity
not only helps to ensure that a person or business always has a reliable supply of cash
close at hand, but it is a powerful tool when it comes to determining the financial health
of future investments as well. It principally has an effect on financial costs reduction or
147
growth, changes in the sales dynamic, as well as it influences on company risk level.
The decisive significance of liquidity means that it is important for company
development and at the same is one of the fundamental endogenous factors that are
responsible for company market position. The significance of liquidity to company
performance might lead to the conclusion that it determines the profitability level of
company. The current ratio is used to test a firm’s liquidity, that is, its current or
working capital position by deriving the proportion of the firm’s current assets available
to cover its current liability. A higher current ratio indicates a larger investment in
current assets which means, a low rate of return on investment for the firm, as excess
investment in current assets will not yield enough returns. A low current ratio means
smaller investment in current assets which means a high rate of return on investment for
the firm, as no unused investment is tied up in current assets.
5.3.3 Asset Tangibility
Based on the findings, the study concluded that asset tangibility has a positive and
significant effect on financial performance of Listed Firms in the Nairobi Securities
Exchange. A firm is highly competitive when as its managers are able to mix tangible
and intangible assets in the most effective and efficient manner. Therefore, a firm can
get the same score of competitiveness by using a different combination of assets and by
giving different importance coefficients to the tangible and intangible assets. Tangible
assets are positively related to firm performance and the trade-off theory predicts a
positive relation between leverage and tangibility. This relationship exists because
tangible assets are easier to collateralize and they suffer a smaller loss of value when
firms go into distress. Since firms tend to match the maturity of assets with maturity of
liabilities. A larger share of tangible assets increases the liquidation value of a company.
This is because the tangible assets constitute collateral for the debt in case of
bankruptcy. When a firm is solvent, tangible asset increase the firm value by allocating
assets to better uses. In addition, when the firm is in distress, tangible asset sales
represent the cheapest source of funds for the firm. Moreover, asset sales allow the firm
to finance continued operation of its remaining assets without requiring external capital.
148
5.3.4 Firm Size
Based on the findings, the study concluded that firm size has a positive and significant
effect on financial performance of Listed Firms in the Nairobi Securities Exchange. The
size influences a firm performance because large firm can increase their current size
very fast by accumulating earnings from past performance and this enhances their value.
In terms of structure, that is firm’s characteristics, institutional shareholders can
influence any decision by management of firms. The accumulation of funds assists in
putting up effective risk management structures. Firm size is a basis of competitive
advantage in the sense that larger companies tend to be more efficient than their smaller
counterparts and have better resources to survive economic downturns.
5.3.5 Moderating Effect of Firm Age
Based on the findings, the study concluded that firm age moderates firm level factors
that are leverage, liquidity, asset tangibility and firm size. The liability of newness
suggests that newer firms are disadvantaged vis-à-vis older firms because newer firms
lack experience, lack external ties and lack legitimacy. The return on investment in
older firms is likely to be higher because it has benefited from exposure, repetition and
learning by doing that assist older firms to refine their strategies and build firm-specific
human capital. Younger companies are more dynamic and more volatile in their
growth experience than older companies are. Maturity brings stability in growth as
firms learn more precisely their market positioning, cost structures and efficiency levels.
Older firms are prone to inertia, and the bureaucratic ossification that goes along with
age; they might have developed routines, which are out of touch with changes in market
conditions, in which case an inverse relationship between age and profitability. Newer
and smaller firms, as a result, take away market share in spite of disadvantages like lack
of capital, brand names and corporate reputation with older firms.
149
5.4 Recommendations
5.4.1 Recommendations for Management
The study recommends the management on firms listed at the Nairobi Securities
Exchange to focus on leverage, liquidity, asset tangibility and firm size since they were
found to have a significant effect on the financial performance. This study noted that
leverage, liquidity, asset tangibility and firm size contributed largely towards a financial
performance of firms. Leverage helps to access the financial risks. It also helps in
attaining trading on equity. Achieving leverage can enable significant competitive
advantages despite the risk, however, as it can accelerate the speed of revenue
acquisition exponentially.
Liquidity is a crucial factor in a firm. Inability to meet the short-term liabilities may
affect the company’s operations and in many cases, it may affect its reputation too. Lack
of cash or liquid assets on hand may force a company to miss the incentives given by the
suppliers of credit, services, and goods. There is always a need for the company to
maintain certain degree of liquidity. Supplier of goods will check the liquidity of the
company before selling goods on credit. Employees are also have interest in the liquidity
to know whether the company can meet its employees’ related obligations.
The firm size is crucial in a company due to their market power larger firms are able to
charge higher prices and hence earn higher profits. Additionally, higher profits could
also be result of economies of scale and stronger negotiating power that provides larger
firms more favorable financing conditions.
The Nairobi Securities Exchange and Capital markets authority supervisory framework
guidelines should be adhered to foster credibility and performance of the listed
companies.
150
5.4.2 Policy Recommendations
The study found out that the firm level factors have a significant effect on financial
performance of firms listed at the Nairobi Securities Exchange. Therefore, the researcher
recommends that the policy makers in the financial sector to embrace indicators such as
leverage, liquidity, asset tangibility and firm size on their strategic decision-making.
These indicators will further guide in expanding the interpretation of the financial
dynamics in the listed firms at the Nairobi securities exchange and other related firms.
The government policy makers will also find the findings beneficial in interpreting of
performance of the listed companies based on the firm level factors.
5.4.3 Academic Recommendations
The current study has contributed knowledge on firm level factors and it has further
advanced the existing literature on financial performance. The study recommends that
the academicians and scholars should team up to develop theories financial performance
that will enhance the knowledge of finance in the developing world instead of relying
more on theories from the western world.
5.5 Contribution to the Body of Knowledge
The study contributed to the body of knowledge in the following ways; the findings of
the study will assist the firm managers to evaluate leverage, liquidity, asset tangibility
and firm size and firm age as the study discovered that the stated factors contribute to
financial performance. By undertaking the study, the firm level factors and financial
performance was explored. This went a long way in adding value to the past findings
and enabled users have information and a deeper understanding of the need for
enhancing leverage, liquidity, asset tangibility and firm size and firm age to improve on
financial performance. The study also offered a logical ground on which empirical
indicators and hypotheses could be identified and tested to verify the theories. It
contributed to the body of knowledge and to other researchers, as they will be able to
151
appreciate the effects of the stated factors, inspire similar and further research in other
areas, and contribute to the existing literature on financial performance.
5.6 Areas for further research
This study sought to determine the effect of Firm Level Factors on Financial
Performance of Listed Firms in the Nairobi Securities Exchange only, thus area for
further studies could consider other companies in Kenya for purpose of making a
comparison of the findings with those of the current study.
This study used only five variables that is leverage, liquidity, asset tangibility and firm
size as the only variables that influence financial performance. Future studies can
incorporate other variables like exchange rates, economic growth and inflation rates
since they can influence financial performance.
This study used firm age as a moderating variable. There are other factors that can affect
by mediating or intervening that could be researched further for example exchange rates.
Therefore, future studies can introduce other moderating or an intervening variable in
their models.
Since the R squared was not 100% it seems there are other firm level characteristics that
affect financial performance that were not addressed by the study. Other studies should
therefore focus on other firm level characteristics for example growth and profitability
that affect financial performance.
152
REFERENCES
Abata, M. A., Migiro, S. O., Akande, J. O., & Layton, R. (2017). Does Capital Structure
Impact on the Performance of South African Listed Firms?. Acta Universitatis
Danubius. Œconomica, 13(6), 54-68..
Abbasi, A., & Malik, Q. A. (2015). Firms’ size moderating financial performance in
growing firms: An empirical evidence from Pakistan. International Journal of
Economics and Financial Issues, 5(2), 334-339.
Abdullah, M. S., Shah, S. Z. A., & Hassan, A. (2008). Impact of corporate governance
on financial performance of firms: Evidence from Pakistan. The Business
Review, Cambridge, 11(2), 282-289.
Abubakar, A. (2015). Relationship between financial leverage and financial performance
of deposit money banks in Nigeria. International Journal of Economics,
Commerce and Management, 3(10), 759-778.
Adongo, J. (2012). The effect of financial leverage on profitability and risk of firms
listed at the Nairobi Securities Exchange. Unpublished Msc Project. Nairobi:
University of Nairobi.
Agrawal, A. and C.R. Knoeber (1996). Firm Performance and Mechanisms to Control
Agency Problems between Managers and Shareholders. Journal of Financial and
Quantitative Analysis. 31 (3, Sept.) 377-97.
Akoto, R. K., Awunyo-Vitor, D., & Angmor, P. L. (2013). Working capital management
and profitability: Evidence from Ghanaian listed manufacturing firms. Journal of
Management Research, 4(2), 266-289.
153
Al Farooque, O., Van Zijl, T., Dunstan, K., & Karim, A. W. (2007). Corporate
governance in Bangladesh: link between ownership and financial performance.
Corporate governance: An international review, 15(6), 1453-1468.
Ali, K. A. (2014). The Impact of Financial Leverage on Firm Performance: The Case of
Non- Financial Firms in Kenya. Unpublished Msc Project. Nairobi: University
of Nairobi.
Al-Khatib, H. B., & Al-Horani, A. (2012). Predicting financial distress of public
companies listed in Amman Stock Exchange. European Scientific Journal,
ESJ, 8(15), 31-54..
Almajali, A. Y., Alamro, S. A. & Al-Soub, Y. Z. (2012). Factors affecting the financial
performance of Jordanian Insurance Companies Listed at Amman Stock
Exchange, Journal of Management Research, 4(2), 266-289.
Alshatti, A. S. (2015). The effect of the liquidity management on profitability in the
Jordanian commercial banks. International Journal of Business and
Management, 10(1), 62.
Al-Tally, H. A. (2014). An investigation of the effect of financial leverage on firm
financial performance in Saudi Arabia's public listed companies, Unpublished
PhD dissertation, Victoria: Victoria University.
Amato, L. H., & Burson, T. E. (2007). The effects of firm size on profit rates in the
financial services. Journal of Economics & Economic Education Research, 8(1),
43-52.
Amato, L., & Wilder, R. (1985).The Effects of Firm Size on Profit Rates in U.S.
Manufacturing, Southern Economic Journal, 52(1), 181-190.
154
Amihud, Y., & Mendelson, H. (1991). Liquidity, maturity, and the yields on US
Treasury securities. The Journal of Finance, 46(4), 1411-1425.
Ammar, A., Hanna, A. S., Nordheim, E. V., & Russell, J. S. (2003). Indicator variables
model of firm’s size-profitability relationship of electrical contractors using
financial and economic data. Journal of Construction Engineering and
Management, 129(2), 192-197.
Andersson, A., Sköld-Larsson, K., Haligren, A., Petersson, L. G., & Twetman, S.
(2007). Effect of a Dental Cream Containing Amorphous Calcium Phosphate
Complexes on White Spot Lesion Regression Assessed by Laser
Fluorescence. Oral health & preventive dentistry, 5(3), 23- 35.
Aroni, J. M. (2011). Factors influencing stock prices for firms listed in the Nairobi Stock
Exchange. International Journal of Business and Social Science, 2(20), 30 -52.
Asif, A., Rasool, W., & Kamal, Y. (2011). Impact of financial leverage on dividend
policy: Empirical evidence from Karachi Stock Exchange-listed
companies. African Journal of Business Management, 5(4), 1312-1324.
Ayako, A., Kungu, G., & Githui, T. (2015). Determinants of the Performance of Firms
Listed At the Nairobi Securities Exchange. Research Journal of Finance and
Accounting, 6(12), 157-164.
Babalola, Y. A. (2013). The effect of firm size on firms profitability in Nigeria. Journal
of Economics and Sustainable Development, 4(5), 90-94.
Baltagi, B. H., Bratberg, E., & Holmås, T. H. (2005). A panel data study of physicians'
labor supply: the case of Norway. Health Economics, 14(10), 1035-1045.
155
Banafa, A. S., Muturi, W., & Ngugi, K. (2015). The impact of leverage on financial
performance of listed non-financial firm in Kenya. International Journal of
Finance and Accounting 4 (7), 1- 20.
Baum, C. F., Caglayan, M., Stephan, A., & Talavera, O. (2008). Uncertainty
determinants of corporate liquidity. Economic Modelling, 25(5), 833-849.
Baum, R, J., & Wally, S. (2003). Strategic decision speed and firm
performance. Strategic management journal, 24(11), 1107-1129.
Beck, T., Demirguc‐Kunt, A., Laeven, L., & Levin, R. (2008). Finance, firm size, and
growth. Journal of Money, Credit and Banking, 40(7), 1379-1405.
Berger, A. N., & Di Patti, E. B. (2006). Capital structure and firm performance: A new
approach to testing agency theory and an application to the banking
industry. Journal of Banking & Finance, 30(4), 1065-1102.
Bhatti, A. M., Majeed, K., Rehman, I. U., & Khan, W. A. (2010). Effect of leverage on
risk and stock returns: evidence from Pakistani companies. International
Research Journal of Finance and Economics, 58, 32-49.
Bhunia, A. (2010). A trend analysis of liquidity management efficiency in selected
private sector Indian steel industry. International Journal of Research in
Commerce and Management, 1(5-9), 9-21.
Binti, M. and Binti, M. S. (2010). Working capital management: The effect of market
valuation and profitability in Malaysia. International Journal of Business and
Management, 5(11), 140-162.
Bobakova, V. (2003). Possibilities of the increasing of the profitability of a commercial
bank. Biatec, 11(4), 26-29.
156
Borghesi, R., Houston, J., & Naranjo, A. (2007). Value, survival, and the evolution of
firm organizational structure. Financial Management, 36(3), 5-31.
Braun, M., & Sharma, A. (2007). Should the CEO also be chair of the board? An
empirical examination of family-controlled public firms. Family Business
Review, 20(2), 111-126.
Bresnahan, T. F., Brynjolfsson, E., & Hitt, L. M. (2002). Information technology,
workplace organization, and the demand for skilled labor: Firm-level
evidence. The Quarterly Journal of Economics, 117(1), 339-376.
Breusch, T. S., & Pagan, A. R. (1980). The Lagrange multiplier test and its applications
to model specification in econometrics. The review of economic studies, 47(1),
239-253.
Brooks, C. (2008). Introductory Econometrics for Finance, Journal of Management
Research, 4(2), 26-89.
Calof, J. L. (1993). The impact of size on internationalization. Journal of small business
management, 31(4), 60.
Campello, M. (2006). Asset tangibility and corporate performance under external
financing. Journal of Management Research, 4(2), 66-89.
Campello, M., & Giambona, E. (2011). Capital structure and the redeployability of
tangible assets. Journal of small business management, 31(4), 60.
Chebii, K. & Wasike, A. (2011). The emerging patterns of power in Corporate
Governance. Back to the future in improving Corporate decision making.
Journal of managerial psychology, 15(5), 477- 507.
157
Chechet, I. L., & Olayiwola, A. B. (2014). Capital structure and profitability of Nigerian
quoted firms: The agency cost theory perspective. American International
Journal of Social Science, 3(1), 139-158.
Chittenden F., Hall G., P. & Hutchinson (2006). Small Firm Growth, Access to Capital
Markets and Financial Structure: Review of Issues and an Empirical
Investigation. Small Business Economics, 8, 59–67.
Choi, I. (2001). Unit root tests for panel data. Journal of international money and
Finance, 20(2), 249-272.
Clementi, D. (2001). Financial markets: implications for financial stability, Banca
D'Italia conference on international banking and financial systems evolution and
stability. MCB University Press, Bradford, 11, 13‐19.
Cockburn, I. M., & Henderson, R. M. (2001). Scale and scope in drug development:
unpacking the advantages of size in pharmaceutical research. Journal of health
economics, 20(6), 1033-1057.
Cohen, W. M. (1995). Absorptive capacity: a new perspective on learning and
innovation. Administrative Science Quarterly, 35(1), 128-152.
Colburn, C. & Talley, W. (1992). A Firm-Specific Analysis of Economies of Size in the
U.S. Urban Multiservice Transit Industry. Transportation Research, 26B(3), 195-
206.
Cubbin, J. & Leech, D. (1986). Growth verus profit-maximization: A simultaneous
equations approach to testing Marris model. Managerial and Decision
Economics, 7, 123-131.
158
Daskalakis, N., & Psillaki, M. (2008). Do country or firm factors explain capital
structure? Evidence from SMEs in France and Greece. Applied financial
economics, 18(2), 87-97.
Davydenko, S. A. (2012). When do firms default? A study of the default boundary
Journal of Management Research, 4(2), 266-289.
De Jong, A., Kabir, R., & Nguyen, T. T. (2008). Capital structure around the world: The
roles of firm-and country-specific determinants. Journal of Banking &
Finance, 32(9), 1954-1969.
Defee, C., Williams, B., Randall, W. S., & Thomas, R. (2010). An inventory of theory in
logistics and SCM research. The International Journal of Logistics Management,
21(3), 404-489.
Degryse, H., de Goeij, P., & Kappert, P. (2012). The impact of firm and industry
characteristics on small firms’ capital structure. Small Business
Economics, 38(4), 431-447.
Deitiana, T., & Habibuw, L. G. (2015). Factors Affecting the Financial Performance of
Property Andreal Estate Companies Listed at Indonesia Stock Exchange). Asian
Business Review, 5(2), 79-88.
Dhanaraj, C., & Beamish, P.W. (2003). A resource based approach to the study of export
performance. Journal of Small Business Management, 41(1), 242-261.
Diamond, W. & Rajan, G. (2001). Liquidity risk, liquidity creation, and financial
fragility: a theory of banking. The Journal of Political Economy, 109(2):287‐327.
Doğan, M. (2013). Does firm size affect the firm profitability? Evidence from Turkey.
Research Journal of Finance and Accounting, 4(4), 53-59.
159
Dong, H., & Su, J. T. (2010). The relationship between working capital management and
profitability: a Vietnam case. Journal of Management Research, 4(2), 266-289.
Ebiringa, O. T., & Ezeji, E. C. (2012). Analysis of effect of financing leverage on bank
performance: Evidence from Nigeria. Journal of Public Administration and
Governance, 2(4), 178-187.
Eljelly, A. M. (2004). Liquidity‐profitability tradeoff: An empirical investigation in an
emerging market. International journal of commerce and management, 14(2),
48-61.
Enekwe, C. I., Agu, C. I., & Eziedo, K. N. (2014). The effect of financial leverage on
financial performance: Evidence of quoted pharmaceutical companies in
Nigeria. IOSR Journal of Economics and Finance, 5(3), 17-25.
Evans, D.S. (1987). Tests of Alternative Theories of Firm Growth. Journal of Political
Economy, University of Chicago Press, 95(4), 657-674.
Fafchamps, M., & Quinn, S. (2017). Aspire. The Journal of Development Studies,
53(10), 1615-1633.
Fama, E. F., & French, K. R. (2002). Testing trade-off and pecking order predictions
about dividends and debt. The review of financial studies, 15(1), 1-33.
Fatoki, O.O., George, H. & Mornay, R. (2010). An investigation into the impact of the
usage of debt on the profitability on SMEs in the Buffalo city municipality,
South Africa. African Journal of Business Management, 4(4), 373-381.
Fischer, E. O., Heinkel, R., & Zechner, J. (1989). Dynamic capital structure choice:
Theory and tests. The Journal of Finance, 44(1), 19-40.
160
Galbreath, J., & Galvins, P. (2008). Firm factors, industry structure and performance
variation: New empirical evidence to a classic debate. Journal of Business
Research, 61, 109-11
Gay, L. R. (1981). Educational Research: Competencies for analysis and
application. Merrill, Ohio: Columbus.
Gertz, G. (2009). Kenya’s Trade Liberalization of the 1980s and 1990s: Policies,
Impacts, and Implications. The impact of Doha Round Table on Kenya. Nairobi:
Carnegie Endowment for International Peace.
Gomes, M, C., Kruglianskas, I., & Scherer, F. L. (2009). Company size effect in
innovative performance. Journal of technology management & innovation, 4(4),
14-31.
Gordon, M. J. (1971). Towards a theory of financial distress. The Journal of
Finance, 26(2), 347-356.
Graham, J., Li, S. & Qiu, J. (2012). Managerial attributes and executive compensation.
Review of Financial Studies, 25,144-186.
Greene, W. H. (2008). The econometric approach to efficiency analysis. The
measurement of productive efficiency and productivity growth, 1(1), 92-250.
Gujarati, D., & Porter, D. (2003). Multicollinearity: What happens if the regressors are
correlated. Basic econometrics, 363.
Gupta, A. D. (2010). Corporate social responsibility and human resources management:
A strategic balanced model. In S. O. Idowu, & L. F. Walter (Eds.),
Professionals’ perspectives of corporate social responsibility (pp. 393-407).
London: Springer.
161
Gweyi, M. O., & Karanja, J. (2014). Effect of financial leverage on financial
performance of deposit taking savings and credit co-operative in
Kenya. International Journal of Academic Research in Accounting, Finance and
Management Sciences, 4(2), 180-188.
Hall, S., & Vila, A. (2002). The role of corporate balance sheets and bank lending
policies in a financial accelerator framework. Journal of Finance, 46(1), 97-155.
Harc, M. (2015). The relationship between tangible assets and capital structure of small
and medium-sized companies in Croatia. Ekonomski vjesnik: Review of
Contemporary Entrepreneurship, Business, and Economic Issues, 28(1), 213-
224.
Harris, M., & Raviv, A. (1991). The theory of capital structure. Journal of Finance,
46(1), 297-355.
Hawawini, G., Subramanian, V., & Verdin, P. (2003). Is performance driven by
industry‐or firm‐specific factors? A new look at the evidence. Strategic
management journal, 24(1), 1-16.
Hendrikse, A. (2009, December). A bootstrap approach to eigenvalue correction.
In 2009 Ninth IEEE International Conference on Data Mining (pp. 818-823).
IEEE.
Henri, J. F. (2004). Performance measurement and organizational effectiveness:
Bridging the gap. Managerial Finance, 30(6), 93-123.
Herciu, M., Ogrean, C., & Belascu, L. (2012). Leveraging tangible and intangible assets
by using a possible firm competitiveness index. Global business and economics
review, 14(1-2), 115-124.
162
Heshmati, A., & Kim, H. (2011). The R&D and productivity relationship of Korean
listed firms. Journal of Productivity Analysis, 36(2), 125-142.
Hsiao, C. (2007). Panel data analysis—advantages and challenges. Test, 16(1), 1-22.
Iraya, C., Mwangi, M., & Muchoki, G. W. (2015). The effect of corporate governance
practices on earnings management of companies listed at the Nairobi securities
exchange. European Scientific Journal, ESJ, 11(1).
Jude Leon S. A., (2013), the impact of Capital Structure on Financial Performance of the
listed manufacturing firms in Sri Lanka, global journal of commerce and
management perspective, 2(5), 30-56.
Kaguri, A. W (2013). Relationship between firm characteristics and financial
performance of life insurance companies in Kenya. Unpublished M.Sc. Thesis,
Nairobi: University of Nairobi.
Kahiga, D. (2014). Effect of Financial Innovation on Profitability of Deposit-taking
Microfinance Institutions in Kenya. Unpublished M.Sc. Thesis, Nairobi:
University of Nairobi.
Kanu, C. C. (2015). The Impact of Capital Structure on Corporate Performance in
Nigeria: A Study of Selected Companies, Unpublished PhD dissertation, Owerri:
Federal University of Technology.
Karaca, S. S., & Eksi, I. H. (2012). The relationship between ownership structure and
firm performance: An empirical analysis over Istanbul Stock Exchange (ISE)
listed companies. International Business Research, 5(1), 172.
Khidmat, W., & Rehman, M. (2014). Impact of liquidity and solvency on profitability
chemical sector of Pakistan. Economics management innovation, 6(3), 34-67.
Khoo, J., & Durand, R. B. (2014). Leverage and the Japanese Financial Crisis.
163
Kibet,B., Kibet ,L., Tenai, J. & Mutwol, M.(2011) The Determinants of Leverage at the
Nairobi Stock Exchange, Kenya. The Second Asian Business and Management
Conference 2011 Osaka, Japan.
Kihara, N. (2006). Relationship between Ownership Structure, Governance Structure
and Performance of Firms Listed at the NSE. Unpublished MBA research paper,
Nairobi: University of Nairobi.
Kim, J., MacDuffie, J. P., & Pil, F. K. (2010). Employee voice and organizational
performance: Team versus representative influence. human relations, 63(3), 371-
394.
Kioko, N. P. (2013). The relationship between firm size and financial performance of
commercial banks in Kenya. Unpublished Master’s thesis, Nairobi: University of
Nairobi.
Köksal, B., Orman, C., & Oduncu, A. (2013). Determinants of capital structure:
evidence from a major emerging market economy. MPRA Paper, 48415.
Kombo, D. K., & Tromp, D. L. (2009). Introduction to proposal writting. Nairobi:
Pauline publications.
Kothari, C. R. (2004). Research methodology: Methods and techniques. New Delhi:
New Age International.
Kraus, A. & Litzenberger, R.H. (1973). A State-Preference Model of Optimal Financial
Leverage. Journal of Finance, 911–922.
Kristiansen, S., Furuholt, B. & Wahid, F. (2003). Internet cafe entrepreneurs: pioneers in
information dissemination in Indonesia. The International Journal of
Entrepreneurship and Innovation, 4(4), 251-263.
164
Kula, V. (2005). The impact of the roles, structure and process of boards on firm
performance: Evidence from Turkey. Corporate governance: an international
review, 13(2), 265-276.
La Rocca, M., La Rocca, T., Gerace, D., & Smark, C. (2009). Effect of diversification
on capital structure. Accounting & Finance, 49(4), 799-826.
Lee. J. (2009). Does Size Matter in Firm Performance? Evidence from US Public Firms.
International Journal of the Economics of Business, 16(2), 189 – 203.
Lemmon, M. L., Roberts, M. R., & Zender, J. F. (2008). Back to the beginning:
persistence and the cross‐section of corporate capital structure. The Journal of
Finance, 63(4), 1575-1608.
Liargovas, P., & Skandalis, K. (2008). Factor affecting firms financial performance, The
Case of Greece, Greece: University of Peloponnese.
Linck, J. S., Netter, J. M., & Yang, T. (2008). The determinants of board
structure. Journal of financial economics, 87(2), 308-328.
Maaka, Z. A. (2013). The relationship between liquidity risk and financial performance
of commercial banks in Kenya. Unpublished PhD dissertation, Nairobi:
University of Nairobi.
Maghanga, E., & Kalio, A. (2012). Effects of Leverage on the Financial Performance of
Parastatals: A Case Study of Kenya Power. International Journal of Science and
Research, 3(10), 990, 994.
Mahfoudh, O. (2013). Effect of selected firm characteristics on financial performance of
firms listed in the agricultural sector at the Nairobi securities exchange.
Unpublished PhD Thesis, Nairobi: University of Nairobi.
165
Mahmoudi, S. (2014). The Effect of Leverage on Cement Industry Probability. Journal
of Resources Assessment and Management Tecnical Paper.
Maina, H. K. (2011). Relationship between the liquidity and profitability of oil
companies in Kenya. Unpublished PhD Thesis, Nairobi: University of Nairobi.
Majumdar, S. K. (1997). The impact of size and age on firm-level performance: Some
Evidence from India. Review of Industrial Organization, 12 (2), 231-241.
Marshall, A. (1890). Principles of Economics, (8th edn.) (1920). London: Mcmillan.
Matemilola, B. T., Bany, A. N., & Saini, W. N. W. (2013). Impact of leverage and
managerial skills on shareholders’ return. Procedia Economics and Finance, 7,
103-115.
Mathuva, D. M. (2010). Corporate Profitability: A Survey on Kenyan Listed Firms.
Unpublished PhD Thesis, Juja: JKUAT.
Melitz, M. J., & Ottaviano, G. I. (2008). Market size, trade, and productivity. The review
of economic studies, 75(1), 295-316.
Mentzer, J. T., Stank, T. P., & Esper, T. L. (2008). Supply chain management and its
relationship to logistics, marketing, production, and operations
management. Journal of business logistics, 29(1), 31-46.
Molyneux, P., & Thornton, J. (1992). Determinants of European bank profitability: A
note. Journal of banking & Finance, 16(6), 1173-1178.
Moradi, M., Salehi, M., & Erfanian, Z. (2010). A Study of the effect of financial
leverage on earnings response coefficient throughout income approach: Iranian
Evidence. International Review of Accounting, Banking and Finance, 2(2), 104-
116.
166
Morellec, E. (2001). Asset liquidity, capital structure, and secured debt. Journal of
financial economics, 61(2), 173-206.
Mule, R. K., & Mukras, M. S. (2015). Financial leverage and performance of listed
firms in a frontier market: Panel evidence from Kenya. European Scientific
Journal, ESJ, 11(7).
Muller, G. H., Steyn-Bruwer, B. W., & Hamman, W. D. (2009). Predicting financial
distress of companies listed on the JSE-a comparison of techniques. South
African Journal of Business Management, 40(1), 21-32.
Musuva, A. M. (2013). Firm level factors and international performance of companies
listed on the Nairobi Securities Exchange. Unpublished PhD Thesis, Nairobi:
University of Nairobi.
Mutua, R. W. (2013). Effects of mobile banking on the financial performance of
commercial banks in Kenya. Unpublished MBA Thesis, Nairobi: University of
Nairobi.
Mwangi, M. N., & Iraya, C. (2014). The effects of liquidity on financial performance of
deposit taking microfinance institutions in Kenya. Unpublished MBA Research
Project, Nairobi: University of Nairobi.
Myers, S. C. (1977). Determinants of corporate borrowing. Journal of financial
economics, 5(2), 147-175.
Naceur, B, S., & Goaied, M. (2008). The determinants of commercial bank interest
margin and profitability: evidence from Tunisia. Frontiers in Finance and
Economics, 5(1), 106-130.
Naila, D. L. (2013). The effect of environmental regulations on financial performance in
Tanzania: A survey of manufacturing companies quoted on the Dar Es Salaam
167
Stock Exchange. International Journal of Economics and Financial Issues, 3(1),
99-112.
Naran, M. (2013). The effect of company size and voluntary disclosure on financial
performance of commercial banks in Kenya. Unpublished PhD Thesis, Nairobi:
University of Nairobi.
Neely, A. (2011). Business performance measurement: Unifying theory and integrating
practice (2nd ed.). Cambridge: Cambridge University Press.
Njeri, M. M. (2014). The effects of liquidity on financial performance of deposit taking
microfinance institutions in Kenya, Unpublished PhD Thesis, Nairobi: University
of Nairobi.
Njeri, M. M. K., & Kagiri, A. W. (2013). Effect of capital structure on financial
performance of banking institutions listed in Nairobi Securities
Exchange. International Journal of Science and Research, 4(7), 924-930.
Njoroge, N. (2014). The effect of firm size on financial performance of pension schemes
in Kenya. Unpublished MBA Project, Nairobi: University of Nairobi.
Njure, K. C. (2014). The relationship between liquidity and profitability of nonfinancial
companies listed in Nairobi securities exchange. Unpublished MBA Thesis,
University of Nairobi.
Obiyo, O. C., & Lenee, L. T. (2011). Corporate governance and firm performance in
Nigeria. IJEMR, 1(4), 1-12.
Oduol, E. O. (2011). The relationship between liquidity and leverage of companies
quoted at the NSE, Unpublished PhD Thesis, Nairobi: University of Nairobi.
168
Okwo, I. M., Okelue, U. D., & Nweze, A. U. (2012). Investment in fixed assets and firm
profitability: Evidence from the Nigerian brewery industry. European Journal of
Business and Management, 4(20), 10-17.
Olatunji, T. E., & Adegbite, T. A. (2014). Investment in Fixed Assets and Firm
Profitability: Empirical Evidence from the Nigerian Banking Sector. Asian
Journal of Social Sciences and Management Studies, 1(3), 78-82.
Omesa, J. N. (2015). Effect of liquidity on the financial performance of financial
institutions listed in the Nairobi securities exchange. Unpublished PhD Thesis,
Nairobi: University of Nairobi.
Omondi, M. M., & Muturi, W. (2013). Factors affecting the financial performance of
listed companies at the Nairobi Securities Exchange in Kenya. Research Journal
of Finance and Accounting, 4(15), 99-104.
Ongore, V. O., & Kusa, G. B. (2013). Determinants of financial performance of
commercial banks in Kenya. International journal of economics and financial
issues, 3(1), 237-252.
Ooghe, H., & De Prijcker, S. (2008). Failure processes and causes of company
bankruptcy: a typology. Management Decision, 46(2), 223-242.
Opler, T. C., & Titman, S. (1994). Financial distress and corporate performance. The
Journal of finance, 49(3), 1015-1040.
Orodho, J. A. (2009). Elements of education and social science research
methods. Nairobi/Maseno, 126-133.
Owolabi, S. A., & Obida, S. S. (2012). Liquidity management and corporate
profitability: Case study of selected manufacturing companies listed on the
Nigerian stock exchange. Business Management Dynamics, 2(2), 10-25.
169
Panzar, J. C., & Willig, R. D. (1981). Economies of scope. The American Economic
Review, 71(2), 268-272.
Papadogonas, T. A. (2017). The financial performance of large and small firms:
evidence from Greece. International Journal of Financial Services
Management, 2(1-2), 14-20.
Perinpanathan, R. (2014). Impact of Financial Leverage on Financial Performance
Special Reference to John Keels Holdings PLC Sri Lanka. Scientific Research
Journal (SCIRJ), 2(3), 43-52.
Pervan, M., & Višić, J. (2012). Influence of firm size on its business success. Croatian
Operational Research Review, 3(1), 213-223.
Pervan, M., Pervan, I., & Ćurak, M. (2017). The influence of age on firm performance:
evidence from the Croatian food industry. Journal of Eastern Europe Research
in Business and Economics, 2017, 1-9.
Porter, M. E. (2011). Competitive advantage of nations: creating and sustaining
superior performance. New Jersey: Simon and Schuster.
Rafiq, S., Salim, R., & Smyth, R. (2016). The moderating role of firm age in the
relationship between R&D expenditure and financial performance: Evidence
from Chinese and US mining firms. Economic Modelling, 56, 122-132.
Rajan, R. G., & Subramanian, A. (2005). What undermines aid's impact on
growth? (No. w11657). New Delhi: National Bureau of Economic Research.
Ramasamy, B., Ong, D., & Yeung, M. C. (2005). Firm size, ownership and performance
in the Malaysian palm oil industry: Asian Academy of Management. Journal of
Accounting and Finance, 1, 181-104.
170
Rao, N. V., Al-Yahyaee, K. H. M., & Syed, L. A. (2007). Capital structure and financial
performance: evidence from Oman. Indian Journal of Economics and Business,
6(1), 1.
Rehman, S. S. F. U. (2013). Relationship between financial leverage and financial
performance: Empirical evidence of listed sugar companies of Pakistan. Global
Journal of Management and Business Research. 3(2), 59-72.
Riportella, C., & Cazorla Papis, L. (2001). New approaches to the analysis of the capital
structure of SME's: empirical evidence from Spanish firms. International
Journal of Economics, 31(1/2), 159-172.
Ritchie, J., Lewis, J., Nicholls, C. M., & Ormston, R. (Eds.). (2013). Qualitative
research practice: A guide for social science students and researchers. London:
Sage.
Rubin, A., & Babbie, E. R. (2016). Empowerment series: Research methods for social
work. New York: Cengage Learning.
Runde, J. (1994). Keynesian uncertainty and liquidity preference. Cambridge journal of
economics, 18(2), 129-144.
Rutashobya, L., & Jaensson, J. (2004). Small firms’ internationalisation for development
in Tanzania. International Journal of Economics, 31(1/2), 159-172.
Saini, R. (2012). Impact of financial leverage on shareholders returns and market
capitalization: empirical evidence of telecommunication sector companies,
India. International Journal of Research in IT, Management and Engineering. 2,
12- 32.
171
Sakai, H & Asaoka, H (2003). The Japanese Corporate Governance System and Firm
Performance: Toward Sustainable Growth. Working Paper, Research Centre for
Policy and Economy, Mitsubishi Research Institute Inc. Japan (Jan).
Salim, S. B. (2012). The relationship between size and financial performance of
commercial banks in Kenya Unpublished PhD Thesis, Nairobi: University of
Nairobi.
Sanghani, D. A. (2014). The effect of liquidity on the financial performance of non-
financial companies listed at the Nairobi Securities Exchange. Unpublished
MBA Project, Nairobi: University of Nairobi.
Sanyal, P., & Mann, C. L. (2010). The financial structure of startup firms: The role of
assets, information, and entrepreneur characteristics (No. 10-17). Working
Papers.
Saunders, M., Lewis, P., & Thornhill, A. (2007). Research Methods for Business
Students, Business and Economic Journal, 624-627.
Sebhatu, K.T. (2011). Management of SACCOs from Perspective of outreach and
Sustainability: Evidence from Southern Tigrai of Ethiopia. Research Journal of
Finance and Accounting, 2(718), 222-1697
Sim, J., & Wright, C. (2000). Research in health care: concepts, designs and methods.
Califonia: Nelson Thornes.
Simerly, R. L., & Li, M. (2000). Environmental dynamism, capital structure and
performance: a theoretical integration and an empirical test. Strategic
management journal, 21(1), 31-49.
Stefanou, C. (2006). The Complexity and the Research Area of AIS. Journal of
Enterprise Information Management, 19(1), 9-12.
172
Storey, D. J. (2002). Education, training and development policies and practices in
medium-sized companies in the UK: do they really influence firm
performance? Omega, 30(4), 249-264.
Suhaila, M. (2014). The Effect of Liquidity and Leverage on Financial Performance of
Commercial State Corporations in the Tourism Industry in Kenya. Unpublished
MBA Project, Nairobi: University of Nairobi.
Taani, K. (2012). Impact of working capital management policy and financial leverage
on financial performance: empirical evidence from Amman Stock Exchange–
listed companies. Unpublished MBA Project, Nairobi: University of Nairobi.
Tahir, I. M., & Razali, A. R. (2011). The Relationship between enterprise risk
management (ERM) and firm value: Evidence from Malaysian public listed
companies. International journal of economics and management sciences, 1(2),
32-41.
Taylor,L.,& O'Connell, S. A. (1985). A Minsky crisis. The Quarterly Journal of
Economics, 100(Supplement), 871-885.
Titman, S., & Wessels, R. (2008). The determinants of capital structure choice. The
Journal of finance, 43(1), 1-19.
Topal, J. L. E. (2011). Strategies to assist in obtaining an optimal solution for an
underground mine planning problem using Mixed Integer
Programming. International Journal of Mining and Mineral Engineering, 3(2),
152-172.
Ueda, K. (2012). Deleveraging and Monetary Policy: Japan since the 1990s and the
United States since 2007. Journal of Economic Perspectives, 26(3), 177-202.
173
Upneja, A., & Dalbor, M. (2001). The choice of long-term debt in the US lodging
industry. UNLV Journal of Hospitality, Tourism and Leisure Science, 1, 1-19.
Vafeas, N. (1999). The nature of board nominating committees and their role in
corporate governance. Journal of Business Finance & Accounting, 26(1‐2), 199-
225.
Vijayakumar, R. V., & Tamizhselvan, R. (2010). The effect of firm size on profitability
of firms in Nigeria. Academic Journal, 38(3), 412-443.
Vishnani, S., & Shah, B. K. (2007). Impact of working capital management policies on
corporate performance an empirical study. Global business review, 8(2), 267-
281.
Wabwile, E. S., Chitiavi, M. S., Alala, D. O. B., Douglas, D. M., Khoo, V., Obeid, M.,
& Islam, M. (2014). Financial leverage and performance variance among banks.
Evidence of tier 1 commercial banks listed on Nairobi Security Exchange
Kenya. International Journal of Business and Management Invention, 3(4), 01-
13.
Wainaina, J. N. (2014). The relationship between leverage and financial performance of
top 100 small and medium enterprises in Kenya. Unpublished MBA Project,
Nairobi: University of Nairobi.
Wooldridge, J. M. (2005). Fixed-effects and related estimators for correlated random-
coefficient and treatment-effect panel data models. Review of Economics and
Statistics, 87(2), 385-390.
Xu, M., & Banchuenvijit, W. (2014). Factors Affecting Financial Performance of Firms
Listed on Shanghai Stock Exchange 50 (SSE 50). International Journal of
Business and Economics, 57(09), 42- 61..
174
Yahaya, O. A., Farouk, B. K. U., Yahaya, L. S., Yusuf, M. J., & Dania, I. S. (2015).
Impact of Competition on the Financial Performance of Listed Deposit Money
Banks in Nigeria. Journal of Economics and Sustainable Development, 6(18),
52-61.
Yasuda, H. (2005). Firm’s Growth and Finance Strategy, Journal of Finance, 27(1), 30-
45.
Yazdanfar, D. (2013). Profitability determinants among micro firms: Evidence from
Swedish data. International Journal of Managerial Finance, 9 (2), 150-160.
Zeitun, R. & Tian, G. (2007). Capital structure and corporate performance: Evidence
from Jordan. Australasian Accounting Business and Finance Journal. 1(4), 40-
61.
Zubair, M., & Sajid, M. (2014). Impact of Credit Risk Management on Bank
Performance: An Empirical Study from Commercial Banks of Pakistan Listed at
Pakistan Stock Exchange (PSE). Journal of Economics and Sustainable
Development, 6(18), 52-61.

175
APPENDICES
Appendix I: Target Population
No Firms Listed in NSE
Agricultural
1 Eaagads Ltd
2 Kakuzi Ltd
3 Kapchorua Tea Co. Ltd
4 The Limuru Tea Co. Ltd
5 Rea Vipingo Plantations Ltd
6 Sasini Ltd
7 Williamson Tea Kenya Ltd
Automobiles and Accessories
8 Car & General (K) Ltd
9 Marshalls (E.A.) Ltd
10 Sameer Africa Ltd
Banking
11 Barclays Bank of Kenya Ltd
12 CFC Stanbic of Kenya Holdings Ltd
13 Diamond Trust Bank Kenya Ltd
14 Equity Bank Ltd
15 Housing Finance Co. Kenya Ltd
16 I&M Holdings Ltd
17 Kenya Commercial Bank Ltd
18 National Bank of Kenya Ltd
19 NIC Bank Ltd
20 Standard Chartered Bank Kenya Ltd
21 The Co-operative Bank of Kenya Ltd
Commercial and Services
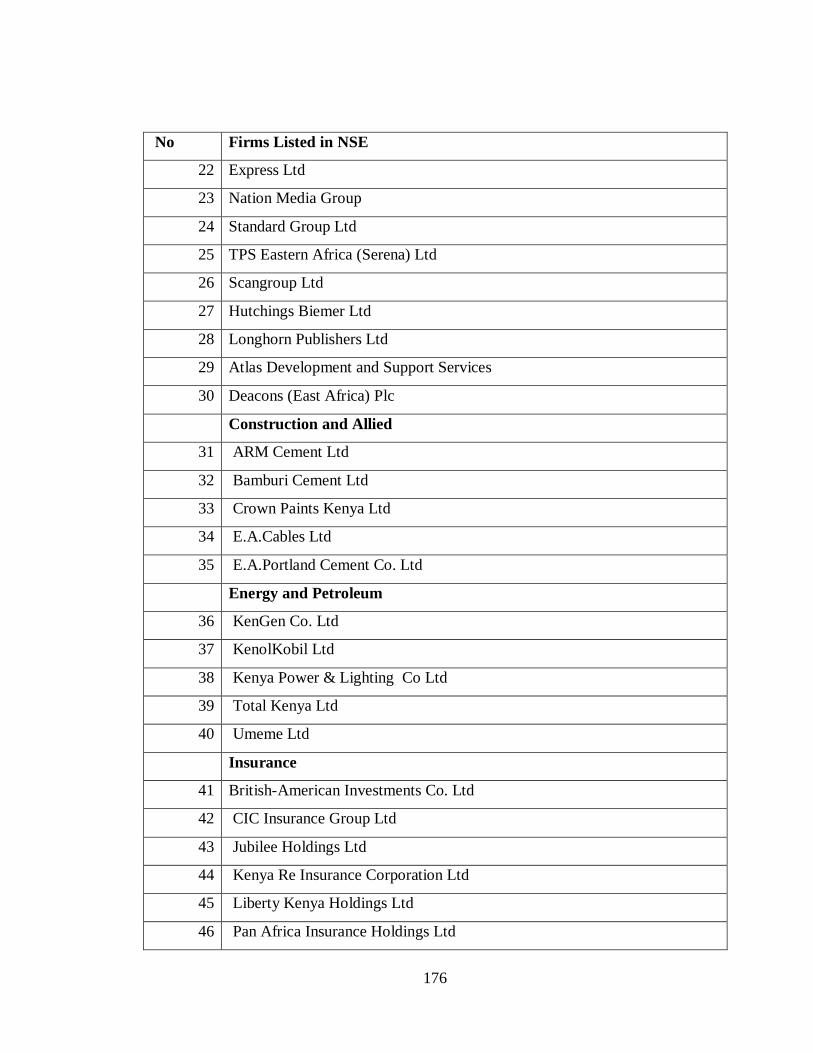
176
No Firms Listed in NSE
22 Express Ltd
23 Nation Media Group
24 Standard Group Ltd
25 TPS Eastern Africa (Serena) Ltd
26 Scangroup Ltd
27 Hutchings Biemer Ltd
28 Longhorn Publishers Ltd
29 Atlas Development and Support Services
30 Deacons (East Africa) Plc
Construction and Allied
31 ARM Cement Ltd
32 Bamburi Cement Ltd
33 Crown Paints Kenya Ltd
34 E.A.Cables Ltd
35 E.A.Portland Cement Co. Ltd
Energy and Petroleum
36 KenGen Co. Ltd
37 KenolKobil Ltd
38 Kenya Power & Lighting Co Ltd
39 Total Kenya Ltd
40 Umeme Ltd
Insurance
41 British-American Investments Co. Ltd
42 CIC Insurance Group Ltd
43 Jubilee Holdings Ltd
44 Kenya Re Insurance Corporation Ltd
45 Liberty Kenya Holdings Ltd
46 Pan Africa Insurance Holdings Ltd
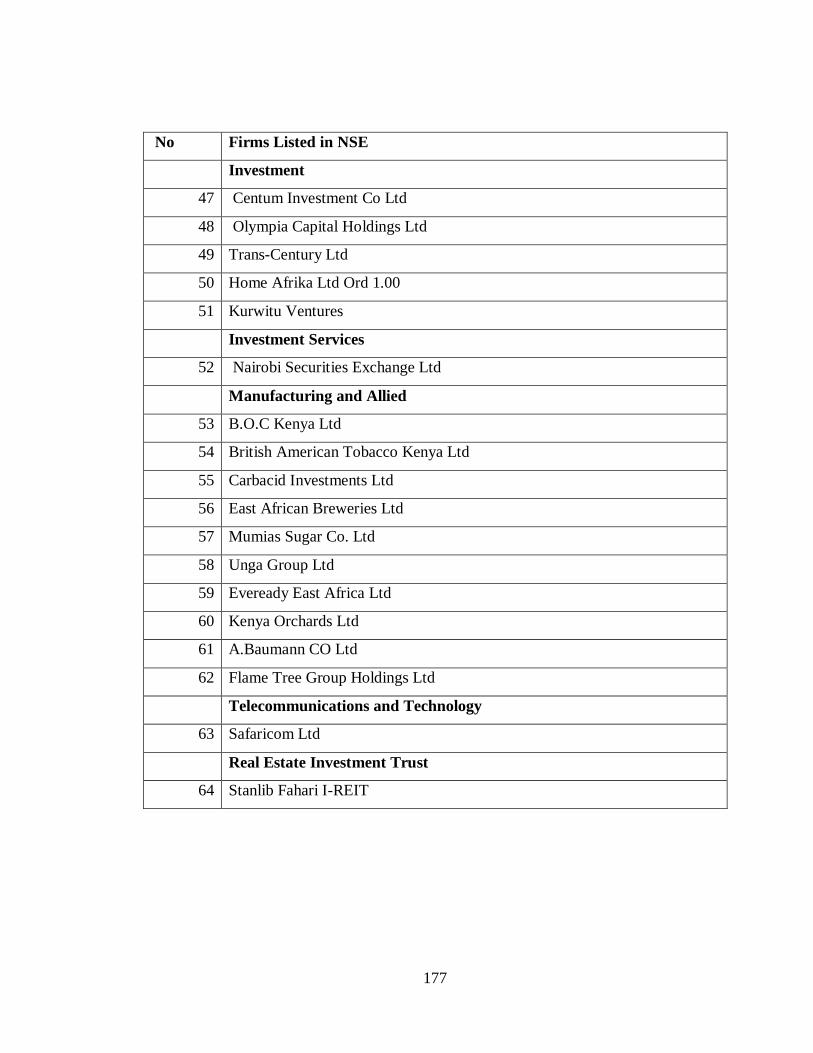
177
No Firms Listed in NSE
Investment
47 Centum Investment Co Ltd
48 Olympia Capital Holdings Ltd
49 Trans-Century Ltd
50 Home Afrika Ltd Ord 1.00
51 Kurwitu Ventures
Investment Services
52 Nairobi Securities Exchange Ltd
Manufacturing and Allied
53 B.O.C Kenya Ltd
54 British American Tobacco Kenya Ltd
55 Carbacid Investments Ltd
56 East African Breweries Ltd
57 Mumias Sugar Co. Ltd
58 Unga Group Ltd
59 Eveready East Africa Ltd
60 Kenya Orchards Ltd
61 A.Baumann CO Ltd
62 Flame Tree Group Holdings Ltd
Telecommunications and Technology
63 Safaricom Ltd
Real Estate Investment Trust
64 Stanlib Fahari I-REIT

178
Appendix II: Secondary Data Collection Template
Yea
r
Fir
m
Total
debt
Total
asset
Current
asset
Current
liability
Number of years
in operation Fixed asset ROA
RO
E
201
1 1
201
2 1
201
3 1
201
4 1
201
5 1
201
6 1
201
1 2
201
2 2
201
3 2
201
4 2
201
5 2
201
6 2