Embed Size (px)
Citation preview

Effect of Loading Frequency on Dynamic Properties
of Soils Using Resonant Column
by
Soheil Moayerian
A thesis
presented to the University of Waterloo
in fulfillment of the
thesis requirement for the degree of
Master of Applied Science
in
Civil Engineering
Waterloo, Ontario, Canada, 2012
© Soheil Moayerian 2012

ii
AUTHOR’S DECLARATON
I hereby declare that I am the sole author of this thesis. This is a true copy of the thesis,
including any required final revisions, as accepted by my examiners.
I understand that my thesis may be made electronically available to the public.

iii
ABSTRACT
Dynamic properties of soils (shear stiffness and damping ratio) are critical for the design
of structures subjected to vibrations. The dynamic properties of a benchmark
standardized laboratory sand (Ottawa silica sand) were evaluated with two different
resonant column devices, utilising software with different analytical approaches for the
evaluation of soil properties. The dynamic properties (shear modulus and damping ratio)
are evaluated as a function of the shear strain level. The results are compared to evaluate
the effect of the type of equipment and the form of the data analysis on the measured
dynamic properties of the samples. The results are discussed in light of the applicability
of the procedures in practice, the ease of the testing methods, and the errors they
introduced into analysis and design. In general, the shear wave velocities obtained from
the two different devices are in good agreement. However, the damping ratios they give
show considerable differences as strains increase.
Dynamic properties are typically measured by curve fitting of the transfer function
between the excitation and the response using the resonant column device. However, the
force function generated by sinusoidal sweep or random noise excitations induce
different shear strain levels at different frequencies. Consequently, the shape of the
measured transfer function is distorted and differs from the theoretical transfer function
for an equivalent single-degree-of-freedom system. The difference between the measured
and theoretical transfer functions as well as the bias in the computed dynamic properties

iv
becomes more pronounced with the increase in shear strain. This study presents a new
methodology for the evaluation of dynamic properties from an equivalent constant-strain
transfer function. The soil specimen is excited simultaneously using a sinusoidal
excitation (carrier signal) at the required strain level and small amplitude, narrow band
random noise. The strain level induced by the fixed sine is shown to control the resonant
frequency of the specimen; whereas the random noise introduces the required frequency
bandwidth to determine the transfer function and hence the dynamic properties at a
constant strain level. The new methodology also shows a good potential for the
evaluation of frequency effects on the dynamic properties of soils in resonant column
testing.

v
ACKNOWLEDGEMENTS
First and foremost, I would like to thank my supervisor: Prof. Giovanni Cascante for his
guidance and patience. Without his help and encouragement this thesis would not exist.
I would to thank all members in NDT group. Especially thanks to Yen Wu and Zahid
Khan for Their help through my study. My thanks are also due to Fernando Tallavo ,
Hassan Ali, Serhan kirlangic, Antonin Du Tertre and Paul Groves. I would like to also
thank Shahriar Ofavezi for his supports and advices.
I would like to thank Professor Timothy A. Newson for his guidance and helps and also
Lisa Katherine Reipas for her helps.
I am forever indebted to my parents and my sister for their understanding, endless patient
and love.
Finally, Many thanks to my patient and loving wife, who gave me strength trough this
work and she support me and encourage me whenever I was tired. Thanks to my lovely
Kian and Nika for their motivation.

vi
TABLE OF CONTENTS
AUTHOR’S DECLARATION ii
ABSTRACT iii
ACKNOWLEDGEMENTS v
TABLE OF CONTENTS vi
LIST OF TABLES x
LIST OF FIGURES xi
CHAPTER 1
INTRODUCTION
1.1 DEFINITION OF THE PROBLEM 1
1.2 RESEARCH OBJECTIVE AND METHODOLOGY 5
1.3 THESIS ORGANIZATION 6
CHAPTER 2
DYNAMICS BEHAVIOR OF SOILS
2.1 INTRODUCTION 8
2.2 MECHANICAL WAVES 9
2.2.1 Compression Waves 9
2.2.2 Shear Waves 10
2.2.3 Rayleigh Waves 11

vii
2.3 DAMPING RATIO 11
2.4 DYNAMIC PROPERTIES IN THE LABORATORY 12
2.5 FACTORS AFFECTING THE DYNAMIC RESPONSE 18
2.5.1 Cyclic Shear Strain 18
2.5.2 Stress/Strain Rate 20
2.5.3 Duration of Excitation 21
2.5.4 Moisture Content 22
2.5.5 Confinement 24
2.5.6 Frequency 25
2.6 CHAPTER SUMMARY 27
CHAPTER 3
RESONANT COLUMN TESTING
3.1 INTRODUCTION 29
3.2 BACKGROUND 31
3.3 THE UNIVERSITY OF WATERLOO DEVICE 40
3.4 CALIBRATION - DRIVING SYSTEM 43
3.5 REDUCTION OF EQUIPMENT GENERATED DAMPING 45
3.6 EXPERIMENTAL METHODOLOGY 47
3.7 VOLTAGE-MODES AND CURRENT-MODE SOURCES 48
3.7.1 Voltage Source 48
3.7.2 Current Source 49

viii
3.8 EQUIPMENT EFFECTS 50
CHAPTER 4
NEW METHOD FOR THE EVALUATION OF DYNAMIC PROPERTIES
OF SOILS USING A STRAIN CONTROLLED EXCITATION
4.1 INTRODUCTION 56
4.2 EXPERIMENTAL SETUP AND EXPERIMENTAL PROGRAM
4.2.1 RC Method 59
4.2.2 NR Method 60
4.2.3 FN Method 58
4.3 RESULTS AND DISCUSSIONS 62
4.4 CONCLUDING REMARKS 69
CHAPTER 5
EQUIPMENT EFFECTS ON DYNAMIC PROPERTIES OF SOILS IN
RESONANT COLUMN
5.1 INTRODUCTION 71
5.2 EXPERIMENTAL PROGRAM 73
5.3 SAMPLE PREPARATION 76
5.4 RESULTS AND DISCUSSION 77
5.5 CONCLUDING REMARKS 87

ix
CHAPTER 6
CONCLUSIONS AND RECOMMENDATIONS
6.1 CONCLUSIONS 88
6.1.1 Equipment Modifications 88
6.1.2 Development of New Methods for the Evaluation of Dynamic
Properties 89
6.1.3 Effect of Resonant Column Properties on Dynamic Soils
characteristics 89
6.2 RECOMMENDATION AND FUTURE STUDIES 90
REFERENCES 91
APPENDIX A TRANSFER FUNCTION METHOD 102
APPENDIX B COMPARISON OF DIFFERENT METHODS OF RC
TESTING 104
APPENDIX C SOLUTION FOR NON-RESONANT (NR) METHOD 109

x
LIST OF TABLES
Table 2.1 Soil behaviour and shear strain level. 19
Table 2.2 General Trends in Attenuation (after Badali and Santamarina,
1992).
26
Table 3.1 Characteristics of calibration bars. 43
Table 4.1 Characteristic of different resonant column testing method 71
Table 5.1 Characteristics of the aluminum probes. 75
Table 5.2 Change in height and void ratio during the test. 75
Table 5.3 Summary of Ottawa sand results for low shear strain levels
(2.7*10-6
< γ < 1.0*10-5
).
80

xi
LIST OF FIGURES
Figure 2.1 Shear strains mobilized in in-situ and common laboratory
techniques (from Ishihara 1996)
13
Figure 2.2 Fixed-free resonant column schematic 15
Figure 2.3 Frequency dependence of damping ratio within soil mass
(Shibuya et al., 1995)
21
Figure 3.1 Transfer functions from RC measurements fitted with
theoretical TF (fo = 42 Hz, γ = 5.27 x 10⁻⁴
)
34
Figure 3.2 Transfer functions from equal strain and frequency sweep
(RC) measurements (fo = 51 Hz, γ = 9.54 x 10⁻⁵
)
36
Figure 3.3 Comparison of simulated NR and the NTF tests results for a
soil specimen: f o = 29 Hz, ξ = 0.68%, and VS= 257.7 m /s
40
Figure 3.4 Typical setup and instrumentation 42
Figure 3.5 Sample position and magnets 42
Figure 3.6 Calibration bars 44
Figure 3.7 Additional mass for I0 calculation 44
Figure 3.8 (a) Schematic diagram of the solenoid-magnet unit; (b) the
drive system (top view)
46
Figure 3.9 Equipment-generated damping ratio from RC measurements
in previous research
47
Figure 3.10 (a) Voltage-mode and (b) current-mode sources 49
Figure 3.11 Basic schematic of fixed-free base resonant column device
(Stokoe type)
51
Figure 3.12 Typical instrumentation for resonant column device RCD-1 52

xii
Figure 3.13 Typical instrumentation for resonant column device RCD-2 54
Figure 4.1 Transfer functions from FN measurements fitted with
theoretical TF (fo = 42 Hz, γ = 5.27 x 10⁻⁴
)
62
Figure 4.2 Comparison of transfer functions from RC, equal strains, and
FN measurements (γ = 9 x 10⁻⁶
)
64
Figure 4.3 Evaluation of dynamic properties as function of frequency
from NR and FN method (σo = 50 kPa, γ= 9.5 x 10⁻⁶
)
66
Figure 4.4 Evaluation of dynamic properties as function of frequency
from NR and FN method (σo = 120 kPa, γ= 9 x 10⁻⁶
)
67
Figure 4.5 Evaluation of dynamic properties as function of shear strain
from RC, NR and FN methods (σo = 50 kPa)
69
Figure 5.1 Calibration bar for systems (a) RCD-1 and (b) RCD-2. 74
Figure 5.2 Grain size distribution of silica sand used (Barco sand #49). 77
Figure 5.3 Damping vs. shear strain level for aluminum probes. 81
Figure 5.4 (a) Damping vs. shear strain level and (b) shear modulus vs
shear strain leve,l at σ' = 30 KPa.
82
Figure 5.5 (a) Damping vs. shear strain level and (b) shear modulus vs
shear strain leve,l at σ' = 60 KPa.
83
Figure 5.6 (a) Damping vs. shear strain level and (b) shear modulus vs
shear strain leve,l at σ' = 120 KPa.
84
Figure 5.7 (a) Damping vs. shear strain level and (b) shear modulus vs
shear strain leve,l at σ' = 240 KPa.
85
Figure 5.8 (a) Damping vs shear strain level and (b) shear modulus vs
shear strain level at σ' = 240 KPa, with hyperbolic model.
86

1
CHAPTER 1
INTRODUCTION
1.1 DEFINITION OF THE PROBLEM
The evaluation of soil properties by sampling methods is a powerful tool in
geotechnical engineering. Dynamic properties of soils are used to solve problems such as
response of foundations and structures to earthquake loads, machine excitations and wind
and wave loads (Humar 2005). Soil characteristics are required before any geotechnical
design. Shear wave velocity and damping ratios are dynamic properties required for soil
characterization. The new National Building Code of Canada (NRC 2010) and allows the
use wave velocity and acceleration factors for different soil classes; which are selected
based on the average shear wave velocity of the top 30 m of the site profile.
Wave-based methods are well suited for lower depth measurements and the
induced strain is small enough to assume that the medium responds in the elastic range
(Cevic 2009). When a detailed space distribution of properties is needed, seismic
methods provide unique complementary information not only to extrapolate data from
boreholes but also to monitor processes (Groves et al. 2011). Seismic methods were used
in the past decades to evaluate interfaces and structures in hydrocarbon exploration.
Currently, wave-based methods are also used to infer properties of geomaterials such as

2
porosity, mineralogy, saturation and pore pressure (Cao et al. 2010, Crow et al. 2011,
Tallavo et al. 2011).
The dynamic properties of soils can be measured either in the field or in the
laboratory. In-situ testing facilitates determination of dynamic properties of soil in
undisturbed state, and involves a large mass of soil (Groves et al. 2011, Crow et al.
2011).
In-situ measurement of dynamic properties may be affected by many sources of
errors such as soil layering, inclusions, reflections from layers interfaces, and depth
limitations of the testing technique. Wave propagation occurs during in-situ
measurements, which introduces radiation damping; making it more difficult to
quantifying the material damping ratio in-siu (Yang et al. 2010; Jiang et al. 2011; Das
and Ramana 2011, Tsui 2009). On the other hand, laboratory determination of the
dynamic properties is convenient and allows easy and precise control on different
parameters that affect the soil properties. Laboratory determination of the dynamic
properties is also affected by unknown sources of errors and unverified assumptions used
in the analysis of data (Khan et al. 2008; Park 2010; Naggar 2008; Cascante et al. 2005) .
Resonant column and cyclic triaxial testing are ASTM standard tests and are
widely used for the evaluation of dynamic properties of soils (ASTM 2000; Cascante et
al. 2005). Having results from both these tests helps geotechnical engineers to know the
behavior of sample in a wide frequency range between 0.01 Hz to 200 Hz. The resonant
column is capable of determining dynamic properties at shear strain levels from very low
(γ <10-6
) to mid shear strain level (γ <10-3
). Moreover, shear modulus and damping ratio

3
are measured independently of each other, contrary to the principle of causality and
excessive number of cycles are imposed. To address some of these issues, a non-
resonance method based on simultaneous evaluation of dynamic properties at different
frequencies has been recently developed and tested at only very low strain levels. (Khan
et al. 2008)
For large strain dynamic characterization of soils, the cyclic triaxial device have
limitations in attainable strains and loading frequencies. Therefore, an appropriate set of
devices may be needed to evaluate dynamic properties at wider range of strains and
frequencies (Khan et al. 2011; Tsui 2009). Models predicting dynamic properties as a
function of shear strain and frequency should only be reliable if they are developed based
on reliable laboratory results. The resonant column device, RCD, provides more
consistent test results; and it is considered one of the most accurate ways to determine the
dynamic properties of soils at low to mid shear strain levels (ASTM 2000; Park 2010;
Cascante et al. 2005; Khan et al. 2008). Resonant column (RC) tests are accurate and
reliable; however, the effect of the excitation frequency and of different equipment
characteristics on the results has not yet been evaluated. This is especially true in the
damping measurements, which are significantly affected by the electro-motive force
(EMF) (Cascante et al. 2003; Wang et al. 2003, Rix and Meng 2005).
The RC tests can vary in their configuration and the analytical methods used for
the computation of the dynamic properties. While many testing programs were used to
measure the dynamic properties of soils on a single resonant column apparatus (Stokoe et
al. 1994, Dobry and Vucetic 1987; Cascante and Santamarina 1997, Khan et al. 2005,

4
Camacho et al. 2008), very few have evaluated the dynamic properties of the same soils
as function of frequency and on different RC equipment. In most cases, in which a soil
was tested on two different RC equipment, the tests were for calibration purposes, when
the RC had been modified to accommodate different samples (e.g. stiffened base,
Avramidis and Saxena 1990; Khan 2008). In this case, however, the same test method
and data analysis are used in the initial and modified state of the RCDs. Fewer
comparisons have been conducted with two RCDs that use different testing methods and
different data analysis.
The standard RC testing method is based on harmonic excitation, sweeping the
frequency around resonance. The transfer function is determined with small frequency
increments in order to get precise values of damping and resonant frequency. This
procedure is time consuming, especially for low damping materials that present sharp
resonant peak. To overcome this limitation, random noise and sinusoidal sweep
excitations were used (Park 2010, Prange 1981, Aggour et al. 1989, Cascante and
Santamarina 1997). However, these excitations do not impose a constant strain on all
frequencies; thus the reliability of the measurement rests on the definition of an
equivalent strain level.
Previous studies have discussed the effect of different strain levels in frequency
sweep tests (e.g. Cascante et al. 1997; Khan et al. 2008, Tsui 2009, Turan et al. 2009).
These studies concluded that the error in the measured damping ratio increases with the
increase in strain level because of the non-symmetrical shape of the measured transfer
function. Although the measured transfer function can be curve fitted within acceptable

5
error at low strain levels, the goodness of the fit declines with the increase in shear strain
level (Khan et al. 2008). Moreover, the effect of frequency on the dynamic properties is
difficult to evaluate in the conventional RC testing and the recently proposed non-
resonance (NR) method.
1.2 RESEARCH OBJECTIVES AND METHODOLOGY
The overall goal of this research is to investigate the effect of frequency on the
dynamic properties of soils. The main objectives of this work are to develop a new
method for the evaluation of dynamic properties of soils as a function of frequency and
shear strain levels in the resonant column; and to evaluate the effects of different reonant
column equipment and data analysis procedures on the dynamic characterization of sands
and clays. For the first objective, a modified, Stokoe-type resonant-torsional column
apparatus is used in this study. The calibration probes of lower resonant frequencies were
selected to avoid the effects of base fixidity (Khan et al. 2008b). RC tests were
performed on a sand specimen at a two confinements. The tests were performed using
conventional RC method, NR method (using equal strains), and the proposed
methodology (FN) at different shear strain levels. The details of test setup and
methodology for each method are presented in the following sub-sections. The proposed
new method is based on the novel idea of applying simultaneously sinuandal and
random noise excitatiobns. Controlled sand samples are used to assess the validity of the
proposed method. For the second objective, two different resonant columns are used: the
resonant column developed at the University of Waterloo, and a resonant column device

6
that is commercially available (GDS Instruments). The effects of different equipment are
evaluated by comparing resonant column tests on sands and clays. Excatly the same
sample preparation techniques were used to enhance the difference in wave velocity and
damping rations introduced because of the differences in the equipment and the data
analysis procedures.
1.3 THESIS ORGANIZATION
Chapter 1 presents an introduction, the objectives and the general outline of the
thesis. Chapter 2 provides the general background and review of the wave propagation,
discusses the important factors affecting the dynamic properties, and the experimental
techniques used for the measurement of dynamic properties. Chapter 3 evaluates two key
assumptions in the analysis of resonant column results. The assumptions of the linearity
of the first mode of vibration and fixed base are investigated. A new model based on the
two-degree-of-freedom system instead of conventional single-degree-of-freedom is
presented for the analysis of the resonant column measurements. Chapter 4 presents the
evaluation of dynamic properties using two different resonant column devices to evaluate
the effect of different instrumentation analysis methods on the measured dynamic
properties. Controlled conditions are used for testing dry sand with constant density and
confinement. Chapter 5 presents the evaluation of the frequency-dependent dynamic
properties in the resonant column. This is usually difficult to assess in conventional
resonant column tests. A new technique is proposed to measure the shear modulus and
damping ratio simultaneously at a single frequency. Moreover, the non-resonance

7
methods, as well as the resonant method, are evaluated at larger frequency range and
shear strain levels for comparison with our result from proposed techniques. Degradation
of dynamic properties with shear strains using one frequency is included, which enables
the comparison of results from resonant column using different methods.
Finally, the main conclusions and recommendations for further research are
discussed in Chapter 6.

8
CHAPTER 2
DYNAMIC BEHAVIOR OF SOILS
2.1 INTRODUCTION
Shallow shear-wave velocity (VS) profiles are used in a variety of earthquake
engineering applications, including site response in sedimentary basins, liquefaction
analyse sand soil–structure Interaction evaluations. It is an important parameter in
building codes and the engineering community widely uses VS in design applications.
Hazard mapping methodology, particularly in urbanized areas, advances with the
incorporation of more accurate local VS information. This trend is expected to accelerate
with future expansion of these efforts. VS velocity has become the standard property
from which in-situ shear modulus is determined because of its relative ease of
measurement with seismic prospecting. (Raptakis, 2011)
Dynamic properties of soils are used to evaluate the dynamic response of soils at
different strain levels in geotechnical engineering. Shear modulus and material damping
ratio are the most important dynamic properties of soils. Wave propagation theory has
been widely used to measure material properties. This chapter starts with a brief
discussion on wave propagation modes and velocity, followed by a review of energy loss
mechanisms in materials. Then, the factors that affect the dynamic response and the
laboratory procedures used to measure damping are reviewed.

9
2.2 MECHANICAL WAVES
There are mainly two types of waves: body waves (compression and shear) and
Rayleigh waves. Their features are described next.
2.2.1 Compression Waves
Compression waves, also known as P-waves, can propagate through the soil
media generating particle motions that are parallel to the direction of propagation.
Essentially, a particle is deformed (compressed) by the propagating wave, transferring its
energy to an adjacent particle; similar to a linear arrangement of particles interconnected
with springs.
Wave velocity is the ratio of the stiffness and the inertia of a material. The
velocity of P-waves in an isotropic full-space is given by (Achenbach, 1984)
VG M
P
2
(2-1)
where η and G are Lame's constants, G is also called the shear modulus, is the mass
density of the medium, and M is the constrained modulus. The compressional wave
velocity in an elastic-circular rod, when the wave length is much greater than the radius
of the rod, is given by (Achenbach, 1984)
VE
E
(2-2)

10
where E is Young's modulus. Equations 2-1 and 2-2 indicate that compressional waves
travel faster in the infinite space than in a rod (Poisson's ratio 0), because the lateral
displacements are constrained in the infinite medium, leading to higher stiffness. P-
waves are subjected to "geometric dispersion" as implied by Equation 2-1 and 2-2.
There are two types of compressional waves in saturated soils (Biot, 1956):
compressional waves of the 1st and 2
nd kind. Waves of the 1
st kind have low attenuation
and propagate with very little dispersion. In this case, the liquid and the solid tend to
move in-phase. Compressional waves of the 2nd
kind attenuate very rapidly and have
significantly lower velocity. They are also called diffusional waves (Stoll, 1978); the
liquid and the solid tend to move out-of-phase. A comprehensive study of wave
propagation in saturated media was reviewed by Bourbie et al. (1987).
2.2.2 Shear Waves
The particle motion in shear waves is perpendicular to the direction of
propagation. Shear waves are not subjected to geometric dispersion as P-waves are.
Thus, the velocity of propagation in either an infinite space or a rod is the same, and it’s
given by (Humar J.L., 1970)
VG
s
(2-3)
Shear waves can be polarized in any given plane. This property has been used in
many experimental studies (e.g., Stokoe and Hoar 1977; Auld 1977). There is only one

11
type of shear wave in saturated porous media that can travel through the rigid skeleton,
affected only by the soil inertia and fluid viscosity.
2.2.3 Rayleigh Waves
Rayleigh waves (also known as surface waves) travel along the surface of a
relatively thick solid material penetrating into a depth of one wavelength. Its particle
displacement consists of elliptical motions in the vertical plane and parallel to the
direction of propagation. The amplitude decreases with the depth. The material returns
to its original shape subsequent to the particle displacement generated by the passing
wave. For an input excitation generated at the surface of an elastic half-space, the
Rayleigh waves are formed and they propagate outward from the source in a cylindrical
wave front. The particle motion appears to be a combination of compression and shear
waves, with components parallel and perpendicular to the direction of propagation. The
particle displacement perpendicular to the direction of propagation attenuates faster than
the longitudinal motion.
2.3 DAMPING RATIO
It is defined as the ratio between the system damping and the critical damping (no
oscillatory movement involved). From the equation of motion for a single degree of
freedom system with viscous damping, the damping ratio is expressed as (Humar J. L.,
2005)

12
(2-4)
where Cc is the critical damping coefficient, C is the system damping coefficient
[N/(m/s)], k and m are the stiffness and the mass of the system, respectively.
The critical damping corresponds to the limit between oscillatory motion and
non-oscillatory motion. The system is over-damped for D > 1, critically damped for D=1
and under damped for D < 1.
2.4 DYNAMIC PROPERTIES IN THE LABORATORY
In current practice of geotechnical engineering, the measurement of dynamic
shear modulus and damping ratio is performed independently. Different in-situ and
laboratory techniques are used for this purpose. In general, laboratory techniques provide
more accurate measurements compared to in-situ measurements; however, there are
limitations and assumptions associated with laboratory techniques. Laboratory
measurements are very difficult to operate at very low strain levels. Only resonant
column and pulse velocity techniques (bender elements, ultrasonics) offer the very small
strain level measurements. Figure 2.1 illustrates the strain levels achieved in most
common in-situ and laboratory techniques.
DC
C
C
k mc
2

13
Figure 2.1: Shear strains mobilized in in-situ and common laboratory techniques
(Ishihara 1996)
The resonant column device permits testing a specimen under axi-symmetric
loading in steady state vibration and in free vibration (Fig. 2-2). There are different types
of resonant columns, depending on boundary conditions and mode of vibration.
Wilson and Dietrich (1960) developed a fixed-free resonant column to measure
both longitudinal and torsional vibrations. Hardin and Richart (1963) described two
devices with free-free end conditions to measure torsional and longitudinal vibrations.
Hardin and Music (1965) developed a resonant column device which allowed the
application of deviatoric axial loads. All these devices were designed to operate at small
strains (in the range of 10-5). In 1967, Drnevich developed a free-fixed resonant column
which allowed for strains greater than 10-4. Later, devices that combine resonant column
and torsional shear were designed to measure dynamic properties of soils for shear
10 -4 10 -3 10 -2 10 -1 10 -0 10 1
Shear Strain (%)
In Situ Seismic
Resonant Column
Torsional Shear
Cyclic triaxial
Earthquakes

14
strains between 10-6 and 10-1 (Drnevich, 1978; Drnevich et al., 1978; Isenhower,
1980).
In the resonant column test, a solid or hollow cylindrical specimen is subjected to
harmonic excitation by an electromagnetic driving system. In a fixed-free configuration,
the specimen is assumed fixed at the base and free at the top. The mass attached to the
top of the specimen (driving plate) is driven by sets of coils and magnets. The soil can be
excited in torsional, flexural, and axial modes of vibration at different confinements and
shear strain levels.
In the fixed-free configuration of the resonant column, the distribution of angular
rotation (φ) along the specimen is given by a quarter-sine function if the mass polar
moment of inertia of the driving plate tends to zero (Io = 0). Conversely, the distribution
of angular rotation approaches a straight line as the ratio of the mass polar moment of
inertia of the specimen (I) and the drive plate I/Io tends to zero (Fig. 2.2).
Two parameters are obtained from resonant column measurements: resonant
frequency and damping coefficient. Wave velocity and attenuation are computed from
these measurements. The computation of the damping coefficient assumes an equivalent,
uniform, linear viscoelastic specimen, i.e. Kelvin-Voigt model (Hardin 1965, Hardin and
Scott 1966). This model predicts a response similar to the response observed in sand
specimens, even though damping in sands is not necessarily of viscous nature (Hardin,
1965; Hardin and Scott, 1966). The frequency dependency of wave velocity and

15
attenuation is difficult to obtain with this device because of problems involved in
measuring high resonant modes (see Stoll, 1979 for alternative approaches).
Figure 2.2: Fixed-free resonant column schematic
The effect of the rigid mass at the top of the sample is important for the
calculation of shear wave velocity and the shear strain at resonance. If the rigid mass
tends to zero, the first mode is a quarter sine wave, hence the shear strain is not constant
throughout the height of the sample. If the rigid mass tends to infinity compared with the
mass of the sample, the first mode approaches a straight line and the shear strain is
constant at a given radius (Woods, 1978).
Several testing effects on resonant column results have been studied including:
aging due to number of cycles (Drnevich and Richart, 1970), coupling between the
specimen and end platens (Drnevich, 1978), restraint of the sample due to end platens
<¼ sine for
(z)
I
I/Io ≈ 0
Io
Base assumed fixed
Torsional Input
Spec
imen
φ (rotation angle)

16
(Alarcon-Guzman, 1986) and membrane penetration (Frost, 1989; Drnevich, 1985;
suggested that the latex membrane should have a thickness less than 1% of the specimen
diameter). In general, these effects are negligible when the shear strain amplitude is small
(γ < 10-4). Furthermore, small deformations permit assuming in-plane strain conditions
in data interpretation. The shear strain varies radially throughout the specimen; the
representative value most often selected is the shear strain at r = 0.707*R, where R is the
radius of the sample. This strain is an average strain for the volume of the sample.
The solution of the motion of resonant column specimen to applied torque is
presented in Appendix A. In conventional resonant column tests, the solution is obtained
by considering an elastic medium with negligible damping ratio. The equation has the
form (Lai et al., 2001)
2
2222
2)(
tan
1
)(
)(
o
SS
P
i
o I
G
H
G
H
HJeT
(2.5)
where To is the applied harmonic torque, φ is the rotation angle of the specimen, ϕ is the
phase lag between torque and rotation angle, GS is the shear modulus, ρ is the density, JP
is the polar moment of inertia, H is the height of the specimen, and ω is the excitation
frequency. At resonance, the excitation frequency ω = ωo and due to negligible damping
the response of the system (rotation) becomes so large that the left hand side of Eq. 2.5
tends to zero. At this condition the solution becomes (Lai et al., 2001)
17
S
o
S
o
o G
H
G
H
I
I2222
tan
(2.6)
Damping ratio in conventional resonant column tests is defined as the ratio
between system damping and critical damping. From the equation of motion of a single
degree of freedom system with viscous damping, the damping ratio is expressed as
(Humar J. L., 2005)
mk
C
C
C
c 2
(2.7)
where Cc is the critical damping coefficient, C is the viscous damping coefficient
[N/(m/s)], k and m are the stiffness and mass of the system, respectively. The critical
damping represents the limit between harmonic motion and non harmonic motion; the
system is over-damped for ξ > 1, critically damped for ξ = 1 and under damped for ξ < 1.
The solution of Eq. 2.6 yields the elastic shear modulus of specimen material, and
its material damping ratio has to be evaluated independently. However, in a viscoelastic
medium the dynamic properties are not independent and have to be evaluated
simultaneously. A convenient method is to replace the shear modulus in Eq. 2.5 with
complex shear modulus using the viscoelastic correspondence principle as discussed
before. Solving Eq. 2.5 based on complex modulus allows the determination of
frequency dependent dynamic properties. The procedure of determining frequency
dependent dynamic properties in resonant column is known as non-resonance method
(Lai et al., 2001).

18
Both conventional and non-resonance methods in resonant column can be
performed in voltage based or current based measurements (Cascante et al., 2003).
Voltage based measurements yield significantly large damping ratios; therefore, the
values have to be corrected. Cascante et al. (2003) present transfer functions for the
correct measurement of damping ratio from either voltage or current based
measurements.
2.5 FACTORS AFFECTING THE DYNAMIC RESPONSE
The most important factors that affect the dynamic behaviour of soils can be
divided into two main categories (Kramer, 1996). Firstly, external variables such as
stress/strain path, stress/strain magnitude, stress/strain rate, and stress/strain duration can
affect the dynamic property of soils. Secondly, the characteristics of the material, such as
soil type, size and shape of soil particles, and void ratio, can affect the response of the
material to any dynamic loading.
2.5.1 Cyclic Shear Strain
Experimental results show that the magnitude of applied stress or strain is the
most important external variable affecting the soil’s dynamic behaviour .The strain level
induced in soil mass are measured during dynamic excitation.
The response of soils below the linear cyclic threshold shear strain (Vucetic,
1994) is linear but not elastic, since energy dissipation occurs even at very small strain
levels (Lo Presti and Pallara, 1997; Kramer, 1996). The linear response of a soil is

19
exhibited by constant soil stiffness; whereas, energy dissipation at very small shear strain
levels occurs due to the time-lag between cyclic strain and stress (typical of viscoelastic
behaviour). Soil properties are also independent of the number of excitation cycles below
linear cyclic threshold shear strain level (Ishihara, 1996).
Experimental observations of the soil response in small strain level are
characterized by permanent changes in volume in drained tests and development of pore
pressure in undrained tests (Vucetic, 1994). The response of soils is non-linear
viscoelastic; however, material properties do not change significantly at this stage, and
little degradation is measured by way of the number of cycles.
In an intermediate strain level, also called pre-failure, instantaneous energy
dissipation/losses occur over a finite period of time in function of the number of cycles.
In this level the degradation of soil properties is demonstrated not only within the
hysteretic loop but also with the increase of number of cycles (Ishihara, 1996). The
behaviour of soils in this shear strain range is characterised as non-linear elasto-visco-
plastic.
Energy losses occurring below the volumetric threshold shear strain are
considered as viscoelastic in nature, e.g., they only occur over a finite period of time. The
value of volumetric threshold shear strain varies with the soil type. The upper region
corresponding to this range is 0.005 % for gravels, 0.01 % for sands, and 0.1 % for
normally consolidated high plasticity clays (Bellotti et al.,1989; Vucetic and Dobry,
1991).

20
Table 2.1: Soil behaviour and shear strain level (Ishihara, 1996)
Shear Strain
Very Small
γ < 10-7
Small
10 -6
< γ < 10-3
Intermediate
10 -3
< γ < 100
Large
> 100
Soil Behavior Linar Inelastic Non Linear
Viscoelastic
Non- Linear
Viscoplastc
Failure
There are three factors that limit the strain levels that can be obtained in resonant
column testing. First, limited torque in the drive system; second, limited travel in the
drive system; and third, limits in the deflection measuring system. By decreasing the
length of the specimen, a higher strain can be achieved for the same rotation of the drive
in a resonant column test. By fabricating taller base platens, shorter specimens can be
employed. An additional benefit to using short specimens in torsional shear testing is that
the resonant frequency of the specimen and drive plate system will be higher. This allows
testing at higher frequencies without inducing significant inertial effects. The third
limitation on strain in torsional shear testing is limits in the deflection sensor. The use of
shorter specimens largely mitigates this limitation. Micro proximitors are typically
employed to measure rotations of the RC/TS drive plate, from which strains can be
calculated. The proximitor calibration was performed using a milling machine to obtain
an accurate measurement between the proximitor and target . Sasanakul showed that the
average linear range for the two proximitors is about 0.216 cm and that strain levels up to
about 1.5% can be measured for a soil specimen with an aspect ratio of 2:1. One solution
to measure higher strains is to employ a less sensitive proximitor with a large linear

21
measurement range. Another solution is to make a local strain measurement using a
strain gage attached to the specimen membrane. (Bae, Y. S., 2009)
2.5.2 Stress/Strain Rate
Important external variables that affect the soil response are the stress/strain rate
(frequency of excitation) and the duration (number of cycles). A number of studies have
investigated the frequency effect on the response of soils (Dobry and Vucetic, 1987;
Vucetic and Dobry, 1991; Shibuya et al., 1995; Malagnini 1996; Lo Presti et al., 1996).
Results from these studies indicate that frequency effect depends on the strain level. The
stiffness generally increases with the frequency, and low plasticity soils exhibit the
lowest sensitivity to frequency.
Studies have shown that the damping ratio is frequency dependent at certain
bandwidths, and frequency independent at others (Hardin and Drnevich, 1972; Shibuya
et al., 1995; Lo Presti and Pallara, 1997). Shibuya et al., (1995) suggests the following
conceptual diagram:

22
Figure 2.3: Frequency dependence of damping ratio within soil mass (Shibuya et
al., 1995).
2.5.3 Duration of Excitation
The duration of excitation (also known as number of cycles) may significantly
affect the soil’s response to dynamic excitation. Experimental results show that in clayey
soils and dry sands, the effect of the number of cycles is negligible at very small strain
levels (Shibuya et al., 1995; Lo Presti and Pallara, 1997). The effect of the number of
cycles becomes more significant as the shear strain level increases. In the case of sandy
soils, as the number of cycles is increased, the stiffness increases in drained conditions;
whereas, it decreases under undrained conditions (Dobry and Vucetic, 1997). The lower
stiffness is associated to the decrease in the effective stress due to an increase in the pore
pressure.

23
There are several factors, such as cyclic pre straining, creep, relaxation,
anisotropy, digenetic processes, degree of saturation, and drainage conditions, that may
affect the degradation of dynamic properties.
2.5.4 Moisture Content
When the soil mass is accelerated by the propagating wave, the fluid and the soil
particles are subjected to different inertial forces. Viscous shear stresses develop within
the pore fluid, decreasing away from the pore wall. (Winkler and Nur, 1982). Strong
coupling of the solid and liquid phases exists for compressional waves; conversely, a lack
of coupling is exhibited for shear waves.
Dynamic stiffness and damping characteristic were found to be substantially in
dependent of saturation ratio in the range of 25-75%. However, by approaching the full
saturation state, the values of modulus fall sharply and damping of loose samples
increases dramatically from corresponding values of unsaturated levels. Results of
drained tests revealed that most of increase in shear modulus and decrease in damping
take place in the first 30 cycles. It was found that vertical consolidation stress is the most
important parameter which affects shear modulus and damping ratio of sand. Similarly,
relative density or void ratio significantly affects dynamic stiffness and damping under
undrained conditions. Moreover, the influence of shears strain amplitude should be
considered for both drained and undrained tests. ( Jafarzadeh, 2011)

24
The attenuation and dispersion of low strain waves (γ < 10-6) is controlled by the
degree of fluid saturation and the frequency content of the wave (Murphy 1983; Winkler
and Nur 1982). The strain amplitude dependence increases in water-saturated rocks
(Winkler et al., 1979). Other mechanisms, such as the flow of droplets and the
compression of the gaseous phase, participate in partially saturated media. These
mechanisms specify the increase in attenuation with saturation, and the final reduction in
attenuation when the medium reaches 100% saturation (Winkler and Nur, 1979).
The attenuation of compressional and shear waves responds differently in fully
saturated and partially saturated media. In fully saturated media, the cracks and pores are
compressed uniformly by the traversing P-wave producing no substantial fluid flow. Pure
shear causes compression in some regions and dilation in others, enhancing the fluid
flow. Thus, attenuation in fully saturated media is expected to be higher in shear than in
compression. In the case of compression, the energy lost can be twice as great as the
energy lost in shear. Furthermore, the large compressibility of the gas-water mixture
enhances the fluid-flow mechanisms in the compressional mode (White, 1975; Murphy et
al., 1982).
At low strains, the low saturation slightly increases the attenuation (fluid-flow
mechanism); however, it generates a large increase at high strains when frictional losses
prevail (Winkler and Nur, 1982). Hornby and Murphy (1987) considered the change in
both bulk and shear moduli due to saturation with heavy hydrocarbon, and suggested the
use of the ratio Vp/Vs to distinguish between oil saturated sands (Vp/Vs < 2.5) and

25
shales (Vp/Vs > 2.5). The change in attenuation for compressional and shear modes with
saturation leads to an important diagnostic tool: Qp/Qs > 1 indicate full saturation and
Qp/Qs < 1 indicates partial saturation (Winkler and Nur, 1979). This tool is very
important for field measurements, particularly when the absolute values of the
attenuation are difficult to determine. Thus, the attenuation provides information that is
independent to the velocity, and in function of the saturation condition in the medium.
2.5.5 Confinement
The decrease in attenuation with an increased confining pressure within the near-
surface pressure range is one of the most stable patterns that can be observed in the
laboratory. At high pressure, attenuation remains constant, and it does not change with
frequency or saturation condition (Johnston, 1981). This observation can be explained by
the increase in the number and stability of contacts, and by the reduction of fluid flow
and elastic dispersion as pores and cracks close with increased pressure (Winkler and
Nur, 1982; Jones, 1986).
In the case of clays, the increase in confinement generates higher shear wave
velocities, and decreases attenuation. The latter is mainly due to the reduction in void
ratio during primary consolidation, and the strengthening of particle bonding after
primary consolidation (Stokoe, 1980). The effect of time is more significant on the
attenuation than on the shear wave velocity (Stokoe ,1980; Lodde, 1982).

26
2.5.6 Frequency
Stoll (1978) showed that the attenuation in saturated soils is frequency dependent.
This study considered that the energy dissipation can be accounted by the inelasticity of
the soil skeleton, and the viscous interaction of the fluid in the pore space. The soil-
skeleton losses dominate at low frequencies, while the viscous losses prevail at high
frequencies. "High" and "low" frequencies are relative to the physical properties of the
soil under investigation. The attenuation peak of shear waves in a sand (porosity = 40%)
changes from 500 Hz to 5000 Hz when the intrinsic permeability is reduced from 10-6
cm2 to 10-7 cm2. Stoll (1984) found that the attenuation in dry Ottawa sand was almost
constant from 2 Hz to 1000 Hz. However, the attenuation increased with frequency in
saturated Ottawa sand, reaching a maximum in the low kilohertz range. These results
were well predicted by Biot's model. Nevertheless, Biot’s theory failed to predict the
frequency dependency of attenuation (1/Q) for low permeability silts (Stoll, 1985). Kim
et al. (1991) used a torsional shear device and a resonant column (shear strain < 10-5) to
discover that the damping effects in dry sand are independent of frequency (0.1 Hz to
100 Hz). This was not the case for compacted clay beyond 10 Hz.
Table 2-2 presents a summary of the attenuation trends for increasing strain,
confinement and frequency. The identification of parameters that affect attenuation is a
fundamental stage in the investigation of the physical laws that control wave
propagation.

27
Table 2.2: General Trends in Attenuation ( After Badali and Santamarina, 1992).
Material condition
Attenuation Parameter
Attenuation Trend
Measurement Device
Material
References
Damping
Ratio
Increase
Longitudinal Oscillations
Clean Sand
Hardin, Drnevich
1972
Dry Increase
Torsional Column
Ottawa Sand
Bae, 2009
Strain Increase
Longitudinal Oscillations
Ottawa Sand
Bae, 2009
Logarithmic
Decrement
Increase (Saturant Glycerin)
Longitudinal Oscillations
Ottawa Sand
Test 19
Bae, 2009
Saturated Increase
Torsional Column
Ottawa Sand
Jafarzadeh,
2011
Increase
Torsional Column
Siltt
Jafarzadeh,
2011
Damping Ratio
Decrease
Longitudinal Oscillation
Clean Sand
Hardin, Drnevich
1
Dry Decrease
Torsional Column
Ottawa Sand
Cabalar,
2009
Confinement Decrease
Torsional Column
Soil
Cabalar,
2009
Logarithmic
Decrement
Decrease
Longitudinal Oscillation
Ottawa Sand
Cabalar,
2009
Saturated
Decrease (Saturant Glycerin)
Longitudinal Oscillation
Ottawa Sand
Test 19
Hall, Richart
1963
Amplitude
Ratio
Increase
Transmission
Line
Sandstone Limestone
Khan , 2005
Dry Increase then
Decrease
Torsional Column
Sand and
Silts
Khan, 2011
Frequency Logarithmic
Decrement
Increase
Torsional Column
Fire Island
Sand
Khan, 2011
Saturated
Parabolic Downward
Resonance
Column
Sand
Khan, 2011

28
2.6 CHAPTER SUMMARY
Wave propagation theory has been extensively used to measure material
properties. Earlier work focused primarily on propagation velocity, due to difficulties in
measuring attenuation. Recent developments in analysis procedures and electronics,
together with the increased need for full-wave data interpretation, stimulated further
studies in attenuation.
The dynamic properties of soils are essentially viscoelastic in nature when the
mobilized shear strains are below the volumetric threshold shear strain level. Depending
upon the shear strain level, the behaviour of soils can change from linear viscoelastic to
non-linear viscoplastic. Different laboratory techniques are used to evaluate the dynamic
properties at different frequencies and shear strain levels. The most common laboratory
techniques, such as the resonant column, ultrasonic, and cyclic triaxial tests, can be used
to model the behaviour of soils under dynamic excitation. These techniques excite the
soil specimens in different modes and employ various analysis approaches to
characterize the soils in viscoelastic range as far as the damping ratio is concerned.

29
CHAPTER 3
RESONANT COLUMN TESTING
3.1 INTRODUCTION
The resonant column device (RC) is used to measure the low and mid strain shear
modulus and damping ratio of soils. In order to determine the resonant frequency of soil
specimen, the resonant column device was used to measure the specimen response to
different excitation frequencies (frequency sweep).
The solution of the equation of motion for a single degree of freedom (SDOF) system is
used to determine shear wave velocity from the resonant frequency. Furthermore,
material damping ratio can be measured by curve fitting the frequency (transfer function)
or time domain (free vibration decay) data with the corresponding theoretical equations,
or by the half-power bandwidth method (Cascante et al., 2003).
During a frequency sweep (constant excitation voltage), the imposed shear strain
levels are not constant for all frequency components. Measurements of the variation of
dynamic properties of soils (shear wave velocity and damping ratio) with frequency are
difficult to perform in conventional RC tests.
The non-resonance (NR) method has been recently used to measure the dynamic
properties of soils as a function of frequency (Lai et al., 2001; Rix and Meng, 2005). The
NR method is based on the solution of the equation of motion governing the forced

30
vibrations of a continuous, homogeneous, and linear viscoelastic cylinder representing a
soil specimen. The method allows determining simultaneously the shear wave velocity
and material damping ratio at the same frequency of excitation (Khan, 2011). Since these
parameters can be determined at different frequencies of excitation, the NR method is
well suited to investigate the frequency dependence laws of these important soil
parameters. The NR method founds its roots on viscoelasticity theory through the
application of the elastic-viscoelastic correspondence principle The quantity determined
experimentally is the complex shear modulus, which allows the simultaneous
measurement of the shear wave velocity and shear damping ratio as a function of
frequency.
The NR method has been used for low frequencies (f < 30Hz) and at low strain
levels in cohesive soils (Lai et al., 2001; Rix and Meng, 2005). Meza and Lai (2006)
showed that NR data from two cohesive soils are well described by the Kramers-Kroning
relationships (Booij and Thoone, 1982), which constitute the necessary and sufficient
conditions for a mechanical disturbance, propagating in a linear viscoelastic medium, to
satisfy the fundamental principle of physical causality.
Results indicate that the NR and the RC methods give the same results at the
resonant frequency of the specimen if the shear strain levels are the same. The NR
method can be significantly affected by participation of flexural modes of vibration.

31
3.2 BACKGROUND
In a fixed-free RC configuration, the base of the specimen is assumed fixed and
torsional loads are applied at the top of specimen. In the standard interpretation of the
resonant-column test, the shear modulus and damping ratio of the specimen are
computed by solving the equation of motion of a column-mass system (Richart et al.,
1970). The torsional excitation should be perfectly perpendicular to the top surface of the
specimen. However, from an experimental point of view, deviations from orthogonality
occur and flexural modes are excited in addition to torsional modes (Cascante et al.,
1998).
The analytical solution for a resonant-column test is obtained using a viscoelastic
Kelvin–Voigt model for a material characterized by weak energy dissipation i.e., low
material damping ratio. The shear stress in a slice of a specimen under torsional
excitation is given by the following relation Hardin (1965):
(3-1)
Where angle of twist per unit length; r radial distance from the center of the
specimen; z position along the height of the specimen; c viscous damping coefficient;
and G elastic shear modulus. Therefore, the torque T along an arbitrary cross section of
the specimen is given by:
(3-2)

32
where Jp area polar moment of inertia. Thus, the basic equation of motion for a rod
undergoing torsional oscillations is given by Hardin (1965):
(3-3)
where is the mass density. The solution of Eq. 3-3 is obtained using the separation of
variables method and appropriate boundary conditions, which are (1) zero rotation at the
fixed end of the soil column; (2) at the top of the specimen z = H; the torque must be
equal to the applied torsional excitation Lai et al. (2001).
(3-4)
where Io is the mass polar moment of inertia of the driving plate; Vs shear wave velocity;
H height of the specimen; β rotation angle at z = H; and is given by Hardin (1965).
(3-5)
where q = . At the resonant frequency ( i. e., o ) the amplitude of twist
(rotation angle) approaches infinity for a zero damping material; thus , equation 3.4
become equation 3.6. (stokoe et al., 1994)
(3-6)
where I is mass polar moment of inertia of the specimen ; and for zero

33
value of damping ratio, Eq. 3-6 is used in conventional RC testing to
compute the shear wave velocity VS of the material. The standard analysis of resonant-
column results is then based on the continuum theory of elastic wave propagation; only
when I0 >> I the fundamental frequency predominates and the approximation of a SDOF
model can be used e.g., Richart et al. (1970).
The material damping ratio and resonant frequency is typically obtained by
measuring the transfer function between induced current and resulting rotation of the top
of the specimen during a frequency sweep. Figure 3.1 presents the typical measured
transfer function during RC testing. The measured transfer function is curve fitted with a
theoretical acceleration transfer function (TF(ω)) to obtain the resonant frequency and the
damping ratio (e.g. Cascante et al., 2003).
2
2 2
1( / )
( )( / )
(1 ( / ) ( )
m ao
oo E m s
o
B r r
JTF
ic r d
J
(3-7)
where B1 (the effective product of the magnetic-field induction and the length of wire in
the coils) is the magnetic force factor of the coils (N/A); J is the mass moment of inertia of
the specimen and driving plate (kg•m2); cE is the damping coefficient that represents
energy losses resulting from the eddy-current forces (N/(m/s)); dS is the viscous damping
coefficient that represents energy losses in the specimen (N•m2/(m/s)); rm is the distance
from the centre of the specimen to the magnets (m); and ra is the distance from the centre
of the specimen to the accelerometer (m). The theoretical transfer function assumes that

34
the shear strains induced by all the frequencies in a frequency sweep are constant. At large
strains; however, the goodness of fit deteriorates and the damping ratio is over estimated
(Figure 3.1).
Figure 3.1: Transfer functions from RC measurements fitted with theoretical TF (fo = 42
Hz, γ = 5.27 x 10⁻⁴
).
The current in the coil system of resonant column is controlled by either a power
amplifier or current amplifier. Irrespective of the type of amplifier used in the RC tests,
shear strains at different frequencies are difficult to control. The shear strain
associatedwith a measured resonant frequency is typically computed from the peak-to-peak
acceleration response of the specimen in time domain by (Cascante et al., 2003)
0
0.2
0.4
0.6
0.8
1
1.2
0.6 0.8 1 1.2 1.4
No
rmaliz
ed
Mag
nitud
e
Normalized Frequency
TF (RC method)
Theoretical TF
Damping ratio, x = 11.0 %

35
202 1016
71.0Amp
oa
out
fHSr
Vgd
(3-8)
where d is the diameter, g is acceleration due to gravity, Vout is the amplitude of response
in volts, S is the sensitivity of the accelerometer, and Amp is the amplification in the
filter amplifier. This equation can also be used to compute the shear strains at any
frequency of excitation during equal strain testing.
Khan et al. (2008) presented the effect of unequal strains in a transfer function on
the computation of dynamic properties. They proposed a new procedure of constructing
the equal strain transfer function. The procedure is based on exciting the specimen with
sinusoids inducing similar strains in the specimen and measurement of discrete values of
transfer function (TF). The resulting transfer function (Figure 3.2) has a symmetrical
shape even at large strains that improves the error in curve fitting of theoretical TF. The
method; however, is time consuming and induces undesirable number of cycles to the
specimen in calculating the Transfer Function which is critical at mid to large strain
levels in loose sands and saturated soils.
Non-resonance (NR) methods involving single frequency excitation are based on
elastic-viscoelastic correspondence principle (Christensen 1971, Lai et al., 2001, Lai and
Rix 1998) which replaces elastic shear modulus with the complex-valued shear modulus.
Khan et al. (2008) presented another non-resonance model based on transfer function
approach. Solution for non resonant method is presented in appendix C .The substitution
of elastic shear modulus with complex shear modulus allows the simultaneous

36
determination of dynamic properties but implicitly forces one of the property to be
function of frequency even for a hypothetical response of an elastic material. Khan et al
(2008) showed that the damping ratio of a hypothetical specimen with frequency
independent damping (as assumed in RC testing) increases linearly with frequency.
Figure 3.2: Transfer functions from equal strain and frequency sweep (RC)
measurements (fo = 51 Hz, γ = 9.54 x 10⁻⁵
).
Material damping ratio could be determined from Eq. 3-4 written for q = 1 i.e., perfectly
elastic material by using the elastic - viscoelastic correspondence principle Christensen
1971; Lai et al. 2001; thus, assuming that soil behavior at low-strain levels can be
represented by a linear viscoelastic model. Meza-Fajardo and Lai (2007) derived a
0
0.2
0.4
0.6
0.8
1
1.2
0.85 0.9 0.95 1 1.05 1.1 1.15
No
rmaliz
ed
Mag
nitud
e
Normalized Frequency
RC Method
Equal Strains

37
closed-form solution for the Kramers– Kronig relationships and showed that
experimental measurements 0 – 30 Hz for kaolin and natural clay are well described by
the viscoelastic model. By replacing the elastic shear modulus with the complex-valued
shear modulus Gs*(ω), which is expressed in terms of the real, G1 (ω), and the
imaginary, G2 (ω), components as: (Christensen, 1971)
(3-9)
thus, the complex value of the parameter β* is given by
(3-10)
Substitution of Eq. 3-10 in Eq. 3-4 yields an equation that can be solved iteratively for
the complex shear modulus as a function of frequency, if the torque and rotation angle at
the top of the specimen are known for a given excitation frequency. The torque and the
angle of twist are in general out of phase because of energy dissipation, thus Eq. 3-4 can
be rewritten as (Lai et al., 2001; Lai and Rix, 1998).
(3-11)
Using the equation of motion for a cylindrical specimen subjected to a torsional
excitation, the Lorentz force equation proportionality between the force applied to the
system by the magnetic field in coils and the current in the coils, and representing the soil
specimen in a resonant-column test by a SDOF system, the transfer function between the

38
torque and the angle of twist can be computed as (Khan et al., 2008)
(3-12)
Eddy current damping, which is significant at low frequencies, can be easily
incorporated into this equation (Cascante et al., 2005). Once the material damping ratio
(ξ) and the resonant frequency (ω) are obtained from Eq. 3-12, the shear wave velocity is
computed by solving Eq. 3-6. The dynamic properties computed by using Eq. 3-12 are
referred to here as properties from the NTF method. Dynamic soil properties obtained
from Eq. 3-11 are referred to as properties from the NR method. Finally, soil properties
determined from the standard resonant-column method using a sinusoidal chirp
excitation will be referred to herein as properties from the standard RC method (Eq. 3-6
and the half-power bandwidth method).
A hypothetical specimen with frequency-independent damping (as assumed in
RC) testing is tested using the non-resonant method (frequency-dependent dynamic
properties) to show the expected NR test results for the standard assumptions. The
response of this hypothetical specimen in terms of the applied torque and the
corresponding angle of twist are computed by using the transfer function approach
proposed by Cascante et al. (2003, 2005). The hypothetical soil specimen has a resonant
frequency fo = 29 Hz, shear wave velocity VS = 257.7 m/s, and a damping ratio of ξ =
0.68%. The hypothetical specimen is used to show the expected results if a specimen

39
with constant damping (as assumed in the standard resonant-column test) is tested using
the non-resonant method (frequency-dependent dynamic properties). The response of this
hypothetical specimen was simulated by using the transfer function approach proposed
by Cascante et al. (2003, 2005).
Figure 3.3 shows the soil dynamic properties obtained from the NR and the NTF
methods for the simulated specimen. As expected, the shear wave velocity and shear
damping ratio from the NTF method are constant. The shear wave velocity from the NR
method is also constant for the frequency bandwidth of the simulation. However, the
damping ratio increases linearly with frequency to fulfill the causality principle (i.e.,
Kramers–Kronig relationships) at the resonant frequency, both the NTF and NR methods
predict the same value of the material damping ratio because the strain level is the same
at this frequency. The SDOF approximation commonly used in the interpretation of RC
tests does not fulfill the physical principle of causality for a linear viscoelastic material.
This approximation linearly underestimates the damping ratio above resonance and
overestimates it below resonance.

40
Figure 3.3: Comparison of simulated NR and the NTF tests results for a soil
specimen: f o = 29 Hz, ξ = 0.68%, and VS= 257.7 m /s (Khan et al., 2008)
3.3 THE UNIVERSITY OF WATERLOO DEVICE
A Stokoe resonant-torsional column device was used in this research (SBEL
D1128). The cell and sample pressures are independently controlled by a Brainard &
Kilman pneumatic pressure control panel. The air pressure system allows confining
pressures up to 700 kPa. The axial deformation of the specimen is measured with a
LVDT (Schaevitz 500HR) mounted inside the confining chamber. The input signal for
the driving coils is generated by a function/arbitrary waveform generator (HP-33120A or
the built-in signal generator in HP-35665A) through a power amplifier (Krohn-Hite
7500). During resonant testing, the response of the sample to torsional vibrations is
monitored with one accelerometer mounted at the top, and one on the base (Columbia

41
Research 8402, and charge amplifier 1035). The output signal from these transducers is
monitored and processed in a digital storage oscilloscope (HP-54600A with a HP-
54657A Module), a universal counter (HP-53131A), a dynamic signal analyzer (HP-
35665A), and by software developed as part of this research, running in a 486 computer.
Figure 3.4 shows a general view of the setup and instrumentation; required components
are boxed in full-lines, while optional devices are boxed in dashed-lines.
The driving system is 15 cm in diameter, which is close to the height of the
sample. The solution neglecting the inertia of the driving system in the transverse
direction is a good approximation just for the first mode of vibration, even in the extreme
case when the radius of gyration is computed assuming the mass of the driving system
concentrated at the position of the four magnets (h = 0.4; Fig. 3.5). For this device with
c=mT/m smaller than 4, approximate Eqs. 3-6 and 3-7 have less than 0.3% error with
respect to the theoretical values obtained with Eqs. 3-4 and 3-5. For typical soils, levels
of confinement (10 kPa to 700 kPa), and standard specimen size (H=13 cm, R=3.5 cm),
the torsional frequency is about 60% higher than the flexural frequency ( T 1.6 ω
f ).
Thus, mode coupling can be neglected for the expected damping coefficient at low strain.

42
Figure 3.4: Typical setup and instrumentation.
Figure 3.5: Sample position and magnets.

43
3.4 CALIBRATION – DRIVING SYSTEM
The computation of the shear wave velocity in the resonant column test requires
the mass polar moment of inertia of the driving system Io. In general, due to the complex
geometry of driving systems, the experimental determination of Io is preferred. A metal
calibration specimen (Figure 3.6) and a mass are used to measure Io assuming a single
degree of freedom system with total mass equal to the mass of the driving system plus
any additional mass attached to the system (Figure 3.7). Several aluminum and steel
probes were manufactured to verify calibration in different frequency ranges. Equipment
modes in the range of frequency of interest were assessed with a solid stiff steel sample.
No spurious modes were detected. Characteristics of the calibration probes are
summarized in Table 3.1.
Table 3.1 Characteristics of calibration bars
The mass polar moment of inertia of the driving system must be re-calibrated
whenever changes are made, e.g. transducers added to the top cap. Errors in the
measurement of frequencies have a significant effect in the computation of Io, for
Outside Inside
RCD - 1 AL 1 0.955 0.701 22.54 12
RCD - 1 AL 2 2.534 1.901 22.54 97
RCD - 2 AL 3 1 0 10 40.7
RCD - 2 AL 4 1.5 0 10 90
Resonant
Frequency
(Hz)
Device ProbDiameter ( cm) Length
(cm)

44
example, a 5% error in frequency can produce a 50% error in the computed inertia of the
driving system.
Figure 3.6: Calibration bars.
Figure 3.7: Additional mass for I0 calculation.

45
3.5 REDUCTION OF EQUIPMENT GENERATED DAMPING
Equipment-generated damping in the resonant column (RC) test due to interaction
between the magnets and solenoids in the drive system causes a bias error in measured
values of material damping ratio. Calibration and post-measurement corrections have
been used to address this problem.
Another error in RC measurements of material damping ratio arises from the use
of solenoids and magnets [Fig.3.8(a)] to provide the torsional excitation (Kim, 1991;
Hwang, 1997; d’Onofrio et al., 1999; Cascante et al., 2003; Wang et al., 2003). An AC
current passing through the solenoids generates a uniform magnetic field that interacts
with the permanent magnets. The resulting mechanical motion of the magnets applies a
torque to the test specimen via the drive plate shown in Figure 3.8(b). An oscillating
torque can be produced by switching the poles of the generated magnetic field.
Simultaneously, the motion of the magnets results in a magnetic field that induces an
electromagnetic force (EMF) in the solenoids according to Faraday’s law. Furthermore,
according to Lenz’s law the induced EMF opposes the motion that produces it and is
termed back-EMF. This back- EMF is an additional means of dissipating energy in the
system above and beyond the intrinsic losses occurring in the test specimen and results in
equipment-generated damping.
Back-EMF causes negligible errors in measured values of shear modulus (Wang
et al., 2003). Previous studies (Kim, 1991; Hwang, 1997; Wang et al., 2003) have sought
to quantify the magnitude of the equipment-generated damping and to develop correction

46
procedures. The results summarised in Figure 3.9 indicate that the equipment-generated
damping may be as large as 4% at low resonant frequencies and decreases with
increasing frequency. Errors of this magnitude are significant in the context of the
material damping ratio of most soils, particularly at very small strains. These studies
have recommended subtracting the equipment-generated damping from measured values
to correct for the error.
Figure 3.8: (a) Schematic diagram of the solenoid-magnet unit; (b) the drive system (top
view) (Rix and Meng, 2005)
(a)
(b)
Drive plate and magnets
(mechanical part)
Fixed base
Solenoid and magnets
(electrical part)
Signal poles
Magnet
Solenoid

47
Figure 3.9: Equipment-generated damping ratio from RC measurements in previous
research. (Tallavo, Cascante, Pandy, & Narasimhan, 2011)
3.6 EXPERIMENTAL METHODOLOGY
This study is consisted of three different projects. First we study the effect
loading frequency on dynamic property of Mine paste at different strain level,
confinement and age. Then a comparison study was conducted on sand between two
different RC device to understand the equipment effect on our RC measurements. At the
end of study we proposed new testing technique in RC measurements and compare it
with previous method of testing.

48
The transfer function between the excitation force and the acceleration is
computed by using both the top accelerometer and the miniature accelerometer. Random
noise as well as burst chirp is used as excitation force (Cascante and Santamarina, 1997).
For the evaluation of the torsional mode shape, a sinusoidal excitation is used at the
resonant frequency of the specimen. The responses of the accelerometers are measured
with a dynamic signal analyzer (HP 35670A). The driving plate is assumed rigid;
therefore, the acceleration measured on the driving plate is only corrected by the location
of the accelerometer with respect to the radius of the specimen. This procedure is
repeated for different isotropic confinements to understand the effect of confinement on
dynamic property measurement.
3.7 VOLTAGE-MODES AND CURRENT-MODE SOURCES
3.7.1 Voltage Source
An important factor to consider in studying equipment generated damping is the
difference between voltage-mode and current-mode sources depicted in Figure 3.10. An
ideal voltage-mode source maintains a specified output voltage regardless of the load
impedance and the current through it. Theoretically, this is possible only if the internal
resistance approaches zero, but all actual voltage sources have a finite internal resistance,
Rs, typically about 50 Ω. When Rs is non-zero, the source voltage, Es, is subject to the
voltage division rule. The load voltage is given as (Rix and Meng, 2005)

49
(3-13)
where R1 is the load impedance. In the case of the RC apparatus, R1 = RC, where RC is
the resistance of solenoids. When the source resistance and the load impedance are
comparable, a significant portion of the source voltage will be restricted to the source,
and it will load itself. This is termed source–load mismatch, and is generally undesirable.
Figure 3.10: (a) Voltage-mode and (b) current-mode sources (Rix and Meng, 2005)
3.7.2 Current Source
An ideal current source provides a specified output current regardless of the load
impedance and the voltage across it. This implies that the internal resistance of the source
must be infinite, but all actual current sources have some finite internal resistance,
typically several hundred kilo-ohms or greater. In this case, the source current, is, is
subject to the current division rule. The load current is expressed as (Rix and Meng,
2005)
(a) (b)

50
(3-14)
This implies that, when the source resistance is much higher than the load impedance, the
load current is minimally affected by the load impedance.
3.8 EQUIPMENT EFFECTS
Both of the resonant column devices (RCDs) used in this study have a similar
general configuration, where the base of the sample is fixed and the applied torsional
excitation is at the top of the sample as shown in Figure 3.11 (Stokoe type resonant
column). The two devices are referred as RCD-1 and RCD-2. The RCD-1 is a custom-
made device (Cascante et al. 2003); whereas the RCD-2 is a commercially available
system (GDS-RCA, 2009). The primary differences between the two devices relate to
their geometry, electronic components, and the data analysis procedures for calculation
of the material damping ratio. This section provides a summary of the background theory
used in both resonant column devices.

51
Figure 3.11: Basic schematic of fixed-free base resonant column device (Stokoe type).
The RCD-1 applies a sinusoidal chirp vibration with a wide range of frequencies
to the soil specimen, and the resonant frequency is evaluated from the frequency
response curve or transfer function of the system, which is represented as a single-
degree-of-freedom system (SDOF). The applied torque (proportional to the current
flowing through the coils) gives the input function; whereas the response function is
given by the acceleration measured at the driving plate (Fig. 3.11). The damping ratio
and the resonant frequency are determined by curve fitting the measured frequency
response curve (Khan et al. 2008).
The instrumentation used in RCD-1 is illustrated in Figure 3.12. The input signal
for the coils is generated by a built-in signal generator in a dynamic signal analyzer (HP-
35670A). The low-power input signal is amplified by an audio power amplifier (Bogen

52
250W). The axial deformation of the specimen is measured with an LVDT (Schaevitz
500HR) mounted inside the resonant column device. The response of the specimen is
measured with an accelerometer (PCB 353B65). The output signal of the accelerometer
is monitored, processed, and stored in a digital oscilloscope (Agilent DSOX3014A), a
dynamic signal analyzer (HP-35670A), and a computer. The cell and specimen pressures
are controlled independently by a pneumatic pressure control panel (Brainard-Kilman E-
400).
Figure 3.12: Typical instrumentation for resonant column device RCD-1.
The applied torque is computed from the measured current passing through the
coils IC(ω) at a given angular frequency (ω), and the distance from the magnets from the
Computer
Multimeter
Power Amplifier
Pressure Cell
LVDT
Coils Spectrum
Analyzer
Accelerometer
X()
Y()
Oscilloscope
Switch Box
Specimen
Signal
Generator
Voltage Current
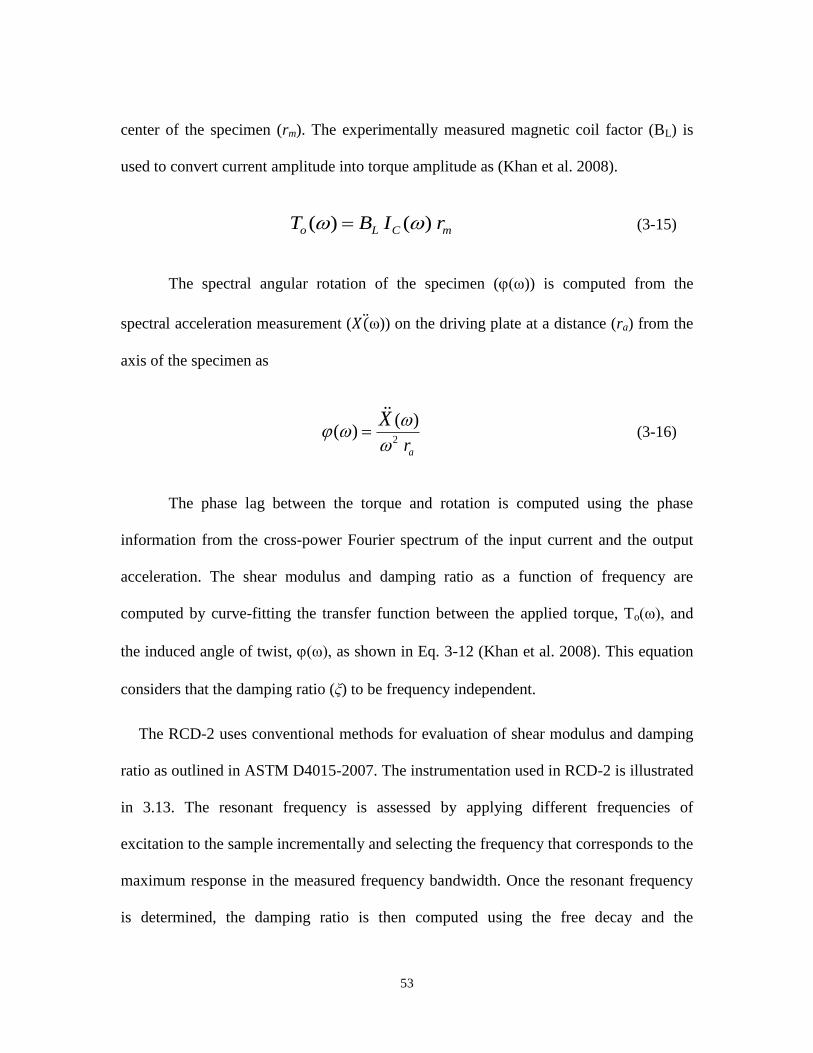
53
center of the specimen (rm). The experimentally measured magnetic coil factor (BL) is
used to convert current amplitude into torque amplitude as (Khan et al. 2008).
mCLo rIBT )()( (3-15)
The spectral angular rotation of the specimen ((ω)) is computed from the
spectral acceleration measurement ( ω )) on the driving plate at a distance (ra) from the
axis of the specimen as
ar
X2
)()(
(3-16)
The phase lag between the torque and rotation is computed using the phase
information from the cross-power Fourier spectrum of the input current and the output
acceleration. The shear modulus and damping ratio as a function of frequency are
computed by curve-fitting the transfer function between the applied torque, To(ω), and
the induced angle of twist, (ω), as shown in Eq. 3-12 (Khan et al. 2008). This equation
considers that the damping ratio (ξ) to be frequency independent.
The RCD-2 uses conventional methods for evaluation of shear modulus and damping
ratio as outlined in ASTM D4015-2007. The instrumentation used in RCD-2 is illustrated
in 3.13. The resonant frequency is assessed by applying different frequencies of
excitation to the sample incrementally and selecting the frequency that corresponds to the
maximum response in the measured frequency bandwidth. Once the resonant frequency
is determined, the damping ratio is then computed using the free decay and the

54
logarithmic decrement method. At the resonant frequency, the amplitude of twist (or
rotation angle) approaches infinity for a zero damping material; thus, the solution for the
equation of motion for fixed-free RC is given by Eq. 3-6 (Richart et al. 1970). This
equation is used in conventional RC testing to compute the shear wave velocity (VS) of
the material. The shear modulus G (kPa) is calculated from shear wave (VS) and the bulk
density () of the specimen as G = (VS)2. The standard analysis of resonant column
results is then based on the continuum theory of elastic wave propagation; only when I0
>> I the fundamental frequency predominates and the approximation of a SDOF model
can be used. Therefore, to reduce data from the resonant column test, the mass polar
moment of inertia of the drive system I0 is required. As the drive system has a complex
geometry, it is difficult to derive mathematically, its value is found experimentally. The
mass polar moment of inertia of the specimen, I, is calculated from the mass (m) and the
radius of the specimen (r) as I = ½ m r2.
Figure 3.13: Typical instrumentation for resonant column device RCD-2.

55
The damping ratio, (ξ), is computed from the shape of free vibration decay curve.
First, a sinusoidal wave is applied at the resonant frequency of the specimen, and then the
excitation is shut off so the resulting free vibrations may be measured. The free vibration
response (x(t)) of a SDOF system is given as function of the phase angle and the
initial amplitude as: (Humar, 2005)
ω (3-17)
where ξ is the damping ratio; ω , the circular resonant frequency; ω , the damped
resonant frequency given by ω ω ξ ; and , the maximum amplitude of the
displacement. For ξ < 0.2, ω ω whereas ω ω when ξ =0.4. The damping
ratio can be estimated from the decrement logarithm method (Richart et al. 1970) as
(3-18)
where and are two peaks separated cycles ( ). The full
waveform of a free-decay response can be used to estimate a single value for the resonant
frequency and damping ratio by curve-fitting the measured response with equation 3.17
the damping ratio is also calculated by plotting the Ln(peak amplitudes) against the phase
angle (2π n). This plot should be straight line; and its slope represents the damping ratio.
For the RCD-2, between 10 and 50 cycles are commonly used in the calculation.

56
CHAPTER 4
NEW METHOD FOR THE EVALUATION OF DYNAMIC
PROPERTIES OF SOILS USING A STRAIN
CONTROLLED EXCITATION
4.1 INTRODUCTION
The effects of intrinsic shear wave attenuation in rock have been of interest for
many decades and the subject of study both in laboratory and in situ. While this effect in
near surface soft soils (Vs< 250 m/s) has received less attention, it has important
implications in the field of seismic hazard studies. Structures founded on soils with
periods close to that of the thickness of the deposit may undergo more intense shaking
due to a resonance effect setup between structure and soil. This building soil interaction
is important because the amplification factors provided in the 2005 National Building
Code of Canada (2005NBCC) may not be sufficiently high at the resonance period of a
site, acknowledging the potential for de-amplification within then on-linear range.
Hence, attenuation in soils is a particularly important property to understand, since the
resonance effect in soft soils will be longer lasting if soil dissipation of wave strapped in
then near surface is low (Crow, 2011).
The low and medium strain dynamic properties of soils are commonly measured
in resonant column (RC) device (ASTM D4015-92, 2000). Conventional RC testing (RC

57
standard) is based on the determination of the resonant frequency by exciting the soil
specimen at different frequencies (frequency sweep, random noise). The shear wave
velocity is determined using the solution of the equation of motion for a column-mass
system. The resonant frequency and the material damping ratio are typically computed
by curve fitting the measured transfer function between the applied torque and induced
angle of twist with the theoretical equations (e.g. Cascante et al. 2003).
The standard RC testing method is based on harmonic excitation, sweeping the
frequency around resonance. The transfer function is determined with small frequency
increments in order to get precise values of damping and resonant frequency. This
procedure is time consuming, especially for low damping materials that present sharp
resonant peak. To overcome this limitation, random noise and sinusoidal sweep
excitations have been used (Prange 1981, Aggour et al. 1989, Cascante and Santamarina
1997). However, these excitations do not impose a constant strain on all frequencies; thus
the reliability of the measurement rests on the definition of an equivalent strain level.
The effect of different strain levels in frequency sweep tests have been reported in
previous studies (e.g. Cascante et al. 1997; Khan et al. 2008); which indicate that the
error in the measured damping ratio increases with the increase in strain level because of
the non-symmetrical shape of the measured transfer function. Although the measured
transfer function can be curve fitted within acceptable error at low strain levels, the
goodness of the fit deteriorates with the increase in shear strain level (Khan et al. 2008).
Moreover, the effect of frequency on the dynamic properties is difficult to evaluate in
conventional RC testing and recently proposed non-resonance (NR) method.

58
The non-resonance (NR) approach uses single frequency excitation instead of
frequency sweep to measure the dynamic properties (Khan et al. 2008; Lai et al. 2001;
Rix and Meng 2005). This method is based on the solution of the equation of motion
governing the forced vibration of a continuous, homogeneous, and linear viscoelastic
cylindrical specimen. The method allows for the simultaneous determination of the shear
wave velocity and material damping ratio at the excitation frequency. The NR method is
based on viscoelasticity theory and the application of the elastic-viscoelastic
correspondence principle (Christensen, 1971).
Since the dynamic properties can be determined at different frequencies, the non-
resonance (NR) method have been used to investigate the frequency dependence of
dynamic properties (Lai et al. 2001; Rix and Meng 2005; Khan et al. 2008). The
experimentally determined complex shear modulus is used to compute the shear wave
velocity and damping ratio as a function of frequency. The use of linear viscoelasticity,
however, forces one of the dynamic properties to vary with frequency. NR results from
two cohesive soils presented by Meza and Lai (2006) showed that the data is well
described by the Kramers-Kronig relationships (Booij and Thoone, 1982); however, the
results are presented for low frequencies (f < 30 Hz). The NR method is appropriate for
the evaluation of dynamic properties as function of the shear strain level because it uses
the same frequency of excitation at all shear strain levels.
The main objective of this study is to present a simple testing technique,
alternative to the NR method, to measure the transfer function and dynamic properties of
soils as a function of frequency at constant strain levels. The proposed technique, called

59
the FN method, (sinusoidal + random excitation) is based on exciting the specimen
simultaneously with a sinusoidal function (carrier frequency) and a relatively small
amplitude random noise. The sinusoidal excitation controls the shear strain level and
hence the resonant frequency of the specimen; whereas the small amplitude random noise
excitation provides the required frequency bandwidth to compute the transfer function
around resonance.
The proposed FN method has several advantages. Firstly it allows a better control
of the shear strain level imposed in random-noise resonant column testing. Secondly, the
errors in curve fitting the transfer function are reduced especially at large strain levels
because at a constant strain level the transfer function matches the theoretical equation
and thirdly, the dynamic properties can be evaluated as function frequency using
conventional solution to the equation of motion used in resonant column testing.
To evaluate the potential of the proposed methodology, resonant column tests are
performed on sand and clay specimens. The sand is tested at two isotropic confinements
using the conventional (RC), non-resonance (NR), and the proposed (FN) methods. The
error in the curve fitting of transfer functions decreased up to 30% at large strain levels,
the dynamic properties of sand computed from the FN method show limited variation
with frequency within the studied bandwidth.

60
4.2 EXPERIMENTAL SETUP AND EXPERIMENTAL PROGRAM
A modified, Stokoe-type resonant-torsional column apparatus is used in this
study. The driving plate has a radius of 15 cm. The input signal to the driving coils is
generated by a dynamic signal analyzer (HP-35670A) and amplified through a power
amplifier (Bogen, GS-250). The response of the sample is acquired using an
accelerometer (PCB 352A78) attached to the driving plate. The output signal from the
accelerometer and the current through the coils are measured with a digital oscilloscope
(HP-54645A) and recorded in the dynamic signal analyzer (HP-35670A). The mass polar
moment of inertia (MPMI) of the driving plate (Io = 6.9 x 10⁶ g-mm
2) was measured by
testing an aluminum (fo = 29.7 Hz) and a PVC probe (fo = 29.4 Hz). The calibration
probes of lower resonant frequencies were selected to avoid the effects of base fixidity
(Khan et al. 2008b).
RC tests were performed on a sand specimen at a confinement of o = 50 kPa and
120 kPa. The tests were performed using conventional RC method, NR method, and the
proposed methodology (FN Method) at different shear strain levels. The details of testing
procedure for each method are presented in following.
4.2.1 RC Method
A broad-band frequency sweep (100 Hz) was used to approximately locate the
resonance before a narrow band frequency sweep (25 Hz) was used to measure the
transfer function, the induced current through the coils, and the acceleration response of
the specimen. The equation of the transfer function (Eq. 3-7) was used to curve fit the

61
measured TF to determine the resonance and damping ratio. The shear strain was
computed from Eq. 3-8 after measuring the largest peak-to-peak response of the
specimen from the oscilloscope. The procedure was repeated at different shear strain
levels to obtain the variation of dynamic properties with shear strain level.
4.2.2 NR Method
The specimen was excited with a fixed sine function at or very close to the
resonant frequency and the corresponding value of transfer function was recorded (TF).
The amplitude of the fixed sine was adjusted until the TF value matched the TF value
obtained from RC method. The TF (e.g. Fig. 3.2) was then reconstructed around
resonance by changing the frequency of fixed sinusoids but keeping the shear strains
constant by controlling the amplitudes. Only one equal strain transfer function is
generated for a certain shear strain level. The dynamic properties were then evaluated
with Eq. 3-4 (e.g. Lai et al., 2001) using the discrete measurements of the equal strain
transfer function.
4.2.3 FN Method
The new methodology (FN Method) is based on exciting the specimen at certain
frequency with a fixed sine using the desired shear strain level; which controls the
position of resonant frequency in the tested frequency bandwidth. A single frequency
excitation produces one peak in the TF; hence, a small amplitude random noise excitation
is added to the main sinusoid (carrier) to measure the transfer function around resonance.

62
The coupling of the signals is achieved by designing and constructing an in phase signal
coupler. A typical transfer function obtained by using this method is presented in Figure
4.1. The effect of frequency is evaluated by changing the frequency of the carrier signal
(shear strains kept constant). Since the shear strains are constant at all frequencies of the
carrier signal, the position of transfer functions do not change for frequency independent
behaviour. The dynamic properties are obtained by curve fitting the measured transfer
functions with Eq. 3-7.
Figure 4.1: Transfer functions from FN measurements fitted with
theoretical TF (fo = 42 Hz, γ = 5.27 x 10⁻⁴
).
Finally the variation of dynamic properties with shear strain level is obtained by
increasing the amplitude of the fixed sinusoid both in NR and FN methods. Although any
frequency can be chosen for the carrier, a frequency close to resonance is preferred. The
0
0.2
0.4
0.6
0.8
1
1.2
0.6 0.8 1 1.2 1.4
No
rmaliz
ed
Mag
nitud
e
Normalized Frequency
TF (FN Method)
Theoretical TF
Damping ratio, x = 7.4 %

63
use of the same excitation frequency at all shear strain levels eliminates the effect of
frequency on the measurements if present. Moreover, the estimation of imposed shear
strain level in the specimen is very accurate when using single frequency excitations.
4.3 RESULTS AND DISCUSSIONS
Dynamic properties of a dry-sand specimen were evaluated using conventional
RC method, NR method and the proposed methodology (FN method). The new
methodology is proposed to better evaluate the dynamic properties as function of
frequency and shear strain level. Typical results and discussion are presented in the
following sections.
The FN method produces transfer functions that have symmetrical shapes even at
large strains that results in better fit of theoretical transfer function. Comparison of
Figure 3.1 and Figure 4.1 (same shear strain level) indicates a 48 % overestimation in
damping ratio when the transfer function is evaluated by conventional RC method (x =
11% and 7.4 %). The goodness of fit also improves significantly in the curve fitting of
TF obtained from FN method.
Figure 4.2 presents the comparison of transfer functions obtained from RC, equal
strain, and FN methods at an isotropic confinement of o = 120 kPa. Transfer functions
from FN method using two different carrier sinusoids are also presented. Figure 4.2
indicates excellent matching among the transfer functions obtained from different
methods at low strain levels. The ability of this method to evaluate dynamic properties at

64
different frequencies of excitations can be used to study the frequency dependent
behaviour of soils especially at low strain levels.
Figure 4.2: Comparison of transfer functions from RC, equal strains,
and FN measurements (γ = 9 x 10⁻⁶
).
Figures 4.3 and 4.4 show the typical results from the NR and FN methods for the
variation of dynamic properties with frequency. The results from FN method are in
agreement with previous results that show a practically frequency-independent damping
ratio and wave velocity for sands at low strain levels (Hardin and Black 1966; Iwasaki et
al. 1978; Bolton and Wilson 1989; Kim and Stokoe 1995; Khan et al. 2008). The NR
method; however, forces shear wave velocity to increase with frequency as noted earlier.
NR method is sensitive to the phase difference between the applied torque and resulting
rotation; these small phase differences produce significant errors in damping even with
small participation of flexural mode. This is evident from very large damping value at
0
0.2
0.4
0.6
0.8
1
1.2
74 75 76 77 78
No
rmaliz
ed
Mag
nitud
e
Frequency [Hz]
RC Method
Equal Strains
Carrier = 50 Hz
Carrier = 75 Hz

65
about 35 Hz (Fig. 4.3) and 60 Hz (Fig. 4.4). The slight decrease in shear wave velocity
(Fig. 4.3) with frequency is insignificant but requires further investigation. The damping
ratio; however, becomes unstable in the FN method when the specimen is excited with a
carrier frequency close to resonant frequency. A similar but smaller decrease is also
evident in the measurements at o = 120 kPa (Fig. 4.4). Although the exact mechanism is
still being investigated, the significant reduction in the net current (excitation) going
through the coils because of the EMF damping could generate inaccurate measurements
close to resonance (EMF damping increases for lower frequencies). The jump in
damping ratio at resonance is expected to decrease with increase in shear strain level due
to relatively larger damping ratios and the reduction of EMF damping with strain level
(Cascante et al. 2005).

66
Figure 4.3: Evaluation of dynamic properties as function of frequency
from NR and FN method (σo = 50 kPa, γ= 9.5 x 10⁻⁶
).
170
175
180
185
190
195
200
205
35 45 55 65
Shear
Velo
city [m
/s]
Frequency [Hz]
NR Method
FN Method
0
0.5
1
1.5
2
2.5
3
3.5
35 45 55 65
Dam
pin
g [%
]
Frequency [Hz]
NR Method
FN Method

67
Figure 4.4: Evaluation of dynamic properties as function of frequency
from NR and FN method (σo = 120 kPa, γ= 9 x 10⁻⁶
).
0
50
100
150
200
250
300
350
400
50 60 70 80 90
Shear
Velo
city [m
/s]
Frequency [Hz]
NR Method
FN Method
0
0.2
0.4
0.6
0.8
1
1.2
1.4
50 60 70 80 90
Dam
pin
g [%
]
Frequency [Hz]
NR Method
FN Method

68
The variation of dynamic properties with shear strain level is presented in Figure 4.5 for
the RC, NR, and FN methods at o = 50 kPa. The results indicate that the variation of
shear modulus is similar for all the methods. These findings are in agreement with
literature (Khan et al. 2008). The damping ratio on the other hand shows larger difference
among the methods. The difference increases with the increase in shear strain level. As
noted earlier (Fig. 3.1 and Fig. 3.2), the damping ratio from RC method is overestimated
because of the distorted shape of transfer function due to unequal strains. At low shear
strain levels, the damping ratios from FN and RC measurements are in good agreement.
69
Figure 4.5: Evaluation of dynamic properties as function of shear strain
from RC, NR and FN methods (σo = 50 kPa).
0.4
0.5
0.6
0.7
0.8
0.9
1
1.1
0.001 0.01 0.1
No
rmalized
G
Shear Strain [%]
RC Method
NR Method
FN Method
0.5
1
1.5
2
2.5
3
3.5
4
0.001 0.01 0.1
Dam
pin
g ratio
[%
]
Shear Strain [%]

70
At shear strain level of 0.1 %, difference between FN and NR measurements is 20 %
whereas the difference between NR and RC measurements is 45 %. The damping ratios
measured from NR method at large strains are more reliable because the larger phase
difference can be measured with greater accuracy. The detailed results of our different
method (RC, NR and FN) are presented in appendix B. Although the shape of TF is
symmetrical, FN method possibly does not produce enough shear strains at frequencies
other than the carrier frequency and hence the damping ratios are slightly underestimated
at large strains. The damping ratios measured from FN method are however more reliable
in terms of accuracy.
4.4 CONCLUDING REMARKS
Resonant column tests were performed on a sand specimen at two isotropic confinements
of 50 kPa and 120 kPa. The dynamic properties were evaluated by conventional RC, NR,
and newly proposed FN methods. Dynamic properties were evaluated as a function of
frequency and shear strain levels. The main conclusions from the study are:
The damping ratios from RC measurements are overestimated at large strains. A
reconstruction of TF using tedious approach of equal strain method provides better
estimate of damping ratio. The representative shear strains estimated from RC Method
are less accurate than the NR and FN methods.
The variation of dynamic properties with frequency is better estimated by newly
proposed FN method compared to NR method. NR method is sensitive to slight

71
variations in phase difference especially at low strain levels and the results become
highly unreliable.
The variation of dynamic properties with shear strain level is better characterized by
using either NR or FN methods. The degradation of shear modulus is practically similar
from RC, NR, and FN methods. Damping ratio is overestimated by RC method due to
distorted shape of transfer function at large strains. The FN method slightly
underestimates the damping ratios at large strains but the difference is smaller compared
to errors produced by RC Method. Table 4.1 summarizes the advantage and disadvantage
of each method.
Table 4.1 Characteristic of different resonant column testing methods
METHOD EXCITATION ADVANTAGE LIMITATION
RC Broad-band
frequency
(20-175 Hz)
Quick solution to find the
resonant frequency in a
broad band frequency range
Over estimate the
damping ratio because of
distorted shape of transfer
function due to unequal
strain level
NR Fix Sine
( 10- 200 Hz )
Equal strain
Allows for simultaneous
determination of shear wave
velocity and damping at
excitation frequency
Sensitive to phase
different between applied
torque and resulting
rotation
FN Fix sine +
Random Noise
( 20-200 Hz) +
20 mV
Better evaluation of dynamic
properties as function of
frequency
Have symmetrical shape in
large strain level
Damping ratio becomes
unstable in this method
when the specimen is
excited with carrier
frequency close to natural
frequency

72
CHAPTER 5
EQUIPMENT EFFECTS ON DYNAMIC PROPERTIES OF
SOILS IN RESONANT COLUMN
5.1 INTRODUCTION
Shear modulus and damping ratio are important soil properties that influence the
response of soils to dynamic loads. Both shear modulus and damping ratio can be
evaluated in the laboratory using devices such as cyclic triaxial, bender elements (BE), or
a resonant column device (RCD); which is the ASTM standard for dynamic
characterization of soils (ASTM D4015-92 2000). The cyclic triaxial test is used for
high shear strain levels (> 10-3
), whereas bender elements and the RCD are used for low
strain levels (<10-3
). Bender element tests are economical and fast; however, the results
can be affected by many variables and they require careful interpretation ; On the other
hand, BE can only be used to measure the shear modulus at low strain levels (Gmax). The
evaluation of material damping in the BE test is complex and there is no standard
procedure (Camacho et al. 2008). The RCD provides more consistent test results; and it
is considered one of the most accurate ways to determine the dynamic properties of soils
at low to mid shear strain levels. Resonant column (RC) tests are accurate and reliable;
however, the effect of different equipment in making the measurements on the results has
not yet been evaluated. This is especially true of the damping measurements, which are

73
significantly affected by the electro-motive force (EMF). (Cascante et al. 2003; Wang et
al. 2003).
The RC tests can vary in their configuration and the analytical methods used for
the computation of the dynamic properties. While many testing programs have been
performed to measure the dynamic properties of soils on a single resonant column
apparatus (Stokoe et al. 1994, Dobry and Vucetic 1987; Cascante and Santamarina 1997,
Khan et al. 2005, Camacho et al. 2008), very few have evaluated the dynamic properties
of the same soils on different RCDs. In most cases in which a soil was tested on two
different RCDs the tests were for calibration purposes, when the RCD had been modified
to accommodate different samples (e.g. stiffened base, Avramidis and Saxena 1990). In
this case, however, the same test method and data analysis are used in the initial and
modified state of the RCDs. Fewer comparisons have been done with two RCDs that use
different testing methods and different data analysis. The main objective of this part of
our study is to measure the dynamic properties of a typical silica sand using two different
RCDs and provide a comparison of the results. The effect of the equipment and the use
of different data analysis procedures for the calculation of damping are discussed.
5.2 EXPERIMENTAL PROGRAM
For the accurate measurement of the equipment effects on the test results, it is critical
to ensure that the same testing procedures were used for both RCDs. While developing
the testing procedure, practice tests were performed with all members of the testing
teams present to ensure that samples would be prepared and tested similarly. Three

74
aluminum specimens were used to calibrate the resonant-column systems. The aluminum
specimens are made of a vertical aluminum pipe with two horizontal aluminum bars or
disks. The bars or disks were attached at each end of the pipe to allow assemblage of the
probe with the resonant column (Figures 5.1a, 5.1b). The main characteristics of the
calibration specimens tested are given in Table 5.1.
Figure 5.1: Calibration bar for systems (a) RCD-1 and (b) RCD-2.
Aluminum
specimen
Aluminum
bar
Base aluminum
bar
Added
calibration mass
Magnets
Screws
Driving
plate
h0
i
h1
i
D = Diameters = 10 mm, 12.5 mm, 15 mm
(a) (b)

75
Table 5.1: Characteristics of the aluminum probes.
Four different Ottawa sand specimens were tested in this study. Sands 1 and 2
(S1, S2) were tested in the RCD-1; whereas, sands 3 and 4 (S3, S4) were tested in the
RCD-2. At each confinement and shear strain level, the dynamic properties were
computed using the analytical procedures described before. To reduce the effects of
large-strain cyclic loading, the specimens are compacted before testing to an average
relative density DR ≈ 77 %. The main characteristics of the sand specimens are given in
Table 5.2.
Table 5.2: Change in height and void ratio during the test.
Outside Inside
RCD - 1 AL 1 0.955 0.701 22.54 12
RCD - 1 AL 2 2.534 1.901 22.54 97
RCD - 2 AL 3 1 0 10 40.7
RCD - 2 AL 4 1.5 0 10 90
Resonant
Frequency
(Hz)
Device Prob
Diameter ( cm)Length
(cm)
Property of Specimen S1 S2 S3 S4
Initial diameter D0 (mm) 69.97 70.32 50.17 49.84
Height during loading (mm) 146.44 144.23 97.69 96.56
Height after Unloading (mm) 146.47 144.14 97.61 96.55
Residual axial strain (%) 0.02 0.06 0.08 0.02
Void ratio during loading 0.521 0.496 0.531 0.561
Void ratio after Unloading 0.520 0.493 0.530 0.561
Max change in Void Ratio (%) 0.21 0.60 0.24 0.05
Average Density (kg/m3) 1741 1749 1736 1702

76
All sand specimens were tested at confining pressures of 30, 60, 120, and 240
kPa, with 0 kPa back pressure. For each pressure, the resonant frequency and damping
ratio were measured over a range of shear strains (10-6
< γ< 10-3
). Vertical displacements
were measured throughout the tests and after unloading with the use of an LVDT. After
unloading each sample, the residual vertical strain was required to be less than 0.2% to
ensure that the samples did not change significantly throughout the testing.
5.3 SAMPLE PREPARATION
Ottawa silica sand was chosen for testing because it is well characterised in the
literature and is uniformly graded, which should enhance the reproducibility of samples.
The geotechnical properties of the silica sand were determined in the laboratory; its grain
size distribution is shown in Fig. 5.2 (D50=0.279 mm, emax=0.727, emin=0.476, SiO2
content 99.6% and Gs=2.66 g/cm3). Samples were prepared in a split mold by the dry
pluviation and tamping technique. Once the upper platen was set in place, vacuum was
applied to hold the sample and the split mold was removed. Then, the connections for the
driving plate, LVDT, and accelerometer were arranged, and the chamber was assembled.
Sample vacuum was gradually released while increasing the cell pressure, until an
effective confinement. Isotropic loading was applied to all samples tested in this study,
increasing the confining pressure from 30 kPa to 240 kPa.

77
Figure 5.2: Grain size distribution of silica sand used (Barco sand #49).
The diameter of the cylindrical specimens for the RCD-1 is 70 mm; whereas the
diameter is 50 mm for the RCD-2. All sand samples were tested in dry conditions. Each
sample was built in five layers; each layer was tamped 70 times with a plastic tamper at a
constant height. To achieve the same void ratio for both sample sizes, a tamper with a
smaller tamping area was used for the 50 mm diameter samples than for the 70 mm
diameter samples.
5.4 RESULTS AND DISCUSSION
Figure 5.3 shows the variation of damping ratio with shear strain level for the
calibration specimens. The results for the low frequency probes at low strains levels (Fig.
5.3a, Table 5.1) indicate that the damping in the RCD-1 is 1.6 times larger than the
damping measured with the RCD-2; and that the damping ratio increases almost linearly
0
10
20
30
40
50
60
70
80
90
100
0.010.1110
Per
cent
Fin
er (%
)
Grain Diameter (mm)

78
with the strain level. The damping ratio in aluminum specimens at the testing frequencies
of the resonant column is practically zero (Zemanek, and Rudnick 1961); thus the
observed increase in damping with strain level could be generated by the radiation of
energy through the base of the resonant column. The base of the resonant column was
assumed to be fixed; however, it has been demonstrated that for the evaluation of shear
modulus, the base is not perfectly fixed and a correction factor should be applied to the
measured values especially for stiff specimens (Khan et al. 2008, Avramidis and Saxena
1990). The results for the high frequency probes (Fig. 5.3b) show an increase in the
damping values measured with the RCD-1 compared to the corresponding values using
the RCD-2 (5 times larger). This increase in attenuation confirms the non-fixed
conditions of the base; as the stiffness ratio of the probes tested in the RCD-1 is 65;
whereas, the ratio is equal to five for the RCD-2 probes. For the low and high frequency
probes (Fig. 5.3), the damping measurements from the RCD-1 are higher than the
measured values using the RCD-2 because different base fastening conditions. The RCD-
1 was mounted on a flexible bench; whereas the RCD-2 was attached to a stiffer bench.
The radiation damping in the RCD-1 increases with the increase the stiffness of the
aluminium probe as expected. However, further studies are required to better characterize
the radiation damping. The increase in radiation damping with shear strain and frequency
is observed on aluminum probes because of their low damping in comparison with
typical soils.
Figures 5.4, 5.5 and 5.6 show typical results for the dynamic properties measured at
σ'o=30, σ'o=60 and σ'o=120 kPa. The results from the two devices are in good agreement.

79
The maximum difference in damping ratio, at low strain levels, is 31%; whereas the
maximum difference in the normalized shear modulus is 20%. The shear modulus is
normalized to remove the effect of void ratio using the correction factor proposed by
Hardin and Drnevich (1972). Table 5.3 shows that the difference in shear modulus and
damping ratio for σ'o=240 kPa (Fig. 5.7) are only 2% and 12% respectively. These
differences could be related to the different sizes of the specimens and the coupling
conditions between the top and bottom caps with the specimen. The platens of the RCD-
2 provide better coupling conditions than those of the platens of the RCD-1 because they
have deeper grooves. The difference in the damping ratios measured with the two
systems is expected to increase with shear strain because of the different testing
procedures used. However, these differences are not significant up to the maximum strain
levels achieved in this study. The variation of shear modulus and damping ratio with
shear strain level are in good agreement and follow the hyperbolic model (Fig. 5.8).
Figure 5.8b shows typical results for the normalized values of the shear modulus with
respect to Gmax.

80
Table 5.3: Summary of Ottawa sand results for low shear strain levels
(2.7*10-6
< γ < 1.0*10-5
).
* F(e) = ( 2.17 – e) 2 / (1 + e) Hardin and Drnevich (1972)
30 S1 0.521 48.9 0.71 176.1 54.3 30.3
30 S2 0.496 50.0 0.52 163.7 47.7 25.4
30 S3 0.532 48.3 0.49 179.9 56.2 32.1
30 S4 0.563 45.2 0.45 171.3 50.0 30.2
Difference
Avg (%)7.72 5.44 23.66 3.35 4.08 11.90
60 S1 0.521 57.1 0.42 205.8 74.1 41.4
60 S2 0.495 58.7 0.37 192.0 65.6 35.0
60 S3 0.532 61.1 0.72 227.6 89.9 51.4
60 S4 0.563 58.1 0.33 220.0 82.4 49.9
Difference
Avg (%)
7.81 2.92 32.18 12.50 23.35 32.47
120 S1 0.520 69.3 0.29 249.5 108.9 60.8
120 S2 0.495 76.9 0.39 251.5 112.6 59.9
120 S3 0.533 73.3 0.60 273.1 129.4 73.9
120 S4 0.563 70.0 0.29 264.9 119.4 72.3
Difference
Avg (%)
7.99 1.93 30.99 7.40 12.33 21.11
240 S1 0.520 92.8 0.27 334.1 195.3 109.0
240 S2 0.494 93.2 0.31 325.0 188.1 99.9
240 S3 0.533 87.9 0.44 327.4 186.1 106.3
240 S4 0.563 85.0 0.21 321.4 175.8 106.4
Difference
Avg (%)8.09 7.01 12.46 1.55 5.60 1.82
Shear
Velocity
(m/s)
G /F(e)*Confinement
(Kpa)Void ratio
Resonanat
frequency
(Hz)
Damping
(%)
Shear
Modulus
(Gpa)
Sample

81
Figure 5.3: Damping vs. shear strain level for aluminum probes.
0
1
2
3
4
5
6
7
8
9
10
0 3 6 9 12 15
Da
mp
ing x
10
0
Shear strain Level x (E04)
AL - 1 RF 12 Hz
AL - 3 RF 40.7 Hz
0
1
2
3
4
5
6
7
8
9
10
0 0.5 1 1.5 2 2.5
Da
mp
ing x
10
0
Shear strain level x (E04)
AL - 2 RF 97 Hz
AL - 4 RF 90 Hz
(a)
(b)

82
Figure 5.4: (a) Damping vs. shear strain level and (b) shear
modulus vs shear strain leve,l at σ' = 30 KPa.
0
2
4
6
8
10
5.0E-06 5.0E-05 5.0E-04
Da
mp
ing
(%
)
Shear Strain level
RCA- 1, S1
RCA- 1, S2
RCA- 2, S3
RCA- 2, S4
10
15
20
25
30
35
5.0E-06 5.0E-05 5.0E-04
G / F
(e)
Shear Strain level (log)
RCA- 1, S1
RCA- 1, S2
RCA- 2, S3
RCA- 2, S4
(a)
(b)

83
Figure 5.5: (a) Damping vs shear strain level and (b) shear
modulus vs shear strain level at σ' = 60 KPa.
0
1
2
3
4
5
6
7
8
5.0E-06 5.0E-05 5.0E-04
Da
mp
ing
(%
)
Shear Strain level
RCD- 1, S1
RCD- 1, S2
RCD- 2, S3
RCD- 2, S4
20
25
30
35
40
45
50
55
5.0E-06 5.0E-05 5.0E-04
G / f
(e)
Shear Strain level (log)
RCD- 1, S1
RCD- 1, S2
RCD- 2, S3
RCD- 2, S4
(a)
(b)
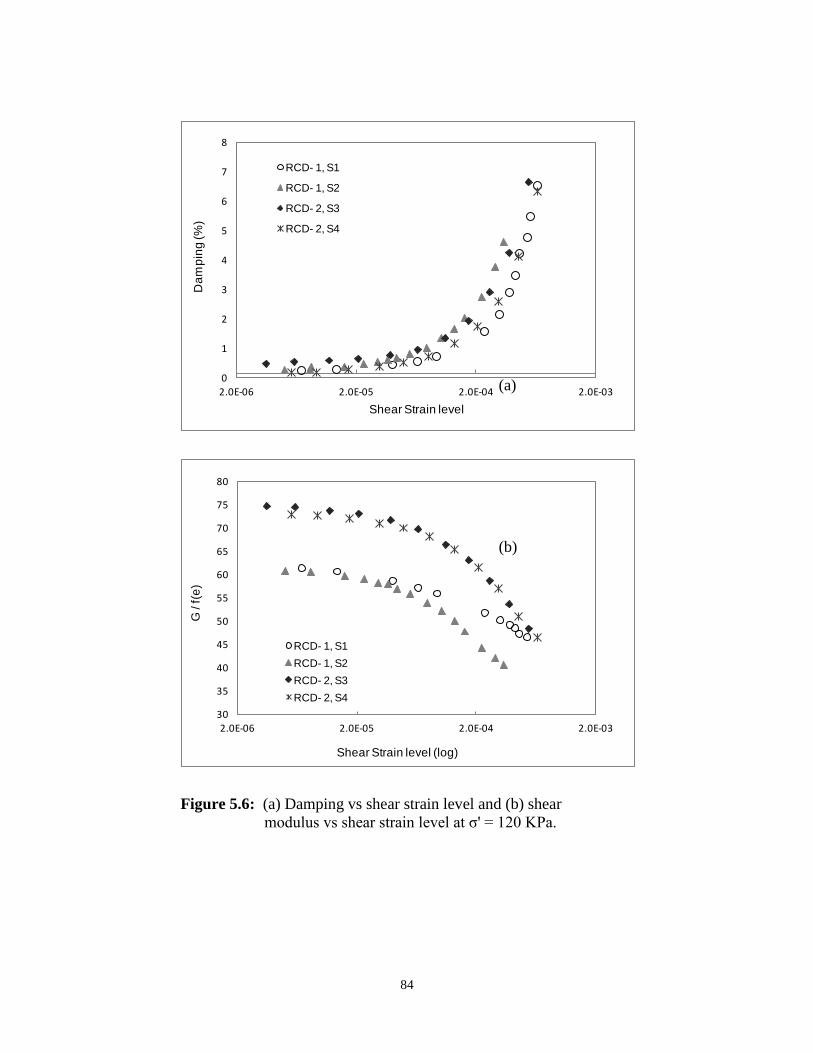
84
Figure 5.6: (a) Damping vs shear strain level and (b) shear
modulus vs shear strain level at σ' = 120 KPa.
0
1
2
3
4
5
6
7
8
2.0E-06 2.0E-05 2.0E-04 2.0E-03
Da
mp
ing
(%
)
Shear Strain level
RCD- 1, S1
RCD- 1, S2
RCD- 2, S3
RCD- 2, S4
30
35
40
45
50
55
60
65
70
75
80
2.0E-06 2.0E-05 2.0E-04 2.0E-03
G / f
(e)
Shear Strain level (log)
RCD- 1, S1
RCD- 1, S2
RCD- 2, S3
RCD- 2, S4
(a)
(b)

85
Figure 5.7: (a) Damping vs shear strain level and (b) shear
modulus vs shear strain level at σ' = 240 KPa.
0
1
2
3
4
5
6
7
2.0E-06 2.0E-05 2.0E-04 2.0E-03
Da
mp
ing
(%
)
Shear Strain level
RCD- 1, S1
RCD- 1, S2
RCD- 2, S3
RCD- 2, S4
60
70
80
90
100
110
120
2.0E-06 2.0E-05 2.0E-04 2.0E-03
G / f
(e)
Shear Strain level (log)
RCD- 1, S1
RCD- 1, S2
RCD- 2, S3
RCD- 2, S4
(a)
(b)

86
Figure 5.8: (a) Damping vs shear strain level and (b) shear modulus vs shear
strain level at σ' = 240 KPa, with hyperbolic model.
0
1
2
3
4
5
6
7
8
2.0E-06 2.0E-05 2.0E-04 2.0E-03
Dam
pin
g (%
)
Shear Strain level
RCD-1, S1
RCD- 1, S2
RCD- 2, S3
RCD- 2, S4
Hyperbolic Model
0.4
0.5
0.6
0.7
0.8
0.9
1
1.1
2.0E-06 2.0E-05 2.0E-04 2.0E-03
Sh
ea
r M
od
ulu
s, G
(M
Pa
)
Shear Strain level
RCD- 1, S1
RCD- 1, S2
RCD- 2, S3
RCD- 2, S4
Hyperbolic Model

87
5.5 CONCLUDING REMARKS
The results of an experimental study using two different resonant columns are
presented. RC tests are performed on calibration aluminum probes and on dry sands
(Ottawa silica sand). The results from the calibration probes show that the base of the RC
cannot be considered fixed as the damping ratio increases with the excitation frequency.
This trend suggests that radiation damping should be considered in the data analysis,
especially at low strain levels where the damping ratio of the tested dry sands is smaller
than 1%. The measured damping ratio of the aluminum probes differed by up to an order
of magnitude for the different types of equipment used. The damping ratio and shear
modulus at low strains measured with the two devices differed by up to 32% for the dry
sand specimens. This difference could have been generated by the different coupling
between the top caps and the specimens or by the different geometry of the specimens.
However, the results are in good agreement with the predictions of the standard
hyperbolic model once that the curves are normalized with respect to Gmax.

88
CHAPTER 6
CONCLUSIONS AND RECOMMENDATIONS
6.1 CONCLUSIONS
Shear modulus and damping ratio are the most important material properties that
determine the behavior of soils under dynamic loadings. Laboratory determination of
these properties is convenient but presents several challenges in terms of testing bias,
invalidated assumptions and analysis techniques. Reliable measurement of dynamic
properties is important for successful analysis of an important class of geotechnical
problems such as seismic design and machine foundations. This thesis investigates the
experimental determination of dynamic properties using resonant column. Different
sources of errors are identified, models for analysis are presented, testing methodologies
are developed, and comparison of results from different equipment is presented. My
research had contribution to the geotechnical community in three different categories as
follow:
6.1.1 Equipment Modification
The research involves modifications to the resonant column testing device at
University of Waterloo. The modification includes achieving higher torque in order to
increase the level of strain in the test setup. Also, the testing equipment (Amplifier) was
modified so that a constant excitation could be used during the test.

89
6.1.2 Development of New Methods for the Evaluation of Dynamic Properties
These properties can be measured from the transfer function between the
excitation and the response using the resonant column device. The force function
generated by a sinusoidal sweep excitation induces different shear strain levels at
different frequencies. Consequently, the shape of the measured transfer function is
distorted and differs from the theoretical transfer function for an equivalent single-
degree-of-freedom system. The difference between the measured and assumed transfer
functions becomes more pronounced with the increase in shear strain levels. This study
presents a new methodology for the evaluation of dynamic properties from an improved
transfer function. In this methodology, the soil specimen is excited using a fixed sine at
the required strain level along with a simultaneous excitation of small amplitude random
noise. The strain level induced by the fixed sine controls the resonant frequency and
damping coefficient of the specimen whereas the random noise controls the shape of
transfer function. The new methodology also shows a good potential for the evaluation of
dynamic properties of soils as function of frequency in resonant column testing.
6.1.3 Effect of Resonant Column Properties on Dynamic Soils characteristics
In other part of my research an experimental study using two different resonant
columns is presented. RC tests are performed on calibration aluminum probes and on dry
sands (Ottawa silica sand). The measured damping ratio and shear modulus was different
in each resonant column device. This difference could have been generated by the

90
different coupling between the top caps and the specimens or by the different geometry
of the specimens. However, the results are in good agreement with the predictions of the
standard hyperbolic model once that the curves are normalized with respect to Gmax.
6.2 RECOMMENDATIONS AND FUTURE STUDIES
Non-resonance methods have been used in torsional mode only; however,
modified resonant columns such as the one used in this study have the capability to
operate in axial mode. Comparison of non-resonance method in axial and torsional mode
can provide insight on the effect of mode of excitation on the dynamic properties using
the same specimen and device at very low strain levels. Besides measurement of dynamic
Poisson ratio, relationships between the damping ratios and elastic moduli from two
modes can be verified.
Non-resonance methods can provide better evaluation of the dynamic properties
as a function of the number of cycles than the conventional resonance method. The
present research presented suggests the feasibility of engineered fills with high damping
and stiffness characteristics. Further research is required to design cheaper materials and
verification of their performance in mitigating ground vibrations due to cyclic loading.

91
REFERENCES
Achenbach, J.D. 1984, “Wave Propagation in Elastic Solids”, North Holland,
Amsterdam, Netherlands, pp. 425
Alarcon-Guzman, A. 1986. Cyclic Stress-Strain and Liquefaction Characteristics of
Sands. PhD. Thesis, Purdue University, Indiana.
ASTM D4015-92, 2000. “Standard Test Methods for Modulus and Damping of Soils by
the Resonant-Column Method,” American Society for Testing and Materials, Annual
Book of Standards.
Avramidis, A.S. and Saxena, S.K. 1990. The Modified "Stiffened" Drnevich Resonant
Column Apparatus. Japanese Society of Soil Mechanics and Foundation
Engineering. Vol. 30, No. 3, 53-68.
Bar, Y. S., Bay, J.A. 2009. Modifications of resonant column and torsional shear device
for the large strain. Computers and Geotechnics 36 (2009) 944–952.
Badali J.P., and Santamarina, J.C. 1992. Damping of Waves in Soils. Experimental
Geomechanics Group, University of Waterloo, Ontario, June.
Bellotti, R., Ghionna, V.N., Jamiolkowski, M., and Robertson, P.K., 1989, “Design
Parameters of Cohesionless Soils from In-situ Tests”, Specialty Session, Sponsored
by Committee A2L02-Soil and Rock Properties, National Research Council,
Transportation Research Board, Washington, USA
Biot, M. A., 1956. Theory of Propagation of Elastic Waves in Fluid-Saturated Porous
Solid. Journal of the Acoustical Society of America, 28, 168-191.
Blair, D. P. 1990. A direct comparison between vibrational resonance and pulse
transmission data for assessment of seismic attenuation in rock. Geophysics, 55(1):
51-60.

92
Bolton, M. D., and Wilson, J. M. R. 1989. An Experimental and Theoretical Comparison
between Static and Dynamic Torsional Soil Tests. Géotechnique, 39(4), 585-599.
Booij, H. C., and Thoone, G. P. C. M. 1982. Generalization of Kramers-Krönig
Transforms and Some Approximations of Relations between Viscoelastic Quantities.
Rheologica Acta, 21, 15-24.
Bratsin, D. 2009. Soils Nonlinearity Effects On Dominant Site Period Evaluation.
Proceedings of the Romanian Academy, Series A.
Brocanelli, D., and Rinaldi, V. 1998. Measurement of low-strain material damping and
wave velocity with bender element in the frequency domain. Canadian Geotechnical
Journal, 35: 1032-1040.
Bourbie, T., Coussy, O., Zinszner, B., 1987. Acoustics of Porous Media. Gulf Publishing
Company. Houston, Texas.
Campanella, R. G., Stewart, W. P., Roy, D., and Davies, M. P. 1994. Low strain dynamic
characteristics of soils with the downhole seismic peizocone penetrometer. Dyn.
Geotech. Test. II, ASTM STP 1213, Philad., pp. 73-87.
Cao, X., He, Y., & Xiong, K. 2010. Confining pressure effect on dynamic response of
high rockfill dam. Frontiers of Architecture and Civil Engineering in China , 116-
126.
Cevik, A. c. 2009. Modelling damping ratio and shear modulus of sand–mica mixtures
using genetic programming. Expert Systems with Applications , 36 (4), 7749-7757.
Cascante, G., Vanderkooy, J., and Chung, W. 2005. “A new mathematical model for
resonant-column measurements including eddy-current effects.” Canadian
Geotechnical Journal, 42:(1) 121-135, 10.1139/t04-073
Cascante, G., Vanderkooy, J., and Chung, W., 2003, “Difference between current and
voltage measurement in resonant column testing,” Canadian Geotechnical Journal,
40(4): 806-820.
93
Cascante, G. and Santamarina, J. C. 1997. Low Strain Measurements Using Random
Noise Excitation, Geotechnical Testing Journal, 20(1): 29-39.
Cascante, G., Santamarina, J.C., and Yassir, N., 1998. Flexural Excitation in a Standard
Resonant Column Device. Canadian Geotechnical Journal, 35(3): 488-490.
Christensen, R. M. 1971. An Introduction to Theory of Viscoelasticity, Academic Press,
New York, pp. 245.
Crow, H. Hunter, J. A., Motazedian, D. 2011. Monofrequency in situ damping
measurements in Ottawa area soft soils. Soil dynamics and Earthquake Engineering
31 (2011) 1669 – 1677.
Das, B. M., & Ramana, G. (2011). Principles of Soil Dyanmics. Cengage Learning.
Delépine, N., Lenti, L., Bonnet, G., & and Semblat, J.-F. (2009). Nonlinear Viscoelastic
Wave Propagation: An Extension of Nearly Constant Attenuation Models. Journal
of Engineering Mechanics , 10.
Dobry, R. 1970, “Damping in Soils: Its Hysteretic Nature and Linear Approximation”,
Research Report R70-14, Massachusetts Inst. of Tech.
Dobry, R. and Vucetic, M. (1987). "Dynamic Properties and Seismic Response of Soft
Clay Deposits." International Symposium on Geotechnical Engineering of Soft
Soils, Vol. 2, Mexico City, 51-87.
Drnevich, V. P., 1967. “Effects of strain history on the dynamic properties of sand,”
Ph.D. Thesis, University of Michigan, 151 pp.
Drnevich, V.P. 1978. Resonant-Column Problems and Solutions. Dynamic Geotechnical
Testing, ASTM STP 654, p 384-398.
Drnevich, V.P. and Richart, F.E., Jr. 1970. Dynamic Prestraining of Dry Sand. Journal of
Soil Mechanics and Foundations Divisions, ASCE, Vol. 96, No.SM2 pp 453-469.
Drnevich, V.P., 1985. Recent Developments in Resonant Column Testing. Richart
Commemorative Lectures, Edited by R.D. Woods, Proceedings of a Session

94
sponsored by the Geotechnical Engineering Division in conjunction with the ASCE
Convention, Detroit, Michigan, p 79-107.
Du Tertre, A., Cascante, G., and Tighe, S. Combining PFWD and Surface Wave
Measurements for Evaluation of Longitudinal Joints in Asphalt Pavements. The
Transportation Research Board (TRB) 89th Annual Meeting. Washington, D.C.,
January, 3319-3327. (Accepted 2010).
Electric Power Research Institute, 1991, Proceedings: NSF/EPRI Workshop on Dynamic
Soil Properties and Site Characterization. Report NP-7337, Vol 1, Research Project
810-14.
Fratta, D. and Santamarina, J. C., 1996, “Wave propagation in soils: Multi-mode, wide
band testing in waveguide device” Geotechnical Testing Journal, ASTM, 19(2):
130-140.
Frost J.D., 1989. Studies on the Monotonic and Cyclic Behaviour of Sands. PhD. Thesis,
Purdue University, Indiana.
Fung, Y.C. 1965, “Foundations of Solid Mechanics”, Prentice-Hall, New Jersey, pp. 525
Groves, P., Cascante, G., Chatterji, P.K., Dundas, D., 2011. Use of Geophysical Methods
for Soil Profile Evaluation. Canadian Geotechnical Journal.
Groves, P., Cascante, G., Knight, M. 2011. Ultrasonic Characterization of Exhumed Cast
Iron Water Pipes Geotechnical Journal. Smart Structures & Systems Journal.
Hardin, B. O., and Drnevich, V. P. (1972). "Shear Modulus and Damping in Soils:
Measurement and Parameter Effects." Journal of the Soil Mechanics and
Foundations Division, Proceedings of the ASCE, 98(SM6), 603-624.
Hardin, B. O. and Drnevich, V. P., (1972). “Shear Modulus and damping in soils: Design
equations and curves.” Journal of soil mechanics and foundations division, ASCE,
Vol. 98, No. SM7, pp. 667.

95
Hardin, B.O., 1965. The Nature of Damping in Sands. Journal of the Soil Mechanics and
Foundations Division, ASCE, Vol. 91, No. SM1, pp. 63-97.
Hardin, B.O. and Richart, F.E. Jr. 1963. Elastic Wave Velocities in Granular Soils.
Journal of the Soil Mechanics and Foundations Division, ASCE, 89(SM1): 33-63.
Hardin, B.O. and Scott G.D. 1966. Generalized Kelvin-Voigt Used in Soil Dynamics
Study. Journal of the Engineering Mechanics Division, ASCE, February, 143-156.
Humar, L. 2005. Dynamics of Structures (2nd Edition ed.). New York: Taylor & Francis.
Hauge, P. S. 1981. Measurements of attenuation from vertical seismic profiles.
Geophysics, 46: 1548-1558.
Isenhower, W.M., 1980. Torsional Simple Shear/Resonant Column Properties of San
Francisco Bay Mud. MS. Thesis, The University of Texas at Austin
Ishihara, K. 1986. Evaluation of Soil Properties for Use in Earthquake Response
Analysis. In Geomechanical Modelling in Engineering Practice, Edited by R.
Dungar and J.A. Studer, A.A. Balkema Publishers, Rotterdam, Netherlands.
Ishihara, K. 1996. Soil Behavior in Earthquake Geotechnics, Oxford University Press
Inc., New York.
Iwasaki, T., Tatsuoka, F., and Takagi, Y. 1978. Shear Modulus of Sands under Cyclic
Torsional Shear Loading. Soils and Foundations, 18(1), 39-56.
Jafarzadeh, F. Sadeghi, H. 2011. Experimental study on dynamic properties of sand with
emphasis on the degree of saturation. Soil Dynamic sand Earthquake Engineering 32
(2012) 26 – 41.
Jiang, Z. Ponniah, J., and Cascante, G., Haas, R., 2011. Innovative Nondestructive Test
Method for Condition Assessment of Hot Mix Asphalt Mixtures. Canadian Journal of
Civil Engineering.
Johnston, D.H. 1981. Seismic Wave Attenuation. Geophysics Reprint Series, No. 2.
Society of Exploration Geophysicists. Tulsa, Oklahoma, p. 123-135.

96
Jones, T.D. 1986. Pore Fluids and Frequency-Dependent Wave Propagation in Rocks.
Geophysics, v. 51, p. 1939-1953.
Kallioglou, P., Tika, T., Koninis, G., & St.Pitilakis, K. (2009). Shear Modulus and
Damping Ratio of Organic Soils. Geotechnical and Geological Engineering , 217-235.
Khan, Z. H., Cascante, G., and El Naggar, M.H. 2011. Frequency dependent dynamic
properties from resonant column and cyclic triaxial tests. Journal of the Franklin
Institute 348 2011 1363 – 1376
Khan, Z. H., Cascante, G., and El Naggar, M.H., 2008a. Linearity of the first torsional
mode of vibration and base fixidity in resonant column. ASTM, Geotechnical Testing
Journal, 31(1): 587 - 606.
Khan, Z. H., Cascante, G., El Naggar, M.H., and Lai, C. 2008b. Measurement of
frequency-dependent dynamic properties of soils using the Resonant-Column device.
Journal of Geotechnical and Geoenvironmental Engineering, ASCE, 134(9): 1319-
1326.
Kim, D.S., 1991. Deformational Characteristics of Soils at Small to Intermediate Strains
from Cyclic Tests. PhD. Thesis, The University of Texas at Austin.
Kim, D.-S., and Stokoe, K. H. 1995. Deformational Characteristics of Soils at Small to
Medium Strains. Earthquake Geotechnical Engineering, Tokyo, Japan, 89-94.
Kjartansson, E., 1979, “Constant Q-wave Propagation and Attenuation”, Journal of
Geophysical Research, 84: 4737-4748
Kramer, S. L. 1996. Geotechnical Earthquake Engineering, Prentice Hall, New Jersey.
Lai, C. G., Meza-Fajardo, K. C., 2007, On the implications of the principle of physical
causality in the propagation of seismic waves in geomaterials. Rivista Italiana Di
Geotecnica.
Lai, C. G., Pallara, O., Lo Presti, D. C. and Turco, E. (2001). "Low-strain stiffness and
Material Damping Ratio Coupling in Soils." Advanced Laboratory Stress-strain

97
Testing of Geomaterials, Tatsuoka, T., Shibuya, S., and Kuwano, R. Eds, Balkema,
Lisse, pp: 265-274.
Liu, H.P., Anderson, D.L., and Kanamori, H. 1976, “Velocity Dispersion due to
Anelasticity: Implications for Seismology and Mantle Composition”, Geophysical
Journal Royal Astronomical Society, 47: 41-58
LIU, F., 2010. Research on consolidation pressure correlated dynamic properties model
of clay and its application. Rock and Soil Mechanics .
Lodde, P.F., 1982. Dynamic Response of San Francisco Bay Mud. M.S. Thesis, The
University of Texas at Austin.
Lo Presti, D.C.F., and Pallara, O. 1997, “Damping Ratio of Soils from Laboratory and
In-situ Tests”, Proceddings, 14th
International Conference on Soil Mechanics and
Foundation Engineering, Hamburg, Germany, pp: 6-12
Lo Presti, D.C.F., Jamiolkowski, M., Pallara, O., and Cavallaro, A. 1996, “Rate and
Creep Effect on the Stiffness of Soils”, Proc. Conference on Measuring and
Modeling Time Dependent Soil Behavior, Held in Conjunction with the ASCE
National Convention, Washington D.C., USA.
Lovelady, P. L. and Picornell, M. 1990, “Sample coupling in resonant column testing of
cemented soils.” Dynamic Elastic Modulus Measureemnt in Materials, ASTM STP
1045, Philadelphia.
Malagnini, L., 1996, “Velocity and Attenuation Structure of Very Shallow Soils:
Evidence for Frequency Dependent Q”, Bulletin of Seismological Society of
America, 86(5): 1471-1486.
Mott, G. and Wang, J., 2010, The effects of variable soil damping on soil-structure
dynamics. Journal of Vibration and Control 2011 17: 365.
Murphy, W.F. 1982. Effects of Partial Water Saturation on Attenuation in Massilon
Sandstone and Vycor Porous Glass. Journal of the Acoustical Society of America
71(6), June, p. 1458-1467.
98
Murphy, W.F., Winkler K.W. and Kleinberg R.L. 1984. Frame Modulus Reduction in
Sedimentary Rocks: The effect of Adsorption on Grain Contacts. Geophysical
Research Letters. v. 1, p. 805-808.
Naggar, M. H. 2008. Dynamic Properties of Soft Clay and Loose Sand from Seismic
Centrifuge Tests. Geotechnical and Geological Engineering, 593-602.
NBCC, 2010. National Building Code of Canada 2010. National Research Council of
Canada, NRCC 38726, Ottawa, 571 pp.
O’Connell, R.J., and Budiansky, B. 1978, “Measures of Dissipation in Viscoelastic
Media”, Geophysical Research Letters, 5: 5-8
Pak, J. C. 2010. Application of Random Vibration Techniques to Resonant Column
Testing. GeoFlorida 2010: Advances in Analysis, Modeling, & Design. Proceedings
of the GeoFlorida 2010 Conference.
Pipkin, A.C. 1986, “Lectures on Viscoelasticity Theory”, 2nd
Edition, Springer-Verlag,
Berlin, pp. 188.
Raptakis, D. G., 2011, Pre-loading effect on dynamic soil properties: Seismicmethods
and their efficiency in geotechnical aspects, Soil Dynamics and Earthquake
Engineering 34 (2012) 69 – 77.
Read, W. T. J. 1950. "Stress Analysis for Compressible Viscoelastic Materials", Journal
of Applied Physics, 21, 671-674.
Richart F. E., Hall J. R. and Woods R. D. 1970. Vibrations of soils and foundations.
Prentice Hall, Englewood Cliffs, pp: 414.
Rix, G. J., and Meng, J. 2005. A non resonance method for measuring dynamic soil
properties., Geotechnical Testing Journal, 28(1), pp.1-8.
Santamarina, J. C., Klein, K. A., and Fam, M. A. 2001. Soils and Waves. John Wiley &
Sons, New York.

99
Schuettpelz, C. C., Fratta, D., 2010. Mechanistic Corrections for Determining the
Resilient Modulus of Base Course Materials Based on Elastic Wave Measurements.
Geotechnical and Geoenvironmental Engineering, 1086–1094.
Shibuya, S., Mitachi, T., Fukuda, F., and Degoshi, T. (1995). "Strain-Rate Effects on
Shear Modulus and Damping of Normally Consolidated Clay." Geotechnical
Testing Journal, 18(3), 365-375.
Stokoe, K.H. II, Hwang, S.K., Lee, J.N.-K, and Andrus, R.D. 1994. Effects of various
parameters on stiffness and damping of soils to medium strains, Proceedings,
International Symposium on Prefailure Deformation Characteristics of
Geomaterials, Vol. 2, Japanese Society of Soil Mechanics and Foundation
Engineering, Sapporo, Japan, September, 785-816.
Stokoe, K., and Isenhower M., 1980. Dynamic Properties of Offshore Silty Samples.
Proceedings of the 12th Annual Offshore Technology Conference. Houston, Texas.
Stoll, Robert D., 1978. Damping in Saturated Soil. Proc. Specialty Conf. on Earthquake
Engineering and Soil Dynamics, ASCE, New York, p. 969-975.
Stoll, Robert D., 1979. Experimental Studies of Attenuation in Sediments a). Acoustical
Society of America 66(4), October, p. 1152-1160.
Stoll, Robert D., 1984. Computer-Aided Measurements of Damping in Marine
Sediments. Computational Methods and Experimental Measurements. 3.29-3.39.
Stoll, Robert D., 1985. Computer-Aided Studies of Complex Soil Moduli. Measurement
and Use of Shear Wave Velocity for Evaluating Dynamic Soil Properties, Richard
W. May, p. 18-33.
Tallavo, F., Cascante, G. and Pandey, M. D., 2011. Estimation of the Probability
Distribution of Wave Velocity in Wood Poles, Journal of Materials in Civil
Engineering, ASCE.
Toksöz, M. N., Johnston, D. H., and Timur, A. 1979. Attenuation of seismic waves in
dry and saturated rocks: I. Lab. Meas. Geophysics, 44(4): 681-690.

100
Toll, J.S. 1956. Causality and the dispersion relation: logical foundations. Physical
Review, 104(6): 1760-1770.
Tschoegl, N. W. 1989. The Phenomenological Theory of Linear Viscoelastic Behavior,
An Introduction, Springer-Verlag, Berlin Heidelberg, pp: 769.
Tsui, Y.-H. W.-Y. 2009. Experimental Characterization of Dynamic Property Changes in
Aged Sands. Journal of Geotechnical & Geoenvironmental Engineering , 12.
Turan, A., Hinchberger, S., & El Naggar, M. (2009). Mechanical Characterization of an
Artificial Clay. Journal of Geotechnical & Geoenvironmental Engineering , 11.
Vinod, T. G. 2010. Evaluation of Shear Modulus and Damping Ratio of Granular
Materials Using Discrete Element Approach. Geotechnical and Geological
Engineering, 28 (5), 591-601.
Vucetic, M. 1994. "Cyclic Threshold Shear Strains in Soils." Journal of Geotechnical
Engineering, ASCE, 120(12), 2208-2228.
Vucetic, M., and Dobry, R. 1991, “Effect of Soil Plasticity on Cyclic Response”, Journal
of Geotechnical Engineering, ASCE, 117(1): 89-107
Wang, Z., and Nur, A. 1992. Elastic Wave Velocities in Porous Media: A Theoretical
Recipe. Seismic and Acoustic Velocities in Reservoir Rocks. vol. 2, 1-35.
White, J.E., 1975. Computed Seismic Speeds and Attenuation in Rocks with Partial Gas
Saturation. Geophysics, v. 40, p. 224-232.
Wilson, S.D., and Dietrich, R.J., 1960. Effect of Consolidation Pressure on Elastic and
Strength Properties of Clay, Proceedings of the ASCE, Soil Mechanics and
Foundations Division, Research Conference on Shear Strength of Cohesive Soils,
Boulder, CO.
Winkler, K., Nur, A., and Gladwin, M. 1979. Friction and seismic attenuation in rocks.
Nature, 227: 528-531.

101
Winkler, K., and Nur, A., 1982. Seismic Attenuation: Effects of Pore Fluids and
Frictional Sliding. Geophysics. v. 47, p. 1-15.
Woods, R.D., 1978, “Measurement of Dynamic Soil Properties”, Proceedings, ASCE
Specialty Conference on Earthquake Engineering and Soil Dynamics, Pasadena,
California. Vol.1, pp. 91-178.Dobry, R. and Vucetic, M. (1987) State of the art report:
Dynamic properties and response of soft clay deposits. Proc. Int. Symp on
Geotechnical Engineering of Soft Soils, Vol. 2, 51- 87.
Wu, R., and Aki, K. 1988. Introduction: Seismic wave scattering in three-dimensionally
heterogeneous earth. In Scattering and Attenuation of Seismic Waves, Part 1. Edited
by K. Aki and R. Wu. Birkhäsuer Verlag. Pp: 1-6.
Yang, Y., Cascante, and Polak, M., 2010. Damping measurements in construction
materials using the wavelet transform. Journal of Geotechnical and
Geoenvironmental Engineering, ASCE.
Zemanek, J., Jr., and Rudnick, I. 1961. Attenuation and dispersion of elastic waves in a
cylindrical bar. The Journal of the Acoustical Society of America, 33: 1283-1288.

102
APPENDIX A
TRANSFER FUNCTION METHOD
The equation of motion for a specimen subjected to torsional excitation in the resonant
column device can be expressed in terms of the displacement, x.
m
aaa
rFr
xk
r
xc
r
xJ
1 [A1]
where F is the force induced by current in the coils, J1 is the mass polar moment of
inertia of the specimen and driving plate ( 3/1 IIJ o ), c is the viscous damping
coefficient, rm is the distance of magnets from the center of the specimen, Io and I are the
mass polar moment of inertia of the driving plate and specimen respectively, and ra is the
radial distance of accelerometer from the center of the specimen. Time derivatives are
expressed by the dots on top of the appropriate variables.
The force (F = BL IC) applied to the driving plate is proportional to the current (IC)
amplitude in the coils and the magnetic force factor of the coils. Defining the stiffness of
the specimen (k) as the product of ωo2 and J1, Eq. A1 can be written as;
mCL
a
o
aa
rIBr
xJi
r
xci
r
xJ 1
22
1 )(
[A2]
mCLo
a
rIBJicJr
x 1
22
1 )(
[A3]

103
The angular rotation (φ(ω)=x/ra) can be expressed in terms of displacement (x) and ra as
1
22
1 )()(
JicJ
rIB
o
mCL
[A4]
2
2
2
1
2
22
1
)(
)(o
o
oo
omCL
J
icJ
rIB
[A5]
2
1
2
22
1
)(1
)(oo
omCL
J
icJ
rIB
[A6]
Viscous damping coefficient is expressed in terms of material damping ratio (ξ) and mass
polar moment of inertia of the system as oJc 12 . Substitution in Eq. A6 yields;
o
oo
o
o
mCL
J
JiJ
rIB
1
1
2
2
1
)/(21
)( [A7]
oo
ooo i
II
T
21
3)(
)(2
2
[A8]
where To(ω) is the applied torque to the system.

104
APPENDIX B
COMPARISON OF DIFFERENT METHODS OF RC TESTING
Figure B1. Comparison of Shear modulus calculated by FN, NR and RC Method In
Leda Clay.
0.4
0.5
0.6
0.7
0.8
0.9
1
1.1
5.0E-06 5.0E-05 5.0E-04 5.0E-03
No
rma
lize
d G
ma
x (
Mp
a)
Strain Level ( log)
RC data
NR data
FN

105
Figure B2. Comparison of Damping calculated by FN, NR and RC Method in Leda
Clay.
Figure B3. Comparison of Shear modulus calculated by FN, NR and RC Method In
Leda Clay and curve fit with theoretical TF for each one.
0
0.005
0.01
0.015
0.02
0.025
0.03
0.035
0.04
0.045
0.05
5.0E-06 5.0E-05 5.0E-04 5.0E-03
Da
mp
ing
Strain Level ( log)
RC damping
NR damping
FN damping
0
0.2
0.4
0.6
0.8
1
1.2
5.0E-06 5.0E-05 5.0E-04 5.0E-03
Gm
ax
(M
pa
)
Strain Level ( log)
RC data fit
NR data NR fit
FN Model for FN

106
Figure B4. Comparison of Shear modulus calculated by FN, NR and RC Method In
Leda Clay and curve fit with theoretical TF for each one.
Figure B5. Comparison of Shear modulus calculated by NR and FN Method In Sand.
0
0.01
0.02
0.03
0.04
0.05
0.06
0.07
0.08
0.09
0.1
5.0E-06 5.0E-05 5.0E-04 5.0E-03
Da
mp
ing
Strain Level ( log)
RC damping fit
NR damping NR fit
FN Model for FN
170
175
180
185
190
195
200
205
35 40 45 50 55 60 65 70
She
ar v
elo
city
(m
/s)
Frequency (Hz)
Fix + RND 9.5E-06
Vs by NR
Vs by RF

107
Figure B6. Comparison of Damping calculated by FN, NR and RC Method in Sand.
Figure B7. Normalized TF at different frequency in high strain level using FN method.
0
0.5
1
1.5
2
2.5
3
3.5
35 40 45 50 55 60 65 70
Dam
pin
g (%
)
Frequncy (Hz)
Fix + RND 9.5E-06
NR damping
Analyser damping
0
0.2
0.4
0.6
0.8
1
1.2
0.7 0.8 0.9 1 1.1 1.2 1.3
No
rm
ali
zed
TF
Freq (Hz)
FN 4.0 E-04
F = 57
F = 60
F = 61.375
F = 63
F = 68
F = 76
F = 87

108
Figure B8. Normalized TF at different frequency in Low strain level using FN method
0
0.2
0.4
0.6
0.8
1
1.2
35 45 55 65 75 85 95
No
rm
ali
zed
Ma
g o
f T
F
Frequency (Hz)
f=50
f=55
f=65
f=68
f=70
f=79
f=89

109
APPENDIX C
SOLUTION FOR NON RESONANCE (NR) METHOD
Shear stress on the element in a cylindrical specimen with negligible damping coefficient
is given by
dz
drGtrz
),,(
[C1]
dϴ/dz is angle of twist per unit length, r is radial distance from center, and G is shear
modulus
dz
dJGtzT
),(
[C2]
J is area polar moment of inertia. Applying Newton’s 2nd
law of motion to element with
length dz
2
2
dt
dJ
dz
dT
[C3]
where ρ is the mass density. Taking derivative of Eq. C2 w.r.t. z and substituting in
Eq.C3
2
2
2
2
dz
dG
dt
d
[C4]
The displacement function can be assumed as
)sin()cos()(),( ttzutz [C5]

110
where u(z) is spatial function defined by boundary conditions. By differentiating Eq. C5
w.r.t. z and t and substituting in Eq. C4, following relationships are obtained.
)sin()cos()('')sin()cos()(2 ttzuG
ttzu
0)sin()cos()()(''
2
ttzu
zuG
Let u(z) = eλz
, then the taking the double derivative w.r.t. z and substitution can be
solved for the two roots of λ.
0)()('' 2 zuzuG
0)()( 22 zuzuG
022 G
Vsi
Then u(z) can be defined as Eq. C6 and can be rewritten as Eq. C7.
zVs
izVs
i
eAeAzu
21)( [C6]
z
VsCz
VsCzu
sincos)( 43
[C7]
The first boundary condition is that the displacement at fixed end is zero (z=0) Then Eq.
C5 becomes:
0)sin()cos()0(),0( ttut

111
By applying this boundary condition we know that u(0)=0 and hence c3=0. Hence the
equations for u(z) can be simplified to
z
VsCzu
sin)( 4
[C8]
The second boundary condition is that the forces at top should satisfy the the equation of
motion, hence,
)sin(),(
),(2
2
tTdt
tLdItLT oo
Substituting T(L,t) from Eq. C2
)sin(),(
2
2
tTdz
dJG
dt
tLdI oo
)sin(),(
2
2
tTdz
d
L
IG
dt
tLdI oo
[C9]
By differentiating ϴ(z,t) with respect to z and t and setting z = L Eq. C9 becomes
oo TLuILuL
IG )()(' 2
4
2 sincosC
T
Vs
LI
Vs
L
VsL
IG oo
[C10]
At resonance the amplitude of twist C4 should approach to infinity and therefore
0sincos2
Vs
LI
Vs
L
VsL
IG ooo
oo
Vs
L
Vs
L
I
I oo
o
tan
[C11]
Similarly Eq. C10 can be rearranged and by setting VsL /

112
sin
sinsincos
4
Vs
L
I
I
Vs
JG
C
T oo
I
IJVs
C
T oo
cot
)sin(4
I
IJVsJVs
Lu
T oo cot
)(
VsI
LI
L
IVsJVs
Lu
T oo
cot
)(
2cot)(
oo IJVsLu
T
2cot)(
o
o IJVsL
L
Lu
T
2
24
tan2)(
o
o ILR
Lu
T
[C12]
Equation C12 is the non-resonance frequency equation which can be solved for complex
b. Equation C12 should be also approach 0 at resonance for negligible damping and yield
Eq. C11.