Embed Size (px)
Citation preview
Effect of Metabolizable Undegradable Protein and Supplemental Methionine and Lysine on Production
Parameters and Nitrogen Efficiency of Holstein Cows in Early Lactation
Undergraduate Honors Research Project
2001 Department of Animal Sciences
The Ohio State University
Sarah Katherine Ivan
Project Advisor: Dr. Normand R. St-Pierre
Academic Advisor: Dr. Jeffrey L. Firkins
fae HON:ANI 2001 1926
Table of Contents
Abstract .......................................................................... .
Acknowledgements................................................... . . . . . . . . . iii
List of Tables.................................................................... iv
List of Abbreviations.......................................................... v
Introduction...................................................................... 1
Review of Literature........................................................... 3
Materials and Methods......... . . . . . . . . . . . . . . . . . . . . . . . . . . . . . . . . . . . . . . . . . . . . . . . 8
Results and Discussion... . . . . . . . . . . . . . . . . . . . . . . . . . . . . . . . . . . . . . . . . . . . . . . . . . . . . 15
Conclusion........................................................................ 21
Definition of terms... . . . . . . . . . . . . . . . . . . . . . . . . . . . . . . . . . . . . . . . . . . . . . . . . . . . . . . . . . . . . 22
Literature Cited.................................................................. 23
Abstract
Milk production can have a negative effect on the environment from excessive
excretion of nitrogen (N) by dairy cows. We hypothesized that targeted dietary
changes to the N-intake pools, or the N available in the feed, would improve N
efficiency by dairy cows, thus reducing negative environmental impact from milk
production. Forty multiparous and 22 primiparous Holstein cows were used in a 2x2
factorial arrangements of dietary treatments to determine the effects of (1)
metabolizable rumen undegradable protein (M-RUP): 100% (loM-RUP) or 110%
(HiM-RUP) of the requirements stated by the National Research Council (NRC)
(2001), and (2) methionine (Met) and lysine (lys) supplementation: control levels of
6.15 and 1.80% Lys and Met, respectively (loAA), or supplementation at 108% and
120% (HiAA) of control levels for Lys and Met respectively. The Lys to Met ratio in
the HiAA diets was set at 3.0, as recommended by the NRC (2001), whereas the
LoAA diets contained Lys to Met ratios of 3.3 to 3.4. Cows were randomly assigned
to one of four dietary treatments 14 to 21 days postpartum and continued on their
assigned diet for 12 weeks. There was no effect of treatment on dry matter intake or
milk yield. Treatment had significant effects on milk true protein (2.96, 3.08, 2.97,
3.02; SE = 0.041 %), milk fat (3.21, 3.07, 3.34, 3.39; SE = 0.11 %), and lactose
(4.81, 4.73, 4.90, 4.78; SE = 0.024 %) for the HiM-RUP-LoAA, HiM-RUP-HiAA, LoM
RUP-LoAA, and LoM-RUP-HiAA treatments respectively. Lower levels of M-RUP
significantly decreased urinary N excretion. Cows were more efficient at converting
intake N to milk Nat higher amino acid levels and with a Lys to Met ratio at 3.0.
Dietary manipulation of N fractions can reduce the impact of intensive dairy
production on the environment.
11
Acknowledgements
I would like to thank Susan Noftsger for her endless advice and help with this
project. This trial would not have gone as smoothly without her. I would also like to
thank Dr. Normand St-Pierre for giving me the chance to do this project and for the
countless things I have learned from him over the past year. Thank you to Dr.
Jeffrey Firkins for encouraging me to pursue an honors project. Finally, I would
especially like to thank my parents, Robert and Karen, my brother, Jake, and my
sister-in-law, Jennifer for all their support and optimism that helped me get through
this project.
111
List of Tables
Table Page
Table 1. Calculated nutrient composition of diets .................................. 10
Table 2. Ingredient and nutrient composition of diets as a percentage of dry matter ............................................... 11
Table 3. Dry matter intake and milk production responses of cows fed different levels of M-RUP and amino acid balances ..................................................... 16
Table 4. Nitrogen efficiencies of cows fed different levels of M-RUP and amino acid balances .......................................... 19
lV
Abbreviation Key
ADF- Acid detergent fiber
CP- Crude protein
OM- Dry matter
DMI- Dry matter intake
M-RUP- Metabolizable-rumen undegradable protein
MUN- Milk urea nitrogen
NDF- Neutral detergent fiber
NRC- National research council
NEL- Net energy of lactation
RDP- Rumen degradable protein
RUP- Rumen undegradable protein
v
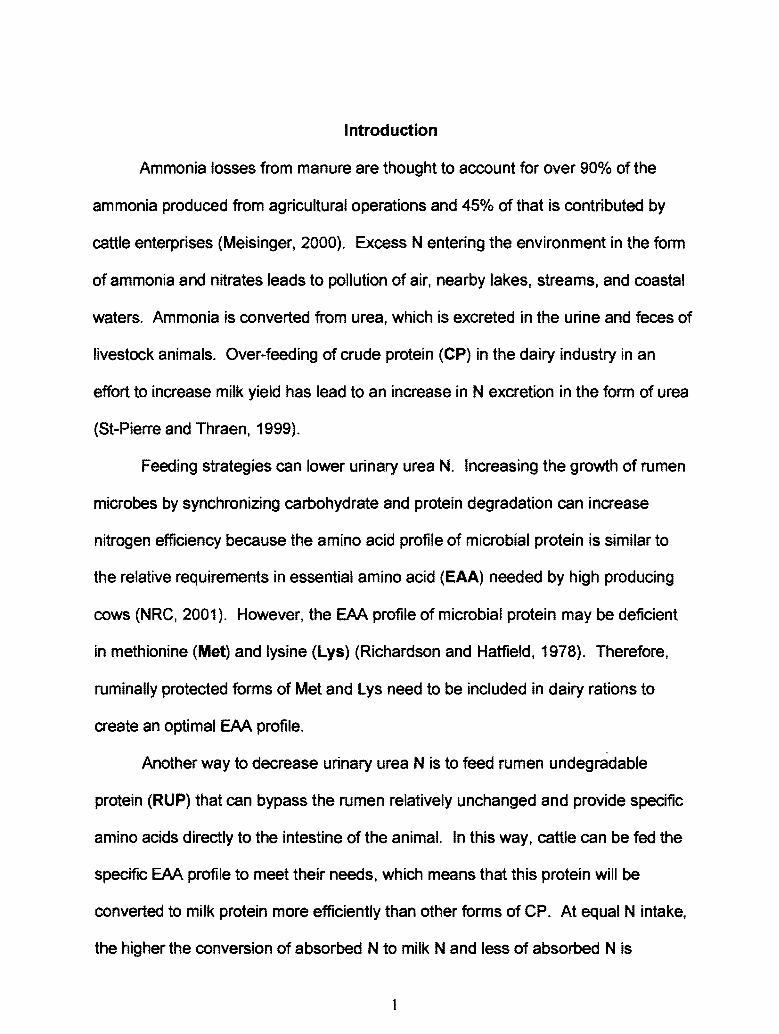
Introduction
Ammonia losses from manure are thought to account for over 90% of the
ammonia produced from agricultural operations and 45% of that is contributed by
cattle enterprises (Meisinger, 2000). Excess N entering the environment in the form
of ammonia and nitrates leads to pollution of air, nearby lakes, streams, and coastal
waters. Ammonia is converted from urea, which is excreted in the urine and feces of
livestock animals. Over-feeding of crude protein (CP) in the dairy industry in an
effort to increase milk yield has lead to an increase inN excretion in the form of urea
(St-Pierre and Thraen, 1999).
Feeding strategies can lower urinary urea N. Increasing the growth of rumen
microbes by synchronizing carbohydrate and protein degradation can increase
nitrogen efficiency because the amino acid profile of microbial protein is similar to
the relative requirements in essential amino acid (EAA) needed by high producing
cows (NRC, 2001). However, the EAA profile of microbial protein may be deficient
in methionine (Met) and lysine (Lys) (Richardson and Hatfield, 1978). Therefore,
ruminally protected forms of Met and Lys need to be included in dairy rations to
create an optimal EAA profile.
Another way to decrease urinary urea N is to feed rumen undegradable
protein (RUP) that can bypass the rumen relatively unchanged and provide specific
amino acids directly to the intestine of the animal. In this way, cattle can be fed the
specific EAA profile to meet their needs, which means that this protein will be
converted to milk protein more efficiently than other forms of CP. At equal N intake,
the higher the conversion of absorbed N to milk N and less of absorbed N is
1
converted to urinary urea N. Increasing the efficiency of N utilization for milk
production would not only decrease urea production and degradation but could also
increase the nutritional and economic value of the milk by increasing milk protein
and fat yields.
The purpose of this study was to determine whether lowering metabolizable
rumen undegradable protein (M-RUP) would lead to increased N efficiency, and to
determine if supplementation of metabolizable Lys and Met in the proper ratio would
lead to increased milk yield or component production.
2
Literature Review
Lysine and Met are generally considered to be the two most limiting amino
acids for dairy cattle. Schwab et al., (1992), infused Holstein cows with Met, Lys,
and a combination of Met and Lys to determine which was the first limiting amino
acid during early and mid-lactation. In early lactation, Lys was the most limiting
amino acid and Met was the second-limiting amino acid for milk protein synthesis.
However, during mid-lactation it was not clear whether Lys was first limiting or
whether Lys and Met were co-limiting.
Rumen undegradable protein has the ability to supply specific amino acids
directly to the intestine of the animal. Feeding properly balanced M-RUP sources
has the potential to increase the efficiency with which amino acids are utilized. The
following studies have looked more closely at the effects of different levels of RUP
on N efficiencies and milk and component production. Wright et al. (1998) fed RUP
supplements from animal products at 4.5, 14. 9, and 29.1 o/o of dry matter intake and
found that urinary N and fecal N outputs increased at higher levels of RUP and
found that overall N efficiency (N utilization for milk) decreased. The higher RUP
levels did increase milk yield, milk true protein production, and lactose production
but decreased milk fat production. Cunningham et al. (1996) looked at different
levels of dietary RUP from soybean products. Their results agreed with the findings
of Wright et al. (1998) that increased levels of RUP increased milk yield and milk
true protein production. However, contrary to the observation of Wright et al. (1998),
Cunningham et al. (1996) saw an increase in milk fat production at higher RUP
levels. These conflicting results could be due to different amino acid profiles found
3
in the RUP sources. Research has shown that the relative concentration of dietary
amino acids may have a greater impact on milk components and N efficiency than
dietary CP levels. Bach et al. (2000) fed diets containing 18 and 15% CP in
combination with high and low essential amino acid profiles. The high amino acid
profile was comparable to that found in casein. They observed that the amino acid
profile had a greater effect on milk, protein, and fat production than did concentration
of CP. They also found that an improvement inN efficiency was associated with a
higher amino acid profile.
Many studies have looked at the effects of feeding supplemental rumen
protected Lys and Met on milk and component yields. However, the results from
these studies have been variable, possibly due to ration ingredients rather than
protein or amino acid level. Several studies (Donkin et al., 1989; Colin-Schoellen et
al., 1995; Piepenbrink et at., 1996; Nichols et at., 1998) have shown no affect of
supplemental rumen protected Lys and Met on milk yield with corn-based diets.
Bateman et al. (1999) also reported no affect of supplemental rumen protected Lys
and Met on milk yield. In this study, the basal diets were balanced for 15.5% CP.
Supplemental CP was then added in the form of soybean meal, urea, or a mixture of
fish and blood meal to bring the CP level up to 18% of diet OM. Results indicate
that, at high CP levels, Lys and Met requirements were being met and additional Lys
or Met has no beneficial impact on production.
Other studies have shown an increase in milk yield due to Lys and Met
supplementation. Robinson et at. (1995) found that supplementation increased milk
yield. The basal diet used in the study was balanced to meet CP requirements.
4
Thus, either the Lys and Met were still limiting even though the CP requirement was
met or else Lys and Met can enhance milk yield when fed above requirement levels.
Xu et al. (1998) showed that very high levels of Lys and Met can have a bene·ficial
effect on milk yield. They added 40 g/d of Lys and 13 g/d of Met to a ration already
balanced for 112 and 103% of required metabolizable Lys and Met, respectively,
found a significant increase in milk yield from the Met and Lys supplementation. This
supports that theory that Lys and Met may have an effect on milk yield when fed
above their calculated requirements.
Results on the effect of RUP Lys and Met supplementation on milk fat
percentage and yield are variable. Several studies (Colin-Schoellen et al., 1995;
Robinson et al., 1995; Xu et al., 1998) showed an increase in milk fat percentage
when additional RUP Lys and Met were fed. However, these studies did not look at
which amino acid, Lys or Met, was responsible for the increase in fat percentage.
When RUP Met was the only supplemental amino acid fed, Overton et al. (1996)
showed a significant increase in milk fat yield and percent. When Met was
calculated as being the sixth limiting amino acid, Robinson et al. (1998) reported a
numerical increase in milk fat production from supplemental RUP Met. This
indicates the Met can increase milk fat even when it is not calculated as being
limiting. It is unclear why Met supplementation increases fat content in these
conditions, but it could be due to its potential involvement in de novo fat synthesis or
its ability to donate a methyl group for choline synthesis (National Research Council,
2001 ). There are still other studies in which the addition of RUP Lys and Met had no
5
affect on milk fat yield or milk fat percentage (Donkin et al., 1989; Armentano et al.,
1993; Bateman et al., 1999).
The effects of additional RUP Lys and Met on milk protein content are more
consistent with several studies (Donkin et al., 1989; Armentano et al., 1997; Colin
Schoellen et al., 1995; Robinson et al., 1995; Piepenbrink et al., 1996; Xu et al.,
1998) showing an increase in milk protein production and percentage when
supplemental Lys and Met were fed. Xu et al. (1998) showed a 0.24 kg/d increase
in protein yield from a high RUP Lys and Met diet over a negative control during the
first eight weeks of the experiment. The increase in milk protein is economically
important because true milk protein (mostly casein) is now factored in the price paid
to dairy producers for their milk. Armentano et al. (1993) showed that feeding rumen
protected Lys (16.6 g/d) and Met (5.6 g/d) would increase cheese yield by
300g/100kg of milk, which is a 3.5% increase in cheese yield.
Increasing milk fat, protein, and yield are not the only reasons for feeding M
RUP Lys and Met. The other reason is to increase N efficiency (i.e., conversion of N
intake into milk N) by lactating cows to reduce N waste being excreted into the
environment. However, it is possible for excessive M-RUP Lys and Met to be fed,
leading to an inefficient use of N by the animal. Wright et al. (1998) found that
urinary and fecal N excretion increased linearly with RUP supplementation. They
found that 50% of N intake was converted to urinary N when cows were fed high
RUP diets and that. as RUP increased, N utilization for milk N decreased. Wu and
Satter (2000) agreed with Wright et al. (1998) that lower concentrations of RUP in
the diet increased the efficiency with which the animal utilized N, where N efficiency
6
is defined as the percentage of feed or absorbed N converted to milk N. However,
high RUP levels will not always lead to decreased N efficiency. If the RUP supplies
an EAA profile more in line with the animal requirements, then theN (protein)
supplied by the RUP source can be used more efficiently.
7
Materials and Methods
Cows and Design
Forty multiparous and 22 primiparous Holsteins cows were used in a 2x2
factorial arrangement of treatments. Cows were randomly assigned to continuous
12-week treatments based on calving dates. Assignment to treatments was made
14 to 21 days postpartum. The week ptior to assignment to treatment served as the
covariate adjustment period during which measurements were taken for milk yield
and composition, and body weight. Once half of the cows were assigned to
treatments animals were assigned based on the average milk weights from the
covariate period. This assLtred that the starting average milk weights across all four
treatments were reasonably balanced. All cows were housed in tie stalls bedded
twice daily with sawdust and had 'free access to water. Bovine somatotropin was
administered beginning at 63 days postpartum for all cows.
Diets
Prior to freshening, all cows were fed a standard pre-fresh diet with the
addition of a premix containing 5.5 g/d of rumen protected Met with soybean meal
serving as the canier. The post-fresh cows were fed twice daily ad libitum as a
group until they were assigned to treatment. The post-fresh diet served as the
covariate adjustment diet. It was balanced using the NRC (2001) ration balancing
program for 1350 lbs. of body weight, 80.0 lbs.lday of milk, 3.6% fat, and 2.9% milk
true protein. The post-fresh diet consisted of 30% com silage, 20% alfalfa hay, 4%
whole cottonseed, 44.2% of a pelleted concentrate, and 0.8% of a premix containing
supplemental metabolizable Met and Lys on a DM basis. The supplemental
8
metabolizable Lys was from porcine blood meal and Smartamine M-L ® (Aventis
Animal Nutrition, Alpharetta, GA), which contains 40% Lys and 15% Met. The
supplemental metabolizable Met was from Smartamine M-L ®and Smartamine M®
(Aventis Animal Nutrition, Alpharetta, GA), which contains 75% Met. According to
the manufacturer both Smartamine® products are estimated to be 90% rumen
undegradable. The post-fresh diet was designed to exceed metabolizable Lys and
Met requirements to ensure that experimental treatment would not be initiated with
animals coming out of severe amino acid deficiencies.
Treatment diets were arranged in a 2x2 factorial arrangement of 100% (LoM
RUP) or 110% (HiM-RUP) of the requirements stated by the NRC (2001), and (2)
metabolizable Met and Lys supplementation at control levels (Lys at 6.15% of
metabolizable protein (MP) and Met at 1.81% of MP) (LoAA): supplementation at
108% and 120% (HiAA) of control levels for metabolizable Lys and Met,
respectively. Diets were balanced using the NRC (2001) ration balancing program
for 1350 lbs. of body weight, 100 lbs./day of milk, 3.6% fat, and 3.9% milk true
protein. Diets were fed twice daily at ad libitum intake. Daily feed intakes were
recorded; feed offered was adjusted daily to allow for approximately 10% refusal.
Dry matter of the diets was formulated to contain 30% com silage, 15% alfalfa hay,
4% whole cottonseed, 49.2% of a pelleted concentrate, and 0.8% of a soybean meal
premix containing the Met supplement or a placebo. The two unsupplemented diets
were formulated to contain metabolizable Lys at 6.15% of MP, and metabolizable
Met at 1.85% of MP. The two supplemented diets were balanced for Lys at 6.65%
9
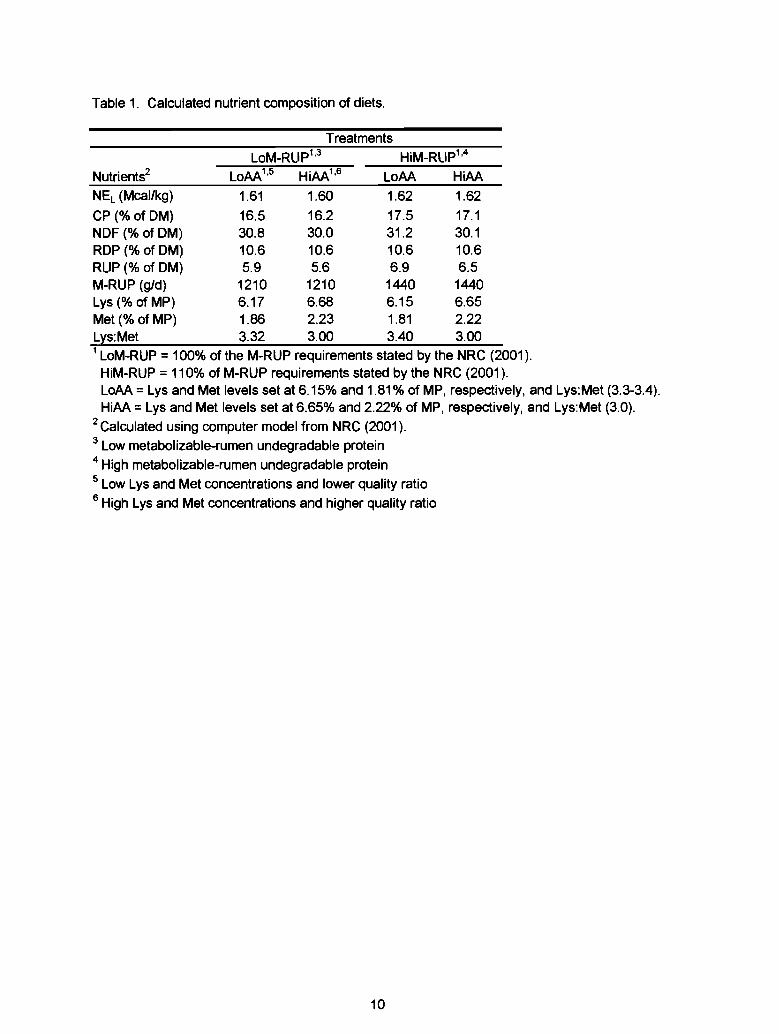
Table 1. Calculated nutrient composition of diets.
Treatments LoM-RUP1
•3 HiM-RUP1
'4
Nutrients2 LoAA1•5 HiAA1
'6 LoAA HiAA
NEL (Meal/kg) 1.61 1.60 1.62 1.62
CP(%ofOM) 16.5 16.2 17.5 17.1 NOF (% of OM) 30.8 30.0 31.2 30.1 ROP (%of OM) 10.6 10.6 10.6 10.6 RUP (%of OM) 5.9 5.6 6.9 6.5 M-RUP (g/d) 1210 1210 1440 1440 Lys (%of MP) 6.17 6.68 6.15 6.65 Met(% of MP) 1.86 2.23 1.81 2.22 Lys:Met 3.32 3.00 3.40 3.00 1 LoM-RUP = 100% of the M-RUP requirements stated by the NRC (2001 ).
HiM-RUP = 11 0% of M-RUP requirements stated by the NRC (2001 ). LoAA = Lys and Met levels set at 6.15% and 1.81% of MP, respectively, and Lys:Met (3.3-3.4). HiAA = Lys and Met levels set at 6.65% and 2.22% of MP, respectively, and Lys:Met (3.0).
2 Calculated using computer model from NRC (2001 ). 3 Low metabolizable-rumen undegradable protein 4 High metabolizable-rumen undegradable protein 5 Low Lys and Met concentrations and lower quality ratio 6 High Lys and Met concentrations and higher quality ratio
10
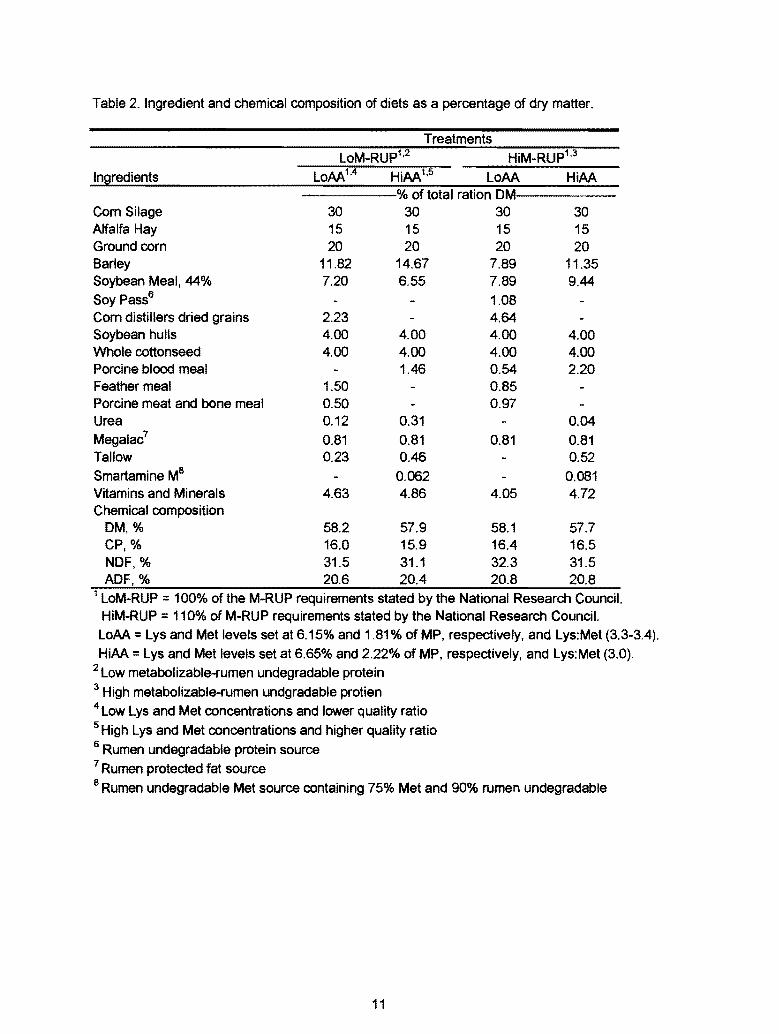
Table 2. Ingredient and chemical composition of diets as a percentage of dry matter.
Treatments
Ingredients
Com Silage Alfalfa Hay Ground corn Barley Soybean Meal, 44% Soy Pass6
Com distillers dried grains Soybean hulls Whole cottonseed Porcine blood meal Feather meal Porcine meat and bone meal Urea Megalac7
Tallow Smartamine M8
Vitamins and Minerals Chemical composition
LoM-RUP1•2 HiM-RUP1
·3
LoAA HiAA % of total ration DM
30 15 20
11.82 7.20
2.23 4.00 4.00
1.50 0.50 0.12 0.81 0.23
4.63
30 15 20
14.67 6.55
4.00 4.00 1.46
0.31 0.81 0.46
0.062 4.86
30 15 20
7.89 7.89 1.08 4.64 4.00 4.00 0.54 0.85 0.97
0.81
4.05
30 15 20
11.35 9.44
4.00 4.00 2.20
0.04 0.81 0.52
0.081 4.72
DM, % 58.2 57.9 58.1 57.7 CP,% 16.0 15.9 16.4 16.5 NDF,% 31.5 31.1 32.3 31.5 ADF,% 20.6 20.4 20.8 20.8
1 LoM-RUP = 100% of the M-RUP requirements stated by the National Research Council. HiM-RUP = 110°k of M-RUP requirements stated by the National Research Council. LoAA = Lys and Met levels set at 6.15% and 1.81% of MP, respectively, and Lys:Met (3.3-3.4). HiAA = Lys and Met levels set at 6.65% and 2.22% of MP, respectively, and Lys:Met (3.0).
2 Low metabolizable-rumen undegradable protein 3 High metabolizable-rumen undgradable protien 4 Low Lys and Met concentrations and lower quality ratio 5 High Lys and Met concentrations and higher quality ratio 6 Rumen undegradable protein source 7 Rumen protected fat source 8 Rumen undegradable Met source containing 75% Met and 90% rumen undegradable
11
of MP, and Met at 2.25% of MP (Table 1). The supplemental metabolizable Lys was
from porcine blood meal, whereas the supplemented metabolizable Met was from
Smartamine M®. Rumen degradable protein, ether extract, and neutral detergent
fiber (NDF) were kept the same across treatments at 1 0.6%, 4.6%, and 30% of OM,
respectively. Diet composition is reported in Table 2.
Data Collection
Cows were milked twice daily at 0500h and 1800h. Milk production and
composition data were collected starting with the covariate week and continued
through the entire 12 weeks of the trial. Milk production was recorded for all mil kings
and was averaged weekly. Milk samples were taken weekly for four consecutive
milkings and analyzed for fat, true protein, somatic cell count, lactose, and milk urea
nitrogen (MUN) by Ohio DHIInc., (Powell, OH).
Total mixed rations were sampled daily and composited weekly. Feed
analyses for dry matter (OM), CP, NDF, and acid detergent fiber (ADF) were done
on the weekly composites as well as weekly samples of the com silage and alfalfa
hay. Concentrates and whole cottonseed were sampled monthly and analyzed for
OM, CP, NDF, and ADF by Dairy One Inc., (Ithaca, NY). Premixes were also
sampled monthly and analyzed for Met inclusion rate and Met protection by Aventis
Animal Nutrition, (Alpharetta, GA).
Body weights and body condition scores were determined weekly. Body
condition scores were assessed on a five-point scale, with 1 being thin and 5 being
very overconditioned animals (Wildmand et al., 1982). Body condition scores were
determined independently by two individuals.
12
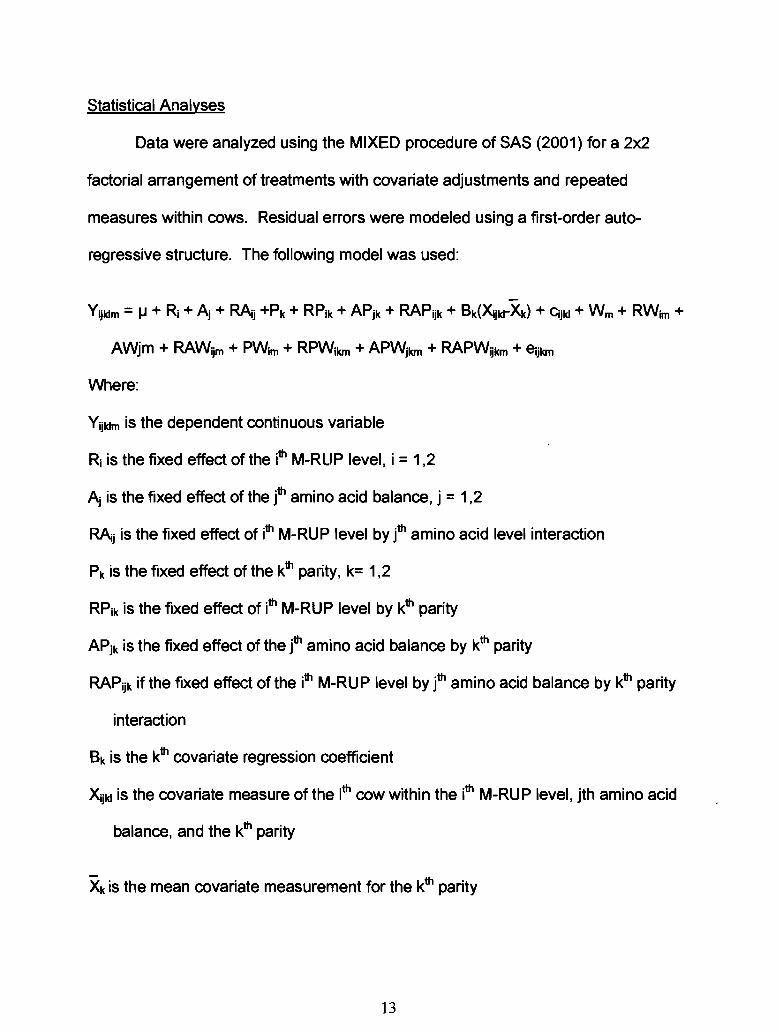
Statistical Analyses
Data were analyzed using the MIXED procedure of SAS (2001) for a 2x2
factorial arrangement of treatments with covariate adjustments and repeated
measures within cows. Residual errors were modeled using a first-order auto
regressive structure. The following model was used:
Yijklm = 1J + R; + Aj + RAj +Pk + RP;k + APjk + RAP;jk + Bk(~jkl-~) + C;jkl + Wm + RWim +
AWjm + RAWijm + PW;m + RPW;km + APWjkm + RAPWijkm + e;jkm
Where:
Y;jklm is the dependent continuous variable
R; is the fixed effect of the ith M-RLIP level, i = 1,2
Aj is the fixed effect of the r amino acid balance, j = 1 ,2
RAj is the fixed effect of ith M-RLIP level by jth amino acid level interaction
Pk is the fixed effect of the kth pa1ity, k= 1,2
RP;k is the fixed effect of ith M-RUP level by kth parity
APjk is the fixed effect of the jth amino acid balance by kth parity
RAP;jk if the fixed effect of the ith M-RUP level by jth amino acid balance by kth parity
interaction
Bk is the kth covariate regression coefficient
X;jkl is the covariate measure of the lth cow within the ith M-RUP level, jth amino acid
balance, and the kth parity
~is the mean covariate measurement for the kth parity
13
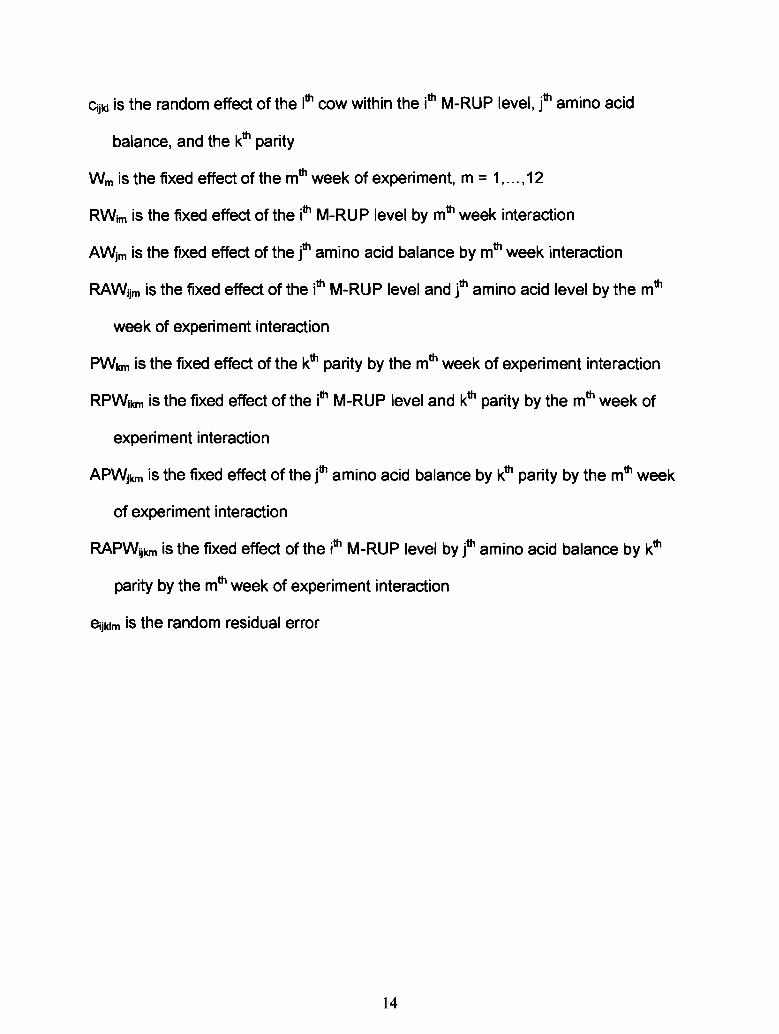
Ciikl is the random effect of the ltn cow within the itn M-RUP level, jtn amino acid
balance, and the ktn parity
Wm is the fixed effect of the mtn week of experiment, m = 1, 0 0 0,12
RWim is the fixed effect of the itn M-RUP level by mtn week interaction
AWim is the fixed effect of the r amino acid balance by mtn week interaction
RAWiim is the fixed effect of the itn M-RUP level and jtn amino acid level by the mtn
week of experiment interaction
PW~un is the fixed effect of the ktn parity by the mtn week of experiment interaction
RPWikm is the fixed effect of the itn M-RUP level and ktn parity by the mtn week of
experiment interaction
APWikm is the fixed effect of the r amino acid balance by ktn parity by the mtn week
of experiment interaction
RAPWiikm is the fixed effect of the itn M-RUP level by r amino acid balance by ktn
parity by the mtn week of experiment interaction
eiiklm is the random residual error
14
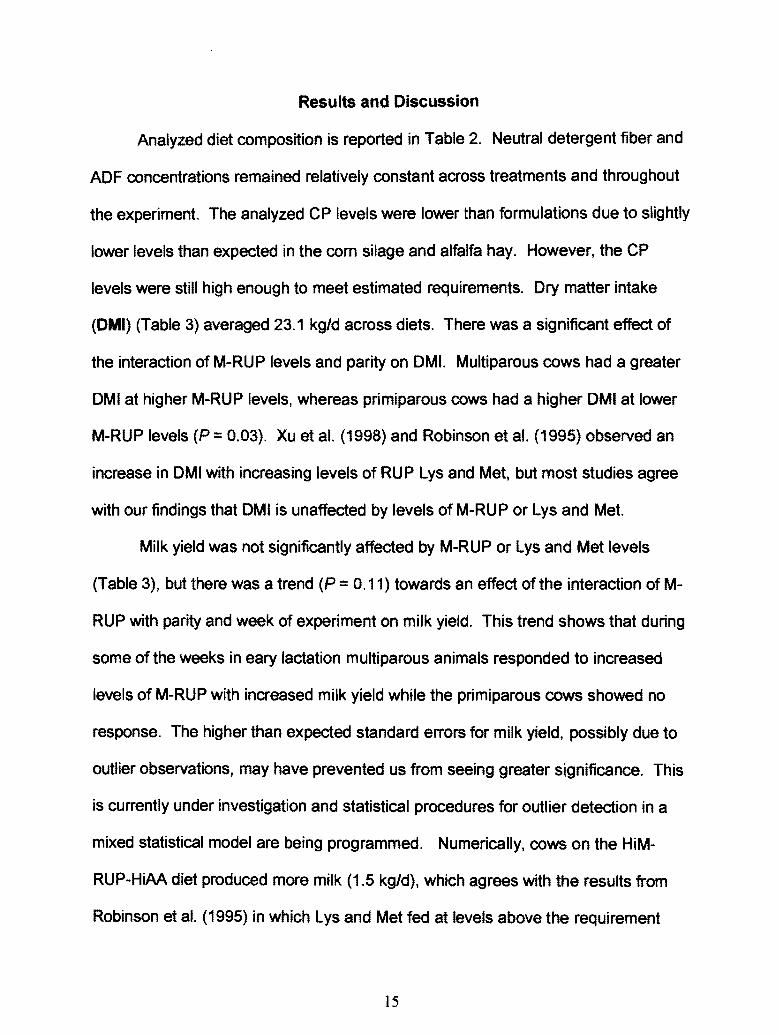
Results and Discussion
Analyzed diet composition is reported in Table 2. Neutral detergent fiber and
ADF concentrations remained relatively constant across treatments and throughout
the experiment. The analyzed CP levels were lower than formulations due to slightly
lower levels than expected in the com silage and alfalfa hay. However, the CP
levels were still high enough to meet estimated requirements. Dry matter intake
(DMI) (Table 3) averaged 23.1 kg/d across diets. There was a significant effect of
the interaction of M-RUP levels and parity on DMI. Multiparous cows had a greater
DMI at higher M-RUP levels, whereas primiparous cows had a higher DMI at lower
M-RUP levels (P = 0.03). Xu et al. (1998) and Robinson et al. (1995) observed an
increase in DMI with increasing levels of RUP Lys and Met, but most studies agree
with our findings that DMI is unaffected by levels of M-RUP or Lys and Met.
Milk yield was not significantly affected by M-RUP or Lys and Met levels
(Table 3), but there was a trend (P = 0.11) towards an effect ofthe interaction of M
RUP with parity and week of experiment on milk yield. This trend shows that during
some of the weeks in eary lactation multiparous animals responded to increased
levels of M-RUP with increased milk yield while the primiparous cows showed no
response. The higher than expected standard errors for milk yield, possibly due to
outlier observations, may have prevented us from seeing greater significance. This
is currently under investigation and statistical procedures for outlier detection in a
mixed statistical model are being programmed. Numerically, cows on the HiM
RUP-HiAA diet produced more milk (1.5 kg/d), which agrees with the results from
Robinson et al. (1995) in which Lys and Met fed at levels above the requirement
15
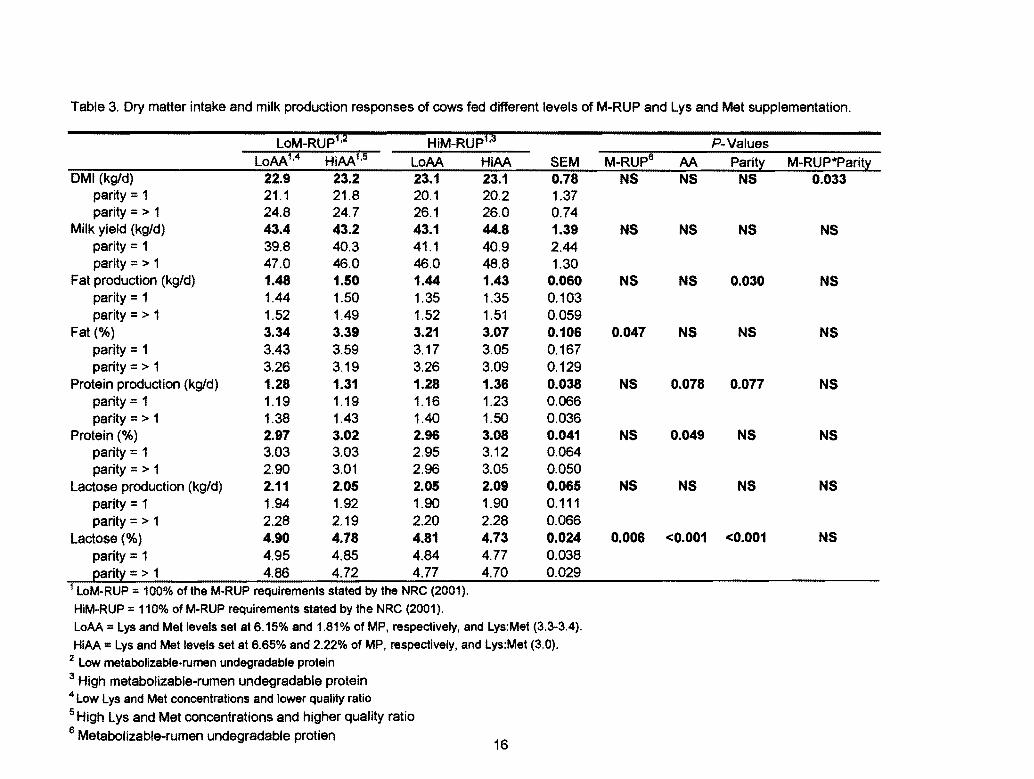
Table 3. Dry matter intake and milk production responses of cows fed different levels of M-RUP and Lys and Met supplementation.
LoM-RUP1 ·~ HiM-RUPU P-Values LoAA1
'4 HiAA1
'5 LoAA HiAA SEM M-RUP6 AA Parit~ M-RUP*Parit~
DMI (kg/d) 22.9 23.2 23.1 23.1 0.78 NS NS NS 0.033 parity= 1 21.1 21.8 20.1 20.2 1.37 parity=> 1 24.8 24.7 26.1 26.0 0.74
Milk yield (kg/d) 43.4 43.2 43.1 44.8 1.39 NS NS NS NS parity= 1 39.8 40.3 41.1 40.9 2.44 parity=> 1 47.0 46.0 46.0 48.8 1.30
Fat production (kg/d) 1.48 1.50 1.44 1.43 0.060 NS NS 0.030 NS parity= 1 1.44 1.50 1.35 1.35 0.103 parity=> 1 1.52 1.49 1.52 1.51 0.059
Fat (0A>) 3.34 3.39 3.21 3.07 0.106 0.047 NS NS NS parity= 1 3.43 3.59 3.17 3.05 0.167 parity=> 1 3.26 3.19 3.26 3.09 0.129
Protein production (kg/d) 1.28 1.31 1.28 1.36 0.038 NS 0.078 0.077 NS parity= 1 1.19 1.19 1.16 1.23 0.066 parity=> 1 1.38 1.43 1.40 1.50 0.036
Protein(%) 2.97 3.02 2.96 3.08 0.041 NS 0.049 NS NS parity= 1 3.03 3.03 2.95 3.12 0.064 parity=> 1 2.90 3.01 2.96 3.05 0.050
Lactose production (kg/d) 2.11 2.05 2.05 2.09 0.065 NS NS NS NS parity= 1 1.94 1.92 1.90 1.90 0.111 parity=> 1 2.28 2.19 2.20 2.28 0.066
Lactose(%) 4.90 4.78 4.81 4.73 0.024 0.006 <0.001 <0.001 NS parity= 1 4.95 4.85 4.84 4.77 0.038
~arit~ = > 1 4.86 4.72 4.77 4.70 0.029 1 LoM-RUP = 100% of the M-RUP requirements stated by the NRC (2001).
HiM-RUP = 110% of M-RUP requirements stated by the NRC (2001).
LoAA = Lys and Met levels set at 6.15% and 1.81% of MP, respectively, and Lys:Met (3.3-3.4).
HiAA = Lys and Met levels set at 6.65% and 2.22% of MP, respectively, and Lys:Met (3.0). 2 Low metabolizable-rumen undegradable protein 3 High metabolizable-rumen undegradable protein 4 Low Lys and Met concentrations and lower quality ratio 5 High Lys and Met concentrations and higher quality ratio 6 Metabolizable-rumen undegradable protien
16
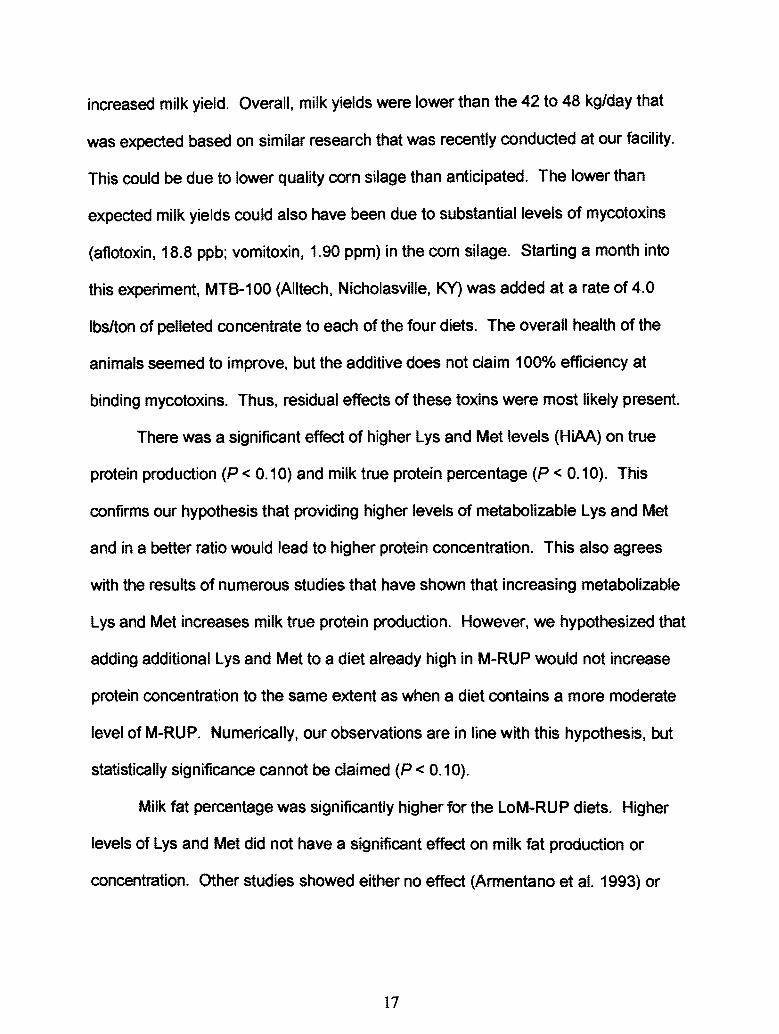
increased milk yield. Overall, milk yields were lower than the 42 to 48 kg/day that
was expected based on similar research that was recently conducted at our facility.
This could be due to lower quality corn silage than anticipated. The lower than
expected milk yields could also have been due to substantial levels of mycotoxins
(atlotoxin, 18.8 ppb; vomitoxin, 1.90 ppm) in the corn silage. Starting a month into
this experiment, MTB-100 (AIItech, Nicholasville, KY) was added at a rate of 4.0
lbs/ton of pelleted concentrate to each of the four diets. The overall health of the
animals seemed to improve, but the additive does not claim 1 00% efficiency at
binding mycotoxins. Thus, residual effects of these toxins were most likely present.
There was a significant effect of higher Lys and Met levels (HiAA) on true
protein production (P < 0.1 0) and milk true protein percentage (P < 0.1 0). This
confirms our hypothesis that providing higher levels of metabolizable Lys and Met
and in a better ratio would lead to higher protein concentration. This also agrees
with the results of numerous studies that have shown that increasing metabolizable
Lys and Met increases milk true protein production. However, we hypothesized that
adding additional Lys and Met to a diet already high in M-RUP would not increase
protein concentration to the same extent as when a diet contains a more moderate
level of M-RUP. Numerically, our observations are in line with this hypothesis, but
statistically significance cannot be claimed (P < 0.1 0).
Milk fat percentage was significantly higher for the LoM-RUP diets. Higher
levels of Lys and Met did not have a significant effect on milk fat production or
concentration. Other studies showed either no effect (Armentano et at. 1993) or
17
increased milk fat content from higher levels of Met in diets (Overton et al., 1996;
Robinson et al., 1998).
The percent lactose was increased by the LoM-RUP-LoAA diet over the other
three. Lactose is one of primary osmotic regulator in the mammary gland. Thus, it
is uncommon to see a significant effect of dietary treatments on lactose
concentration of milk. This effect on lactose concentration, like the effect on fat, may
be due to differences in milk production for animals on the LoM-RUP diets.
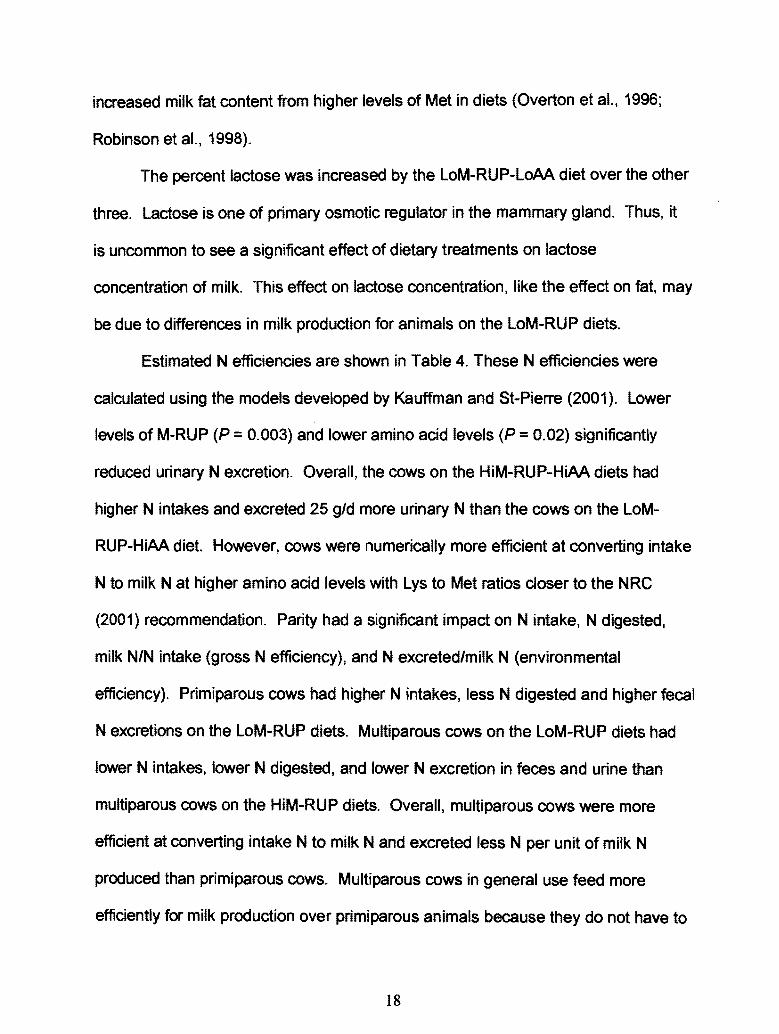
Estimated N efficiencies are shown in Table 4. These N efficiencies were
calculated using the models developed by Kauffman and St-Pierre (2001 ). Lower
levels of M-RUP (P = 0.003) and lower amino acid levels (P = 0.02) significantly
reduced urinary N excretion. Overall, the cows on the HiM-RUP-HiAA diets had
higher N intakes and excreted 25 g/d more urinary N than the cows on the LoM
RUP-HiAA diet. However, cows were numerically more efficient at converting intake
N to milk N at higher amino acid levels with Lys to Met ratios closer to the NRC
(2001) recommendation. Parity had a significant impact on N intake, N digested,
milk N/N intake (gross N efficiency), and N excreted/milk N (environmental
efficiency). Primiparous cows had higher N intakes, less N digested and higher fecal
N excretions on the LoM-RUP diets. Multiparous cows on the LoM-RUP diets had
lower N intakes, lower N digested, and lower N excretion in feces and urine than
multiparous cows on the HiM-RUP diets. Overall, multiparous cows were more
efficient at converting intake N to milk N and excreted less N per unit of milk N
produced than primiparous cows. Multiparous cows in general use feed more
efficiently for milk production over primiparous animals because they do not have to
18
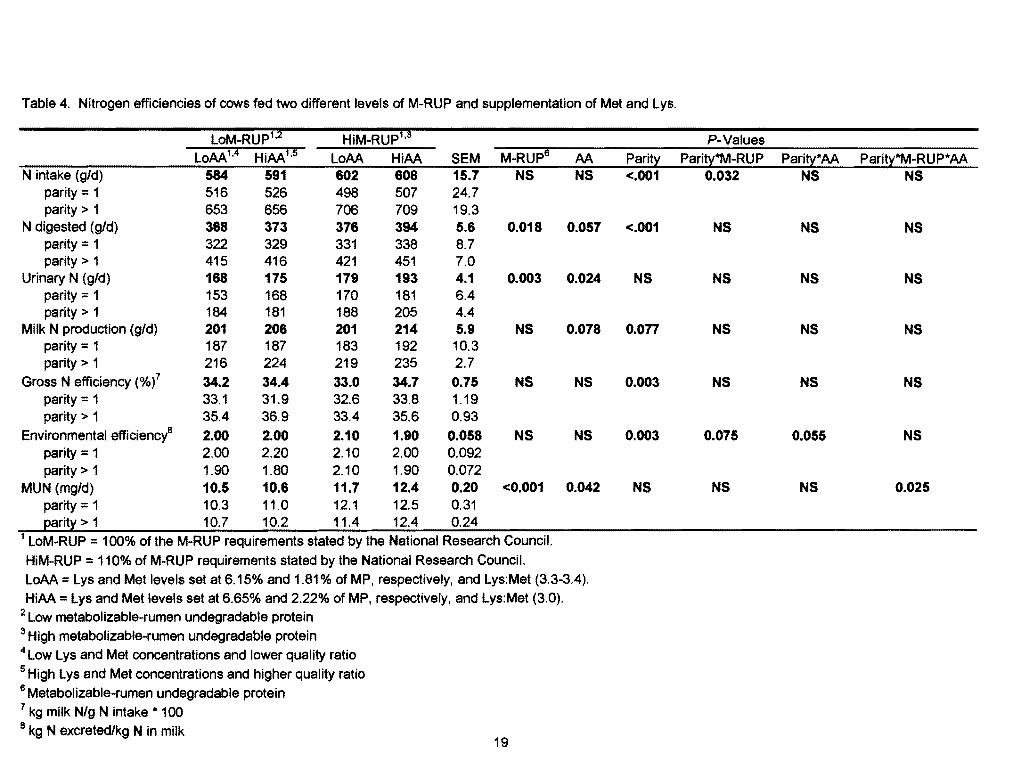
Table 4. Nitrogen efficiencies of cows fed two different levels of M-RUP and supplementation of Met and lys.
loM-RUP1•2 HiM-RUP1
•3
loAA1•4 HiAA1
•5 loAA HiAA SEM M-RUP6 AA
N intake (g/d) 584 591 602 608 15.7 NS NS parity= 1 516 526 498 507 24.7 parity > 1 653 656 706 709 19.3
N digested (g/d) 388 373 378 394 5.8 0.018 0.057 parity= 1 322 329 331 338 8.7 parity> 1 415 416 421 451 7.0
Urinary N (g/d) 188 175 179 193 4.1 0.003 0.024 parity= 1 153 168 170 181 6.4 parity> 1 184 181 188 205 4.4
Milk N production (g/d) 201 208 201 214 5.9 NS 0.078 parity= 1 187 187 183 192 10.3 parity> 1 216 224 219 235 2.7
Gross N efficiency (%)7 34.2 34.4 33.0 34.7 0.75 NS NS parity= 1 33.1 31.9 32.6 33.8 1.19 parity> 1 35.4 36.9 33.4 35.6 0.93
Environmental efficiency8 2.00 2.00 2.10 1.90 0.058 NS NS parity= 1 2.00 2.20 2.10 2.00 0.092 parity>1 1.90 1.80 2.10 1.90 0.072
MUN (mg/d) 10.5 10.6 11.7 12.4 0.20 <0.001 0.042 parity=1 10.3 11.0 12.1 12.5 0.31 parity> 1 10.7 10.2 11.4 12.4 0.24
1 LoM-RUP = 100% of the M-RUP requirements stated by the National Research Council. HiM-RUP = 110% of M-RUP requirements stated by the National Research Council. loAA = lys and Met levels set at 6.15% and 1.81% of MP, respectively, and lys:Met (3.3-3.4 ). HiAA = lys and Met levels set at 6.65% and 2.22% of MP, respectively, and lys:Met (3.0).
2 Low metabolizable-rumen undegradable protein 3 High metabolizable-rumen undegradable protein 4 low lys and Met concentrations and lower quality ratio 5 High lys and Met concentrations and higher quality ratio 6 Metabolizable-rumen undegradable protein 7 kg milk N/g N intake * 100 8 kg N excreted/kg N in milk
19
P-Values Parity EC3rity*M-RUE Parity*AA Parity*M-RUP*AA <.001 0.032 NS NS
<.001 NS NS NS
NS NS NS NS
0.077 NS NS NS
0.003 NS NS NS
0.003 0.075 0.055 NS
NS NS NS 0.025
divert nutrients from milk production to growth. Based on previous studies (Wright et
al., ·1998;Wu and Satter, 2000), we expected that the animals on the LoM-RUP-HiAA
diet would have been the most efficient because the diet contained sufficient
metabolizable protein to meet the calculated requirement but had additional
metabolizable Lys and Met in the proper ratio to enhance milk protein secretion.
The significantly lower MUN concentrations for the LoM-RUP diets do indicate that
the N was used more efficiently than in the HiM-RUP diets.
Dietary treatments had a significant interaction effect with parity on body
weight and body condition score. Primiparous cows on the LoM-RUP-LoAA diet
showed a significantly greater rate of increase in body condition score during the first
twelve weeks of the experiment (y = 0.03x + 3.2 . .-2 = 0.81, P <0.001 ). Multiparous
cow were unaffected by treatments. There was also a significant effect of M-RUP
levels on body weight. Animals on the LoM-RUP diets averaged 633 kg while
animals on the HiM-RUP diets averaged 618 kg. Again, this may indicate that the
LoM-RUP diets led to slightly lower milk production, especially in primiparous cows,
allowing more energy to go into growth and fat deposition. However, without doing
more analyses to determine energy balance it is hard to know exactly what is
causing this effect.
20
Conclusions
Supplemental metabolizable Lys and Met provided in the proper profile
significantly increased milk true protein production, daily amounts of N digested, and
urinary N excretion. Decreasing the M-RUP levels in the diet decreased urinary N
excretion and increased milk fat content. M-RUP levels had no effect on milk yield
or milk components except for milk fat percentage, which indicates that the M-RUP
levels recommended by the NRC (2001) may not be predicting M-RUP requirements
accurately. However, supplementation with metabolizable Lys and Met led to a
signi·ficant increase in protein concentration in the diet, which supports the NRC
(2001) recommendations. This study supports many of the findings of previous
research, but there is still a lot of variability of the effects of M-RUP and
metabolizable Lys and Met levels on N efficiency and milk production parameters.
More research is needed in this area to determine more precisely optimum M-RUP,
Lys, and Met levels needed to maximize milk yield and component production
without causing detrimental effects on the environment.
21
Definition of Terms
Body condition score- A measurement of the subcutaneous body fat in the cow.
Degradation- The breaking down of material in the rumen by the rumen microbes.
Essential amino acids- Amino acids which can not be made by the body or can not be made in sufficient quantities to meet the animals needs.
Freshening- Calving
Metabolizable protein- Protein that is able to be absorbed by the intestine.
Multiparous- Cows that are in their second or higher lactation.
Mycotoxins- Toxins produced by fungi that can grow in forage sources.
Primiparous- Cows that are in their first lactation.
Neutral detergent fiber- Laboratory analysis that measure the hemicellulose, cellulose, and lignin content of feed.
Rumen undegradable protein- Protein that can bypass the rumen relatively unchanged.
22
Literature Cited
1. Arrnentano, L. E., S. J. Bertics, and G. A Ducharme. 1997. Response of lactating cows to methionine or methionine plus lysine added to high protein diets based on alfalfa and heated soybeans. J. Dairy Sci. 80: 1194-1199.
2. Armentano, L. E., S.M. Swain, and G. A Ducharme. 1993. Lactation response to ruminally protected methionine and lysine at two amounts of ruminally available nitrogen. J. Dairy Sci. 76:2963-2969.
3. Bach, A, G. B. Huntington, S. Calsamiglia, and M.D. Stern. 2000. Nitrogen metabolism of early lactation cows fed diets with two different levels of protein and different amino acid profiles. J. Dairy Sci. 83:2585-2595.
4. Bateman, H. G., J. N. Spain, M.S. Kerley, R. L. Belyea, and R. T. Marshall. 1999. Evaluation of ruminally protected methionine and lysine or blood meal and fish meal as protein sources for lactating Holsteins. J. Dairy. Sci. 82: 2115-2120.
5. Colin-Schoellen, 0. F. Laurent, B. Vignon, J. C. Robert, and B. Sloan. 1995. Interaction of ruminally protected methionine and lysine with protein source or energy level in the diets of cows. J. Dairy Sci. 78:2807-2818.
6. Cunningham, K. D., M. J. Cecava, T. R. Johnson, and P. A. Ludden. 1996. Influence of source and amount of dietary protein on milk yield by cows in early lactation. J. Dairy Sci. 79:620-630.
7. Donkin, S. S., G. A Varga, T. F. Sweeney, and L. D. Muller. 1989. Rumenprotected methionine and lysine: effects on animal performance, milk protein yield, and physiological measures. J. Dairy Sci. 72:1484-1491.
8. Kauffman, A J. and N. R. St-Pierre. 2001. The relationship of milk urea nitrogen excretion in Holstein and Jersey cows. J. Dairy Sci. 84:(accepted).
9. Meisinger, J. J., and W. E. Jokela. 2000. Ammonia losses from manure. Page 109-115. Cornell Nutr. Conf., Ithaca, NY.
10. National Research Council. 2001. Nutritional requirements of dairy cattle. 7th rev. ed. Natl. Acad. Sci., Washington, DC.
11. Nichols, J. R., D. J. Schingoethe, H. A Maiga, M. J. Brouk, and M. S. Piepenbrink. 1998. Evaluation of com distillers grains and ruinally protected lysine and methionine for lactating dairy cows. J. Dairy Sci. 81:482-491
23
12.0verton, T. R., D. W. LaCount, T. M. Cicela, and J. H. Clark. 1996. Evaluation of Ruminally Protected Methionine Product for Lactating Dairy Cows. J. Dairy Sci. 79:631-638.
13. Piepenbrink, M.S., T. R. Overton, and J. H. Clark. 1996. Response of cows fed a low crude protein diet to ruminally protected methionine and lysine. J. Dairy Sci. 79: 1638-1646.
14. Richardson, C. R., and E. E. Hatfield. 1978. The limiting amino acid in growing cattle. J. Anim. Sci. 46:740-745.
15. Robinson, P. H., W. Chalupa, C. J. Sniffen, W. E. Julien, H. Sato, K. Watanabe, T. Fujieda, and H. Suzuki. 1998. Ruminally Protected Lysine or Lysine and Methionine for lactating Dairy Cows Fed a Ration Designed to Meet Requirements for Microbial and Postruminal Protein. J. Dairy Sci. 81:1364-1373.
16. Robinson, P. H., A H. Fredeen, W. E. Julien, H. Sato, T. Fujieda, and H. Suzuki. 1995. Ruminally protected lysine and methionine for lactating dairy cows fed a diet designed to meet requirements for microbial and postruminal protein. J. Dairy Sci. 78:582-594.
17.SAS/STAT User's Guide, Version 8.1 Edition. 2001. SAS lnst., Inc., Cary, NC.
18.Schwab, C. G., C. K. Bozak, N. L. Whitehouse, and M. M.A. Mesbah. 1992. Amino acid limitation and flow to duodenum at four stages of lactation. 1. sequence of lysine and methionine limitation. J. Dairy Sci. 75:3486-3502.
19. St-Pierre, N. R. and C. S. Thrain. 1999. Animal grouping strategies, sources of variation, and economic factors affecting nutrient balance on dairy farms. J. Dairy Sci. 82(Suppl. 2) 72-83.
20. Wildman, E. E., G. M. Jones, P. E. Wagner, R. L. Boman, H. F. Troutt, and T. N. Lesch. 1982. A dairy cow body condition scoring system and its relationship to selected production characteristics. J. Dairy Sci. 65:495-501.
21. Wright, T. C., S. Moscardini, P. H. Luimes, P. Susmel, and B. W. McBride. 1998. Effects of Rumen-Undegradable Protein and Feed Intake on Nitrogen Balance and Milk Protein Production in Dairy Cows. J. Dairy Sci. 81:784-793.
22. Wu, Z., R. J. Fisher, C. E. Polan, and C. G. Schwab. 1997. Lactational performance of cows fed low or high ruminally undegradable protein prepartum and supplemental methionine and lysine postpartum. J. Dairy Sci. 80:722-729.
24
23. Wu, Z., and L. D. Satter. 2000. Milk Production During the Complete Lactation of Dairy Cows Fed Diets Containing Different Amounts of Protein. J. Dairy Sci. 83:1042-1051.
24.Xu, S., J. H. Harrison, W. Chalupa, C. Sniffen, W. Julien, H. Sato, T. Fujieda, K. Watanabe, T. Ueda, and H. Suzuki. 1998. The Effect of Ruminal Bypass Lysine and Methionine on Milk Yield and Composition of Lactating Cows. J. Dairy Sci. 81:1062-1077.
25