Embed Size (px)
Citation preview
379
In potato production nitrogen determines the quantity and structure of yield, its chemical com-position and tuber quality. On the other hand, it provides an important source of environment pollution with nitrates. The effect of nitrogen fer-tilization on potato yielding is commonly known. Numerous authors investigating this problem think that increase in tuber yield occurs until some determined level of nitrogen fertilization and once this limit is passed, increase in yield is no longer statistically significant or a reduction in yield occurs (Zebarth et al. 2004, Olivier et al. 2006, Jamaati-e-Somarin et al. 2010). Yield incre-ment is the result of increase in the mean tuber weight and the number of set tubers (Galarreta et al. 2006). An average tuber weight is determined by many factors which directly or indirectly affect the value of this feature. Planting density, nitrogen
fertilization, cultivar properties and moisture con-ditions have the greatest direct influence (Zebarth et al. 2006, Lutra et al. 2009, Badr et al. 2012). The number of tubers per plant depends mainly on the number of main stems, which is a cultivar feature highly correlated with seed-potato size. Research of Zebarth et al. (2006) and Jamaati-e-Somarin et al. (2010) indicate that the number of stems is also influenced by the level of nitrogen fertilization. This relationship was not revealed by Zelalem et al. (2009). On the other hand, the above quoted authors are in agreement as to the beneficial effect of nitrogen fertilization on the number of tubers and average tuber weight.
Progressing intensification of production (simpli-fied tillage and crop rotation, reduced organic but intensified mineral fertilization, intensive chemical protection) affect unfavourably soil environment.
Effect of nitrogen fertilization and microbial preparations on potato yielding
M. Kołodziejczyk
Department of Crop Production, University of Agriculture in Krakow, Krakow, Poland
ABSTRACT
The effect of nitrogen fertilization and microbial preparations on yielding and development of potato tuber yield components were assessed in field experiments conducted under soil conditions of Luvic Chernozem. The factors of the experiment were nitrogen fertilization levels: 0, 60, 120 and 180 kg N/ha and the following preparations: Bac-toFil B10, effective microorganisms and UGmax soil fertilizer. Nitrogen fertilization caused a significant increase in marketable yield of potato tubers. Yield increments on individual fertilizer treatments ranged from 66% to 140%. An evident effect of this factor was also visible regarding the yield components values. Increase in the number of main stems per 1 m2 under the influence of growing nitrogen doses occurred from the fertilization level 120 kg N/ha, whereas the number of tubers per 1 stem increased only to the level of 60 kg N/ha. Each nitrogen dose ap-plied within the range to 180 kg N/ha caused a marked increase in an average tuber weight. Conducted investiga-tions demonstrated an unfavourable effect of microbial preparations on the marketable crop yield of tubers and formation of yield components. On the objects where microbial preparations were applied, the marketable yield was lower by 1.5 to 2.3 t/ha than in the control. Analysis of linear regression revealed occurrence of significant dependencies between the total tuber yield and the values of individual yield components. The relationships were the most visible for an average tuber weight formation as evidenced by the value of coefficient of determination (R2 = 0.983).
Keywords: Solanum tuberosum; marketable yield; average weight of tuber; number of tubers per stem; number of stems
Plant Soil Environ. Vol. 60, 2014, No. 8: 379–386
380
Therefore, the idea of the environment protection and ensuring food safety is fast gaining in popular-ity. One of the ways to improve soil properties is application of microbial preparations. However, despite numerous investigations, the results of the effect of these preparations on the quantity and quality of yield and properties of soils are not unanimous (Stewart and Daly 1999, Xu 2001, Priyadi et al. 2005, van Vliet et al. 2006).
The aim of the investigations was an assessment of yielding and formation of yield components of edible potato tubers cultivated under conditions of diversified nitrogen fertilization and application of microbial preparations improving soil properties.
MATERIAL AND METHODS
Experimental design. Field experiments were conducted in 2006–2008 at the Experimental Station of the University of Agriculture in Krakow (50°07'N, 20°05'E) on Luvic Chernozem with granu-lometric composition of ordinary silt. Two-factor field experiment was carried out in a split-block design in 4 replications. The experimental factors were nitrogen fertilization levels; 0, 60, 120 and 180 kg N/ha and microbial preparations improv-ing soil properties: BactoFil B10 (3 L/ha), effective microorganisms (EM) (3 L/ha) and soil fertilizer UGmax (0.9 L/ha) applied to the soil after the pre-vious crop harvesting and before spring tillage. BactoFil B10 contains the following microorgan-isms: Azotobacter vinelandii, Azospirillum lipofer-um, Bacillus megaterium, B. circulans, B. substilis,
Pseudomonas fluorescens, macro/microelements, enzymes, and other active substances. Effective microorganisms preparation contains milk bacteria (Lactobacillus casei, Streptococcus lactis), photo-synthetic bacteria (Rhodopseudomonas palustrus, Rhodobacter space), yeast (Saccharomyces albus, Candida utilis), actinomycetes (Streptomyces albus, S. griseus) and moulds (Aspergillus oryzae, Mucor hiemalis). UGmax soil fertilizer contains yeast, lactic acid bacteria, photosynthetic bacteria, bacteria of Azotobacter, Pseudomonas genii, actinomycetes, macro/micro elements. Further in the paper the fertilizer treatments will be referred to as N0, N60, N120 and N180, whereas microbial preparations as B, EM and UGmax, respectively. Characteristics of the microbial preparations and methodology of the experiment were presented at length in a paper by Kołodziejczyk (2014).
Table 1 presents pluviothermal conditions dur-ing potato vegetation period assessed on the basis of precipitation amount, Sielianinow coefficient and potato water requirement according to Klatt.
Sampling and analyses. Prior to the harvesting the number of main stems was determined for each plot and tuber samples were collected from 10 plants to assess the average tuber weight, number of tubers per stem and shares of individual tuber fractions. The average weight of the tuber was determined by dividing the weight by the number of tubers. The fraction of marketable tubers consisted of tubers with transverse diameters exceeding 35 mm, whereas large tubers had diameters above 50 mm. The amount of marketable tuber yield was esti-mated on the basis of the share of marketable tuber
Table 1. Meteorological conditions during potato vegetation in years 2006–2008
YearMonth Mean/
sumIV V VI VII VIII IXSielianinow’s hydrothermal coefficient*2006 1.30 1.47 1.17 0.41 1.69 0.39 1.022007 0.53 1.20 1.07 1.20 1.92 5.73 1.842008 1.36 0.64 0.47 2.40 0.80 2.89 1.39
Rainfalls (mm)2006 36 (–12) 60 (+17) 62 (+4) 28 (–58) 93 (+31) 18 2972007 15 (–34) 57 (+5) 59 (–2) 72 (–2) 125 (+49) 213 5412008 35 (–10) 28 (–19) 26 (–39) 142 (+39) 45 (–36) 111 387Long-term period 1971–2000 50 74 94 81 76 60 435
*classification by Skowera and Puła (2004): 0.0–0.4 extremely dry; 0.4–0.7 very dry; 0.7–1.0 dry; 1.0–1.3 fairly dry; 1.3–1.6 optimum; 1.6–2.0 fairly wet; 2.0–2.5 wet; 2.5–3.0 very wet; > 3.0 extremely wet; (+) excess and (–) deficit of rainfall compared to the water needs of potato by Klatt
Vol. 60, 2014, No. 8: 379–386 Plant Soil Environ.
381
RESULTS AND DISCUSSION
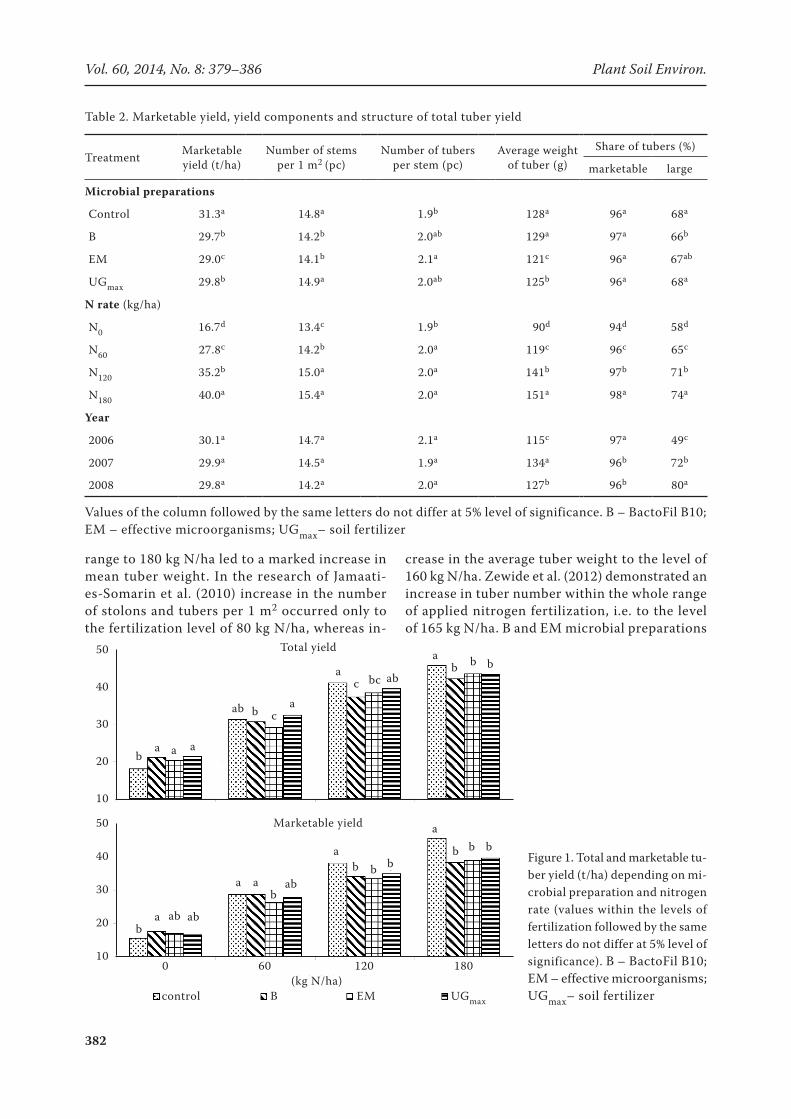
Nitrogen fertilization led to a significant increase in marketable yield of potato tubers (Table 2). Yield increment in the respective fertilizer treatments ranged from 66% to 140%. Each applied nitrogen dose up to 180 kg N/ha caused a marked increase in tuber yield as compared with a smaller dose. In the research of Zelalem et al. (2009) a significant increase in total and marketable tuber yield oc-curred only from the nitrogen fertilization level of 138 kg N/ha. Jamaati-e-Somarin et al. (2010) stated that on the objects fertilized with 200 kg N/ha productivity of potato was lower, by 23% and 18% than on the objects fertilized with 160 and 80 kg N/ha, respectively. The research demonstrated unfavourable effect of microbial preparations on the amount of marketable tuber yield. On the objects where microbial preparations were ap-plied the marketable yield was by between 1.5 and 2.5 t/ha smaller than in the control (Table 2). Moreover, an interactive effect of microbial prepa-rations and nitrogen doses on the amount of total and marketable tuber yield was observed (Figure 1). Application of microbial preparations in the treatments without nitrogen fertilization (N0) contributed to a marked increase in total and mar-ketable tuber yield but only after the application of B preparation. Growing nitrogen doses diminished productive effectiveness of microbial preparation. Particularly unfavourable effect of joint applica-tion of microbial preparations and nitrogen fer-tilization on potato yielding was observed in N120 and N180 treatments. Development of total tuber yield depending on the experimental factors and weather conditions was presented at length in the paper by Kołodziejczyk (2014). The effect of mi-crobial preparations on potato yielding described in literature is not unanimous. Mayer et al. (2008) stated no significant influence of microorganisms on potato yielding, whereas Emitiazi et al. (2004) revealed a beneficent effect of microbial inoculants on tuber development in a majority of studied potato cultivars.
Nitrogen fertilization of potato influenced an increase in the value of tuber yield components. A significant increase in the number of the main stems per 1 m2 under the influence of different doses of nitrogen fertilization occurred up to 120 kg N/ha level (Table 2). The number of tubers per 1 stem increased significantly under the fertilization up to 60 kg N/ha. Each dose of nitrogen within the
CNS =NSd × (Yb − Ya)
NSd + NTd + AWTd
CNT =NTd × (Yb − Ya)
NSd + NTd + AWTd
CAWT =AWTd × (Yb − Ya)
NSd + NTd + AWTd
fraction, after separating greened tubers, infected by disease or deformed. Potato harvesting, dur-ing which total tuber yield was determined were conducted in the 3rd decade of September.
Statistical analysis. Obtained research results were subjected to statistical assessment in accord-ance with experience system. Year was treated as a random effect. Honestly significant difference (HSD) for the studied traits were verified using the Tukey’s test at significance level P < 0.05. Relationships between the tuber yield and yield components were assessed by means of analysis of regression. The analysis of individual contri-bution and share of respective yield components in the increased level of potato yielding between the nitrogen fertilization levels was based on the method proposed by Rudnicki (2000).
Y = (NS × NT × AWT)/100
Where: Y – total yield (t/ha); NS – number of stems per 1 m2; NT – number of tubers per stem; AWT – average weight of tuber (g).
On the assumption that elements of yielding condition yield amount correlatively, the signifi-cance of each in differentiating yields among the objects (b and a) was determined as follows:
Where: NSd – difference in the number of stems per 1 m2; NTd – difference in the number of tubers per stem; AWTd – difference in the mean weight of tuber.
The contribution of respective elements of yielding in the absolute difference in yields (t/ha) between the objects b and a was determined as follows:
Where: CNS – contribution of the number of stems; CNT – contribution of the number of tubers; CAWT – contribu-tion of the mean weight of tuber.
NSd = 100 ×(NSb− NSa)
NSa/ �
NTbNTa
×AWTbAWTa
�
NTd = 100 ×(NTb − NTa)
NTa/ �
NSbNSa
×AWTbAWTa
�
AWTd = 100 ×(AWTb− AWTa)
AWTa/ �
NSbNSa
×NTbNTa
�
NSd
NTd
AWTd
NSb NSaNSa
NTbNTa
NTb NTaNTa
NSb
NSbNSa
NTbNTa
NSa
AWTa
AWTa
AWTaAWTa
AWTb
AWTb
AWTb
NSdNSd NTd AWTd
NTdNSd NTd
NSd NTd AWTd
AWTd
AWTd
CNS
CNT
CAWT
Yb
Yb
Yb
Ya
Ya
Ya
Plant Soil Environ. Vol. 60, 2014, No. 8: 379–386
382
range to 180 kg N/ha led to a marked increase in mean tuber weight. In the research of Jamaati-es-Somarin et al. (2010) increase in the number of stolons and tubers per 1 m2 occurred only to the fertilization level of 80 kg N/ha, whereas in-
crease in the average tuber weight to the level of 160 kg N/ha. Zewide et al. (2012) demonstrated an increase in tuber number within the whole range of applied nitrogen fertilization, i.e. to the level of 165 kg N/ha. B and EM microbial preparations
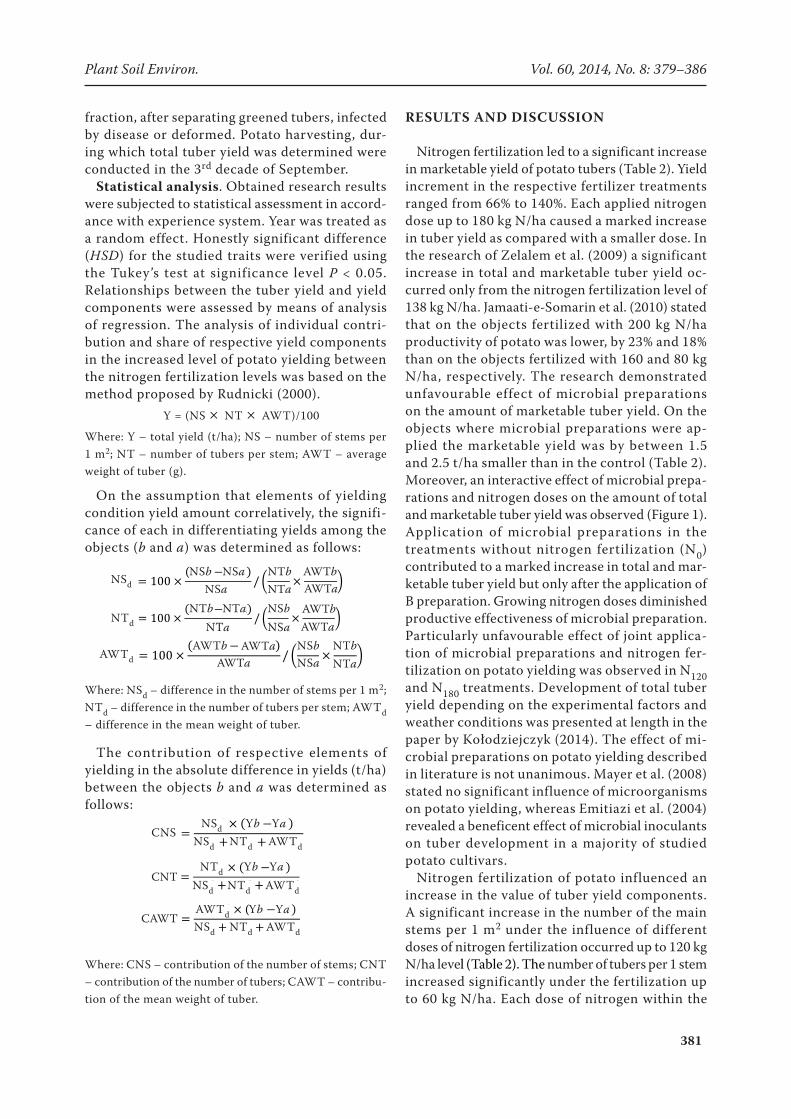
Table 2. Marketable yield, yield components and structure of total tuber yield
Treatment Marketable yield (t/ha)
Number of stems per 1 m2 (pc)
Number of tubers per stem (pc)
Average weight of tuber (g)
Share of tubers (%)
marketable large
Microbial preparations
Control 31.3a 14.8a 1.9b 128a 96a 68a
B 29.7b 14.2b 2.0ab 129a 97a 66b
EM 29.0c 14.1b 2.1a 121c 96a 67ab
UGmax 29.8b 14.9a 2.0ab 125b 96a 68a
N rate (kg/ha)
N0 16.7d 13.4c 1.9b 90d 94d 58d
N60 27.8c 14.2b 2.0a 119c 96c 65c
N120 35.2b 15.0a 2.0a 141b 97b 71b
N180 40.0a 15.4a 2.0a 151a 98a 74a
Year
2006 30.1a 14.7a 2.1a 115c 97a 49c
2007 29.9a 14.5a 1.9a 134a 96b 72b
2008 29.8a 14.2a 2.0a 127b 96b 80a
Values of the column followed by the same letters do not differ at 5% level of significance. B – BactoFil B10; EM – effective microorganisms; UGmax– soil fertilizer
Figure 1. Total and marketable tu-ber yield (t/ha) depending on mi-crobial preparation and nitrogen rate (values within the levels of fertilization followed by the same letters do not differ at 5% level of significance). B – BactoFil B10; EM – effective microorganisms; UGmax– soil fertilizer
Total yield
Marketable yield
0 60 120 180(kg N/ha)
control B EM UGmax
50
40
30
20
10
50
40
30
20
10
b
b
b b b
a a a
a
aa
cab
abbcc
b
b
b b bb b b
a
a
a
a a ab
abab
Vol. 60, 2014, No. 8: 379–386 Plant Soil Environ.
383
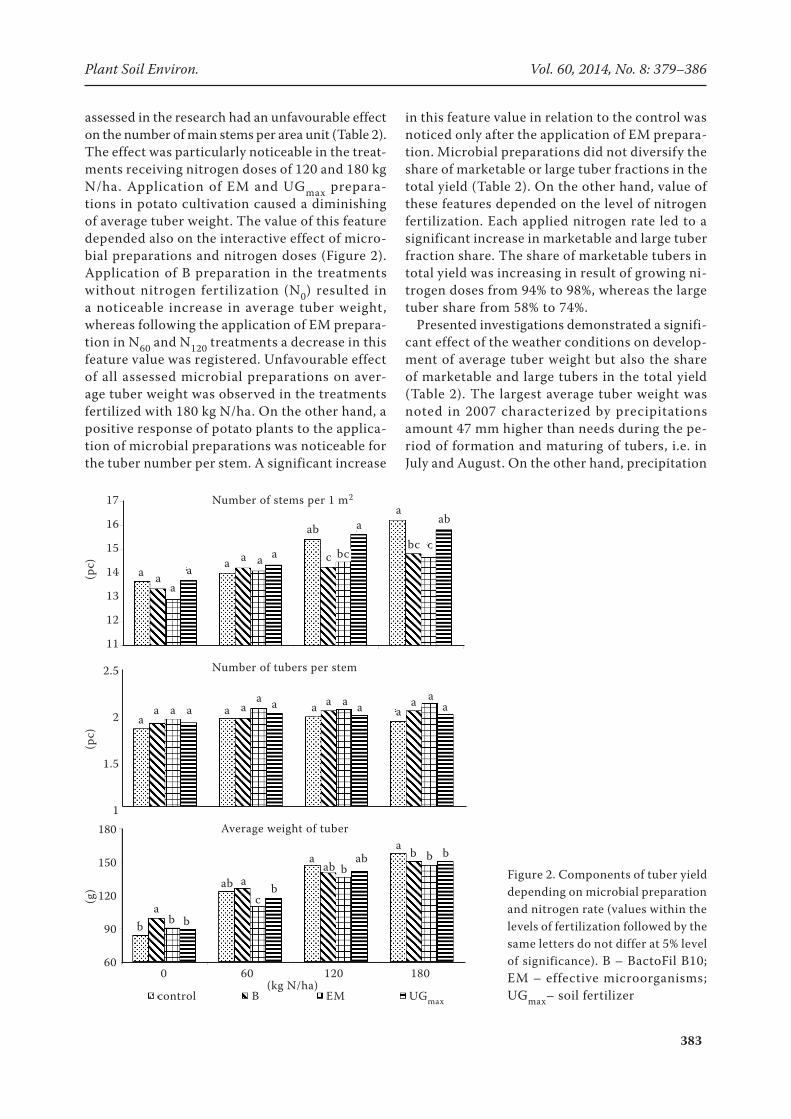
assessed in the research had an unfavourable effect on the number of main stems per area unit (Table 2). The effect was particularly noticeable in the treat-ments receiving nitrogen doses of 120 and 180 kg N/ha. Application of EM and UGmax prepara-tions in potato cultivation caused a diminishing of average tuber weight. The value of this feature depended also on the interactive effect of micro-bial preparations and nitrogen doses (Figure 2). Application of B preparation in the treatments without nitrogen fertilization (N0) resulted in a noticeable increase in average tuber weight, whereas following the application of EM prepara-tion in N60 and N120 treatments a decrease in this feature value was registered. Unfavourable effect of all assessed microbial preparations on aver-age tuber weight was observed in the treatments fertilized with 180 kg N/ha. On the other hand, a positive response of potato plants to the applica-tion of microbial preparations was noticeable for the tuber number per stem. A significant increase
in this feature value in relation to the control was noticed only after the application of EM prepara-tion. Microbial preparations did not diversify the share of marketable or large tuber fractions in the total yield (Table 2). On the other hand, value of these features depended on the level of nitrogen fertilization. Each applied nitrogen rate led to a significant increase in marketable and large tuber fraction share. The share of marketable tubers in total yield was increasing in result of growing ni-trogen doses from 94% to 98%, whereas the large tuber share from 58% to 74%.
Presented investigations demonstrated a signifi-cant effect of the weather conditions on develop-ment of average tuber weight but also the share of marketable and large tubers in the total yield (Table 2). The largest average tuber weight was noted in 2007 characterized by precipitations amount 47 mm higher than needs during the pe-riod of formation and maturing of tubers, i.e. in July and August. On the other hand, precipitation
Figure 2. Components of tuber yield depending on microbial preparation and nitrogen rate (values within the levels of fertilization followed by the same letters do not differ at 5% level of significance). B – BactoFil B10; EM – effective microorganisms; UGmax– soil fertilizer
Average weight of tuber
Number of tubers per stem
Number of stems per 1 m2
0 60 120 180(kg N/ha)
control UGmaxEMB
17
16
15
14
13
12
11
2.5
2
1.5
1180
150
120
90
60
(pc)
(pc)
(g)
a aa
a a a a a
aaab
cc
ab
bcbc
aa a a a a
a a a a a a aa a
a
a
a
aa bbb
bab
abab
b b b
bc
Plant Soil Environ. Vol. 60, 2014, No. 8: 379–386
384
deficiency in July 2006 and high number of set tubers had a negative effect on the formation of average tuber weight and the share of large tuber fraction. In 2006 the highest for the three-year period of investigations share of marketable tuber fraction in the total yield was noted. Precipitation amount during the July–August period 2008, ap-proximate to potato plant requirements and an average number of set tubers, positively affected the share of large tubers. A significant effect of the moisture conditions on the value of tuber yield components was revealed also by Zebarth et al. (2006). The authors stated a bigger average tuber weight in wetter than dry years and diversi-fied response of varieties to moisture conditions concerning formation of the number of main stems but also the number of set tubers. Obtained results are compatible also with the reports of Badr et al. (2012), who revealed that deficiency of water has a more unfavourable effect on average tuber weight than on the number of set tubers.
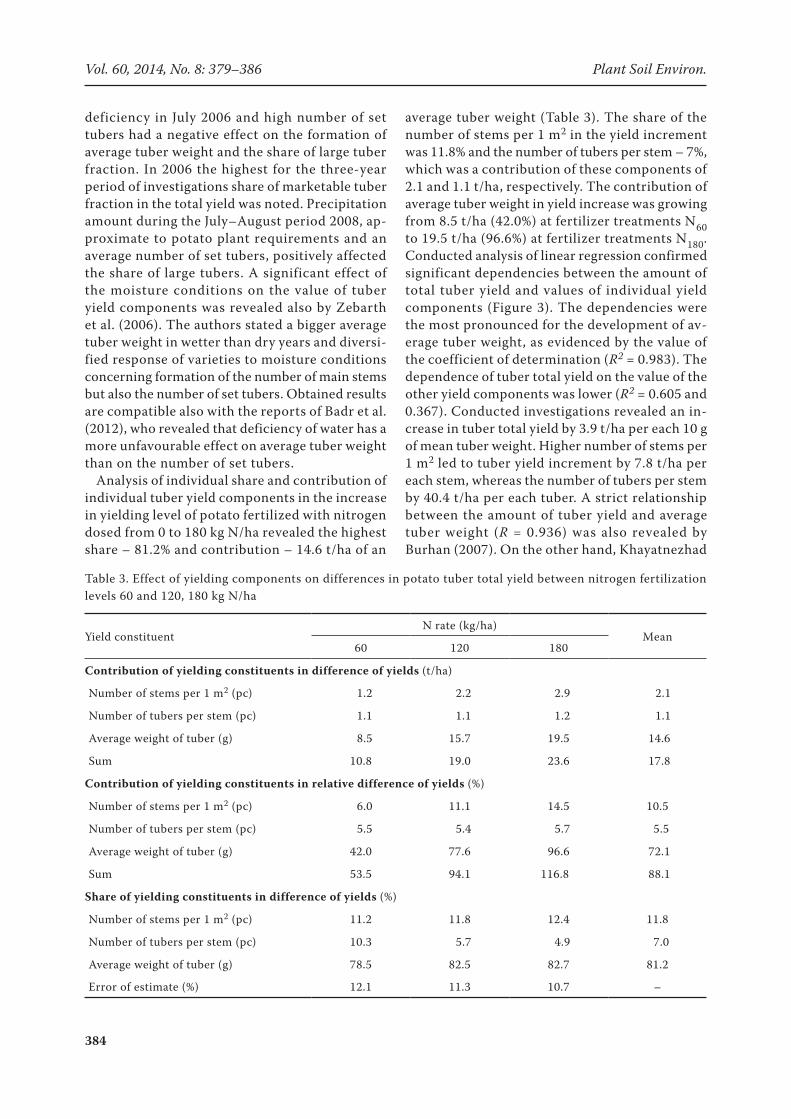
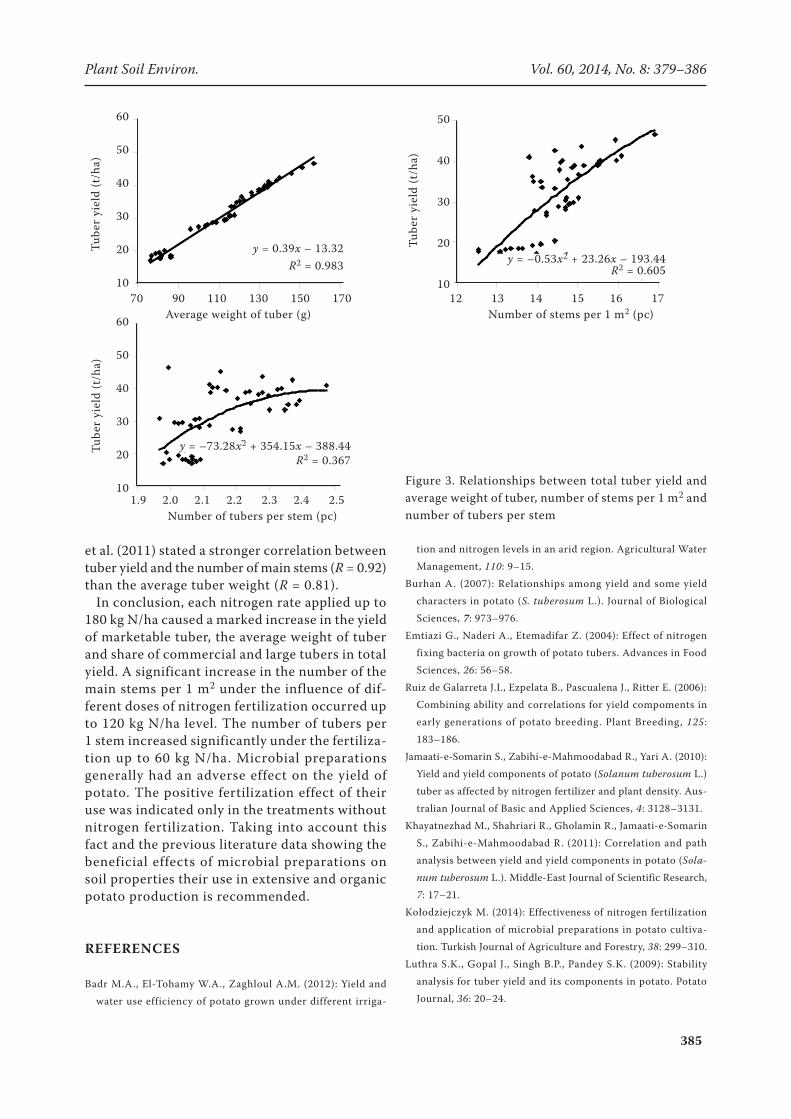
Analysis of individual share and contribution of individual tuber yield components in the increase in yielding level of potato fertilized with nitrogen dosed from 0 to 180 kg N/ha revealed the highest share – 81.2% and contribution – 14.6 t/ha of an
average tuber weight (Table 3). The share of the number of stems per 1 m2 in the yield increment was 11.8% and the number of tubers per stem – 7%, which was a contribution of these components of 2.1 and 1.1 t/ha, respectively. The contribution of average tuber weight in yield increase was growing from 8.5 t/ha (42.0%) at fertilizer treatments N60 to 19.5 t/ha (96.6%) at fertilizer treatments N180. Conducted analysis of linear regression confirmed significant dependencies between the amount of total tuber yield and values of individual yield components (Figure 3). The dependencies were the most pronounced for the development of av-erage tuber weight, as evidenced by the value of the coefficient of determination (R2 = 0.983). The dependence of tuber total yield on the value of the other yield components was lower (R2 = 0.605 and 0.367). Conducted investigations revealed an in-crease in tuber total yield by 3.9 t/ha per each 10 g of mean tuber weight. Higher number of stems per 1 m2 led to tuber yield increment by 7.8 t/ha per each stem, whereas the number of tubers per stem by 40.4 t/ha per each tuber. A strict relationship between the amount of tuber yield and average tuber weight (R = 0.936) was also revealed by Burhan (2007). On the other hand, Khayatnezhad
Table 3. Effect of yielding components on differences in potato tuber total yield between nitrogen fertilization levels 60 and 120, 180 kg N/ha
Yield constituentN rate (kg/ha)
Mean60 120 180
Contribution of yielding constituents in difference of yields (t/ha)
Number of stems per 1 m2 (pc) 1.2 2.2 2.9 2.1
Number of tubers per stem (pc) 1.1 1.1 1.2 1.1
Average weight of tuber (g) 8.5 15.7 19.5 14.6
Sum 10.8 19.0 23.6 17.8
Contribution of yielding constituents in relative difference of yields (%)
Number of stems per 1 m2 (pc) 6.0 11.1 14.5 10.5
Number of tubers per stem (pc) 5.5 5.4 5.7 5.5
Average weight of tuber (g) 42.0 77.6 96.6 72.1
Sum 53.5 94.1 116.8 88.1
Share of yielding constituents in difference of yields (%)
Number of stems per 1 m2 (pc) 11.2 11.8 12.4 11.8
Number of tubers per stem (pc) 10.3 5.7 4.9 7.0
Average weight of tuber (g) 78.5 82.5 82.7 81.2
Error of estimate (%) 12.1 11.3 10.7 –
Vol. 60, 2014, No. 8: 379–386 Plant Soil Environ.
385
y = 0.39x - 13.32R2 = 0.983
10
20
30
40
50
60
70 90 110 130 150 170Average weight of tuber (g)
Tube
r yie
ld (t
ha
-1 )
y = -0,53x2 + 23,26x - 193,44R2 = 0,605
10
20
30
40
50
12 13 14 15 16 17Nunber of stems per 1 m2
Tube
r yie
ld (t
ha
-1 )
y = -73,28x2 + 354,15x - 388,44R2 = 0,367
10
20
30
40
50
60
1,9 2,0 2,1 2,2 2,3 2,4 2,5Number of tubers per stem
Tube
r yie
ld (t
ha -1
)
Figure 3. Relationships between total tuber yield and average weight of tuber, number of stems per 1 m2 and number of tubers per stem
et al. (2011) stated a stronger correlation between tuber yield and the number of main stems (R = 0.92) than the average tuber weight (R = 0.81).
In conclusion, each nitrogen rate applied up to 180 kg N/ha caused a marked increase in the yield of marketable tuber, the average weight of tuber and share of commercial and large tubers in total yield. A significant increase in the number of the main stems per 1 m2 under the influence of dif-ferent doses of nitrogen fertilization occurred up to 120 kg N/ha level. The number of tubers per 1 stem increased significantly under the fertiliza-tion up to 60 kg N/ha. Microbial preparations generally had an adverse effect on the yield of potato. The positive fertilization effect of their use was indicated only in the treatments without nitrogen fertilization. Taking into account this fact and the previous literature data showing the beneficial effects of microbial preparations on soil properties their use in extensive and organic potato production is recommended.
REFERENCES
Badr M.A., El-Tohamy W.A., Zaghloul A.M. (2012): Yield and water use efficiency of potato grown under different irriga-
tion and nitrogen levels in an arid region. Agricultural Water Management, 110: 9–15.
Burhan A. (2007): Relationships among yield and some yield characters in potato (S. tuberosum L.). Journal of Biological Sciences, 7: 973–976.
Emtiazi G., Naderi A., Etemadifar Z. (2004): Effect of nitrogen fixing bacteria on growth of potato tubers. Advances in Food Sciences, 26: 56–58.
Ruiz de Galarreta J.I., Ezpelata B., Pascualena J., Ritter E. (2006): Combining ability and correlations for yield compoments in early generations of potato breeding. Plant Breeding, 125: 183–186.
Jamaati-e-Somarin S., Zabihi-e-Mahmoodabad R., Yari A. (2010): Yield and yield components of potato (Solanum tuberosum L.) tuber as affected by nitrogen fertilizer and plant density. Aus-tralian Journal of Basic and Applied Sciences, 4: 3128–3131.
Khayatnezhad M., Shahriari R., Gholamin R., Jamaati-e-Somarin S., Zabihi-e-Mahmoodabad R. (2011): Correlation and path analysis between yield and yield components in potato (Sola-num tuberosum L.). Middle-East Journal of Scientific Research, 7: 17–21.
Kołodziejczyk M. (2014): Effectiveness of nitrogen fertilization and application of microbial preparations in potato cultiva-tion. Turkish Journal of Agriculture and Forestry, 38: 299–310.
Luthra S.K., Gopal J., Singh B.P., Pandey S.K. (2009): Stability analysis for tuber yield and its components in potato. Potato Journal, 36: 20–24.
y = 0.39x - 13.32R2 = 0.983
10
20
30
40
50
60
70 90 110 130 150 170Average weight of tuber (g)
Tube
r yie
ld (t
ha
-1 )
y = -0,53x2 + 23,26x - 193,44R2 = 0,605
10
20
30
40
50
12 13 14 15 16 17Nunber of stems per 1 m2
Tube
r yie
ld (t
ha
-1 )
y = -73,28x2 + 354,15x - 388,44R2 = 0,367
10
20
30
40
50
60
1,9 2,0 2,1 2,2 2,3 2,4 2,5Number of tubers per stem
Tube
r yie
ld (t
ha -1
)
y = 0.39x - 13.32R2 = 0.983
10
20
30
40
50
60
70 90 110 130 150 170Average weight of tuber (g)
Tube
r yie
ld (t
ha
-1 )
y = -0,53x2 + 23,26x - 193,44R2 = 0,605
10
20
30
40
50
12 13 14 15 16 17Nunber of stems per 1 m2
Tube
r yie
ld (t
ha
-1 )
y = -73,28x2 + 354,15x - 388,44R2 = 0,367
10
20
30
40
50
60
1,9 2,0 2,1 2,2 2,3 2,4 2,5Number of tubers per stem
Tube
r yie
ld (t
ha -1
)Tu
ber
yiel
d (t
/ha)
Average weight of tuber (g)
y = 0.39x – 13.32R2 = 0.983
60
50
40
30
20
1070 90 110 130 150 170
Tube
r yi
eld
(t/h
a)
60
50
40
30
20
101.9 2.0 2.1 2.2 2.3 2.4 2.5
Number of tubers per stem (pc)
R2 = 0.367y = –73.28x2 + 354.15x – 388.44
Tube
r yi
eld
(t/h
a)
60
50
40
30
20
10
50
40
30
20
1012 13 14 15 16 17
Number of stems per 1 m2 (pc)
y = –0.53x2 + 23.26x – 193.44 R2 = 0.605
Plant Soil Environ. Vol. 60, 2014, No. 8: 379–386
386
Mayer J., Scheid S., Oberholzer H.R. (2008): How effective are ‘effective microorganisms’? Results from an organic farming field experiment. In: Proceedings of the 16th IFOAM Organic World Congress, 18–20 June, Modena, 168–171.
Olivier M., Goffart J.P., Ledent J.F. (2006): Threshold value for chlorophyll meter as decision tool for nitrogen management of potato. Agronomy Journal, 98: 496–506.
Priyadi K., Hadi A., Siagian T.H., Nisa C., Azizah A., Raihani N., Inubushi K. (2005): Effect of soil type, applications of chicken manure and effective microorganisms on corn yield and mi-crobial properties of acidic wetland soils in Indonesia. Soil Science and Plant Nutrition, 51: 689–691.
Rudnicki F. (2000): Estimation of individual yielding constituents effects on field difference between experimental treatments. Fragmenta Agronomica, 3: 53–65. (In Polish)
Skowera B., Puła J. (2004): Pluviometric extreme conditions in spring season in Poland in the years 1971–2000. Acta Agro-physica, 3: 171–177.
Stewart D.P.C., Daly M.J. (1999): Influence of ‘effective micro-organisms’ (EM) on vegetable production and carbon miner-alization – a preliminary investigation. Journal of Sustainable Agriculture, 14: 15–25.
Van Vliet P.C.J., Bloem J., de Goede R.G.M. (2006): Microbial diversity, nitrogen loss and grass production after addition of
effective micro-organisms (EM) to slurry manure. Applied Soil Ecology, 32: 188–198.
Xu H.L. (2001): Effects of a microbial inoculant and organic fertilizers on the growth, photosynthesis and yield of sweet corn. Journal of Crop Production, 3: 183–214.
Zebarth B.J., Arsenault W.J., Sanderson J.B. (2006): Effect of seedpiece spacing and nitrogen fertilization on tuber yield, yield components, and nitrogen use efficiency parameters of two potato cultivars. American Journal of Potato Research, 83: 289–296.
Zebarth B.J., Leclerc Y., Moreau G. (2004): Rate and timing of nitrogen fertilization of Russet Burbank potato: Nitrogen use efficiency. Canadian Journal of Plant Science, 84: 845–854.
Zelalem A., Tekalign T., Nigussie D. (2009): Response of potato (Solanum tuberosum L.) to different rates of nitrogen and phosphorus fertilization on vertisols at Debre Berhan, in the central highlands of Ethiopia. African Journal of Plant Sci-ence, 3: 16–24.
Zewide I., Mohammed A., Tulu S. (2012): Effect of different rates of nitrogen and phosphorus on yield and yield components of potato (Solanum tuberosum L.) at Masha District, Southwestern Ethiopia. International Journal of Soil Science, 7: 146–156.
Received on April 28, 2014Accepted on June 4, 2014
Corresponding author:
Dr. Marek Kołodziejczyk, University of Agriculture in Krakow, Department of Crop Production, Al. Mickiewicza 21, 31 120 Krakow, Polande-mail: [email protected]
Vol. 60, 2014, No. 8: 379–386 Plant Soil Environ.