Embed Size (px)
Citation preview

Effect of pH switch operation on anaerobic hydrogen production
1 2,3,4 2 5 2,3,4,Chyi-How Lay, Biswarup Sen, Ya-Chun Cheng, Chin-Chao Chen and Chiu-Yue Lin *
1Department of Chemistry and Bioengineering Tampere University of Technology
Tampere 33720, Finland2Depatment of Environmental Engineering and Science
Feng Chia University Taichung 40724, Taiwan
3Green Energy Development Center Feng Chia University
Taichung 40724, Taiwan4Master Program of Green Energy Science and Technology
Feng Chia UniversityTaichung 40724, Taiwan
5Department of Landscape ArchitectureChung Chou University of Science and Technology
Changhwa 51022, Taiwan
Key Words: Anaerobic fermentation, ethanol production, hydrogen production, switch strategy
*Corresponding authorEmail: [email protected]
ABSTRACT
INTRODUCTION
Hydrogen is an intermediate product in anaerobic fermentation along with the production of soluble metabolic product such as ethanol (EtOH). Dark fermentation becomes more interesting due to its advantages of producing hydrogen rapidly when compared with other biological methods. This study aimed to investigate the effect of pH-switch operating strategy on biohydrogen production in a continuously stirred tank reactor (CSTR). The efficiencies of hydrogen and ethanol production by shifting the pH from 6.8 (I) to 6.0 (I) and 6.0 (II) to 6.8 (II) and vice versa were investigated in
-1CSTR. At the optimal hydrogen production condition, hydrogen production yield 2.8 mol H mol 2-1 -1sucrose, hydrogen production rate 437 mmol H L d and specific hydrogen production rate 224 2
-1 -1mmol H g VSS d were obtained at pH 6.0 (I). pH 6.8 (I) was the optimal condition for ethanol 2-1production with an ethanol concentration of 7743 mg COD L . The bacterial community structure
analysis showed that Clostridium intestinale and Clostridium pasteurianum were dominant in the fermenter. The bacterial activity decreased during the pH shift. Switching the pH from 6 to 6.8 back and forth could be an operation strategy for obtaining the production of hydrogen and ethanol separately in the same bioreactor. .
Renewable energy such as biohydrogen, bioethanol and biodiesel from biomass has received considerable attention because of high price of the fossil fuels and the environmental pollution problems associated with their utilization. Dark-fermentation technology offers the best potential for practical appli-cation with advantages of higher rates of hydrogen and ethanol production and utilization of low-value bio-mass like wood residues, municipal solid waste and agricultural residues as raw materials [1]. Anaerobic
hydrogen production process is an exciting research and development area that offers a promising industrial technology for generating hydrogen from a variety of renewable resources. Moreover, hydrogen produced from this process is clean, sustainable and has dual benefit of waste recycling and hydrogen production economically. Fermentative hydrogen production process is a tedious process and requires optimization of inoculums type, pretreatment, substrate nature and composition, pH and temperature to scale-up the proc-ess [2]. There are many reports focusing on developing the operation strategies which could improve hydrogen
335Sustain. Environ. Res., 22(5), 335-342 (2012)
production efficiency in continuous systems. For example, immobilization technology used in biohydrogen production showed the world's leading hydrogen production rate (HPR) [3]. The control of pH is crucial to the dark fermenta-tive hydrogen production, due to its effect on the hydrogenase activity and on the metabolic pathways. Gao et al. [4] investigated the effects of elevated pH shocks on the performance and membrane fouling of a submerged anaerobic membrane bioreactor treating thermo-mechanical pulping. The results revealed the elevated pH shocks induced the dispersion of sludge flocs and resulted in the accumulation of colloids and solutes or biopolymers in the sludge suspension, and thus deteriorated membrane perfor-mance. Statistical analysis showed that the ratio of proteins to polysaccharides in extracellular polymeric substances had a strongly negative effect on the mem-brane fouling rate. When the pH of the fermentation medium is too low, either metabolic activity of the H -2
producing bacterial population would be inhibited or there would be a switch in metabolic pathway re-sulting in cessation of hydrogen generation [5]. Many reports listed that studies on dark fermentation using wastewaters and solid wastes at slightly acidic envi-ronment (< pH 7.0). Typically, the maximum hydrogen yield (HY) and HPR values were obtained when the pH was in a range of 5.5 and 6.5 [5-7]. This study aimed to investigate the effect of operating strategy by switching the cultivation pH value between 6.8, 6.0 and 5.0 during hydrogen fermentation using sucrose as substrate in continuously stirred tank reactor (CSTR).
.
.
MATERIALS AND METHODS
1. Seed Sludge and Substrate
The seed sludge was obtained from waste ac-tivated sludge from the Li-Ming Municipal Sewage Treatment Plant in Taichung, Taiwan. The collected sludge was screened with a No. 8 mesh (size 2.35 mm) and heated at 100 °C for 45 min (to inhibit hydrogen consuming methanogenic bioactivity). The pH, volatile suspended solids (VSS, to express the biomass con-centrations) and TS (total solids) concentrations of the
-1seed sludge were 6.92, 46.3 and 72.1 g L , respec--1tively. Sucrose (20 g COD L ) was used as the single
substrate source. Nutrient medium contains sufficient inorganic supplements in the following composition
-1(g L ): NH HCO 5.24, K HPO 0.125, MgCl ·6H O 4 3 2 4 2 2
0.1, MnSO ·6H O 0.015, FeSO ·7H O 0.025, 4 2 4 2
CuSO ·5H O 0.005, COCl ·5H O 0.000125 and 4 2 2 2
NaHCO 6.72 [8]. 3
2. Experimental Procedures
A CSTR hydrogen fermenter with a working volume of 2.0 L was operated at a temperature of
.
.
.
35 °C and hydraulic retention time (HRT) of 8 h. The fermenter was constantly mixed at 250 rpm with a magnetic stirrer. pH 5.0, 6.0 and 6.8 were maintained using a pH controller and 1 M NaOH and HCl. When a steady-state condition with slight variations (less than 10%) in the gas production, volatile fatty acid (VFA) and solids concentrations reached and the desired data were obtained, the cultivation pH was switched.
3. Monitoring and Analyses
During the hydrogen-production experiments, the monitoring parameters were pH, ORP (oxidation- reduction potential), alkalinity, VFA distribution and gas production. The gas volumes were measured with a wet gas meter (Ritter, Bochum, Germany) at a room temperature (25 °C) and pressure (760 mm Hg). The hydrogen production efficiency was evaluated using the hydrogen content in the biogas, HY (the ability converting sucrose into hydrogen), HPR, and specific HPR (SHPR). The analytical procedures of Standard Methods [9] were used to determine the above parameters of liquid content. Ethanol and VFA were analyzed with a gas chromatograph having a flame ionization detector (glass column, 145 °C; injection temperature, 175 °C; carrier gas, N ; packing, free fatty acid polyester 2
(10%). Gas composition was analyzed with a gas chromatograph having a thermal conductivity detector (column, 55 °C; injection temperature, 90 °C; carrier gas, Argon; packing, Porapak Q, mesh 80/100). Anthrone-sulfuric acid method was used to measure hexose concentration [10].
4. Microbial Analysis
Total genomic DNA was isolated from the samples collected in different phases of reactor operation using the Blood & Tissue Genomic DNA Extraction Miniprep System (Viogene, Taiwan) following the manufacturer's instructions. Primer pair EUB968F (5'-CGC CCG GGG CGC GCC CCG GGC GGG GCG GGG GCA CGG GGG GAA CGC GAA GAA CCT TAC-3') and UNIV1392R (5'-ACG GGC GGT GTG TRC-3') were used to amplify partial 16S rRNA gene to generate a DNA fragment suitable for Dena-turing Gradient Gel Electrophoresis analysis. Each polymerase chain reaction (PCR) mix (50 mL) con-tained 200 mM deoxynucleoside triphosphate, 1.5 mM MgCl , 0.4 mM each primer set, and 1.25 U Taq DNA 2
polymerase (Promega, USA). The amplification was performed with an automatic thermocycler iCyclerTM (Bio-Rad, USA) and consisted of a denaturing step at 95 °C for 5 min, followed by 30 cycles of denaturation at 94 °C for 1 min, annealing at 55 °C for 1 min, ex-tension at 72 °C for 1 min, and a final extension step at 72 °C for 10 min. The PCR-amplified rDNA frag-
.
.
.
.
.
336 Lay et al., Sustain. Environ. Res., 22(5), 335-342 (2012)
ments were assessed using DGGE [11] by using TMDCode Universal Mutation Detection System
(BioRad, USA). The 6% (w/v) acrylamide solution was used to cast a gel with denaturant gradients ranging from 40 to 60%. Electrophoresis was con-ducted in 1X Tris/acetic acid/EDTA buffer solution at 100 V and 60 °C for 16 h. The gels were stained for 10 min with ethidium bromide and visualized under a UV transilluminator. The DGGE bands were excised and then purified using the Centrilutor microelectroeluter system (Millipore, Rockville, MD, USA). The purified DNA fragments were re-amplified under the reaction conditions described above. The resulting PCR prod-ucts were sequenced and identified through BLAST search similarity. .
RESULTS AND DISCUSSION
1. Bioreactor Performance at Steady State
pH 6.8 was suitable for continuous hydrogen production from sucrose feedstock in our previous study [12]. Therefore, the bioreactor was cultivated at pH 6.8 and fed with sucrose concentration 20 g COD
-1L with HRT 8 h for start-up in a CSTR. When the bioreactor reached the steady-state condition, the cultivation pH was switched to 5.0, 6.0 and 6.8 back and forth to investigate the bioreactor performance and optimal pH value for hydrogen and ethanol production.
.
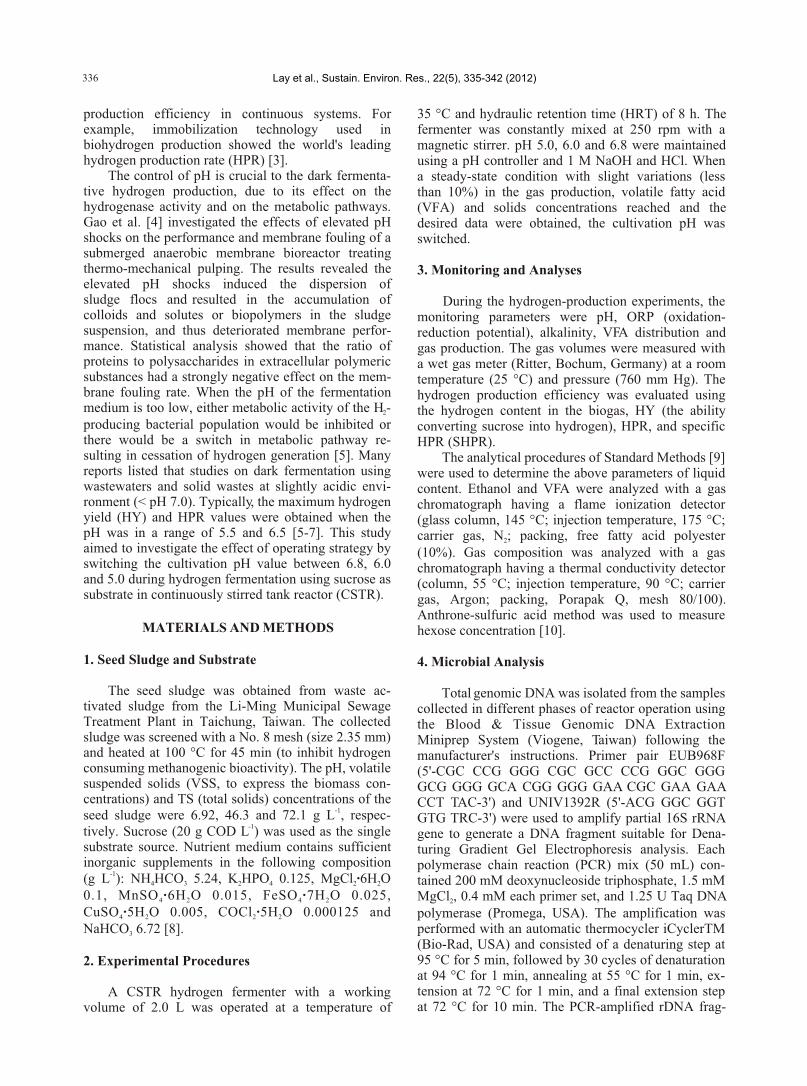
Figure 1 shows the pH switch operation strategy and daily bioreactor performance at various pH values in CSTR. The reactor was cultivated at first period at pH 6.8 (pH 6.8 (I)) during day 1-43. The hydrogen content, HPR and HY at steady-state condition (day 13-43) of
-1 -1pH 6.8 (I) were 40 ± 6%, 219 ± 89 mmol H L d and 2-11.4 ± 1 mol H mol sucrose, respectively (Table 1). 2
The cultivation pH was switched to 6.0 (pH 6.0 (I)) at day 48. The hydrogen production performance was
-1hydrogen content 46 ± 2%, HPR 437 ± 81 mmol H L 2-1 -1d and 2.8 ± 0.5 mol H mol sucrose under the steady-2
state condition (day 54-76) at pH 6.0 (I). The HPR -1 -1value was similar to HPR 469 mmol H L d obtained 2
using sucrose and HRT 8 h in an anaerobic sequencing batch reactor in our previous study [13]. The hydrogen
-1 -1content 46 ± 4%, HPR 328 ± 46 mmol H L d and 2-1HY 2.1 ± 0.3 mol H mol sucrose were obtained when 2
the pH was maintained at 6.8 again (pH 6.8 (II)) under the steady-state condition at day 89-104. Then, the reactor was cultivated at a lower pH of 5.0 at day 114. However, the hydrogen production performance de-creased to hydrogen content 32 ± 6%, HPR 183 ± 64
-1 -1 -1mmol H L d and 1.2 ± 0.4 mol H mol sucrose 2 2
under the steady-state condition (day 89-104) at pH 5.0. Therefore, the cultivation pH was switched to 6.8 again at day 159 (pH 6.8 (III)) to investigate the varia-tion of hydrogen production efficiency. But, the lowest
-1 -1hydrogen content 20 ± 8%, HPR 21 ± 8 mmol H L d 2-1and HY 0.1 ± 0.1 mol H mol sucrose were observed 2
under the steady-state condition at pH 6.8 compared with the values at the three runs of pH 6.8. According to the results above, pH 6.0 has the maximum HY value which was 200% higher than the value at pH 6.8(I) and 57% higher than pH 5.0. To increase the hydro-gen production efficiency, pH was switched to 6.0 again (pH 6.0 (II)) at day 191 (Fig. 1). The hydrogen production performance increased to hydrogen content
-1 -141 ± 2%, HPR 339 ± 86 mmol H L d and HY 2.2 ± 2-10.6 mol H mol sucrose under the steady-state condi-2
tion at pH 6.0 (II) (Fig. 2). These values were still lower than those at pH 6.0 (I). These results indicated that a suitable cultivation pH could enhance the hydro-gen production efficiency in a continuous system. Even the bioreactor is cultivated at some strict condi-tion such as low or high pH for a period; hydrogen production performa
.
.
.
.
nce could be recovered by switching to the correct operation condition.
2. Water Quality and Soluble Metabolic Products (SMP) Performance under Steady State
Water quality performances under steady-state at various pH values are shown in Table 1. The ORP values at the pH 6.8 runs ranged from -400 to -500 mV. However, the ORP values were -212 ± 48 mV at pH 5.0. At pH 6.0 the ORP ranged from -484 to -337 mV and resulted in high hydrogen production efficiency.
Cultivation time (d)
OR
P (
-mV
)H
con
ten
t (%
)2
-1-1
HP
R (
mm
ol H
L d
)2
pH
S1 S2 S3 S4 S5
337
Fig. 1. Daily bioreactor performance at various pH values.
Lay et al., Sustain. Environ. Res., 22(5), 335-342 (2012)

Similarly, in our previous study [14] the optimum ORP ranged from -300 to -400 mV to produce hydrogen from soluble condensed molasses using mixed culture rich in Clostridium species. MLVSS concentration was
-1higher than 2.0 g L in all runs. Carbohydrate degrada-tions were higher than 90% at each pH except pH 5.0 and 6.8. Ethanol, acetate, propionate and butyrate were the main SMPs during anaerobic hydrogen fermentation [15]. n-butyrate had the highest concentration ranging
-1from 1065 ± 277 to 9069 ± 957 mg COD L that was 16-69% of SMPs (Table 2). It indicated butyrate pathway in sucrose fermentation. Similar results were obtained in our previous study using the same substrate and seed inoculum [16]. On the other hand, high ethanol representing 32-33% of SMP with the concen-
-1tration of 774 ± 726 and 2638 ± 628 mg COD L were observed at pH 6.8 (I) and 6.8 (Fig. 3). Hawkes et al.
.
Fig. 2. Biohydrogen production performance under steady-state condition at various pH values.
Table 1. Performance of the continuous stirred-tank reactor at various pH values under steady-state condition
pHCultivation
day (d)
13-43
54-76
89-104
123-149
170-186
198-210
ORP
(-mV)
525 ± 50
484 ± 43
441 ± 29
212 ± 48
426 ± 62
337 ± 64
Alkalinity-1(mg as CaCO L )3
9757 ± 1736
5863 ± 913
6350 ± 3420
2977 ± 1120
11712 ± 848
6712 ± 387
MLVSS -1(g L )
3.91 ± 1.04
2.04 ± 0.35
2.6 ± 0.22
2.07 ± 0.47
2.48 ± 0.26
2.2 ± 0.22
H Content2
(%)
40 ± 6
46 ± 27
46 ± 4
32 ± 6
20 ± 89
41 ± 2
HPR-1 -1(mmol H L d )2
219 ± 89
437 ± 81
328 ± 46
183 ± 64
21 ± 8
339 ± 87
HY (mol H 2
-1mol Sucrose)
1.4 ± 0.6
2.8 ± 0.5
2.1 ± 0.3
1.2 ± 0.4
0.1 ± 0.1
2.2 ± 0.6
-1SHPR (mmol H g 2
-1MLVSS d )
90 ± 53
223.5 ± 33
119 ± 44
88 ± 13
9 ± 6
158 ± 47
Carbohydrate
degradation (%)
97 ± 3
94 ± 2
98 ± 3
70 ± 8
68 ± 12
97 ± 1
6.8 (I)
6.0 (I)
6.8 (II)
5.0
6.8 (III)
6.0 (II)
H c
onte
nt (
%)
2
-1
HY
(m
ol H
mol
sucr
ose)
2
-1-1
HP
R (
mm
ol H
L d
)2
-1-1
SH
PR
(m
mol
g M
LV
SS
d)
50
45
40
35
30
25
20
153.0
2.5
2.0
1.5
1.0
0.5
500
400
300
200
100
250
200
150
100
50
06.8 (I) 6.8 (II) 6.8 (III)6.0 (I) 6.0 (II)
pH
Sol
uble
met
abol
ic p
rodu
cts
com
posi
tion
(%
)
0
20
40
60
80
100
[6] reported that high hydrogen production efficiency is usually associated with high butyrate concentration, and ethanol accumulation would lead to reduced hydrogen production. The lowest SMP concentration was obtained at pH 5.0 with low hydrogen production. Probably, low pH inhibited the microbial activity to reduce the metabolism or a switch in metabolic path-way resulting in cessation of biohydrogen generation [5]. Moreover, switching pH could affect the ioniza-tion states of the active components of the cells and substrates [17].
3. Microbial Community
The microbial determination in a DGGE analysis for the biomass sample under steady state at each pH indicated that microbial population was pH-dependent with Clostridium intestinale and Clostridium pasteurianum (Fig. 4) as dominant species. Clostridial species have been reported to be responsible for hy-drogen production via butyrate type fermentation [18]. C. intestinale could convert saccharides to produce hydrogen [17,18]. C. pasteurianum was found as the dominant microorganism while using sugarcane juice [18], starch [19] and rice straw [20] as feedstock in anaerobic hydrogen fermentation. C. intestinale and C. Pasteurianum existed simultaneously under the steady-state at pH 6.8 (I) and pH 6.8 (II). However, there was only C. pasteurianum AB536773 under the steady-state at pH 6.8 after pH 5.0 cultivation. The reason might be that the hydrogen production effi-
.
.
*n 5
Fig. 3. Soluble metabolic products performance under steady-state condition at various pH values.
338 Lay et al., Sustain. Environ. Res., 22(5), 335-342 (2012)

ciency could not recover when the pH was switched to 6.8 again. The pH is considered to be the most crucial growth parameter which significantly affects the metabolic and enzymatic reactions and consequently the fermentation process. Especially the Clostridial species are pH sensitive for their biochemical and physiological behavior and performances during the hydrogen fermentation. Previous study has shown that metabolic
.
Table 2. Soluble metabolic products performances at steady-state periods of various pH values
n = 5*Percentage of total Soluble metabolic products**TVFA (Total volatile fatty acids) = HAc (Acetate) + HPr (Propionate) + i-HBu (i-Butyrate) + n-HBu (n-Butyrate); SMP (Soluble product) = TVFA + EtOH (Ethanol) + BuOH (Butanol)metabolic
Fig. 4. DGGE profile of the 16S rRNA gene PCR products of genomic DNA from samples under steady-state condition at various pH values.
II
Den
atur
ed g
radi
ent
(40-
60%
)
C. intestinaleC. pasteurianum
C. intestinale
C. pasteurianum
pathway in Clostridium tyrobutyricum ATCC 25755 switched from butyrate to lactate and acetate formation when the pH was lowered from 6.3 to 5.7, and the metabolic shift was related to pH effects on the ex-pression levels of several acid-forming enzymes [21]. Similarly another study using C. tyrobutyricum JM1 also reported metabolic shift while switching the pH from 6.3 to 6, resulting in lowering biohydrogen pro-duction [22]. Parallel to our results, Cai et al. [23] found low HY at pH 7 when lactic acid was the domi-nant acid with higher ethanol production in Clostridium butyricum W5.
4. Bioreactor Variation during pH Switch
4.1. Biohydrogen production
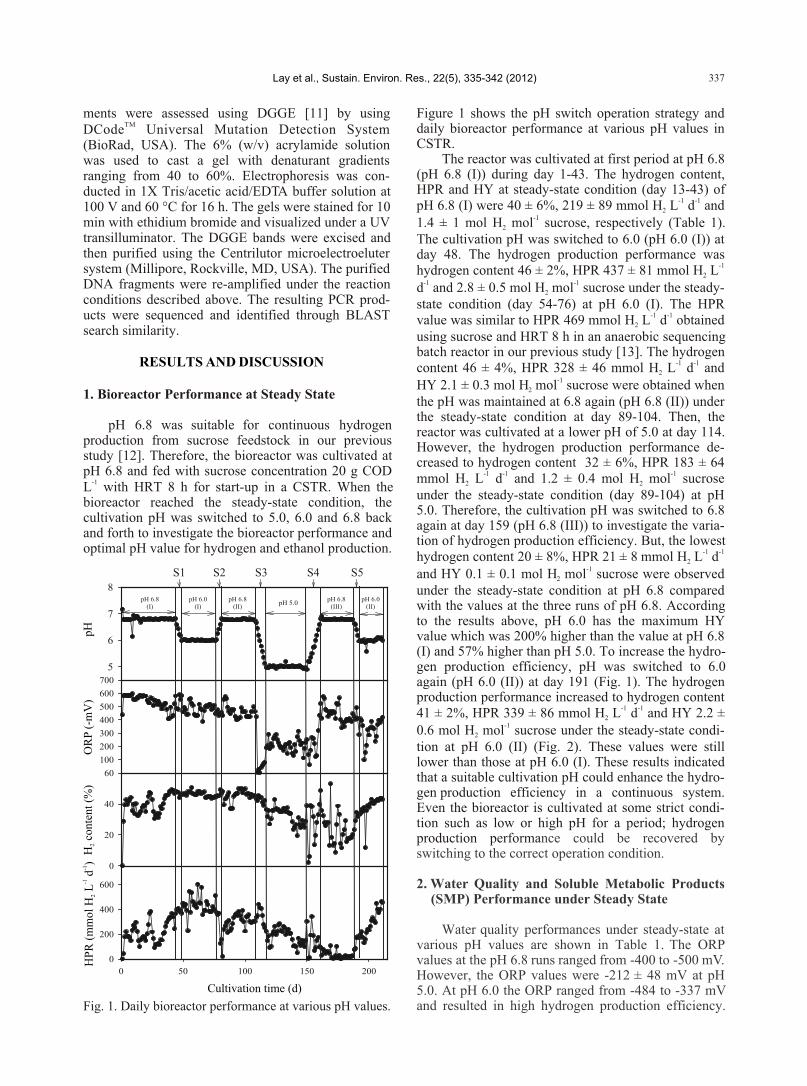
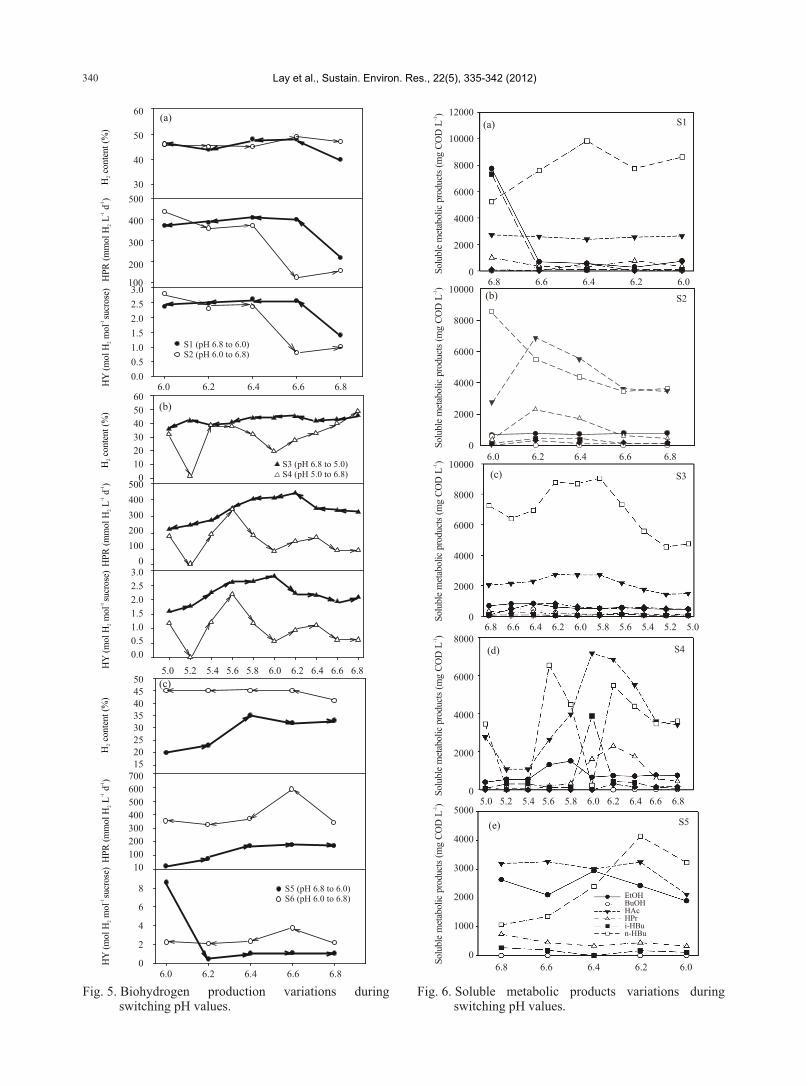
The variations of biohydrogen production and SMPs performances are shown in Figs. 5 and 6, respectively. The hydrogen content, HPR and HY were
-1 -1 -140%, 219 mmol H L d and 1.4 mol H mol sucrose, 2 2
respectively, under steady-state at pH 6.8 (I) during day 13-44. Then the cultivation pH was reduced by 0.2 of pH every 24 h with 1 N HCl beginning at day 44 and reached to pH 6.0 at day 48 (S1). Figure 5a illustrates that hydrogen content ranged from 48 to 46% and HPR value was improved from 366 to 371
-1 -1mmol H L d with HY value increasing from 2.34 to 2-12.37 mol H mol sucrose when the pH was switched 2
from 6.8 to 6.0 during day 44-48. The cultivation pH was switched back to 6.0 at day 77 with the same gradient as decreasing from 6.8 to 6.0 (S2). The hydrogen production performance could reach back tothe same level before switch (Fig. 5a). Next pH switch was from 6.8 (II) to 5.0 (S3) at day
.
.
.
.
339Lay et al., Sustain. Environ. Res., 22(5), 335-342 (2012)
i-HBu
(a)
H c
onte
nt (
%)
2H
con
tent
(%
)2
H c
onte
nt (
%)
2-1
-1H
PR
(m
mol
H L
d)
2
-1-1
HP
R (
mm
ol H
L d
)2
-1-1
HP
R (
mm
ol H
L d
)2
-1
HY
(m
ol H
mol
sucr
ose)
2
-1
HY
(m
ol H
mol
sucr
ose)
2
-1
HY
(m
ol H
mol
sucr
ose)
2
S1 (pH 6.8 to 6.0)S2 (pH 6.0 to 6.8)
S3 (pH 6.8 to 5.0)S4 (pH 5.0 to 6.8)
60
50
40
30
60
50
40
30
20
10
0
5045403530252015
500
400
300
200
100
500
400
300
200
100
0
700
600
500
400
300
200
100
10
3.0
2.5
2.0
1.5
1.0
0.5
0.0
3.0
2.5
2.0
1.5
1.0
0.5
0.0
8
6
4
2
0
6.0 6.2 6.4 6.6 6.8
5.0 5.2 5.4 5.6 5.8 6.0 6.2 6.4 6.6 6.8
6.0 6.2 6.4 6.6 6.8
S5 (pH 6.8 to 6.0)S6 (pH 6.0 to 6.8)
(b)
(c)
Fig. 5. Biohydrogen production variations during switching pH values.
Fig. 6. Soluble metabolic products variations during switching pH values.
-1S
olub
le m
etab
olic
pro
duct
s (m
g C
OD
L)
-1S
olub
le m
etab
olic
pro
duct
s (m
g C
OD
L)
-1S
olub
le m
etab
olic
pro
duct
s (m
g C
OD
L)
-1S
olub
le m
etab
olic
pro
duct
s (m
g C
OD
L)
-1S
olub
le m
etab
olic
pro
duct
s (m
g C
OD
L)
340
12000
10000
8000
6000
4000
2000
0
10000
8000
6000
4000
2000
0
10000
8000
6000
4000
2000
0
8000
6000
4000
2000
0
5000
4000
3000
2000
1000
06.8 6.6 6.4 6.2 6.0
5.0 5.2 5.4 5.6 5.8 6.0 6.2 6.4 6.6 6.8
(a)
(b)
(d)
(e)
(c)
6.8 6.6 6.4 6.2 6.0 5.8 5.6 5.4 5.2 5.0
6.0 6.2 6.4 6.6 6.8
EtOHBuOHHAcHPri-HBun-HBu
S1
S2
S3
S4
S5
6.8 6.6 6.4 6.2 6.0
Lay et al., Sustain. Environ. Res., 22(5), 335-342 (2012)

105 with the same strategy used in S1 (6.8 (I) 6.0). Figure 5b shows that hydrogen content dropped down to 36% and HPR and HY values during S3 were 31 and 23% less compared with the values at the final day of pH 6.8 (II). After 36 d cultivation, pH was switched back to pH 6.8 again (S4). The hydrogen production performance decreased rapidly while pH was increased to 5.2. Foam formation was noted in the bioreactor and hydrogen accumulated at pH 5.4. The hydrogen con-tent restored to similar value as in pH 6.8 (II). How-ever, the HPR and HY values were much lower thanvalues of the switches S3 and S4. Figure 5c shows that hydrogen content, HPR and
-1HY increased from 20 to 33%, 25 to 171 mmol H L 2-1 -1d and 0.16 to 1.09 mol H mol sucrose when the pH 2
was switched to 6.0 which had peak hydrogen produc-tion efficiency during day 188-191. After 21 d cultiva-tion at 6.0, the hydrogen production performance had obvious improvement (Fig. 5c). The variations of hy-drogen content, HPR and HY during these switching periods of pH 6.8 (II) pH 6.0 (II) (S5) and pH 6.0
-1 -1(II) pH 6.8 (S6) were 25%, 332 mmol H L d and 2-11.4 mol H mol sucrose, respectively (Fig. 5c). It in-2
dicated that hydrogen production efficiency could be enhanced after a suitable pH operation.
4.2. SMP and water quality performance at steady state
Figures 6a and 6b illustrated that the SMP varia-tions at S1 (pH 6.8 (I) pH 6.0) and S2 (pH 6.0 pH 6.8 (II)) respectively. The results showed that the concentrations of ethanol, propionate and valerate were reduced from 7743 to 722, 991 to 331 and 69 to 16 mg
-1COD L , respectively. Acetate concentration had no -1remarkable variation (2715-2627 mg COD L ) and
-1butyrate increased from 5230 to 8622 mg COD L in S1. While pH was switched from 6.0 to 6.8 in S2, ethanol concentration increased slightly from 645 to
-1761 mg COD L with other SMP concentrations re-duced. Especially i-butyrate had significant reduction
-1(from 3880 to 85 mg COD L ) (Fig. 6b). During S1 and S2, n-butyrate decrease was along with pH reduc-tion. Similar result was reported in our previous study using glucose to produce hydrogen [24]. The SMP variation as pH switched between 6.8 and 5.0 (S3 and S4) is shown in Figs. 6c and 6d. n-Butyrate, acetate and butanol concentrations had significant reduction which were decreased from 10405 to 4740, from 3280 to 1507 and 211 to 37 mg
-1COD L respectively at S3 (Fig. 6c). When the pH was increased to 6.8 from 5.0 at S4, the concentrations of ethanol, propionate and i-butyrate were increased and acetate and n-butyrate were decreased (Fig. 6d). During S3 and S4, n-butyrate concentration had posi-tive relationship with pH. Figure 6e shows that n-butyrate concentration increased from 1065 to 3229
-1mg COD L and ethanol and acetate concentrations increased first then decreased in S5 (pH 6.8 (III) pH 6.0 (I)).
.
.
.
.
.
CONCLUSIONS
In this study the effect of pH switch during CSTR operation on biohydrogen production performance was investigated, and the results showed hydrogen content
-1 -146%, HPR 437 mmol H L d and HY 2.8 mol H 2 2-1mol sucrose at pH 6.0 (I). At pH 6.8 (I) it was found
that ethanol production was high with a value of 7743 -1mg COD L . PCR-DGGE analysis showed prominence
of Clostridium sp. in the fermenter in all the experi-mental pH conditions, but their richness decreased during the pH shift. This study demonstrates that switching the pH between 6 and 6.8 could be a new strategy to produce hydrogen and ethanol at optimum efficiency in the same fermenter. .
ACKNOWLEDGEMENTS
The authors gratefully acknowledge the financial support by Taiwan's Bureau of Energy (grant no. 101-D0204-3), Taiwan's National Science Council (NSC-99-2221-E-035-025-MY3, NSC-99-2632-E-035-001-MY3, NSC-101-2218-E-035-003-MY3) and Feng Chia University (FCU-10G27101). .
REFERENCES
Lay, C.H., H.C. Lin, B. Sen, C.Y. Chu and C.Y. Lin, Simultaneous hydrogen and ethanol production from sweet potato via dark fermentation. J. Clean. Prod., 27, 155-164 (2012).Chuang, Y.S., C.C. Chen, C.H. Lay, I.Y. Sung, J.S. Wu, S.C. Lee, B. Sen and C.Y. Lin, Optimization of incubation factors for fermentative hydrogen production from agricultural wastes. Sustain. Environ. Res., 22(2), 99-106 (2012). Wu, S.Y., C.H. Hung, C.N. Lin, H.W. Chen, A.S. Lee and J.S. Chang, Fermentative hydrogen production and bacterial community structure in high-rate anaerobic bioreactors containing silicone-immobilized and self-flocculated sludge. Biotechnol. Bioeng., 93(5), 934-946 (2006). Gao, W.J.J., H.J. Lin, K.T. Leung and B.Q. Liao, Influence of elevated pH shocks on the performance of a submerged anaerobic membrane bioreactor. Process Biochem., 45(8), 1279-1287 (2010). Lin, C.Y., C.H. Lay, B. Sen, C.Y. Chu, G. Kumar, C.C. Chen and J.S. Chang, Fermentative hydrogen production from wastewaters: A review and prognosis. Int. J. Hydrogen Energ., in press (2012). Hawkes, F.R., I. Hussy, G. Kyazze, R. Dinsdale and D.L. Hawkes, Continuous dark fermentative hydrogen production by mesophilic microflora: Principles and progress. Int. J. Hydrogen Energ., 32(2), 172-184 (2007).
.
.
.
.
.
.
1.
2.
3.
4.
5.
6.
341Lay et al., Sustain. Environ. Res., 22(5), 335-342 (2012)
Li, C.L. and H.H.P. Fang, Fermentative hydrogen production from wastewater and solid wastes by mixed cultures. Crit. Rev. Env. Sci. Tec., 37(1), 1-39 (2007). Endo, G., T. Noike and J. Matsumoto, Characteristics of cellulose and glucose decomposition in acidogenic phase of anaerobic digestion. Proc. Soc. Civ. Engrs., 325, 61-68 (1982). APHA, Standard Methods for the Examination of Water and Wastewater. 19th Ed., American Public Health Association, Washington, DC (1995). Koehler, L.H., Differentiation of carbohydrates by anthrone reaction rate and color intensity. Anal. Chem., 24(10), 1576-1579 (1952). Muyzer, G., E.C. Dewaal and A.G. Uitterlinden, Profiling of complex microbial populations by denaturing gradient gel electrophoresis analysis of polymerase chain reaction-amplified genes coding for 16S rRNA. Appl. Environ. Microb., 59(3), 695-700 (1993). Lin, C.Y. and C.H. Lay, Effects of carbonate and phosphate concentrations on hydrogen production using anaerobic sewage sludge microflora. Int. J. Hydrogen Energ., 29(3), 275-281 (2004). Lin, C.Y. and C.H. Jo, Hydrogen production from sucrose using an anaerobic sequencing batch reactor process. J. Chem. Technol. Biot., 78(6), 678-684 (2003). Lay, C.H., J.H. Wu, C.L. Hsiao, J.J. Chang, C.C. Chen and C.Y. Lin, Biohydrogen production from soluble condensed molasses fermentation using anaerobic fermentation. Int. J. Hydrogen Energ., 35(24), 13445-13451 (2010). Lin, C.Y., S.Y. Wu, P.J. Lin, J.S. Chang, C.H. Hung, K.S. Lee, C.H. Lay, C.Y. Chu, C.H. Cheng, A.C. Chang, J.H. Wu, F.Y. Chang, L.H. Yang, C.W. Lee and Y.C. Lin, A pilot-scale high-rate biohydrogen production system with mixed microflora. Int. J. Hydrogen Energ., 36(14), 8758-8764 (2011). Lin, C.Y., C.Y. Lee, I.C. Tseng and I.Z. Shiao, Biohydrogen production from sucrose using base-enriched anaerobic mixed microflora. Process Biochem., 41(4), 915-919 (2006).
.
.
.
.
.
.
.
.
.
.
Wang, J.L. and W. Wan, Kinetic models for fermentative hydrogen production: A review. Int. J. Hydrogen Energ., 34(8), 3313-3323 (2009). Pattra, S., C.H. Lay, C.Y. Lin, S. O-Thong and A. Reungsang, Performance and population analysis of hydrogen production from sugarcane juice by non-sterile continuous stirred tank reactor augmented with Clostridium butyricum. Int. J. Hydrogen Energ., 36(14), 8697-8703 (2011). Lin, C.Y., C.C. Chang and C.H. Hung, Fermentative hydrogen production from starch using natural mixed cultures. Int. J. Hydrogen Energ., 33(10), 2445-2453 (2008). Chen, C.C., Y.S. Chuang, C.Y. Lin, C.H. Lay and B. Sen, Thermophilic dark fermentation of untreated rice straw using mixed cultures for hydrogen production. Int. J. Hydrogen Energ., in press (2012). Zhu, Y. and S.T. Yang, Effect of pH on metabolic pathway shift in fermentation of xylose by Clostridium tyrobutyricum. J. Biotechnol., 110(2), 143-157 (2004). Jo, J.H., D.S. Lee and J.M. Park, The effects of pH on carbon material and energy balances in hydrogen-producing Clostridium tyrobutyricum JM1. Bioresource Technol., 99(17), 8485-8491 (2008). Cai, G.Q., B. Jin, C. Saint and P. Monis, Metabolic flux analysis of hydrogen production network by Clostridium butyricum W5: Effect of pH and glucose concentrations. Int. J. Hydrogen Energ., 35(13), 6681-6690 (2010). Lin, C.Y. and R.C. Chang, Hydrogen production during the anaerobic acidogenic conversion of glucose. J. Chem. Technol. Biot., 74(6), 498-500 (1999).
.
.
.
.
.
.
.
.
Discussions of this paper may appear in the discus-sion section of a future issue. All discussions shouldbe submitted to the Editor-in-Chief within six monthsof publication. .
Manuscript Received: Revision Received:
and Accepted:
June 18, 2012July 31, 2012
August 24, 2012
7.
8.
9.
10.
11.
12.
13.
14.
15.
16.
17.
18.
19.
20.
21.
22.
23.
24.
Lay et al., Sustain. Environ. Res., 22(5), 335-342(2012)342
![Anaerobic Oxidation of Hydrogen Sulfide in Batch ... · pollution with sulfur dioxide and hydrogen sulfur gases hydrogen sulfide serve as electron donors for anaerobic [1, 2]](https://img.pdfslide.net/doc/110x75/5af1cca97f8b9ac62b9069d3/anaerobic-oxidation-of-hydrogen-sulfide-in-batch-with-sulfur-dioxide-and-hydrogen.jpg)