Embed Size (px)
Citation preview
J. Phys. Chem. 1995,99, 4577-4589 4577
Effect of Preparation Conditions of Pt Alloys on Their Electronic, Structural, and Electrocatalytic Activities for Oxygen Reduction-XRD, XAS, and Electrochemical Studies
Sanjeev Mukerjee, Supramaniam Srinivasan, and Manuel P. Soriaga Center for Electrochemical Systems and Hydrogen Research, Texas Engineering Experiment Station and Department of Chemistry, Texas A&M University, College Station, Texas 77843-3402
James McBreen* Material Science Division, Department of Applied Science, Brookhaven National Laboratory, Upton, New York 11973
Received: June 4, 1994; In Final Form: December 21, 1994@
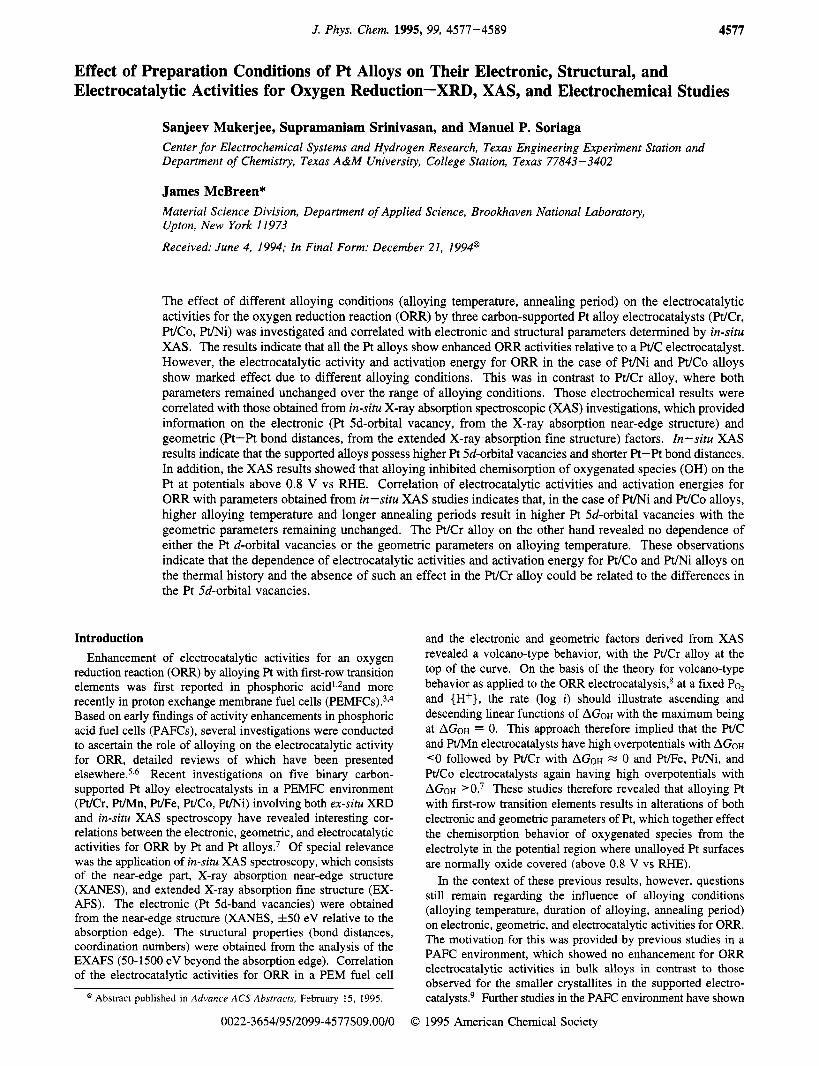
The effect of different alloying conditions (alloying temperature, annealing period) on the electrocatalytic activities for the oxygen reduction reaction (ORR) by three carbon-supported Pt alloy electrocatalysts (WCr, WCo, m i ) was investigated and correlated with electronic and structural parameters determined by in-situ XAS. The results indicate that all the Pt alloys show enhanced ORR activities relative to a W C electrocatalyst. However, the electrocatalytic activity and activation energy for ORR in the case of Pt/Ni and Pt/Co alloys show marked effect due to different alloying conditions. This was in contrast to W C r alloy, where both parameters remained unchanged over the range of alloying conditions. Those electrochemical results were correlated with those obtained from in-situ X-ray absorption spectroscopic (XAS) investigations, which provided information on the electronic (Pt 5d-orbital vacancy, from the X-ray absorption near-edge structure) and geometric (Pt-Pt bond distances, from the extended X-ray absorption fine structure) factors. In-situ XAS results indicate that the supported alloys possess higher Pt Sd-orbital vacancies and shorter Pt-Pt bond distances. In addition, the XAS results showed that alloying inhibited chemisorption of oxygenated species (OH) on the Pt at potentials above 0.8 V vs RHE. Correlation of electrocatalytic activities and activation energies for ORR with parameters obtained from in-situ XAS studies indicates that, in the case of mi and Pt/Co alloys, higher alloying temperature and longer annealing periods result in higher Pt 5d-orbital vacancies with the geometric parameters remaining unchanged. The W C r alloy on the other hand revealed no dependence of either the Pt d-orbital vacancies or the geometric parameters on alloying temperature. These observations indicate that the dependence of electrocatalytic activities and activation energy for Pt/Co and Pt/Ni alloys on the thermal history and the absence of such an effect in the W C r alloy could be related to the differences in the Pt Sd-orbital vacancies.
Introduction Enhancement of electrocatalytic activities for an oxygen
reduction reaction (ORR) by alloying Pt with first-row transition elements was first reported in phosphoric acid'&nd more recently in proton exchange membrane fuel cells (PEMFCS).~.~ Based on early findings of activity enhancements in phosphoric acid fuel cells (PAFCs), several investigations were conducted to ascertain the role of alloying on the electrocatalytic activity for ORR, detailed reviews of which have been presented e l~ewhere .~ .~ Recent investigations on five binary carbon- supported Pt alloy electrocatalysts in a PEMFC environment (WCr, Pt/Mn, Pt/Fe, WCo, Pt/Ni) involving both ex-situ XRD and in-situ XAS spectroscopy have revealed interesting cor- relations between the electronic, geometric, and electrocatalytic activities for ORR by Pt and Pt alloys.' Of special relevance was the application of in-situ XAS spectroscopy, which consists of the near-edge part, X-ray absorption near-edge structure (XANES), and extended X-ray absorption fine structure (EX- AFS). The electronic (Pt 5d-band vacancies) were obtained from the near-edge structure (XANES, f 5 0 eV relative to the absorption edge). The structural properties (bond distances, coordination numbers) were obtained from the analysis of the EXAFS (50-1500 eV beyond the absorption edge). Correlation of the electrocatalytic activities for ORR in a PEM fuel cell
@ Abstract published in Advance ACS Abstracts, February 15, 1995.
0022-365419512099-4577$09.00/0
and the electronic and geometric factors derived from XAS revealed a volcano-type behavior, with the WCr alloy at the top of the curve. On the basis of the theory for volcano-type behavior as applied to the ORR electrocatalysis,S at a fixed Po2 and {H+>, the rate (log i ) should illustrate ascending and descending linear functions of AGOH with the maximum being at AGOH = 0. This approach therefore implied that the W C and Pt/Mn electrocatalysts have high overpotentials with AGOH <O followed by WCr with AGOH x 0 and P e e , Pt/Ni, and Pt/Co electrocatalysts again having high overpotentials with AGOH >0.7 These studies therefore revealed that alloying Pt with first-row transition elements results in alterations of both electronic and geometric parameters of Pt, which together effect the chemisorption behavior of oxygenated species from the electrolyte in the potential region where unalloyed Pt surfaces are normally oxide covered (above 0.8 V vs RHE).
In the context of these previous results, however, questions still remain regarding the influence of alloying conditions (alloying temperature, duration of alloying, annealing period) on electronic, geometric, and electrocatalytic activities for ORR. The motivation for this was provided by previous studies in a PAFC environment, which showed no enhancement for ORR electrocatalytic activities in bulk alloys in contrast to those observed for the smaller crystallites in the supported electro- catalysts? Further studies in the PAFC environment have shown
0 1995 American Chemical Society
4578 J. Phys. Chem., Vol. 99, No. 13, 1995
the bulk alloys to be unstable in terms of the dissolution/ corrosion of the first-row transition alloying In contrast, the supported alloy electrocatalysts have shown very high stabilities in terms of retaining the nonnoble alloying element during long periods (6000-9000 h) of operation in PAFCs'* and more recently in PEMFCS.~
This investigation presents a study of carbon-supported Pt and three selected Pt alloy electrocatalysts (Pt/Cr, Pt/Co, Pt/ Ni) prepared using different alloying conditions (alloying temperature, annealing period). Correlation is made between the electrocatalytic activities for ORR in a PEMFCs environment and the electronic and geometric parameters of Pt derived from ex-situ XRD and in-situ XAS analysis. The primary aim is to present explanations of the presence or absence of differences in the electrocatalytic activities of the Pt alloys prepared using different alloying conditions and correlate the observed results with the properties unique to small crystallites of the supported electrocatalysts.
Mukerjee et al.
5% by weight, in a mixture of lower alcohols, Aldrich Chemical Co.) by a brushing technique to extend the three-dimensional reaction zone for ORR. This was followed by air-drying at 80 "C and weighing to ensure a Nafion loading of -0.6 mg/cm2. Finally the electrodes were hot pressed to the membrane at 1000 psig pressure and 150-155 "C for 90 s. This temperature was chosen because it is close to the glass transition temperature of both the membranes.
Assembly of Single Cells and Electrochemical Charac- terization. The membrane and electrode assembly (MEA) was incorporated in a single cell test fixture. Details of the single cell test fixture, PEMFC test station, and methods to obtain the optimum humidification conditions are given elsewhere.*O Comparisons of the electrocatalytic activities for ORR were made by measurement of the cell and half-cell potentials at 5 atm and 95 "C with the oxygen and hydrogen gases being humidified at 100 and 105 "C. Similar measurements were then made at several temperatures and pressures for the determination of activation energy and reaction order for the oxygen reduction reaction. The temperature variations (35-80 "C) were carried out at a nominal constant pressure of 1.33 atm. The pressure variations (1-5 atm) were similarly carried out at a constant temperature of 70 "C.
The cyclic voltammetry experiment was carried out with argon flowing through the working electrode (cathode, oxygen electrode) and hydrogen through the counter electrode compart- ment. The electrodes were initially subjected to potential cycling (50 times) at 25 mV/s. The cyclic voltammogram (CV) was then recorded in order to determine the electrochemically active surface area. The potential was scanned between 120 mV and 1 V vs RHE, and sweep rates in the range 10-50 mV/s were used with the cell operating conditions of 95 "C and 5 atm pressure. For the measurement of the Coulombic charge due to hydrogen adsorption or desorption, lower sweep rates are preferred in order to minimize the pseudo-transmission-line effects in the porous electrode. The electrochemically active surface area of the electrode was obtained from the charge required for hydrogen desorption from the Pt surface in the electrocatalyst.
X-ray Diffraction. The characteristics of the crystalline structure of supported W C and binary Pt alloys (formation of superlattices, etc.) were determined from powder X-ray dif- fraction technique (XRD). The data were obtained using a Sintag automated diffractometer with a Cu K a radiation source. The powdered electrocatalyst samples were kept in a 2.5 x 2.5 cm x 1 mm quartz block. The powders were pressed onto the quartz block using a glass slide, so as to obtain a uniform distribution. The diffractometer was interfaced with a PDP 11/ 23 computer for data analysis and plotting. The 213 Bragg angles were scanned over a range of 0-80". The diffraction pattems were recorded and analyzed by comparison with standard powder diffraction data such as the JCPDS powder diffraction pattems (NIST). All the powder diffraction patterns were obtained by using an intemal standard of A1 powders [20 pm spherical particles, AESER (Johnson Matthey)] for calibration of X-ray diffraction line positions and for particle size estima- tions.
In-Situ XANES and EXAFS Investigations. The X-ray absorption spectroscopic measurements were carried out at the National Synchrotron Light Source (NSLS), Brookhaven Na- tional Laboratory (BNL), using the beam line X23-A2 belonging to the National Institute of Science and Technology (NIST). The monochromator used was a two-crystal (Si (31 1)) upwardly reflecting fixed exit Golovchenko-Cowan design with an energy resolution (AE/E) of 2 x The in-situ X-ray
Experimental Section
Electrocatalysts, Electrodes, and Preparation of Mem- brane Electrode Assembly. WCr, WCo, and WNi alloy electrocatalysts supported on high surface area carbon (Vulcan XC-72, Cabot Corp.) were procured from ETEK Inc. (Framing- ham, MA) and Johnson Matthey Inc. (West Deptford, NJ). For comparison, a conventional carbon-supported Pt (WC) elec- trocatalyst, from ETEK Inc., was used. All the electrocatalysts contained a metal loading of 20 wt % on carbon support, as used in PEMFCs, based on previous investigation^.'^^'^
The alloying conditions for the ETEK alloys involved a temperature of 900 "C and an annealing period of 12 h under an inert atmosphere (Ar). The Johnson Matthey (JMRC) alloys were alloyed at a higher temperature of 950 "C and were annealed for a longer period of 15 h under an inert atmosphere (Ar). The duration of alloying in both ETEK and JMRC alloys was 1 h. All the alloy electrocatalysts contained approximately 80-90% Pt by weight or an atom percent ratio of 75:25 for Pt and the alloying element. The primary motivation for these choices was based on the WCr,I5 WNi,'6-'8 and W C O " ~ ' ~ phase diagrams, which pointed to the possibility of forming intermedi- ate crystalline alloys with fcc cubic lattice of Pt3M type (where M denotes the Cr, Ni, and Co alloying element). The porous gas diffusion electrodes, prepared with these electrocatalysts, contained 40% PTFE and had a Pt loading of 0.3 mg/cm2 (confirmed by atomic absorption spectrometry).
Two types of proton exchange membranes were used in this investigation, namely, Dow membrane (XUS 13204.10 devel- opmental fuel cell membrane, Dow Chemical Co.) and Asahi membrane (Aciplex-S 1004, Asahi Chemical Co.). All electro- chemical characterizations on ETEK electrodes in the PEM half- cell environment were obtained with Dow membranes. The Johnson Matthey electrodes were, however, tested using the Asahi membranes. In previous studies from our laborat~ries, '~ it was demonstrated that the performances of PEMFCs with Dow and Asahi membranes are practically identical up to current densities of 1 A/cm2. Above this current density, there are differences in performance due to differences in the mass transport characteristics of protons and/or of water molecules within the temperature. The membranes were pretreated ac- cording to procedures described e l s e ~ h e r e . ~ , ~ . ' ~ . ~ ~ The primary purpose of the pretreatment was to remove organic and metallic impurities from the membrane by heating in aqueous solutions
As described in previous c o m m u n i ~ a t i o n s , ~ ~ ~ ~ ' ~ ~ ~ ~ the elec- trodes were impregnated with Nafion solution (Nafion 1100,
of H202 and H2S04.
Effect of Preparation Conditions on Activities
absorption spectroscopic (XAS) studies on the Pt and Pt alloy electrocatalysts were conducted in both transmission and fluorescence modes using an electrochemical cell and data acquisition setup described in detail elsewhere.'-*' The cell comprised of plexiglass end plates with windows for passing the X-ray beam and contained channels for incorporation of a calomel reference electrode with a built in Luggin capillary in contact with the working electrode (WC or the binary Pt alloy electrodes). The saturated calomel reference electrode contained a special arrangement of a double Nafion salt bridge in order to avoid chloride contamination. The anode and cathode compartments were separated using an electrolyte barrier comprised of Nafion 117 (DuPont) proton exchange membrane. The anode was an uncatalyzed carbon electrode so as to avoid any interference in the transmitted working electrode signal. The test electrodes were prepared by a vacuum table paper making technique2' and contained 12 wt % PTFE binder. Since XAS is a bulk-averaging technique, it is difficult to analyze the data when the element of interest is present in more than one chemical form or phase. This can be a major problem in a PEM cell if all the catalyst is not in the same state. To ensure a uniform electrochemical environment for the catalyst, XAS measurements were done in 1 M HC104 with the electrodes in the flooded mode. Like the PEM, is an acid with a nonabsorbing anion.7 Previous tests had shown that, once anion absorption is eliminated as a factor, the XAS data can be directly correlated with the catalyst behavior in a PEM celL7 This arrangement also allowed the use of thicker samples and a greater signal to noise ratio in the XAS data. Prior to fabrication of these electrodes, the WC and binary Pt alloy electrocatalysts were soaked in 1 M HC104 to remove any residual oxides and unalloyed first-row transition metal elements. The WCr alloys were also soaked in 2 M KOH. This yielded a yellow solution indicating the presence of chromium oxides. To ensure complete wetting of the catalyst, all electrodes were soaked in 1 M HC104 (the test electrolyte) for 24 h prior to XAS analysis. The electrodes were formulated to yield an absorption length, px e 1 at the Pt L3 edge. In most cases, this yielded adequate step heights for XAS measurements at the respective transition metal element K edges in the transmission mode. Only in the case of Cr was it necessary to resort to measurement in the fluorescence mode.
The potential control for the in-situ XAS measurements was carried out using a potentiostat (Stonehart Associates, Model BC-1200) and a function generator (Princeton Applied Research Model PAR-175). XAS data were first recorded at the Pt L3 and L2 edges and then at the K edge of the respective alloying element. The measurements were made at the open circuit potential and at potentials of -0.24,0.0,0.3, and 0.6 V vs SCE (or 0.0, 0.24, 0.54, and 0.84 V vs RHE). The potential was changed from one value to the next at a sweep rate of 1 mV/s. The K-edge XAS measurements for the alloying element were also carried out at 0.9 V vs SCE (1.14 V vs RHE) to check for its stability. (Unless otherwise stated, all electrode potentials are quoted vs the potential of a reversible hydrogen electrode.) Detailed XANES and EXAFS analysis was carried out only at potentials of 0.54 and 0.84 V vs RHE, the primary motivation being the fact that the former potential is in the double-layer region where there is minimal interference due to hydrogen, oxygen, or ionic ad~orption.~ Thus, the electronic and geometric parameters obtained at this potential using the Pt L3 edge XAS data should reflect those due to Pt on the carbon-supported Pt and Pt alloy electrocatalyst. The potential at 0.84 V on the other hand is in the region where there is adsorption of an
J. Phys. Chem., Vol. 99, No. 13, 1995 4579
oxygenated species (hydroxyl) on the unalloyed Pt surface and lies in the activation-controlled region of the oxygen reduction reaction.
Results and Discussion
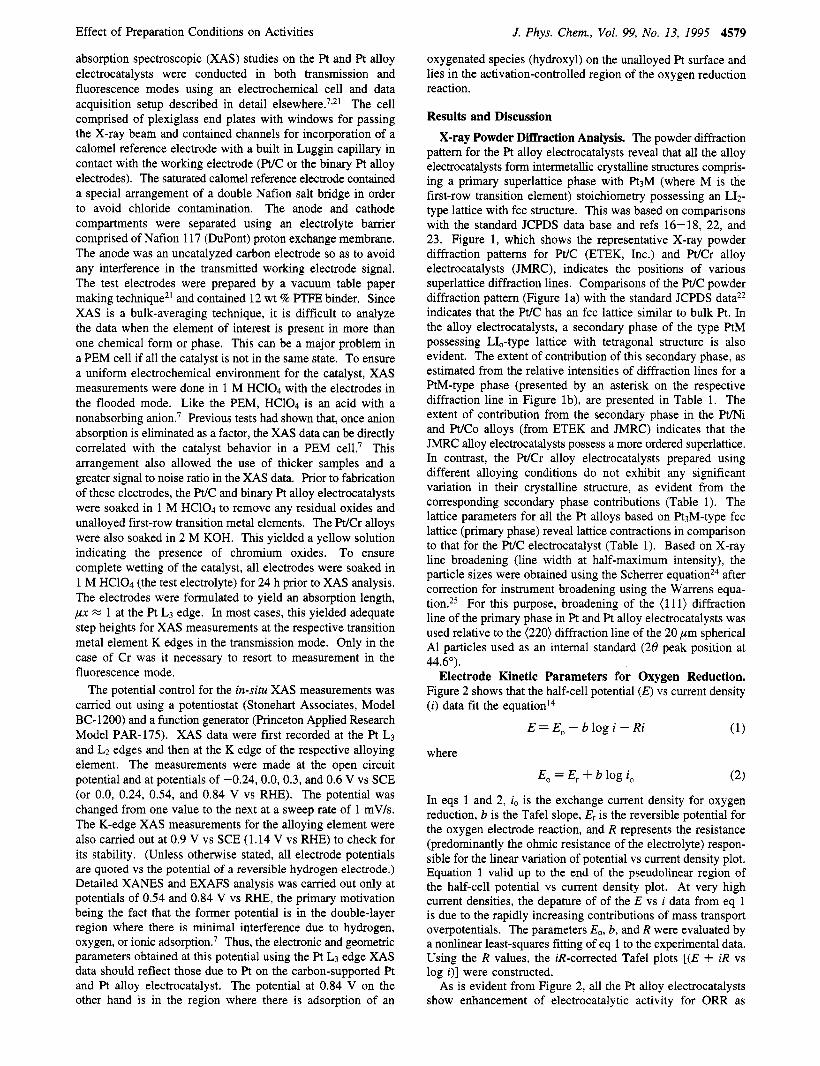
X-ray Powder Diffraction Analysis. The powder diffraction pattern for the Pt alloy electrocatalysts reveal that all the alloy electrocatalysts form intermetallic crystalline structures compris- ing a primary superlattice phase with Pt3M (where M is the first-row transition element) stoichiometry possessing an LI2- type lattice with fcc structure. This was based on comparisons with the standard JCPDS data base and refs 16-18, 22, and 23. Figure 1, which shows the representative X-ray powder diffraction patterns for Pt/C (ETEK, Inc.) and WCr alloy electrocatalysts (JMRC), indicates the positions of various superlattice diffraction lines. Comparisons of the W C powder diffraction pattern (Figure la) with the standard JCPDS data22 indicates that the W C has an fcc lattice similar to bulk Pt. In the alloy electrocatalysts, a secondary phase of the type PtM possessing LL-type lattice with tetragonal structure is also evident. The extent of contribution of this secondary phase, as estimated from the relative intensities of diffraction lines for a PtM-type phase (presented by an asterisk on the respective diffraction line in Figure lb), are presented in Table 1. The extent of contribution from the secondary phase in the Pt/Ni and WCo alloys (from ETEK and JMRC) indicates that the JMRC alloy electrocatalysts possess a more ordered superlattice. In contrast, the WCr alloy electrocatalysts prepared using different alloying conditions do not exhibit any significant variation in their crystalline structure, as evident from the corresponding secondary phase contributions (Table 1). The lattice parameters for all the Pt alloys based on Pt3M-type fcc lattice (primary phase) reveal lattice contractions in comparison to that for the Pt/C electrocatalyst (Table 1). Based on X-ray line broadening (line width at half-maximum intensity), the particle sizes were obtained using the Scherrer equation24 after correction for instrument broadening using the Warrens equa- t i ~ n . * ~ For this purpose, broadening of the (1 l l) diffraction line of the primary phase in Pt and Pt alloy electrocatalysts was used relative to the (220) diffraction line of the 20 pm spherical A1 particles used as an internal standard (28 peak position at 44.6').
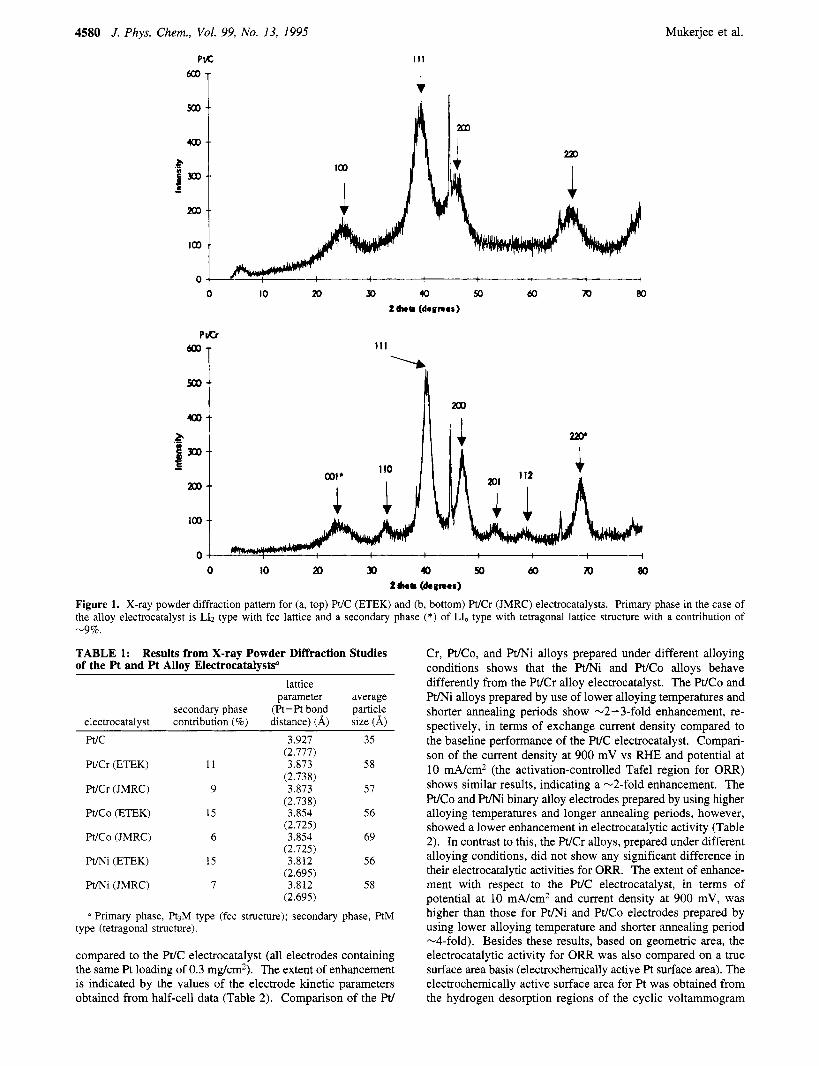
Electrode Kinetic Parameters for Oxygen Reduction. Figure 2 shows that the half-cell potential ( E ) vs current density ( i ) data fit the equationI4
(1) E = E, - blog i - Ri
where
E, = E, + b log io
In eqs 1 and 2, io is the exchange current density for oxygen reduction, b is the Tafel slope, E, is the reversible potential for the oxygen electrode reaction, and R represents the resistance (predominantly the ohmic resistance of the electrolyte) respon- sible for the linear variation of potential vs current density plot. Equation 1 valid up to the end of the pseudolinear region of the half-cell potential vs current density plot. At very high current densities, the depature of of the E vs i data from eq 1 is due to the rapidly increasing contributions of mass transport overpotentials. The parameters E,, b, and R were evaluated by a nonlinear least-squares fitting of eq 1 to the experimental data. Using the R values, the iR-corrected Tafel plots [ ( E + iR vs log i)] were constructed.
As is evident from Figure 2, all the Pt alloy electrocatalysts show enhancement of electrocatalytic activity for ORR as
4580 J. Phys. Chem., Vol. 99, No. 13, 1995
PK
" T
0
Mukerjee et al.
0 IO x ) 30 40 so 00 m 80 2 bwm (degner)
111
0 IO a0 30 4 50 do 70 80 2 he8 (depnrr)
Figure 1. X-ray powder diffraction pattem for (a, top) W C (ETEK) and (b, bottom) Pt/Cr (JMRC) electrocatalysts. Primary phase in the case of the alloy electrocatalyst is LI2 type with fcc lattice and a secondary phase (*) of LI, type with tetragonal lattice structure with a contribution of -9%.
TABLE 1: Results from X-ray Powder Diffraction Studies of the Pt and Pt Alloy ElectrocatalysW
lattice parameter average
secondary phase (Pt-Pt bond particle electrocatalyst contribution (%) distance) (A) size (A) Pt/C 3.927 35
PUCK (ETEK) 11 3.873 58
Pt/Cr (JMRC) 9 3.873 57
(2.777)
(2.738)
(2.738)
(2.725)
(2.725)
(2.695)
(2.695)
WCo (ETEK) 15 3.854 56
W C o (JMRC) 6 3.854 69
Pt/Ni (ETEK) 15 3.812 56
Pt/Ni (JMRC) 7 3.812 58
a Primary phase, R3M type (fcc structure); secondary phase, PtM type (tetragonal structure).
compared to the Pt/C electrocatalyst (all electrodes containing the same Pt loading of 0.3 mg/cm2). The extent of enhancement is indicated by the values of the electrode kinetic parameters obtained from half-cell data (Table 2) . Comparison of the W
Cr, WCo, and m i alloys prepared under different alloying conditions shows that the Pt/Ni and WCo alloys behave differently from the Pt/Cr alloy electrocatalyst. The WCo and F " i alloys prepared by use of lower alloying temperatures and shorter annealing periods show -2-3-fold enhancement, re- spectively, in terms of exchange current density compared to the baseline performance of the Pt/C electrocatalyst. Compari- son of the current density at 900 mV vs RHE and potential at 10 mA/cm2 (the activation-controlled Tafel region for ORR) shows similar results, indicating a -2-fold enhancement. The W C o and F" i binary alloy electrodes prepared by using higher alloying temperatures and longer annealing periods, however, showed a lower enhancement in electrocatalytic activity (Table 2). In contrast to this, the WCr alloys, prepared under different alloying conditions, did not show any significant difference in their electrocatalytic activities for ORR. The extent of enhance- ment with respect to the Pt/C electrocatalyst, in terms of potential at 10 mA/cm2 and current density at 900 mV, was higher than those for Pt/Ni and WCo electrodes prepared by using lower alloying temperature and shorter annealing period -4-fold). Besides these results, based on geometric area, the electrocatalytic activity for ORR was also compared on a true surface area basis (electrochemically active Pt surface area). The electrochemically active surface area for Pt was obtained from the hydrogen desorption regions of the cyclic voltammogram
Effect of Preparation Conditions on Activities J. Phys. Chem., Vol. 99, No. 13, I995 4581
TABLE 2: Electrode Kinetic Parameters for Oxygen Reduction in Proton Exchange Membrane Fuel Cells at 95 "C and 5 atm Pressure Usine Pt and Pt AUov ElectrocatalvsW
E O b R io (lo4) immv EIO,,,N~,,,~ roughness i,b ( 105) iPWmVb electrocatalyst (mV) (mV/decade) (52 cm2) (mA/cm2) (mA/cm2) (mV) factor (cmZ/cm2) (mA/cm2) (mA/cm2) WC 982 63 0.14 3.46 22.1 915 61 0.56 0.36 WCr (ETEK) 997 62 0.10 5.6 76.4 949 48 1.16 1.09 WCr (JMRC) 1005 62 0.09 7.15 83.8 95 1 50 1.43 1.67 WCo (ETEK) 1007 65 0.09 10.7 45.9 941 56 1.90 0.85 WCo (JMRC) 990 65 0.11 5.87 37.2 935 49 1.19 0.76 Pt/Ni (ETEK) 1009 66 0.10 12.5 47.6 947 51 2.45 0.93 F"i(JMRC) 988 64 0.11 4.86 26.4 924 48 1.01 0.5.5
Pt Loading in Electrodes, 0.3 mg/cm2. Normalized with respect to the roughness factor.
0.95
W
5 0.90 ui > 5 - Q .a 5 0.85 c
B
0.80
L I I
10 100 1000
Current Density, mNcmZ Figure 2. iR-corrected Tafel plots for oxygen reduction in proton exchange membrane fuel cells at 95 'C and 5 atm pressure for Pt and Pt alloy electrocatalysts. Pt loading on electrodes 0.3 mg/cm2. Pt/Co, ETEK (0); WCo, JMRC (0); Pt/Ni, ETEK (0); Pt/Ni, JMRC (W); WCr, ETEK (0); WCr, JMRC (+); WC (A).
for all the electrodes. The extent of contribution of the alloying element to the values of the roughness factors was, however, difficult to ascertain and was assumed to be negligible. The Coulombic charge for the adsorption of molecular hydrogen (area under the anodic peak minus the double-layer charge at 0.4 V vs RHE) was used to evaluate the roughness factor of the electrode, assuming a value of 220 pC/cm2 for the oxidation of atomic hydrogen on a smooth Pt surface. The values of roughness factors for the electrodes (Table 2 ) show that the electrodes with the Pt alloy electrocatalysts have slightly lower values than those for the W C electrocatalyst. This result is in agreement with bigger particle sizes of the carbon-supported Pt alloys as compared to the Pt/C electrocatalyst (Table 1). The enhanced electrocatalytic activities exhibited by the alloys could therefore be primarily due to differences in the electronic and structural characteristics of the Pt atom caused by alloying. Thus, based on the real surface areas of the electrodes, the Pt alloys exhibit an even higher enhancement in electrocatalytic activity for ORR than on the Pt/C electrocatalyst.
Effect of Temperature and Pressure on Electrode Kinetic Parameters. The Tafel kinetic parameters [exchange current density (i,), potential at 10 mA/cm2 ( E l 0 , , , ~ ~ ~ 2 ) , current density at 900 mV (i"~)] were obtained from iR-corrected Tafel plots as a function of temperature (35-80 "C) for Pt and Pt alloy electrocatalysts. The activation energies for ORR, obtained from the slopes of the Arrhenius-type plots (log immv vs l/Z'), show that the Pt alloys are lower than (Table 3) the W C electrocata- lyst. The activation energy value determined for the WC
TABLE 3: Activation Energies and Reaction Orders for Oxygen Reduction for Pt and Pt Alloy Electrocatalysts in a Proton Exchange Membrane Fuel Cell
Pt/C 62.17 0.96 0.95 Pt/Cr (ETEK) 28.72 1.08 1.25 WCr (JMRC) 27.63 0.97 0.89 WCo (ETEK) 23.74 0.77 0.85 WCo (JMRC) 35.44 0.80 0.90 Pt/Ni (ETEK) 23.84 0.79 0.95 P t N (JMRC) 43.23 0.89 1.05
electrocatalyst was comparable to those determined earlier in a PEM environment.26 Arrhenius analysis using exchange current densities (io) instead of immv values also gave similar results; however, it is preferable to use current densities at 900 mV so as to avoid errors related to extrapolation over several decades of current density in determinations of exchange current density. These lower activation energy values can account for the enhanced electrocatalytic performance of the Pt alloys toward ORR. More importantly, the electrocatalytic activities for ORR at 95 "C and 5 atm pressure obtained for the Pt alloys prepared using different alloying conditions (Table 2) follow trends similar to their corresponding activation energies (Table 3). It therefore indicates that the lower electrocatalytic enhancement observed for the WCo and WNi alloys prepared by using higher alloying temperature and longer annealing periods can be correlated with the increased values of the activation energies. Similarly, for the Pt/Cr alloys, the invariance of the electro- catalytic activity for ORR with different alloying conditions is also reflected in their constant activation energies.
The Tafel kinetic parameters were obtained from #-corrected Tafel plots as a function of pressure (1-5 atm) for Pt and Pt alloy electrocatalysts. The reaction orders were obtained from the slopes of log i, vs log P, plots (Table 3). They indicate that all the electrocatalysts under investigation (Pt and Pt/Cr, WNi and WCo alloys prepared by different alloying conditions) have values close to unity. These values of reaction order were confirmed using the expression27
(AHA log = bnO, (3) where no2 is the reaction order for ORR rate-limiting step and b is the average Tafel slope. The values of reaction orders (Table 3) determined from the slopes of the log ElOmA/cm2 vs log Po for the Pt and Pt alloys prepared by using different alloying conditions confirm that all electrocatalysts under investigation have reaction orders close to unity. This implies that the rate-determining step of ORR remains the same in both Pt and Pt alloy electrocatalysts and is first order with respect to oxygen pressure.
In-Situ XAS Data Analysis. One of the significant aspects of XANES analysis is that it can provide important information on the Pt d-band vacancies. The d-band vacancies are derived from an analysis of the Pt L3 and L2 white lines. The respective
4582 J. Phys. Chem., Vol. 99, No. 13, 1995 Mukerjee et al.
to explain the differences in ORR electrocatalysis on Pt alloys vs Pt/C electrocatalyst.
The data analysis package used for XANES was the University of Washington data analysis program.35 The first step in the data analysis of XANES spectra involved background removal by fitting the pre-edge data to a Victoreen-type formula over a range of -200 to -40 eV relative to the edge (this range was same for all the samples, at both the alloying element and the Pt edge), followed by extrapolation over the energy range of interest and subtraction from the data. After the removal of background, the spectra were corrected for edge shifts using the second derivatives of the inflection points of data from the reference channel (5 pm Pt or alloying element reference foil). The procedures used for normalization were similar to those described by Wong et al.36 The normalization value was chosen as the absorbance at the inflection point of one of the EXAFS oscillations. The spectrum was therefore normalized by dividing each data point by the normalization value. The edge areas (Azs and A3J were calculated by numerical integration using Simpson's rule. The spectral window used for such an integration was -10 to 13 eV relative to the absorption edge. The denominator in eq 4, (A3 + 1 . 1 l A ~ ) ~ was determined following the procedure of Brown et aLz9 All the areas (AA2,
AA3, A3r, and A2r) were normalized by the X-ray cross section at the edge jump and the density of the absorbing material.37
The EXAFS data analysis involved using computer algorithms developed by Koningsberger and c o - w ~ r k e r s . ~ ~ ~ ~ ~ The EXAFS analysis involved subjecting the raw data to pre-edge subtraction (-200 to -50 eV relative to the respective element edge) using a second-order polynomial. This had the advantage of com- pensating more adequately for the contribution of the ionization chambers.38 This was followed by background removal using cubic spline functions in the energy range of 20-1500 eV relative to the Pt L3 edge and 20-1000 eV relative to the Cr, Ni, and Co K edges. The normalization of the data was then carried out by determining the height of the edge jump. The edge jump height was the difference between the extrapolated pre-edge background and the extrapolated background (in the post-edge region) at the threshold region of 50 eV above the absorption edge. The isolated EXAFS spectrum was of very high quality and did not require deglitching. The Fourier filtering and analysis of the EXAFS were conducted according to the procedure described in detail e l s e ~ h e r e . ~ , ~ ~ - ~ ~ The
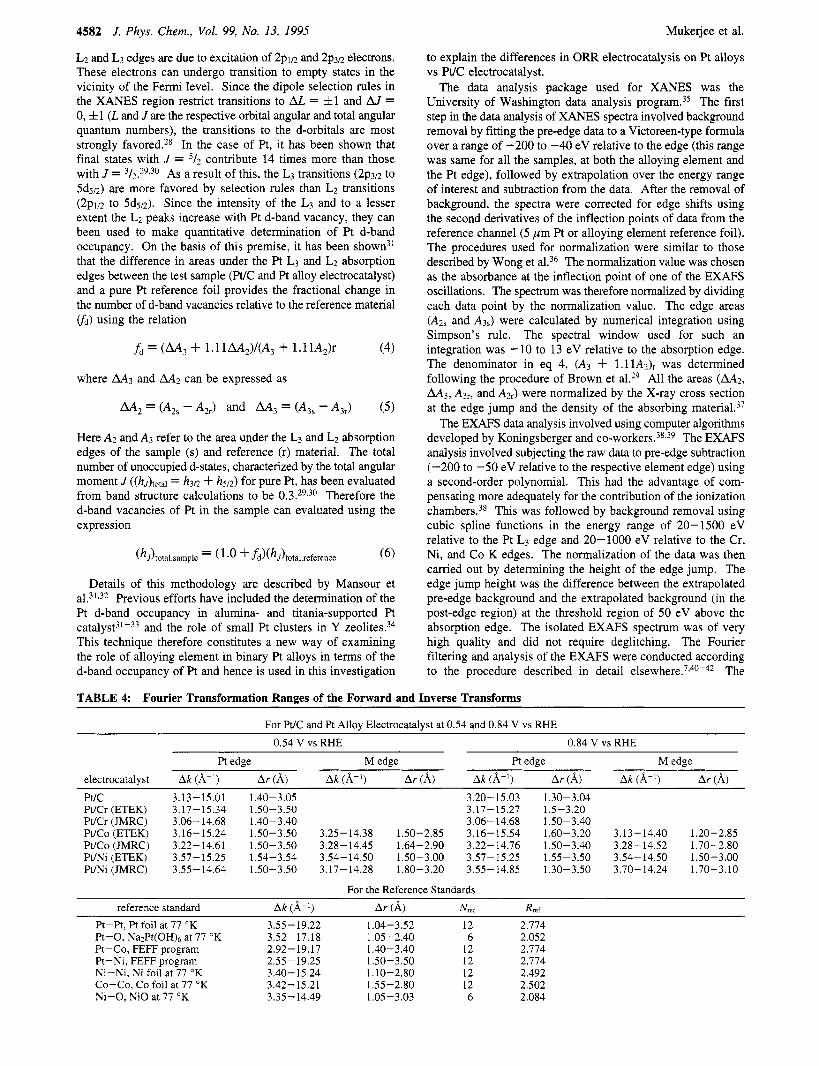
L2 and L3 edges are due to excitation of 2~112 and 2p3/2 electrons. These electrons can undergo transition to empty states in the vicinity of the Fermi level. Since the dipole selection rules in the XANES region restrict transitions to AL. = f l and AJ = 0, f 1 (L and J are the respective orbital angular and total angular quantum numbers), the transitions to the d-orbitals are most strongly favored.28 In the case of Pt, it has been shown that final states with J = 5 / 2 contribute 14 times more than those with J = 3/2.29330 As a result of this, the L3 transitions (2~312 to 5dv2) are more favored by selection rules than L2 transitions (2p1/2 to 5dw2). Since the intensity of the L3 and to a lesser extent the L2 peaks increase with Pt d-band vacancy, they can been used to make quantitative determination of Pt d-band occupancy. On the basis of this premise, it has been shown3' that the difference in areas under the Pt L3 and L2 absorption edges between the test sample (WC and Pt alloy electrocatalyst) and a pure Pt reference foil provides the fractional change in the number of d-band vacancies relative to the reference material (fd) using the relation
fd = (AA3 + l . l lAA2) / (A3 + l . l lA2)r (4)
where A A 3 and A A 2 can be expressed as
A A 2 = - and U, = (A3s - A3J ( 5 )
Here A2 and A3 refer to the area under the L3 and L2 absorption edges of the sample (s) and reference (r) material. The total number of unoccupied d-states, characterized by the total angular moment J ((hJ)total = h3/2 + hy2) for pure Pt, has been evaluated from band structure calculations to be 0.3.29330 Therefore the d-band vacancies of Pt in the sample can evaluated using the expression
Details of this methodology are described by Mansour et al.31,32 Previous efforts have included the determination of the Pt d-band occupancy in alumina- and titania-supported Pt ~ a t a l y s t ~ l - ~ ~ and the role of small Pt clusters in Y zeolites.34 This technique therefore constitutes a new way of examining the role of alloying element in binary Pt alloys in terms of the d-band occupancy of Pt and hence is used in this investigation
TABLE 4: Fourier Transformation Ranges of the Forward and Inverse Transforms
For Pt/C and Pt Alloy Electrocatalyst at 0.54 and 0.84 V vs RHE
electrocatalyst
PtJC Pt/Cr (ETEK) PVCr (JMRC) W C o (ETEK) Pt/Co (JMRC) Pt/Ni (ETEK) Pt/Ni (JMRC)
0.54 V vs RHE
Pt edge M edge
Ak (k') Ar (A) Ak (A-') Ar (A) 3.1 3 - 15 .O 1 1.40- 3.05 3.17-15.34 1.50-3.50 3.06-14.68 1.40-3.40 3.16-15.24 1.50-3.50 3.25-14.38 1.50-2.85 3.22- 14.61 1.50-3.50 3.28- 14.45 1.64-2.90 3.57-15.25 1.54-3.54 3.54-14.50 1.50-3.00 3.55-14.64 1.50-3.50 3.17-14.28 1.80-3.20
0.84 V vs RHE
Pt edge M edge
Ak (kl) Ar (A) Ak (A-') Ar (A) 3.20-15.03 1.30-3.04 3.17-15.27 1.5-3.20 3.06- 14.68 1.50-3.40 3.16- 15.54 1.60-3.20 3.13- 14.40 1.20-2.85 3.22-14.76 1.50-3.40 3.28-14.52 1.70-2.80 3.57-15.25 1.55-3.50 3.54-14.50 1.50-3.00 3.55-14.85 1.30-3.50 3.70-14.24 1.70-3.10
For the Reference Standards
Pt-Pt, Pt foil at 77 "K 3.55-19.22 1.04-3.52 12 2.774 Pt-0, Na2Pt(OH)6 at 77 "K 3.52- 17.18 1.05-2.40 6 2.052 Pt-Co, FEFF program 2.92- 19.17 1.40-3.40 12 2.774 Pt-Ni, FEFF program 2.55-19.25 1.50-3.50 12 2.774 Ni-Ni, Ni foil at 77 OK 3.40-15.24 1.10-2.80 12 2.492 Co-Co, Co foil at 77 OK 3.42-15.21 1.55-2.80 12 2.502 Ni-0, NiO at 77 O K 3.35-14.49 1.05 -3.03 6 2.084
Effect of Reparation Conditions on Activities J. Phys. Chem., Vol. 99, No. 13, 1995 4583
-10 0 10 20 30
Energy Relative to the Pt & Edge ( I 1564 eV)
1.2
C
k
! P o.8
E 0.4
-10 0 10 20 30
Energy Relative to the Pt Lj Edge (11564 ev)
. B . * .
0
P P P
m
-10 0 10 20 30
Energy Relative to the Pt 4 Edge (11564 eV)
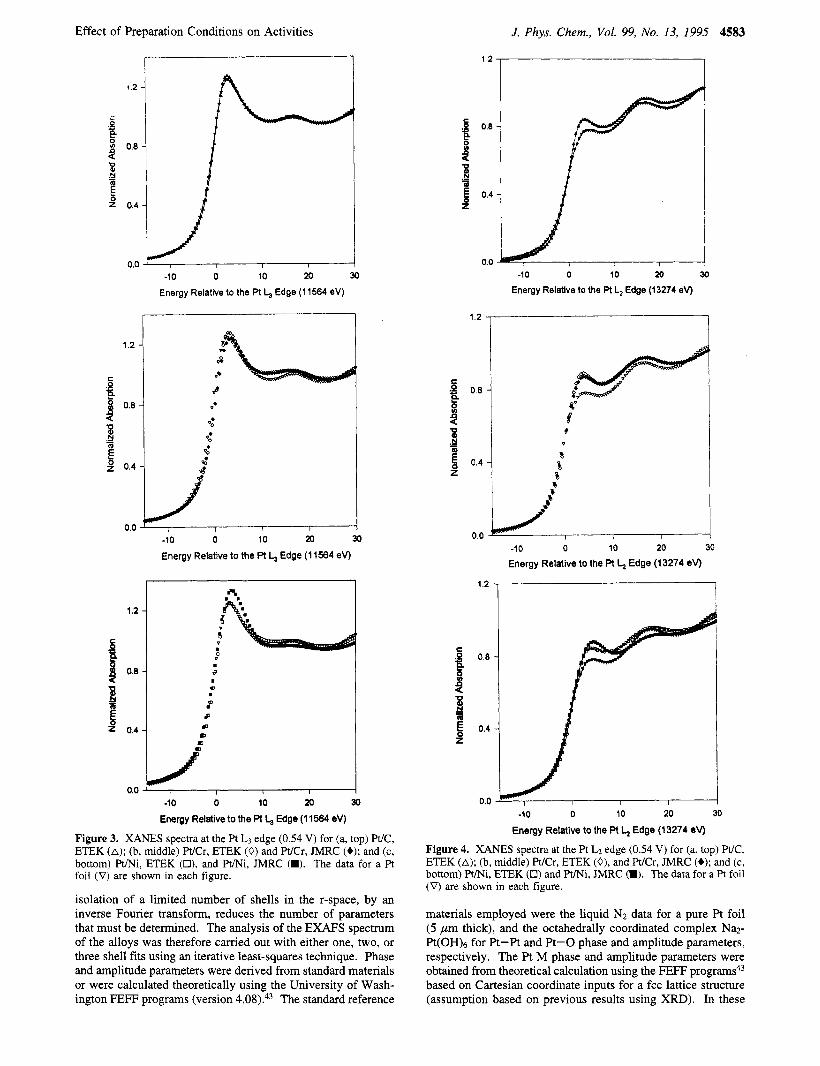
Figure 3. XANES spectra at the Pt L3 edge (0.54 V) for (a, top) Pt/C, ETEK (A); (b, middle) Pt/Cr, ETEK (0) and Pt/Cr, JMRC (+); and (c, bottom) mi, ETEK (O), and Pt/Ni, JMRC (W). The data for a Pt foil (V) are shown in each figure.
isolation of a limited number of shells in the r-space, by an inverse Fourier transform, reduces the number of parameters that must be determined. The analysis of the EXAFS spectrum of the alloys was therefore carried out with either one, two, or three shell fits using an iterative least-squares technique. Phase and amplitude parameters were derived from standard materials or were calculated theoretically using the University of Wash- ington FEW programs (version 4.08).43 The standard reference
1.2
E .Q 0.8 P 4 0 9)
.cI - 0.4 e
-1 0 0 10 20 30
Energy Relative to the Pt L, Edge (13274 ev)
-1 0 0 10 20 30
Energy Relative to the Pt L2 Edge (13274 ev)
1.2 ,
-10 0 10 20 30
Energy Relative to the Pt L2 Edge (13274 ev)
Figure 4. XANES spectra at the Pt LZ edge (0.54 V) for (a, top) Pt/C, ETEK (A); (b, middle) WCr, ETEK (0), and WCr, JMRC (+); and (c, bottom) Pt/Ni, ETEK (0) and P m i , JMRC (W). The data for a Pt foil (V) are shown in each figure.
materials employed were the liquid N2 data for a pure Pt foil (5 pm thick), and the octahedrally coordinated complex Na2- Pt(OH)6 for Pt-Pt and Pt-0 phase and amplitude parameters, respectively. The Pt M phase and amplitude parameters were obtained from theoretical calculation using the FEW programs43 based on Cartesian coordinate inputs for a fcc lattice structure (assumption based on previous results using XRD). In these
4584 J. Phys. Chem., Vol. 99, No. 13, 1995 Mukerjee et al.
TABLE 5: Analysis on Pt and Pt Alloy Electrocatalysts at 0.54 and 0.84 V vs RHE"
Comparison of Activation Energy for Oxygen Reduction with Results from the InSitu EXAFS and XANES
0.54 V vs RHE 0.84 V vs RHE Pt-Pt Pt-M -- Pt-Pt Pt-M -~
electrocatalyst AH,,, (!d/mol) ( h ~ ) ~ . , (A) N (A) N M-M(A) M-Pt(A) (hdt.* (A) N (A) N M-M (A) M-Pt (A) PtlCb 62.17 0.329 2.77 8.7 0.370 2.77 6.8 Pt/Cr (ETEK) 28.72 0.360 2.70 7.2 2.67 3.1 0.361 2.71 7.0 2.67 3.2 Pt/Cr (JMRC) 27.63 0.360 2.71 8.5 2.69 2.8 0.358 2.71 8.8 2.70 2.9 PtCo (ETEK) 23.74 0.368 2.11 6.5 2.64 2.3 2.65 2.64 0.365 2.69 5.9 2.64 2.9 2.67 2.64 PtCo (JMRC) 35.44 0.401 2.68 6.9 2.63 2.5 2.63 2.51 0.390 2.68 7.6 2.63 2.3 2.64 2.50 PtNi (ETEK) 23.84 0.375 2.71 7.8 2.66 2.4 2.55 2.64 0.372 2.71 7.6 2.65 2.3 2.57 2.66 PtNi (JMRC) 42.23 0.409 2.68 9.1 2.61 2.1 2.53 2.63 0.404 2.68 9.5 2.57 3.3 2.53 2.63
a ( h ~ ) , , , Pt d-orbital vacancy per atom. N, coordination number. At 0.84 V, the Pt-0 values were N = 1.69 and R = 2.04 A. theoretical calculations, an S: value of 0.87 was used through- out. Similarly for the K-edge EXAFS analysis, the standard reference materials were the Ni and Co foil at 77 OF (liquid N2 temperature) for the Co-Co and Ni-Ni phase and amplitude parameters. The Co-Pt and Ni-Pt phase and amplitude parameters were obtained from theoretical calculations using the FEFF program43 in a manner similar to those obtained at the Pt L3 edge; the Si used in this case was 0.75. The parameters for the Ni-0 and Co-0 were obtained from the NiO standard at 77 OK. The windows in the k and r space used to obtain the forward and inverse Fourier transforms for the standards are given in Table 4.
EXAFS and XANES Analysis at the Pt Edge. Figures 3 and 4a-c show the representative plots of in-situ XANES at the Pt L3 and Lz edges at 0.54 V vs RHE for the Pt/C, Pt/Cr, and Pt/Ni alloy electrocatalysts. As evident from Figure 3a- c, the magnitudes of the Pt L3 edge white line recorded at 0.54 V (double-layer region) are greater for the alloys as compared to the Pt/C electrocatalyst. This is evident from the broadening of the Pt L3 XANES for the Pt/Ni alloy electrocatalyst prepared by using the lower alloying temperature and shorter annealing periods and a more significant increase in the white line in the case of the same alloy prepared by using higher alloying temperatures and longer annealing periods. Similar behavior was also evident for the Pt/Co alloy electrocatalysts. The magnitude of the L3 white line in the case of the WCr alloy exhibits broadening but does not show any change based on different alloying conditions. The calculated values of Pt d-band vacancies, evaluated from the areas under the Pt L3 and L2 edges (Table 5) quantitatively reflect these observations. As shown in Table 5, the value of d-orbital vacancies per atom at 0.54 V is higher for the alloys compared to the Pt/C electrocatalyst. In addition, the comparison of the Pt/Ni and Pt/Co alloys prepared by different alloying conditions indicates that the higher alloying temperature and longer annealing periods seem to further increase the Pt d-orbital vacancies per atom in the respective alloys. The corresponding values for Pt/Cr alloy prepared by using different alloying conditions do not show any change (Table 5).
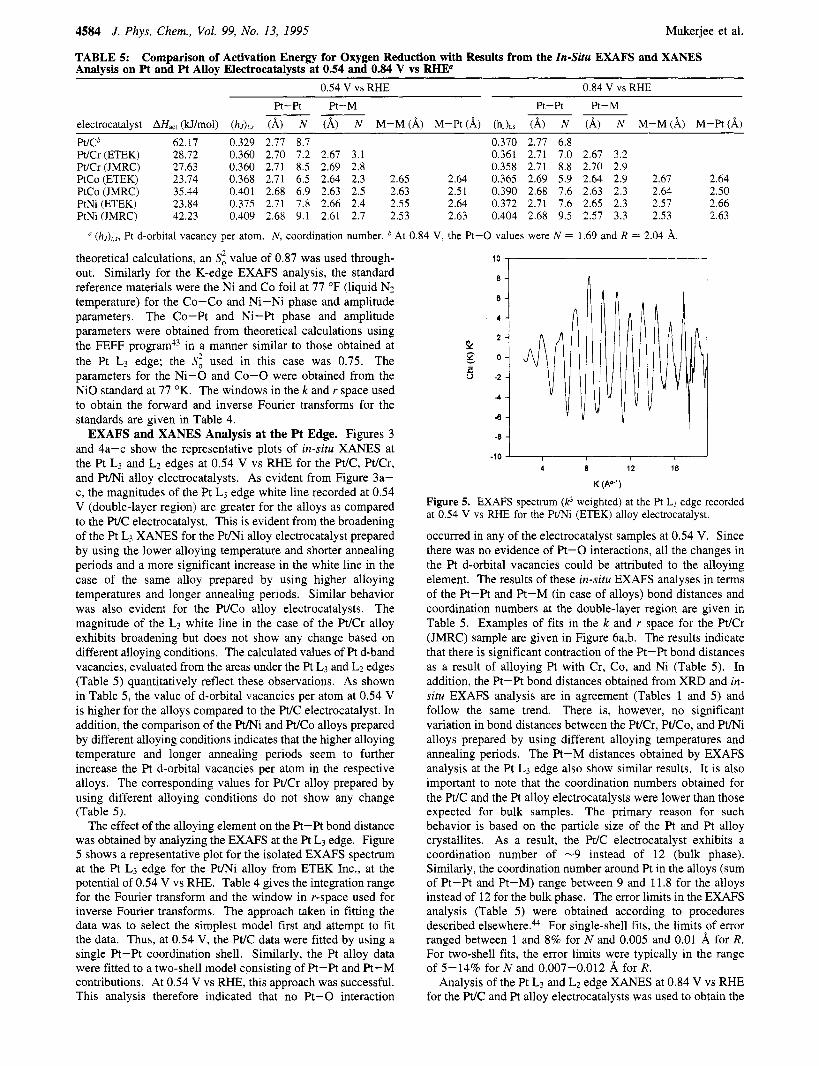
The effect of the alloying element on the Pt-Pt bond distance was obtained by analyzing the EXAFS at the Pt L3 edge. Figure 5 shows a representative plot for the isolated EXAFS spectrum at the Pt L3 edge for the Pt/Ni alloy from ETEK Inc., at the potential of 0.54 V vs RHE. Table 4 gives the integration range for the Fourier transform and the window in r-space used for inverse Fourier transforms. The approach taken in fitting the data was to select the simplest model first and attempt to fit the data. Thus, at 0.54 V, the Pt/C data were fitted by using a single Pt-Pt coordination shell. Similarly, the Pt alloy data were fitted to a two-shell model consisting of Pt-Pt and Pt-M contributions. At 0.54 V vs RHE, this approach was successful. This analysis therefore indicated that no Pt-0 interaction
lo I I '1 4 A
-10 4 4 8 12 16
K (Ao-')
Figure 5. EXAFS spectrum (k3 weighted) at the Pt L3 edge recorded at 0.54 V vs RHE for the F " i (ETEK) alloy electrocatalyst.
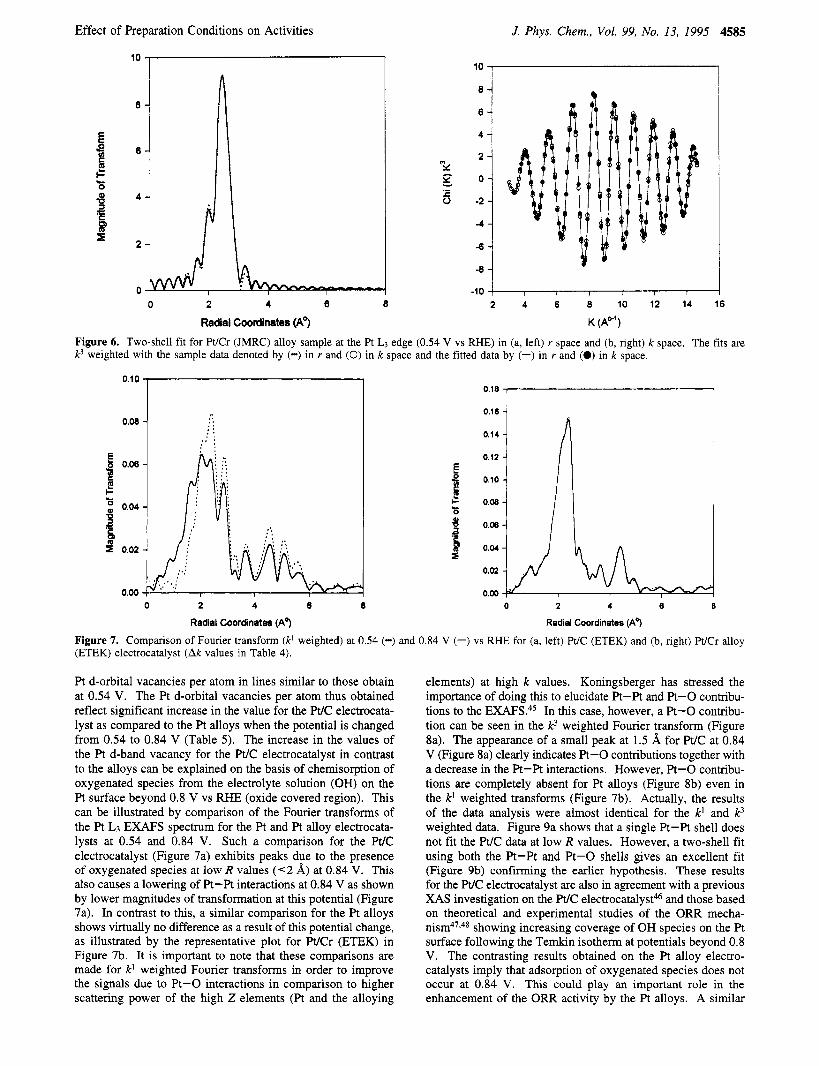
occurred in any of the electrocatalyst samples at 0.54 V. Since there was no evidence of Pt-0 interactions, all the changes in the Pt d-orbital vacancies could be attributed to the alloying element. The results of these in-situ EXAFS analyses in terms of the Pt-Pt and Pt-M (in case of alloys) bond distances and coordination numbers at the double-layer region are given in Table 5. Examples of fits in the k and r space for the Pt/Cr (JMRC) sample are given in Figure 6a,b. The results indicate that there is significant contraction of the Pt-Pt bond distances as a result of alloying Pt with Cr, Co, and Ni (Table 5). In addition, the Pt-Pt bond distances obtained from XRD and in- situ EXAFS analysis are in agreement (Tables 1 and 5) and follow the same trend. There is, however, no significant variation in bond distances between the Pt/Cr, Pt/Co, and Pt/Ni alloys prepared by using different alloying temperatures and annealing periods. The Pt-M distances obtained by EXAFS analysis at the Pt L3 edge also show similar results. It is also important to note that the coordination numbers obtained for the W C and the Pt alloy electrocatalysts were lower than those expected for bulk samples. The primary reason for such behavior is based on the particle size of the Pt and Pt alloy crystallites. As a result, the Pt/C electrocatalyst exhibits a coordination number of -9 instead of 12 (bulk phase). Similarly, the coordination number around Pt in the alloys (sum of Pt-Pt and Pt-M) range between 9 and 11.8 for the alloys instead of 12 for the bulk phase. The error limits in the EXAFS analysis (Table 5) were obtained according to procedures described elsewhere.& For single-shell fits, the limits of error ranged between 1 and 8% for Nand 0.005 and 0.01 %, for R. For two-shell fits, the error limits were typically in the range of 5-14% for N and 0.007-0.012 8, for R.
Analysis of the Pt L3 and Lz edge XANES at 0.84 V vs RHE for the Pt/C and Pt alloy electrocatalysts was used to obtain the
Effect of Preparation Conditions on Activities
10
e
€ $ 6 E E
$ = 2
0
4 4
P
0.14 4
J. Phys. Chem., Vol. 99, No. 13, 1995
/!
4585
0.14 -
0.12 - 0.10 - 0.08 - 0.08 -
6 -
4 -
2 - "y Y, O - E 0 -2 -
-4 - a -
0.12 - 0.10 - 0.08 - 0.08 -
0 2 4 6 6 2 4 6 8 10 12 14 16
Radial Coordinates (A? K (A*')
Figure 6. Two-shell fit for Pt/Cr (JMRC) alloy sample at the Pt LJ edge (0.54 V vs RHE) in (a, left) r space and (b, right) k space. The fits are k3 weighted with the sample data denoted by (-) in r and (0) in k space and the fitted data by (-) in r and (0) in k space.
0.10
0.08
E 8 0.06 % f u-
0.04
?i 3 0.02
0.00 0 2 4 6 8
Radial Coordinate8 (A")
0.18 0.18 1-
0 2 4 8 8
Radial Coordinates (A")
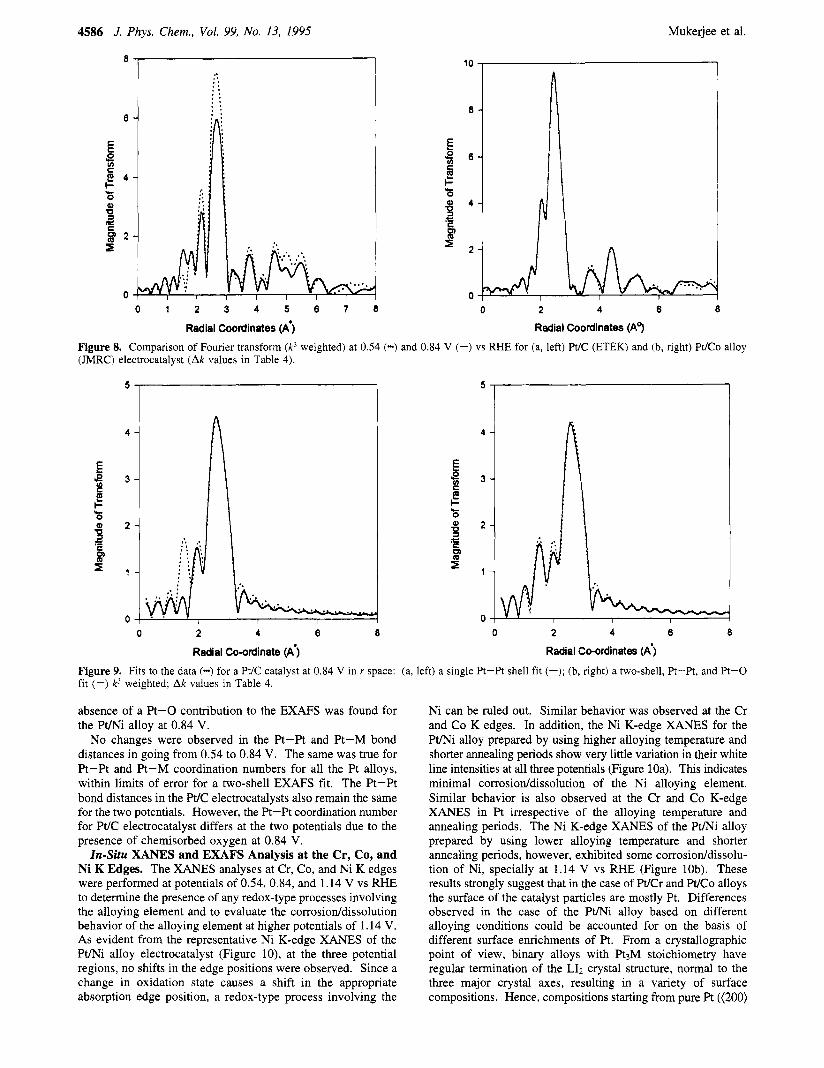
Figure 7. Comparison of Fourier transform (k' weighted) at 0.54 (-) and 0.84 V (-) vs RHE for (a, left) Pt/C (ETEK) and (b, right) WCr alloy (ETEK) electrocatalyst (Ak values in Table 4).
Pt d-orbital vacancies per atom in lines similar to those obtain at 0.54 V. The Pt d-orbital vacancies per atom thus obtained reflect significant increase in the value for the W C electrocata- lyst as compared to the Pt alloys when the potential is changed from 0.54 to 0.84 V (Table 5). The increase in the values of the Pt d-band vacancy for the Pt/C electrocatalyst in contrast to the alloys can be explained on the basis of chemisorption of oxygenated species from the electrolyte solution (OH) on the Pt surface beyond 0.8 V vs RHE (oxide covered region). This can be illustrated by comparison of the Fourier transforms of the Pt L3 EXAFS spectrum for the Pt and Pt alloy electrocata- lysts at 0.54 and 0.84 V. Such a comparison for the W C electrocatalyst (Figure 7a) exhibits peaks due to the presence of oxygenated species at low R values ( < 2 A) at 0.84 V. This also causes a lowering of Pt-Pt interactions at 0.84 V as shown by lower magnitudes of transformation at this potential (Figure 7a). In contrast to this, a similar comparison for the Pt alloys shows virtually no difference as a result of this potential change, as illustrated by the representative plot for WCr (ETEK) in Figure 7b. It is important to note that these comparisons are made for k' weighted Fourier transforms in order to improve the signals due to Pt-0 interactions in comparison to higher scattering power of the high Z elements (Pt and the alloying
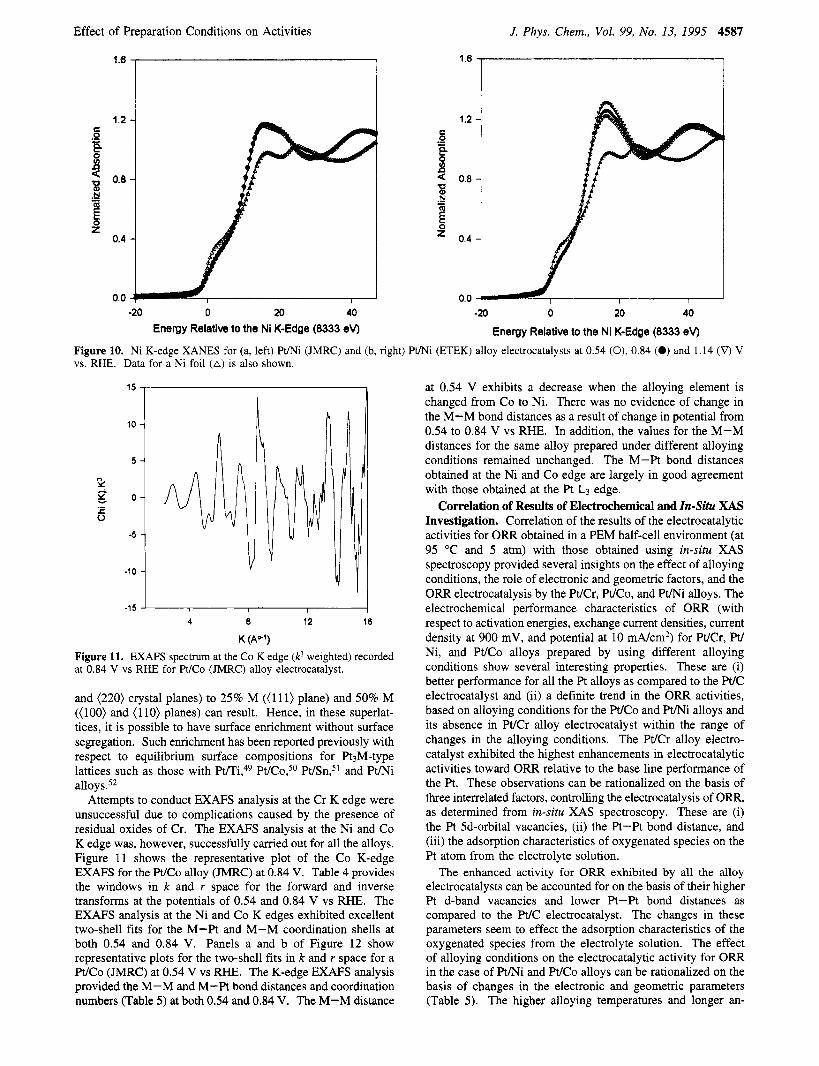
elements) at high k values. Koningsberger has stressed the importance of doing this to elucidate Pt-Pt and Pt-0 contribu- tions to the EXAFS.45 In this case, however, a Pt-0 contribu- tion can be seen in the k3 weighted Fourier transform (Figure 8a). The appearance of a small peak at 1.5 8, for W C at 0.84 V (Figure 8a) clearly indicates Pt-0 contributions together with a decrease in the Pt-Pt interactions. However, Pt-0 contribu- tions are completely absent for Pt alloys (Figure 8b) even in the k' weighted transforms (Figure 7b). Actually, the results of the data analysis were almost identical for the k' and k3 weighted data. Figure 9a shows that a single Pt-Pt shell does not fit the W C data at low R values. However, a two-shell fit using both the Pt-Pt and Pt-0 shells gives an excellent fit (Figure 9b) confirming the earlier hypothesis. These results for the WC electrocatalyst are also in agreement with a previous XAS investigation on the W C electr~catalyst~~ and those based on theoretical and experimental studies of the ORR mecha- nism47,48 showing increasing coverage of OH species on the Pt surface following the Temkin isotherm at potentials beyond 0.8 V. The contrasting results obtained on the Pt alloy electro- catalysts imply that adsorption of oxygenated species does not occur at 0.84 V. This could play an important role in the enhancement of the ORR activity by the Pt alloys. A similar
4586 J. Phys. Chem., Vol. 99, No. 13, 1995 Mukerjee et al.
0 , I
I ,. * :
0
E
t s 6
E E
0
g 4 .- E
8 = 2
0 0 1 2 3 4 5 6 7 8 0 2 4 6 6
Radial Coordinates (A') Figure 8. Comparison of Fourier transform (k3 weighted) at 0.54 (-) and 0.84 V (-) vs RHE for (a, left) Pt/C (ETEK) and (b, right) Pt/Co alloy (JMRC) electrocatalyst (Ak values in Table 4).
Radial Coordinates (A?
E 3 .- ti
I- 0 Q
C
5
0 2 4 6 0
Radial Co-ordinate (A')
5
4
E g 3
5 t a
0 2 4 6 0
Radial Co-ordinates (A')
Figure 9. Fits to the data (-) for a Pt/C catalyst at 0.84 V in r space: (a, left) a single Pt-Pt shell fit (-); (b, right) a two-shell, Pt-Pt, and Pt-0 fit (-) k3 weighted; Ak values in Table 4.
absence of a Pt-0 contribution to the EXAFS was found for the P t N alloy at 0.84 V.
No changes were observed in the Pt-Pt and Pt-M bond distances in going from 0.54 to 0.84 V. The same was true for Pt-Pt and Pt-M coordination numbers for all the Pt alloys, within limits of error for a two-shell EXAFS fit. The Pt-Pt bond distances in the Pt/C electrocatalysts also remain the same for the two potentials. However, the Pt-Pt coordination number for Pt/C electrocatalyst differs at the two potentials due to the presence of chemisorbed oxygen at 0.84 V.
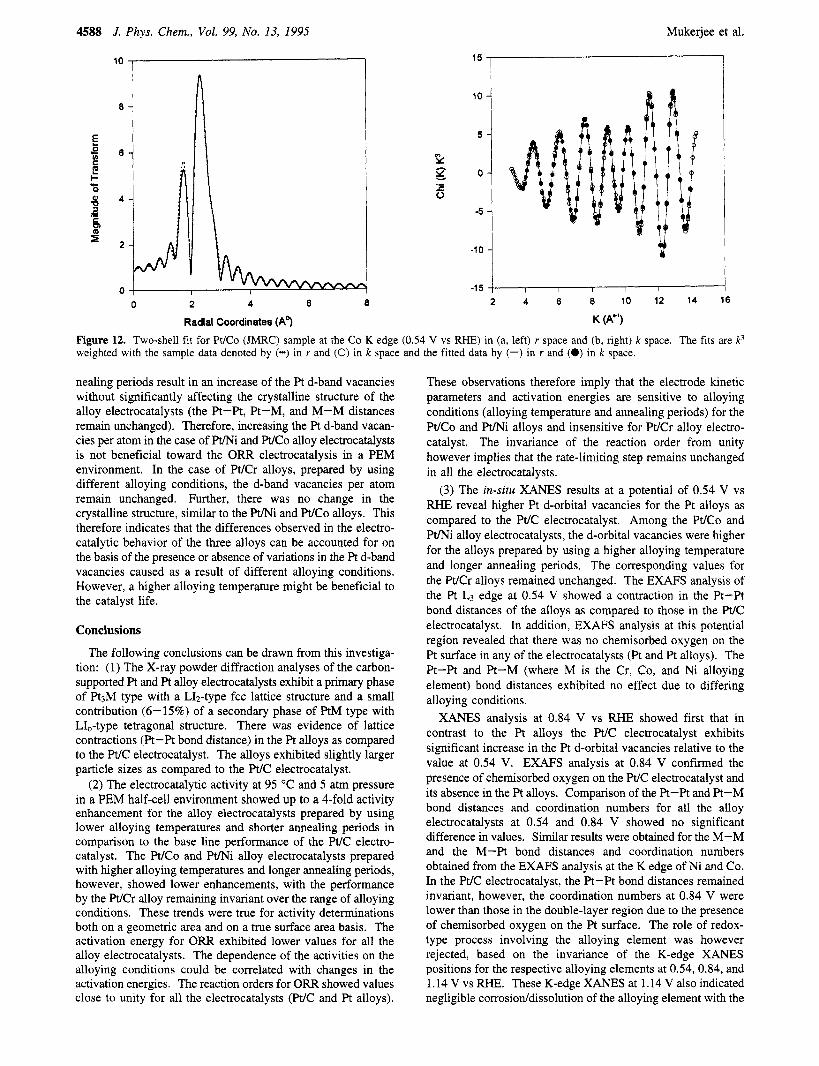
In-Situ XANES and EXAFS Analysis at the Cr, Co, and Ni K Edges. The XANES analyses at Cr, Co, and Ni K edges were performed at potentials of 0.54, 0.84, and 1.14 V vs RHE to determine the presence of any redox-type processes involving the alloying element and to evaluate the corrosioddissolution behavior of the alloying element at higher potentials of 1.14 V. As evident from the representative Ni K-edge XANES of the Pt/Ni alloy electrocatalyst (Figure lo), at the three potential regions, no shifts in the edge positions were observed. Since a change in oxidation state causes a shift in the appropriate absorption edge position, a redox-type process involving the
Ni can be ruled out. Similar behavior was observed at the Cr and Co K edges. In addition, the Ni K-edge XANES for the Pt/Ni alloy prepared by using higher alloying temperature and shorter annealing periods show very little variation in their white line intensities at all three potentials (Figure loa). This indicates minimal corrosioddissolution of the Ni alloying element. Similar behavior is also observed at the Cr and Co K-edge XANES in Pt irrespective of the alloying temperature and annealing periods. The Ni K-edge XANES of the Pt/Ni alloy prepared by using lower alloying temperature and shorter annealing periods, however, exhibited some corrosioddissolu- tion of Ni, specially at 1.14 V vs RHE (Figure lob). These results strongly suggest that in the case of WCr and WCo alloys the surface of the catalyst particles are mostly Pt. Differences observed in the case of the Pt/Ni alloy based on different alloying conditions could be accounted for on the basis of different surface enrichments of Pt. From a crystallographic point of view, binary alloys with Pt3M stoichiometry have regular termination of the LIZ crystal structure, normal to the three major crystal axes, resulting in a variety of surface compositions. Hence, compositions starting from pure Pt ((200)
Effect of Preparation Conditions on Activities
1.6 ,
10 -
5 -
0 -
-5 -
-10 -
-20 0 20 40
Energy Relative to the Ni K-Edge (8333 ev)
J. Phys. Chem., Vol. 99, No. 13, 1995 4587
I -I -20 0 20 40
0.0
Energy Relative to the Ni K-Edge (8333 ev)
Figure 10. Ni K-edge XANES for (a, left) Pt/Ni (JMRC) and (b, right) Pt/Ni (ETEK) alloy electrocatalysts at 0.54 (0), 0.84 (0) and 1.14 (V) V vs. RHE. Data for a Ni foil (A) is also shown.
"y g E u
15 I 1
-15 ' I I I
4 8 12 16
K (A*')
Figure 11. EXAFS spectrum at the Co Kedge (k3 weighted) recorded at 0.84 V vs RHE for WCo (JMRC) alloy electrocatalyst.
and (220) crystal planes) to 25% M (( 11 1) plane) and 50% M (( 100) and (1 10) planes) can result. Hence, in these superlat- tices, it is possible to have surface enrichment without surface segregation. Such enrichment has been reported previously with respect to equilibrium surface compositions for Pt3M-type lattices such as those with Pt1Ti,4~ P~/CO,~O Pt/Sn,5' and Pt/Ni alloys.52
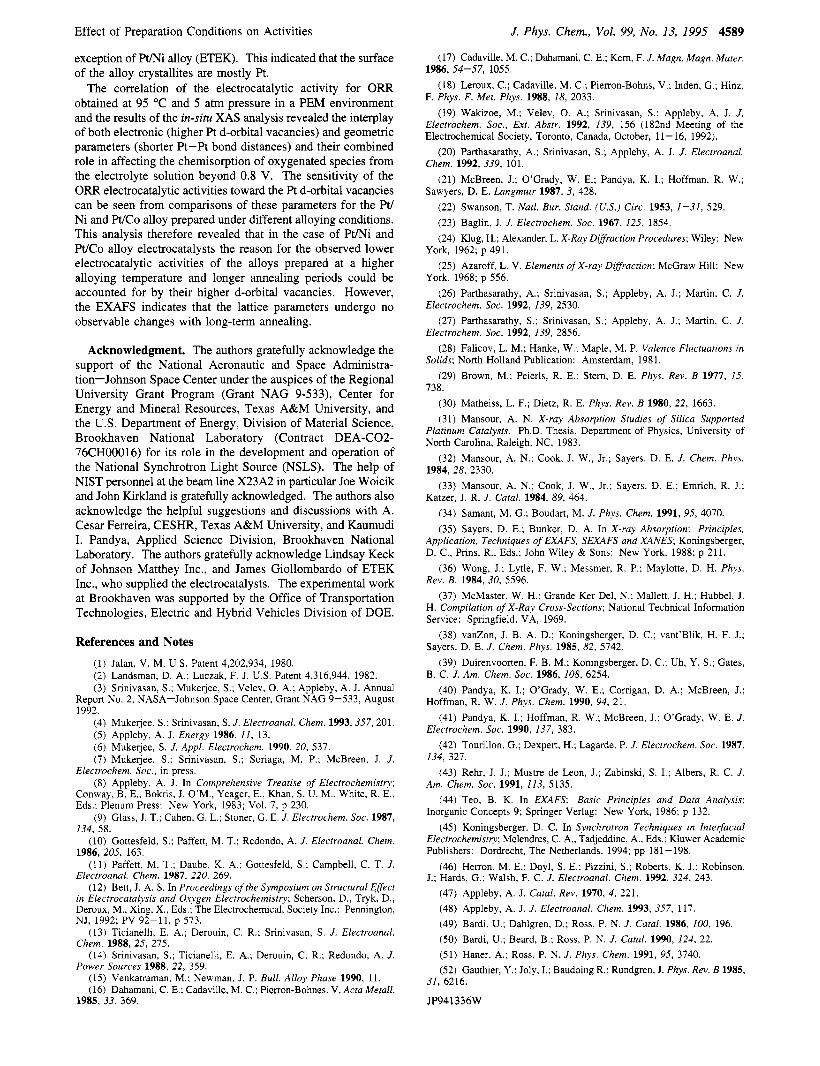
Attempts to conduct EXAFS analysis at the Cr K edge were unsuccessful due to complications caused by the presence of residual oxides of Cr. The EXAFS analysis at the Ni and Co K edge was, however, successfully carried out for all the alloys. Figure 11 shows the representative plot of the Co K-edge EXAFS for the W C o alloy (JMRC) at 0.84 V. Table 4 provides the windows in k and r space for the forward and inverse transforms at the potentials of 0.54 and 0.84 V vs RHE. The EXAFS analysis at the Ni and Co K edges exhibited excellent two-shell fits for the M-Pt and M-M coordination shells at both 0.54 and 0.84 V. Panels a and b of Figure 12 show representative plots for the two-shell fits in k and r space for a WCo (JMRC) at 0.54 V vs RHE. The K-edge EXAFS analysis provided the M-M and M-Pt bond distances and coordination numbers (Table 5) at both 0.54 and 0.84 V. The M-M distance
at 0.54 V exhibits a decrease when the alloying element is changed from Co to Ni. There was no evidence of change in the M-M bond distances as a result of change in potential from 0.54 to 0.84 V vs RHE. In addition, the values for the M-M distances for the same alloy prepared under different alloying conditions remained unchanged. The M-Pt bond distances obtained at the Ni and Co edge are largely in good agreement with those obtained at the Pt L3 edge.
Correlation of Results of Electrochemical and In-Situ XAS Investigation. Correlation of the results of the electrocatalytic activities for ORR obtained in a PEM half-cell environment (at 95 "C and 5 atm) with those obtained using in-situ XAS spectroscopy provided several insights on the effect of alloying conditions, the role of electronic and geometric factors, and the ORR electrocatalysis by the Pt/Cr, Pt/Co, and Pt/Ni alloys. The electrochemical performance characteristics of ORR (with respect to activation energies, exchange current densities, current density at 900 mV, and potential at 10 mA/cm2) for Pt/Cr, Pt/ Ni, and Pt/Co alloys prepared by using different alloying conditions show several interesting properties. These are (i) better performance for all the Pt alloys as compared to the W C electrocatalyst and (ii) a definite trend in the ORR activities, based on alloying conditions for the PtfCo and WNi alloys and its absence in Pt/Cr alloy electrocatalyst within the range of changes in the alloying conditions. The Pt/Cr alloy electro- catalyst exhibited the highest enhancements in electrocatalytic activities toward ORR relative to the base line performance of the Pt. These observations can be rationalized on the basis of three interrelated factors, controlling the electrocatalysis of ORR, as determined from in-situ XAS spectroscopy. These are (i) the Pt 5d-orbital vacancies, (ii) the Pt-Pt bond distance, and (iii) the adsorption characteristics of oxygenated species on the Pt atom from the electrolyte solution.
The enhanced activity for ORR exhibited by all the alloy electrocatalysts can be accounted for on the basis of their higher Pt d-band vacancies and lower Pt-Pt bond distances as compared to the Pt/C electrocatalyst. The changes in these parameters seem to effect the adsorption characteristics of the oxygenated species from the electrolyte solution. The effect of alloying conditions on the electrocatalytic activity for ORR in the case of WNi and PVCo alloys can be rationalized on the basis of changes in the electronic and geometric parameters (Table 5). The higher alloying temperatures and longer an-
4588 J. Phys. Chem., Vol. 99, No. 13, 1995 Mukerjee et al.
10
n 10 -
5 -
0 -
-5
-10 -
-1 5 I I I 1-1
I 1 II '
I 2wv a
- v v
k $z E 0
Figure 12. Two-shell fit for Pt/Co (JMRC) sample at the Co K edge (0.54 V vs RHE) in (a, left) r space and (b, right) k space. The fits are k3 weighted with the sample data denoted by (-) in r and (0) in k space and the fitted data by (-) in r and (0) in k space.
nealing periods result in an increase of the Pt d-band vacancies without significantly affecting the crystalline structure of the alloy electrocatalysts (the Pt-Pt, Pt-M, and M-M distances remain unchanged). Therefore, increasing the Pt d-band vacan- cies per atom in the case of WNi and WCo alloy electrocatalysts is not beneficial toward the ORR electrocatalysis in a PEM environment. In the case of WCr alloys, prepared by using different alloying conditions, the d-band vacancies per atom remain unchanged. Further, there was no change in the crystalline structure, similar to the Pt/Ni and WCo alloys. This therefore indicates that the differences observed in the electro- catalytic behavior of the three alloys can be accounted for on the basis of the presence or absence of variations in the Pt d-band vacancies caused as a result of different alloying conditions. However, a higher alloying temperature might be beneficial to the catalyst life.
Conclusions
The following conclusions can be drawn from this investiga- tion: (1) The X-ray powder diffraction analyses of the carbon- supported Pt and Pt alloy electrocatalysts exhibit a primary phase of Pt3M type with a LIZ-type fcc lattice structure and a small contribution (6-15%) of a secondary phase of PtM type with L1,-type tetragonal structure. There was evidence of lattice contractions (Pt-Pt bond distance) in the Pt alloys as compared to the Pt/C electrocatalyst. The alloys exhibited slightly larger particle sizes as compared to the W C electrocatalyst.
(2) The electrocatalytic activity at 95 "C and 5 atm pressure in a PEM half-cell environment showed up to a 4-fold activity enhancement for the alloy electrocatalysts prepared by using lower alloying temperatures and shorter annealing periods in comparison to the base line performance of the Pt/C electro- catalyst. The Pt/Co and Pt/Ni alloy electrocatalysts prepared with higher alloying temperatures and longer annealing periods, however, showed lower enhancements, with the performance by the WCr alloy remaining invariant over the range of alloying conditions. These trends were true for activity determinations both on a geometric area and on a true surface area basis. The activation energy for ORR exhibited lower values for all the alloy electrocatalysts. The dependence of the activities on the alloying conditions could be correlated with changes in the activation energies. The reaction orders for ORR showed values close to unity for all the electrocatalysts (Pt/C and Pt alloys).
These observations therefore imply that the electrode kinetic parameters and activation energies are sensitive to alloying conditions (alloying temperature and annealing periods) for the Pt/Co and F " i alloys and insensitive for Pt/Cr alloy electro- catalyst. The invariance of the reaction order from unity however implies that the rate-limiting step remains unchanged in all the electrocatalysts.
(3) The in-situ XANES results at a potential of 0.54 V vs RHE reveal higher Pt d-orbital vacancies for the Pt alloys as compared to the Pt/C electrocatalyst. Among the Pt/Co and WNi alloy electrocatalysts, the d-orbital vacancies were higher for the alloys prepared by using a higher alloying temperature and longer annealing periods. The corresponding values for the Pt/Cr alloys remained unchanged. The EXAFS analysis of the Pt L3 edge at 0.54 V showed a contraction in the Pt-Pt bond distances of the alloys as compared to those in the Pt/C electrocatalyst. In addition, EXAFS analysis at this potential region revealed that there was no chemisorbed oxygen on the Pt surface in any of the electrocatalysts (Pt and Pt alloys). The Pt-Pt and Pt-M (where M is the Cr, Co, and Ni alloying element) bond distances exhibited no effect due to differing alloying conditions.
XANES analysis at 0.84 V vs RHE showed first that in contrast to the Pt alloys the W C electrocatalyst exhibits significant increase in the Pt d-orbital vacancies relative to the value at 0.54 V. EXAFS analysis at 0.84 V confirmed the presence of chemisorbed oxygen on the W C electrocatalyst and its absence in the Pt alloys. Comparison of the Pt-Pt and Pt-M bond distances and coordination numbers for all the alloy electrocatalysts at 0.54 and 0.84 V showed no significant difference in values. Similar results were obtained for the M-M and the M-Pt bond distances and coordination numbers obtained from the EXAFS analysis at the K edge of Ni and Co. In the Pt/C electrocatalyst, the Pt-Pt bond distances remained invariant, however, the coordination numbers at 0.84 V were lower than those in the double-layer region due to the presence of chemisorbed oxygen on the Pt surface. The role of redox- type process involving the alloying element was however rejected, based on the invariance of the K-edge XANES positions for the respective alloying elements at 0.54, 0.84, and 1.14 V vs RHE. These K-edge XANES at 1.14 V also indicated negligible corrosioddissolution of the alloying element with the
Effect of Preparation Conditions on Activities
exception of WNi alloy (ETEK). This indicated that the surface of the alloy crystallites are mostly Pt.
The correlation of the electrocatalytic activity for ORR obtained at 95 “C and 5 atm pressure in a PEM environment and the results of the in-situ XAS analysis revealed the interplay of both electronic (higher R d-orbital vacancies) and geometric parameters (shorter Pt-Pt bond distances) and their combined role in affecting the chemisorption of oxygenated species from the electrolyte solution beyond 0.8 V. The sensitivity of the ORR electrocatalytic activities toward the Pt d-orbital vacancies can be seen from comparisons of these parameters for the Pt/ Ni and WCo alloy prepared under different alloying conditions. This analysis therefore revealed that in the case of Pt/Ni and WCo alloy electrocatalysts the reason for the observed lower electrocatalytic activities of the alloys prepared at a higher alloying temperature and longer annealing periods could be accounted for by their higher d-orbital vacancies. However, the EXAFS indicates that the lattice parameters undergo no observable changes with long-term annealing.
J. Phys. Chem., Vol. 99, No. 13, 1995 4589
Acknowledgment. The authors gratefully acknowledge the support of the National Aeronautic and Space Administra- tion-Johnson Space Center under the auspices of the Regional University Grant Program (Grant NAG 9-533), Center for Energy and Mineral Resources, Texas A&M University, and the U.S. Department of Energy, Division of Material Science, Brookhaven National Laboratory (Contract DEA-COZ- 76CH00016) for its role in the development and operation of the National Synchrotron Light Source (NSLS). The help of NIST personnel at the beam line X23A2 in particular Joe Woicik and John Kirkland is gratefully acknowledged. The authors also acknowledge the helpful suggestions and discussions with A. Cesar Ferreira, CESHR, Texas A&M University, and Kaumudi I. Pandya, Applied Science Division, Brookhaven National Laboratory. The authors gratefully acknowledge Lindsay Keck of Johnson Matthey Inc., and James Giollombardo of ETEK Inc., who supplied the electrocatalysts. The experimental work at Brookhaven was supported by the Office of Transportation Technologies, Electric and Hybrid Vehicles Division of DOE.
References and Notes
(1) Jalan, V. M. U.S. Patent 4,202,934, 1980. (2) Landsman, D. A,; Luczak, F. J. U.S. Patent 4,316,944, 1982. (3) Srinivasan, S.; Mukerjee, S.; Velev, 0. A,; Appleby, A. J. Annual
Report No. 2, NASA-Johnson Space Center, Grant NAG 9-533, August 1992.
(4) Mukerjee, S.; Srinivasan, S. J . Electroanal. Chem. 1993, 357, 201. (5) Appleby, A. J. Energy 1986, 11, 13. (6) Mukerjee, S. J . Appl. Electrochem. 1990, 20, 537. (7) Mukerjee, S.; Srinivasan, S.; Soriaga, M. P.; McBreen, J. J .
Electrochem. Soc., in press. (8) Appleby, A. J. In Comprehensive Treatise of Electrochemistry;
Conway, B. E., Bokris, J. O’M., Yeager, E., Khan, S. U. M., White, R. E., Eds.; Plenum Press: New York, 1983; Vol. 7, p 230.
(9) Glass, J. T.; Cahen, G. L.; Stoner, G. E. J . Electrochem. SOC. 1987, 134, 58.
(10) Gottesfeld, S.; Paffett, M. T.; Redondo, A. J . Electroanal. Chem. 1986, 205, 163.
(11) Paffett, M. T.; Daube, K. A.; Gottesfeld, S . ; Campbell, C. T. J . Electroanal. Chem. 1987, 220, 269.
(12) Bett, J. A. S. In Proceedings of the Symposium on Structural Effect in Electrocaralysis and Oxygen Electrochemistry; Scherson, D., Tryk, D., Deroux, M., Xing, X., Eds.; The Electrochemical, Society Inc.: Pennington, NJ, 1992; PV 92-11, p 573.
(13) Ticianelli, E. A.; Derouin, C. R.; Srinivasan, S. J . Electroanal. Chem. 1988, 25, 275.
(14) Srinivasan, S.; Ticianelli, E. A,; Derouin, C. R.; Redondo, A. J . Power Sources 1988, 22, 359.
(15) Venkatraman, M.; Newman, J. P. Bull. Alloy Phase 1990, 11. (16) Dahamani, C. E.; Cadaville, M. C.; Pierron-Bohnes. V. Acra Metall.
1985, 33, 369.
(17) Cadaville, M. C.; Dahamani, C. E.; Kem, F. J . Magn. Magn. Mater.
(18) Leroux, C.; Cadaville, M. C.; Pierron-Bohns, V.; Inden, G.; Hinz, F. Phys. F. Met. Phys. 1988, 18, 2033.
(19) Wakizoe, M.; Velev, 0. A.; Srinivasan, S.; Appleby, A. J. J. Electrochem. SOC., Ext. Abstr. 1992, 139, 156 (182nd Meeting of the Electrochemical Society, Toronto, Canada, October, 11 - 16, 1992).
(20) Parthasarathy, A.; Srinivasan, S.; Appleby, A. J. J . Electroanal. Chem. 1992, 339, 101.
(21) McBreen, J.; O’Grady, W. E.; Pandya, K. I.; Hoffman, R. W.; Sawyers, D. E. Langmuir 1987, 3, 428.
(22) Swanson, T. Natl. Bur. Stand. (U.S.) Circ. 1953, 1-31, 529. (23) Baglin, J. J . Electrochem. SOC. 1967, 125, 1854. (24) Klug, H.; Alexander, L. X-Ray Diffraction Procedures; Wiley: New
(25) Azaroff, L. V. Elements of X-ray Diflraction; McGraw Hill: New
(26) Parthasarathy, A.; Srinivasan, S.; Appleby, A. J.; Martin, C. J .
(27) Parthasarathy, S.; Srinivasan, S.; Appleby, A. J.; Martin, C. J .
(28) Falicov, L. M.; Hanke, W.; Maple, M. P. Valence Fluctuations in
(29) Brown, M.; Peierls, R. E.; Stem, D. E. Phys. Rev. B 1977, 15,
(30) Matheiss, L. F.; Dietz, R. E. Phys. Rev. B 1980, 22, 1663. (31) Mansour, A. N. X-ray Absorption Studies of Silica Supported
Platinum Catalysts. Ph.D. Thesis, Department of Physics, University of North Carolina, Raleigh, NC, 1983.
(32) Mansour, A. N.; Cook, J. W., Jr.; Sayers, D. E. J . Chem. Phys. 1984, 28, 2330.
(33) Mansour, A. N.; Cook, J. W., Jr.; Sayers, D. E.; Emrich, R. J.; Katzer, J. R. J . Caral. 1984, 89, 464.
(34) Samant, M. G.; Boudart, M. J . Phys. Chem. 1991, 95, 4070. (35) Sayers, D. E.; Bunker, D. A. In X-ray Absorption: Principles,
Application, Techniques of EXAFS, SEXAFS and XANES; Koningsberger, D. C., Prins, R., Eds.; John Wiley & Sons: New York, 1988; p 211.
(36) Wong, J.; Lytle, F. W.; Messmer, R. P.; Maylotte, D. H. Phys. Rev. B. 1984, 30, 5596.
(37) McMaster, W. H.; Grande Ker Del, N.; Mallett, J. H.; Hubbel, J. H. Compilation of X-Ray Cross-sections; National Technical Information Service: Springfield, VA, 1969.
(38) vanZon, J. B. A. D.; Koningsberger, D. C.; vant’Blik, H. F. J.; Sayers, D. E. J . Chem. Phys. 1985, 82, 5742.
(39) Duirenvoorten, F. B. M.; Koningsberger, D. C.; Uh, Y . S.; Gates, B. C. J . Am. Chem. SOC. 1986, 108, 6254.
(40) Pandya, K. I.; O’Grady, W. E.; Comgan, D. A,; McBreen, J.; Hoffman, R. W. J . Phys. Chem. 1990, 94, 21.
(41) Pandya, K. I.; Hoffman, R. W.; McBreen, J.; O’Grady, W. E. J . Electrochem. SOC. 1990, 137, 383.
(42) Tourillon, G.; Dexpert, H.; Lagarde, P. J . Electrochem. SOC. 1987, 134, 327.
(43) Rehr, J. J.; Mustre de Leon, J.; Zabinski, S. I.; Albers, R. C. J . Am. Chem. SOC. 1991, 113, 5135.
(44) Teo, B. K. In EXAFS: Basic Principles and Data Analysis; Inorganic Concepts 9; Springer Verlag: New York, 1986; p 132.
(45) Koningsberger, D. C. In Synchrotron Techniques in Interfiacial Electrochemistry; Melendres, C. A., Tadjeddine, A,, Eds.; Kluwer Academic Publishers: Dordrecht, The Netherlands, 1994; pp 181-198.
(46) Herron, M. E.; Doyl, S. E.; Pizzini, S.; Roberts, K. J.; Robinson, J.; Hards, G.; Walsh, F. C. J . Elecrroanal. Chem. 1992, 324, 243.
(47) Appleby, A. J. Catal. Rev. 1970, 4 , 221. (48) Appleby, A. J. J . Electroanal. Chem. 1993, 357, 117. (49) Bardi, U.; Dahlgren, D.; Ross, P. N. J . Catal. 1986, 100, 196. (50) Bardi, U.; Beard, B.; Ross, P. N. J . Catal. 1990, 124, 22. (51) Haner, A.; Ross, P. N. J . Phys. Chem. 1991, 95, 3740. (52) Gauthier, Y.; Joly, I.; Baudoing R.; Rundgren, J. Phys. Rev. B 1985,
1986, 54-57, 1055.
York, 1962; p 491.
York, 1968; p 556.
Electrochem. SOC. 1992, 139, 2530.
Electrochem. SOC. 1992, 139, 2856.
Solids; North Holland Publication: Amsterdam, 198 1.
738.
31, 6216.
JP94 1 336W