Embed Size (px)
Citation preview
E L S E V I E R Materials Science and Engineering A219 (1996) 133-14i
M A T E R I A L S SCIENCE &
ENGINEERING
A
Effect of presence and type of particulate reinforcement on the electrical conductivity of non-heat treatable aluminum
M. Gupta a,*, G. Karunasiri b, M.O. Lai a aDepartment of Mechanical and Production Engineering, National University of Singapore, I0 Kent Ridge Crescent, Singapore it9260, Singapore
bDepartment of Electrical Engineering, National University of Singapore, I0 Kent Ridge Crescent, Singapore 119260, Singapore
Received 6 February 1996; revised 12 April 1996
Abstract
In the present study, the effect of presence and type of reinforcing particulates (C and SiC) on the electrical conductivity of 99.5% non heat treatable aluminum was investigated. The synthesis of the unreinforced and reinforced samples was carried out using disintegrated melt deposition route. Microstructural characterization studies conducted on the unreinforced and reinforced samples revealed the presence of columnar-equiaxed microstructure and unconnected porosity. Energy dispersive spectroscopic analysis conducted in the near vicinity of SiC particulates revealed a more pronounced segregation of silicon when compared with C particulates. The results of electrical properties measurements indicate that the presence of reinforcing particulates degrade the electrical conductivity of the metallic matrix and that the C particulates besides their higher volume fraction degrade the electrical conductivity of the aluminium to a lesser extent when compared with SiC particulates. The electrical conductivity results obtained in this study are correlated with the particulates' associated microstructural and constitutional changes in the metallic matrix. A new rule of mixture is proposed that incorporates the particulates' associated change in matrix microstructural features as a necessary criterion to compute the electrical conductivity of the reinforced metallic matrices. The electrical conductivity results obtained using modified rule of mixture accords well with the conductivity trend proposed by the Kerner's model and the experimental results obtained in the present study. The electrical conductivity results, however, indicate that the variation in electrical conductivity as a result of the presence of reinforcing particulates may not necessarily follow the trend predicted by the classical Rayleigh-Maxwell equation.
Keywords: Electrical conductivity measurement; Microstructural eharacterisation; SiC particulates
1. Introduction
Metal matrix composites represent the unified combi- nation of continuous metallic phase with that o f the judiciously selected ceramic phase [1]. The addition of hard and stiff ceramic phase has been established to improve the modulus and strength properties of the metallic matrices that are particularly lean in alloying elements [2]. For the applications where electrical con- ductivity requirement is important together with me- chanical stability, reinforced metallic matrices may offer a good alternative material choice. However, in order to qualify for these type of applications, the effect
* Corresponding author.
0921-5093/96/$15.00 © 1996- Elsevier Science S.A. All rights reserved PH S0921-5093(96) I0416-0
of reinforcing phases and the other microstructural changes inflicted on the metallic matrix as a result of the presence of the reinforcing phases requires careful monitoring. In related studies, investigators reported the effect of volume percent of ceramic phase [1], solutionizing temperature [3], aging heat treatment [4] and coherent/incoherent nature of the precipitated phase [5] on the electrical resistivity of the commercially used reinforced aluminum alloys, however, no system- atic studies were carried out to delineate the effect of type of reinforcing phase on the electrical conductivity of the commercially pure non-heat treatable aluminum.
Accordingly, the objective of the present study was to provide preliminary information on the effect of type of reinforcing particulates on the electrical conductivity of the non heat treatable 99.5% pure aluminum. Particular
134 M. Crupta et al. / Materials Science and Engineering A219 (I996) 133-141
emphasis was placed to study the effect of presence of reinforcing particulates on the microhardness of the metallic matrix and to correlate the particulates' associ- ated microstructural variation in the metallic matrix with the electrical conductivity of the reinforced metal- lic matrix.
2. Experimental procedure
2.1. Materials
The nominal composition of the matrix alloy used in the present study was (in wt.%): 0.35 Si--0.15, others (Fe + Mn + Mg + V)--99.5 AI. Silicon carbide (a-SiC) and graphite (C) particulates with an average size of 8 /~m were selected as the reinforcement phase.
2.2. Processing
The disintegrated melt deposition (DMD) processing of the reinforced materials used in the present study was carried out according to the following procedure. The starting elemental material (aluminum) was prop- erly cleaned and superheated to 950°C in a graphite crucible. Reinforcing particulates (SiC/C) preheated to a maximum temperature of 950°C were then added into the molten metal stirred using an impeller. The stirring time of reinforcing particulates in the melt was main- tained between 10 and 15 min. The composite melt was then disintegrated using argon gas at 0.18 m from the melt pouring point. The gas flow rate was maintained at 4.17 × 10 - 4 m3/s. The disintegrated composite melt slurry was subsequently deposited on a circular shaped metallic substrate located at 0.25 m from the gas disin- tegration point. The experiment was carried out under ambient atmospheric conditions. For the purpose of comparison, the matrix alloy (referred as 99.5 A1) and an industrial grade A1 alloy (AA 1050) were synthesized using similar processing conditions as described for composite materials.
2.3. Quantitative assessment of SiC particulates
Quantitative assessment of reinforcing particulates in the DMD processed composite samples was carried out using a chemical dissolution method. This method in- volved: (i) measuring the mass of composite samples; (ii) dissolving the samples in hydrochloric acid; fol- lowed by (iii) filtering to separate the ceramic particu- lates. The particulates were then dried and the weight fraction determined. The weight fraction was converted to volume fraction, Vr, using the following equation
(wt.%R)/pr Vr = (1)
(wt.%R)/p~ + (wt.%matrix)/Pmat~
where Pr and Pmatrix represent the densities of the reinforcing particulates and the matrix, respectively.
2.4. Density measurement
Density measurements were carried out using Archimedes' principle in order to ascertain the volume fraction of porosity in the unreinforced and reinforced samples. This procedure involved: weighing a polished cube using A&D Electronic Balance (accuracy of 0.001 g), immersing the cube in the liquid, measuring the loss in weight, calculating the density of the cube, and comparing the results with the theoretical Rule of Mix- tures density.
2.5. Microstructural characterization
Microstructural characterization studies were con- ducted on the DMD processed unreinforced and com- posite samples using scanning electron microscope (SEM) in order to investigate the grain structure, pres- ence of porosity, distribution of SiC particulates, and the constitutional characteristics of the matrix adjacent to reinforcing particulates (SiC/C).
SEM was carried out using a JEOL JSM-T330A scanning electron microscope equipped with energy dis- persive spectroscopy (EDS) on unetched and etched samples.
2.6. Microhardness testing
Microhardness testing was carried out in order to determine the effect of reinforcing particulates on the plastic properties of the metallic matrix. Vickers micro- hardness measurements were determined on a Mat- suzawa MXT 50 Automatic Digital microhardness tester using an indentation load of 100 g.
2. 7. Electrical resistivity~conductivity measurement
The electrical resistivities of the samples were esti- mated by measuring the voltage (V) along the sample for a known current (/) passing through it. Typical size of the samples used in this measurement was approxi- mately 2 cm in length and 1 x 1 mm 2 in crossection. The current through the sample was varied from 0.5 A to 2.5 A in 0.5 A steps and the voltage drop along length was measured using a microvolt meter. These values of the currents were chosen to achieve apprecia- ble voltage along the sample while keeping the genera- tion of heat in the sample to a minimum. The measured voltages were found to be in the 50-680/~V range. The resistance of each sample was estimated by determining the gradient of I - V plots. The resistivity/conductivity of the samples were than calculated by using the follow- ing formula:
M. Gupta et at. / Materials Science and Engineering A219 (1996) 133-14l
Table 1 Results of microhardness, density and porosity measurements
135
Material Weight % Microhardness (HV) Density ( g c m -3) Porosity (Vp) (%)
AA 1050 - - 28.1 _ 1.73 2.692 0.47 99.5 A1 - - 28.8 _ 2.08 2.679 0.98 99.5 A I + C 2.2 48.6 __+ 1.58 2.684 0.29 99.5 AI+SiC 2.9 38.0 _+ 1.08 2.674 1.63
RA 1 P - L - K (2)
where R is the resistance, L is the length, A is the cross-sectional area and K is the conductivity.
3. Results
3.1. Quantitative assessment of SiC particulates
The results of acid dissolution experiments are sum- marized in Table 1. The weight percentage (wt.%) of SiC and C particulates was measured to be approxi- mately 2.9 and 2.2%, respectively.
3.2. Density measurement
The results of density measurements conducted on the as-DMD processed unreinforced and reinforced composite specimens and the volume percent (vol.%) of the porosity computed using the experimentally deter- mined density values and the results of acid dissolution tests are shown in Table 1. The results indicate that the presence of SiC reinforcement lead to maximum forma- tion of porosity in the metallic matrix under identical experimental conditions.
3.3. Microstructural characterization
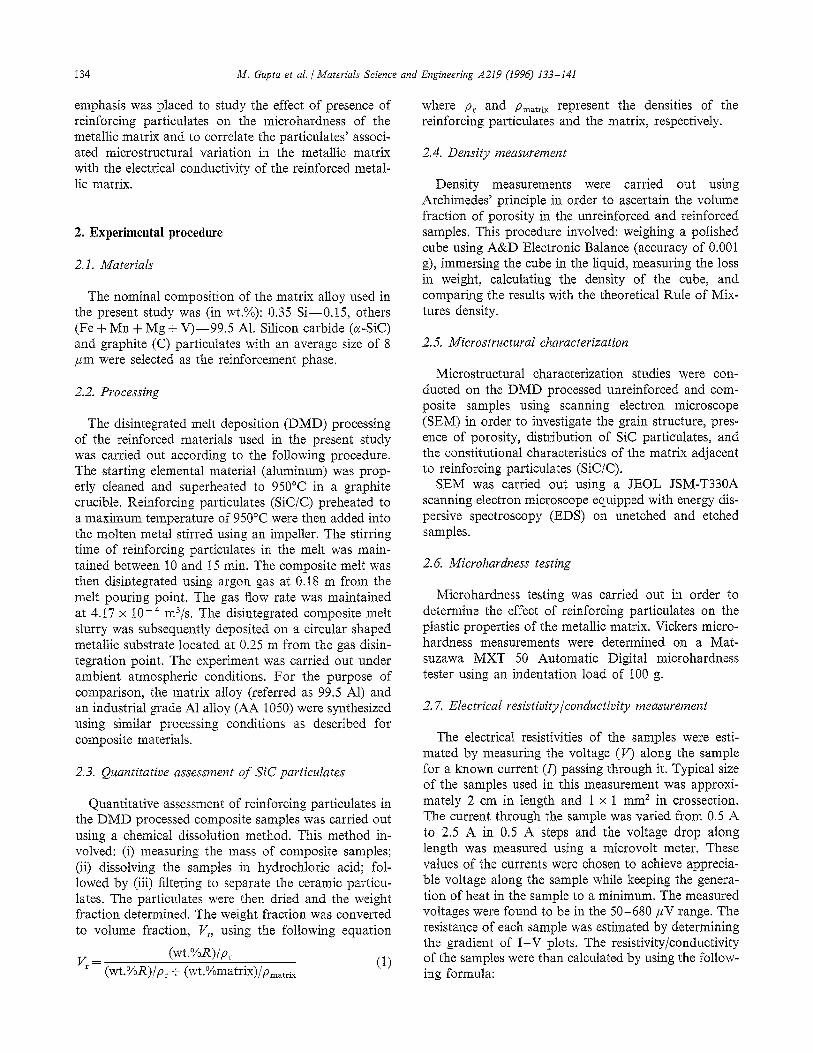
The results of microstructural characterization stud- ies carried out on unreinforced and reinforced samples revealed the presence of columnar-equiaxed grain struc- ture and minimal amount of microporosity. The distri- bution of reinforcing particulates in the reinforced samples was predominantly uniform. However, in some locations reinforcement clusters were also observed. High magnification SEM studies carried out in the interfacial location did not reveal the presence of reac- tion products. The results of the point analyses con- ducted in the near vicinity of SiC/C particulates revealed the enrichment of Si. The results indicate that the segregation tendency of Si in the matrix adjacent to SiC particulates was more pronounced when compared with C particulates and that the segregation distance of Si from the reinforcing particulate is larger for SiC particulates (Fig. 1).
3.4. Microhardness testing
The results of the microhardness measurements car- ried out on the unreinforced and reinforced samples are shown in Table 1. The results show that the microhard- ness of the reinforced samples is significantly higher when compared with the unreinforced samples. Amongst the reinforced samples, C reinforced samples exhibited higher microhardness than the SiC reinforced samples.
3.5. Electrical resistivity/conductivity measurement
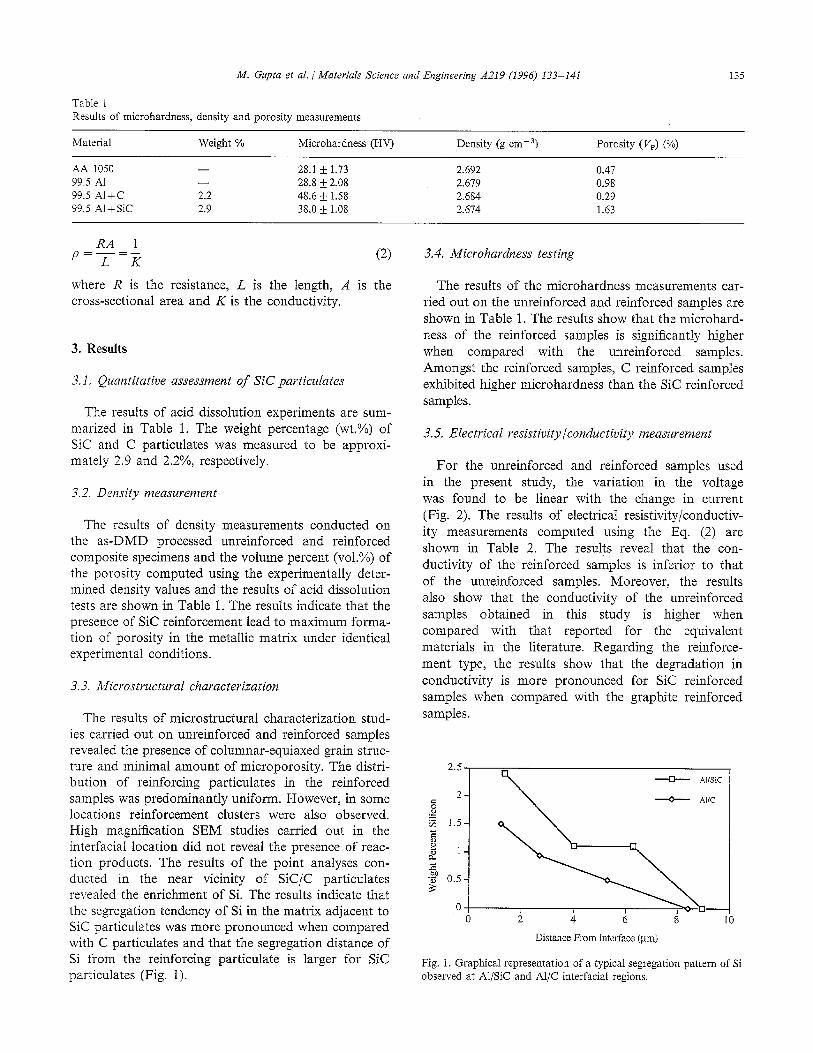
For the unreinforced and reinforced samples used in the present study, the variation in the voltage was found to be linear with the change in current (Fig. 2). The results of electrical resistivity/conductiv- ity measurements computed using the Eq. (2) are shown in Table 2. The results reveal that the con- ductivity of the reinforced samples is inferior to that of the unreinforced samples. Moreover, the results also show that the conductivity of the unreinforced samples obtained in this study is higher when compared with that reported for the equivalent materials in the literature. Regarding the reinforce- ment type, the results show that the degradation in conductivity is more pronounced for SiC reinforced samples when compared with the graphite reinforced samples.
2.5 \ ---'t21----- A]/SiC
2 - ~ -----ok ArC
"9 0.5
0 0 2 4 6 8 10
Distance From interface (pro)
Fig. 1. Graphical representation of a typical segregation pattern of Si observed at A1/SiC and A1/C interfacial regions.
136 M. Cmpta et al. / Materials Science and Engineering A219 0996) i33-141
700
600 9~).~ al alfC / /O
300 t 200 1
tOOl I I
0 5 i , 5
I (Amp.)
Fig. 2. Graphical representation of the voltage-current relationship exhibited by the unreinforced and reinforced samples.
4. Discussion
4. i. Microstructure
The microstructure of the unreinforced and DMD processed composite samples revealed, in common, the presence of columnar-equiaxed grain structure and min- imal amount of microporosity [6,7]. The presence of columnar-equiaxed structure exhibited by the unrein- forced and reinforced DMD processed A1 based materi- als has been established previously and the underlying principals can be found elsewhere [7]. The presence of microporosity is inevitable for the materials exhibiting columnar-equiaxed structure and is attributed to the inability of the high viscosity liquid in the interdendritic regions to be "sucked" into the groove sufficiently fast to keep pace with the shrinkage that accompanies so- lidification [6,7].
The predominantly uniform distribution of reinforc- ing particulates observed in the reinforced (SiC/C) DMD processed samples can be attributed to the cou- pled effects of non-equilibrium conditions during melt disintegration and the dynamic events that follow dur- ing deposition of disintegrated melt stream. The dy- namic events during deposition bear a significant
Table 2 Results of electrical resistivity/conductivity measurements
Material Resistance Resistivity (f2 Conductivity ( ~ ) cm) (f~ cm) - i
Pure AP - - 2.74 x 10 .6 3.65 x 10⁵ AA 1050 b - - 2.81 x 10 .6 3.56 x 10⁵ AA 1050 :. 200 2.72 x 10 .6 3.68 x l0 s 99.5 At 223 2.63 x 10 .6 3.80 x 10⁵ 99.5 A I + C 194 3.I1 x 10 -6 3.22x 10⁵ 99.5 AI+SiC 261 3.32 x 10 .6 3.01 x 10 -s
a Ref. [28]. b Ref. [23].
importance in achieving uniform distribution since the solidification front velocity, which is governed by the rate of heat extraction, remains sluggish enough to engulf the SiC particulates during solidification even for the disintegration velocity of 296 m/s [8,9].
4.2. Interfacial characteristics
The results of microstructural characterization stud- ies conducted on the particulate/matrix interfacial re- gion of the SiC and C reinforced DMD processed composite samples revealed: (1) a high concentration of Si in the immediate vicinity
of SiC and C particulates; (2) larger segregation distance of Si in the case of SiC
reinforced A1 matrix; and (3) more pronounced segregation of Si in the immedi-
ate vicinity of SiC particulates. The high concentration of Si in both SiC and C
reinforced DMD processed composite samples (Fig. 1) can primarily be attributed to the presence of enhanced dislocation density in the interfacial region. The en- hanced dislocation density results due to the difference in coefficient of thermal expansion between the rein- forcing particulates and the aluminum matrix [10] and promotes the dislocation-assisted diffusion of the alloy- ing elements from the adjacent dislocation lean areas of the matrix. These results are consistent with similar results obtained on reinforced A1 matrices synthesized using conventional casting, rheocasting and spray depo- sition routes [11,12].
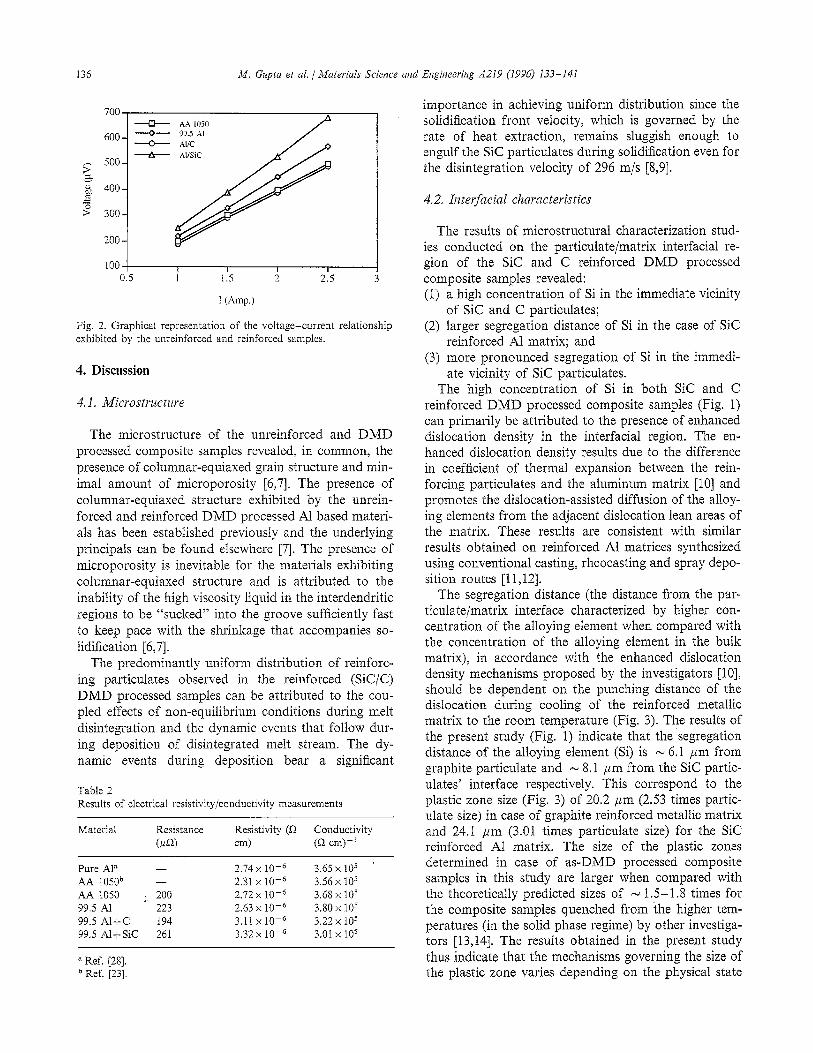
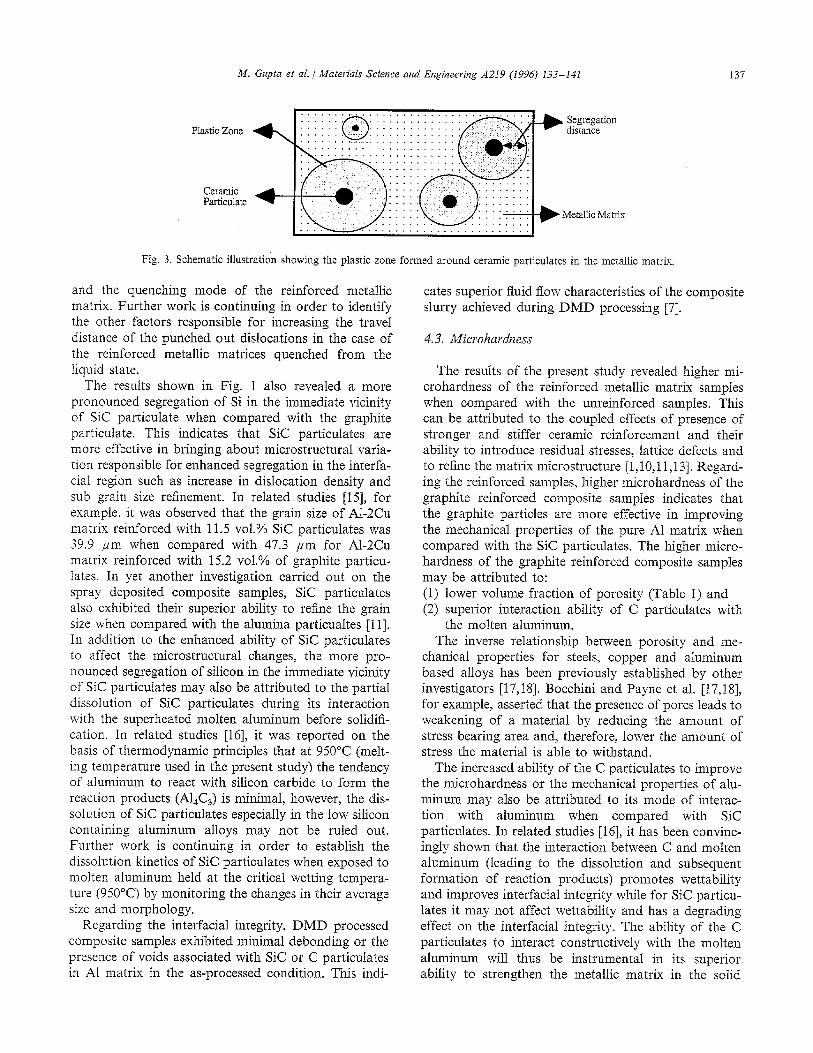
The segregation distance (the distance from the par- ticulate/matrix interface characterized by higher con- centration of the alloying element when compared with the concentration of the alloying element in the bulk matrix), in accordance with the enhanced dislocation density mechanisms proposed by the investigators [10], should be dependent on the punching distance of the dislocation during cooling of the reinforced metallic matrix to the room temperature (Fig. 3). The results of the present study (Fig. 1) indicate that the segregation distance of the alloying element (Si) is ~ 6.1 #m from graphite particulate and ~ 8.1 /~m from the SiC partic- ulates' interface respectively. This correspond to the plastic zone size (Fig. 3) of 20.2 ¢zm (2.53 times partic- ulate size) in case of graphite reinforced metallic matrix and 24.1 #m (3.01 times particulate size) for the SiC reinforced At matrix. The size of the plastic zones determined in case of as-DMD processed composite samples in this study are larger when compared with the theoretically predicted sizes of ~ 1.5-1.8 times for the composite samples quenched from the higher tem- peratures (in the solid phase regime) by other investiga- tors [13,14]. The results obtained in the present study thus indicate that the mechanisms governing the size of the plastic zone varies depending on the physical state
M. Gupta et al. ¢ Materials Science and Engineering A219 (1996) 133-141 137
Plastic Zone
Ceramic Particulate
ii ii! ) i i i ! ! i i i ! ! ! i i : . . . . . . . . . . . . . . . . . . . F
i i i
Segregation distance
a~ix
Fig. 3. Schematic illustration showing the plastic zone formed around ceramic particulates in the metallic matrix.
and the quenching mode of the reinforced metallic matrix. Further work is continuing in order to identify the other factors responsible for increasing the travel distance of the punched out dislocations in the case of the reinforced metallic matrices quenched from the liquid state.
The results shown in Fig. 1 also revealed a more pronounced segregation of Si in the immediate vicinity of SiC particulate when compared with the graphite particulate. This indicates that SiC particulates are more effective in bringing about microstructural varia- tion responsible for enhanced segregation in the interra- cial region such as increase in dislocation density and sub grain size refinement. In related studies [15], for example, it was observed that the grain size of At-2Cu matrix reinforced with 11.5 vol.% SiC particulates was 39.9 #m when compared with 47.3 #m for A1-2Cu matrix reinforced with 15.2 vol.% of graphite particu- lates. In yet another investigation carried out on the spray deposited composite samples, SiC particulates also exhibited their superior ability to refine the grain size when compared with the alumina particualtes [11]. In addition to the enhanced ability of SiC particulates to affect the microstructural changes, the more pro- nounced segregation of silicon in the immediate vicinity of SiC particulates may also be attributed to the partial dissolution of SiC particulates during its interaction with the superheated molten aluminum before solidifi- cation. In related studies [16], it was reported on the basis of thermodynamic principles that at 950°C (melt- ing temperature used in the present study) the tendency of aluminum to react with silicon carbide to form the reaction products (A14C3) is minimal, however, the dis- solution of SiC particulates especially in the low silicon containing aluminum alloys may not be ruled out. Further work is continuing in order to establish the dissolution kinetics of SiC particulates when exposed to molten aluminum held at the critical wetting tempera- ture (950°C) by monitoring the changes in their average size and morphology.
Regarding the interracial integrity, DMD processed composite samples exhibited minimal debonding or the presence of voids associated with SiC or C particulates in A1 matrix in the as-processed condition. This indi-
cates superior fluid flow characteristics of the composite slurry achieved during DMD processing [7].
4.3. Microhardness
The results of the present study revealed higher mi- crohardness of the reinforced metallic matrix samples when compared with the unreinforced samples. This can be attributed to the coupled effects of presence of stronger and stiffer ceramic reinforcement and their ability to introduce residual stresses, lattice defects and to refine the matrix microstructure [1,10,11,13]. Regard- ing the reinforced samples, higher microhardness of the graphite reinforced composite samples indicates that the graphite particles are more effective in improving the mechanical properties of the pure A1 matrix when compared with the SiC particulates. The higher micro- hardness of the graphite reinforced composite samples may be attributed to: (1) lower volume fraction of porosity (Table 1) and (2) superior interaction ability of C particulates with
the molten aluminum. The inverse relationship between porosity and me-
chanical properties for steels, copper and aluminum based alloys has been previously established by other investigators [17,18]. Bocchini and Payne et al. [17,18], for example, asserted that the presence of pores leads to weakening of a material by reducing the amount of stress bearing area and, therefore, lower the amount of stress the material is able to withstand.
The increased ability of the C particulates to improve the microhardness or the mechanical properties of alu- minum may also be attributed to its mode of interac- tion with almninum when compared with SiC particulates. In related studies [16], it has been convinc- ingly shown that the interaction between C and molten aluminum (leading to the dissolution and subsequent formation of reaction products) promotes wettability and improves interracial integrity while for SiC particu- lates it may not affect wettability and has a degrading effect on the interfacial integrity. The ability of the C particulates to interact constructively with the molten aluminum will thus be instrumental in its superior ability to strengthen the metallic matrix in the solid
138 M. Gupta et al. / Materials Science and Engineering A219 (I996) 133-141
state and to constrain the localized plastic deformation more effectively when compared with SiC particulates.
The microhardness results obtained in this study are also consistent with the mechanical characterization results carried out by other investigators on the spray co-deposited graphite and SiC reinforced commercially pure A1 revealing that 5% graphite reinforced A1 matrix exhibited higher strength (UTS = 175 MPa) when com- pared with 22% SiC reinforced pure A1 matrix (UTS = 110 MPa) [19]. Furthermore, the linear dependence between the tensile strength and hardness for many aluminum alloys has been previously established by other investigators [20,21].
4.4. Electrical properties
The results of the electrical conductivity measure- ments revealed that DMD processed unreinforced sam- ples exhibit superior electrical conductivity when compared with their conventionally cast counterparts and DMD processed reinforced samples (Table 2).
The higher electrical conductivity exhibited by DMD processed unreinforced samples when compared with their conventionally cast counterparts indicates that DMD processing methodology is superior to the con- ventional casting in minimizing the contamination of aluminum even in adverse conditions such as high superheating temperatures (950°C) and ambient atmo- spheric conditions ( ~ 70-75% Relative Humidity).
The relatively inferior electrical conductivity of the reinforced samples, when compared with the unrein- forced samples, can primarily be attributed to the pres- ence of reinforcing particulates (SiC/C) and the particulates' associated microstructural changes such as increase in lattice defects that include point defects, line defects and grain boundary area [4] and the tensile stresses generated in the metallic matrix [22]. According to Matthiessen's rule, the total resistivity of a material can be represented as [23]:
Ptotat = P t -b Pi -~- Pd (3)
where, Pt, Pi and Pa represent the individual thermal, impurity and deformation resistivity contributions, re- spectively. In light of Matthiessen's rule, it can be seen that the total resistivity of the composite samples is expected to be higher due to the larger contributions of Pi and p~ when compared with the unreinforced sam- ples which is consistent with the results obtained in the present study (Table 2). It may be noted that the addition of ceramic reinforcement induces the plastic deformation in the metallic matrix due to its different coefficient of thermal expansion (CTE) when compared with the metallic matrix [10]. The results of electrical conductivity measurements thus strongly indicates the dependence of the electrical conductivity/resistivity of the metallic matrix on the presence of reinforcing par-
ticulates and particulates induced electron scattering centers (such as lattice defects) in the metallic matrix. The results of this study are also consistent with the work of other investigators showing that the increased presence of reinforcing particulates in the matrix leads to an increased deterioration of the electrical conductiv- ity of the industrial grade aluminum alloys (AA 6061 and AA 2009) in T6 heat treated condition [1].
Regarding the effect of type of reinforcement, the graphite reinforced samples exhibited improved electri- cal conductivity when compared with SiC reinforced samples. The improved electrical conductivity of graphite reinforced samples, besides containing a higher volume fraction of graphite particulates, can be at- tributed to the lower volume fraction of micrometer sized electron scattering centers. The total volume frac- tion of micrometer sized electron scattering centers, VT, can be represented as:
VT---- V. + Vp~ + Vp (4)
where V,, Vpl and Vp represent the volume fraction of reinforcement, plastic zone and the porosity, respec- tively. The volume fraction of plastic zone Vpl, can be computed from the volume fraction of particulates, V,, using the following expressions suggested by Wu and Lavernia [24]
V,1 = (R 3 - 1)V, (5)
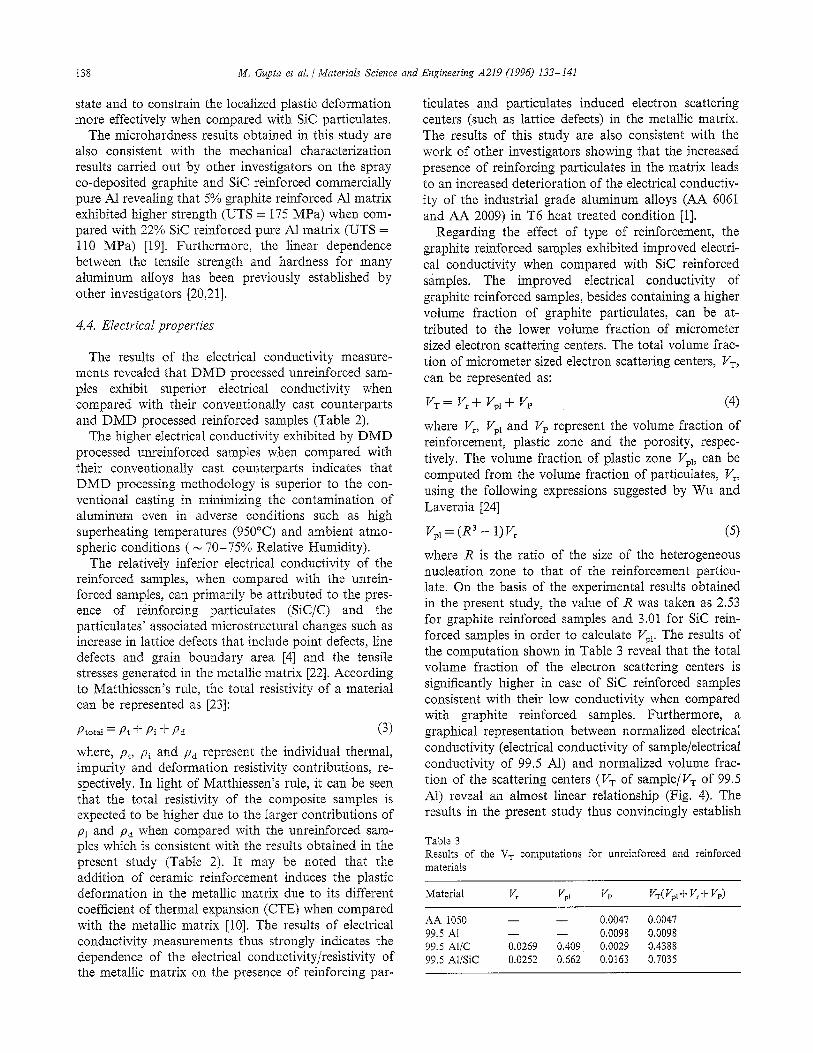
where R is the ratio of the size of the heterogeneous nucleation zone to that of the reinforcement particu- late. On the basis of the experimental results obtained in the present study, the value of R was taken as 2.53 for graphite reinforced samples and 3.01 for SiC rein- forced samples in order to calculate Vpl. The results of the computation shown in Table 3 reveal that the total volume fraction of the electron scattering centers is significantly higher in case of SiC reinforced samples consistent with their low conductivity when compared with graphite reinforced samples. Furthermore, a graphical representation between normalized electrical conductivity (electrical conductivity of sample/electrical conductivity of 99.5 A1) and normalized volume frac- tion of the scattering centers (I% of sample/VT of 99.5 A1) reveal an almost linear relationship (Fig. 4). The results in the present study thus convincingly establish
Table 3 Results of the V T computations for unreinforced and reinforced materials
Material V~ Vpj Vp VT(VpI+ Vr+ Ve)
AA 1050 -- -- 0.0047 0.0047 99.5 AI -- -- 0.0098 0.0098 99.5 A1/C 0.0269 0.409 0.0029 0.4388 99.5A1/SIC 0.0252 0.662 0.0163 0.7035
M. Gupta et al. /Materials Science and Eng#wer#Tg A219 (1996) 133-t4i I39
'= 100 -
95 ~J
.-~ 90
[ ]~ 85
8O
z 75 0 1'0 2b 3b 4'O 5; 6; vb
Normalized Volume Fraction of Scattering Centers
Fig. 4. Graphical representation showing the variation of normalized electrical conductivity as a function of normalized volume fraction of electron scattering centers.
that the electrical conductivity of the reinforced metallic matrix is a direct function of the volume fraction of the electron scattering centers in the matrix resulting due to the presence of ceramic reinforcement.
The trend of the electrical conductivity exhibited by the reinforced samples is, however, in contradiction with the model proposed by Lord Rayleigh in 1892 [1,25]. According to the model, the electrical conductiv- ity for discontinuously reinforced composites, K~omp, containing a small volume fraction of approximately spherical reinforcement can be predicted by Rayleigh- Maxwell equation [1,25]
Km/Kr-1 1 + 2 V~ t_2Km/K~ 4- 1_]
Sc°mp---- Km F ' ! - Krn/~r 1 (6)
1 - gr 12Km/Kr + 1A
where, Kr and Km represent the electrical conductivity of the reinforcement and metallic matrix respectively. Since for the reinforcements used in the present study, Km >> K~, the above equation can be reduced to
1 - V ~ f~comp = Krn 1 4- V~/2 (7)
It may be noted that the electrical conductivity values computed using Eqs. (6) and (7) were found to tally with each other for the two metal/ceramic systems investigated in this study. The values of electrical con- ductivities computed using simplified Rayleigh- Maxwell equation are shown in Table 4. The computations indicate that the SiC reinforced samples should exhibit higher electrical conductivity when com- pared with the graphite reinforced samples. This is because the prediction of electrical conductivity of the reinforced samples by Rayleigh-Maxwell equation is primarily dependent on the volume fraction of the reinforcement and that the volume fraction of SiC particulates is lower than the volume fraction of the graphite particulates. An inspection of Eqs. (6) and (7) indicates that Rayleigh-Maxwell equation does not
account for the microstructural changes that take place in the metallic matrix as a result of the addition of ceramic reinforcement. In order to overcome this dis- crepancy, the model proposed by Kerner [26] for pre- dicting the electrical conductivity of composite media was used. Unlike Rayleigh's model, the model proposed by Kerner [26] is capable of taking into account the effect of plastic zone created due to the presence of reinforcement as illustrated in Fig. 3. According to Kerner's model, the conductivity of the composite sam- ples can be predicted as follows [26]:
Kcom p K m g m -Jr- K r g r L r 4- Kpl gplLpi = V m 4- VrL r 4- VplZpl 4- V p L p (g)
where
Lr =
2V~ (K r 4- 2KN)(Kpl 4- 2Krr0 -~ Vr 4- Vp~ (Kin - KPt)(KPl - Kr)
(9)
Lpl -- ~ Lr (10)
and Lv = 3/2 since inside the porosity the conductivity is equal to zero. In Eqs. (8)-(10), Kp~ represents the electrical conductivity of the plastic zone while Vm represents the volume fraction of the metallic matrix. The value of Kpz was taken as 3.73 x 10⁵ (f~ cm)- i as the first approximation based on the degradation of electrical conductivity realized by annealed 99.6% A1 when strain hardened to H18 condition [27]. The values of the conductivities computed using the above formu- lation for A1/C and A1/SiC samples are shown in Table 4. It can be seen that the Kerner's model predicts the observed trend eventhough the magnitude of the con- ductivities are higher than the experimental values. This discrepancy may be attributed, in part, to the uncer- tainty in the value of the conductivity of the plastic zone used in the computations. It may be noted that the value of the electrical conductivity chosen for plastic zone should be considered as upper bound since other factors such as dissolution of the reinforcing particu- lates and the precipitation of lattice defects as a result of difference in chemical and physical properties of the reinforcement may result in further degradation of the electrical conductivity of the plastic zone. If we assume Kpl = 3.02 x 10⁵ (~q cm)- 1, the computed values of the electrical conductivities for A1/C and A1/SiC using the Kerner's model closely match the experimental values.
As a simplified approach, incorporating the mi- crostructural effects produced by ceramic reinforcement on the matrix and the ensuing increase in volume fraction of the electron scattering centers, the electrical conductivity of the composite materials can also be predicted using the following rule of mixture:
140 M. Gupta et al. / Materials Science and Engineering A219 (1996) I33-141
Table 4 Results of electrical conductivity computations
Material V~ Conductivity (f2 cm)-
Rayleigh-Maxwell model Kerner's model Rule of Mixture Experimental values
99.5 AI . . . . 3.80 x 10 ~ 99.5 A1/C 0.0269 3.648 x 10⁵ 3.569 x 10 s 3.659 x 10⁵ 3.22 x 10 s 99.5 N/SiC 0.0252 3.658 x i05 3.524 x 10⁵ 3.598 x 10 s 3.01 x l0 s
Koomp = I~K~+ Vp~Kpl + VpKp+ VmKm (11)
The results of the computations based on Eq. (11) with K r = 0 reveal a conductivity of 3.659 x 10⁵ (f~ cm) -1 for A1/C samples and 3.598 x 10⁵ (f~ cm) -~ for A1/SiC samples (Table 4). The trend exhibited by the electrical conductivity values computed using Eq. (11) is similar to that observed experimentally, however, the magnitude is significantly higher. The trend and magni- tude of the electrical conductivity values, in addition, conforms well with the Kerner's model [26] (Table 4). The higher electrical conductivity values obtained by using Eq. (11) can primarily be attributed to the uncer- tainty associated with the electrical conductivity value of the plastic zone used in the above formulation as discussed before. However, if we assume Kp~ = 2.66 x 10⁵ (f2 cm) - 1 for A1/C and Kpl = 2.85 x 10⁵ (f~ cm) - ~, for A1/SiC the computed values of the electrical con- ductivities for A1/C and A1/SiC using the rule of mix- ture match closely with the experimental values. The different fitting values for the Kpl in the case of A1/C and A1/SiC composite materials is to be expected as a result of different physical and chemical properties associated with C and SiC particulates and hence their ability to influence the constitutional and microstruc- tural characteristics of the interfacial region differently [t6]. This is consistent with the different segregation patterns of Si observed in this study in the near vicinity of SiC and C particulates (Fig. 1). The segregation results obtained in this study are also consistent with the different segregation patterns obtained in the near vicinity of the reinforcing particulates by Gupta et al. on a AI -Cu based alloy (AA 2519) reinforced with SiC and A120 3 particulates using transmission electron mi- croscopy (TEM) equipped with energy dispersive spec- troscopy [11].
The electrical conductivity values thus obtained using the Rayleigh-Maxwell equation [25], Kerner's model [26], experimental measurements and the present for- mulation indicate that the prediction of electrical con- ductivity of discontinuously reinforced metal matrix composites containing a low volume fraction of rein- forcement can be carried out using Rayleigh-Maxwell equation only if the reinforcing phase does not change the microstructure of the parent phase significantly. When the reinforcing phase changes the matrix mi-
crostructure significantly due to its different chemical, physical and mechanical properties, the correct trend of the electrical conductivity can be predicted using either the Kerner's model [26] or the simplified rule of mixture proposed in this study. It may however be noted that Eq. (11) needs further refinement in order to take into account the particulates associated change in mi- crostructural features such as the reduction in grain size of the metallic matrix on the mobility of electrons in the matrix. Further work is continuing in this area.
5. Conclusions
The primary conclusions that may be derived from this work are as follows: (1) The improvement in the hardness of the commer-
cially pure aluminum (99.5%) can be realized by incorporation of ceramic reinforcements even in very low volume fractions (within the limits of 2-3%).
(2) The results of microhardness measurements indi- cate that the graphite particulates are more effective in increasing the microhardness of the non-heat treatable aluminium when compared with SiC par- ticulates.
(3) The degradation of electrical conductivity of the reinforced samples when compared with the unrein- forced samples can be attributed to an increase in the number and volume fraction of the electron scattering centers.
(4) The inferior electrical conductivity of the SiC rein- forced samples when compared with the graphite reinforced samples can primarily be attributed to the coupled effects of larger sized plastic zone and higher amount of porosity in the metallic matrix.
Acknowledgements
MG and MOL would like to thank NUS (grant # RP 3940619) for financial support during the course of this investigation. The authors would also like to thank Mr Thomas Tan, Mr Boon Heng and Mr Tung Siew Kong (National University of Singapore, Singapore)
M. Gupta et al. / Materials Science and Engitwering A219 (1996) 133-14t 141
fo r the i r v a l u a b t e a s s i s t ance a n d f o r m a n y use fu l d i scus- s ions. F i n a l l y , the a u t h o r s w o u l d a lso l ike to t h a n k the r ev iewer fo r his v a l u a b l e c o m m e n t s t h a t have c e r t a i n l y h e l p e d to i m p r o v e the q u a l i t y o f the p r e s e n t w o r k .
References
[1] A.L. Geiger and J.A. Walker, d. Met., 43 (8) (1991) 8. [2] D.L. McDanels, Met. Trans. A, 16(1985) 1105. [3] B.K. Prasad and T.K. Dan, J. Mater. Sei. Lett., 10 (1991) 1412. [4] B.K. Prasad, o r. Mater. Sei., 28 (1993) I00. [5] M.J. Hadianfard, Y.W. Mai and 3.C. Healy, J. Mater. Sci., 28
(1993) 3665. [6] B. Chalmers, Principles of Solidification, Wiley, New York, 1964,
pp. 253-297. [7] M. Gupta, M.O. Lai and C.Y. Soo, Mater. Sci. Eng. A, in press,
1995. [8] M. Gupta, F. Mohamed and E. Lavernia, Metall. Trans. A, A23
(I992) 831. [9] M. Gupta, F.A. Mohamed and E.J. Lavern~a, Int. J. Rapid
Solidi., 6 (1991) 247. [i0] R.J. Arsenault and N. Shi, Mater. Sci. Eng., 81 (1986) 175. [11] M. Gupta, T.S. Srivatsan, F.A. Mohamed and E.J. Lavernia, 3..
Mater. Sci., 28 (1993) 2245.
[12] M. Gupta, L. Lu, M.O. Lai and S. E. Ang, Mater. Des., 15 (2) (1995) 75.
[13] J.K. Lee, Y.Y. Earmme, H.I. Aaroson and K.C. Russell, Metall. Trans. A, AI I (1980) 1837.
[14] M. Taya, K.E. Lulay and D.J. Lloyd, Acta Metall. Mater., 39 (1) (t991) 73.
[15] M. Gupta, Ongoing Research, NUS, Singapore, 1995. [16] R.Y. Lin, Key Eng. Mater., 104-t07 (1995) 507. [17] G.F. Bocchini, Int. J. Powder Metall., 22 (3) (1986) 185. [18] R.D. Payne, A.L. Moran and R.C. Cammarata, Scr. Metall.
Mater., 29 (1993) 907. [19] A.R.E. Singer and S. Ozbek, Powder Metall., 28 (2) (1985) 72. [20] T.G. Nieh and R.F. Karlak, Scr. Metall. I8 (1984) 25. [21] J.R. Cahoon, W.H. Broughton and A.R. Kutzak, Metall. Trans.
A, 2 (1971) 1979. [22] R.3. Arsenault, Scr. MetalI. ~'ffater., 25 (1991) 2617. [23] W.D. Callister Jr., Materials Science and Engineering: An Intro-
duction, Wiley, Singapore, 1994, pp. 590-60I. [24] Y. Wu and E.J. Lavernia, Scr. Metall. Mater., 27 (1992) 173. [25] Lord Rayleigh, Philos. Mag., 34 (1892) 481. [26] E.H. Kerner, Proc. Phys. Soc. London, B69 (1956) 802. [27] ASM Metal Handbook, Properties and Selection: Nonferrous
Alloys and Special-Purpose Materials, Vol. 2, ASM Interna- tional, USA, 1992.
[28] G.T. Meaden, Electrical Resistance of Metals, Plenum, New York, 1965.