Embed Size (px)
Citation preview
University of Rhode Island University of Rhode Island
DigitalCommons@URI DigitalCommons@URI
Open Access Master's Theses
1985
Effect of Temperature and Packaging Material on Vitamin A and Effect of Temperature and Packaging Material on Vitamin A and
Riboflavin in Milk Riboflavin in Milk
Abdulaziz Ahmed Al-Zawawi University of Rhode Island
Follow this and additional works at: https://digitalcommons.uri.edu/theses
Recommended Citation Recommended Citation Al-Zawawi, Abdulaziz Ahmed, "Effect of Temperature and Packaging Material on Vitamin A and Riboflavin in Milk" (1985). Open Access Master's Theses. Paper 996. https://digitalcommons.uri.edu/theses/996
This Thesis is brought to you for free and open access by DigitalCommons@URI. It has been accepted for inclusion in Open Access Master's Theses by an authorized administrator of DigitalCommons@URI. For more information, please contact [email protected].
EFFECT OF TEMPERATURE AND PACKAGING
MATERIAL ON VITAMIN A AND RIBOFLAVIN
IN MILK
BY
'
ABDULAZIZ AHMED AL-ZAWAWI
A THESIS SOBMITTED IN PARTIAL FULFILLMENT OF THE
REQOIRMENTS FOR THE DEGREE OF
MASTER OF SCIENCE
IN
FOOD SCIENCE AND NUTRITION
UNIVERSITY OF RHODE ISLAND
1985
MASTER OF SCIENCE THESIS
OF
ABDULAZIZ AHMED AL-ZAWAWI
..
APPROVED:
Thesis Committee
Major Profess~~._....c.==-~~~~~~-==-
QLQ. JL ~ ,L*'.J.-1 u
~l~
DEAN OF THE GRADUATE SCHOOL
UNIVERSITY OF RHODE ISLAND
1985
ABSTRACT
The effect of different heating times and
temperatures and packaging on vitamin A and riboflavin
retention was studied in whole and skim milk.
Refrigerated storage (40C) in the dark for 15 days
resulted in losses of vitamin A ranging from 9-12% in
pasteurized whole milk, and 14% in pasteurized skim milk
fortified with vitamins A and D. Riboflavin losses did
not exceed 8 % • Vitamin A was also more labile than
riboflavin when stored at room temperature ( 230C) • '
Vitamin A was retained better in whole milk than in skim
milk where there was no protection from milk fat. After
48 hours of storage at room temperature, pasteurized
whole milk stored in a paperboard container lost 26. 3%
while that in plastic container lost 30%. Losses of
vitamin A in skim milk stored in paperboard were 52%. In
contrast, the losses or riboflavin of whole and skim milk
were about 18%.
Boiling of milk at loooc for 10 seconds resulted in
more destruction of vitamin A than of riboflavin. Whole
milk lost 10. 2% of the vitamin A after a single boiling
and 14. 4% after twice boiling. Skim milk lost 17. 4 and
28. 5%, respectively. The riboflavin content remained
very stable in both whole and skim milk. Losses did not
exceed 1% for a single and 4% for twice boiling. Boiling
.........
milk and holding it at 55oc was quite destructive to
vitamin A, but had a smaller effect on riboflavin. After
12 hours of holding previously boiled milk at 55oc, 29%
and 53% of the vitamin A were lost in whole and fortified
skim milk, respectively. Riboflavin losses did not
exceed 10-14% in whole or skim milk. A double cycle of
boiling and holding milk at 55oc resulted in the largest
losses of both vitamin A and riboflavin. After the
second 12-hour holding at 55oc, vitamin A losses for
whole milk were 30. 4% to 33 .1% • In fortified skim milk, •
the loss was 54.7%. Riboflavin losses for the double
boiling and ho·lding at 55oc were approximately 20% for
whole or skim milk.
Packaging material such as paperboard and plastic
containers did not greatly influence the losses of
vitamin A or of riboflavin. aowever, vitamin A retention
was better for whole than for skim milk.
As a result of these experiments, it is recommended
that milk in Saudi Arabia continue to be packaged in
paperboard containers. However, for maximum retention of
vitamin A and riboflavin, milk handlers and consumers
should be educated to stop heating milk and to store it
in the dark under refrigeration.
ACKNOWLEDGEMENTS
The author wishes to sincerely thank Dr. Marjorie J.
Caldwell for her guidance during the course of the
research and thesis preparation. Grateful appreciation
is also extended to the other committee members, Dr.
Kenneth L. Simpson and Dr. Lewis T. Smith.
The author also wishes to thank Dr. Arthur G. Rand,
Jr. Chairman of the Department, Dr. Henry A. Dymsza and
' Helen T. McCarthy for their advice and assistance.
Finally, the author wishes to express his special
appreciation to his father, his late mother, his sisters
and brothers and to all his friends who are in Saudi
Arabia.

TABLE OF CONTENTS
PAGE
ABSTRACT•··· • • • • . . . . . . . . . . . . . . . . . . . . . . . . . . . . . .ii ACKNOWLEDGMENTS. . . . . . . . . . . . . . . . . . . . . . . . . . . . • iv
TABLE OF CONTENTS. • • v
LIST OF TABLES •• . . . . . . . . . . . . . . . . . . . . . . . . . . . . . .vi
LIST OF FIGURES. . . . . . . . . . . . . . . . . . . . . . . . . . . . . .vii
INTRODUCTION •••••• . . . . . . . . . . . . . . . ~ . . . . . . . . . . . .1 '
LITERATURE REVIEW. . . . . . . . . . . . . . . . . . . . . . . . . . . . .3
MATERIALS AND EXPERIMENTAL PROCEDURE ••••••••• 24
RESULTS AND DISCUSSION. .32
SUMMARY AND CONCLUSION. .56
LIST OF REFERENCES ••••••••••••••••••••••••••• 88

LIST OF TABLES
PAGE
1. CONTENT OF VITAMIN A IN FLUID WHOLE MILK ••••••••••••• 9
2. RIBOFLAVIN CONTENT OF MILK •••••••••••••••••••••••••• 18
3. TRANSMISSION OF FLUORESCENT LIGHT THROUGH
VARIOUS MILK CONTAINER MATERIALS ••••••••••••••••••• 22
4. PROXIMATE COMPOSITION OF RAW AND PROCESSED
BOVINE MILK ••••••••••••••• ••••••••••••••••••••••••• 60
S. FLUORESCENCE UNIT OBTAINED FROM VARIOUS '
CONCENTRATION OF RETINYL ACETATE IN HEXANE ••••••••• 61
6. RECOVERY OF ADDED RETINYL PALMITATE (VITAMIN A
PALMITATE) FROM PASTEURIZED HOMOGENIZED
VITAMIN D MILK •• ••••••••••••••••••••••••••••••••••• 62
7. EFFECT OF REFRIGERATION AT 40C ON VITAMIN A
IN WHOLE AND SKIM MILK ••••••••••••••••••••••••••••• 63
8. EFFECT OF STORAGE IN ROOM TEMPERATURE AT 230C
ON VITAMIN A IN WHOLE AND SKIM MILK •••••••••••••••• 64
9. EFFECT OF HOLDING MILK AT 55oc AFTER BOILING
FOR 10 SECONDS ON VITAMIN A CONTENT •••••••••••••••• 65
10. EFFECT OF TWICE BOILING AND THEN HOLDING MILK AT
55oc FOR VARIOUS TIME ON VITAMIN A CONTENT ••••••••• 66
11. EFFECT OF BOILING AT lOOOc FOR 10 SECONDS ON
VITAMIN A IN MILK •••••••••••••••••••••••••••••••••• 67
vi

12. FLOURESCENCE UNIT OBTAINED FROM
VARIOUS CONCENTRATION RIBOFLAVIN
PAGE
IN 0.02N ACETIC ACID ••••••••••••••••••••••••••••• 68
13. EFFECT OF REFRIGERATION AT 4oc ON
RIBOFLAVIN IN WHOLE AND SKIM MILK ••••••••••••••••• 69
14. EFFECT OF STORAGE IN ROOM TEMPERATURE
AT (230C) ON RIBOFLAVIN IN WHOLE MILK ••••••••••••• 70
15. EFFECT OF HOLDING MILK AT 55oc. AFTER '
BOILING FOR 10 SECONDS ON RIBOFLAVIN
CONTENT • •••••••.••••••••••••••••••••••••••••••••••• 71
16. EFFECT OF TWICE BOILING AND THEN HOLDING
MILK A·r 550C FOR VARIOUS TIMES ON RIBOFLAVIN
CONTEt~T • •••••••••••••••••••••••••••••••••••••••••• 72
17. EFFECT OF BOILING AT lOOOC FOR 10 SECONDS
ON RIBOFLAVIN IN MILK •••••••.••••••••••••••••••••• 73
18. LINEAR REGRESSION ANALYSIS OF VITAMIN A
IN MILK ••••••••••••••••••••••••••••••••••••••••••• 74
19. LINEAR REGRESSION ANALYSIS OF RIBOFLAVIN
IN MILK ••••••••• •••••••••••••••••••••.•••••••••••• 76
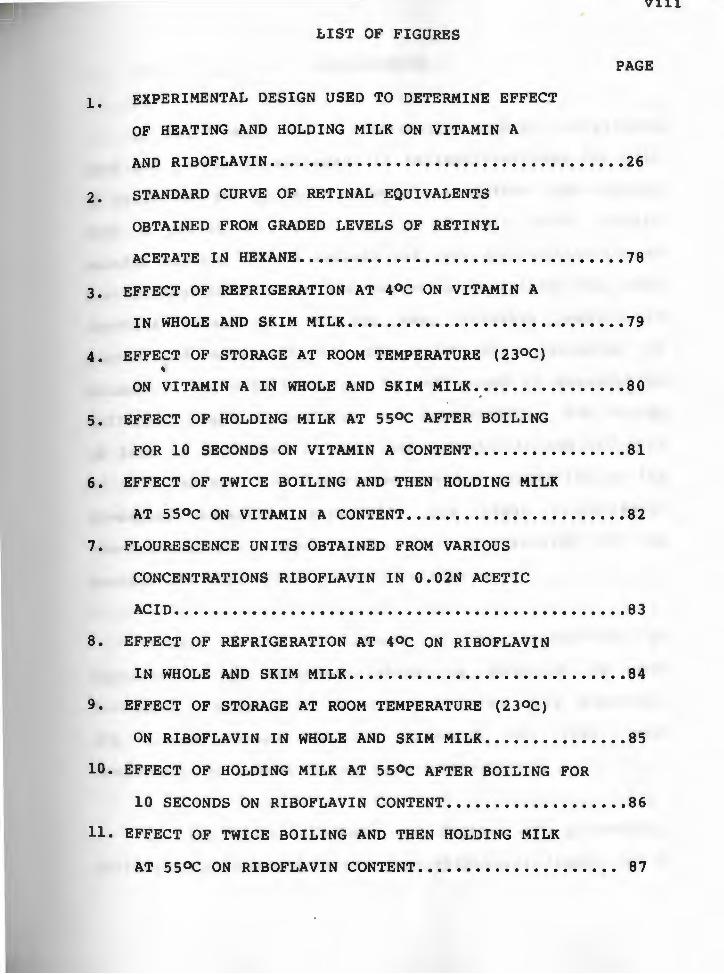
LIST OF FIGURES
1. EXPERIMENTAL DESIGN USED TO DETERMINE EFFECT
OF HEATING AND HOLDING MILK ON VITAMIN A
V111
PAGE
AND RIBOFLAVIN • .••••••••••••••••••••••••••••••••••• 26
2. STANDARD CURVE OF RETINAL EQUIVALENTS
OBTAINED FROM GRADED LEVELS OF RETINYL
ACETATE IN HEXANE •••••••••••••••••••••••••••••••••• 78
3. EFFECT OF REFRIGERATION AT 4oc ON VITAMIN A
IN WHOLE AND SKIM MILK ••••••••••••••••••••••••••••• 79
4. EFFECT OF STORAGE AT ROOM TEMPERATURE (2JOC) '
ON VITAMIN A IN WHOLE AND SKIM MILK •••••••••••••••• 80
5. EFFECT OF HOLDING l>IILK AT 55oc AFTER BOILING
FOR 10 SECONDS ON VITAMIN A CONTENT •••••••••••••••• 81
6. EFFECT OF TWICE BOILING AND THEN HOLDING MILK
AT SSOC ON VITAMIN A CONTENT ••••••••••••••••••••••• 82
7. FLOURESCENCE UNITS OBTAINED FROM VARIOUS
CONCENTRATIONS RIBOFLAVIN IN 0.02N ACETIC
ACID • •••••••••••••••••••••••••••••••••••••••••••••• 8 3
8. EFFECT OF REFRIGERATION AT 40C ON RIBOFLAVIN
IN WHOLE AND SKIM MILK ••••••••••••••••••••••••••••• 84
9. EFFECT OF STORAGE AT ROOM TEMPERATURE (230C)
ON RIBOFLAVIN IN WHOLE AND SKIM MILK ••••••••••••••• 85
10. EFFECT OF HOLDING MILK AT SSOC AFTER BOILING FOR
10 SECONDS ON RIBOFLAVIN CONTENT ••••••••••••••••••• 86
11. EFFECT OF TWICE BOILING AND THEN HOLDING MILK
AT 55oc ON RIBOFLAVIN CONTENT ••••••••••••••••••••• 87

INTRODUCTION
As fluid milk is a universally accepted nutritious
food for people of all ages, it is important that the milk
be processed and packaged to maintain maximum high quality
over a period of · time. Quality factors which require
careful control should include not only such parameters as
microbiological content and organoleptic indices but also
nutrient retention. Of the many vitamins present in
pasteurized milk, it is well known that retention of '
Vitamin A and riboflavin can be influenced by exposure to
different light intensities and wavelengths. The degree
of loss is dependent on time and temperature and the type
of milk package. Of importance are the properties of the
packaging material, especially its light transmission
characteristics. Type, size, and construction of the
package can also affect vitamin retention.
Vitamin A is considered to be susceptible to
destruction by oxidation which is enhanced by heat
treatment. Riboflavin is more stable to heat treatment,
but losses occur in the presence of light, with
enhancement of losses during high temperatures.
As may be expected, a degree of protection,
particularly from the deleterious effects of light, can be
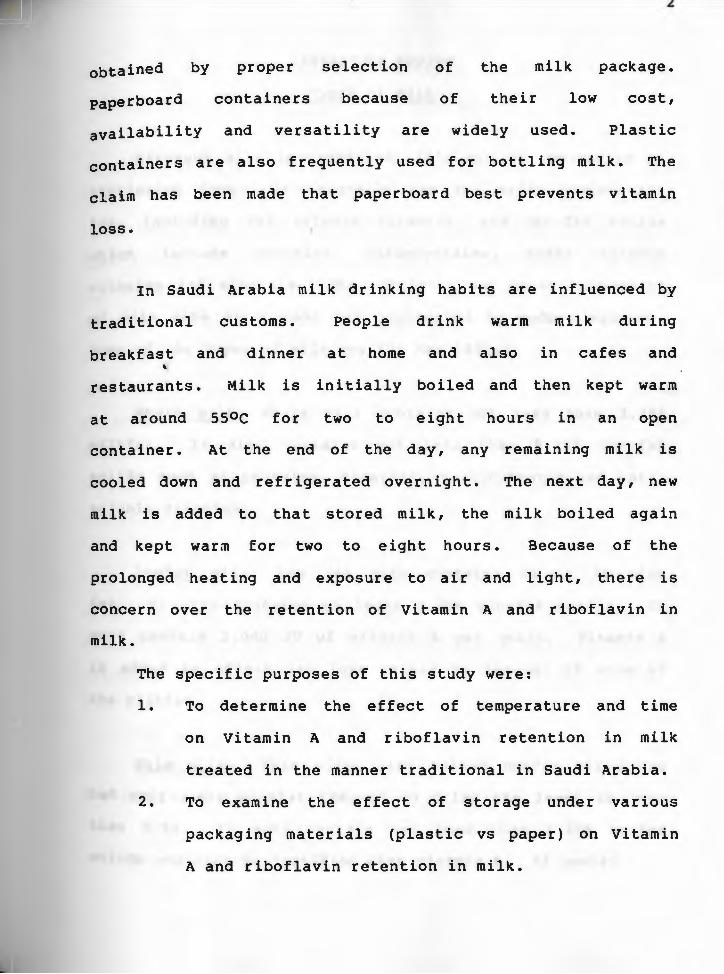
obtained
paperboard
by proper
containers
selection of
because of
the milk package.
their low cost,
availability and versatility are widely used. Plastic
containers are also frequently used for bottling milk. The
claim has been made that paperboard best prevents vitamin
loss.
In Saudi Arabia milk drinking habits are influenced by
traditional customs. People drink warm milk during
breakfast and dinner at home and also in cafes and '
restaurants. Milk is initially boiled and then kept warm
at around ssoc for two to eight hours in an open
container. At the end of the day, any remaining milk is
cooled down and refrigerated overnight. The next day, new
milk is added to that stored milk, the milk boiled again
and kept warm for two to eight hours. Because of the
prolonged heating and exposure to air and light, there is
concern over the retention of Vitamin A and riboflavin in
milk.
The specific purposes of this study were:
1. To determine the effect of temperature and time
on Vitamin A and riboflavin retention in milk
treated in the manner traditional in Saudi Arabia.
2. To examine the effect of storage under various
packaging materials (plastic vs paper) on Vitamin
A and riboflavin retention in milk.
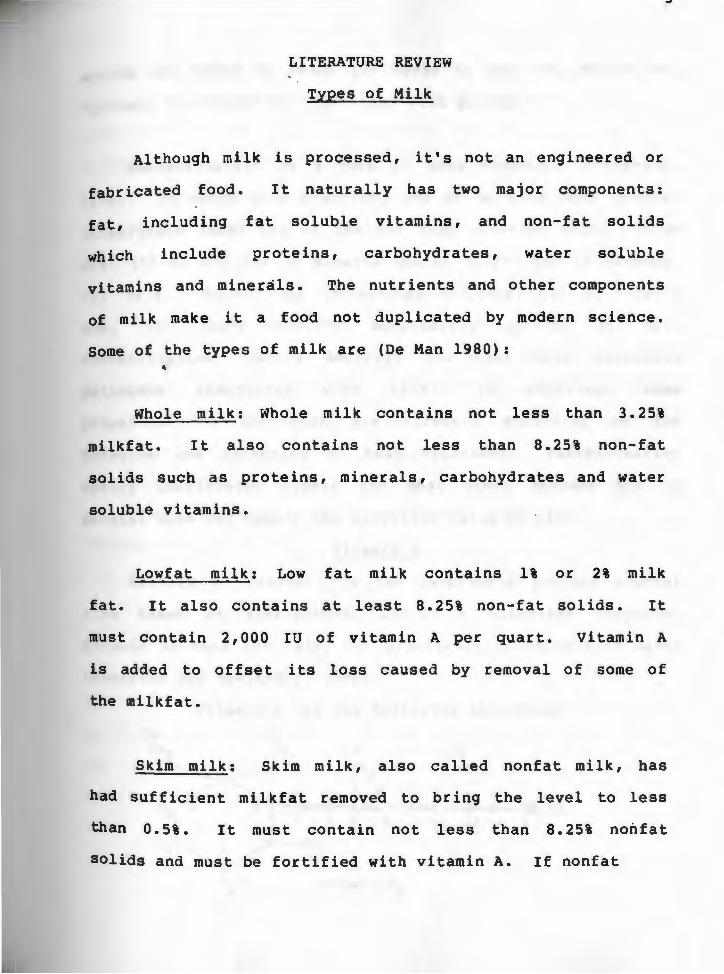
LITERATURE REVIEW
Types of Milk
Although milk is processed, it's not an engineered or
fabricated food. It naturally has two major components:
fat, including fat soluble vitamins, and non-fat solids
which include proteins, carbohydrates, water soluble
vitamins and minerals. The nutrients and other components
of milk make it a food not duplicated by modern science.
some of the types of milk are (De Man 1980): '
Whole milk: Whole milk contains not less than 3. 25%
milkfat. It also contains not less than 8.25% non-fat
solids such as proteins, minerals, carbohydrates and water
soluble vitamins.
Lowfat milk: Low fat milk contains 1% or 2% milk
fat. It also contains at least 8. 25% non-fat solids. It
must contain 2, 000 IU of vitamin A per quart. Vitamin A
is added to off set its loss caused by removal of some of
the milkfat.
Skim milk: Skim milk, also called nonfat milk, has
had sufficient milkfat removed to bring the level to less
than 0.5%. It must contain not less than 8.25% nonfat
solids and must be fortified with vitamin A. If nonfat
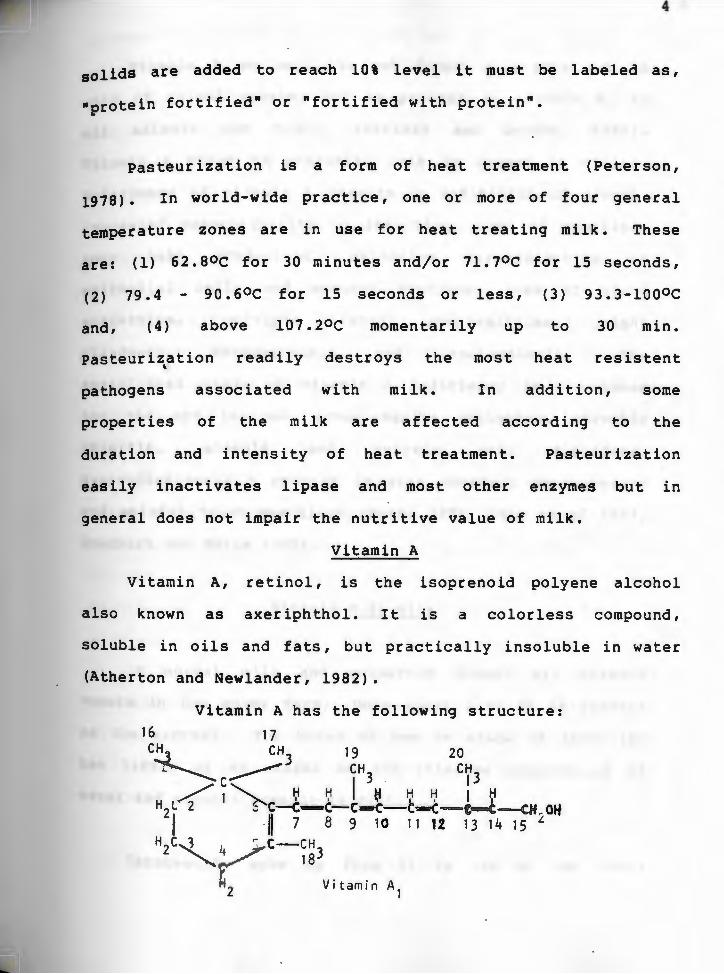
4
solids are added to reach 10\ level it must be labeled as,
•protein fortified• or "fortified with protein".
Pasteurization is a form of heat treatment (Peterson,
1978). In world-wide practice, one or more of four general
temperature zones are in use for heat treating milk. These
are: (1) 62.eoc for 30 minutes and/or 71. 7oc for 15 seconds,
(2) 79.4 - 90.6oc for 15 seconds or less, (3) 93.3-loooc
and, (4) above 107.20C momentarily up to 30 min.
Pasteurization readily destroys the most heat resistent '
pathogens associated with milk. In addition, some
properties of the milk are affected according to the
duration and intensity of heat treatment. Pasteurization
easily inactivates lipase and most other enzymes but in
general does not impair the nutritive value of milk.
Vitamin A
Vitamin A, retinol, is the isoprenoid polyene alcohol
also known as axeriphthol. It is a colorless compound,
soluble in oils and fats, but practically insoluble in water
(Atherton and Newlander, 1982).
Vitamin A has the following structure:
16 17 C!!t_ CH 19 20
.. ~ c__....-----3
cH3 . c~3 /1~ ~ ~ I tf H ~ I ~
H2t 2 .: c-c-c-c-c-c--c-c-c-at~ oH I . ~ 1 a 9 10 11 12 13 14 1 s J.
H2C~ 4/C-~~3
~2 Vitamin A1
· vitamin A as such, is not found in plants but is
onlY of animal origin, and is present as vitamin Ai in
all animals and fish. (Hartman and Dryden, 1965).
vitamin A plays an essential role in regard to vision.
Deficiency of vitamin A results in inhibition of growth,
increased susceptibility to infection, loss of appetite,
poor hair production, extensive keratinization of
epithelial cells and mucuous membrane, loss of gland
activities, multiple fetal abnormalities, night
blindness, xerophthalmia and keratomalacia. The '
established signs of vitamin A deficiency in the human
are the eye lesions, acne, senile vaginitis, atrophic
rhinitis, anosmia and certain skin disorders.
Hypervi taminosis A results in skin changes, hepatomegaly
and painful joint swellings (Marks 1979, Webb et al 1983,
Goodhart and Shila 19SO).
Vitamin A in Milk
In normal milk and colostrum almost all vitamin
occurs in the ester form. Only about 2 to 6% is present
as the alcohol. The breed of cow or stage of lactation
has little or no effect on the relative proportions of
ester and alcohol present in milk.
Carotenoids make up from 11 to 50% of the total
5

vitamin A activity of milk, and can be converted to the
vitamin in the animal body. The exact percentage depends
upon the breed of the cow and the level of carotenoid
intake (Reinart and Nesbitt, 1956). Since the intake of
these substances is generally higher during the summer
than during the winter, the fraction of total vitamin A
activity due to the provitamin is greater in summer milk
(Lord, 1945).
The yellow color of milk fat and of animal _fat is
due to the presence of carotenoids. The fat in Guernsey '
milk has a much more golden color than has that of
Holstein milk because it has a higher content of carotene.
{J-carotene makes up the greatest fraction of the
carotenoids in the milk (Strain, 1939). aie-carotene, is
generally absent from butterfat, but if cows are fed
carrots, which contain about 25% of their total
carotenoids in the form of 0<-carotene, this form of
carotene will also appear in the milk (Hauge, 1942).
A part of the total carotenoids in milk may consist
of compounds that are completely inactive as provitamin
A. Inactive substances can range from 5 to 25% of the
total carotenoids (Thompson and Kon, 1950).
6

The amount of vitamin A secreted into the milk and
milk fat, either as vitamin A itself or a carotene,
depends upon the level of carotene or vitamin A in the
ration of the cow (Hibbes, et al, 1949). Large increases
in the vitamin A content of milk can be obtained by
supplementing the ration of the cow with concentrated
sources of vitamin A such as fish liver oils. These oils
contain only vitamin A no carotene, and the increase in
the total vitamin A activity of the milk is all in the
form of vitamin A. When carotene was sharply increased '
in the diet, vitamin A secreted in milk was increased
very rapidly within 1-2 weeks (Thompson, and Ascarell,
1962).
A relationship between carotene and vitamin A and
off-flavors in milk was reported by several researchers.
The feeding of carotene but not of vitamin A was thought,
in the beg inning, to prevent the occurrence of oxidized
flavor in milk (Whitnah, et al, 1937). Later, however,
it was found (Trout and Gjessing, 1939) that it was not
carotene but some other factor in carotene concentrates
and carotene rich forages that was the effective
substance.
The Committee on Biological Standardization of the
World Health Organization has, as an international

standard, 1 IU of vitamin A equal to O. 30 micrograms of
vitamin A alcohol or 0. 6 micrograms of a-carotene. The
levels of vitamin A in fluid whole milk in late winter
are about 1,083 IO/Liter and, in summer, about 1,786 IU/
Liter. This difference was not due to the season but to
differences between winter feed and summer pasture (Cary,
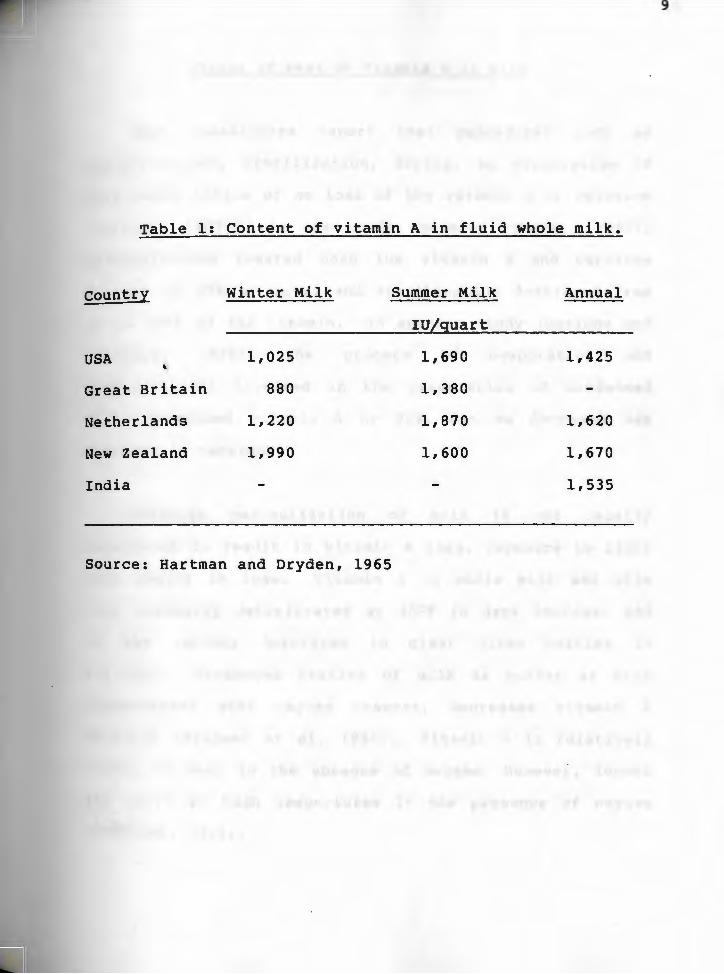
et al 1947). The content of vitamin A in fluid whole
milk, measured in International Units per quart, for
winter and summer, in different countries, is shown in
Table 1 (Hartman and Dryden, 1965). '
In the United States, vitamin A palmitate is added
to whole milk and skim milk at a concentration of 2, 000
IU per quart. Vitamin A fortified skim milk is subject
to decreases in vitamin A, because the vitamin is no
longer protected by fat as it is in whole milk. In fluid
skim milk, added vitamin A deteriorated gradually during
normal storage of the milk at 4. 4oc in the dark but was
destroyed rapidly when the milk was exposed to sunlight
in clear-glass bottles (Cox et al, 1957, and Birdsall, et
al. 1958).
0
9
Table 1: Content of vitamin A in fluid whole milk.
country Winter Milk Summer Milk Annual
IO/quart
USA 1,025 1,690 1,425 '
Great Britain 880 1,380
Netherlands 1,220 1,870 1,620
New Zealand 1,990 1,600 1,670
India 1,535
Source: Hartman and Dryden, 1965
Effect of heat on Vitamin A in milk
Most researchers report that procedures such as
pasteurization, sterilization, drying, or evaporation of
milk cause little or no loss of the vitamin A or carotene
(Fennema, 1977). In one study, however (Wagner, 1957),
pasteurization lowered both the vitamin A and carotene
content by 20% or more, and sterilization destroyed from
JO to 100% of the vitamin. In another study (Davidov and
Kruglova, '
1959), the process of evaporation and
pasteurization involved in the prepara~ion of condensed
milk, decreased vitamin A by 20%, but no decrease was
observed in carotene.
Although pasteurization of milk is not usually
considered to result in vitamin A loss, exposure to light
will result in loss. Vitamin A in whole milk and skim
milk gradually deteriorated at 400F in dark storage, and
it was rapidly destroyed in clear glass bottles in
sunlight, Prolonged heating of milk or butter at high
temperatures with oxygen present, decreases vitamin A
activity (Fragner et al, 1956). Vitamin A is relatively
stable to heat in the absence of oxygen, however, losses
may occur at high tempertures in the presence of oxygen
(DeRitter, 1976).
10

The observation that added vitamin A is more stable
in dry whole milk than in nonfat dry milk solids suggest
thatthe fat in dry whole milk is involved in some manner
in stabilizing vitamin A (Cox et al, 1957). Destruction
of vitamin A was less in dried milk preheated to 1800F
for 30 minutes than in those preheated to 1450F for the
same period of time.
More vitamin A is destroyed during the boiling of
' reconstituted milk than during the boiling of fresh milk
(Wilkinson and Conochie, 1958). With milk reconstituted
from vitamin A-fortified skim milk powder, such losses
ranged from 2 to 20% after 2 minutes of boiling and
increased to 30% after 30 minutes of boiling. In another
study, (Bauernfeind and Allen, 1963), decreases in
potency were smaller1 about 3 to 6% after 2 minutes and 6
to 9% after 30 minutes of boiling. When milk was heated
at 22ooc for 10 minutes, all vitamin A activity was
destroyed (Hattianydi and Kanga, 1956).
Legge and Richards (1978) reported that vitamin A
and beta-carotene did not show any significant change in
concentration when human milk was heated to 860C for 1
minute.

Effect of packaging on vitamin A in milk
The protection offered by a package is determined
by the nature of the packaging materials and by the type
of package construction. Packaging is a decisive factor
in controlling nutrient retention in milk. There are
three basic classes of packaging materials as related to
light transmission a) transparent glass and clear
plastic films, b) opaque-aluminum foil and laminates and
c) translucent-paper, cardboard and plastic (Sat tar and '
OeMan, 1975).
A very considerable proportion of packaged food is
stored and distributed in packages made of paper-based
materials • It seems probable that, because of its low
cost, ready availability, and great versatility, paper
will retain its predominant packaging position for some
time to come. (Karel amd Heidelbaugh, 1975).
Paper cartons block out 98 percent of the
destructive light. Paper gallon 2-paks are also easier
to store, because they take up less space, fit in
refrigerator doors and are easily disposed of in the
home. (International Paper Company, 1982).
Other major types of milk containers on the market
today include flint glass, olefin-coated fiber.board,
blow-molded polyethylene and the polyethylene pouch
(Dimick, 19781 Siddall, 1957). Both the polyethylene and
the polycarbonate containers have been shown to absorb
contaminants, and to impart off odors into the product
(Landsberg et al, 1977).
Barnard (1974), reported that 16% of the serious
criticisms concerning the flavor of milk were due to '
oxidation. The majority were attributed to milk held in
translucent or transparent containers, i.e. blow-molded
plastic, glass, and the plastic pouch. Hankin and
Dillman (1972), reported a similar study in which 31% and
33% of milk in glass and plastic containers were oxidized
as compared to 4. 4% in paper cartons. In conveying milk
products from stores to home in transparent or
translucent containers, a flavor problem could develop.
A light-induced off-flavor is a function of the amount of
radiant energy at the milk surface and the length of
exposure (Bradley, 1980).
Sattar et al (1977), showed that losses of vitamin A
and its precursor could be markedly reduced by limiting
exposure of milk to energy below 465 nm. Destruction was
not autocatalytic and followed zero-order kinetics. No
13

synergism was observed except that at p-carotene
concentrations of greater than 2.5 ug/ml, a protective
effect on vitamin A was observed.
Hansen et al (1975), reported that homogenized milk
packaged in polyethylene containers exposed to
fluorescent light showed both flavor and vitamin
deterioration. Vitamin A in whole milk packaged in
plastic pouches (DeMan, 1980), dropped to 67. 7% of its '
original content by 30 hours after exposure to 2. 200 lx
intensity fluorescent light and remained constant for a
further 18 hours. In 2% milk, it dropped to 23.6% and in
skim milk, to 4.2% of the original content. The 2% milk
had an original_ Vitamin A content about twice as high as
that of whole or skim milk.
In the fortification of low-fat fluid milks with
Vitamin A (retinyl palmitate), Thompson and Erdody,
(1974), demonstrated that this form of the vitamin was
rapidly destroyed following fluroescent light exposure.
Losses up to 60% occured in milk in glass following 200
feet-candles fluorescent light exposure for 3 hours.
When milks were packaged in blow-molded polyethylene, 50%
losses in total vitamin A occured in low fat milks
supplemented with retinyl palmitate.
14
cox et al, (1957), studied the effect of exposure of
pasteurized whole and skim milk on retention of Vitamin
The milk was packaged in amber glass bottle, plain A.
glass bottles and waxed paperboard cartons and was
exposed to diffused daylight and to short time
irradiation with direct sunlight. Care was taken to
avoid temperature changes. It was found that amber
glass bottles and paperboard cartons afforded good
protection, but plain glass bottles did not prevent '
considerable losses of the vitamin. Because of the
highly unsaturated character of the molecules, it is
susceptible to influence of light, and this includes
sunlight as well as artificial light (Hartmand and
Dryden, 1965).
Riboflavin
Vitamin B2, riboflavin, lactoflavin or vitamin G is
a yellow-orange to yellow-green pigment. It is a heat
stable and one of the least soluble of water soluble
vitamins. The riboflavin molecule consists of a
D-ribitol unit attached to an isoalloxazine ring, as is
shown in the following structures.
15

16
Riboflavin
'
Riboflavin is a constituent of two coenzymes, fl av in
mononucleotide (FMN) and f lavin adenine dinucleotide
(Bartman and Dryden, 1965). Riboflavin has a profound
effect on such processes as tissue repair, tissue growth,
reproduction and lactation.
Early symptoms of riboflavin deficiency may be
related to oral or ocular lesions. Oral lesions include
soreness and burning of the lips, mouth and tongue and
cracking at the corner of lips. Ocular symptoms include
Photophobia, lachrymation, burning and itching of the
eyes, visual fatique, blepharospasms and loss of visual
acuity (Marks, 1979). Dermatitis is also a symptom.

!,ibof lavin content in milk
The average riboflavin content of fluid milk is
about 1.75 mg. per liter. Values for riboflavin content
of various types of milk are shown in Table 2. It has
been estimated that m·ilk contributes about 40 to 50% of
the total riboflavin in the diet of the United States
(Webb et al, 1983).
' The riboflavin content of milk is usually higher
during the spring or summer. This difference has been
associated with a change in ration from indoor feeding to
fresh pasture feeding (Kramer et al, 1939). Increases of
20% to 50% have been reported. In other instances,
however, no significant differences were found between
summer and winter rations {Gregory et al, 1958) •
Supplementation of the rate of the cow with crystalline
riboflavin did not increase the content of riboflavin in
milk {Marsh et al, 1947).
~orms of Riboflavin in milk
From 65 to 95% of the riboflavin in cow's milk is in
the free form {Modi et al, 1959) • According to Modi and
Owen (1956) the rest is present as FAD, and there is none
17

18
Table 2: Riboflavin Content of Milk
~ AVERAGE (mg/kg) RAU GE (mg/kg)
Whole milk
Fluid ' 1.75 0.81 - 2.58 Condensed 3.6 2.6 4.0 Evaporated 3.8 2.8 4.8 Dried 15.5 9.8 - 25.6
Skim milk
Fluid 1.7 1.5 1.8 Dried 18.9 13.0 - 25.4
Source: Webb, et al, 1983.
as FMN. Funai (1955), however, reported 21% in the form
of FMN, with 14% as FAD and the remainder in the free
form. In skim milk, Nagasawa et al, (1961), found 94-95%
of the riboflavin free, with the remainder bound about
60% as FMN and 40% as FAD.
The bound riboflavin in milk is, for the most part,
attached to protein as part of an enzyme (Modi et al,
1959) • The sites of binding between the vitamin and '
casein may be the tyrosine residues of the protein
(Leviton and Pollansch, 1960).
Effects of Heat on Riboflavin in Milk
Losses of riboflavin due to heating are generally
enhanced and complicated by the effects of light. In the
absence of light, the riboflavin in milk is quite stable
to heat.
No decrease in the vitamin occurred when pasteurized
milk was heated for 22 hours at 37oc and similar results
were obtained from raw milk (Sure and Fore, 1943).
Heating milk in dark brown bottles at loooc for 15
minutes caused only 5% loss in riboflavin (Funai, 1957).
19
pasteurization caused only a negligible amount of
destruction of the vitamin (Holmes, 1944) / or none at all
(Ford, et al, 1959). No loss was reported when milk was
pasteurized under 8 atm oxygen pressure (Luck and
Schillinger, 1959). When fresh skim milk was heated at
lOOOC for 45 minutes in the dark, only 5% destruction of
riboflavin occured (Williams and Cheldelin, 1942) •
Homogenization of milk has no effect whatsoever on the
riboflavin (Theophilus and Stamberg, 1945). '
Stomberg and Theophilus (1944),, found that the rate of
destruction of riboflavin was related directly to milk
temperature as well as the amount of light transmitted
through the containers. This would mean greater loss in
summer months when product temperature, in general, would
be higher.
No changes in riboflavin were observed when human
milk was heated at 62.5oc for 30 minutes; 72oc for 15
seconds; a3oc for 5 seconds and loooc for 5 minutes
(Goldsmith et al., 1983).
Effect of packaging on Riboflavin in Milk
The protection of riboflavin is of vital interest,
20
, not only to the scientist but also to the consumer as
well· Packaging material plays a significant role in
preventing destruction of naturally occurring or
fortified vitamins (Senyk and Shipe, 1981).
aasken and Dimik (1979) , have reported that the
protection effect of milk containers is due to the light
transmission properties of packaging material.
Transmission characteristic of different milk containers '
are shown in Table 3.
The use of containers other than clear glass bottles
increased the retention of riboflavin upon exposure to
light. Brown, amber or ruby glass bottles or waxed paper
cartons lessen considerably or eliminate its destruction
(Dunkley et al 1962).
Sattar and DeMan (1973),observed that the paperboard
carton and returnable plastic jug were both inadequate
for protection of milk from loss of flavor and
nutritional value. At 100 foot candles of light, the
riboflavin losses were 7.1%, 11.1% and 22.3% for the
carton, jug and clear package, respectively, compared to
essentially no loss in the opaque pouch.
21
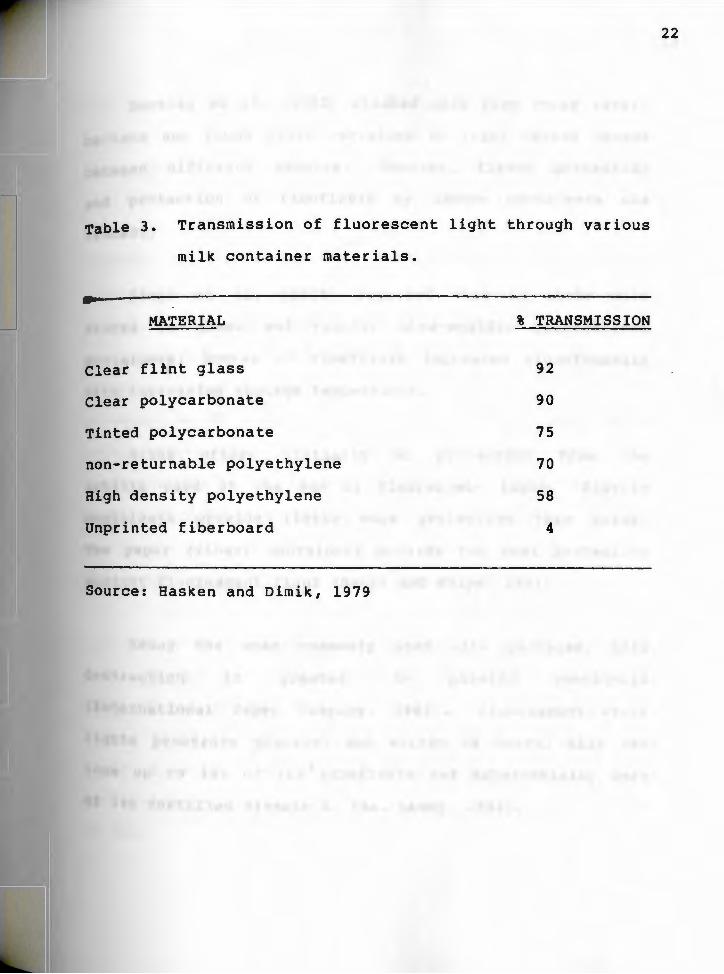
Table 3. Transmission of fluorescent light through various
milk container materials.
MATERIAL
Clear flint glass
Clear polycarbonate
Tinted polycarbonate
non-returnable polyethylene
High density polyethylene
Unprinted fiberboard
Source: Hasken and Dimik, 1979
% TRANSMISSION
92
90
75
70
58
4
22

ounkley et al, (1962) studied milk from three retail
markets and found great variation in light caused damage
between different samples. However, flavor protection
and protection of riboflavin by opaque containers was
evident.
Singh et al, (1975), reported that in whole milk
stored in glass and regular blow-moulded polyethylene
containerp, losses of riboflavin increased significantly
with increasing storage temperature.
Glass offers virtually no protection from the
actinic rays of the sun or fluorescent light. Plastic
containers provide little more protection than glass.
The paper (fiber) containers provide the most protection
against fluorescent light (Senyk and Shipe , 1981).
Among the most commonly used milk packages, this
destruction is greatest in plastic containers
(International Paper Company, 1982). Fluorescent store
lights penetrate plastic, and within 24 hours, milk can
lose up to 14% of its riboflavin and substantially more
of its fortified Vitamin A. (Ms. Levey, 1982).
23
MATERIALS AND EXPERIMENTAL PROCEDURES
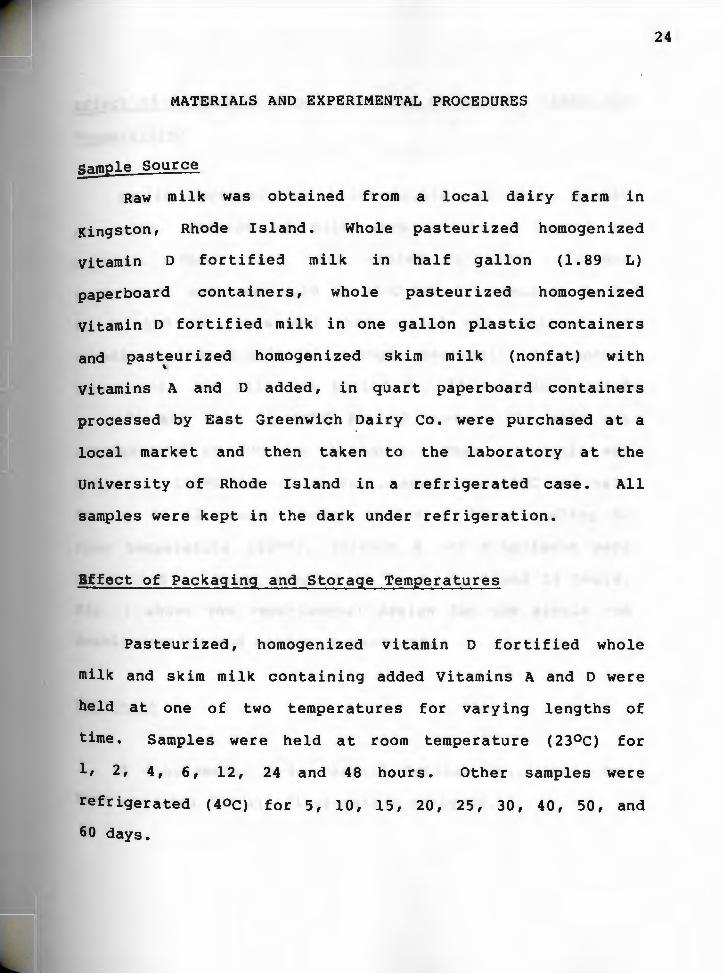
sample source
Raw milk was obtained from a local dairy farm in
Kingston, Rhode Island. Whole pasteurized homogenized
vitamin D fortified milk in half gallon (1.89 L)
paperboard containers, whole pasteurized homogenized
vitamin D fortified milk in one gallon plastic containers
and pasteurized homogenized skim milk '
(nonfat) with
vitamins A and D added, in quart paperboard containers
processed by East Greenwich Dairy Co. were purchased at a
local market and then taken to the laboratory at the
University of Rhode Island in a refrigerated case. All
samples were kept in the dark under refrigeration.
Bffect of Packaging and Storage Temperatures
Pasteurized, homogenized vitamin D fortified whole
milk and skim milk containing added Vitamins A and D were
held at one of two temperatures for varying lengths of
time. Samples were held at room temperature ( 2JOC) for
1, 2, 4, 6, 12, 24 and 48 hours. Other samples were
refrigerated (40C) for s, 10, 15, 20, 25, 30, 40, SO, and
60 days.
24
.feet of Single or Double Heating at Various Times and
!emeeratures
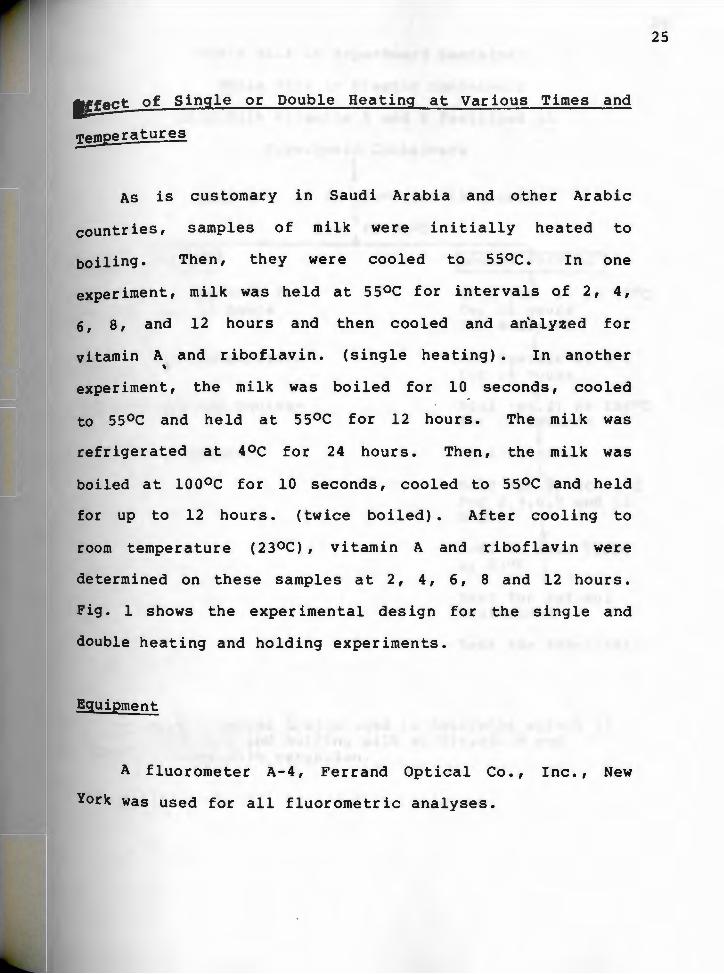
As is customary in Saudi Arabia and other Arabic
countries, samples of milk were initially heated to
boiling. Then, they were cooled to ssoc. In one
experiment, milk was held at ssoc for intervals of 2, 4,
6, a, and 12 hours and then cooled and an'alyzed for
vitamin A and riboflavin. (single heating). In another '
experiment, the milk was boiled for 10 seconds, cooled
to ssoc and held at ssoc for 12 hours. The milk was
refrigerated at 4oc for 24 hours. Then, the milk was
boiled at loooc for 10 seconds, cooled to ssoc and held
for up to 12 hours. (twice boiled) • After cooling to
room temperature (230C), vitamin A and riboflavin were
determined on these samples at 2, 4, 6, 8 and 12 hours.
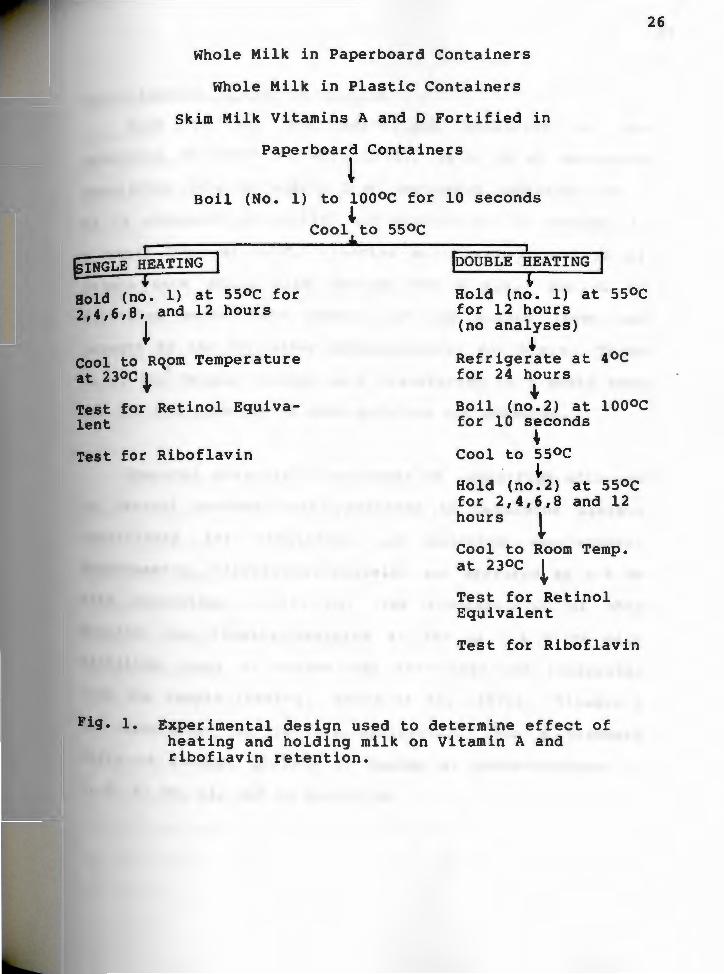
Fig. 1 shows the experimental design for the single and
double heating and holding experiments.
Equipment
A fluorometer A-4, Ferrand Optical Co., Inc., New
York was used for all fluorometric analyses.
25
Whole Milk in Paperboard Containers
Whole Milk in Plastic Containers
Skim Milk Vitamins A and D Fortified in
Paperboard Containers
t Boil (No. 1) to loooc for 10 seconds
!:INGLE ?ATING
sold (no. 1) at ssoc for 2 4,6,8, and 12 hours ' l
Cool to Rqom Temperature at 2JOC i
~ Cool to ssoc ..
looUBLE tEATING
Hold (no. 1) at ssoc for 12 hours (no analyses)
~ Refrigerate at 4oc for 24 hours
26
Test for Retinol Equivalent
~ Boil (no.2) at loooc
Test for Riboflavin
for 10 seconds ~
Cool to ssoc ~
Hold (no.2) at ssoc for 2,4,6,8 and 12 hours l Cool to Room Temp. at 23oc i Test for Retinol Equivalent
Test for Riboflavin
Pig. 1. Experimental design used to determine effect of heating and holding milk on Vitamin A and riboflavin retention.
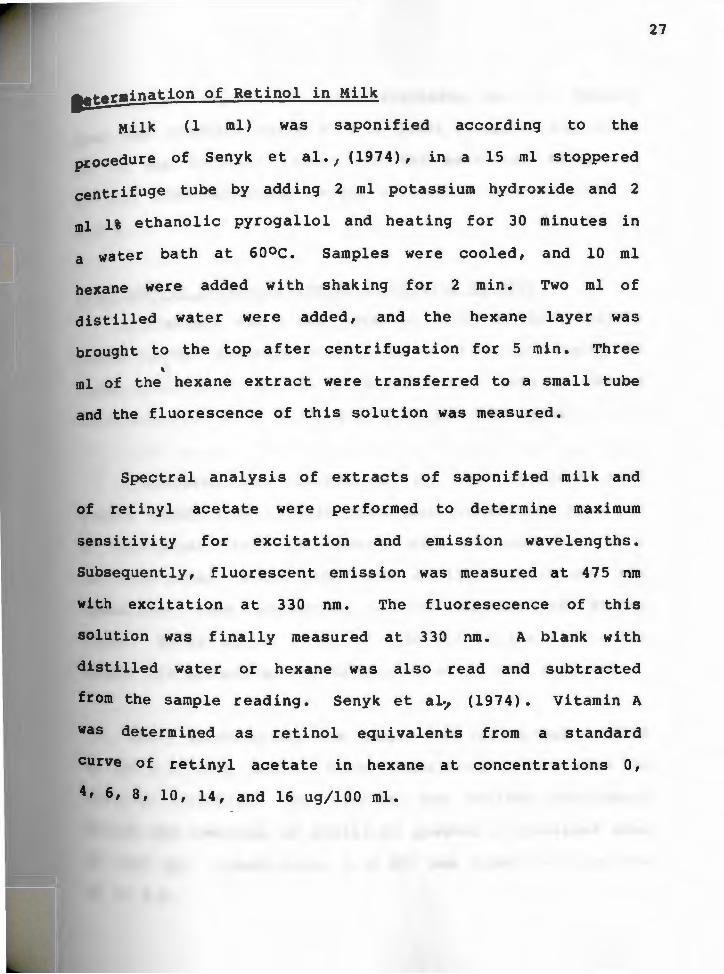
l!termination of Retinol in Milk
Milk (1 ml) was saponified according to the
procedure of Senyk et al. / (1974), in a 15 ml stoppered
centrifuge tube by adding 2 ml potassium hydroxide and 2
ml 1% ethanolic pyrogallol and heating for 30 minutes in
a water bath at 6ooc. Samples were cooled, and 10 ml
hexane were added with shaking for 2 min. Two ml of
distilled water were added, and the hexane layer was
brought to the top after centrifugation for 5 min. Three
' ml of the hexane extract were transferred to a small tube
and the fluorescence of this solution was measured.
Spectral analysis of extracts of saponif ied milk and
of retinyl acetate were performed to determine maximum
sensitivity for excitation and emission wavelengths.
Subsequently, fluorescent emission was measured at 4 75 nm
with excitation at 330 nm. The f luoresecence of this
solution was finally measured at 330 nm. A blank with
distilled water or hexane was also read and subtracted
from the sample reading. Senyk et al-,, (1974). Vitamin A
was determined as retinol equivalents from a standard
curve of retinyl acetate in hexane at concentrations O,
4, 6, 8, 10, 14, and 16 ug/100 ml.
27
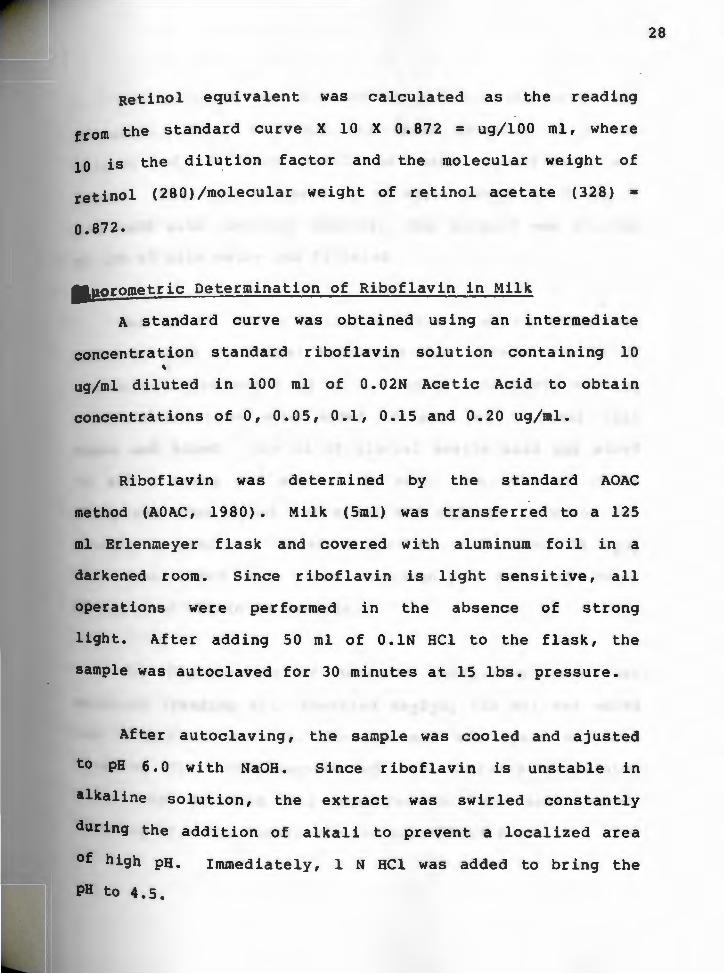
Retinol equivalent was calculated as the reading
from the standard curve X 10 X O. 872 = ug/100 ml, where
10 is the dilu_tion factor and the molecular weight of
retinol (280)/molecular weight of retinol acetate (328) z
Q.872.
llporometric Determination of Riboflavin in Milk
A standard curve was obtained using an intermediate
concentration standard riboflavin solution containing 10 '
ug/ml diluted in 100 ml of 0. 02N Acetic Acid to obtain
concentrations of O, 0.05, 0.1, 0.15 and 0.20 ug/ml.
Riboflavin was determined by the standard AOAC -
method (AOAC, 1980). Milk (5ml) was transferred to a 125
ml Erlenmeyer flask and covered with aluminum foil in a
darkened room. Since riboflavin is light sensitive, all
operations were performed in the absence of strong
light. After adding 50 ml of 0. lN HCl to the flask, the
sample was autoclaved for 30 minutes at 15 lbs. pressure.
After autoclaving, the sample was cooled and ajusted
to PH 6. 0 with NaOH. Since riboflavin is unstable in
alkaline solution, the extract was swirled constantly
during the addition of alkali to prevent a localized area
Of high pH. Immediately, 1 N HCl was added to bring the
PH to 4.5.
28

The solution was diluted to 100 ml with water and
filtered. Then, 1 N HCl was added dropwise to 50 ml
aliquot of filtrate until no more precipitate was
formed. This was followed by an equal number of drops of
l N NaOH with constant shaking. The aliquot was diluted
to 100 ml with water and filtered.
Ten ml of sample solution plus 1 ml of water was
added to each of 2 test tubes and then mixed. Ten ml of '
sample solution and 1 ml of O. 5 ug/ml riboflavin working
standard solution were added to each of 2 other test
tubes and mixed. One ml of glacial acetic acid was added
to all 4 tubes and mixed. To each tube, O. 5 ml of 3%
KMno4 was then added and mixed and allowed to stand for
exactly 2 minutes. After 2 minutes, 0. 5 ml of 3% H202
was then added and mixed thoroughly.
disappeared within 10 seconds.
The red color
The fluorescence of extracts containing water was
measured (reading A). Powdered Na 2s204 (20 mg) was added
and within 10 seconds, fluorescence was again measured
(reading C) • Fluorescence of the extracts containing
riboflavin standard was measured in the same manner
(reading B). The riboflavin was calculated from
29

following formula: the
30
A-C x Amount of riboflavin added x dilution x 1 = ug/gm -8-A 10-ml aliquot factor sample wt.
Reading A = 10 ml filtrate and 1 ml water, Reading B 10 ml
filtrate plus and 1 ml O.S ug riboflavin standard, and
Reading c = blank of filtrate. Sample weight (S ml) was S.16
gm. The dilution factor was 100 or 2.
so '
Therefore riboflavin content of milk (ug/gm) = A-C x o.s x 100 x 100 x 1 z ug/gm
B-A 10 so S.16gm
Ill in, Fat, Moisture, Ash and Solids Determination
Percent moisture in the sample was determined by drying
(lOSOC) a small portion to constant weight for 24 hours.
Protein, fat and ash were determined by standard AOAC methods
(AOAC, 1980). Total solids and nonfat solids were determined
by calculation from the proximate analysis values.
II! £'stical Analysis
Means and standard deviations were determined for
retinol and riboflavin content of milk samples as
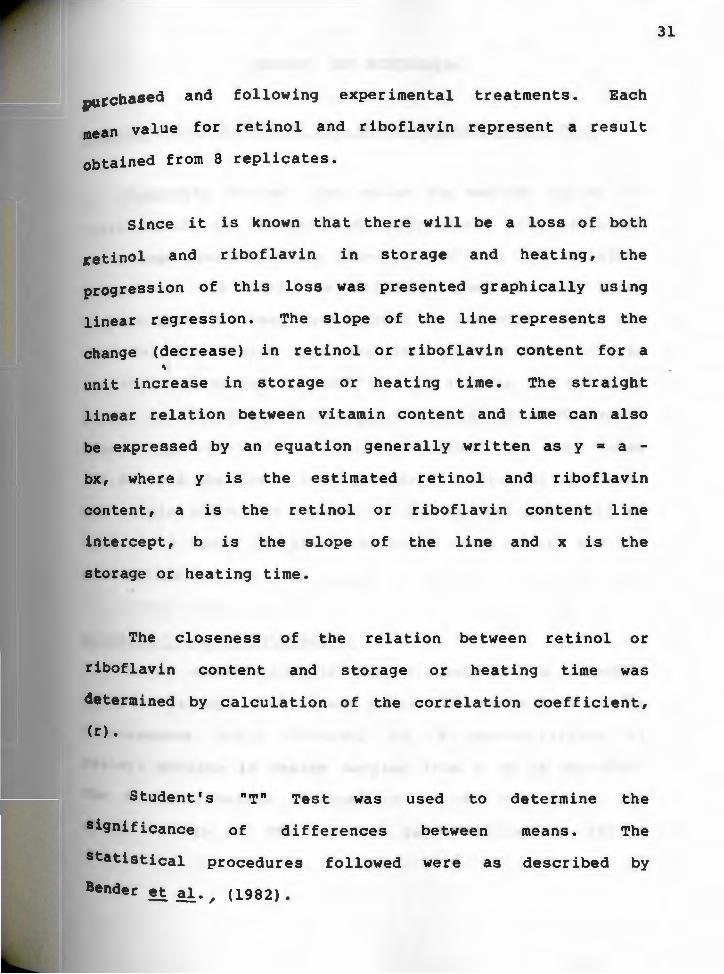
purchased and following experimental treatments. Each
mean value for retinol and riboflavin represent a result
obtained from 8 replicates.
since it is known that there will be a loss of both
i:etinol and riboflavin in storage and heating, the
progression of this loss was presented graphically using
linear regression. The slope of the line represents the
change (decrease) in retinol or riboflavin content for a '
unit increase in storage or heating time. The straight
linear relation between vitamin content and time can also
be expressed by an equation generally written as y = a -
bx, where y is the estimated retinol and riboflavin
content, a is the retinol or riboflavin content line
intercept, b is the slope of the line and x is the
storage or heating time.
The closeness of the relation between retinol or
riboflavin content and storage or heating time was
determined by calculation of the correlation coefficient,
(r) •
Student's "T" Test was used to determine the
significance of differences between means. The
statistical procedures followed were as described by
Bender.!!. al., (1982).
31

RESULTS AND DISCUSSION
lllllrt•ate Composition of Raw and Processed Bovine Milk
Proximate analysis and values for non-fat solids and
total solids of raw milk and pasteurized milk subjected
to various treatments are shown in Table 4. The moisture
content of the milk was slightly lower in the three
samples that had been heated than in raw milk. This was
true for the sample that was only pasteurized and also '
for the milk heated to loooc for 10 seconds and the milk
boiled at loooc and subsequently held at ssoc for 2
hours. As expected, raw milk contained the most water
(87.0%) and the least total solids (13.0%). In contrast,
the sample which was heated to boiling and then held at
ssoc for 2 hours contained the least water (84.6% and the
most solids (15.2%) •
... ndard Curve for Vitamin A:
After calibration of the fluorometer, a standard
curve of retinyl acetate was prepared. Table 5 shows the
fluorescence units obtained for 6 concentrations of
retinyl acetate in hexane ranging from 4 to 16 ug/lOOml.
The standard . curves obtained at 330 nm and 360 nm are
shown in Fig. 2. The standard curve obtained at 330 nm
32
was used to calculate the vitamin A values of the samples
analyzed.
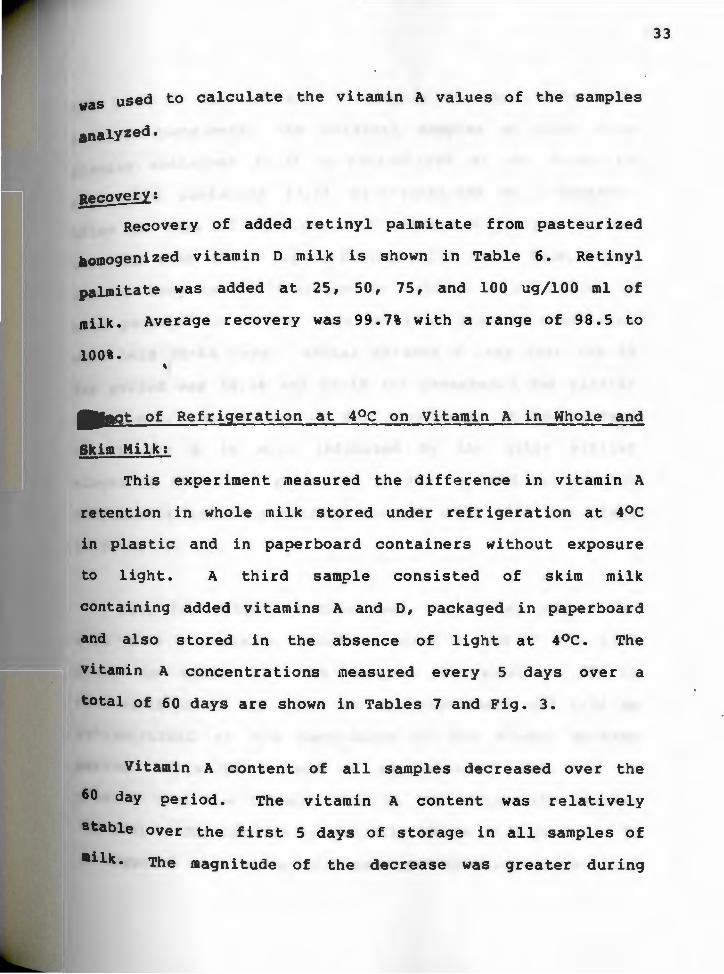
1.ecovery:
Recovery of added retinyl palmitate from pasteurized
&aomogenized vitamin D milk is shown in Table 6. Retinyl
palmitate was added at 25, 50, 75, and 100 ug/100 ml of
milk. Average recovery was 99.7% with a range of 98.5 to
100\. '
.'Rt of Refrigeration at 4oc on Vitamin A in Whole and
Skim Milk:
This experiment measured the difference in vitamin A
retention in whole milk stored under refrigeration at 4oc
in plastic and in paperboard containers without exposure
to light. A third sample consisted of skim milk
containing added vitamins A and D, packaged in paperboard
and also stored in the absence of light at 4oc. The
vitamin A concentrations measured every 5 days over a
total of 60 days are shown in Tables 7 and Fig. 3.
Vitamin A content of all samples decreased over the
60 day period. The vitamin A content was relatively
stable over the first 5 days of storage in all samples of
•ilk. The magnitude of the decrease was greater during
33
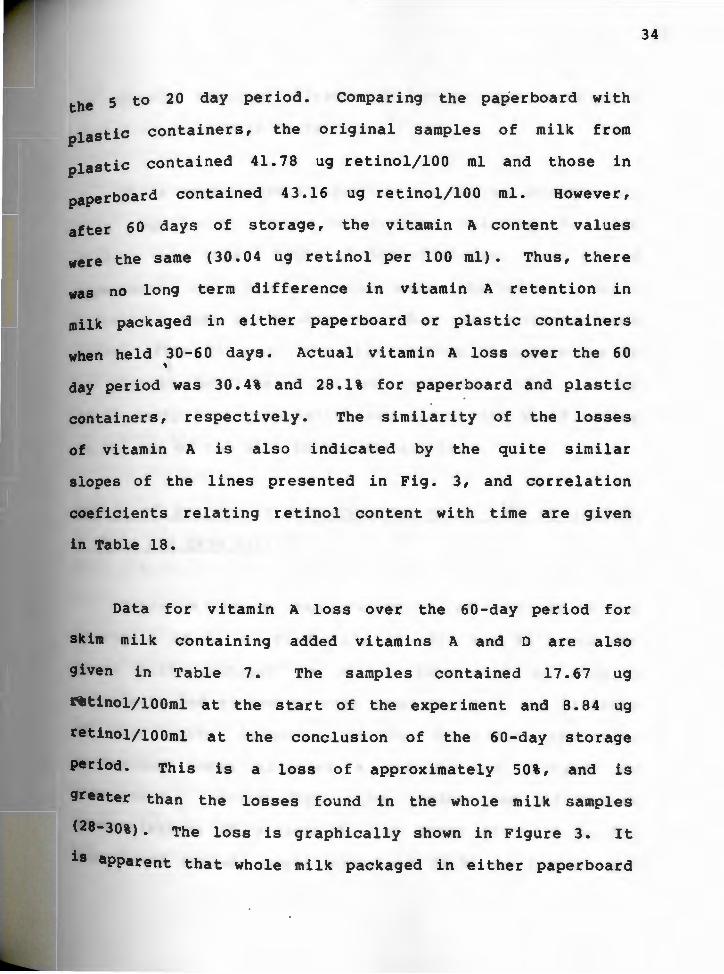
the 5 to 20 day period.
plastic
plastic
containers, the
contained 41.78
Comparing the paperboard with
original samples of milk from
ug retinol/100 ml and those in
paperboard contained 43.16 ug retinol/100 ml. However,
after 60 days of storage, the vitamin A content values
were the same (30.04 ug retinol per 100 ml). Thus, there
was no long term difference in vitamin A retention in
milk packaged in either paperboard or plastic containers
when held 30-60 days. Actual vitamin A loss over the 60 '
day period was 30. 4% and 28 .1 % for paperboard and plastic
containers, respectively. The similarity of the losses
of vitamin A is also indicated by the quite similar
slopes of the lines presented in Fig. 3, and correlation
coeficients relating retinol content with time are given
in Table 18.
Data for vitamin A loss over the 60-day period for
skim milk containing added vitamins A and D are also
given in Table 7. The samples contained 17.67 ug
~tinol/lOOml at the start of the experiment and 8. 84 ug
retinol/lOOml at the conclusion of the 60-day storage
.Period. This is a loss of approximately 50%, and is
greater than the losses found in the whole milk samples
<28-30%). The loss is graphically shown in Figure 3. It
is apparent that whole milk packaged in either paperboard
34

or plastic retained vitamin A better than skim milk
stored in paperboard containers.
While measurement of quality was not an objective of
this experiment, some observations relating to milk
quality were made. After 15 day of storage, both closed
paperboard and plastic containers started to swell
indicating some gas production. When the containers were
opened after 20 days, the milk samples in paperboard or '
in plastic containers had an unpleasant odor. After
25-30 days, some coagulation was noted with fluid rising
to the top of the milk in the containers •
.. ct of Storage at Room Temperature at 23oc on Vitamin
I Whole and Skim Milk:
Table 8 shows the retention of vitamin A at
intervals of 1, 2, 4, 6, 12, 18, 24, and 48 hours for
whole milk packaged in either paperboard or plastic
containers and stored at room temperature in the presence
of room light. Retention is also shown for skim milk,
containing added vitamins A and o, and packaged in
paperboard. Originally, the milk had different
concentrations of vitamin A. As shown in Table 8, the
paperboard stored sample contained 43. 96 ug retinol per
35

36
100 ml, and the plastic container stored sample contained
41. 78 ug retinol per 100 ml. Losses of vitamin A in 12
hours were 14.3% and 15.3%, for paperboard and plastic
containers, respectively. After 24 hrs, decreases were
l8.2% and 23.1% for paperboard and plastic containers,
respectively. At the end of the 48-hour storage period,
milk in the paperboard container lost 26.3% of its vitamin
A, while milk stored in plastic lost 30.1%. The two
slopes are shown in Fig. 4, and correlation coefficient
' relating vitamin A content to time are given in Table 18.
Skim milk, containing added vitamins A and D, had a
retinol content of 17. 67 ug/100 ml at the start of the
experiment. This decreased to 8.45 ug retinol per 100 ml
at the end of the 48-hour experimental period. The losses
were 31% at 12 hours, 49. 0% at 24 hours and 52. 2% for 48
hours. These are much higher than the losses found with
whole milk. The retention is shown graphically in Fig.
4. However, the data obtained are not as linear as
results from the other tests, as indicated by the lower
correlation coefficient of -0.84 is shown in Table 18.
Both closed paperboard and plastic containers started
to be inflated from gas production after 12-18 hours. The
milk samples in both containers also had unpleasant odor
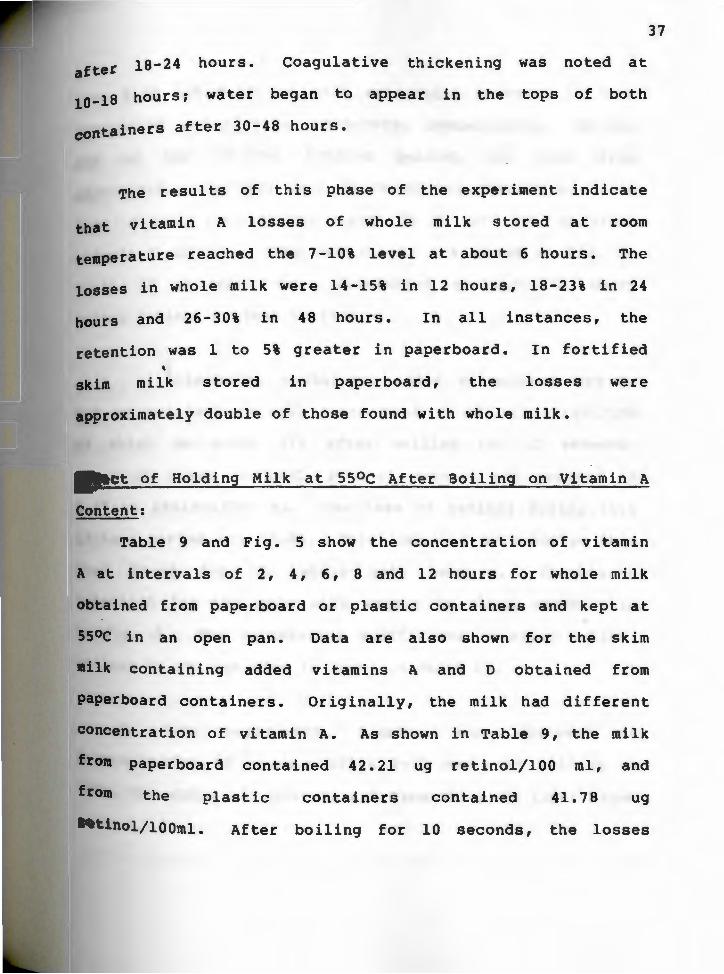
after 18-24 hours. Coagulative thickening was noted at
10_19 hours 1 water began to appear in the tops of both
containers after 30-48 hours.
The results of this phase of the experiment indicate
that vitamin A losses of whole milk stored at room
temperature reached the 7-10% level at about 6 hours. The
losses in whole milk were 14-15% in 12 hours, 18-23% in 24
hours and 26-30% in 48 hours. In all instances, the
retention was 1 to 5% greater in paperboard. In fortified '
skim milk stored in paperboard, the losses were
approximately double of those found with whole milk.
37
•+ct of Holding Milk at ssoc After Boiling on Vitamin A
Content:
Table 9 and Fig. 5 show the concentration of vitamin
A at intervals of 2, 4, 6, 8 and 12 hours for whole milk
obtained from paperboard or plastic containers and kept at
ssoc in an open pan. Data are also shown for the skim
•ilk containing added vitamins A and D obtained from
paperboard containers. Originally, the milk had different
concentration of vitamin A. As shown in Table 9, the milk
from paperboard contained 42.21 ug retinol/100 ml, and
from the plastic containers contained 41.78 ug
.. tinol/lOOml. After boiling for 10 seconds, the losses

were 6. 4% and 9. 6% for milk originally packaged in from
paperboard and plastic containers, respectively. At the
end of the 12-hour holding period, the milk from
paperboard containers lost 29. 0% of its vitamin A. Milk
from plastic containers lost 29.3% of its original
vitamin A content. The two slopes are shown in Fig. 5.
Table 18 presents the correlation coefficients which
relate retinol content to time.
' Skim milk, containing added vitamins A and D,
had an original retinol content of 17. 67 ug retinol/100
ml which decreased 17% after boiling for 10 seconds.
After 12 hours at ssoc, retinol content was reduced to
8.37 ug retinol/100 ml. The loss of retinol during this
12-hour period was 52.6%. This loss was much higher than
that found for the whole milk samples. Vitamin A
retention for the skim milk sample is shown graphically
in Fig. 5. The correlation coefficient relating retinol
content to storage time is shown in Table 18.
In this experiment, samples were observed at
~Atervals for 12 hours. After 8-12 hours of holding at
ssoc, the color of milk changed from white to light cream
color.
38
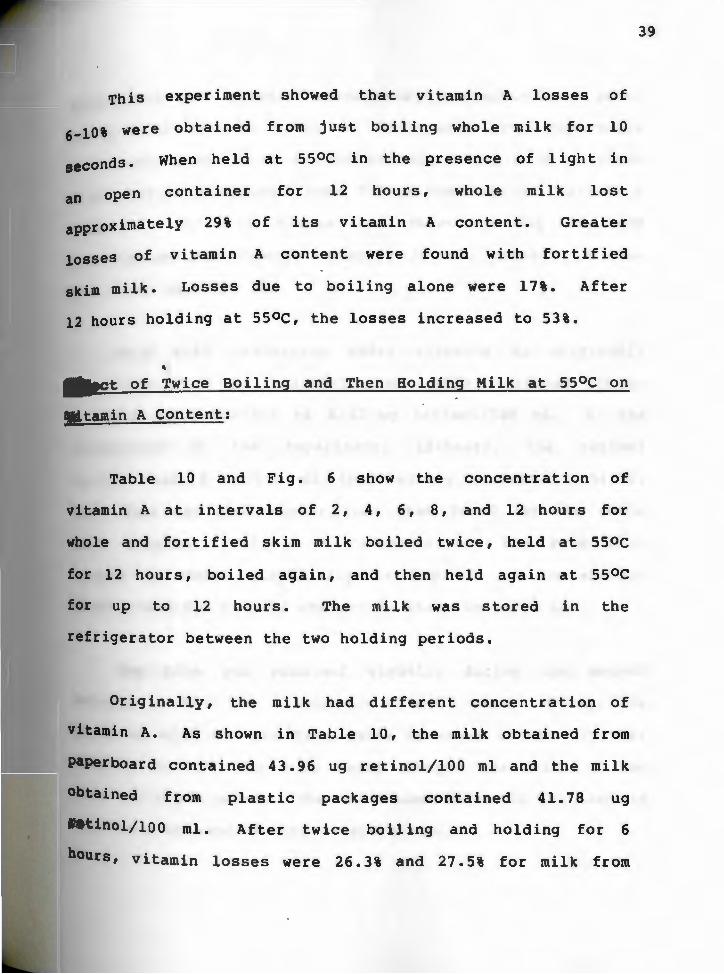
This experiment showed that vitamin A losses of
6-lOt were obtained from just boiling whole milk for 10
seconds. When held at 55oc in the presence of light in
an open container for 12 hours, whole milk lost
approximately 29% of its vitamin A content. Greater
losses of vitamin A content were found with fortified
skim milk. Losses due to boiling alone were 17%. After
12 hours holding at 55oc, the losses increased to 53%.
' •rct of Twice Boiling and Then Holding Milk at 55oc on
!ftamin A Content:
Table 10 and Fig. 6 show the concentration of
vitamin A at intervals of 2, 4, 6, 8, and 12 hours for
whole and fortified skim milk boiled twice, held at 550C
for 12 hours, boiled again, and then held again at 55oc
for up to 12 hours. The milk was stored in the
refrigerator between the two holding periods.
Originally, the milk had different concentration of
vitamin A. As shown in Table 10, the milk obtained from
paperboard contained 43. 96 ug retinol/100 ml and the milk
Obtained from plastic packages contained 41.78 ug
,.tinol/100 ml. After twice boiling and holding for 6
hours, vitamin losses were 26. 3% and 27. 5% for milk from
39
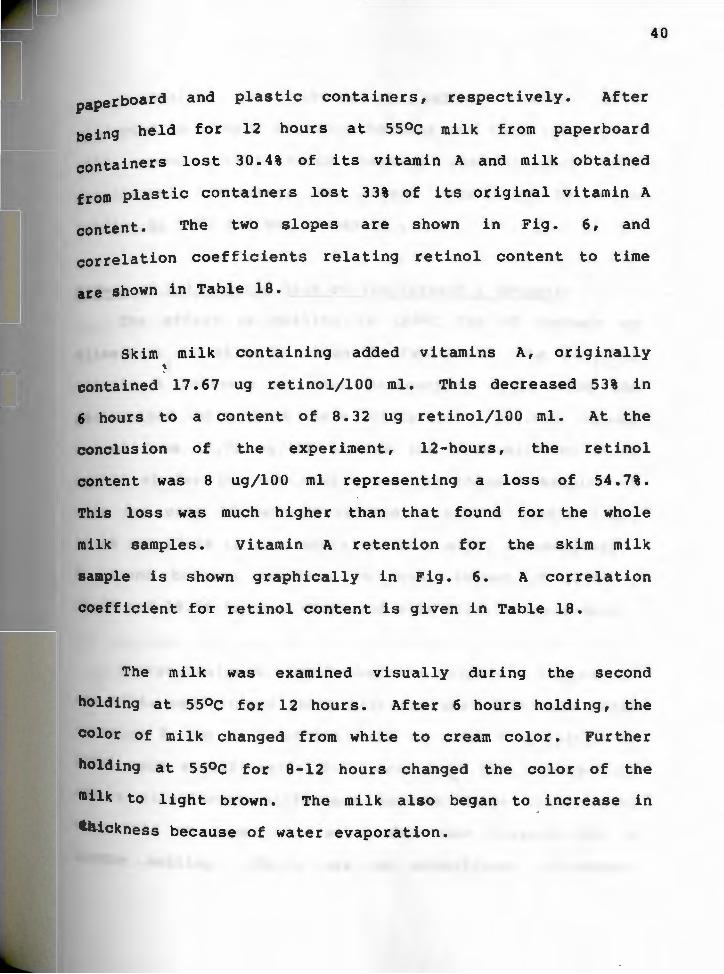
paperboard
being held
and
for
plastic containers,
12 hours at 55oc
respectively. After
milk from paperboard
containers lost 30. 4% of its vitamin A and milk obtained
from plastic containers lost 33% of its original vitamin A
content. The two slopes are shown in Fig. 6, and
correlation coefficients relating retinol content to time
are shown in Table 18.
Skim milk containing added vitamins A, originally
contained 17. 67 ug retinol/100 ml. This decreased 53% in
6 hours to a content of 8. 32 ug retinol/100 ml. At the
conclusion of the experiment, 12-hours, the retinol
content was 8 ug/100 ml representing a loss of 54.7%.
This loss was much higher than that found for the whole
milk samples. Vitamin A retention for the skim milk
40
sample is shown graphically in Fig. 6. A correlation
coefficient for retinol content is given in Table 18.
The milk was examined visually during the second
holding at 55oc for 12 hours. After 6 hours holding, the
color of milk changed from white to cream color. Further
holding at 55oc for 8-12 hours changed the color of the
milk to light brown. The milk also began to increase in
lkickness because of water evaporation.

comparison of vitamin A values between milk
subjected to single or twice boiling and then holding at
55oc reveals that twice heating was slightly more
detrimental. However, the losses attributed to twice
holding at 55oc did not exceed 5% •
lf'eqt of Boiling the Milk on its Vitamin A Content:
The effect of boiling at lOOOC for 10 seconds on
vitamin A in milk is shown in Table 11. The original '
vitamin A contents of raw, pasteurized whole milk and
pasteurized skim milk were different. Retinol values
ranged from 17. 76 ug/100 ml for the skim milk to 51. 05
ug/100 ml for the raw milk. Boiling these 3 samples of
milk for only 10 seconds reduced vitamin A levels 1.4%,
11.4% and 17.4% in raw, whole and skim milk, respectively.
A second boiling resulted in total losses of 13.8% '
15.5% and 18.5% in raw, whole and skim milk, respectively.
T-test analysis showed that the vitamin A content of
raw milk, pasteurized whole milk and skim milk with added
vitamins A and o (controls held at room temperature at
23°c> were significantly different (P ( O. 01) • There also
was a significant difference between these three milks
When held at room temperature and when treated with a
single boiling. There was no significant difference
41

between single and twice heating at loooc for 10 seconds
for pasteurized whole milk and skim milk with vitamins A
and o fortified. A significant difference (P ( O. 05) was
found in raw milk between samples subjected to single and
twice heating to l00°c for 10 seconds. Thus, only in raw
milk was there a difference between single and twice
boiling. With pasteurized whole or skim milk, a second
boiling did not result in further significant reductions
in vitamin A content. These results indicate that the '
first boiling of milk has the most drastic effect on
reducing vitamin A level.
ltPlication of the Vitamin A Retention Results:
The results obtained on vitamin A retention confirm
many reports in the literature on the stability of
vitamin A under the influence of heat, light and
packaging. Vitamin A was relatively stable after 5 days
of storage in paperboard or plastic containers at a
refrigeration temperature of 4oc. This would appear to
be close to a normal holding time for milk in the u. 5.
or Saudi Arabia. However, when stored at 40 for 15 days,
an unusually long storage time, vitamin A losses were 9%
to 12% in whole milk and 14% for skim milk. The
retention was slightly greater in paperboard than in
Plastic containers. These results agree with those of
42
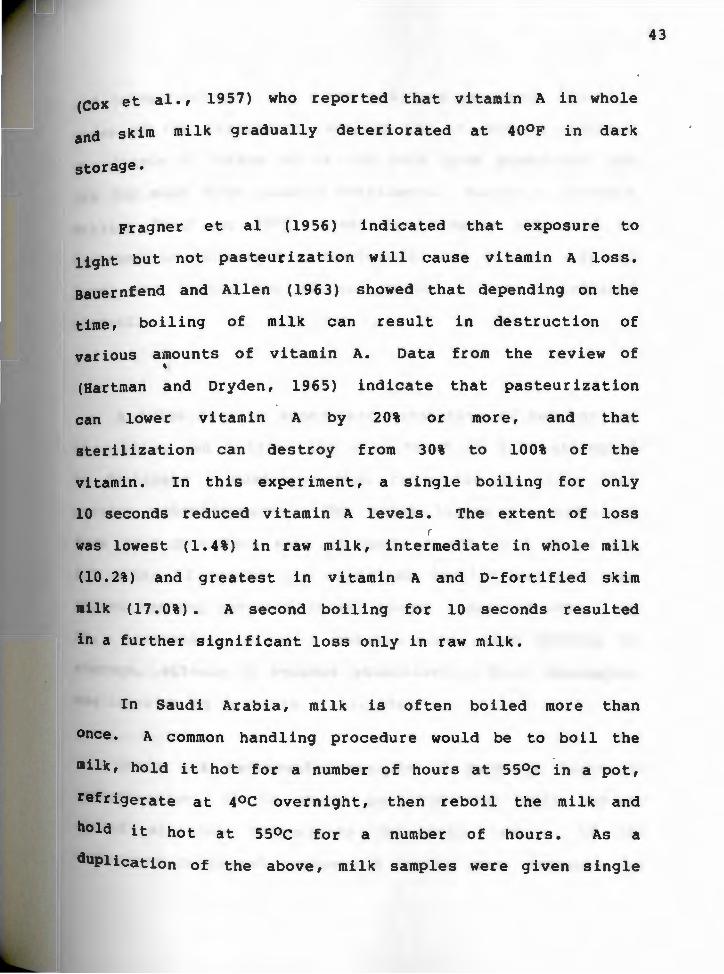
(COX et al., 1957) who reported that vitamin A in whole
and skim milk gradually deteriorated at 400F in dark
storage.
Fragner et al (1956) indicated that exposure to
light but not pasteurization will cause vitamin A loss.
eauernfend and Allen (1963) showed that depending on the
time, boiling of milk can result in destruction of
various amounts of vitamin A. Data from the review of '
(Hartman and Dryden, 1965) indicate that pasteurization
can lower vitamin A by 20% or more, and that
sterilization can destroy from 30% to 100% of the
vitamin. In this experiment, a single boiling for only
10 seconds reduced vitamin A levels. The extent of loss (
was lowest (l.4%) in raw milk, intermediate in whole milk
(10.2%) and greatest in vitamin A and D-fortified skim
milk (17.0%). A second boiling for 10 seconds resulted
in a further significant loss only in raw milk.
In Saudi Arabia, milk is often boiled more than
once. A common handling procedure would be to boil the
milk, hold it hot for a number of hours at 55oc in a pot,
refrigerate at 4oc overnight, then reboil the milk and
hold i't hot at 55oc for a number of hours. As a
duplication of the above, milk samples were given single
43

44
d twice heatings, and vitamin A loss measured. In this an
phase of the experiment, boiling for 10 seconds resulted
in vitamin A losses of 6% for milk from paperboard and
10, for milk from plastic containers. During a 12-hours
holding •hot• at ssoc, these two samples continued to
decrease in vitamin A content until 29% of the original
level was lost.
unusual.
The 12-hour period is not considered
'
A twice heating experiment consisting of two periods
of boiling and holding the milk "hot" at ssoc attempted
to duplicate a condition that can exist in Saudi food
service establishments. The total losses of vitamin A
from this procedure were as much as 28% in 6 hours and
33' after 12 hours. An important finding was that the
second heating resulted in additional losses of only 1 to
5' • Apparently, after a certain loss under heating or
storage, vitamin A becomes stabilized. This phenomenon
was reported by Causeret et al. (1961)
While not recommended because of possible bacterial
contamination, it is quite possible that milk may be
stored at room temperature for many hours. In the
experiment conducted, vitamin A losses were measured for
milk stored at 23°C for 1 to 48 hours. These losses were
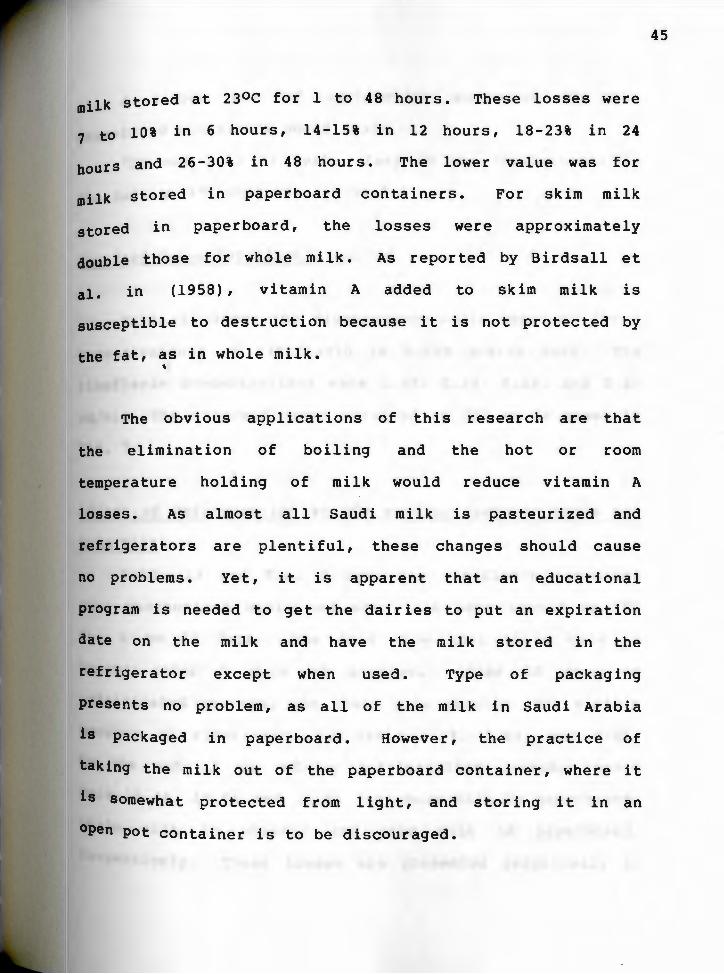
7 to 10% in 6 hours, 14-15% in 12 hours, 18-23% in 24
hours and 26-30% in 48 hours. The lower value was for
milk stored in paperboard containers. For skim milk
stored in paperboard, the losses were approximately
double those for whole milk. As reported by Birdsall et
al. in (1958)' vitamin A added to skim milk is
susceptible to destruction because it is not protected by
the fat, as in whole milk. '
The obvious applications of this research are that
the elimination of boiling and the hot or room
temperature holding of milk would reduce vitamin A
losses. As almost all Saudi milk is pasteurized and
refrigerators are plentiful, these changes should cause
no problems. Yet, it is apparent that an educational
program is needed to get the dairies to put an expiration
date on the milk and have the milk stored in the
refrigerator except when used. Type of packaging
presents no problem, as all of the milk in Saudi Arabia
is packaged in paperboard. However, the practice of
taking the milk out of the paperboard container, where it
is somewhat protected from light, and storing it in an
open pot container is to be discouraged.
45
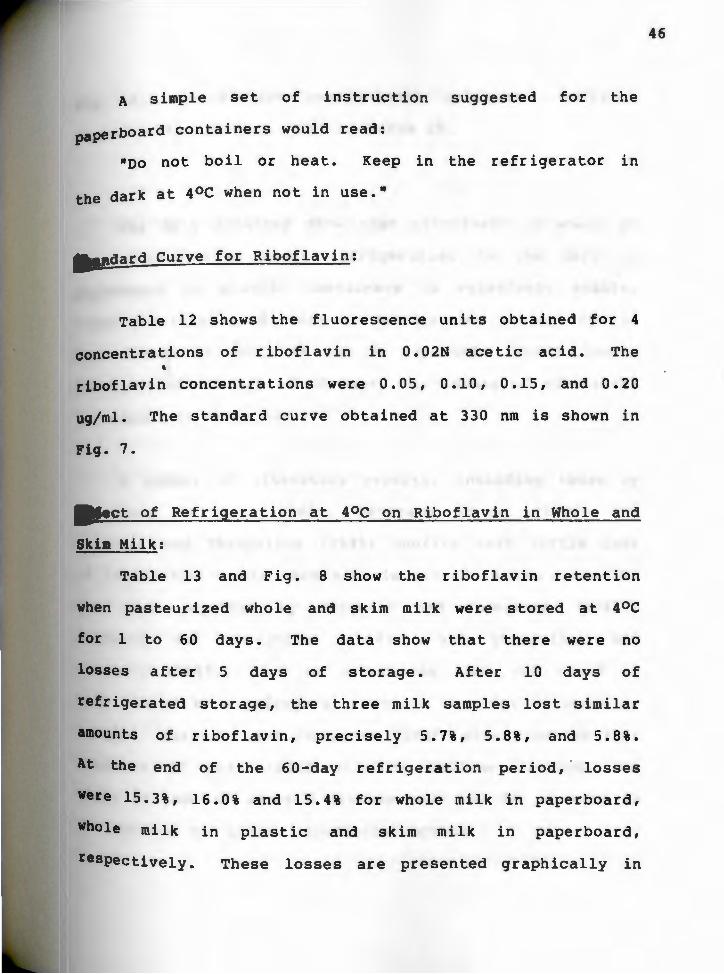
A simple set of instruction suggested for the
paperboard containers would read:
"Do not boil or heat. Keep in the refrigerator in
the dark at 4oc when not in use."
•zndard Curve for Riboflavin:
Table 12 shows the fluorescence uni ts obtained for 4
concentrations of riboflavin in 0. 02N acetic acid. The '
riboflavin concentrations were 0. 05, 0 .10, 0 .15, and 0. 20
ug/ml. The standard curve obtained at 330 nm is shown in
Fig. 7.
lllect of Refrigeration at 4oc on Riboflavin in Whole and
Skim Milk:
Table 13 and Fig. 8 show the riboflavin retention
when pasteurized whole and skim milk were stored at 4oc
for 1 to 60 days. The data show that there were no
losses after 5 days of storage. After 10 days of
refrigerated storage, the three milk samples lost similar
amounts of riboflavin, precisely 5.7%, 5.8%, and 5.8%.
At the end of the 60-day refrigeration period, losses
were 15.3%, 16.0% and 15.4% for whole milk in paperboard,
whole milk in plastic and skim milk in paperboard,
respectively. These losses are presented graphically in
46

Fi9• 8. Correlation coefficients relating riboflavin
content with time are shown is Table 19.
The data obtained show that riboflavin in whole or
skim milk stored under refrigeration in the dark in
f4perboard or plastic containers is relatively stable.
under practical conditions of refrigerated storage for 10
days losses of about 6% can be expected. For a longer '
refrigerated storage of 60 days, the losses of riboflavin
can amount to about 16%.
A number of literature reports, including those by
Josephson et al. (1946), Peterson et al (1944) and
Stamberg and Theophilus (1945) confirm that little loss
of riboflavin occurs when milk is stored in the dark. It
was also reported by Burgwald and Josephson (1947),
Stamberg and Theophilus (1945), and Theophilus and
Stamburg (1947), that no riboflavin loss was found in
milk stored in a refrigerator in the dark for 24 hours or
longer. Burgwald and Josephson (194 7) also reported that
exposure of pasteurized milk to diffuse daylight for
short periods of about 5 minutes each day for as many as
20 days did not affect riboflavin content.
47

lllllJ'Ot of Storage at Room Temperature
llllloflavin in Whole and Skim Milk:
at 23oc on
Table 14 and Fig. 9 present riboflavin values for
pasteurized homogenized whole milk, and skim milk stored
at room temperature for 1 to 48 hours. After 12 hours of
storage in the laboratory in the presence of light,
losses of riboflavin were 10.2%, 10.3% and 9.6% for whole
milk in paperboard, whole milk in plastic and skim milk
' in paperboard, respectively. At 48 hours, the losses for
the above milk increased to 17.8%, 17.9% and 18.6%,
respectively. The correlation coefficients which relate
riboflavin content to time are given in Table 19.
These data verify that the riboflavin content of
pasteurized milk is subject to only a small loss of about
10.2% when abused by storage at room temperature in the
light for as long as 12 hours. After 48 hours at the
above storage conditions, losses did not exceed 18.6%.
It should be noted that there was no difference in
riboflavin retention between whole milk packaged in
either paperboard or plastic. The reason for this may be
size and type of containers used. samples of whole milk
and skim milk were packaged in paperboard, which ·offered
Protection from full intensity of the fluorescent and/or
48
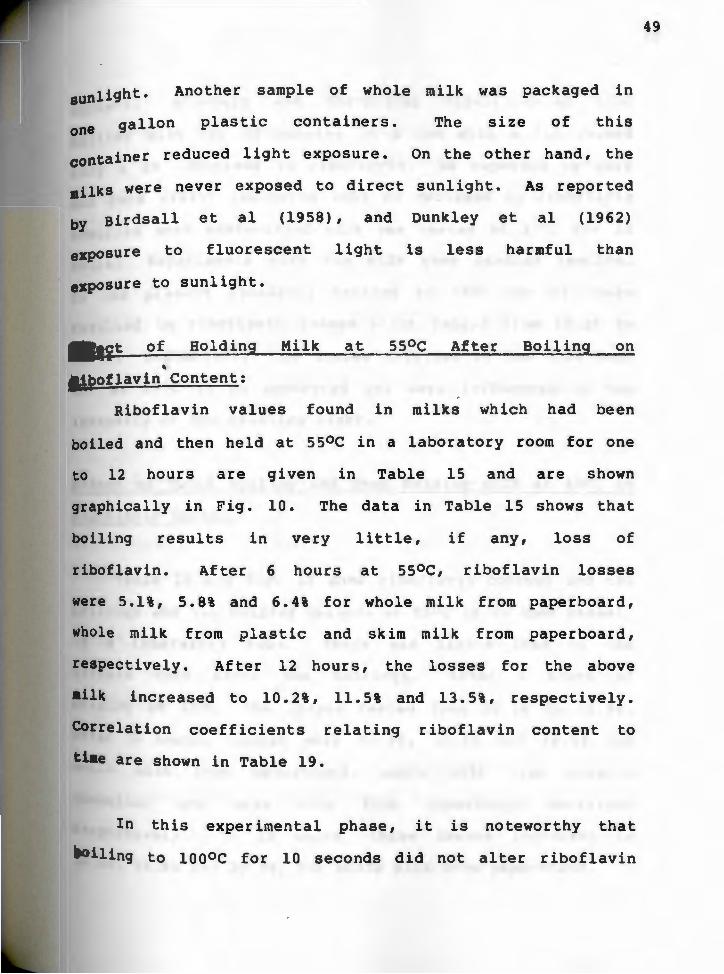
sunlight. Another sample of whole milk was packaged in
one gallon plastic containers. The size of this
container reduced light exposure. On the other hand, the
milkS were never exposed to direct sunlight. As reported
by Birdsall et al (1958), and Dunkley et al (1962)
exposure to fluorescent light is less harmful than
exposure to sunlight •
.. it of Holding Milk at 55oc After Boiling on
' &'lboflavin Content:
Riboflavin values found in milks which had been
boiled and then held at 55oc in a laboratory room for one
to 12 hours are given in Table 15 and are shown
graphically in Fig. 10. The data in Table 15 shows that
boiling results in very little, if any, loss of
riboflavin. After 6 hours at 55oc, riboflavin losses
were 5 .1%, 5. 8% and 6. 4% for whole milk from paperboard,
whole milk from plastic and skim milk from paperboard,
respectively. After 12 hours, the losses for the above
•ilk increased to 10.2%, 11.5% and 13.5%, respectively.
Correlation coefficients relating riboflavin content to
time are shown in Table 19.
In this experimental phase, it is noteworthy that
boiling to loooc for 10 seconds did not alter riboflavin
49

content. Stamberg and Theophilus (1945) found that
boiling milk for 30 minutes in a pan with a lid caused
only a 1% decrease in riboflavin. As reported by Sure
and Ford (1943) indicated that no decrease in riboflavin
occurred when pasteurized milk was heated at 37oc for 22
hours. Experiments with raw milk gave similar results.
In the present research, heating to ssoc for 12 hours
resulted in riboflavin losses which ranged from 10. 2% to
13.5%. Undoubtedly, the losses obtained in the milk kept '
hot at ssoc in an uncovered pot were influenced by the
intensity of the existing light.
-ct of Twice Boiling and Then Holding Milk at ssoc on
ltboflavin Content:
Table 16 and Fig. 11 show riboflavin content and two
boilings and two holding periods at ssoc in an open vessel
in a laboratory room. There was little loss of the
vitamin even after two boilings. After 4 hours of
holding at ssoc, the losses ranged from 10.2% to 11.9%.
After 6 hours, losses were 13.4%, 14.1% and 14.1% for
whole milk from paperboard, whole milk from plastic
container and skim milk from paperboard container
respectively. In 12 hours, these losses increased to
20.4%, 19.9% and 20.5%, for whole milk from paperboard,
so
-hole milk from plastic containers and skim milk from
paperboard containers, respectively. Correlation
coefficient relating riboflavin content to time are given
in Table 19 •
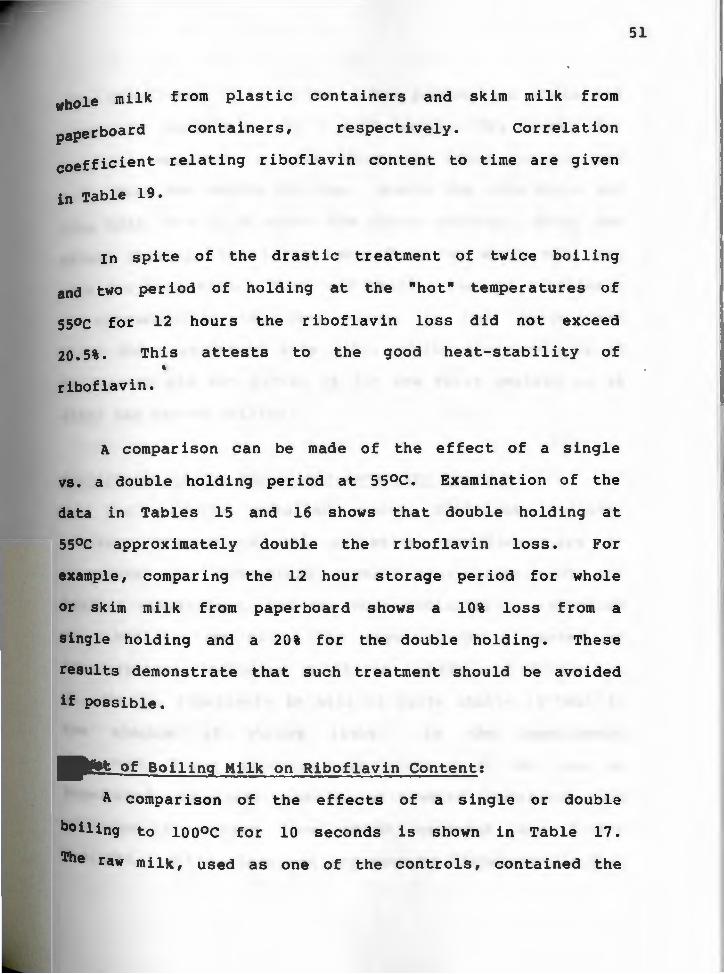
Jn spite of the drastic treatment of twice boiling
and two period of holding at the "hot• temperatures of
55oc for 12 hours the riboflavin loss did not exceed
20.5%. This attests to the good heat-stability of
riboflavin.
A comparison can be made of the ef feet of a single
vs. a double holding period at ssoc. Examination of the
data in Tables 15 and 16 shows that double holding at
55oc approximately double the riboflavin loss. For
example, comparing the 12 hour storage period for whole
or skim milk from paperboard shows a 10% loss from a
single holding and a 20% for the double holding. These
results demonstrate that such treatment should be avoided
if possible.
II !itt of Boiling Milk on Riboflavin Content:
A comparison of the effects of a single or double
boiling to loooc for 10 seconds is shown in Table 17.
The raw milk, used as one of the controls, contained the
51

aost riboflavin (2.57 ug/gm). The pasteurized whole and
skim milk contained 1.56 - 1.57 ug/gm. The losses for
raw milk amounted to 1. 9% after the first boiling and
J.l% after the second boiling. Losses for both whole and
skim milk were 1. 3% after the first boiling. After the
second boiling, the losses were 3. 8% for whole milk and
J.2% for skim milk. Thus, the boiling reduced riboflavin
to approximately the same extent in raw, pasteurized
whole and pasteurized skim milk. While the magnitude of '
the losses did not exceed 2% for the first boiling or 4%
after the second boiling.
llPlication of the Riboflavin Retention Results
The results obtained · under different heating,
storage, temperature and packaging conditions are in
agreement with literature reports that light, but not
heating temperature, has the most influence on retention
of riboflavin in milk. As reported by a number of
investigators including Hellstrom (1960) and Holmes et
al. (1943), riboflavin in milk is quite stable to heat in
the absence of strong light. In the experiments
Oonducted, light exposure was limited to the use of
Paperboard containers, one gallon plastic containers, and
a large laboratory room which excluded any direct
sunlight. While there was exposure to fluorescent light,
52
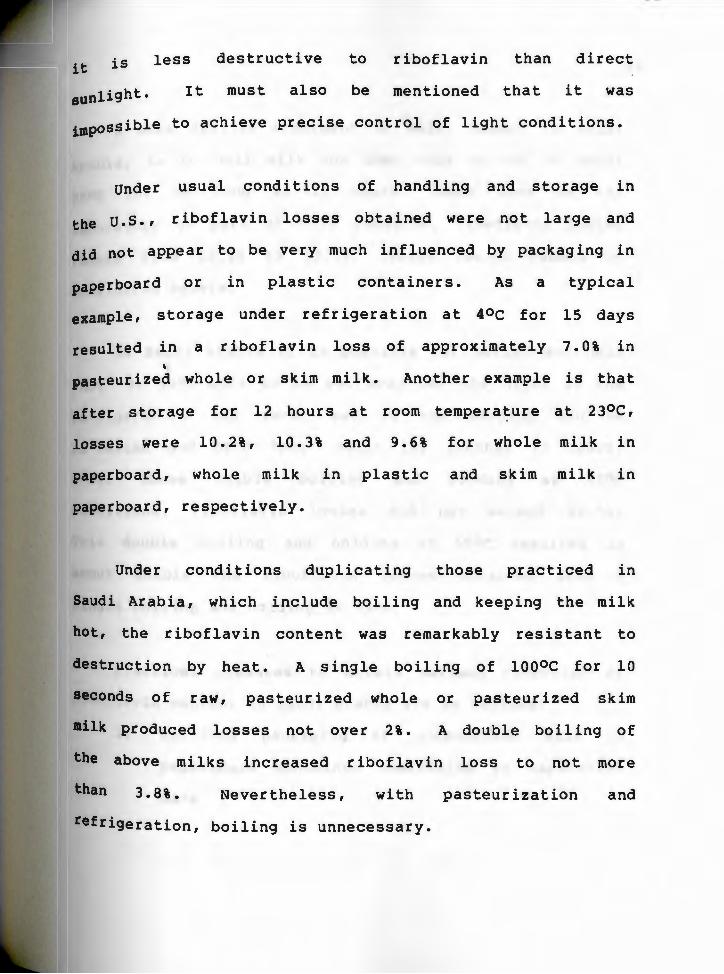
it is
sunlight.
less destructive to riboflavin than direct
It must also be mentioned that it was
impossible to achieve precise control of light conditions.
under usual conditions of handling and storage in
the u. s., riboflavin losses obtained were not large and
did not appear to be very much influenced by packaging in
paperboard or in plastic containers. As a typical
example, storage under refrigeration at 40C for 15 days
resulted in a riboflavin loss of approximately 7.0% in
' pasteurized whole or skim milk. Another example is that
after storage for 12 hours at room tempera~ure at 23oc,
losses were 10.2%, 10.3% and 9.6% for whole milk in
paperboard, whole milk in plastic and skim milk in
paperboard, respectively.
Under conditions duplicating those practiced in
Saudi Arabia, which include boiling and keeping the milk
hot, the riboflavin content was remarkably resistant to
destruction by heat. A single boiling of loooc for 10
seconds of raw, pasteurized whole or pasteurized skim
milk produced losses not over 2%. A double boil ing of
the above milks increased riboflavin loss to not more
than 3.8%. Nevertheless, with pasteurization and
refrigeration, boiling is unnecessary.
54
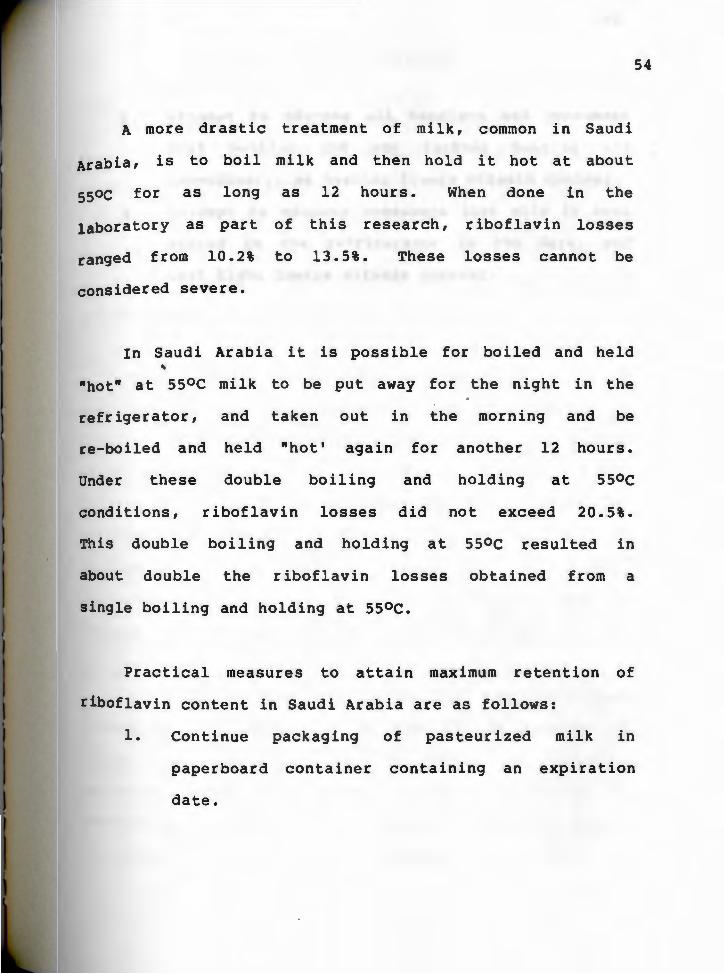
A more drastic treatment of milk, common in Saudi
Arabia, is to boil milk and then hold it hot at about
55oc for as long as 12 hours. When done in the
laboratory as part of this research, riboflavin losses
ranged from 10.2% to 13.5%. These losses cannot be
considered severe.
In Saudi Arabia it is possible for boiled and held
"hot" at 55oc milk to be put away for the night in the
refrigerator, and taken out in the morning and be
re-boiled and held "hot' again for another 12 hours.
Under these double boiling and holding at 55oc
conditions, riboflavin losses did not exceed 20.5%.
This double boiling and holding at ssoc resulted in
about double the riboflavin losses obtained from a
single boiling and holding at ssoc.
Practical measures to attain maximum retention of
riboflavin content in Saudi Arabia are as follows:
1. Continue packaging of pasteurized milk in
paperboard container containing an expiration
date.

55
2. Attempt to educate all handlers and consumers
that boiling and any further heating are
unnecessary, as heating lowers vitamin content.
3. Attempt to educate consumers that milk is best
stored in the refrigerator in the dark, and
that light lowers vitamin content.
'
56
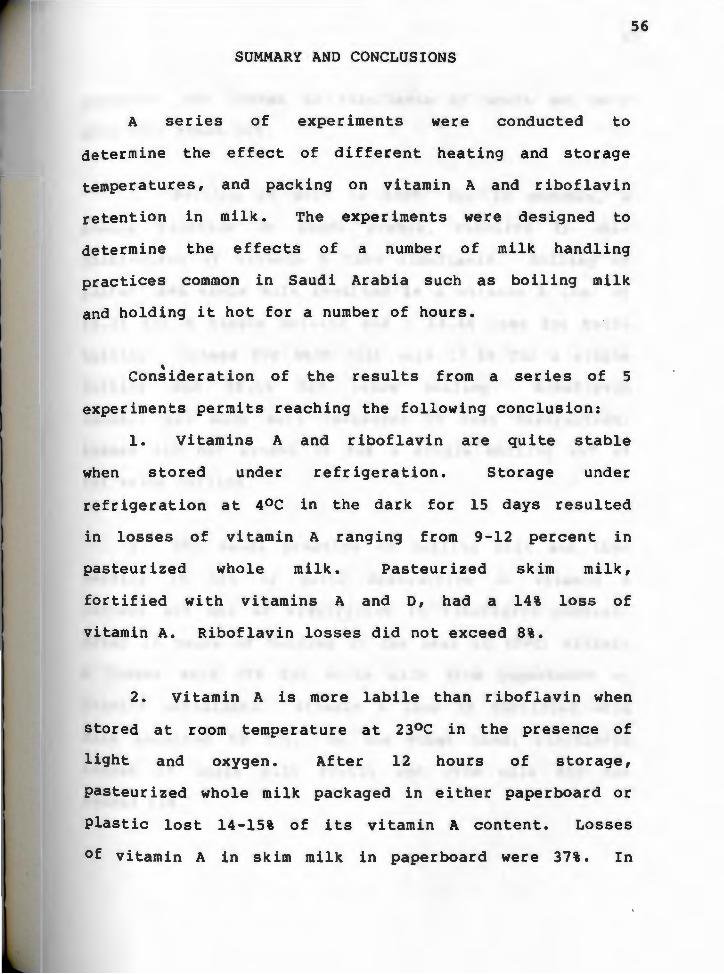
SUMMARY AND CONCLUSIONS
A series of experiments were conducted to
determine the ef feet of different heating and storage
temperatures, and packing on vitamin A and riboflavin
retention in milk. The experiments were designed to
determine the effects of a number of milk handling
practices common in Saudi Arabia such as boiling milk
and holding it hot for a number of hours.
' Consideration of the results from a series of 5
experiments permits reaching the following conclusion:
1. Vitamins A and riboflavin are quite stable
when stored under refrigeration. Storage under
refrigeration at 4oc in the dark for 15 days resulted
in losses of vitamin A ranging from 9-12 percent in
pasteurized whole milk. Pasteurized skim milk,
fortified with vitamins A and o, had a 14% loss of
vitamin A. Riboflavin losses did not exceed 8%.
2. Vitamin A is more labile than riboflavin when
stored at room temperature at 23oc in the presence of
light and oxygen. After 12 hours of storage,
pasteurized whole milk packaged in either paperboard or
Plastic lost 14-15% of its vitamin A content. Losses
of vitamin A in skim milk in paperboard were 37%. In
57
contrast, the losses of riboflavin of whole and skim
milk were about 10%.
3. Boiling of milk to loooc for 10 seconds, a
common practice in Saudi Arabia, resulted in more
destruction of vitamin A than riboflavin. Boiling of
pasteurized whole milk resulted in a vitamin A loss of
10. 2% for a single boiling and a 14. 4% loss for twice
boiling. Losses for skim milk were 17. 4% for a single '
boiling and 28.5% for twice boiling. Riboflavin
content was much more resistant to heat destruction.
Losses did not exceed 2% for a single boiling and 4%
for twice boiling.
4.
holding
The Saudi practice
it hot is quite
of boiling milk and then
destructive to vitamin A
content but not as significant to riboflavin content.
After 12 hours of holding in the heat at 55oc, vitamin
A losses were 29% for whole milk from paperboard or
plastic containers. Vitamin A loss in fortified skim
milk amounted to 53%. On the other hand, riboflavin
losses of whole milk 10-12% and skim milk did not
exceed 14%.

5. A double cycle of boiling and holding milk hot
at 55oc resulted in the largest losses of both vitamin
A and riboflavin. After the second 12-hour holding
period at ssoc, vitamin A losses for whole milk were
30-33%. In fortified skim milk the loss was 55%. This
treatment resulted in losses of riboflavin from whole
and skim milk of approximately 20%.
6. It is apparent that vitamin A was more
' susceptible to high temperature than riboflavin. In
the absence of strong light, riboflavin is quite stable
during heating. Under the experimental conditions
used, the milk samples were not exposed to sunlight or
to strong light. However, precise control of light was
not possible.
7. While the literature gives evidence of the
protective ef feet of paperboard containers over plastic
containers, the results obtained in this experiment did
58
not show any difference. This may have been due to the
absence of strong light and the use of one gallon
containers.
59
8. Recommendations for handling of milk in Saudi
Arabia to maximize vitamins A and riboflavin retention
include:
(1) Continue packaging of pasteurized milk in
paperboard containers and provide an
expiration date.
(2) Educate all consumers to stop boiling milk
' and that any further heating is unencessary
because it lowers the vi tainin content of the
milk.
(3) Educate consumers that pasteurized milk is
best stored in the refrigerator in the dark
immediately after purchase because light and
temperature lower the vitamin content in the
milk.
9. Further
include more
should also
experimentation is
precise control
be evaluated
microbiological tests.
suggested which would
of light. The milks
by organoleptic and

Table 4. Proximate Composition
Water Fat Sample
% %
Raw Milk 87.0* 3.6
Whole Milk Stored at 230C 86.0 3.5
Whole Milk after heating to loooc for 10 seconds 85.7 3.4
Whole Milk after Boiling at lOOOC; and heating at 55oc for 2 hr. 84.6 3.4
*Means are for 4 replicates.
of Raw and Processed Bovine Milk
Protein Carbohydrate Ash
% % %
3.4 5.3 0.71
3.5 6.3 0.71
3.6 6.5 0.72
3.8 7.2 0.72
Non-Fat Solids
' 9.4
10.5
10.8
11.7
Total Solids
%
13.0
14.0
14.2
15.2
·CTI 0

Table 5. Fluorescence Uni ts Obtained fr an Various Concentrations of Retinyl Acetate in Hexane
Concentration )19/100 ml
Blank
4
6
8
10
14
16
'
Fluorescence
0.12-.-0.00*
o.1a+o.oo
o.2s+o.02
0.31-.-0.01
0.41-.-0.02
0.48-.-0.01
*Means are for 8 replicates measured at 330 nm excitation.
61
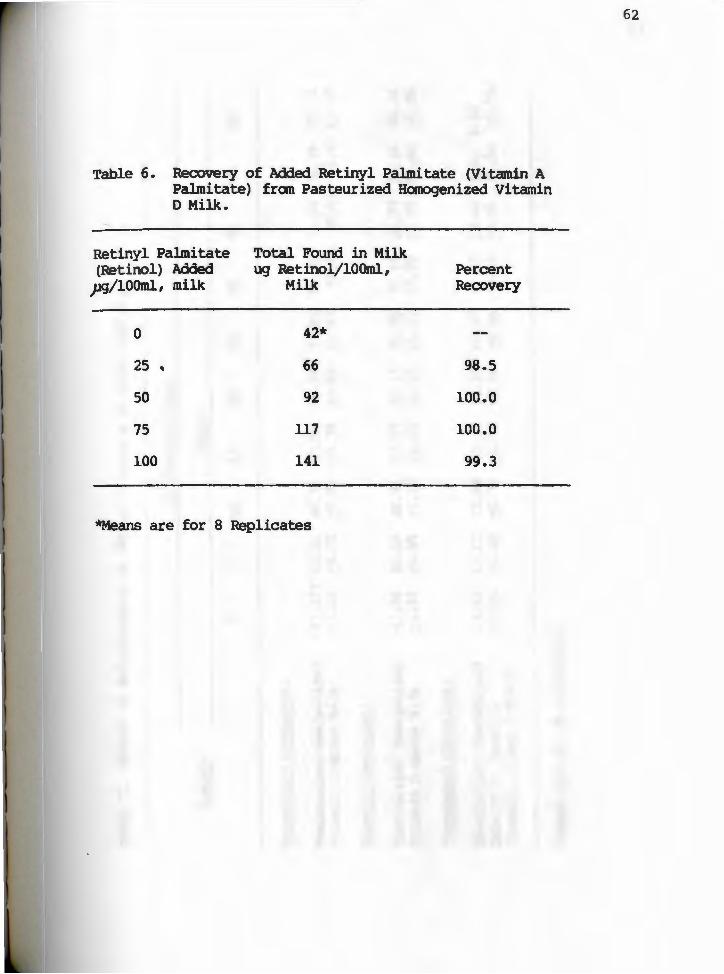
Table 6. Recovery of Added Retinyl Palmi tate (Vi tarnin A Palmitate) fran Pasteurized Hanogenized Vitamin D Milk.
Retinyl Palmitate Total Found in Milk (Retinol) Added ug Retinol/lOOml, Percent
pg/lOOml, milk Milk Reex>very
0 42*
25 ' 66 98.5
50 92 100.0
75 117 100.0
100 141 99.3
*Means are for 8 Replicates
62

Table 7. Effect of Refrigeration at 4oC on Vitamin A in Whole and Skim Milk.
P3 Retiml/l.OOml ~
Sample Days
0 5 10 15 20 25 30 40
Pa~rboard Container:
Pasteurized HaIK>genized 43.16* 42.51 40.32 37.96 35.59 33.95 32.32 31.59 Vitamin D Whole Milk +1.38 +o.75 +o.93 +0.78 +o.85 +l.03 +l.01 +o.85
Plastic Container:
Pasteurized Hanogenized 41.78 40.69 38.96 37.87 36.14 35.05 32.95 31.77 Vitamin D Whole Milk +l.44 +o.65 +l.10 +o.99 +o.95 +l.03 +o.99 +o.55
Pa~rboard Container:
Pasteurized HaIK>genized 17.67 17.12 15.94 15.21 14.21 12.57 11.57 10.66 Skim Milk (nonfat) +o.72 +o.38 +o.75 +l.15 +0.54 +o.98 +o.65 +1.51 Vitamins A aOO D Added
*Means are for 8 replicates.
50 60
30.59 30.04 +l.40 +1.48
30.31 30.04 +1.03 +l.48
9.83 8.84 +1.51 +1.06
°' w

Table a. Effect of Storage in Room Tenperature at 23oC on Vitamin A in Whole aBi Skim Milk.
.pg RetioolL!;OO ml .. Sg>lJl) Hours
0 l 2 4 6 18. 24 1.8
Pa~rboard Container:
Pasteurized Hanogenized 43. 96(2} 43.50 43.14 41.78 40.87 37.68 37.32 35.96 32.41 Vitamin D ~ole Milk +4.08 +1.03 +o.67 +o.93 +o.55 +o.67 +o.26 +o.93 +l.29
Plastic Container:
Pasteurized Hanogenized 41.78 41.10 39.96 38.32 37.50 35.50 32.86 32.13 29.22 Vitamin D Whole Milk +1.44 +1.10 +o.93 +o.95 +1.54 +1.23 +1.10 +l.03 +l.10
Paperboard Container:
Pasteurized Hanogenized 17.67 17.03 15.48 14.30 14.12 11.12 9.57 9.02 8.45 Skim Milk (nonfat) +o.72 +1.21 +o.99 +o.67 +o.93 +o.82 +o.67 +o.01 +o.01 Vitamins A and D Added
1. Sanple was kept in laboratory containing fluorescent light and window light. 2. Means are for 8 replicates.

------------------- - -
Table 9. Effect of Holding Milk at 55oC After Boiling for IO Seconds on Vitamin A Content
.pg Betinol/100 ml
Sample Hours
dJ) singl~ 2 4 6 8 12 boiJ.i I
Pasteurized Hanogenized 42.21PJ 39.50 36.96 34.77 32.13 31.59 29.95 Vitamin D '11lole Milk f ran +l.15 +l.43 +l.10 +l.02 +1.03 +o.85 +l.56 Paperboard Container
Pasteurized Hanogenizea 41. 78 37.78 35.96 33.24 32.32 31.50 29.55 Vitamin D Whole Milk +1.44 +1.48 +1.39 +l.335 +l.49 +l.58 +o.97 from Plastic Container
Pasteurized HORK>genized Skim Milk (oonfat) 17.67 14.67 12.12 10.66 9.66 8.64 8.37 Vitamins A and D added +o.72 +o.78 +l.29 +l.03 +l.48 +o.64 +o.83 from Paperboard Containers
1. Before boiling. 2. After boiling to lOOoC for 10 seconds. 3. Means are for 8 replicates.

Table 10. Effect of Twice Boiling and Then Holding Milk at 55oC for Various Times on Vitamin A Content '
)19 Retinol/100 ml
Sanple Hours
After 'l'W~ 2 4 6 8 u boili
Pasteurized HOJ1k)9enized 43.9dJ) Vitamin D Whole Milk 37.23 35.32 34.40 32.40 31.86 30.58
f ran Paperboard Container +1.08 +0.67 +1.02 +1.13 +o.95 +1.29 +1.42
Pasteurized Hanogenized Vitamin D Whole Milk 41. 78 35.94 32.77 31.86 30.31 29.22 27.94 f ran Plastic Container +1.44 +1.27 +1.13 . +o.67 +1.03 +1.01 +o.75
Pasteurized Hanogenized Skim Milk (nonfat) 17.67 12.69 ll.23 9.57 8.32 8.11 8.00 Vitamins A and D added +o.72 +l.31 +o.36 +o.84 +o.36 +o.oo +o.01 fran Paperboard Containers
1. Before boiling. 2. Sanples were boiled for 10 seconds, refrigerated for 24 hours and reboiled for 10 seconds. 3. Means are for 8 replicates.
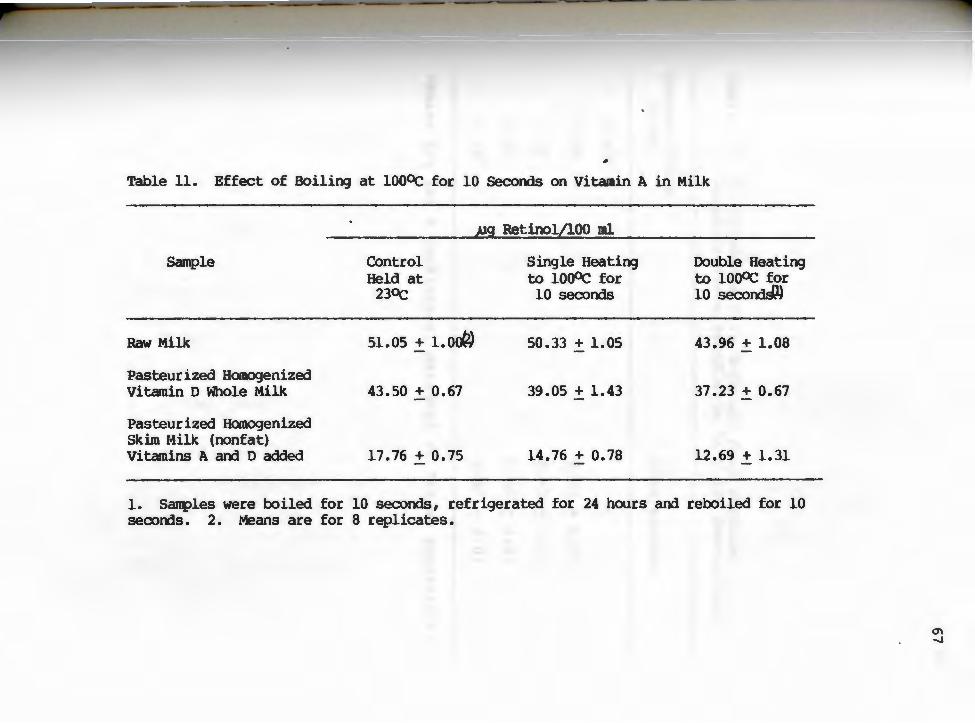
Table 11. Effect of Boiling at lOOoC for 10 seconds on Vitamin A in Milk
Sample
Raw Milk
Pasteurized Hanogenized Vitamin D Whole Milk
Pasteurized HQnogenized Skim Milk (nonfat) Vitamins A and D added
Control Held at
23oC
51. 05 + i. oo(l)
43.50 + 0.67
17.76 + 0.75
,U9 Retinol/100 ml
Single Heating Double Heating to lOOOC for to lOOOC for 10 seconds 10 secondJJ)
50.33 + 1.05 43.96 + 1.08
39.05 + 1.43 37.23 + 0.67
14.76 + 0.78 12.69 + 1.31
1. Sanples were boiled for 10 seconds, refrigerated for 24 hours and reboiled for 10 secooos. 2. Means are for 8 replicates.
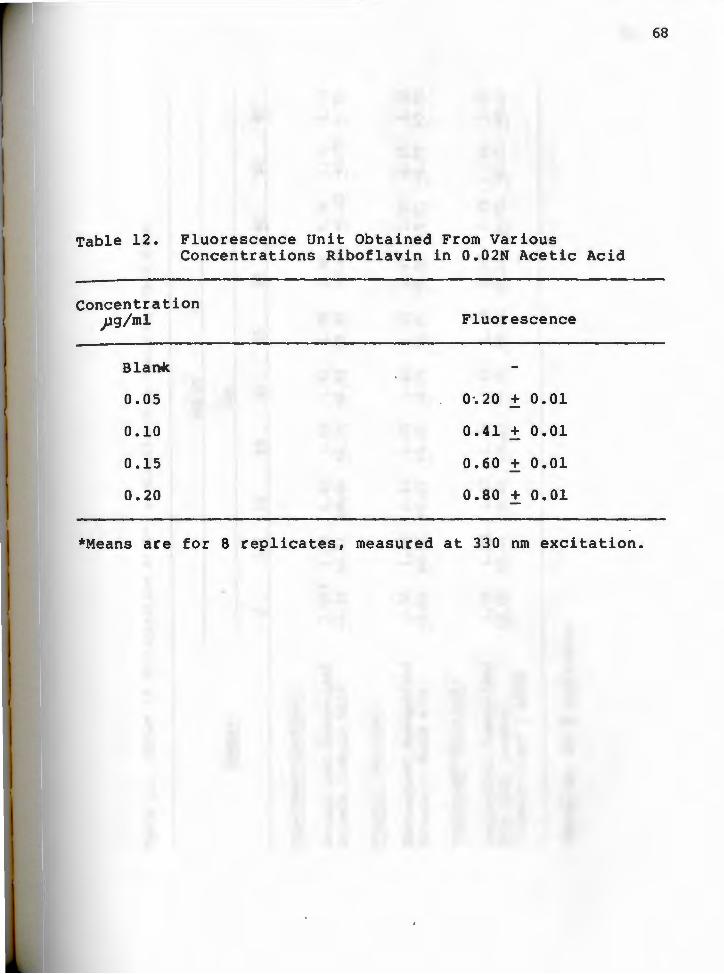
Table 12. Fluorescence Unit Obtained From Various Concentrations Riboflavin in 0.02N Acetic Acid
Concentration pg/ml
Bl a Dk
0.05
0.10
0.15
0.20
Fluorescence
0·.20 + 0.01
0.41 + 0.01
0.60 + 0.01
0.80 + 0.01
*Means are for 8 replicates, measured at 330 nm excitation.
68

Table 13. Effect of Refrigeration at 4oC on Riboflavin in Whole and Skim Milk.
lJ9/SP Sanple
0 5 10 15 20 25 30 40 so 60
Paperboard Container:
Pasteurized Honpgenized 1.57* 1.57 1.48 1.45 1.41 1.39 1.38 1.38 1.34 1.33 Vitamin D Whole Milk +0.02 +o.01 +o.00 +o.01 +o.01 +o.39 +o.oo +o.01 +o.oo +o.01
Plastic Container:
Pasteurized HatK>genized 1.56 1.54 1.47 1.45 1.40 1.39 1.37 1.35 1.33 1.31 Vitamin D Whole Milk +o.01 +o.01 +0.01 +o.01 +o.01 +o.01 +o.01 +o.01 +o.01 +o.01
Pa~rboard Container:
Pasteurized Hanogenized 1.56 1.55 1.47 1.45 1.41 1.39 1.37 1.35 1 .34 1.32 Skim Milk (nonfat) 1 +o.02 +o.01 +o.01 +o.01 +o.01 +o.01 +o.01 +o.01 +o.01 +o.01 Vitamins A and D Added
*Means are for 8 replicates.
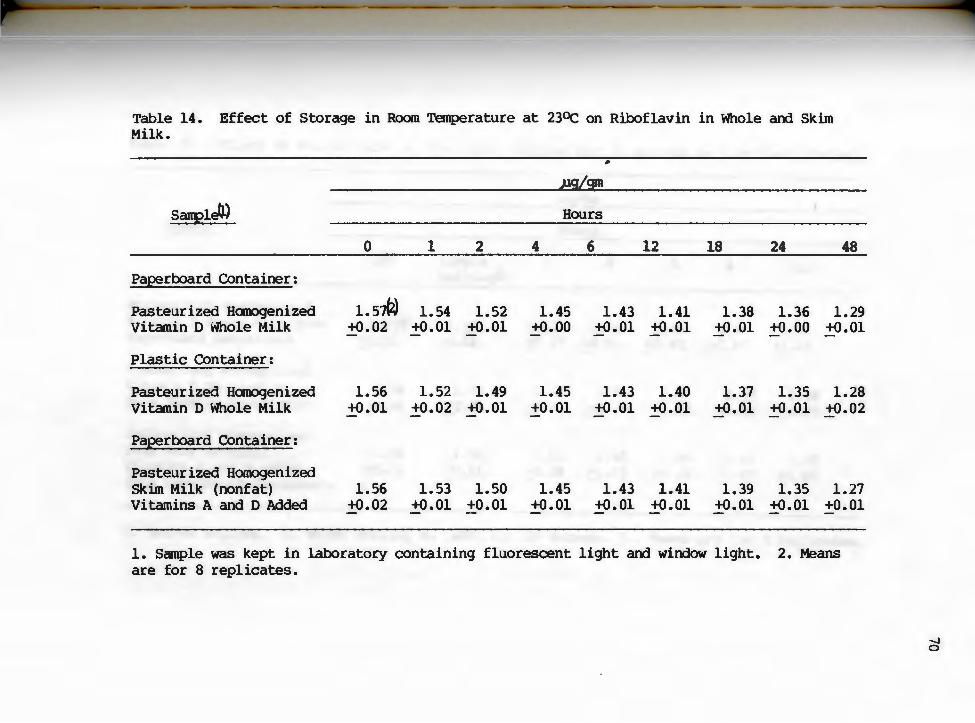
Table 14. Effect of Storage in Room Temperature at 23oC on Riboflavin in Whole and Skim Milk.
#
.Jlgj~
SanplelJ'.} Hours
0 1 2 4 6 12 18 24 48
Pa~rboard Container:
Pasteurized HatK>genized i.5-M 1.54 1.52 1.45 1.43 1.41 1.38 1.36 1.29 Vitamin D Whole Milk +-0.02 +0.01 +0.01 +-0.00 +-0.01 +-0.01 +-0.01 +-0.00 +-0.01
Plastic Container:
Pasteurized HatK>genized 1.56 1.52 1.49 1.45 1.43 1.40 1.37 1.35 1.28 Vitamin D Whole Milk +-0.01 +0.02 +-0.01 +0.01 +-0.01 +-0.01 +-0.01 +-0.01 +-0.02
Pa~rboard Container:
Pasteurized Homogenized Skim Milk (nonfat) 1.56 1.53 1.50 1.45 1.43 1.41 1.39 1.35 1.27 Vitamins A and D Added +-0.02 +-0.01 +0.01 +-0.01 +-0.01 +-0.01 +-0.01 +-0.01 +0.01
1. Sample was kept in laboratory containing fluorescent light arx1 window light. 2. Means are for 8 replicates.
.....J 0
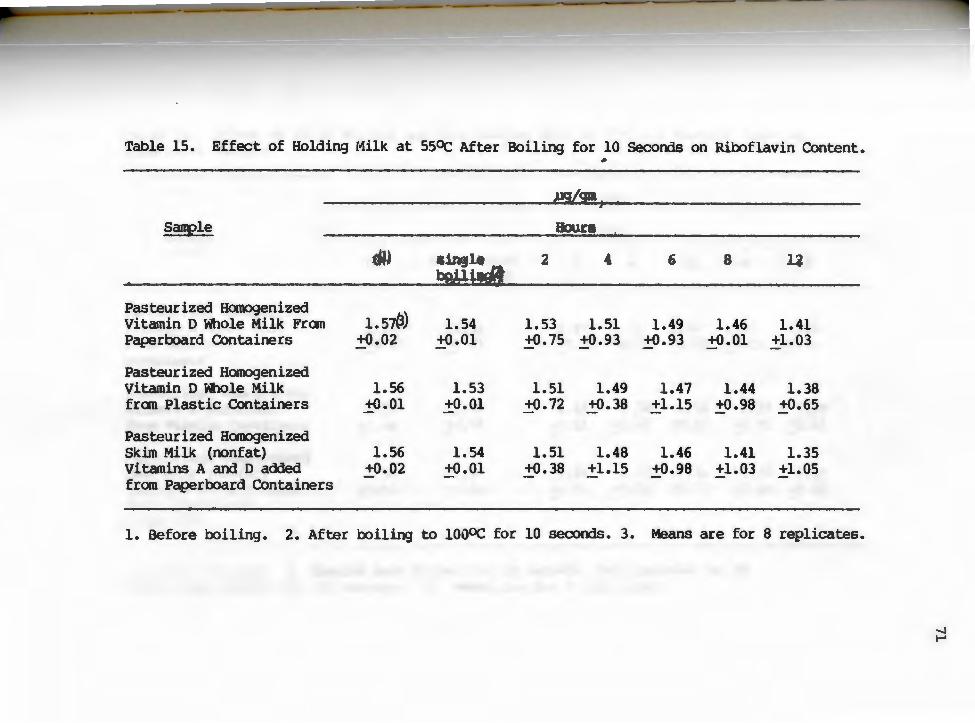
Table 15. Effect of Holding Milk at 55oC After Boiling for 10 Seconds on Riboflavin content. •
pg/91!jo I
Sanple Bour a
single beA!j!f!
2 4 6 8 l i
Pasteurized Hanogenized 1.57~) Vitamin D Whole Milk Fran 1.54 1.53 1.51 1.49 1.46 1.41
Paf)erboard containers +o.02 +o.01 +o.75 +o.93 +o.93 +o.01 +l.03
Pasteurized Hanogenized Vitamin D \'hole Milk 1.56 1.53 1.51 1.49 1.47 1.44 1.38 fran Plastic containers +o.01 +0.01 +o. 72 +o.38 +l.15 +o.98 +o.65
Pasteurized Hanogenized Skim Milk (nonfat) 1.56 1.54 1.51 1.48 1.46 1.41 1.35 Vitamins A and D added +o.02 +o.01 +o.38 +l.15 +o.98 +l.03 +l.05 from Paperboard containers
1. Before boiling. 2. After boiling to lOOoC for 10 seconds. 3. Means are for 8 replicates.
....J .....

1. Before boiling. 2. Sanples were boiled for 10 seconds, refrigerated for 24 hours, arXl reboiled for 10 seconds. 3. Means are for 8 replicates.
....... N
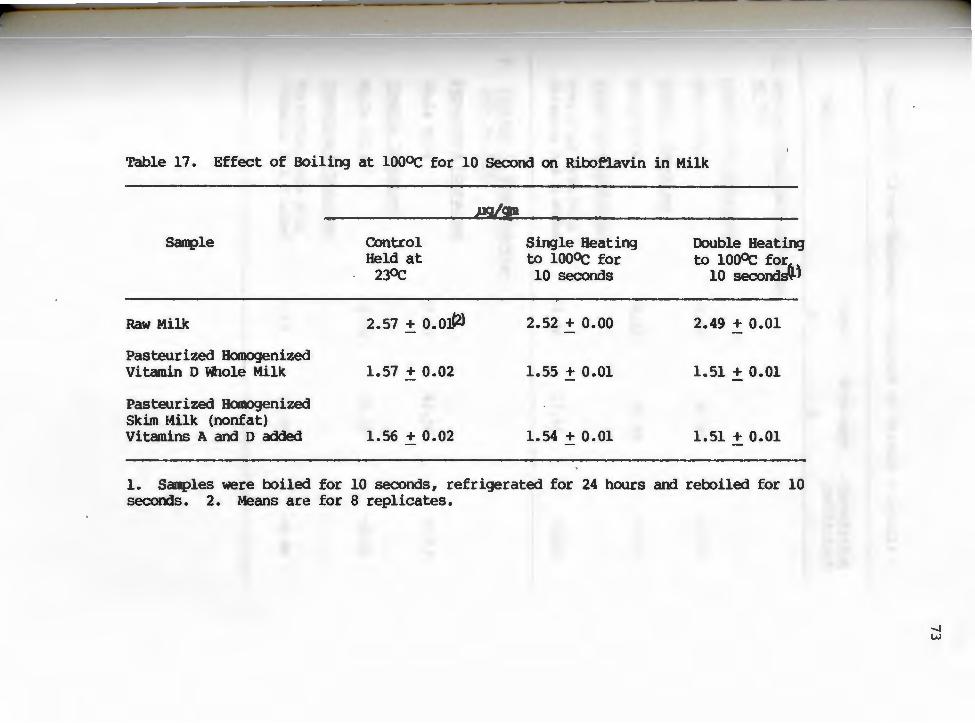
Table 17. Effect of Boiling at lOOoC for 10 Second on Ribof'lavin in Milk
Sanple
Raw Milk
Pasteurized Homogenized Vitamin O Whole Milk
Pasteurized Hcmogenized Skim l>tilk {nonfat) Vitamins A and o added
Control Held at
23oC
2.57 + o.01t2l
1.57 + 0.02
1.56 + 0.02
Single Heating to lOOoC for 10 seconds
2.52 + o.oo
1.55 + 0.01
1.54 + 0.01
Double Heating to lOOoC for6 )
10 second~
2.49 + 0.01
1.51 + 0.01
1.51 + 0.01
l. Samples were boiled for 10 seconds, refrigerated for 24 hours and reboiled for 10 seconds. 2. Means are for 8 replicates.
....... w

74
Table 18. Linear Regression Analysis of Vitamin A in Milk
Slope Intercept Correlation Sample Coefficient
B A r
l. storage after Refrigeration at 4oC
Paperboard Container
Whole Milk -0.24 42.07 -0.93
Plastic Container
Whole Milk -0.21 40.96 -0.97
Paperboard 'Container
Fortified Skim Milk Vitamins A & 0 added -0.16 17.45 -0.98
2. Stor!9e in Room Tempera-ture at 23oC
Paperboard Container
Whole Milk -0.24 42.56 -0.93
Plastic Container
Whole Milk -0.24 39.37 -0.92
PaE!rboard Container
Fortified Skim ~lilk Vitamins A & 0 added -.17 14.82 -0.84
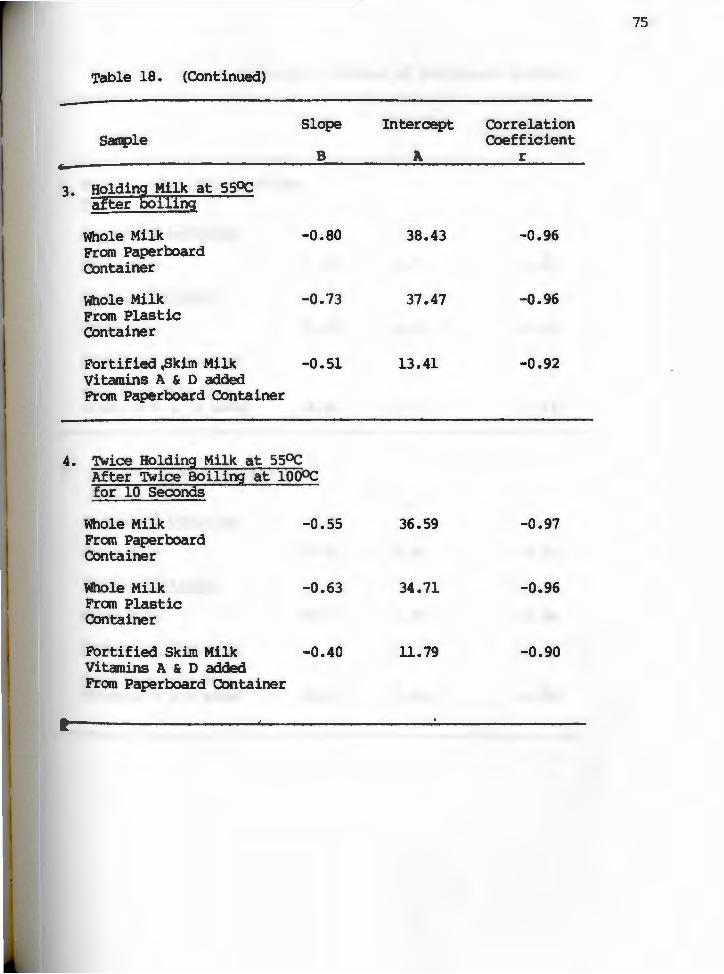
75
Table 18. (continued)
Slope Interc:ept Correlation Sample Coefficient
B A r
3. Holding Milk at SSoC after coiling
Whole Milk -a.so 38.43 -0.96 From Paperboard Container
Whole Milk -0.73 37.47 -0.96 From Plastic Container
Fortified,Skim Milk -0.51 13.41 -0.92 Vitamins A & D added From Paperboard COntainer
4. Twice Holdi!lS Milk at SSoC After Twice Boili!lS at lOOoC for 10 Seconds
Whole Milk -0.55 36.59 -0.97 From Paperboard Container
Whole Milk -0.63 34.71 -0.96 From Plastic Container
Fortified Skim Milk -0.40 11.79 -0.90 Vitamins A & D added From Paperboard Container

76
Table 19. Linear Regression Analysis of Riboflavin in Milk
Slope Intercept Correlation sample Coefficient
B A r
1. storage after Refrigeration at 4oC
Paperboard Container
Whole Milk -0.01 1.53 -0.91
Plastic Container
Whole Milk -o.oo 1.52 -0.94
PaE!!!rboard Container • Fortified Skim Milk Vitamins A & D added -0.01 1.52 -0.93
2. Stora2e in Roan Te111pera-ture at 23oC
PaE!!!rboard Container
Whole Milk -0.01 1.49 -0.92
Plastic Container
Whole Milk -0.01 1.48 -0.94
PaE!!!rboard container
Fortified Skim Milk Vitamins A & D added -0.01 1.49 -0.95

77
Table 19. (Continued)
Slope Intercept Correlation Sample Coefficient
B A r
3. Holding Milk at 55oC after boiii!!]
Whole Milk -0.01 1.55 -0.98 Fran Paperboard Container
Whole Milk -0.01 1.53 -0.99 From Plastic Container
Fortified Skim Milk -0.01 1.54 -0.98 Vitamins A & D added From Paperboard Container
4. Twice Holdi!!! Milk at 55oC After Twice Boili!!J at lOOoC for 10 Seconds
Whole Milk -0.02 1.50 -0.99 Fran Paperboard Container
Whole Milk -0.02 1.48 -0.98 From Plastic Container
Fortified Skim Milk -0.01 1.49 -0.99 Vitamins A & D added From Paperboard Container

a.so
o. so
0. iO
8
~
I a.
~ 0.20
a. I
'
0 2 6 a
A RETINOL 330mn a RETINOL 360mn
10 12
pg RETINOL/lOOML IN HEXANE
l'f
Fig. 2. Standard curve of retinol equivalents obtained from graded levels of retinyl acetate in hexane.
78
16

'
0 10 za
a 6
•
A:'lhole Milk in Paper Container (1) a Whole Milk in Plastic Container (2) * Skim Milk in Paper Container
80
TIME (Days)
Fig. 3. Effect of refrigeration at 4°C on vitamin A in whole and skim milk.
79
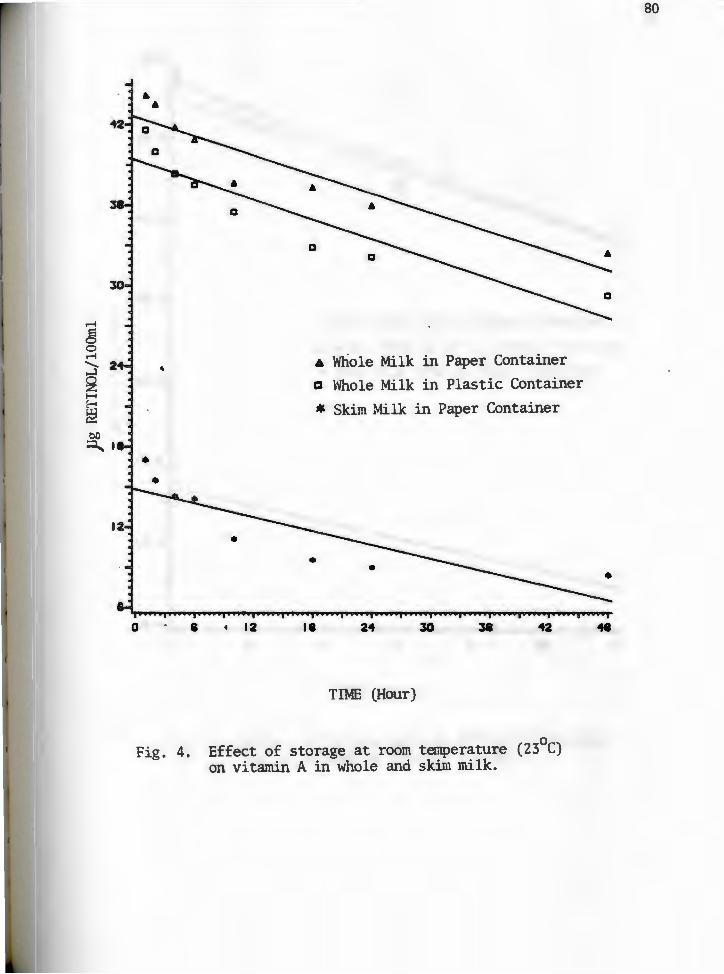
bO
~·
0
• •
'
•
• • 12
A whole Milk in Paper Container a Whole Milk in Plastic Container
* Skim Milk in Paper Container
• •
II 2 .. lO .. 2
TIME (Hour)
Fig. 4. Effect of storage at room temperature (23°C) on vitamin A in whole and skiin milk.
BO
•
...
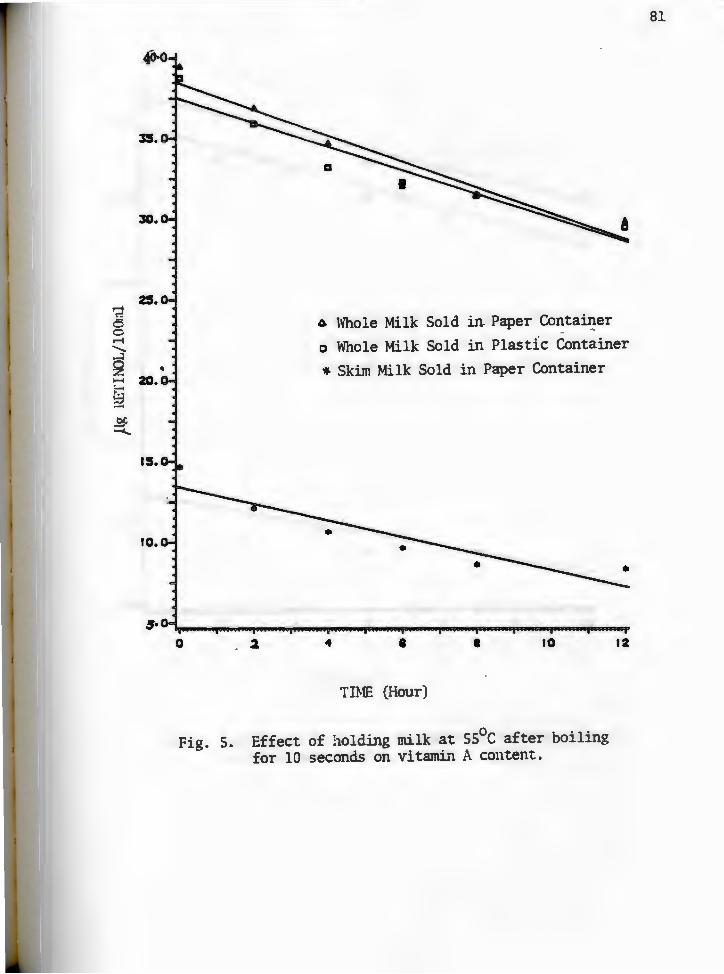
35.
30.
ZS. ~ <":
c5 0 ~ ....... ..J
~ ' - zo. ~ or. ~
IS.
10.
0 . 2
A Whole Milk Sold in. Paper Co~tail}er
a Whole Milk Sold in Plastfc Container
,. Skim Milk Sold in Paper Container
.. • • 10 IZ
TIME (Hour)
Fig. S. Effect of holding milk at ss0c after boiling for 10 seconds on vi tamL"l A content.
81

:SS.
30.
25.
15.
10.
.s-o-1 I o
'
I
2 I ..
~ Whole Milk Sold-in Paper Container ca Whole Milk Sold in Plastic Container * Skim M;ilk Sold in Paper Container
•
ij I U I 0 I 8 • 10 12
TIME (Hour)
Fig. 6. Effecs of twice boiling and then holding milk at SS C on vitamin A content.
82

o.ao 0.08 0.12 O. II
RIBOFLAVIN pg/ gm
Fig. 7. Fluorescence Units Obtained from Various Concentrations of Riboflavin in 0.02N Acetic Acid (HOAC).
83
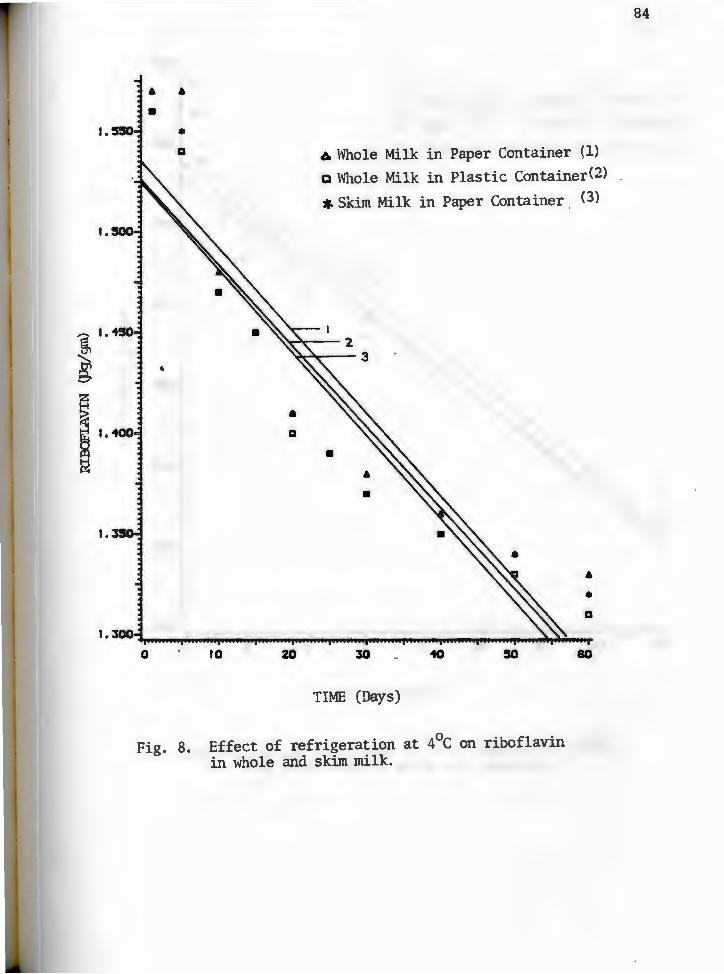
1.
~
~ ··-I•
• • a
'
• a
10 zo
A Whole Milk in Paper Container (1)
a Mlole Milk in Plastic Container(2)
$ Skim Milk in Paper Container . (3)
2 3
• • •
• • a
80
TIME (Days)
Fig. 8. Effect of refrigeration at 4°C on riboflavin in whole and skim milk.
84

I.
I.
- I.
' ~ ~ I.
~ 8 ~
I.
I.
•
D
• 12
D
II
~5
A Whole Milk in Paper Container (1)
a Whole Milk in Plastic Container(2)
* Skim Milk in Paper Container (3)
•
• D
ll . 42 ... TIME (Hour)
Fig. 9. Effect of storage at room temperature (23°C) on riboflavin in whole and skim milk.
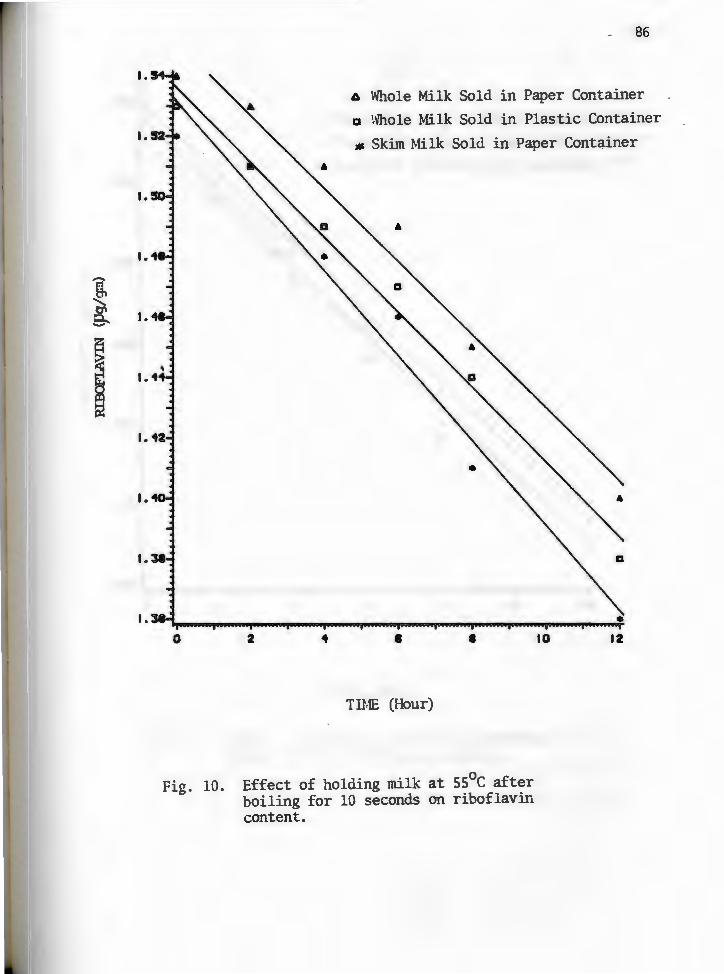
I .
I.
I.
86
6 Whole Milk Sold in Paper Container a Whole Milk Sold in Plastic Container
* Skim Milk Sold in Paper Cont(;!.iner
0 2 .. • •
TIME (Hour)
Fig. 10. Effect of holding milk at ss0 c after boiling for 10 seconds on riboflavin content.
10 12

I.
'
0 z ..
87
6 Whole Milk Sold in Paper Container (1)
Cl 'Whole Milk Sold in Plastic Container (2)
* Skim Milk Sold in Paper Container (3)
a
• I 10 12
TIME (Hour)
Fig. 11. Effect of ~ice boiling and t!1en holding milk at SS C on riboflavin content.
2.
3.
AOAC. 1980.
Association of
washington, DC.
REFERENCES
"Methods of
Official
Analysis,
Analytical
Atherton, H. ". and Newlander, J.
Chemistry and Testing of Dairy Products.
Publishing Co., Inc., Westport, Conn.
'
13th ed.
Chemists,
A. 1982.
The AVI
Barnard, s. E. 1974. Flavor and Shelf-Life of
Fluid Milk. J. Milk and Food Technology 37:346.
4. Bauerfeind, J. C. and Allen, L. E. 1963. Vitamin A
and D .Enrichment of Nonfat Dry Milk. J. Dairy Sci.
46:245.
5. Bender, F. E., Douglass, L. w. and Kramer, A.
1982. Statistical Method For Food and Agriculture.
Avi Publishing Co., Westport, Conn.
6. Birdsall, J. J., Tepley, L. L. and Derse, P. H.
1958. Effect of Light on Homogenized Whole Milk and
Some Fortified Milk Products. Food Technol.
12:670.
88

r 89
7. Bradley, R. L., Jr. 1980. Effect of Light on
Alteration of Nutritional Value and Flavor of Milk:
A Review. J. of Food Prod. 43:314.
8. Burgwald, L. H. and Josephson, D. V. 1947. Keeping
Quality of Pasteurized Milk. J. Dairy Sci.
30:37-383.
9. Cary, c. A. Geddes, w. F.' Guilbert, H. R., '
Hathaway, I. L., Peterson, w. H • ' Salmon, w. D •'
Snedecor, G. w., and Zscheile, F. P., Jr. 1947.
Butter as a Source of Vitamin A in the Diet of the
People of the United States. U.S. Dept. Agr., Misc.
Publ., 636.
10. Causeret, J., Hugot, o., Goulas-Scholler, c., and
Mocquot, G. 1961. Change of Riboflavin and Vitamin
A Levels in Sterilized Milk Over a Long Period.
Ann. Technol. Agr. 10:289-299.
11. Cox, D. H., Coulter, S. T., and Lundberg, w. O.
1957. Effect of NOGA and Other Factors on Stability
of Added Vi tam in A in Dry and Fluid Milk. J. Dairy
Sci. 40:564.
90
12. Davidov, R. and Kruglova, L. 1959. Soderzanie
biotina Molok (Biotin Content of Milk) Molecule
Chemistry Prom 4: 40-42. (Sel' skohoz. Akad.
Timirjazeva, Moscow).
13. DeMan, J. M. 1980. Principles of Food Chemistry.
The AVI Publishing Co., Inc., Westport, Conn.
14. DeMan, J. M. 1981. Light-Induced Destruction of '
Vitamin A in Milk. J. Dairy Sci. 64:2031-2032.
15. DeRitter, E. 1976. Stability Characteristics of
Vitamins in Processed Foods. Food Technol.
30:48-51,54.
16. Dimick, P. s. 197 3. Effect of Fluorescent Light on
the Flavor and Selected Nutrients of Homogenized
Milk Held in Conventional Containers. J. Milk Food
Technol. 36:383-387.
17. Dimick, P. s. 1978. Photochemical Effect on
Constituents of Milk. 32nd P.M.C.A. Production
Conference. The Pennsylvania State University.

18. Dunkley, w. L., Franklin, J. D. and Pangvorn, R. M.
1962. Effects of Fluorescent Light on Flavor,
Ascorbic Acid and Riboflavin in Milk. Food
Technol. 16:9,112.
19. Fennema, o. R. 1976. Principles of Food Science.
Marcel Dekker, Inc. New York and Bassel.
20. Ford, J.E., Kon, s. K. and Thompson, S. Y. 1959. '
Effect of Processing on Vitamins of the B Complex in
Milk. Proc. 15th Intern. Dairy Congr., London
1:429-439.
21. Fragner, J., BLattna, I. and Krumphanzolva, J.
1956. Factors Influencing the Vitamin Content of
Milk. Proc. 14th Intern. Dairy Congr., Rome
1(2) :89-102.
22. Funai, Y. 1955. Studies on r ibof !vain in milk. 1.
On Riboflavin Content in Breast Milk. 2. On
Riboflavin Content in Cow's, Goat's and Dried Milk.
Tokushima J. Experimental Medicine 2: 194-2001
201-206.
91
92
23. Funai, Y. 1957. Studies on riboflavin in milk. 4.
Destruction of Riboflavin in Milk By Heating. 5.
Loss of Riboflavin in Dried Milk Powders ' After
Opening of the Can. Tokushima J. Experimental
Medicine 4: 24-26; 27-30.
24. Goldsmith, s. J., Eitenmiller, R. R., Toledo, R. T.
and Barnhart, H. T. 1983. Effects of Processing
and Storage on the Water-Soluble Vitamin Content of
' Human Milk. J. Food Sci. 48(3):994.
25. Goodhart, R. s. and Shils, M. E. 1980. Modern
Nutritions in Health and Disease. Len & Febiger,
Philadelphia.
26. Gregory, M. E., Ford, J.E., and Kon, S.K. 1958.
The B-Vi tamin Content of Milk in Relation to Breed
of cow and Stage of Lactation. J. Dairy Research
25:447-456.
27. Hankin, L. and Dillman, w. F. 1972. Further
Studies on the Flavor Quality of Retail Milk in
Connecticut. J. Milk and Food Technol. 35:710.

93
28. Hansen, A. P., Turner, L. G. and Aurand, L. w.
1975. Fluorescent Light Activated Flavour in Milk.
J. Milk Food Technol. 38:388-392.
29. Hartman, A. M. and Cruden, L. P. 1965, Vitamins in
Milk and Milk Products. American Dairy Science
Association, Champaign, Ill.
30. Hattiangdi, G. s. and Kanga, K. s. 1956. J. Sci. '
Ind. Research India 15C(2):48.
31. Hauge, s. M. 1942. Feeding of Cow's Controls
Vitamin A Content of Butter. Food Industrial
14(2)48.
32. Hellstrom, v. 1960. The Influence of Sunlight on
Vitamin 86 in Milk. Inter. Zeitschrift Vitamin
Forsch. 30: 323-327. (Vitamin Dept. Nat. Inst. Pub.
Health. Stockholm).
33. Hibbs, J. w., Krauss, w. E. and Monroe, c. F. 1949.
The Relation of the Carotenoid and Vitamin A Content
of Summer Milk to the Carotenoid Content of the
Pasture Herbage J. Dairy Sci. 32:955-960.

94
34. Holmes, A. D. 1944. Effect of Pasteurization on the
Riboflavin Content of Milk. J. Am. Dietet. Assoc.
20:226.
35. Holmes, A. D., Jones, c. P., Wertz, A. w. and
Kuzmeski, J. w. 1943. The Ration of Ascorbic Acid,
Riboflavin and Thiamin in Raw and Pasteurized Milk.
J. Nutrition 26:337-345.
' 36. Hoskin, J. c. and Dimick, P. s. 1979. Evaluation
of Fluorescent Light on Flavor and Riboflavin
Content of Milk Held in Gallon Returnable
Containers. J. of Food Protection, 42(2):102-109.
37. International Paper Co. 1982. Research Indicates
Milk's Vitamins Best Protected in Paper Cartons.
Ogilvy and Mather Public Relations, New York.
38. Josephson, D. v., Burgwaald, L. H. and Stoltz, R.
B. 1946. The Effect of Route Delivery on the
Flavor, Riboflavin and Ascorbic Acid Content of
Milk. J. Dairy Sci. 29:273-284.
39. Kon, s. K. and Thompson, s. Y. 1953. The Effect of
Light on the Riboflavin in Milk. Proc. 13th Intern.
Dairy Congr. 2:363.
95
40. Kramer, M. M., Dickman, R. M., Hildreth, M. D.,
Kunerth, B. L. and Riddell, w. H. 1939. The
Riboflavin Value of Milk. J. oariy Sci. 22:753.
41. Landsberg, J. D., Bodyfelt, F. w. and Morgan, M. E.
1977. Retention of Chemical Contaminants by Glass,
Polyethylene, and Polycarbonate Multiuse Milk
Containers. J. Food Prot. 40:772-777.
42. Legg~, M. and Richards, K. c. 1978. Biochemical
Alterations in Human Breast Milk after Heating.
Australian Pediatric Journal 14(2):87.
43. Leviton, A. and Pallansch, M. J. 1960. Binding of
Riboflavin and Riboflavin Phosphate by the Proteins
of milk. J. Dairy Sci. 43:1713.
44. Levey, G. A. 1982. Light, Milk and Vitamins.
Paperboard Packaging Council, Milk Booklet, New York.
45. Lord, J. w. 1945. Seasonal Variation of Carotene
and Vitamin A in Butterfat and Serum. Biochem. J.
39:372-374.
96
46. Luck, H. and Schillinger, A. 1959. Influence of
Oxygen on Various Milk Constitutents. Zischr.
Lebensmittel Untersuch. Forsch. 110:267-283.
4 7. Marks , J. 1979. A Guide to the Vitamins: Their
Role in Health and Disease. Medical and Technical
Publishing Co., Ltd., Lancaster, London.
48. Marsh, D.C., Peterson, P. B. and Rupel, I. w. 1947.
' The Effect of Feeding Certain Synthetic Vitamins of
the B-Complex on Their Content in i-tilk and Urine.
J. Dairy Sci. 30:867-874.
4 9 • Modi , W. W. and Owen, E. C. 1956. Riboflavin in
Milk. (Hunnh Dairy Res. Inst. Kirhill, Agr.) Nature
178:1120.
50. r-todi, w. w., Owen, E. C. and Darroch, R. A. 1959.
Pastuerization of Riboflavin In Cow's milk. J.
Dairy Research 26:277.
51. Nagasawa, T., Kuzuya, Y. and Shigeta, N. 1961.
Studies on Riboflavin in Milk. I. Relation Between
Riboflavin and Protein. Japan, J. Zootech. Sci.
32:235 in Dairy Sci. Abs. 1962. 24(4)1155.

97
S2. Peterson, M. s. and Johnson, A. H. 1978.
Encyclopedia of Food Science. The AVI Publishing
Company, Inc., Westport Conn.
S3. Peterson, w. H., Haig, F. M. and Shaw, A. o. 1944.
Destruction of Riboflavin in Milk by Sunlight. J.
Am. Chem. Soc. 66:662-663.
S4. Reinart, A. and Nesbitt, J. M. 19S6. The vitamin A
' potency of the milk fat purebred herds in Matitoba.
Proc. 14th Inter. Dairy Congr. Rome. 1(2) 934-94S.
SS. Sattar, A. and DeMan, J. M. 197S. Photoxidation of
Milk and Milk Products: A review Crit. Review in
Food Sci and Nutr. Nov. P. 13.
S6. Sattar, A., and DeMan, J. M. 1973. Effect of
Packaging Material on Light-Induced Quality
Deterioration of Milk. Can. Inst. Food Sci. Technol.
J. 6:170.
S7. Sattar, A., DeMan, J. M. and Alexander, J. c.
1977. wavelength Effect on Light-Induced
Decomposition of Vitamin A and a-carotene in
Solutions and Milk Fat. J. Can. Inst. Sci. Technol.
10:S6-60.
98
58. Senyk, G. F. and Shipe, VJ. F. 1974. I'1odif ied
Fluorometr ic Determination of Vitamin A in Milk. J.
of Dairy Science 58(4)558-560.
59. Senyk, G. F. and Shipe, w. F. 1981. Protecting
Your Milk from Nutritient Losses. Dairy Field.
60. Siddall, D. F. The Use of Plastic in the Dairy
Industry. 1957. International Association of Milk '
and Food Sanitarians, Inc. at Louisville, Kentucky.
61. Singh, R. P., Heldman, o. ·R. and Kirk, J. R. 1975.
Kinetic Analysis of Light-Induced Riboflavin Loss in
Whole Milk. J. of Food Science 40:164.
62. Stamberg, o. E. and Theophilus, D. R. 1944. Loss
of Riboflavin in Milk Due to Sunlight. Milk Dealer
33 (8) :32-42.
63. Stamberg, o. E. and Theophilus, D. R. 1945.
Photolysis of Riboflavin in Milk. J. Dairy Sci.
28:264-275.
64. Strain, H. H. 1939. XI. Isolation and Detection of
a-carotene, and the carotenes of Carrot Roots and of
Butter. J. Biol. Chem. 127:191-201.
65. Sure, B. and Ford, z. w. 1943. Influence of
incubation at 37oc on stability of thiamin and
riboflavin in cow's milk. Proc. Soc. Experimental
Biological medicine. (Dept. Agr. Chem. Univ.
Arkansas, Fayetteville) 54:83-85. '
66. Theophilus, D. R. and Stamberg, O. E. 1945. The
influence of breed feed and processing on the
riboflavin content of milk. J.
28:259-268.
67. Thompson, J. N., Erdody, P. 1974.
Light of Vitamin A Added to Milk.
Sci.Technol. ALiment. 1:157.
68. Thompson, s. Y. and Ascarelli,
Dairy Sci.
Destruction by
J. Inst. Can.
I. 1962.
Utilization of Carotene By the Cow.
16th International Dairy Congress A 81-88.
Proceedings
99

6 9 • Thompson, s . Y • and Kon, S • K • 1950. Some
Applications of Chromatography in the Work of the
National Institute for Research in Dairying. Proc.
8th Congr. Intern. Ind. Agr., Brussels, 2:55-64.
70. Trout, G. M. and Gjessing, E. C. 1939. Ascorbic
Acid and oxidized Flavor in Milk. 1. Distribution
of Ascorbic Acid and Occurrence of Oxidized Flaver
in Commercial Grade A Raw, in Pasteurized Irradiated
' and Pasteurized Milk Throughout the Year. J. Dairy
Sci. 2 2 : 2 71- 2 8 0 •
71. Wagner, K. H. 1957. Milk as a Carrier of
Antirachitic Protective Materials. Fette. Seif en.
Anstrichmittel. 59: 1055-1062.
72. webb, B. H., Johnson, A. H. and Alford, J. 1983.
Fundamentals of Dairy Chemistry. The AVI Publishing
Co., Inc. Westport, Conn.
73. Whitnah, c. H., Martin, w. H. and Beck, G. H. 1937.
Oxidized Milk Flavor as Related to Carotene,
Lecithin and Vitamin c. J. Dairy Sci. 20:431.
100
74. Wilkinson, R. A. and Conochie, J. 1958. The
Determiniation of Vitamin A in Milk Products.
Australian J. Dairy Technol. 13:32-36.
75. Williams, R. R. and Cheldelin, v. H. 1942.
Destruction of Riboflavin by Light. Science 96:
22-23.
'
Wl