Embed Size (px)
Citation preview

Effectiveness of Alternative Export Promotion Strategies For
Branded Food Products
by
Jose R. BrenesGraduate Research Associate
World Food Systems Research GroupDepartment of Agricultural Economics and Rural Sociology
The Ohio State University
Dennis R. HendersonProfessor
World Food Systems Research GroupDepartment of Agricultural Economics and Rural Sociology
The Ohio State University
Ian M. SheldonAssociate Professor
World Food Systems Research GroupDepartment of Agricultural Economics and Rural Sociology
The Ohio State University
Abstract
This study examines the impact on exportsales of various promotional strategies for brandedfood products in foreign markets. It is an empiri-cal analysis using data obtained from organizationsthat administer the High Value Export IncentiveProgram (HVEIP) for branded food products, partof USDA’s Targeted Export Assistance (TEA)program and its successor, the Marketing Assis-tance Program (MAP). To respect the proprietarynature of the data, the identity of individual firmsand brand names has been deleted and productshave been combined into two groups: (1) con-sumer ready and (2) intermediate.
Econometric analysis reveals positive andstatistically significant impacts of expenditures ontelevision advertising and advertising in consumer-orientated print media on export sales of consumerready products, the effect of the latter being some-what larger. No other promotional strategyreveals a consistent and statistically significantrelationship to exports. Channel-orientated strate-gies seldom showed positive results on exportlevels for consumer ready products, and con-sumer-orientated strategies bear no detectablerelationship to export levels of intermediate prod-ucts.
Journal of Food Distribution Research February 921page137
Acknowledgements
This report is based upon research con-ducted as part of North Central Regional Researchproject NC-194, “The Organization and Perfor-mance of World Food Systems: Implications forU.S. Policies. ” The assistance of Kathryn A,Miller, Program Manager, Mid-America Inter-national Agri-Trade Council (MIATCO), and JeanPeate, Project Manager, Western United StatesAgricultural Trade Association (WUSATA), isgratefully acknowledged.
Introduction
International markets have become increas-ingly important to the food and farm system of theUnited States. In 1981, agricultural exportspeaked at $43.78 billion, accounting for 19 per-cent of total U.S. exports. While in the lastdecade the total value of agricultural exports didnot reach its 1981 level, the product mix hasshifted away from bulk commodities toward semi-processed and consumer ready products (Pendlum1990). This change in composition has focusedattention on high value agricultural product(HVAP) exports. Following O’Brien et al.(1983), HVAP are divided into three groups:high-value unprocessed products, such as eggs(SITC1 code number 025), fresh fruits and nuts(05 1), and fresh vegetables (054); semi-processedproducts, such as fresh, chilled and frozen meat(011), refined sugar (612) and coffee (071); andhighly processed products, such as butter (023),cheese (024), chocolate and beverages (011).
In terms of growth, HVAP export perfor-mance has clearly out-paced that of bulk commod-ities. Between 1976 and 1986, high value agricul-tural exports rose from 28 percent to 42 percentof the value of U.S. agricultural exports, as thevalue increased from $6.6 billion to $11.6 billion,a gain of more than 76 percent, On the otherhand, bulk commodities sales were valued at$16.9 billion in 1976 and $15.7 billion in 1986(Burr, 1987).
This change in the structure of agriculturaltrade has not been limited to the United States, In1983, 74 percent of the European Community’s(EC) agricultural exporta, 57 percent of Brazil’s,
78 percent of New Zealand’s and 95 percent ofSpain’s were HVAP (Braaten 1985). Overall,HVAP has been the fastest growing component ofinternational agricultural trade and this trend isexpected to continue. However, while HVAPtrade constituted approximately 66 percent of totalworld trade in 1987, the U.S. share was only 47percent and the United States ranked third in totalvalue of HVAP exports. In brief, the UnitedStates has not been as successful in competing forworld HVAP markets, where its market share isless than 10 percent, as it has been in bulk agri-cultural commodities, where it accounts for a thirdof world trade (Agricultural Outlook 1989).
The trend in world agricultural trade towardhigh value agricultural products poses a specialchallenge to U.S. exporters: its competitive posi-tion, as denoted by its share of world HVAPmarkets, has worsened. The EC, on the otherhand, has become the leader in HVAP exports,maintaining or increasing its market share. Anunderstanding of the factors involved in productdifferentiation, one of the competitive dimensionsnot present in bulk agricultural trade, and howthey affect promotion in HVAP markets may helpdefine strategies to improve the competitive posi-tion of U.S. processed food exporters.
The objective of this paper is to examinehow expenditures for advertising and other pro-motions affect export sales and thus, the inter-national competitiveness of U.S. processed foodexports. To accomplish this, the value of exportsales and expenditures on export promotion andadvertising by a number of U.S. companies partic-ipating in U.S. Department of Agriculture-spon-sored export promotion programs for brandedfood products are analyzed.
1. Data and Methodology
Data Sources: Information regarding mar-keting strategies employed by firms is normallyconsidered proprietary information. This createsan obstacle that must be surpassed if promotionalvariables in marketing strategies are to be identi-fied as having a significant impact on exportperformance. The approach taken in this studyconsists of using primary information collected bytwo of the agricultural trade organizations that
February 92/page 138 Journal of Food Distribution Research

administer the Targeted Export Assistance (TEA)Program for high value agricultural products.Because of the public reporting requirements, theTEA program is a nearly unique source of infor-mation on advertising activities that is not other-wise available for analysis, Specifically, datawere obtained from the Mid-America InternationalAgri-Trade Council (MIATCO) and the WesternUnited States Agricultural Trade Association(WUSATA). Both organizations work with fundsfrom the High Value Export Incentive Program(HVEIP) for branded products, now the Market-ing Assistance Program (MAP), Participatingfirms may be reimbursed a portion of their actualexpenditures for eligible export promotional activ-ities in approved markets. These organizationsprovided information on promotion expendituresavailable under the condition that the data werehandled in such a way that neither the firms’identities nor the products exported would berevealed.
The promotional activities eligible for reim-bursement under the TEA/HVEIP programinclude media and direct mail advertising, tradefairs and exhibits, merchandising, and publicrelations. Other activities need the explicitapproval of the association administering theprogram. Direct selling expenses are not reim-bursed. Companies participating in the programmust submit a marketing plan, sales figures forthe periods before and during which the submittedmarketing plan is executed, and invoices ofincurred expenditures in order to be eligible forreimbursement.
Specificationof Study Variables:The infor-mation from MIATCO and WUSATA was used toconstruct the study’s database. Each observationconsists of a product/market pair, where a productbeing exported to two different markets isrecorded as two observations. However, sortingthe data into relevant variables did present someproblems. These organizations use the informa-tion for control purposes rather than for evaluationof the marketing plans; hence, even when a planof the budgeted activities was submitted, it wasnot always implemented. So, in order to deter-mine how the companies were in fact promotingtheir products, it was necessary to reconstructtheir strategies from invoictx presented by them to
the associations for reimbursement. Along withthe invoices, a copy or a description of the adver-tisement or activity was also requested. For thisanalysis, expenditures were grouped into specificclasses of strategic variables:
(1) Four conwner oriented, or pull, variableswere defined: JeIevision ex~enditures (TV); ~sumer oriented ~rinted material (CSPR), whichincludes newspapers, magazines and flier advertis-ing; point-of-sale dist)lavs and momotions (PSP),which include on-pack giveaways, free consumersamples, mannequin displays, etc.; and hconsumer activities (OCS), grouping those activi-ties targeting consumers not included in the previ-ous categories.
(2) Three channel oriented, or push, variableswere defined: channel minted material (CHPR),includes brochures, advertisements in trade maga-zines, product “newsletters” and direct mailings;samule giveawavs and trade fairs (SF), includesthe shipping of samples and the expendituresincurred when taking part in trade shows; tirchannel activities (OCH), includes activities aimedat winning the goodwill of the distribution channelmembers. Giveaways, from golf balls to pens,were very common. Seminars and other promo-tional meetings were also frequently used.
As well as the above data, an indicator ofexport competitiveness was needed. Unfortun-ately, market share information, a commonly usedvariable, was not available for the country/productpairs in the sample. As an alternative, changes inexport sales was used. The companies reporttheir sales to each market to which they areexporting at the beginning and at the end of theperiod in which they participate in the program.Baseline sales correspond to sales at the end offederal fiscal year 1988. Final sales correspond tosales at the end of federal fiscal year 1989; pro-motional expenditures were those recorded duringfiSCd 1989.
Observations in the study sample are veryheterogeneous; products ranged from highly pro-cessed and consumer oriented, such as frozendinners, to intermediate or ingredients such asspices, In addition, markets (countries) are alsovery diverse. Therefore, one or more variables
Journal of Food Distribution Research February 921page139

were needed to account for differences influencingthe effectiveness of the promotion strategiesamong markets. First, own-price elasticities (DE)were used, indicating how the various marketsreact to changes in food prices and hence reflect-ing their tastes and income levels. Elasticitiestend to be lower for high income countries whereconsumers are less price sensitive than in lowincome countries. Price inelastic market demandsenables increasing sales revenue through raisingprices. The estimates used are Cournot own-priceelasticities, which keep income constant, calcul-ated by Theil and Clements (1987). Second,product characteristics affecting sales were con-trolled for by classifying the products into “inter-mediate, ” which undergo further processingbefore reaching the consumer, and “consumerready, ” which do not.
Using this information, a database with 64observations was constructed. It includes classifi-cation of the product (i.e., intermediate, consumerready), the country to which the product isexported, sales value for the previous fiscal year(baseline sales), sales value for the fiscal yearduring which the promotional activities werecarried out (final sales), and the dollar amount ofexpenditures for each of the selected advertisingand promotion variables.
Statistical Procedures: Two statisticalprocedures were used in analyzing the data. First,an Analysis of Variance (ANOVA) was used totest for mean differences among groups accordingto target market, product type, origin and theemphasis of the strategy @ush vs pull). Second,a linear regression analysis, calculated by Ordi-nary Least Squares (OLS), was performed on thepooled data to determine how each of the definedpromotion and advertising variables affects sales.
2. Results and Analysis
Basic Characteristicsof Sample: In 1988,MIATCO and WUSATA received $2.7 million, or55 percent of the funds allocated to the HV/EIPprogram. The observations from WUSATAaccounted for 56 percent of sales by all WUSATAsponsored firms, and those from MIATCOaccounted for 60 percent of all MIATCO sales,Asian markets are heavily represented in the
sample, accounting for 70 percent of total salesfor the group. The EC accounted for 23 percentof sales and other countries (ROW) for 7 percent.Overall, however, U.S. HVAP exports have beenexported in more or less equal proportions tothese three regions, Thus, the data used in thisstudy are disproportionately weighted toward theAsian markets.
There is a wide variety of products in thesample. Canned fruits and vegetables and fruitjuices make up about half of the observations, andfood ingredients, such as spices and isolated pro-teins, are also numerous. Outside these two broadcategories, products range from TV dinners to petfoods, from nutritional supplements to popcorn.Initial product sales per market ranged from$7,300 to $18.6 million and final sales from $216to $9.6 million. Changes in sales varied between-$9.0 million and $3.3 million. The broad rangeof these figures reflects the diversity in the prod-ucts, markets and firms covered.
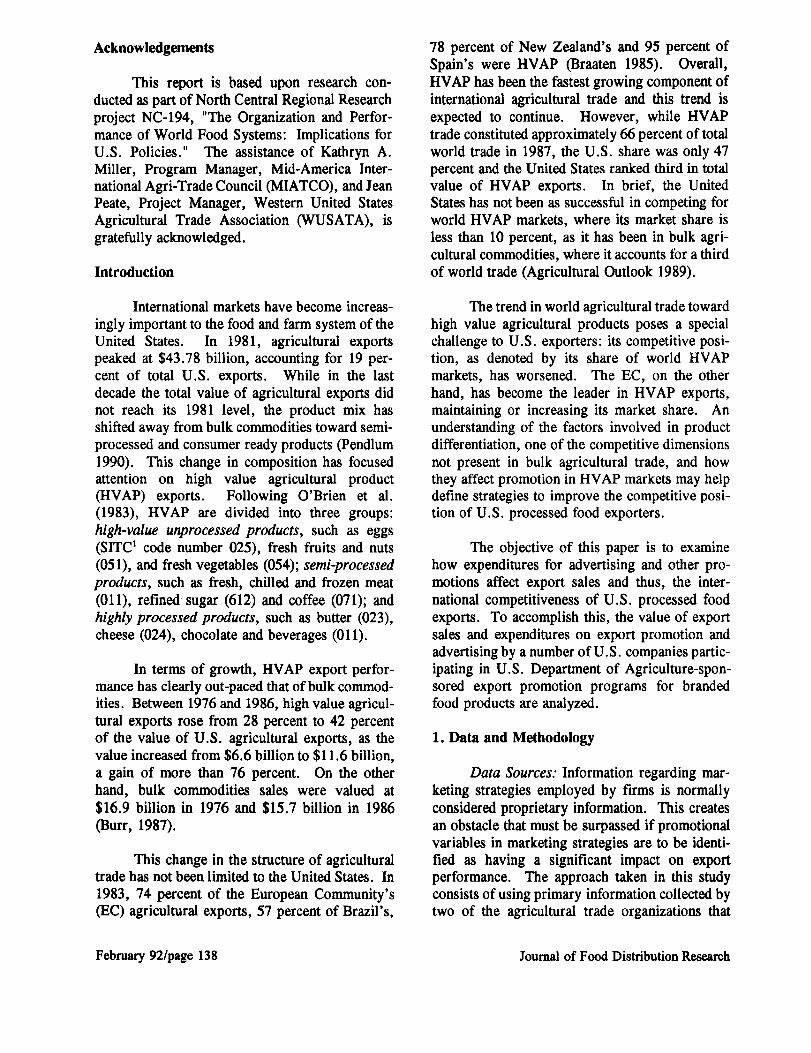
A strategy was classified as primarily pushor pull when expenditures for those type of activi-ties comprised more than 50 percent of total pro-motional expenditures. Regarding the strategiesobserved, forty-three (68.2 %) focused on push-type activities while 20 (31.8%) focused on pull-type activities. This was unexpected since ordy 14(22.2%) products in the sample were classified asintermediate or semi-processed products, whichare normally associated with push strategies.Still, all intermediate products were promoted bya push strategy, Of the 49 observations classifiedas consumer ready products, 29 (59.2%) werepromoted through a mainly push strategy (Figure1). Even if the criterion for classifying a strategyas push or pull is narrowed by increasing thequalifying share of total expenditures in activitiesof the particular type to 70 percent, the percentageof consumer ready products promoted by a pushstrategy would still be high (24 or 49.2%).
Change in sales, defined as final minusbaseline sales, for products promoted by a primar-ily push strategy ranged from -$2.4 million to$3.3 million, with average sales increasing by$151,338 (19.4% of baseline sales). Forprimarily pull promoted products, change in stalesranged between -$9.0 million to $1.7 million. On
February 921page140 Journal of Food Distribution Research

10co=
:
30z*
Figure 1Frequency of Product by Strategy
- oonsmr ready = Intermediate
envu
2026
24P2
20 -18
16
14 -12 -
10 -
Pull Strategy Push Strategy
Journal of Food Distribution Research February 92/page 141

average, sales decreased by -$242,867, (17.8%).The mean responses were heavily affected by onepull-strategy observation with a $9.0 milliondecrease in sales.
The advertising to sales ratio (A/S) for theproducts promoted by a push strategy was 3.89percent and was 6.81 percent for the group ofproducts promoted by a pull strategy, reflectingthe higher cost of a pull-oriented strategy. Figure2 presents the change in sales by products pro-moted by the two strategies, where absolutechange in sales is obtained by adding the changein sales for the group and dividing it by the num-ber of firms, and relative change in sales takesinto account firm size and is calculated as theaverage of the percentage change in sales for eachfirm in the group.
In terms of promotional expenditures bytype of activity:
(i) TV was used as part of twelve of these obser-vations, 66 percent were consumer ready prod-ucts. In half of the cases, TV was used primarilywithin a push strategy. Change in sales for thetwelve observations ranged from -$9 million to+$3.3 million, averaging -$313,727 (-15.4%),but sales increased for nine.
(ii) Consumer oriented printed material, CSPR,was used in twenty-seven cases. All of the prod-ucts in this group are in the consumer ready cate-gory. As with TV expenditures, half the observa-tions used this activity primarily within a pushstrategy. Change in sales varied from -$1.48million to +$1.69 million, Average sales for thegroup increased by $129,248, (15.7%), Salesincreased for twenty-two.
(iii) Channel oriented printed material, CHPR,was present in 32 observations. Of the intermedi-ate products, ten (71 %) used this promotionalmedium as did 22 (44.8%) of the consumer-readyproducts. This activity was used mainly (66%)within a push strategy. Change in sales fluctuatedt%om-$786,244 to +$3.3 million. Average salesfor the group remained fairly stable, increasingonly by $13,281 (1.1%). Sales increased in 25observations.
(iv) Point-of-sale and promotions, PSP, were usedwith 25 products. All were in the consumer-readycategory. In two thirds of the cases, they werepart of a primarily push strategy. Change in salesranged from -$2.4 million to +$1 .46 million,with average sales varying only by -23,236(-2.01 %). Sales increased for 23 products.
(v) Samples and trade fairs, SF, characteristicallypush activities, were used with 22 products, nineintermediate and 13 consumer ready. In all buttwo instances, they were used within a primarilypush strategy. Change in sales varied from-$786,244 to +$557, 172. Average salesdecreased by $363,941 (34.5%) but salesincreased in 19 of the observations.
(vi) Finally, the other channel, OCH, and otherconsumer, OCS, variables were used to groupexpenditures that did not fit into any of the previ-ous defined activities. These included such thingsas give-a-ways to retailers and cooking seminarsaimed at gaining product awareness. Other chan-nel oriented expenditures were observed in 21instances. Of these, only three were used withina mainly pull strategy. Two thirds of the productsin this group were consumer-ready products.Change in sales ranged from -$1.47 million to+$3,3 million. On average, sales decreased by-$79,435 (6.2 %). Other consumer expenditureswere reported in only five cases and were used inpull strategies with consumer ready products.Average sales increased by $197,552 (140,4%),with sales changing from +$19,587 to+$233,132.
A summary of the observed activities ispresented in Figure 3, and Figure 4 presents thechange in sales by products using the differentmedia, where absolute change in sales is obtainedby adding the change in sales for the group anddividing it by the number of firms, and relativechange in sales takes into account firm size and iscalculated as the average of the percentage changein sales for each firm in the group,
Several points in the previous analysis needto be highlighted. First, 60 percent of the con-sumer-ready products are being promoted primar-ily through a push strategy. This is not consistentwith the prior expectation of a positive correlation
Febmary 921page 142 Journal of Food Distribution Research

Figure 2Change in Sales by Strategy Employed
- abaoluto - relatlvo
160
140
120
100
00
80
40
20
0
-20
Pull Strategy Push Strategy
Journal of Faod Distribution Research February 92/page 143

24
22
20
18
16
14
12
10
BB
4
2
0
Figure 3Frequency of Activity by Strategy
m Pull = Push
TV CSPR Ocs CHPR PSP SF OCH
ACTIVITY
February 921page 144 Journal of Food Distribution Research

Figure 4Change in Sales By Activity Employed
- Absolute = Relatlve
260260240220200100160140120100
80604020
0-20
TV csPn OC8 CHPR PSP SF OCH
1. Standard International Trade Classification codes.
2. An observation can be in more than one activity group.
3. The ANOVA criteria for hypothesis testing were not changed by the deletion of the outliers.
Journal of Food Distribution Research February 92/page 145

between consumer-ready products and pull strate-gies. Exporters appear to be relying on thirdparties, channel members in this case, to markettheir products to the consumers. All intermediateproducts, however, were promoted through aprimarily push strategy, as expected.
Regarding the classification of the differentactivities into a push or a pull strategy, the datasupport the criteria followed. Even with con-sumer ready products being promoted heavily bypush strategies, television, consumer orientedprinted material and other consumer orientedexpenditures were associated with a primarily pullstrategy in half or more of the cases in which theywere used. Channel printed material, point-of-sale expenditures and the other activities expectedto be associated with a push strategy were usedwithin a primarily push strategy in at least twothirds of the cases. PSP expenditures are a pushactivity even though they are aimed at consumers.What is more, almost all strategies were heavilyfocused on only one of the two strategicapproaches. An alternative “mixed strategies”category, where total expenditures for one cate-gory of activities is less than 70 percent, wouldhave accounted for five, or 8 percent, of theobservations.
Even though the marketing plans variedaccording to the characteristics of product, thesegment of the market to which they were tar-geted, and a myriad of other factors, two elementswere frequently present. The first, used mainly inpull strategies, was the idea of “America” as amarketing tool. The TEA program encouragesmentioning in the product labels that they arefrom the United States; most firms do so, Severalfirms carry this concept much further, includinguniquely “American” life-style themes in advertis-ing content. Others stress the quality of Americanfood products. The other common approach,mairdy used in push strategies, was to organizeseminars showcasing to distributors and shopowners the uses and qualities of their products,These seminars are deemed necessary since somecompanies are introducing products new to theparticular market and need to achieve productawareness.
ANOVAResults: Five null hypotheses weretested using the ANOVA methodology, the resultsbeing shown in Table 1. All had relative changein sales, the ratio of change in sales to baselinesales expressed as a percentage, as the dependentvariable. Only two, Ho 1 and H03, were signifi-cant y different from zero.
- Hol tested for differences among productsbeing promoted by the different strategies. Exportdata from USDA’s Schedule B by commodityclass, by country, of the products in the samplewere used as a benchmark against which the per-formance of the strategies was compared. Therelative changes in sales group means obtainedare: 156.8 percent for pull-promoted products(Pull), 47.12 percent for push-promoted products(Push) and 46.63 percent for all U.S. exports(us).
Both Duncan’s and Tukey’s tests showedstatistically significant differences at the 0.05 levelbetween (pull) and (Push), and between (pull) and(US). The competitive position for products usinga pull strategy improved relative to that of allU.S. exports. There was no difference betweenthe latter and those identified as being promotedthrough a push strategy. Companies willing toinvest in the direct marketing of their product tothe consumer, using a pull strategy, were moresuccessful than those using the channel to do so.
- H03 tested for differences between prod-uct type/strategy groups. There were no interme-diate products being promoted by a pull strategy.The group means obtained were: 156.8 percentfor consumer-ready products promotal by a pullstrategy (Pull-CSR), 31,56 percent for consumer-ready products promoted by a push strategy (Psh-CSr), and 79.33 percent for intermediate productspromoted by a push strategy (Psh-IN). At the0.05 level, Duncan’s test showed significant dif-ferences between (P1l-CSR) and (Psh-CSR). Thegroups were also significantly different underTukey’s criteria at the 0.10 level. As hypothe-sized, sales of consumer-ready products increasedmore when promoted by predominantly pull strat-egies than when promoted by predominantly pushstrategies, The “optimal” strategies, push forintermediate and pull for consumer-ready,achieved statistically similar results. When tested
February 92/page 146 Journal of Food Distribution Research

Table 1
Summary of ANOVA Results
Relative GroupsChange in Decision Statistically
HvDothesis Variable Sales (means) F-ratio F-Probab ilitv (at t)= 0.05) Different
Ho 1:PromotionPullPushUs.
Ho2:Product TypeInter.Cons. R.
Ho3:StrategyP1l-CSRPsh-INPsh-CSR
Ho4:DestinationAsiaR-O-WW .Europe
Ho5:OriginMiatcoWusata
156.8 4.07 0.0196 Rejected Pull-Push47.12 Pull-us46.63
82.6879.33
156,879.3331.56
79.61122.7534.61
11064,67
0.01
3.13
0.97
0.96
0.09512 Not rejected
0.0511 Rejected PllCSR-P#fSR
0.3858 Not Rejected
0.3308 Not Rejected
Journal of Food Distribution Research February 92/page 147

against all U.S. exports, only (P1l-CSR) is signifi-cantly different. Products promoted by primarilypush strategies resulted in sales similar to all U.S.exports.
- Hypotheses H02, H04 and H05 were notrejected. H02 tested for differences attributable toproduct type. A priori, consumer-ready productshave characteristics maldng them more susceptibleto differentiation than intermediate products; aquality that was expected to affect export perfor-mance. Group means are 82.68 percent for inter-mediate products (Inter) and 79.33 percent forconsumer ready products (CSR). H04 and H05,included to control for destination and origin, didnot indicate significant differences attributable tothese factors. For H04, group means were 79.61percent for Asia, 34.61 percent for WesternEurope, and 122.75 percent for the Rest of theWorld (ROW). The minimum significant differ-ence according to Tukey’s test, at the 0.05 level,was 139.6 percent. For H05, group means were110 percent for MIATCO, and 64.67 percent forWUSATA. The minimum significant differencewas 92.53 percent.
OLSResults: Regression analysis was usedto identify specifically the promotional activitiesthat had a statistically significant impact on salesof the products in the sample. Two models werespecified with this objective. As evidenced in thedescriptive analysis, it seemed that one or twoobservations were heavily influencing the sample.To control for the impact of these observations, anoutlier test, using the DFFITS statistic, was per-formed where a large value indicates that theobservation is very influential in the regression.Following the size-adjusted cut off criteria recom-mended by Belsley et al., two observations weredeleted3.
- Model I, used change in sales, in dollars,as the dependent variable, the results being shownin Table 2. The independent variables were:expenditures on the different promotion activities,also in dollars; a dummy for product type, definedas zero for intermediate products and as one forconsumer-ready products; and the estimates of thedemand elasticities. The R’ obtained was 0,27with an adjusted R’ of 0.1303, and the model’s FValue of 1.932 is significant at the 90 percent
confidence level. Two of the advertising variableshad positive and significant coefficients, TV andCSPR, with every dollar spent on TV resulting inan increase in sales of $3.31 and every dollarspent on consumer oriented printed materialincreasing sales by $12.07. According to hismodel, CSPR is four times more effective thanTV in increasing sales. The coeftlcients for theother advertising variables were not significant.The dummy variable accounting for product char-acteristics was significant and had a negative sign,reflecting a detrimental impact of using the inap-propriate strategy, promoting consumer-readyproducts through push activities. The demandelasticity parameter used to characterize the differ-ent markets was not significant.
- Model 11, used relative change in sales,the ratio of change in sales to baseline sales, asthe dependent variable. The independent variableswere the ratios of expenditures on each type ofactivity to baseline sales along with the producttype dummy and the elasticity of demand esti-mates. By taking into account the differences insales volume among firms, this model shouldperform better than model I. The results, shownin Table 3, bear this out with an R2 of 0.3641, anadjusted R’ of 0.2423, and an F Value of 2.990,significant at the 95 percent confidence level.RTV and RCSPR were both positive and signifi-cant at this level, RTV had a coefficient of 2.3847and RCSPR of 5.0322. These coefllcients mustbe interpreted with caution since they are largelyaffected by the initial volume of sales; however,expenditures on consumer-oriented printed mater-ial showed the biggest positive impact on thecompetitive position of the firm.
Even though their beta estimates were notstatistically significant, the coefilcients of theother promotional activities merit some analysis,especially as they show signs opposite to thoseexpected. Of the four push activities being evalu-ated, three had negative signs. It would seem thattargeting channel members as a strategy to intro-duce and gain sales for new products in foreignmarkets is a doubtfully effective strategy. Japan,a market heavily represented in the sample, hascumbersome distribution channels, particularly inthe food sector, with thirty times the number ofwholesalers as there are in the United States.
February 921page 148 Journal of Food Distribution Research

Table 2
OLS Results for Activity Expenditures - Model I
DF F-Value Prob > F R-Sauare
60 1.932 0.072 0.27
Parameter Estimates
Parameter Standard T for HO:Variable Estimate Error Parameter = O Prob > IT I
INTERCEPTVCSPRCHPRPSPSFOCHOcsPTDE
468422.083.31235244**
12.07814525**-6.17127723-3.67051047
-24.4396792210.55392721-5.97954022
46755.81**328976.78
321615.431.149958785.560657526.633837744.78329727
22.7477612010.3942926625.91630683
194730.17852060.77
1.4562.8802.172
-0.930-0.767-1.0741.015
-0.231-2.0890.386
0.15190.00600.03490.35700.44670.28810.31510.81850.04220.7012
** Significant atthe O.05 level
Table 3
OLS Results for Activity Expenditures-Model II
DF F-Value Prob > F R-Sauare60 2.489 0.020 0.3182
Parameter Estimates
Parameter Standard T for HO:Variable Estimate Error Parameter = O Prob> ITI
INTERCEPRTVRCSPRRCHPRRPSPRSFROCHROCSPTDE
0.334493762.38476948**5.03220494**1.32261604
-0.0056312041.10308592
-0.45812209-1.47042865-0.44056120-0.97808685
** Significant att.he O.05 level,
0.544022620.839014801.557770321.686610441.301371860.976277354.608716231.129170760.353980041.62356246
0.6152.8423.2300.784
-0.0041.130
-0.099-1.302-1.245-0.602
0.54160.00660.00220.43680.99660.26410.92120.19910.21930.5497
JoumalofFood Distribution Research February92/page149

Push strategies are difficult to implement in suchan environment. The estimates for PT and DEwere not statistically significant, but the DEparameter has the expected negative sign.
Both sets of results exhibit several featureswhich need to be addressed. First, both TV andCSPR were the dominating factors affecting sales.The effect of these activities on consumers can beobserved within a few weeks of their implementa-tion and might be better reflected in the sample.Time-series data would help to clarify this point.Second, the fact that all other activities were notsignificant might be due to a multicollinearityproblem, i.e. some of the independent variablesare a linear function of other independent vari-ables. The correlation matrices for both modelswere calculated and there are several variableshaving high Pearson correlation coefilcients, Thedata used do not permit one to differentiate clearlyhow these variables are affecting the dependentvariable. Multicollinearity can be solved eitherby adding new observations, by introducing exactlinear constraints, or performing a ridge regres-sion. It was not possible to obtain new observa-tions given the data limitations described earlier;there is no previous information on the indepen-dent variables to create the linear constraints; andridge regressions do not solve the cause of theproblem, they only make it manageable. Withthese limitations the models were used as tools toidentify the most effective promotional activitiesand as such proved to be useful.
Summarizing, U.S. exporters in the samplepredominantly promoted their products using pushstrategies for both consumer-ready and intermedi-ate products. Nevertheless, pull strategies gavethe best results. The results obtained from theregression analysis reinforced the ANOVA find-ings, showing that firms using pull strategies aresuccessful in improving their competitive positionin HVAP export markets.
3. Conclusions
The results from the study might be used toevaluate current HVAP promotion programs andpolicies. First, there is an important difference inthe products within the HVAP category. Interme-diate products can be effectively promoted by
targeting the distribution channels, a similarapproach to that followed in the promotion of bulkagricultural commodity exports. Consumer-readyproducts, on the other hand, need to be promoteddirectly to the consumers. HVAP producersplanning to engage in the promotion of theirproducts in foreign markets must have the mana-gerial skill and financial capital necessary to exe-cute these types of promotional activities. Evenwhen current export promotion programs recog-nize the importance that promotional activitieshave as an element for the success of the export-ing effort, they fail to achieve an adequate returnon resources when this difference between con-sumer-ready and intermediate products has notbeen recognized. Not all exporting firms shouldbe encouraged to export consumer-ready products.Small and medium sized firms may have a betterchance of succeeding as exporters if they focus onintermediate or semi-processed products.
A related issue deals with the effectivenessof the USDA programs used for promoting HVAPexports. At the present it is almost impossible todetermine the returns on the funds spent on suchprograms as almost no provisions for evaluationhave been made.
Finally, firms interested in getting access toforeign markets should evaluate all their alterna-tives and not limit their choices to targeting thechannel or the consumer. Other strategic optionssuch as joint ventures or licensing might be anoption when marketing cost becomes a constraint.
In conclusion, further tests are needed ofthe impact of export promotion activities usingdata from other sources. Research that discrimi-nates among the promotion strategies targetingchannel members would help complete the analy-sis presented here.
February 921page 150 Journal of Food Distribution Research

References
Agricultural Outlook. “High Value Exports WillReach Record High, ” AO-152 (May1989):22.
Belsley, D. A., Kuh, E. and Welsh, R. E.,RegressionDiagnostics:Identijjing Influen-tial Data and Sourcesof Collinearity. NewYork NY: Wiley, 1980.
Braaten, J. “Value Added Exports: Better Protec-tion Against Economic Shocks. ” ForeignAgriculture. 9(1985):19-20.
Burr, P. “High Value Exports: Bright Spot In theU.S. Picture. ” Foreign Agriculture. 25(December 1987): 10-12.
Journal of Food Distribution Research
O’Brien, P., J. Coyle and W. Coyle. High-ValueAgriculturalExports: U.S. OpportunitiesinThe 1980‘s. Foreign Agricultural Econ-omic Report No. 188. Washington D, C.:Economic Research Service, U.S .D.A.
Pendlum, D., “Agricultural Trade: The Decade inReview. ” AgExporter 2 (March 1990): 10-13.
Theil, H. and K. W. Clements, Applied DenumdAnalysis. Cambridge MA: Ballinger Pub-lishing Company, 1987.
February 921page 151

February 921page 152 Journal of Food Distribution Research