Embed Size (px)
Citation preview
Technical Report Documentation Page 1. Report No. FHWA/TX-08/0-5657-1
2. Government Accession No.
3. Recipient's Catalog No. 5. Report Date October 2007 Published: January 2008
4. Title and Subtitle EFFECTIVENESS OF THE “TEENS IN THE DRIVER SEAT PROGRAM” IN TEXAS
6. Performing Organization Code
7. Author(s) Russell H. Henk, Valmon J. Pezoldt, and Katie N. Womack
8. Performing Organization Report No. Report 0-5657-1 10. Work Unit No. (TRAIS)
9. Performing Organization Name and Address Texas Transportation Institute The Texas A&M University System College Station, Texas 77843-3135
11. Contract or Grant No. Project 0-5657 13. Type of Report and Period Covered Technical Report: November 2006-August 2007
12. Sponsoring Agency Name and Address Texas Department of Transportation Research and Technology Implementation Office P. O. Box 5080 Austin, Texas 78763-5080
14. Sponsoring Agency Code
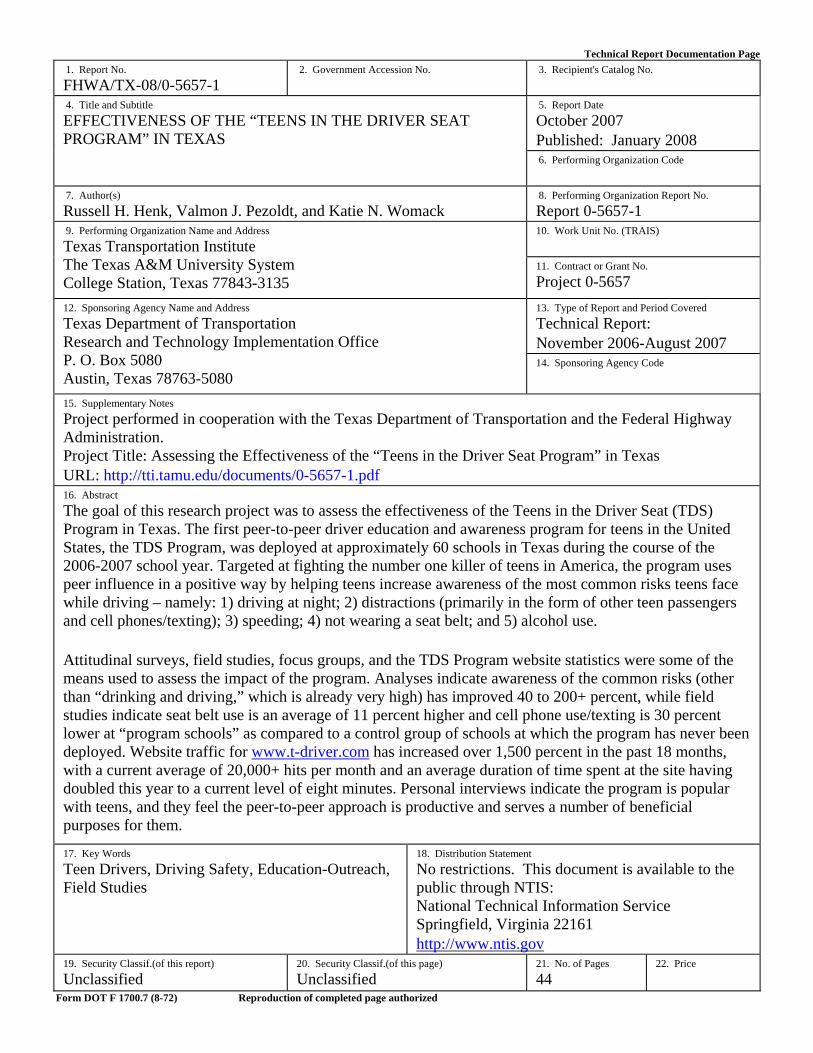
15. Supplementary Notes Project performed in cooperation with the Texas Department of Transportation and the Federal Highway Administration. Project Title: Assessing the Effectiveness of the “Teens in the Driver Seat Program” in Texas URL: http://tti.tamu.edu/documents/0-5657-1.pdf 16. Abstract The goal of this research project was to assess the effectiveness of the Teens in the Driver Seat (TDS) Program in Texas. The first peer-to-peer driver education and awareness program for teens in the United States, the TDS Program, was deployed at approximately 60 schools in Texas during the course of the 2006-2007 school year. Targeted at fighting the number one killer of teens in America, the program uses peer influence in a positive way by helping teens increase awareness of the most common risks teens face while driving – namely: 1) driving at night; 2) distractions (primarily in the form of other teen passengers and cell phones/texting); 3) speeding; 4) not wearing a seat belt; and 5) alcohol use. Attitudinal surveys, field studies, focus groups, and the TDS Program website statistics were some of the means used to assess the impact of the program. Analyses indicate awareness of the common risks (other than “drinking and driving,” which is already very high) has improved 40 to 200+ percent, while field studies indicate seat belt use is an average of 11 percent higher and cell phone use/texting is 30 percent lower at “program schools” as compared to a control group of schools at which the program has never been deployed. Website traffic for www.t-driver.com has increased over 1,500 percent in the past 18 months, with a current average of 20,000+ hits per month and an average duration of time spent at the site having doubled this year to a current level of eight minutes. Personal interviews indicate the program is popular with teens, and they feel the peer-to-peer approach is productive and serves a number of beneficial purposes for them. 17. Key Words Teen Drivers, Driving Safety, Education-Outreach, Field Studies
18. Distribution Statement No restrictions. This document is available to the public through NTIS: National Technical Information Service Springfield, Virginia 22161 http://www.ntis.gov
19. Security Classif.(of this report) Unclassified
20. Security Classif.(of this page) Unclassified
21. No. of Pages 44
22. Price
Form DOT F 1700.7 (8-72) Reproduction of completed page authorized

EFFECTIVENESS OF THE “TEENS IN THE DRIVER SEAT PROGRAM” IN TEXAS
by
Russell H. Henk, P.E. Senior Research Engineer
Texas Transportation Institute
Valmon J. Pezoldt Research Scientist
Texas Transportation Institute
and
Katie N. Womack Senior Research Scientist
Texas Transportation Institute
Report 0-5657-1 Project 0-5657
Project Title: Assessing the Effectiveness of the “Teens in the Driver Seat Program” in Texas
Performed in cooperation with the Texas Department of Transportation
and the Federal Highway Administration
October 2007 Published: January 2008
TEXAS TRANSPORTATION INSTITUTE The Texas A&M University System College Station, Texas 77843-3135

v
DISCLAIMER The contents of this report reflect the views of the authors, who are solely responsible for the facts and accuracy of the data, opinions, and conclusions presented herein. The contents do not necessarily reflect the official views or policies of the Texas Department of Transportation (TxDOT) or the Federal Highway Administration (FHWA). This report does not constitute a standard or regulation, and its contents are not intended for construction, bidding, or permit purposes. The names of specific products or manufacturers listed herein do not imply endorsement of these products or manufacturers. The engineer in charge of this project was Russell H. Henk, P.E. (Texas #74460). The United States Government and the State of Texas do not endorse products or manufacturers. Trade or manufacturers’ names may appear herein solely because they are considered essential to the object of this report.
vi
ACKNOWLEDGMENTS This effort was conducted under a cooperative research program between the Texas Transportation Institute (TTI), TxDOT, and FHWA. Shawna Russell of TxDOT’s Administration was the Project Director (PD), while Lauren Garduno of the TxDOT Odessa District served as the Program Coordinator (PC). Other TxDOT members of the Project Monitoring Committee included Ismael Soto and Kathy Neeley. Wade Odell and Sandra Kaderka of TxDOT’s Research and Technology Implementation Office were active participants in project management meetings and also provided valuable input during the course of this project.
vii
TABLE OF CONTENTS
Page LIST OF FIGURES ................................................................................................................... viii LIST OF TABLES ....................................................................................................................... ix
CHAPTER 1. INTRODUCTION............................................................................................... 1 BACKGROUND AND SIGNIFICANCE OF WORK............................................................... 1 INTRODUCING THE PROGRAM ........................................................................................... 2 DEPLOYING THE PROGRAM ................................................................................................ 5
CHAPTER 2. ASSESSMENTS OF THE TDS PROGRAM ................................................... 9 ATTITUDINAL SURVEY......................................................................................................... 9 FIELD STUDIES...................................................................................................................... 12 PERSONAL INTERVIEWS .................................................................................................... 14 WEBSITE USE......................................................................................................................... 15 CRASH DATA ANALYSIS .................................................................................................... 16
CHAPTER 3. CONCLUSIONS AND RECOMMENDATIONS .......................................... 25
REFERENCES............................................................................................................................ 27
APPENDIX: ATTITUDINAL SURVEYS................................................................................ 29
viii
LIST OF FIGURES
Page Figure 1. TxDOT Districts Where TDS Program Deployment Occurred,
2006-2007 School Year............................................................................................... 4 Figure 2. TDS Program Promotional Items. .................................................................................. 5 Figure 3. TDS Promotional Item Order Form. .............................................................................. 6 Figure 4. Snapshot of the TDS Website, www.t-driver.com......................................................... 7 Figure 5. Results of Pre- and Post-Assessments of TDS Program Pilot Study, San Antonio,
Texas, 2002-2003 (n=2,800)....................................................................................... 11Figure 6. Website Hits per Month, Late 2005 to Present............................................................. 16Figure 7. 15-19 Year-old Drivers in Fatal Crashes in Texas. ...................................................... 19 Figure 8. 15-19 Year-old Driver Fatalities in Texas.................................................................... 19 Figure 9. 15-19 Year-old Drivers in Speed-related Fatal Crashes............................................... 20 Figure 10. 15-19 Year-old Speed-related Driver Fatalities. ..........................................................20 Figure 11. 15-19 Year-old Drinking Drivers in Fatal Crashes......................... ............................ 21 Figure 12. 15-19 Year-old Drinking Driver Fatalies .................................................................... 21 Figure 13. 15-19 Year-old Passenger Fatalies in Vehicle with 15-19 Year-old Drivers .............. 22 Figure 14. 15-19 Year-old Drivers in Fatal Crashes from 10:00 PM to 6:00 AM ....................... 22 Figure 15. 15-19 Year-old Driver Fatalities from 10:00 PM to 6:00 AM .................................... 23
ix
LIST OF TABLES
Page Table 1. TDS Program Schools, 2006-2007 ................................................................................... 2 Table 2. Schools and Respective Surveys Completed, Pre-TDS Deployment ............................... 9 Table 3. Driving Risk Awareness Among Teens in Texas........................................................... 10 Table 4. Summary of Driving Behavior Among Teens in Texas ................................................. 12 Table 5. Teen Seat Belt Use in the Garland School District, 2007............................................... 13 Table 6. Teen Seat Belt Use, Garland versus Mesquite School District, April 2007 ................... 13 Table 7. Wireless Device Use by Drivers in Garland and Mesquite School Districts,
Spring 2007 - Post TDS Program Deployments......................................................... 14 Table 8. 15-19 Year-old Driver Involvement in Fatal Crashes and Driver Casualties ................ 17

1
CHAPTER 1. INTRODUCTION
BACKGROUND AND SIGNIFICANCE OF WORK
Nationwide, approximately 6,000 teens die in vehicle crashes each year – that is the equivalent of a commercial jet full of teens crashing to the ground once per week – costing the U.S. $41 billion dollars per year. It is, far and away, the number one killer of teens in America and accounts for 70 percent of teen injuries and deaths.
In Texas alone, the loss of life is greater than any other state, averaging more than 500 young drivers per year, with teens showing up in 22 percent of all car crashes (compared to the national average of 15 percent). These crashes result in an economic loss of $3.5 billion per year in our state. In addition to the magnitude of lives lost, statistics indicate that on a per-mile driven basis, 15 and 16-year old drivers are approximately 10 times more likely to be killed in a car crash than those age 30 to 50 years old, with approximately 100 teen injuries being incurred for every fatality. Clearly this is a significant problem that is only getting worse, and one in which Texas is a leader in a number of undesirable respects.
Research has shown that virtually all of the crashes involving young drivers are caused by inexperience coupled with one or more of the five major risks that young drivers face: 1) driving at night, 2) distractions (primarily other teen passengers and cell phones/texting), 3) speeding, 4) not wearing a seat belt, and 5) alcohol use. Furthermore, the research shows that, outside of alcohol use, teen drivers and their parents are largely unaware of these risks. To combat this growing problem, The Texas Transportation Institute (TTI) developed an innovative peer-to-peer program entitled “Teens in the Driver Seat” (TDS). The program provides students access to age-specific crash statistics, safe driving tips, risk factors, a “how-to” guide for promoting awareness at their school(s), videos and other online resources geared to developing sustainable safe driving projects unique to the students and their school environment. The TDS Program targets young people directly to help develop and deliver the right message. It is designed to address both awareness and behavior by turning peer pressure in a positive and productive direction. As this program deployment grows throughout the State of Texas, it will be valuable to know if the program is bringing about changes in teen driver awareness and behavior, and if so, how and to what extent. The purpose of this study is to conduct such assessments so as to enable TxDOT to gauge the potential benefits of continuing deployment and support of the TDS Program. The subsequent sections of this introductory chapter outline the basic elements of the TDS Program and deployment activities to date. The following chapters describe attitudinal surveys, field studies, and focus group sessions (and their findings) that were all used to conduct an assessment of TDS Program impacts on teen driving risk awareness and behavior.
2
INTRODUCING THE PROGRAM
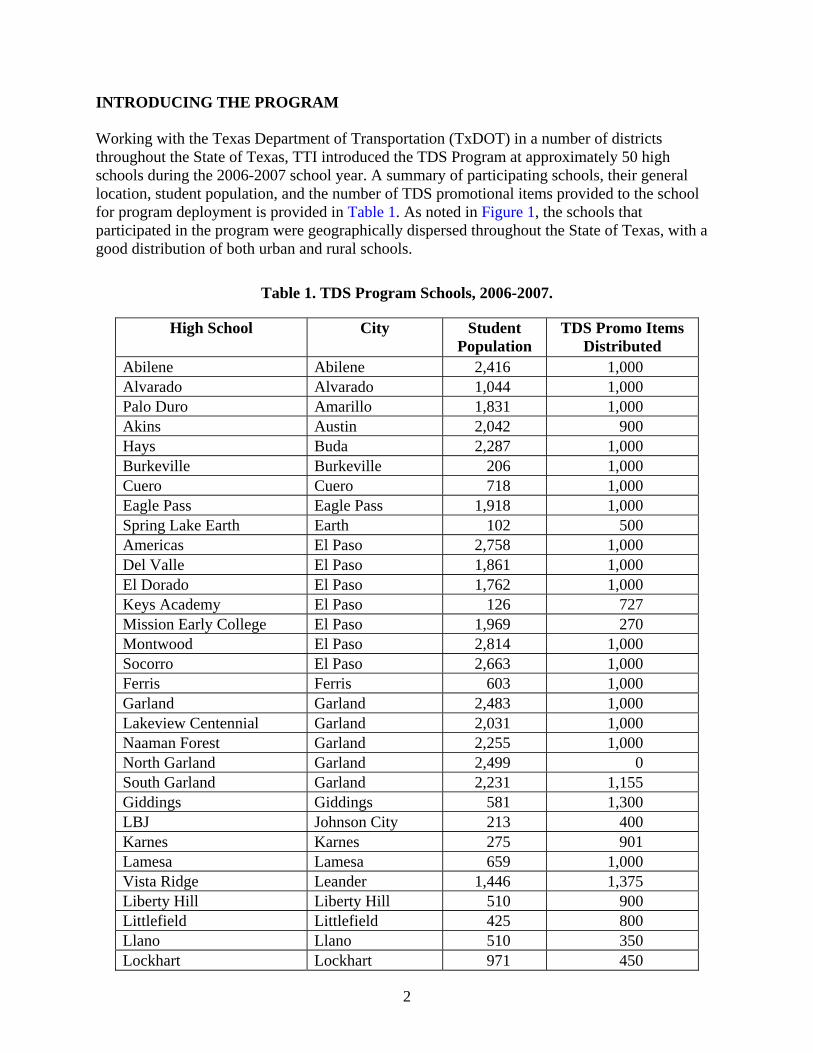
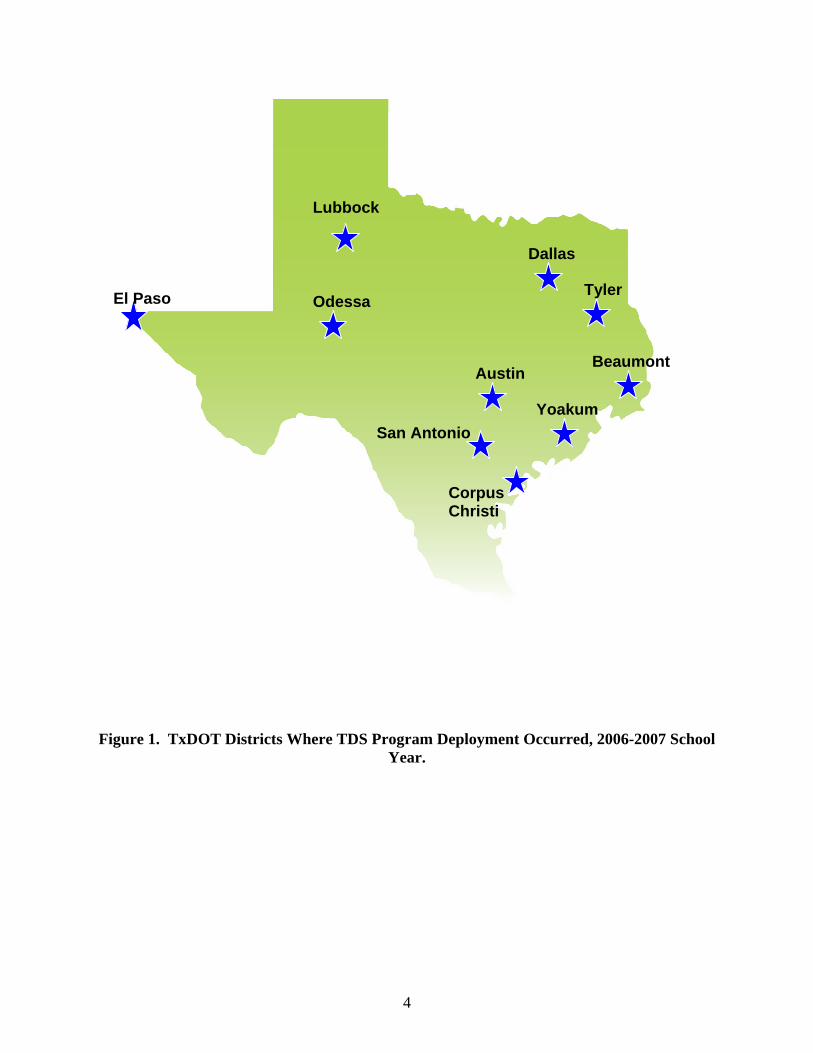
Working with the Texas Department of Transportation (TxDOT) in a number of districts throughout the State of Texas, TTI introduced the TDS Program at approximately 50 high schools during the 2006-2007 school year. A summary of participating schools, their general location, student population, and the number of TDS promotional items provided to the school for program deployment is provided in Table 1. As noted in Figure 1, the schools that participated in the program were geographically dispersed throughout the State of Texas, with a good distribution of both urban and rural schools.
Table 1. TDS Program Schools, 2006-2007.
High School City Student Population
TDS Promo Items Distributed
Abilene Abilene 2,416 1,000 Alvarado Alvarado 1,044 1,000 Palo Duro Amarillo 1,831 1,000 Akins Austin 2,042 900 Hays Buda 2,287 1,000 Burkeville Burkeville 206 1,000 Cuero Cuero 718 1,000 Eagle Pass Eagle Pass 1,918 1,000 Spring Lake Earth Earth 102 500 Americas El Paso 2,758 1,000 Del Valle El Paso 1,861 1,000 El Dorado El Paso 1,762 1,000 Keys Academy El Paso 126 727 Mission Early College El Paso 1,969 270 Montwood El Paso 2,814 1,000 Socorro El Paso 2,663 1,000 Ferris Ferris 603 1,000 Garland Garland 2,483 1,000 Lakeview Centennial Garland 2,031 1,000 Naaman Forest Garland 2,255 1,000 North Garland Garland 2,499 0 South Garland Garland 2,231 1,155 Giddings Giddings 581 1,300 LBJ Johnson City 213 400 Karnes Karnes 275 901 Lamesa Lamesa 659 1,000 Vista Ridge Leander 1,446 1,375 Liberty Hill Liberty Hill 510 900 Littlefield Littlefield 425 800 Llano Llano 510 350 Lockhart Lockhart 971 450
3
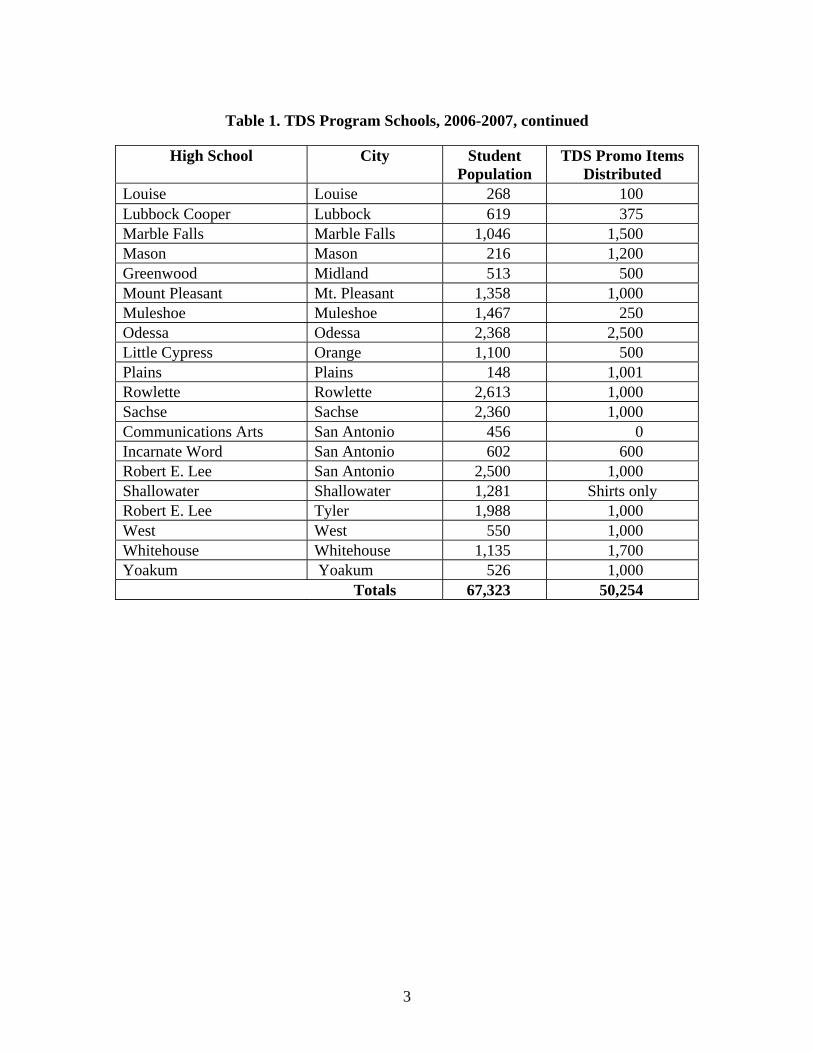
Table 1. TDS Program Schools, 2006-2007, continued
High School City Student Population
TDS Promo Items Distributed
Louise Louise 268 100 Lubbock Cooper Lubbock 619 375 Marble Falls Marble Falls 1,046 1,500 Mason Mason 216 1,200 Greenwood Midland 513 500 Mount Pleasant Mt. Pleasant 1,358 1,000 Muleshoe Muleshoe 1,467 250 Odessa Odessa 2,368 2,500 Little Cypress Orange 1,100 500 Plains Plains 148 1,001 Rowlette Rowlette 2,613 1,000 Sachse Sachse 2,360 1,000 Communications Arts San Antonio 456 0 Incarnate Word San Antonio 602 600 Robert E. Lee San Antonio 2,500 1,000 Shallowater Shallowater 1,281 Shirts only Robert E. Lee Tyler 1,988 1,000 West West 550 1,000 Whitehouse Whitehouse 1,135 1,700 Yoakum Yoakum 526 1,000 Totals 67,323 50,254
4
Figure 1. TxDOT Districts Where TDS Program Deployment Occurred, 2006-2007 School Year.
Lubbock
El Paso Odessa
Dallas
Corpus Christi
Austin Beaumont
Yoakum San Antonio
Tyler
5
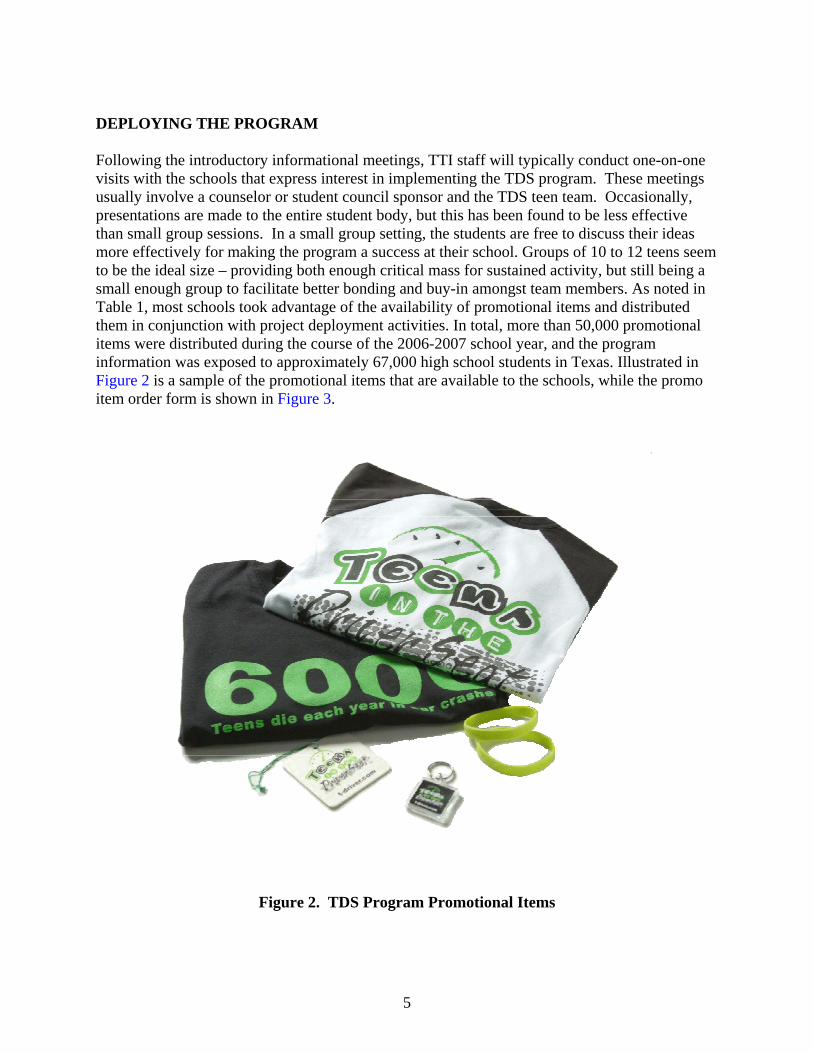
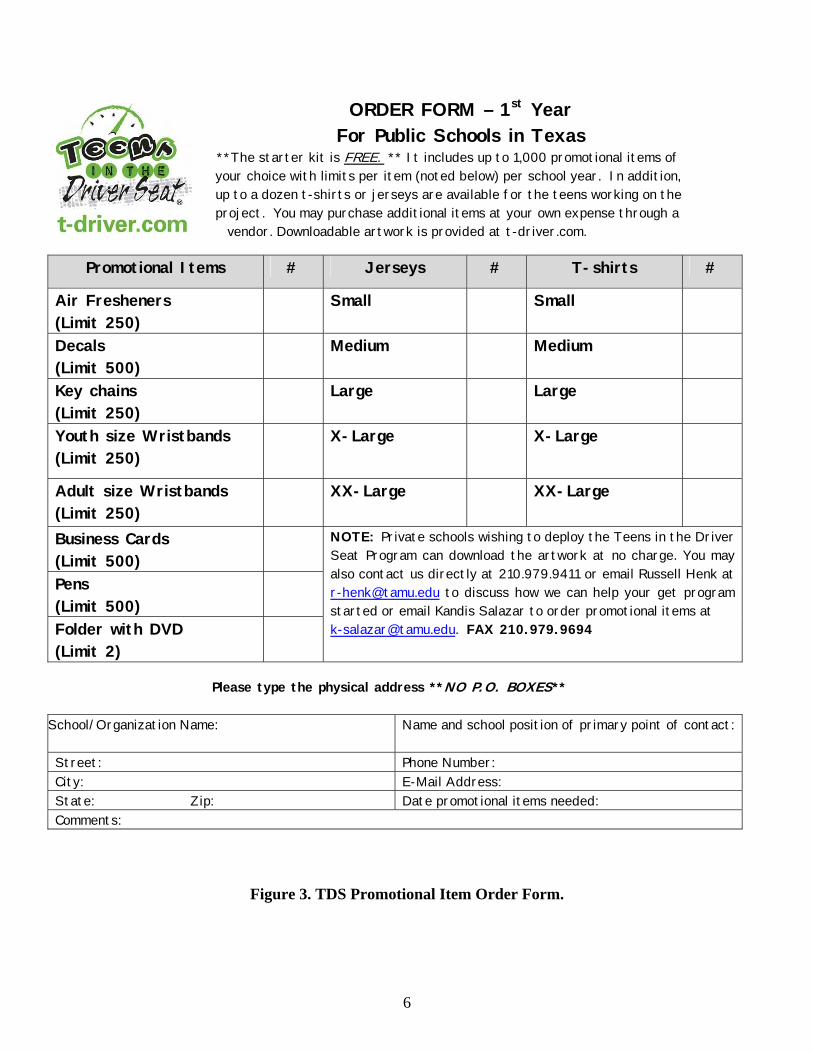
DEPLOYING THE PROGRAM Following the introductory informational meetings, TTI staff will typically conduct one-on-one visits with the schools that express interest in implementing the TDS program. These meetings usually involve a counselor or student council sponsor and the TDS teen team. Occasionally, presentations are made to the entire student body, but this has been found to be less effective than small group sessions. In a small group setting, the students are free to discuss their ideas more effectively for making the program a success at their school. Groups of 10 to 12 teens seem to be the ideal size – providing both enough critical mass for sustained activity, but still being a small enough group to facilitate better bonding and buy-in amongst team members. As noted in Table 1, most schools took advantage of the availability of promotional items and distributed them in conjunction with project deployment activities. In total, more than 50,000 promotional items were distributed during the course of the 2006-2007 school year, and the program information was exposed to approximately 67,000 high school students in Texas. Illustrated in Figure 2 is a sample of the promotional items that are available to the schools, while the promo item order form is shown in Figure 3.
Figure 2. TDS Program Promotional Items
6
ORDER FORM – 1st Year For Public Schools in Texas
**The starter kit is FREE. ** It includes up to 1,000 promotional items of your choice with limits per item (noted below) per school year. In addition, up to a dozen t-shirts or jerseys are available for the teens working on the project. You may purchase additional items at your own expense through a vendor. Downloadable artwork is provided at t-driver.com.
Promotional Items # Jerseys # T-shirts #
Air Fresheners (Limit 250)
Small Small
Decals (Limit 500)
Medium Medium
Key chains (Limit 250)
Large Large
Youth size Wristbands (Limit 250)
X-Large X-Large
Adult size Wristbands (Limit 250)
XX-Large XX-Large
Business Cards (Limit 500)
Pens (Limit 500)
Folder with DVD (Limit 2)
NOTE: Private schools wishing to deploy the Teens in the Driver Seat Program can download the artwork at no charge. You may also contact us directly at 210.979.9411 or email Russell Henk at [email protected] to discuss how we can help your get program started or email Kandis Salazar to order promotional items at [email protected]. FAX 210.979.9694
Please type the physical address **NO P.O. BOXES**
School/Organization Name:
Name and school position of primary point of contact:
Street: Phone Number: City: E-Mail Address: State: Zip: Date promotional items needed: Comments:
Figure 3. TDS Promotional Item Order Form.
7
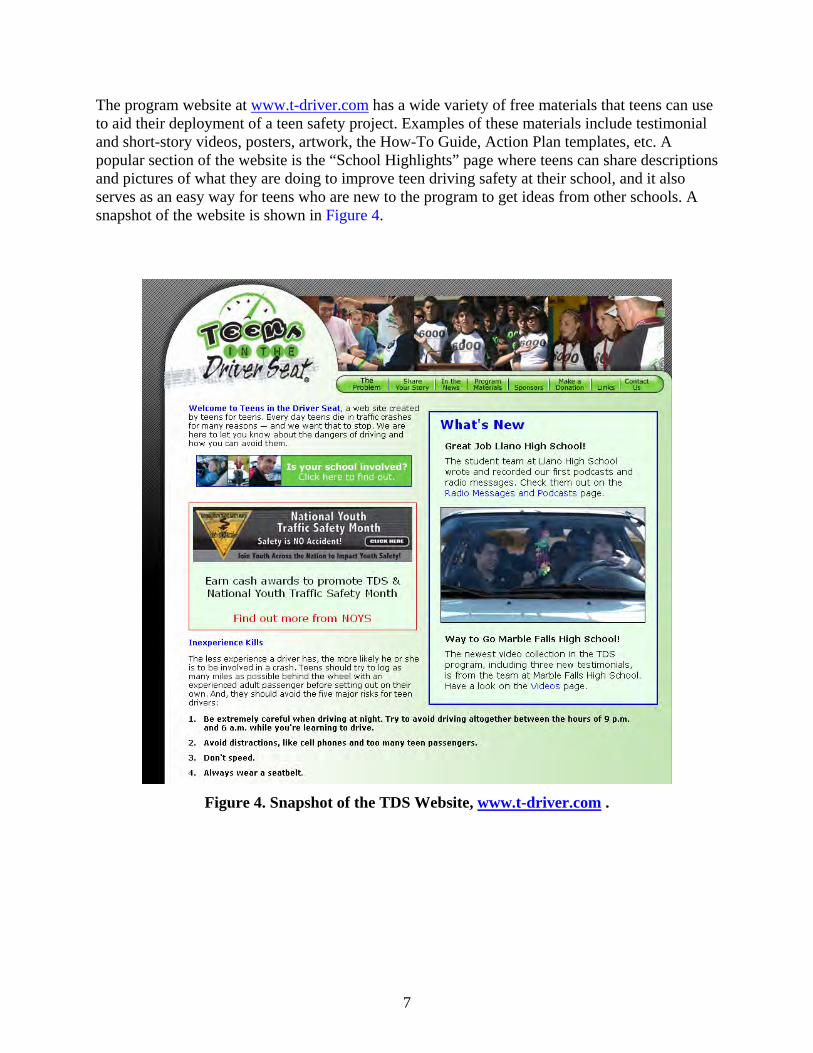
The program website at www.t-driver.com has a wide variety of free materials that teens can use to aid their deployment of a teen safety project. Examples of these materials include testimonial and short-story videos, posters, artwork, the How-To Guide, Action Plan templates, etc. A popular section of the website is the “School Highlights” page where teens can share descriptions and pictures of what they are doing to improve teen driving safety at their school, and it also serves as an easy way for teens who are new to the program to get ideas from other schools. A snapshot of the website is shown in Figure 4.
Figure 4. Snapshot of the TDS Website, www.t-driver.com .

9
CHAPTER 2. ASSESSMENTS OF THE TDS PROGRAM
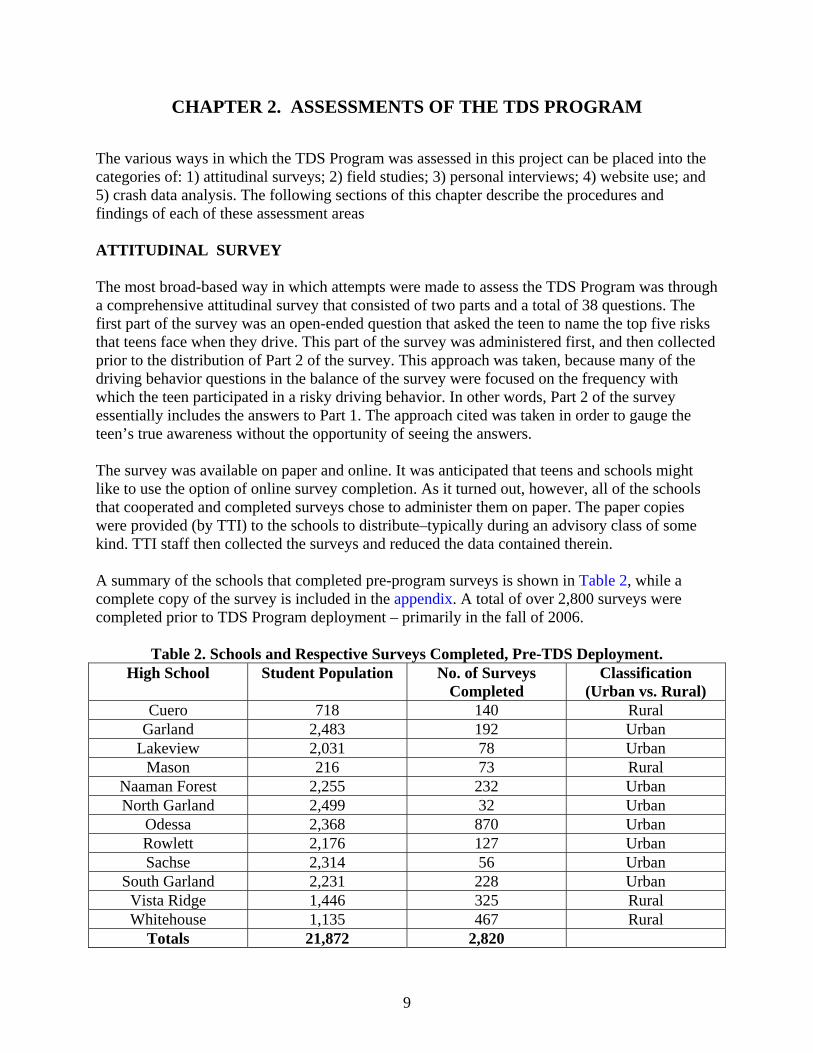
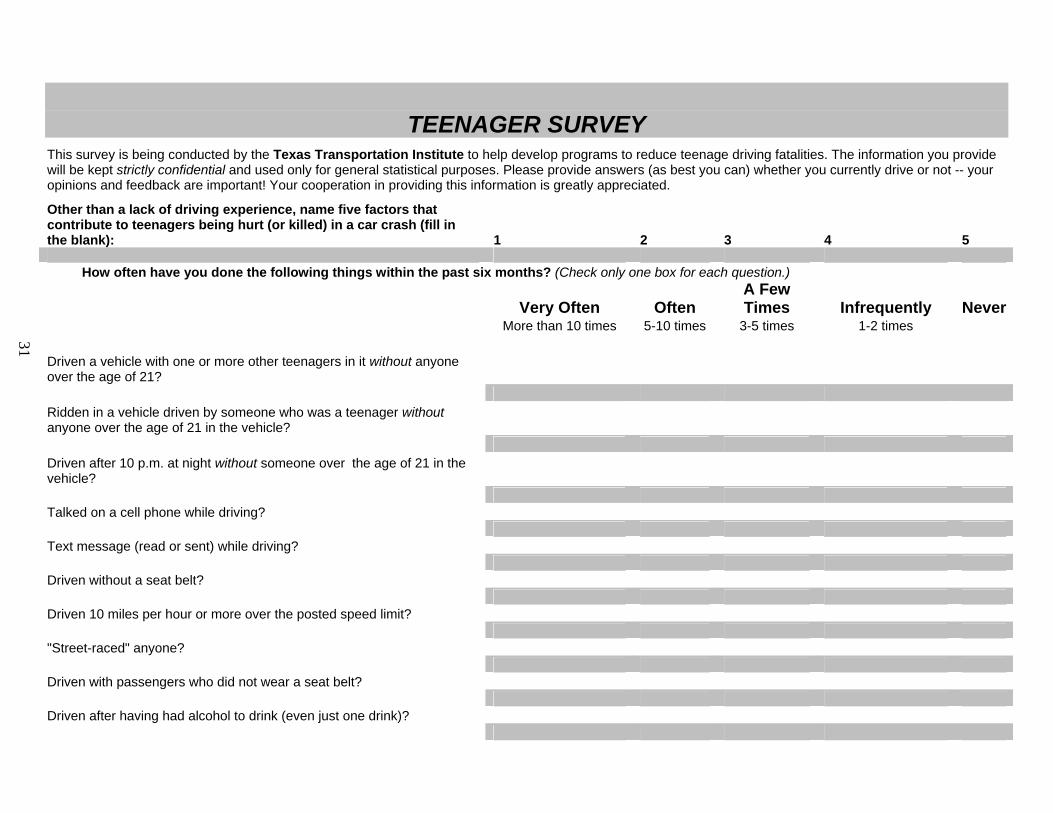
The various ways in which the TDS Program was assessed in this project can be placed into the categories of: 1) attitudinal surveys; 2) field studies; 3) personal interviews; 4) website use; and 5) crash data analysis. The following sections of this chapter describe the procedures and findings of each of these assessment areas ATTITUDINAL SURVEY The most broad-based way in which attempts were made to assess the TDS Program was through a comprehensive attitudinal survey that consisted of two parts and a total of 38 questions. The first part of the survey was an open-ended question that asked the teen to name the top five risks that teens face when they drive. This part of the survey was administered first, and then collected prior to the distribution of Part 2 of the survey. This approach was taken, because many of the driving behavior questions in the balance of the survey were focused on the frequency with which the teen participated in a risky driving behavior. In other words, Part 2 of the survey essentially includes the answers to Part 1. The approach cited was taken in order to gauge the teen’s true awareness without the opportunity of seeing the answers. The survey was available on paper and online. It was anticipated that teens and schools might like to use the option of online survey completion. As it turned out, however, all of the schools that cooperated and completed surveys chose to administer them on paper. The paper copies were provided (by TTI) to the schools to distribute–typically during an advisory class of some kind. TTI staff then collected the surveys and reduced the data contained therein. A summary of the schools that completed pre-program surveys is shown in Table 2, while a complete copy of the survey is included in the appendix. A total of over 2,800 surveys were completed prior to TDS Program deployment – primarily in the fall of 2006.
Table 2. Schools and Respective Surveys Completed, Pre-TDS Deployment. High School Student Population No. of Surveys
Completed Classification
(Urban vs. Rural) Cuero 718 140 Rural
Garland 2,483 192 Urban Lakeview 2,031 78 Urban
Mason 216 73 Rural Naaman Forest 2,255 232 Urban North Garland 2,499 32 Urban
Odessa 2,368 870 Urban Rowlett 2,176 127 Urban Sachse 2,314 56 Urban
South Garland 2,231 228 Urban Vista Ridge 1,446 325 Rural Whitehouse 1,135 467 Rural
Totals 21,872 2,820
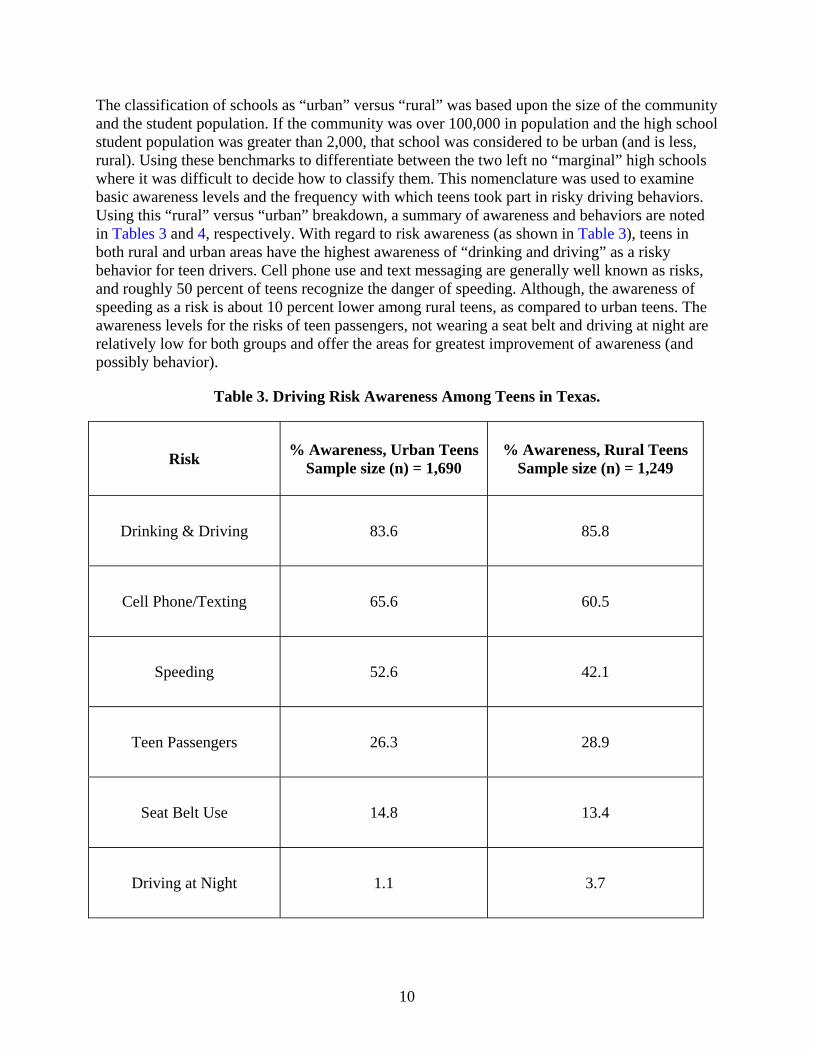
The classification of schools as “urban” versus “rural” was based upon the size of the community and the student population. If the community was over 100,000 in population and the high school student population was greater than 2,000, that school was considered to be urban (and is less, rural). Using these benchmarks to differentiate between the two left no “marginal” high schools where it was difficult to decide how to classify them. This nomenclature was used to examine basic awareness levels and the frequency with which teens took part in risky driving behaviors. Using this “rural” versus “urban” breakdown, a summary of awareness and behaviors are noted in Tables 3 and 4, respectively. With regard to risk awareness (as shown in Table 3), teens in both rural and urban areas have the highest awareness of “drinking and driving” as a risky behavior for teen drivers. Cell phone use and text messaging are generally well known as risks, and roughly 50 percent of teens recognize the danger of speeding. Although, the awareness of speeding as a risk is about 10 percent lower among rural teens, as compared to urban teens. The awareness levels for the risks of teen passengers, not wearing a seat belt and driving at night are relatively low for both groups and offer the areas for greatest improvement of awareness (and possibly behavior).
Table 3. Driving Risk Awareness Among Teens in Texas.
Risk
% Awareness, Urban Teens
Sample size (n) = 1,690
% Awareness, Rural Teens Sample size (n) = 1,249
Drinking & Driving 83.6 85.8
Cell Phone/Texting 65.6 60.5
Speeding 52.6 42.1
Teen Passengers 26.3 28.9
Seat Belt Use 14.8 13.4
Driving at Night 1.1 3.7
10
11
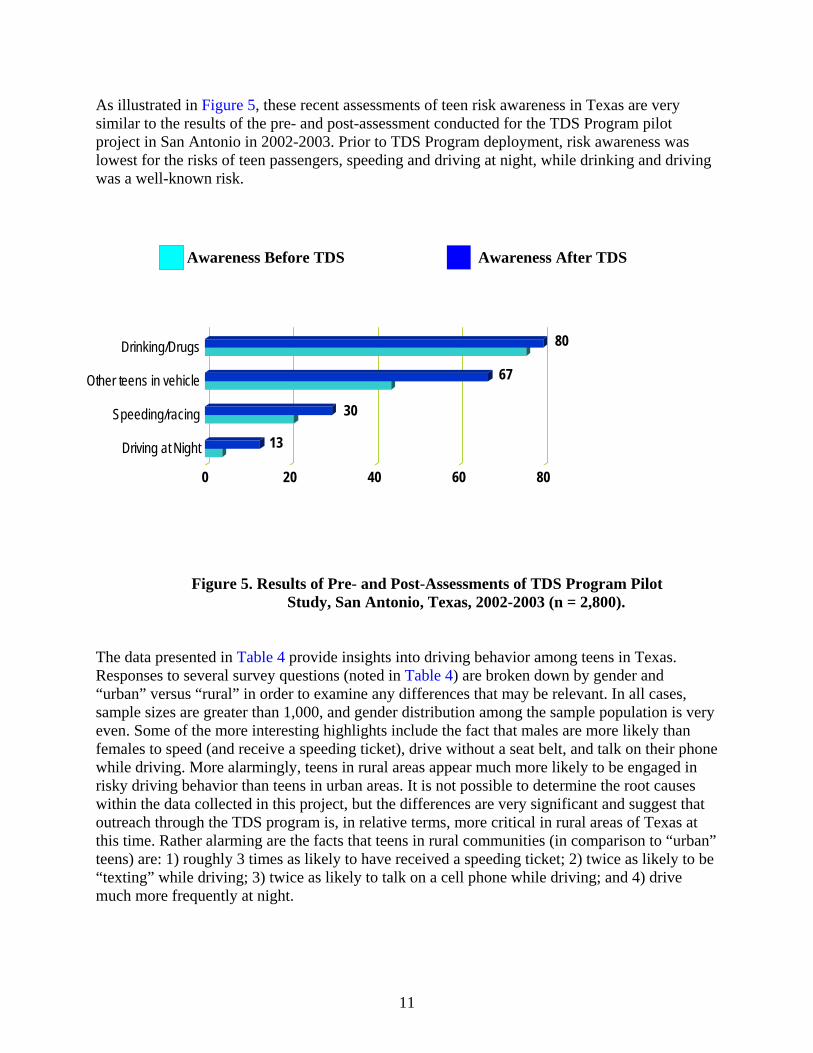
As illustrated in Figure 5, these recent assessments of teen risk awareness in Texas are very similar to the results of the pre- and post-assessment conducted for the TDS Program pilot project in San Antonio in 2002-2003. Prior to TDS Program deployment, risk awareness was lowest for the risks of teen passengers, speeding and driving at night, while drinking and driving was a well-known risk.
Awareness Before TDS Awareness After TDS
Figure 5. Results of Pre- and Post-Assessments of TDS Program Pilot Study, San Antonio, Texas, 2002-2003 (n = 2,800). The data presented in Table 4 provide insights into driving behavior among teens in Texas. Responses to several survey questions (noted in Table 4) are broken down by gender and “urban” versus “rural” in order to examine any differences that may be relevant. In all cases, sample sizes are greater than 1,000, and gender distribution among the sample population is very even. Some of the more interesting highlights include the fact that males are more likely than females to speed (and receive a speeding ticket), drive without a seat belt, and talk on their phone while driving. More alarmingly, teens in rural areas appear much more likely to be engaged in risky driving behavior than teens in urban areas. It is not possible to determine the root causes within the data collected in this project, but the differences are very significant and suggest that outreach through the TDS program is, in relative terms, more critical in rural areas of Texas at this time. Rather alarming are the facts that teens in rural communities (in comparison to “urban” teens) are: 1) roughly 3 times as likely to have received a speeding ticket; 2) twice as likely to be “texting” while driving; 3) twice as likely to talk on a cell phone while driving; and 4) drive much more frequently at night.
13
30
67
80
0 20 40 60 80
Driving at Night
Speeding/racing
Other teens in vehicle
Drinking/Drugs
12
Table 4. Summary of Driving Behavior Among Teens in Texas.
Question % Yes Male
(n=1,371)
% Yes Female
(n=1,386)
% Yes Urban
(n = 1,820)
% Yes Rural
(n = 1,005) Have you received a speeding ticket?
15.7 9.1 6.7 22.3
Do you “text” while driving?
24.9 23.1 16.9 36.0
Do you drive with no seat belt?
12.6 6.0 8.6 10.3
Do you talk on cell phone while driving?
39.0 32.3 25.9 52.0
Do you drink & drive?
6.9 4.0 5.5 5.5
Do you drive after 10 p.m.?
52.0 45.2 38.7 64.8
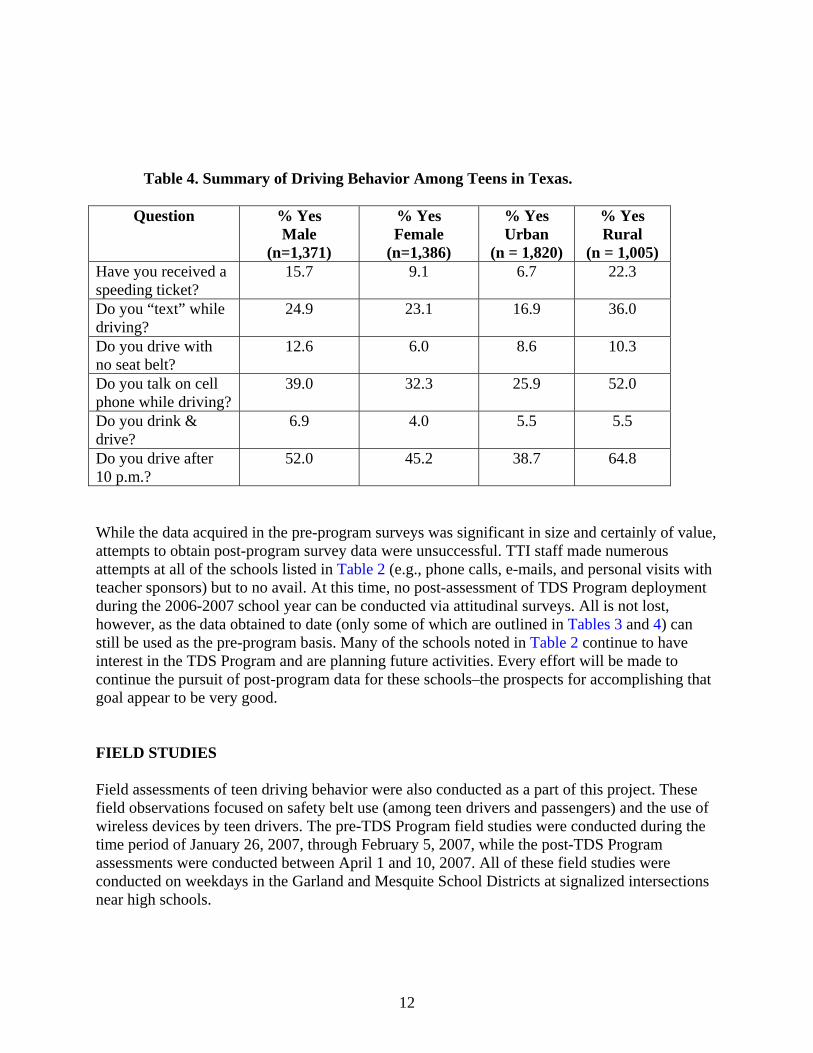
While the data acquired in the pre-program surveys was significant in size and certainly of value, attempts to obtain post-program survey data were unsuccessful. TTI staff made numerous attempts at all of the schools listed in Table 2 (e.g., phone calls, e-mails, and personal visits with teacher sponsors) but to no avail. At this time, no post-assessment of TDS Program deployment during the 2006-2007 school year can be conducted via attitudinal surveys. All is not lost, however, as the data obtained to date (only some of which are outlined in Tables 3 and 4) can still be used as the pre-program basis. Many of the schools noted in Table 2 continue to have interest in the TDS Program and are planning future activities. Every effort will be made to continue the pursuit of post-program data for these schools–the prospects for accomplishing that goal appear to be very good. FIELD STUDIES Field assessments of teen driving behavior were also conducted as a part of this project. These field observations focused on safety belt use (among teen drivers and passengers) and the use of wireless devices by teen drivers. The pre-TDS Program field studies were conducted during the time period of January 26, 2007, through February 5, 2007, while the post-TDS Program assessments were conducted between April 1 and 10, 2007. All of these field studies were conducted on weekdays in the Garland and Mesquite School Districts at signalized intersections near high schools.
13
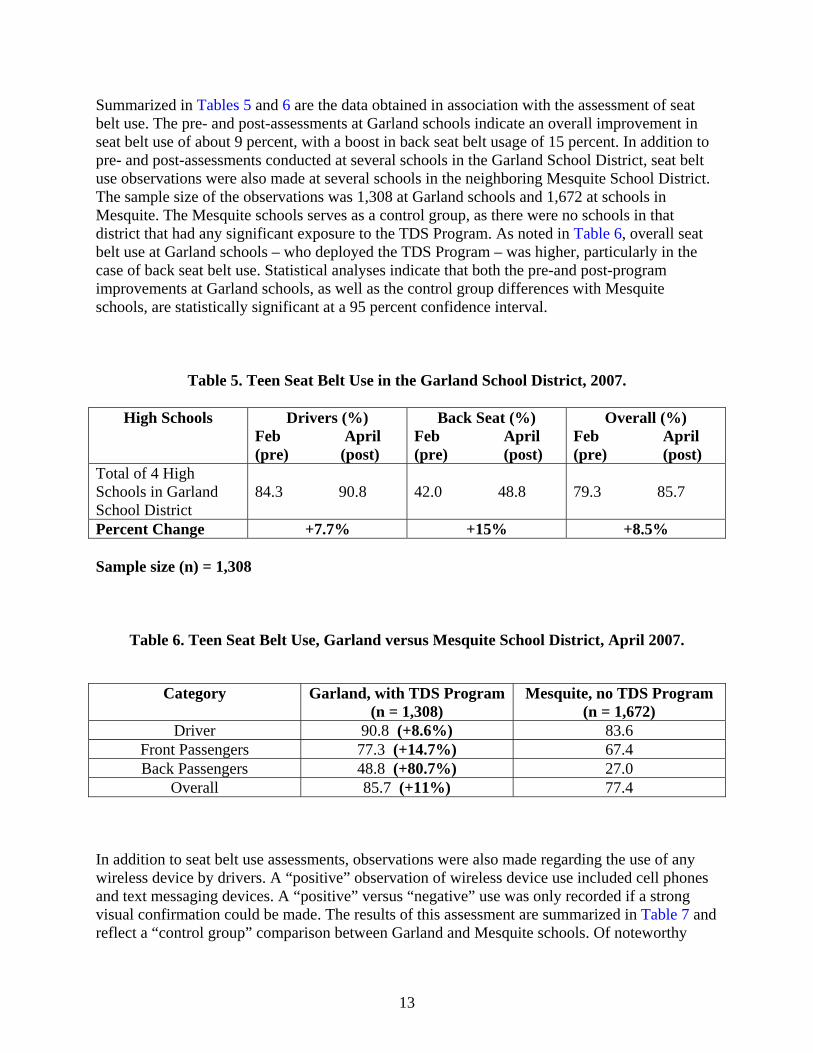
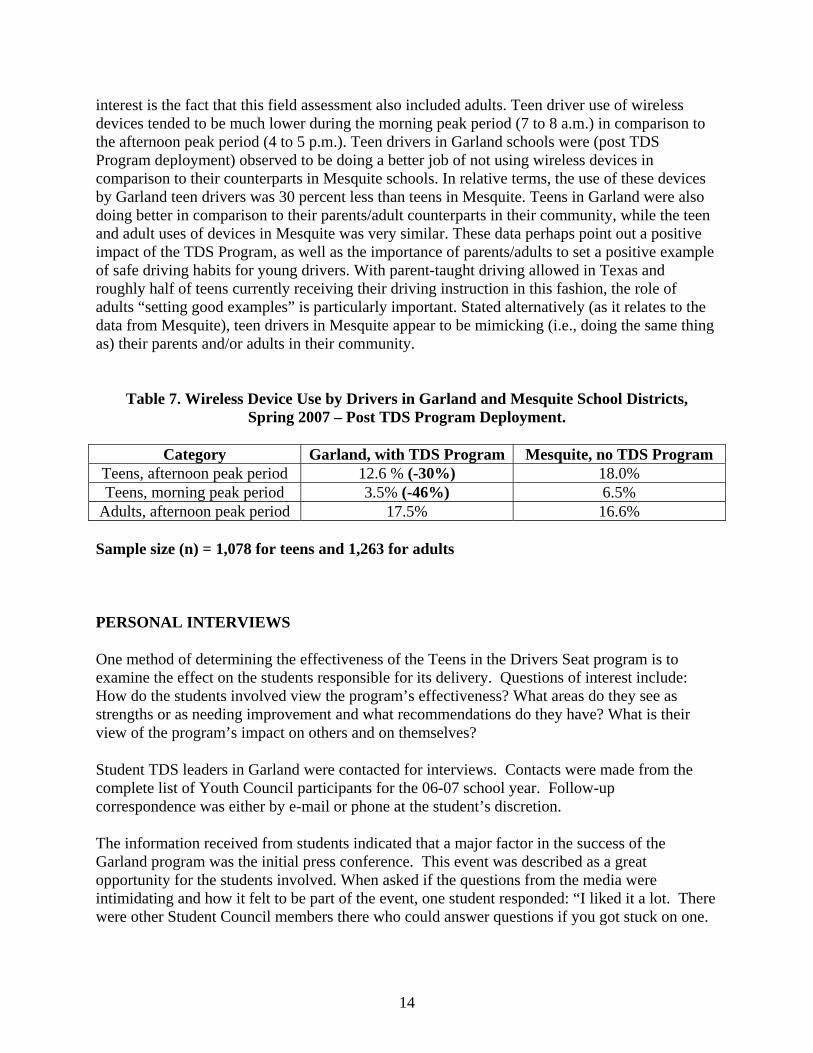
Summarized in Tables 5 and 6 are the data obtained in association with the assessment of seat belt use. The pre- and post-assessments at Garland schools indicate an overall improvement in seat belt use of about 9 percent, with a boost in back seat belt usage of 15 percent. In addition to pre- and post-assessments conducted at several schools in the Garland School District, seat belt use observations were also made at several schools in the neighboring Mesquite School District. The sample size of the observations was 1,308 at Garland schools and 1,672 at schools in Mesquite. The Mesquite schools serves as a control group, as there were no schools in that district that had any significant exposure to the TDS Program. As noted in Table 6, overall seat belt use at Garland schools – who deployed the TDS Program – was higher, particularly in the case of back seat belt use. Statistical analyses indicate that both the pre-and post-program improvements at Garland schools, as well as the control group differences with Mesquite schools, are statistically significant at a 95 percent confidence interval.
Table 5. Teen Seat Belt Use in the Garland School District, 2007.
High Schools Drivers (%) Feb April (pre) (post)
Back Seat (%) Feb April (pre) (post)
Overall (%) Feb April (pre) (post)
Total of 4 High Schools in Garland School District
84.3 90.8
42.0 48.8
79.3 85.7
Percent Change +7.7% +15% +8.5%
Sample size (n) = 1,308
Table 6. Teen Seat Belt Use, Garland versus Mesquite School District, April 2007.
Category Garland, with TDS Program(n = 1,308)
Mesquite, no TDS Program (n = 1,672)
Driver 90.8 (+8.6%) 83.6 Front Passengers 77.3 (+14.7%) 67.4 Back Passengers 48.8 (+80.7%) 27.0
Overall 85.7 (+11%) 77.4
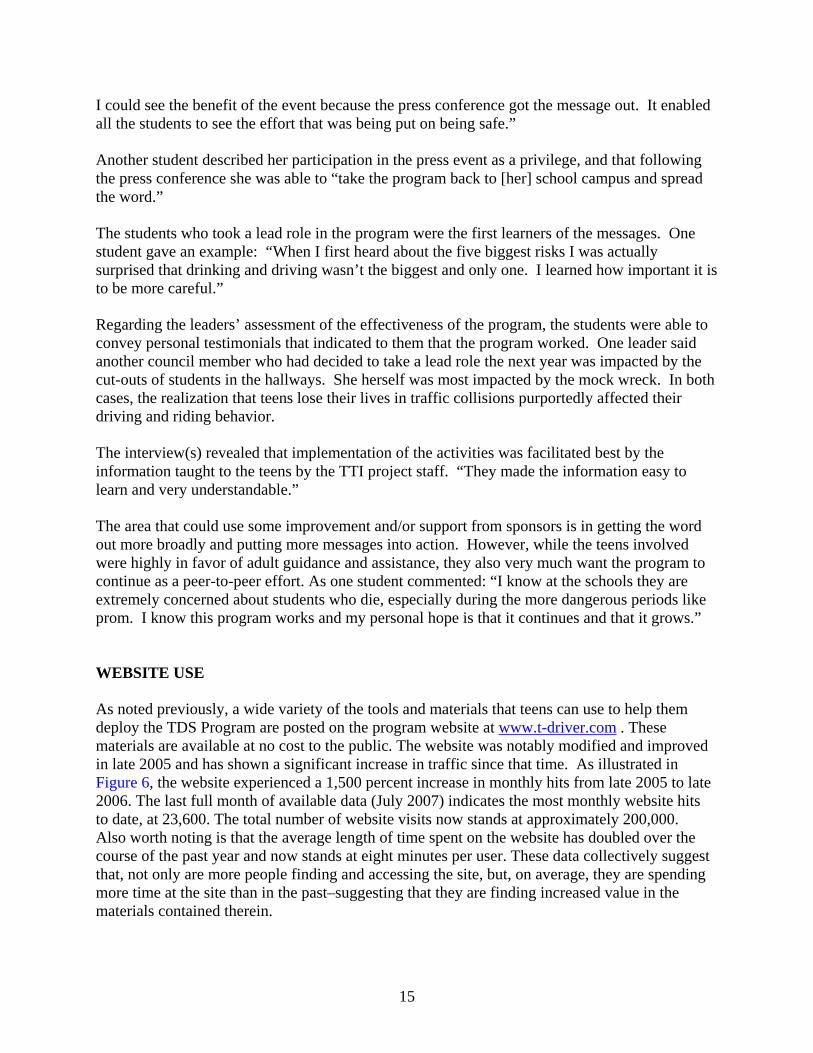
In addition to seat belt use assessments, observations were also made regarding the use of any wireless device by drivers. A “positive” observation of wireless device use included cell phones and text messaging devices. A “positive” versus “negative” use was only recorded if a strong visual confirmation could be made. The results of this assessment are summarized in Table 7 and reflect a “control group” comparison between Garland and Mesquite schools. Of noteworthy
14
interest is the fact that this field assessment also included adults. Teen driver use of wireless devices tended to be much lower during the morning peak period (7 to 8 a.m.) in comparison to the afternoon peak period (4 to 5 p.m.). Teen drivers in Garland schools were (post TDS Program deployment) observed to be doing a better job of not using wireless devices in comparison to their counterparts in Mesquite schools. In relative terms, the use of these devices by Garland teen drivers was 30 percent less than teens in Mesquite. Teens in Garland were also doing better in comparison to their parents/adult counterparts in their community, while the teen and adult uses of devices in Mesquite was very similar. These data perhaps point out a positive impact of the TDS Program, as well as the importance of parents/adults to set a positive example of safe driving habits for young drivers. With parent-taught driving allowed in Texas and roughly half of teens currently receiving their driving instruction in this fashion, the role of adults “setting good examples” is particularly important. Stated alternatively (as it relates to the data from Mesquite), teen drivers in Mesquite appear to be mimicking (i.e., doing the same thing as) their parents and/or adults in their community.
Table 7. Wireless Device Use by Drivers in Garland and Mesquite School Districts, Spring 2007 – Post TDS Program Deployment.
Category Garland, with TDS Program Mesquite, no TDS Program
Teens, afternoon peak period 12.6 % (-30%) 18.0% Teens, morning peak period 3.5% (-46%) 6.5%
Adults, afternoon peak period 17.5% 16.6%
Sample size (n) = 1,078 for teens and 1,263 for adults PERSONAL INTERVIEWS
One method of determining the effectiveness of the Teens in the Drivers Seat program is to examine the effect on the students responsible for its delivery. Questions of interest include: How do the students involved view the program’s effectiveness? What areas do they see as strengths or as needing improvement and what recommendations do they have? What is their view of the program’s impact on others and on themselves?
Student TDS leaders in Garland were contacted for interviews. Contacts were made from the complete list of Youth Council participants for the 06-07 school year. Follow-up correspondence was either by e-mail or phone at the student’s discretion.
The information received from students indicated that a major factor in the success of the Garland program was the initial press conference. This event was described as a great opportunity for the students involved. When asked if the questions from the media were intimidating and how it felt to be part of the event, one student responded: “I liked it a lot. There were other Student Council members there who could answer questions if you got stuck on one.
I could see the benefit of the event because the press conference got the message out. It enabled all the students to see the effort that was being put on being safe.”
Another student described her participation in the press event as a privilege, and that following the press conference she was able to “take the program back to [her] school campus and spread the word.”
The students who took a lead role in the program were the first learners of the messages. One student gave an example: “When I first heard about the five biggest risks I was actually surprised that drinking and driving wasn’t the biggest and only one. I learned how important it is to be more careful.”
Regarding the leaders’ assessment of the effectiveness of the program, the students were able to convey personal testimonials that indicated to them that the program worked. One leader said another council member who had decided to take a lead role the next year was impacted by the cut-outs of students in the hallways. She herself was most impacted by the mock wreck. In both cases, the realization that teens lose their lives in traffic collisions purportedly affected their driving and riding behavior.
The interview(s) revealed that implementation of the activities was facilitated best by the information taught to the teens by the TTI project staff. “They made the information easy to learn and very understandable.”
The area that could use some improvement and/or support from sponsors is in getting the word out more broadly and putting more messages into action. However, while the teens involved were highly in favor of adult guidance and assistance, they also very much want the program to continue as a peer-to-peer effort. As one student commented: “I know at the schools they are extremely concerned about students who die, especially during the more dangerous periods like prom. I know this program works and my personal hope is that it continues and that it grows.”
WEBSITE USE
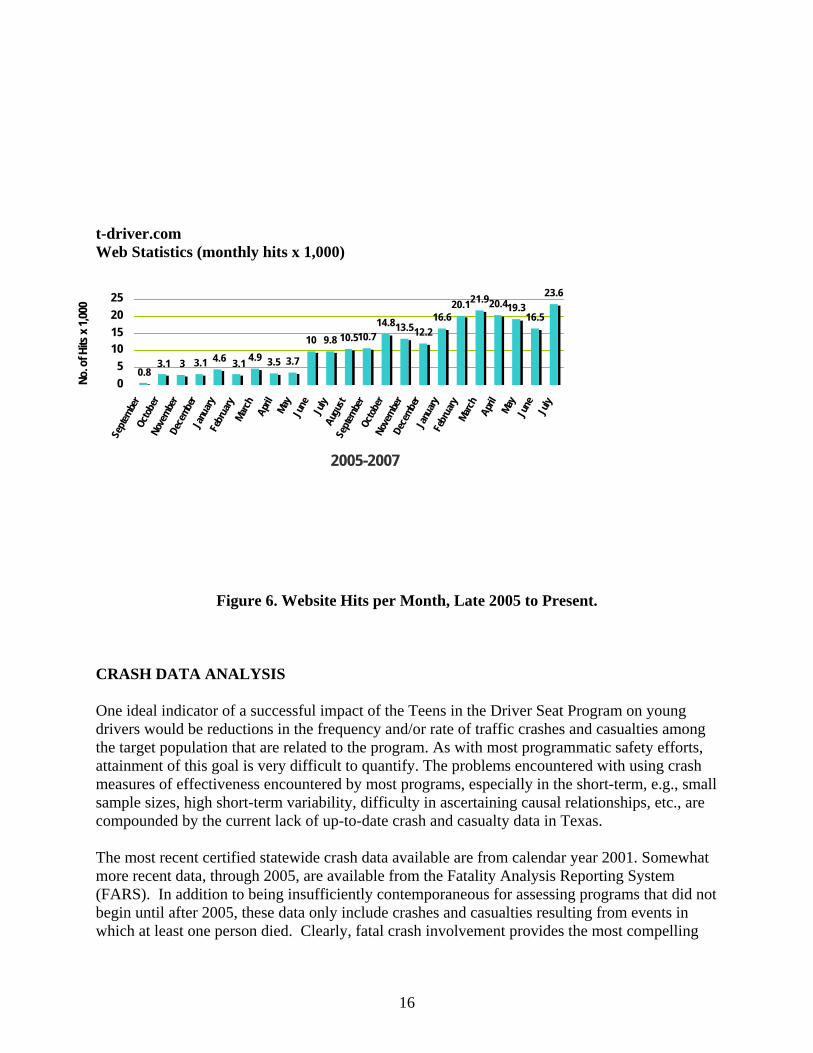
As noted previously, a wide variety of the tools and materials that teens can use to help them deploy the TDS Program are posted on the program website at www.t-driver.com . These materials are available at no cost to the public. The website was notably modified and improved in late 2005 and has shown a significant increase in traffic since that time. As illustrated in Figure 6, the website experienced a 1,500 percent increase in monthly hits from late 2005 to late 2006. The last full month of available data (July 2007) indicates the most monthly website hits to date, at 23,600. The total number of website visits now stands at approximately 200,000. Also worth noting is that the average length of time spent on the website has doubled over the course of the past year and now stands at eight minutes per user. These data collectively suggest that, not only are more people finding and accessing the site, but, on average, they are spending more time at the site than in the past–suggesting that they are finding increased value in the materials contained therein.
15
16
t-driver.com Web Statistics (monthly hits x 1,000)
Figure 6. Website Hits per Month, Late 2005 to Present. CRASH DATA ANALYSIS One ideal indicator of a successful impact of the Teens in the Driver Seat Program on young drivers would be reductions in the frequency and/or rate of traffic crashes and casualties among the target population that are related to the program. As with most programmatic safety efforts, attainment of this goal is very difficult to quantify. The problems encountered with using crash measures of effectiveness encountered by most programs, especially in the short-term, e.g., small sample sizes, high short-term variability, difficulty in ascertaining causal relationships, etc., are compounded by the current lack of up-to-date crash and casualty data in Texas. The most recent certified statewide crash data available are from calendar year 2001. Somewhat more recent data, through 2005, are available from the Fatality Analysis Reporting System (FARS). In addition to being insufficiently contemporaneous for assessing programs that did not begin until after 2005, these data only include crashes and casualties resulting from events in which at least one person died. Clearly, fatal crash involvement provides the most compelling
4.9 3.5 3.7
10 9.8 10.510.714.813.512.2
16.620.121.920.419.3
16.5
23.6
3 3.1 4.6 3.13.10.8
05
10152025
Septe
mber
Octob
erNo
vembe
rDe
cemb
erJa
nuary
Febr
uary
March April
May
June July
Augu
stSe
ptembe
rOc
tober
Nove
mber
Dece
mber
Janu
aryFe
brua
ryMa
rch April
May
June July
2005-2007
No. o
f Hits
x 1,0
00
17
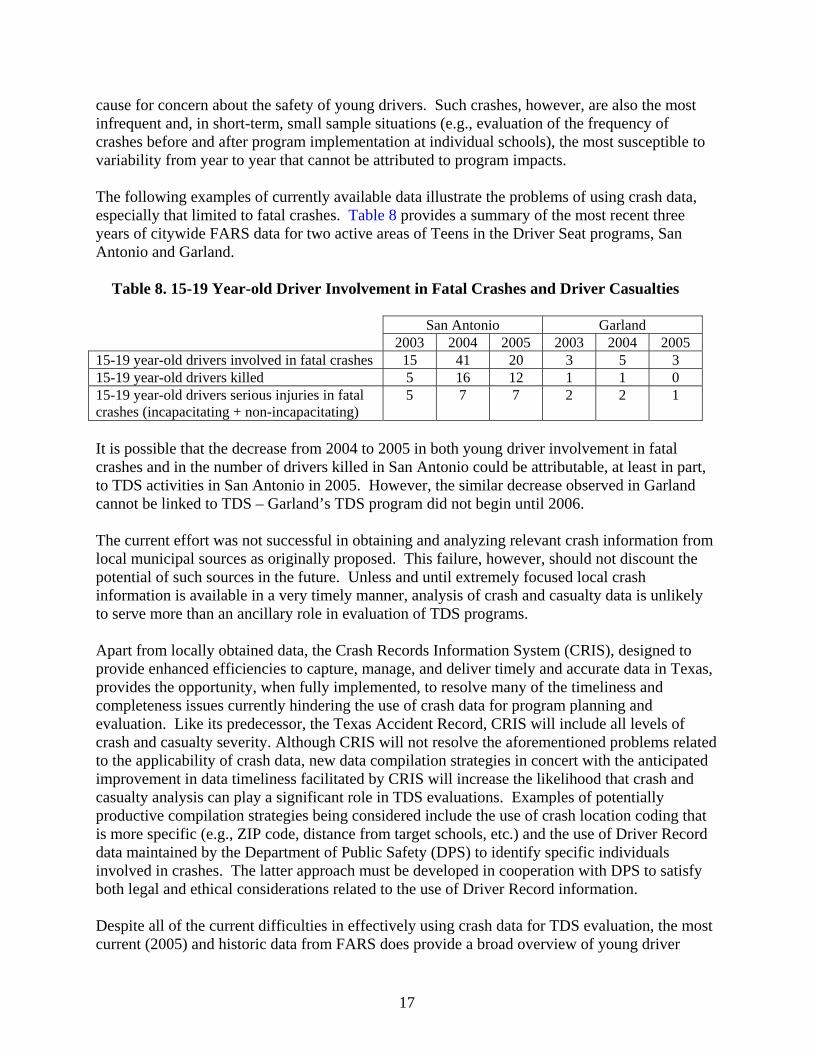
cause for concern about the safety of young drivers. Such crashes, however, are also the most infrequent and, in short-term, small sample situations (e.g., evaluation of the frequency of crashes before and after program implementation at individual schools), the most susceptible to variability from year to year that cannot be attributed to program impacts. The following examples of currently available data illustrate the problems of using crash data, especially that limited to fatal crashes. Table 8 provides a summary of the most recent three years of citywide FARS data for two active areas of Teens in the Driver Seat programs, San Antonio and Garland.
Table 8. 15-19 Year-old Driver Involvement in Fatal Crashes and Driver Casualties
San Antonio Garland 2003 2004 2005 2003 2004 2005 15-19 year-old drivers involved in fatal crashes 15 41 20 3 5 3 15-19 year-old drivers killed 5 16 12 1 1 0 15-19 year-old drivers serious injuries in fatal crashes (incapacitating + non-incapacitating)
5 7 7 2 2 1
It is possible that the decrease from 2004 to 2005 in both young driver involvement in fatal crashes and in the number of drivers killed in San Antonio could be attributable, at least in part, to TDS activities in San Antonio in 2005. However, the similar decrease observed in Garland cannot be linked to TDS – Garland’s TDS program did not begin until 2006. The current effort was not successful in obtaining and analyzing relevant crash information from local municipal sources as originally proposed. This failure, however, should not discount the potential of such sources in the future. Unless and until extremely focused local crash information is available in a very timely manner, analysis of crash and casualty data is unlikely to serve more than an ancillary role in evaluation of TDS programs. Apart from locally obtained data, the Crash Records Information System (CRIS), designed to provide enhanced efficiencies to capture, manage, and deliver timely and accurate data in Texas, provides the opportunity, when fully implemented, to resolve many of the timeliness and completeness issues currently hindering the use of crash data for program planning and evaluation. Like its predecessor, the Texas Accident Record, CRIS will include all levels of crash and casualty severity. Although CRIS will not resolve the aforementioned problems related to the applicability of crash data, new data compilation strategies in concert with the anticipated improvement in data timeliness facilitated by CRIS will increase the likelihood that crash and casualty analysis can play a significant role in TDS evaluations. Examples of potentially productive compilation strategies being considered include the use of crash location coding that is more specific (e.g., ZIP code, distance from target schools, etc.) and the use of Driver Record data maintained by the Department of Public Safety (DPS) to identify specific individuals involved in crashes. The latter approach must be developed in cooperation with DPS to satisfy both legal and ethical considerations related to the use of Driver Record information. Despite all of the current difficulties in effectively using crash data for TDS evaluation, the most current (2005) and historic data from FARS does provide a broad overview of young driver
18
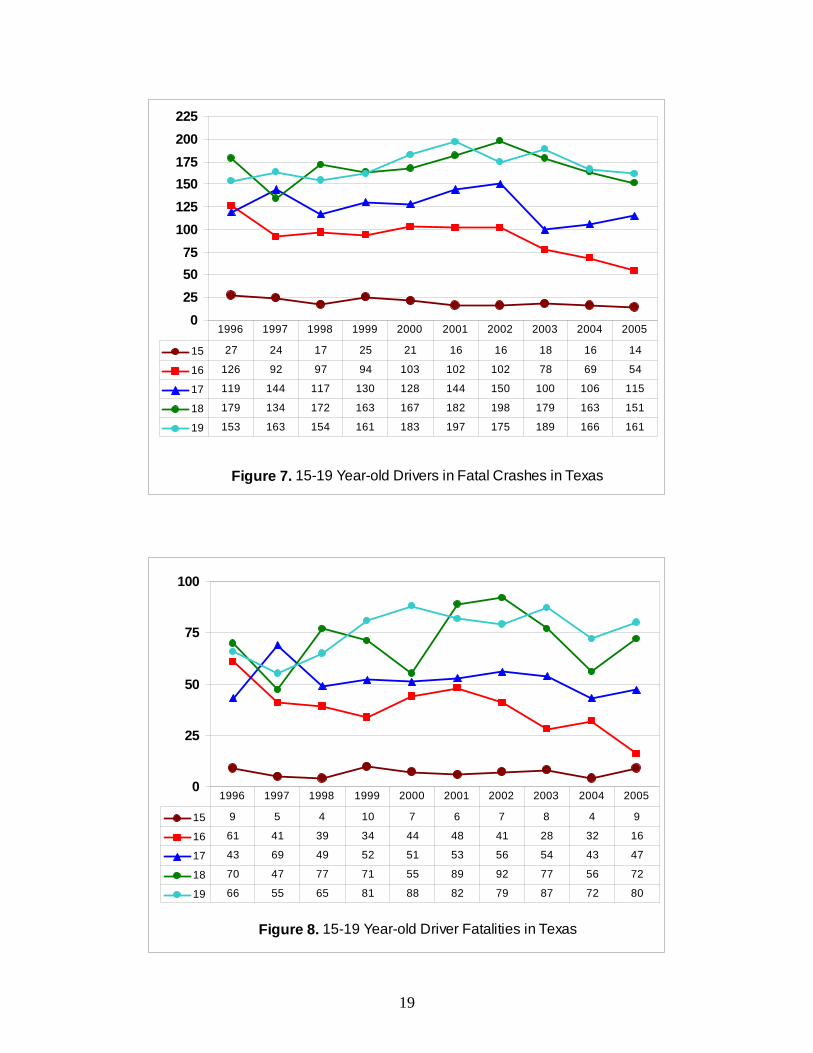
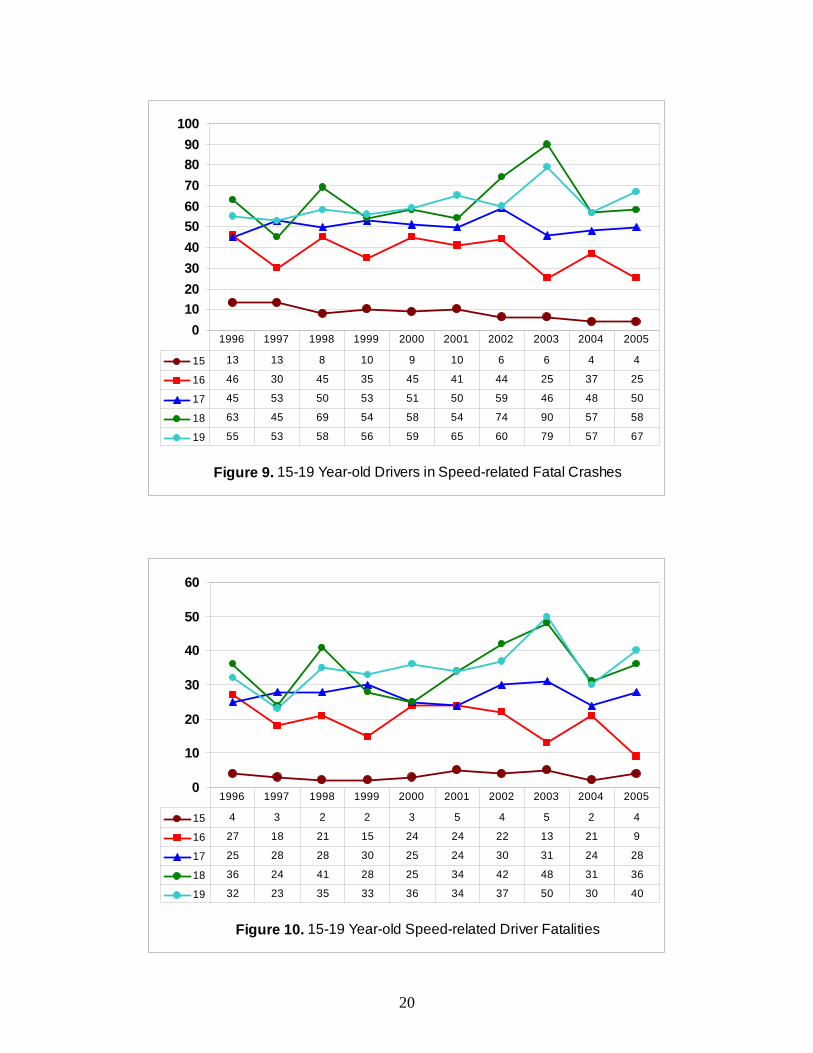
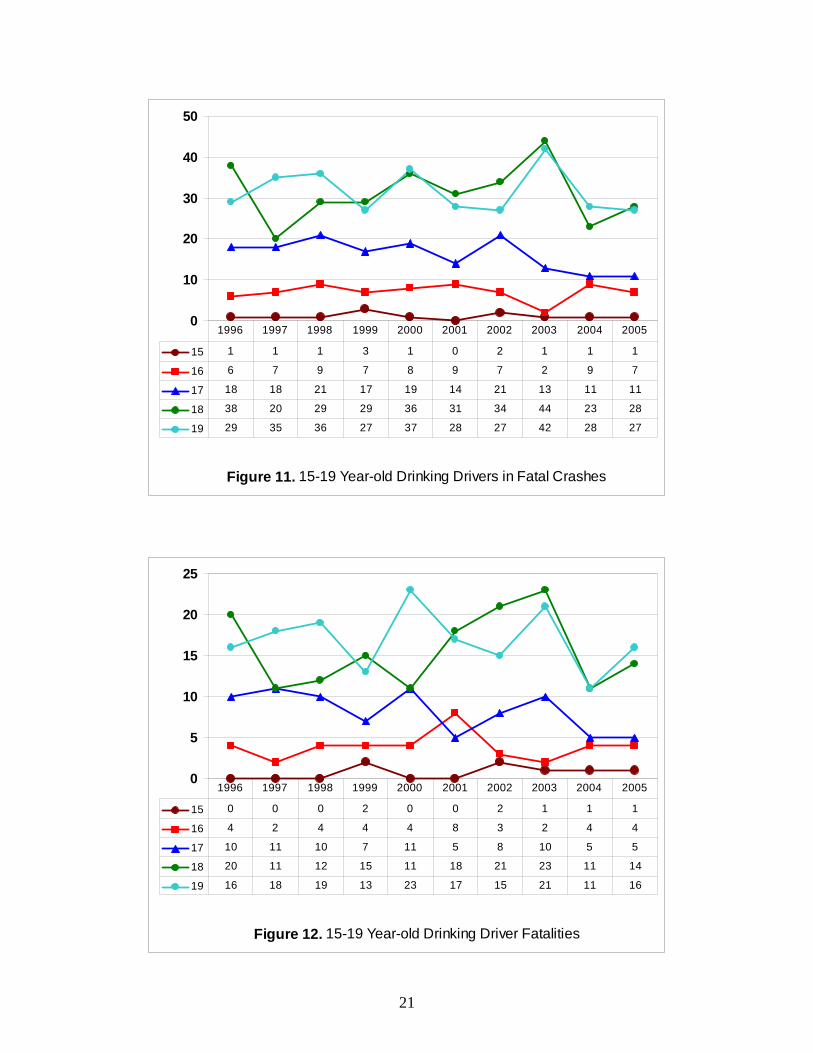
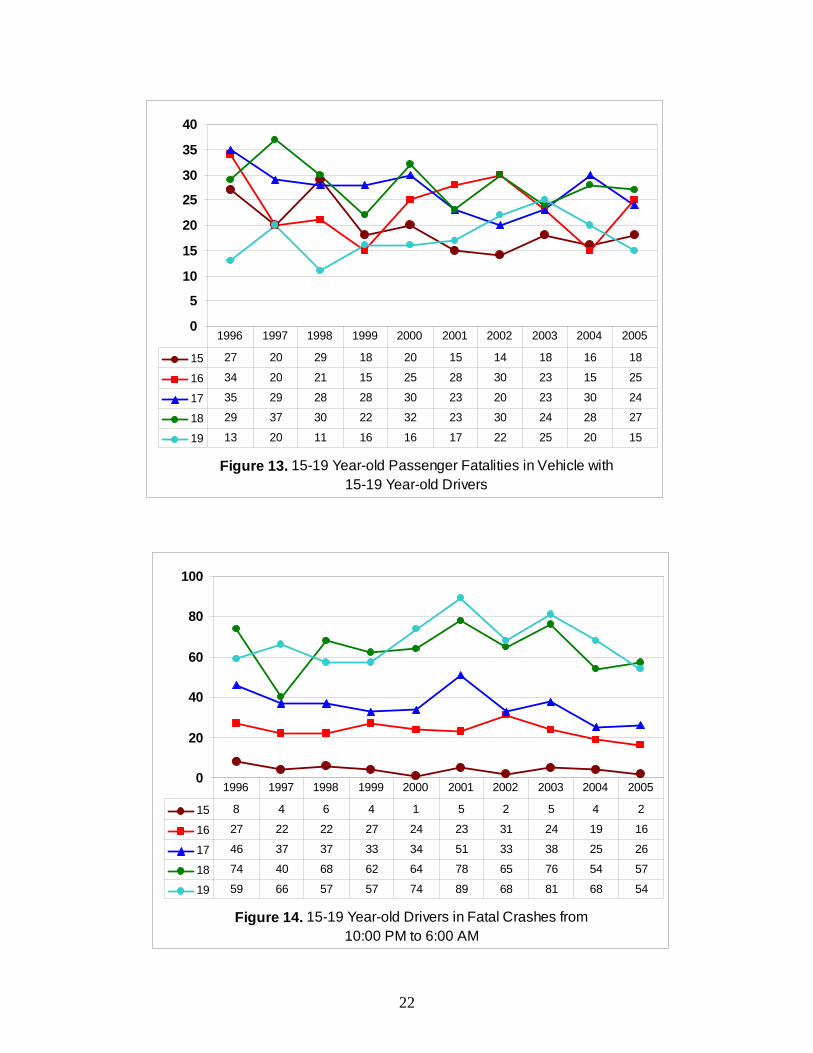
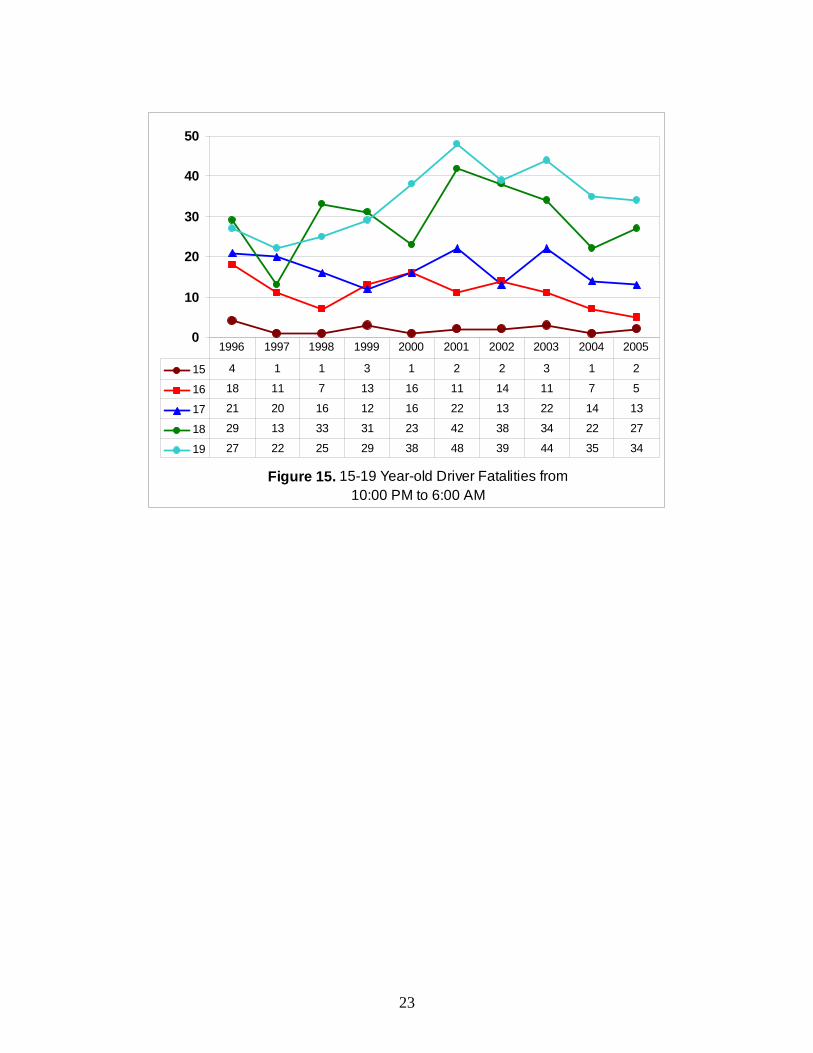
problems in Texas. Figures 7 through 15 provide a selective overview of the fatal crash involvement in Texas among the 15-19 year-old cohort that closely mirrors the target population of Teens in the Driver Seat programs. In addition to all fatal crash involvement among this age group over a 10-year period, data are shown relevant to crashes and casualties associated with several of the issues stressed in TDS programs, notably, speed, alcohol, young passengers with young drivers, and nighttime driving.
19
Figure 7. 15-19 Year-old Drivers in Fatal Crashes in Texas
0255075
100125150175200225
15 27 24 17 25 21 16 16 18 16 14
16 126 92 97 94 103 102 102 78 69 54
17 119 144 117 130 128 144 150 100 106 115
18 179 134 172 163 167 182 198 179 163 151
19 153 163 154 161 183 197 175 189 166 161
1996 1997 1998 1999 2000 2001 2002 2003 2004 2005
Figure 8. 15-19 Year-old Driver Fatalities in Texas
0
25
50
75
100
15 9 5 4 10 7 6 7 8 4 9
16 61 41 39 34 44 48 41 28 32 16
17 43 69 49 52 51 53 56 54 43 47
18 70 47 77 71 55 89 92 77 56 72
19 66 55 65 81 88 82 79 87 72 80
1996 1997 1998 1999 2000 2001 2002 2003 2004 2005
20
Figure 10. 15-19 Year-old Speed-related Driver Fatalities
0
10
20
30
40
50
60
15 4 3 2 2 3 5 4 5 2 4
16 27 18 21 15 24 24 22 13 21 9
17 25 28 28 30 25 24 30 31 24 28
18 36 24 41 28 25 34 42 48 31 36
19 32 23 35 33 36 34 37 50 30 40
1996 1997 1998 1999 2000 2001 2002 2003 2004 2005
Figure 9. 15-19 Year-old Drivers in Speed-related Fatal Crashes
0102030405060708090
100
15 13 13 8 10 9 10 6 6 4 4
16 46 30 45 35 45 41 44 25 37 25
17 45 53 50 53 51 50 59 46 48 50
18 63 45 69 54 58 54 74 90 57 58
19 55 53 58 56 59 65 60 79 57 67
1996 1997 1998 1999 2000 2001 2002 2003 2004 2005
21
Figure 11. 15-19 Year-old Drinking Drivers in Fatal Crashes
0
10
20
30
40
50
15 1 1 1 3 1 0 2 1 1 1
16 6 7 9 7 8 9 7 2 9 7
17 18 18 21 17 19 14 21 13 11 11
18 38 20 29 29 36 31 34 44 23 28
19 29 35 36 27 37 28 27 42 28 27
1996 1997 1998 1999 2000 2001 2002 2003 2004 2005
Figure 12. 15-19 Year-old Drinking Driver Fatalities
0
5
10
15
20
25
15 0 0 0 2 0 0 2 1 1 1
16 4 2 4 4 4 8 3 2 4 4
17 10 11 10 7 11 5 8 10 5 5
18 20 11 12 15 11 18 21 23 11 14
19 16 18 19 13 23 17 15 21 11 16
1996 1997 1998 1999 2000 2001 2002 2003 2004 2005
22
Figure 13. 15-19 Year-old Passenger Fatalities in Vehicle with 15-19 Year-old Drivers
0
5
10
15
20
25
30
35
40
15 27 20 29 18 20 15 14 18 16 18
16 34 20 21 15 25 28 30 23 15 25
17 35 29 28 28 30 23 20 23 30 24
18 29 37 30 22 32 23 30 24 28 27
19 13 20 11 16 16 17 22 25 20 15
1996 1997 1998 1999 2000 2001 2002 2003 2004 2005
Figure 14. 15-19 Year-old Drivers in Fatal Crashes from 10:00 PM to 6:00 AM
0
20
40
60
80
100
15 8 4 6 4 1 5 2 5 4 2
16 27 22 22 27 24 23 31 24 19 16
17 46 37 37 33 34 51 33 38 25 26
18 74 40 68 62 64 78 65 76 54 57
19 59 66 57 57 74 89 68 81 68 54
1996 1997 1998 1999 2000 2001 2002 2003 2004 2005
23
Figure 15. 15-19 Year-old Driver Fatalities from 10:00 PM to 6:00 AM
0
10
20
30
40
50
15 4 1 1 3 1 2 2 3 1 2
16 18 11 7 13 16 11 14 11 7 5
17 21 20 16 12 16 22 13 22 14 13
18 29 13 33 31 23 42 38 34 22 27
19 27 22 25 29 38 48 39 44 35 34
1996 1997 1998 1999 2000 2001 2002 2003 2004 2005

25
CHAPTER 3. CONCLUSIONS AND RECOMMENDATIONS
While the lack of available crash data prevents a clear answer to the most common question: “Does the Teens in the Driver Seat Program save lives?”, there is considerable evidence that the program is having a positive influence, namely by improving awareness of the top risks faced by teen drivers, improving their driving behavior, and that the program is becoming increasingly popular among teens. Data gathered to date indicates that teens involved in the TDS Program: 1) have improved levels of awareness (40 to 200+ percent) related to the top risks faced by teen drivers; 2) exhibit higher seat belt usage rates (+11 percent overall); and 3) exhibit lower usage of wireless devices while driving (30 percent less). With an increase in website traffic of over 1,500 percent in the past 18 months, a current average of 20,000+ website hits per month, and positive post-program interview feedback from teens involved in the initiative, the program also shows clear evidence of increasing popularity and use. The data gathered through the course of these recent evaluations point out some important facts about the program’s most effective near-term focus in future development and deployment. These data indicate that males are more likely to take part in some risky driving behaviors (e.g., speeding and lower seat belt usage rates) than females, and that teens living in rural areas have much higher exposure rates to the greatest risks facing teen drivers. With “rural” teens being three times more likely to speed, twice as likely to talk on their cell phone or “text” while driving, and driving at night much more frequently than “urban” teens, outreach to teens in rural areas and future TDS Program materials should be adjusted accordingly.

27
REFERENCES
Allen, J.P., Porter, M.R., McFarland, C.F., Marsh, P.A. and McElahny, K.B. (2005). The Two Faces of Adolescent’s Success with Peers: Adolescent Popularity, Social Adaptation, and Deviant Behavior. Child Development, 76, 747-760. Baker, S.B., Chen, L.H., and Guohua, L. (2007). Nationwide Review of Graduated Driver Licensing. Carskadon, M.A., Mindell, J.A., and Drake, C. (2006). National Sleep Foundation, 2006 Sleep inAmerica Poll-Teens. Center for Injury Research and Prevention at the Children’s Hospital of Philadelphia, and State Farm. (2007). Driving: Through the Eyes of Teens. Gregersen, N.P. (1996). Young Car Drivers: Why Are They Over-Represented in Car Accidents? Swedish National Road Institute. Lerner, R.M. and Steinberg, L. (2004). Handbook of Adolescent Psychology. National Academies. (2007). Preventing Teen Motor Crashes. Contributions from the Behavioral and Social Sciences: Workshop Report. National Research Council and Institute of Medicine. (2006). A Study of Interactions: Emerging Issues in the Science of Adolescence, Workshop Summary. Pack, A.I., Pack, A.M., Rodgman, E,. Cucchiaria, A., Dinges, D.F., and Schwab, C.W. (1995). Characteristics of Crashes Attributed to the Driver Having Fallen Asleep. Pezoldt, V.J., Womack, K.N., and Morris, D.E. (2007, April) Parent-taught driver education in Texas: A comparative evaluation. Final Report to the National Highway Traffic Safety Administration, DOT Contract No. DTNH22-02-D-85121, Task Order 2. (DOT Report No. DOT HS 810 760). Washington, D.C.: National Highway Traffic Safety Administration. Williams, A.F. (2006). Young Driver Risk Factors: Successful and Unsuccessful Approaches to Dealing with Them and an Agenda for the Future.

29
APPENDIX:
ATTITUDINAL SURVEYS

31
TTEEEENNAAGGEERR SSUURRVVEEYY This survey is being conducted by the Texas Transportation Institute to help develop programs to reduce teenage driving fatalities. The information you provide will be kept strictly confidential and used only for general statistical purposes. Please provide answers (as best you can) whether you currently drive or not -- your opinions and feedback are important! Your cooperation in providing this information is greatly appreciated.
Other than a lack of driving experience, name five factors that contribute to teenagers being hurt (or killed) in a car crash (fill in the blank): 1 2 3 4 5
How often have you done the following things within the past six months? (Check only one box for each question.)
Very Often Often A Few Times Infrequently Never
More than 10 times 5-10 times 3-5 times 1-2 times Driven a vehicle with one or more other teenagers in it without anyone over the age of 21? Ridden in a vehicle driven by someone who was a teenager without anyone over the age of 21 in the vehicle? Driven after 10 p.m. at night without someone over the age of 21 in the vehicle? Talked on a cell phone while driving? Text message (read or sent) while driving? Driven without a seat belt? Driven 10 miles per hour or more over the posted speed limit? "Street-raced" anyone? Driven with passengers who did not wear a seat belt? Driven after having had alcohol to drink (even just one drink)?
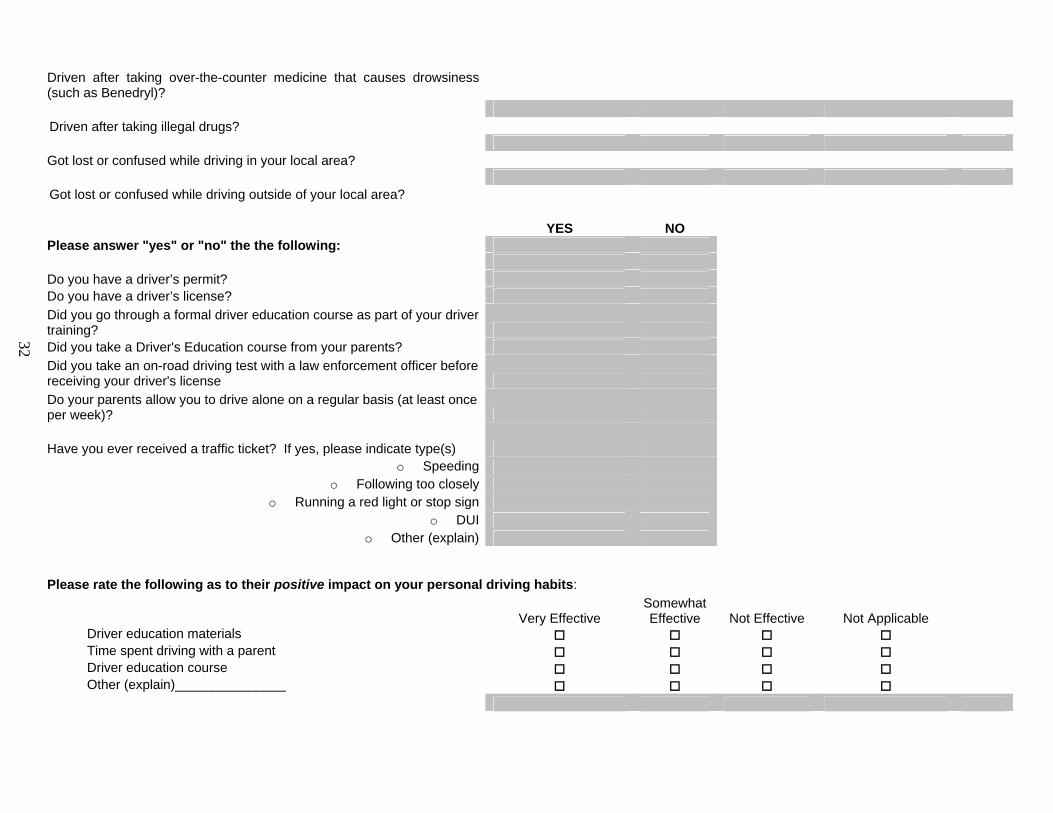
32
Driven after taking over-the-counter medicine that causes drowsiness (such as Benedryl)? Driven after taking illegal drugs? Got lost or confused while driving in your local area? Got lost or confused while driving outside of your local area? YES NO Please answer "yes" or "no" the the following: Do you have a driver’s permit? Do you have a driver’s license? Did you go through a formal driver education course as part of your driver training? Did you take a Driver's Education course from your parents? Did you take an on-road driving test with a law enforcement officer before receiving your driver's license Do your parents allow you to drive alone on a regular basis (at least once per week)?
Have you ever received a traffic ticket? If yes, please indicate type(s) o Speeding
o Following too closely o Running a red light or stop sign
o DUI o Other (explain)
Please rate the following as to their positive impact on your personal driving habits:
Very Effective Somewhat Effective Not Effective Not Applicable
Driver education materials Time spent driving with a parent Driver education course Other (explain)_______________
33
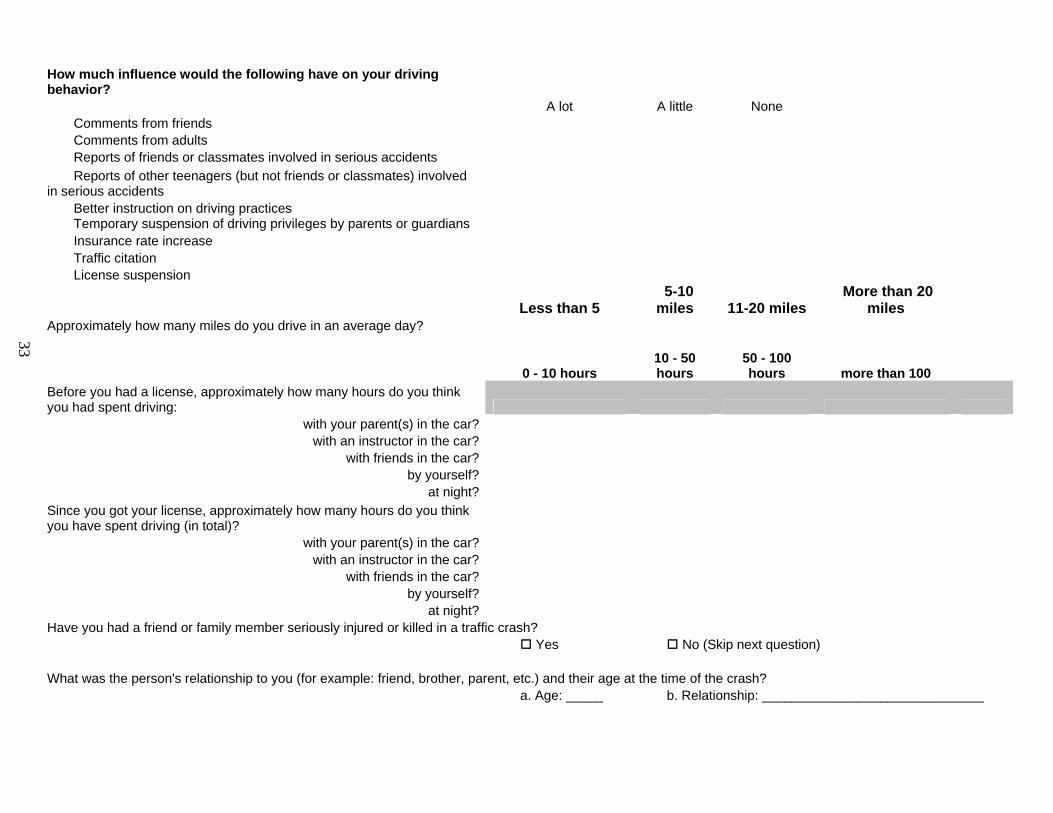
How much influence would the following have on your driving behavior? A lot A little None
Comments from friends Comments from adults Reports of friends or classmates involved in serious accidents Reports of other teenagers (but not friends or classmates) involved
in serious accidents Better instruction on driving practices Temporary suspension of driving privileges by parents or guardians Insurance rate increase Traffic citation License suspension
Less than 5 5-10 miles 11-20 miles
More than 20 miles
Approximately how many miles do you drive in an average day?
0 - 10 hours 10 - 50 hours
50 - 100 hours more than 100
Before you had a license, approximately how many hours do you think you had spent driving:
with your parent(s) in the car? with an instructor in the car?
with friends in the car? by yourself?
at night? Since you got your license, approximately how many hours do you think you have spent driving (in total)?
with your parent(s) in the car? with an instructor in the car?
with friends in the car? by yourself?
at night? Have you had a friend or family member seriously injured or killed in a traffic crash? Yes No (Skip next question)
What was the person's relationship to you (for example: friend, brother, parent, etc.) and their age at the time of the crash?
a. Age: _____ b. Relationship: ______________________________
34
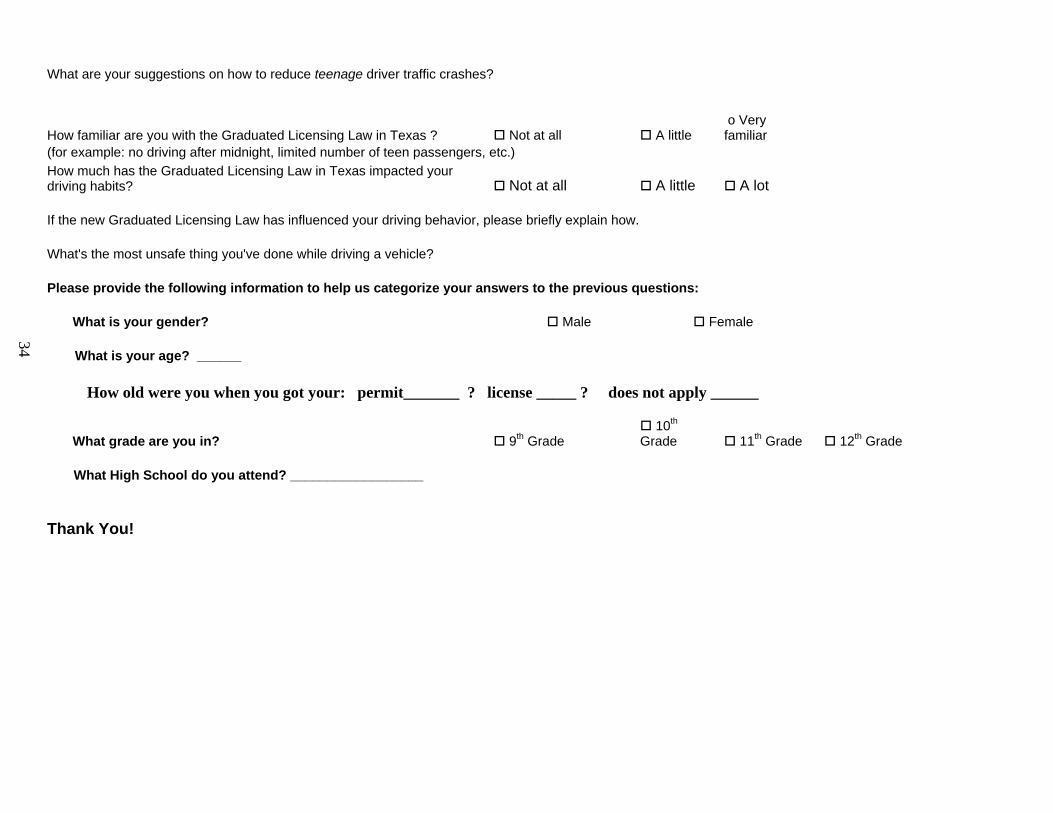
What are your suggestions on how to reduce teenage driver traffic crashes? How familiar are you with the Graduated Licensing Law in Texas ? Not at all A little
o Very familiar
(for example: no driving after midnight, limited number of teen passengers, etc.) How much has the Graduated Licensing Law in Texas impacted your driving habits? Not at all A little A lot If the new Graduated Licensing Law has influenced your driving behavior, please briefly explain how. What's the most unsafe thing you've done while driving a vehicle? Please provide the following information to help us categorize your answers to the previous questions:
What is your gender? Male Female
What is your age? ______
How old were you when you got your: permit_______ ? license _____ ? does not apply ______
What grade are you in? 9th Grade 10th
Grade 11th Grade 12th Grade
What High School do you attend? __________________ Thank You!