Embed Size (px)
Citation preview
C. LESLIE DAWSON
SECRETARY AND
COMMISSIONER OF HIGHWAYS
Mr. R. E. Johnson Division Administrator
COMMONWEALTH OF KENTUCKY
TRANSPORTATION CABINET FRANKFORT, KENTUCKY 40622
November 25, 1985
Federal Highway Administration 330 West Broadway Frankfort, Kentucky 40601
Dear Mr. Johnson:
Subject: Implementation Statement for UKTRP Report No. 85-15, "Effectiveness of Traffic Noise Barrier on I-471 in Campbell County, Kentucky"
MARTHA LAYNE COLLINS
GOVERNOR
The traffic noise measurements and data analyses summarized in the subject report sho» that the 1-471 noise barrier has resulted in a substantial reduction in traffic noise for the affected homes. The success of this noise barrier in providing its predicted insertion loss proves that noise barriers provide an effective traffic noise abatement alternative .
The results of this study are now being used in public meetings to illustrate the potential effectiveness of proposed noise barriers.
The construction of additional barriers wi.ll be considered in the future as a viable noise abatement measure .
The funds allotted and used for this particular research study can well be justified.
Very truly yours,
12/a::;,d;--R. K. Capito, P.E. State Highway Engineer

Technical �eport Documentation Page 1. Report No. 2. Government Accession No. 3. Recipient's Catalog No.
UKTRP-85-15
4. Title and Subtitle 5. Report Date
Effectiveness of Traffic Noise Barrier on I 471 in May 1985
Campbell County, Kentucky 6. Performing Organization Code
8. Performing Organization Report No. 7. Author( s)
T . Creasey and K. R . Agent UKTRP-85-15
9. Performing Organization Nome and Address 10. Work Unit No. (TRAIS) Kentucky Transportation Research Program College of Engineering 11. Contract or Grant No. University of Kentucky KYHPR-84-104 Lexington, Kentucky 40506-0043 13. Type of Report ond Period Covered
12. Sponsoring Agency Name and Address
Kentucky Transportat ion Cabinet F inal State Off ice Building Frankfort, Kentucky 40622 14. Sponsoring Agency Code
15. Supplementary Notes
Study Title: Effectiveness of Traffic Noise Barriers
Prepared in cooperat ion with the U . s. Department of Transportation, Federal Highway
Administration 16. Abstract
The objective of this study was to evaluate the effect iveness of the traffic noise
barrier on I 471 in Campbell County, Kentucky. S ince the barrier coincided with con-
s"truction of I 471, it was necessary to predict noise levels that would exist if no
barrier were present utilizing the FHWA STAMINA 2.0 computer model . This was com-
pared to actual noise level measurements at the barrier site to determine the barrier I insertion loss. I
After calibration of the STAMINA 2.0 model, noise measurements were conducted at 39
receiver locations during off-peak and peak traffic conditions . The noise barrier
reduced the noise level reaching adjacent residences substantially . Twenty-one
residences (20 percent of the total in the study area) experienced a peak LlO insertio
loss of 10 dBA or more, while another 63 residences (58 percent) were estimated as
receiving an insertion loss of 5 . 0 to 9 . 9 dBA .
Comparison of insertion loss using levels predicted by the STAMINA 2 . 0 model with
the barrier in place and measured levels were very close . Analyses indicated that inser t ion loss values predicted by the STAMINA 2.0 model will be achieved by the
noise barrier .
A survey of community percep t ion of the noise barrier was performed. Of 103 question-
naires delivered, 66 (64 percent) were returned. The community perception of the
barrier was favorable, as 64 percent of the respondents generally liked the noise
barrier and 95 percent felt it was effective in reducing traffic noise.
17. Key Words 18. Distribution Statement
Traffic Noise Barrier Unlimited with approval of Kentucky
Insertion Loss Transportation Cabinet Receivers Emission Levels Model
19. Security Clauif. (of this report) 20. Security Clossif. (of this page) 21. No. of Pages 22. Price
66
Form DOT F 1700.7 IB-72) Reproduction of completed page authorized

Research Report UKTRP-85-15
EFFECTIVENESS OF TRAFFIC NOISE BARRIER ON I 471 IN CAMPBELL COUNTY, KENTUCKY
by
Tom Creasey Transportation Research Engineer
and
Kenneth R. Agent Senior Transportation Research Engineer
Kentucky Transportation Research Program College of Engineering University of Kentucky
Lexington, Kentucky
in cooperation with Transportation Cabinet
Commonwealth of Kentucky
and
Federal Highway Administration US Department of Transportation
The contents of this report reflect the views of the authors who are responsible for the facts and accuracy
of the data presented herein. The contents do not necessarily reflect the official views or policies
of the University of Kentucky, the Kentucky Transportation Cabinet, nor the Federal Highway
Administration. This report does not constitute a standard, specification, or regulation.
May 1985

ACKNOWLEDGEMENTS
This report was prepared with the guidance of the following members of the Study Advisory Committee:
G. F. Hughes, Jr., Chairman, Division of Environmental Analysis, Kentucky Department of Highways
Ron George, Federal Highway Administration
Richard Dutton, Division of Environmental Analysis, Kentucky Department of Highways
Barry Atkins, Division of Environmental Analysis, Kentucky Department of Highways
Bill Plunkett, District 6, Kentucky Department of Highways

Table of Contents
Introduction • •
Data Collection Procedure
Technique for Determining Insertion Loss
Model Development and Calibration.
Insertion Loss Measurements.
Results • • • • • •
Model Calibration.
Field Measurements
Measured versus Predicted Insertion Loss
Survey of Community Perception.
Summary •
Implementation.
References.
Appendix A Receiver Coordinates
Appendix B Output from STAMINA 2 . 0
Appendix C Traffic Volume Count Summaries
Appendix D Summary of Data by Location • •
Appendix E Cover Letter and Survey Questionnaire
Page
1
1
1
2
5
5
5
6
7
8
9
10
10
33
3 7
43
47
57

INTRODUCTION
Traffic noise may reach such excessive levels a t loca tions near major highways that noise abatement measures are necessary . One noise abatement measure used frequently across the United States involves a noise ba rrier constructed a long the highwa y . These barriers are vertical wa lls made of wood , meta l , concrete, or earth berm s . They are designed to reduce noise levels at sensitive receivers adjacent to the highway and to break the line of sight between vehicles on the highway and receivers adjacent to the highwa y .
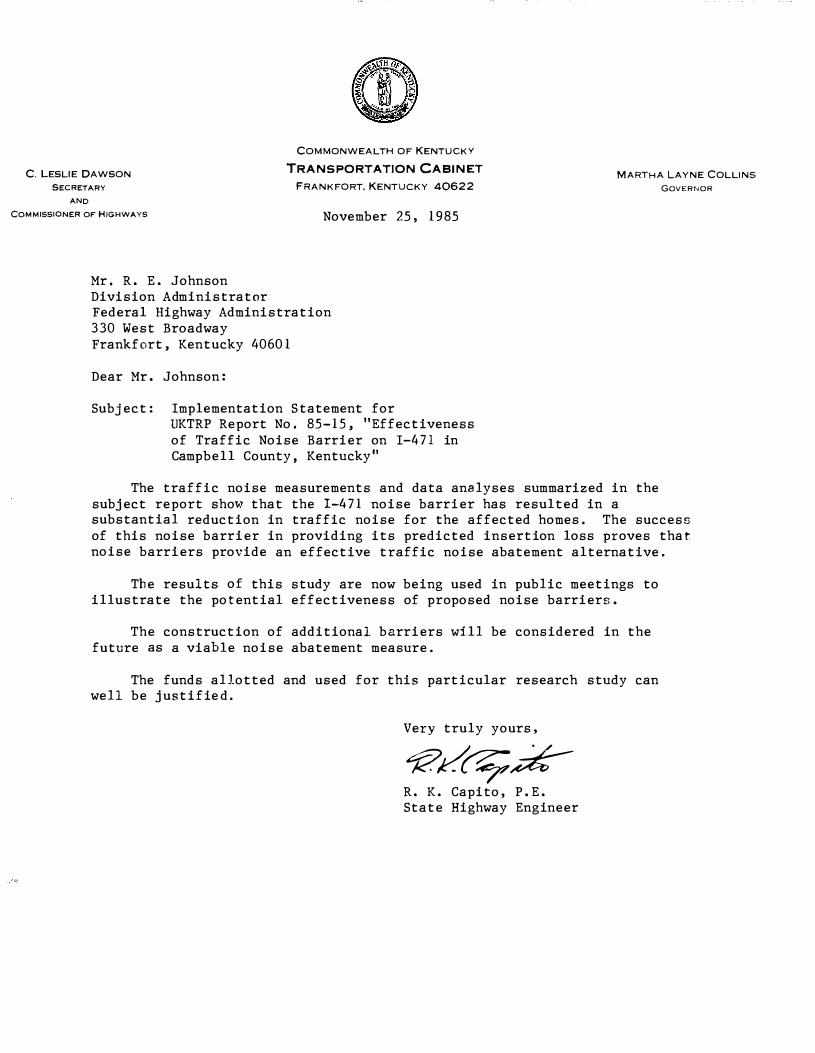
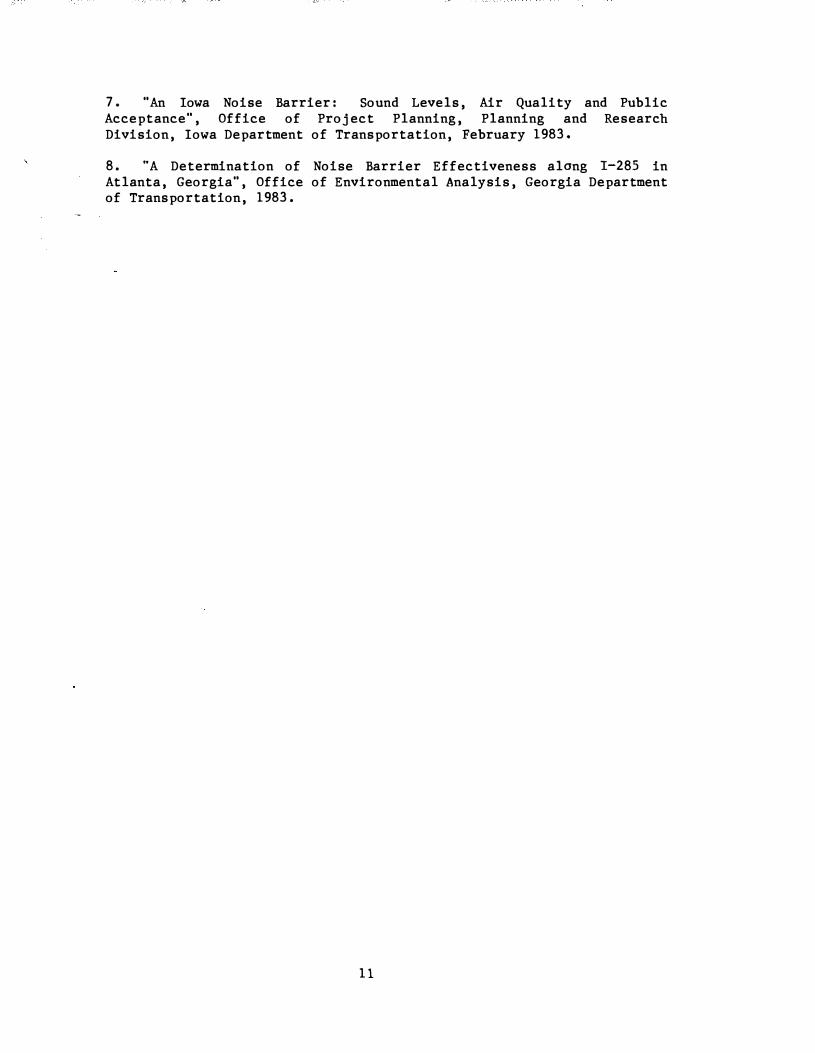
Currently , only one noise ba rrier ha s been constructed i n Kentucky . This ba rrier is loca ted on Interstate 4 7 1 in Cam pbell County (Figure 1 ) . This barrier is 1 5 feet high and is of m eta l construction. It i s located a d ja cent to the shoulder of the interstate and ha s a total length of 2 , 550 fee t . It wa s constructed in 1981 , and its construction coincided with the construction of I 471 . The cost of the m eta l noise ba rrier itself wa s $35 7 , 000 o r $ 9 . 3 3 per squa re foot or $140 . 0 0 per linear foo t . The tota l cost o f the noise ba rrier construction project wa s $392 , 2 7 7 .
The noise ba rrier wa s designed t o shield tra ffic noise from a residential neighborhood adjacent to I 4 7 1 . The obj ectives of this study were to determine the insertion loss provided by the ba rrier and to determine if noise reduction estimates were achieved . Since this ba rrier wa s the first to be constructed in Kentucky , a determina t ion of barrier effectiveness wi ll aid in future decisions regarding when and how additiona l noise ba rriers should be constructed . The construction of noise ba rriers i s expensive, which means tha t the most efficient design must be used to m inim ize the amount of barrier a rea required while achieving the needed noise reduction. Any improvem ent in design would result in reduced construction costs a s well a s reductions in noise levels for the a ffected receivers .
Since the noise ba rrier wa s pa rt of the construction o f I 471 , beforeand-a fter data could not be obta ined. This report describes the procedure used to determine the barrier field insertion los s . Modeling o f the site is detailed a long with the calibration procedure . Results of field m ea surem ents are presented . A survey developed to determine community perception of the noise ba rrier i s a lso shown and results are presented .
DATA COLLECTION PROCEDURE
TECHNIQUE FOR DETERMINING INSERTION LOSS
Since construction of the noise ba rrier coincided with construction of I 47 1 , before-and-a fter noise measurements could not be obta ine d . Als o , there wa s not a sim ilar site a long the highwa y where there wa s no noise ba rrier where measurements could be taken and compared to those behind the ba rrier. Therefore, it wa s decided to use the procedure described in Section 5 . 5 of FHWA report FHWA-DP-45-1R ( 1 ) . Tha t procedure utilizes the FHWA STAMINA 2 . 0 model to determine insertion loss by comparing actua l "a fter" s ound level measurements to predicted "before" leve l s . The STAMINA
1
2 . 0 m odel considers highway traff ic noise in relation to a roadwa y sourc e , which is a pproxima ted by a series of straight-line segment s , a n d estimates the acoustic intensity at rece iver locations resulting from the roa dwa y source. Source characteristics are defined by speed-dependent noise emission levels and by traff ic density by vehicle type. Site geography is described by a three-dim ensiona l coordina te system . Source-receiver pa th chara cteristics are then considered , taking into account effects of noise barrier s , topography, vegeta tion , and a tm ospheric absorption.
Two locations (behind the noise ba rrier) were selected and m easurements were taken to calibrate the m odel . Thirty-nine locations were then used in the data collection procedure. Once the ca libration process wa s completed , "bef ore" sound levels were predicted by the m odel. The insertion loss wa s determined by taking the difference between the calculated "before" and m easured "after" noise levels .
MODEL DEVELOPMENT AND CALIBRATION
The f irst step in the m odel ca libra tion process wa s the physical modeling of the study sit e . This wa s done by quantifying physical characteristics of the microphone or receiver loca tions , vehicles , the roadwa y , and the ba rrier. Using map s , an aerial photograph, and a prelim ina ry f ield inspection, locations f or the two m icrophones ( study site and ref erence microphones) necessary to the calibra tion process were selected .
To locate the study site m icrophone, it wa s necessary to f irst e s tablish a ba seline perpendicular to the centerline of the near traff ic lane , pa ssing through the study site m icrophone loca tion. The study site m icrophone had to be on the receiver side of the ba rrier ( i . e . the ba rrier ha d to stand between the microphone and roadway) and had to be a t least 10 feet from any vertical reflective surfa ce . The geome try between the microphone and roadway wa s to be a s simple as possible.
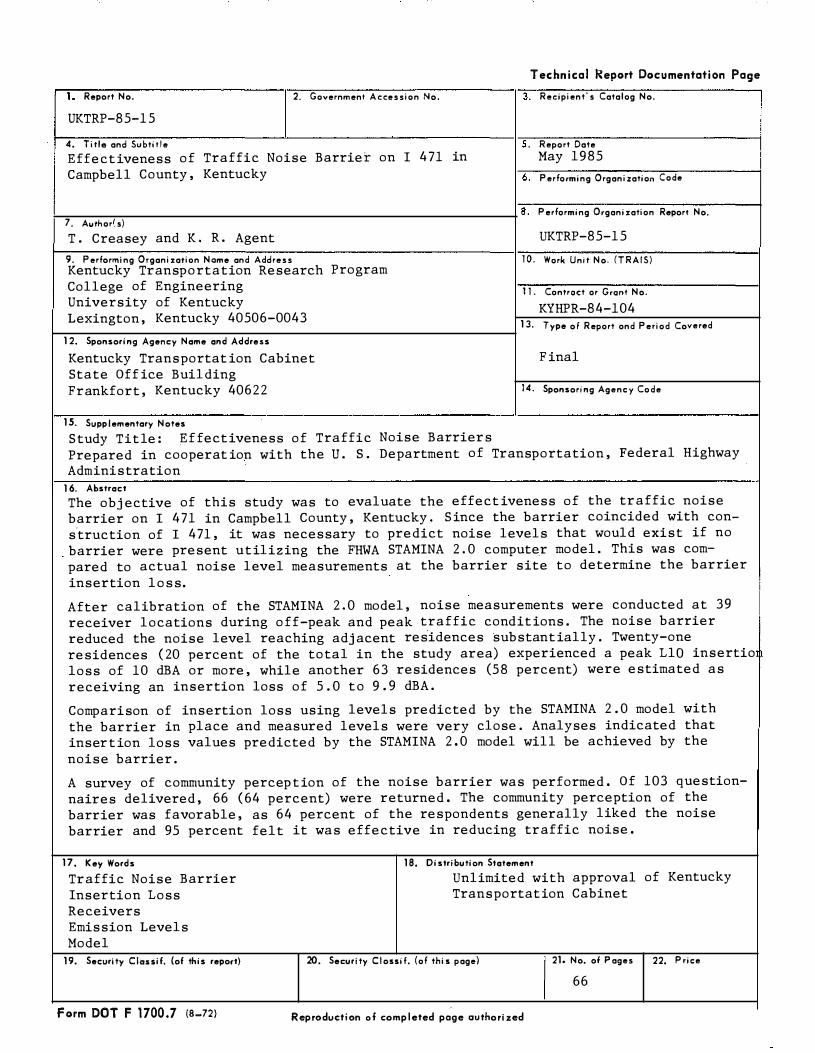
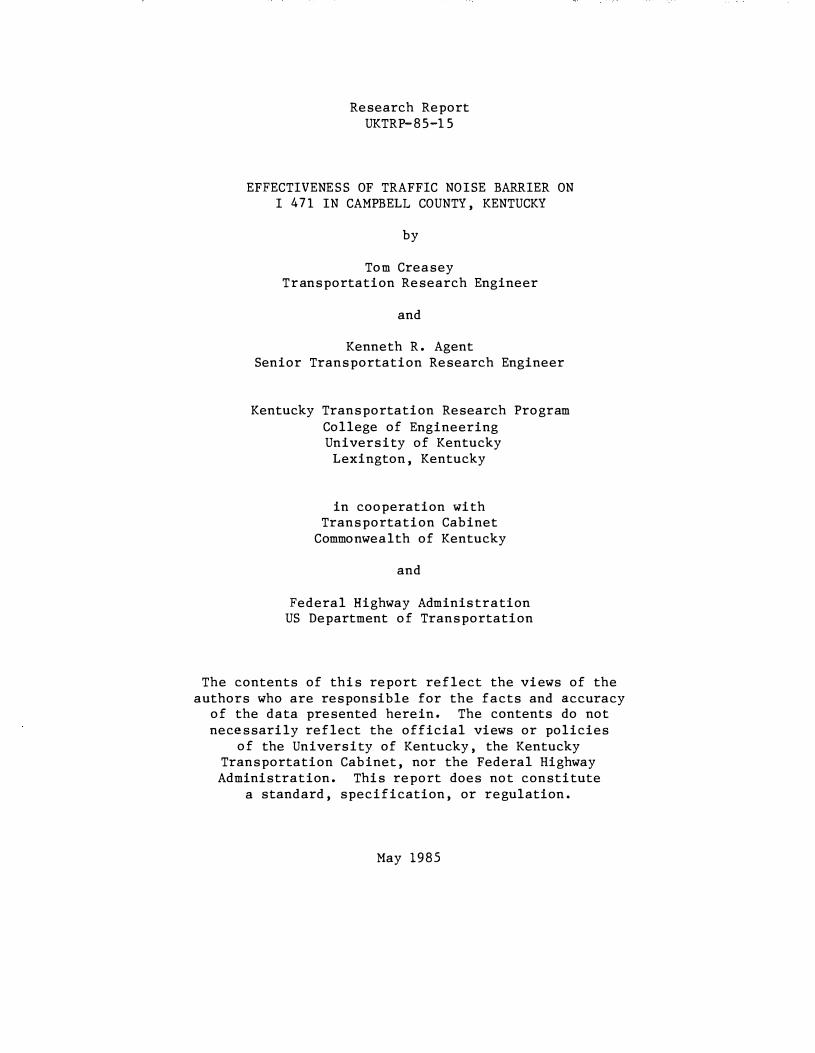
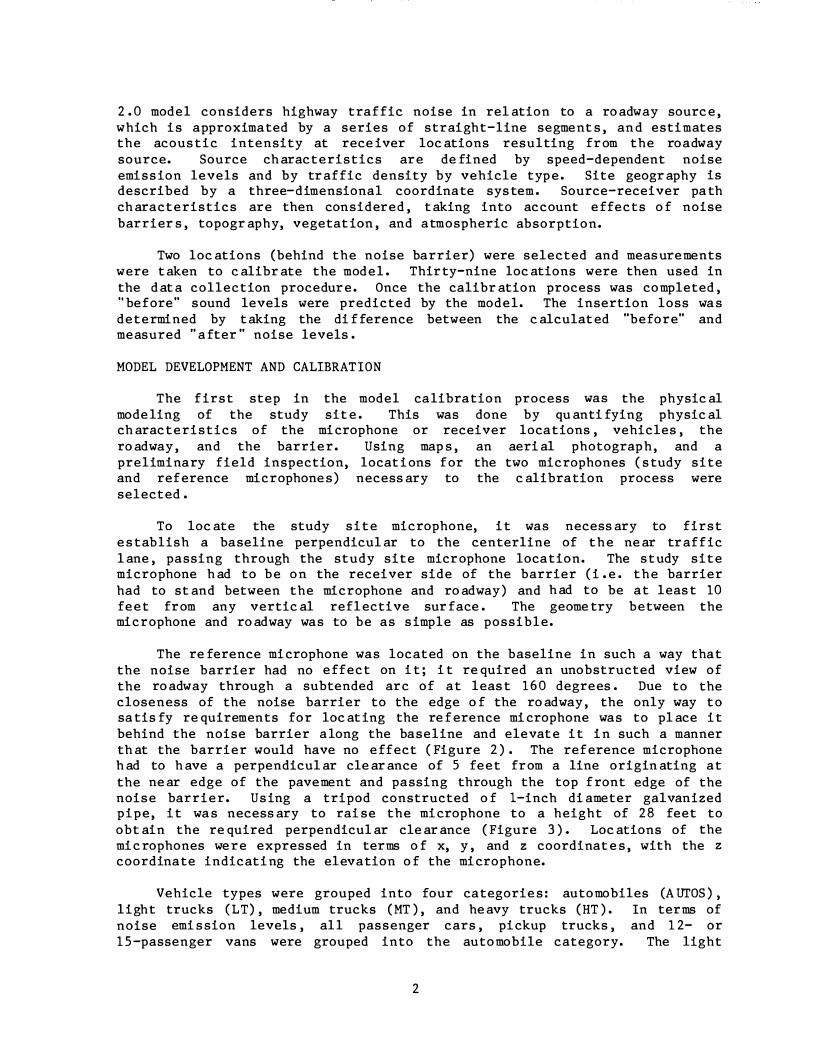
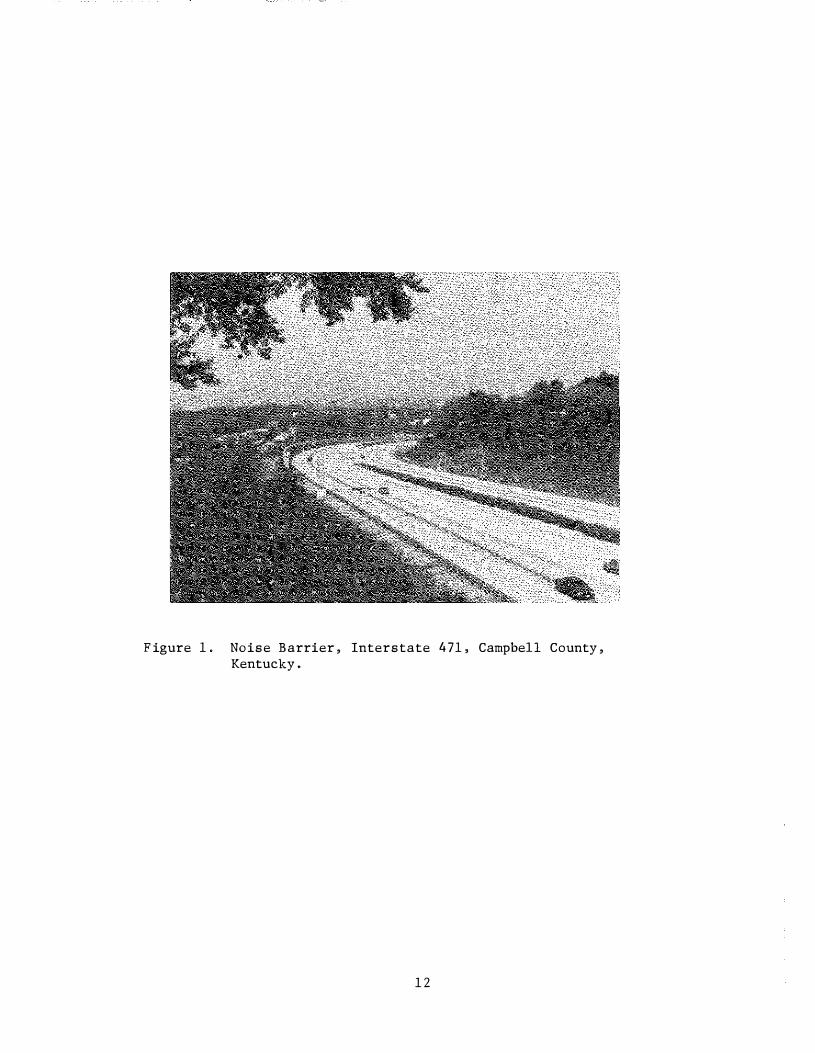
The reference m icrophone wa s loca ted on the ba seline in such a way tha t the noise ba rrier had no eff ect on i t ; i t required a n unobstructed view of the roadwa y through a subtended arc of a t least 160 degrees . Due to the closeness of the noise ba rrier to the edge of the roadway, the only way to sa tisfy requirem ents for locating the ref erence mi crophone wa s to place it behind the noise ba rrier a long the ba seline and elevate it in such a manner that the ba rrier would have no eff ect ( Figure 2 ) . The ref erence m icrophone had to have a perpendicular clearance of 5 feet from a line originating a t the near edge of the pavement and pa ssing through the top f ront edge of the noise ba rrier. Using a tripod constructed of l-inch diameter ga lvanized pipe, it wa s necessary to ra i se the m icrophone to a height of 28 feet to obtain the required perpendicular clearance ( Figure 3 ). Locations of the m i c rophones were expressed in terms of x, y , and z coordina t e s , with the z coordina te indicating the eleva tion of the microphone.
Vehicle types were grouped into four ca tegorie s : automobiles (AUTOS ) , light trucks (LT) , medium trucks (MT ) , and heavy trucks (HT ) . In terms of noise em i ssion levels , all pa ssenger ca rs , pickup trucks , and 1 2- or 1 5 -pa ssenger vans were grouped into the automobile ca tegory. The light
2
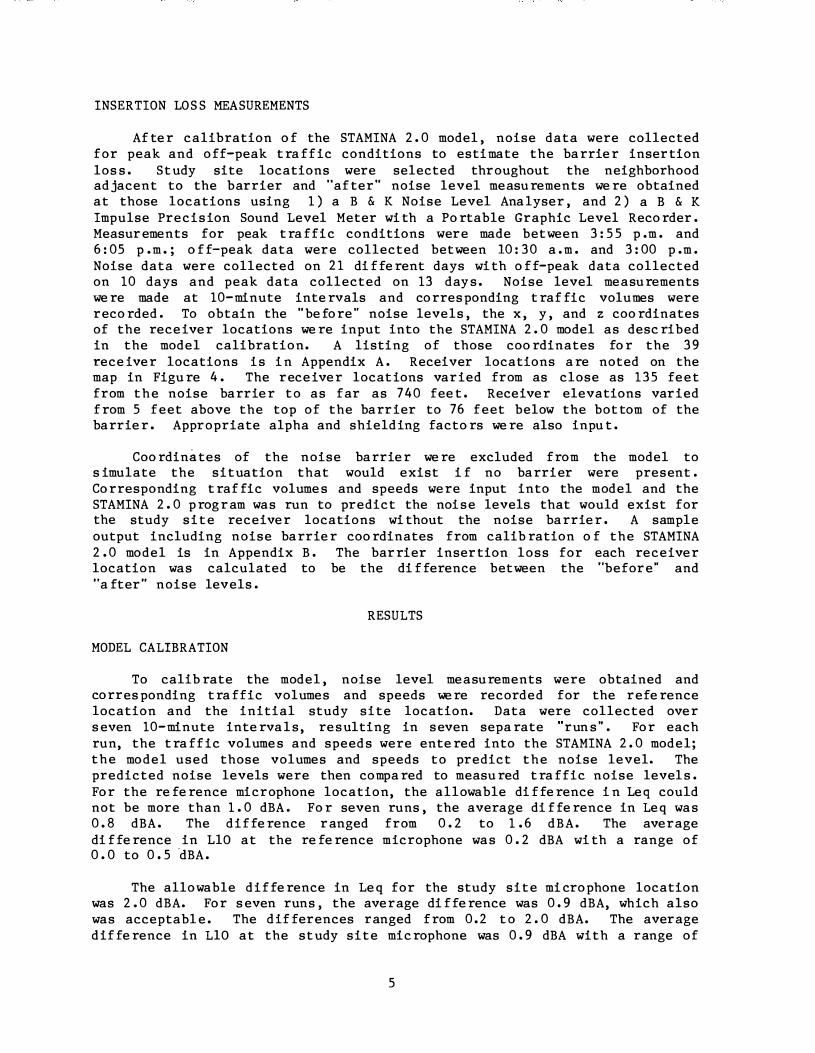
truck ca tegory consisted of delivery-type trucks la rger than a van in a ddition to pickup trucks having two axles and six tires . Single-unit trucks having two axles and six tires , as well a s buses , were considered a s m edium trucks . Motor cycles were included in th� t category because they had s imila r noise em ission levels. Single-unit trucks having three or more axles and all combina tion trucks were grouped into the heavy truck ca tegory . Corresponding source heights of 0 . 0 , 0 . 0 , 2 . 3 and 8 . 0 fee t , respectively , were a s signed to the categories and input into the STAMINA 2 . 0 m odel . Noise emission levels for ca r s , medium trucks and heavy trucks ba sed on results from na tionwide studies are incorpora ted into the STAMINA 2 . 0 m odel , but it wa s decided to use noise em ission levels for different types of Kentucky vehicles derived in a previously issued report (2 ) . The STAMINA 2 . 0 m odel a llows for input of additiona l vehicle types; thu s , parameters for Kentucky autos , light trucks , medium trucks and heavy trucks were added to the m odel a s Vehicle Types 4 , 5 , 6 , and 7 , respectively. Tra ffic flow conditions for vehicle type , volum e , and speed were then input into the model. The "Car s , ·· ""Medi urn Trucks , .. and ""Heavy Trucks"" vehicle types , ba sed on na tionwide em ission levels , wer e all a ssigned traffic volum es of one vehicle per hour and speeds of 3 0 miles per hour (minimum va lues accepted by the model) so tha t they would effectively not be considered in the prediction process . Speeds and volumes were input for Vehicle Types 4 , 5 , 6 , and 7 for prediction of traffic noise ba sed on em ission param eters for Kentucky automobile s , light truck s , medium trucks and heavy trucks , respectively . The STAMINA 2 . 0 U ser's Ma nual ( 1 ) did not specify wha t speeds were to be used . The 85th-percentile speed , which is the speed used to set speed lim i t s , wa s used in this study.
A m odel of the roadway wa s constructed ma thema tically using a threed imensiona l coordina te system to describe a string of sequentia l ly connected straight-line segm ents. This presented a complex situa t ion because the roa dway running in ea ch direction consisted of a mainline and an entrance or exi t ram p , all within the study site loca tion. It wa s decided to m odel the ramps , the mainline section before the ramp , and the mainline section a fter the ramps all as individua l roadways with corresponding traffic volum e s . For exam ple, the southbound lanes of I 471 , which are adjacent t o the noise bar rier , are comprised of the mainline section and an entrance ram p . The ramp wa s considered a s one roa dwa y and its tra ffic volumes recorded . The mainline section just prior to the entrance ram p wa s considered a s a separa te roa dway and its tra ffic volumes recorded . Fina lly , the mainline section just pa st the entrance point of the ram p wa s considered a s a roa dway itself; the ramp traffic volumes and the previous mainline section volumes were added to obtain combined tra ffic volum es for the third roadwa y . A s im ila r techniq ue wa s used for the northbound lane s . The exit ramp and ma inline section tra f fic volum es were added to obtain combined tra ffic volumes for the section just prior to the exit ram p . Thus , there were three individual roadwa ys for each direction , or a total of six. The individua l roadways making up the northbound or southbound roadways contained common terminal points in order to connect the individua l sections . STAMINA 2 . 0 allows the user to adjust the em ission levels for heavy trucks m oving up grades , but does not a llow the user to define tra ffic flow direction . However , a gra de adjus tm ent fa ctor may be included in the roa dway model and wa s taken into a ccount in the prediction process for the upgra de southbound lanes .
3
The noise barrier wa s modeled physica lly in the same manner a s the roadwa y , using a three-dimensional coordinate system to describe the ba rrier as a string of sequentially connected stra ight-line s egment s . The height of the top of the barrier wa s input into the model as well a s its eleva tion a t ground level. Ba rrier
"coordina tes were inserted into the model during the
calibra tion process for the purpose of predicting the present conditions and compa ring those predicted noise levels to those a ctua lly mea sured . After ca libration of the model, noise barrier coordina tes are removed from the model to predict conditions tha t would exist if the ba rrier were not present .
A decision wa s made to model the concrete median barrier a s a sma ll noise ba rrier . Though it wa s not intended to be a noise ba rrier and its effect would be minima l , it wa s decided to include the concrete median barrier in the model to approxima te the a ctual site a s closely a s possibl e . For the same rea son, three hills in the study s ite considered to be sufficiently large to provide a significant amount of protection from traffic . noise for some of the residences were included in the model. STAMINA 2 . 0 recognizes three types of ba rrier s : a bsorptive, reflective , and structural . The noise barrier wa ll and the concrete median ba rrier were considered to be reflect ive ba rriers , while the three hills were modeled a s absorptive earth ba rrier s .
Other fa ctors recognized by STAMINA 2 . 0 i n the modeling process are alpha fa ctors , which concern the effect of hard or soft ground on the noise propaga tion rate between the source and receive r , and shielding fa ctor s , which account for the additional a ttenua tion o f noise due t o shielding by buildings , rows of houses , tree s , or other terrain feature s . The hillside behind the noise ba rrier wa s covered with thick vegeta tion, leading to the use of the 4 . 5 dB per distance doubling propa ga tion rate for soft ground between the roa dway and the study site microphone . A propaga tion ra te of 3 dB per distance doubling wa s used for the hard pavement surface between the roadway and the reference microphone . There were no shielding fa ctors between the roadwa y and reference and study site microphones to cause additional noise a ttenua tion in the model ca libra tion proce s s .
Noise mea surements were taken a t the reference microphone location by a microphone a top the 28-foot tripod and connected via cable to a B & K Model 4426 Noi se Level Ana lyser. The microphone a t the study site wa s supported on a sma ller 5-foot tripod and wa s connected to another B & K Noise Level Ana lyser .
The final step in the calibra tion process wa s to obtain noise mea sur ements at selected microphone reference and study site loca tions . During this time period , tra ffic volumes and speeds were recorded . Us ing thi s informa tion, noise levels a t the two receiver locations were predicted by the STAMINA 2 . 0 program. Those levels were then compared to the actua l recorded levels a t the receiver loca tions for the same t ime periods in order to test the va lidity of the model .
4
INSERTION LOS S MEASU REMENTS
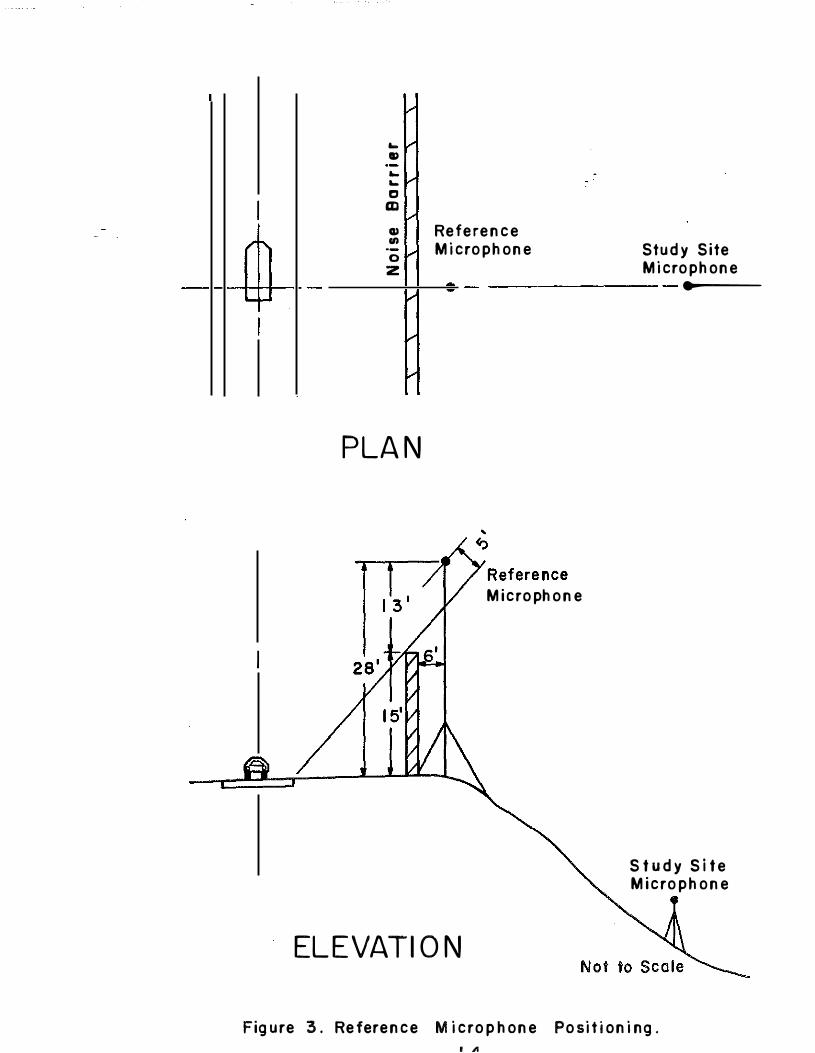
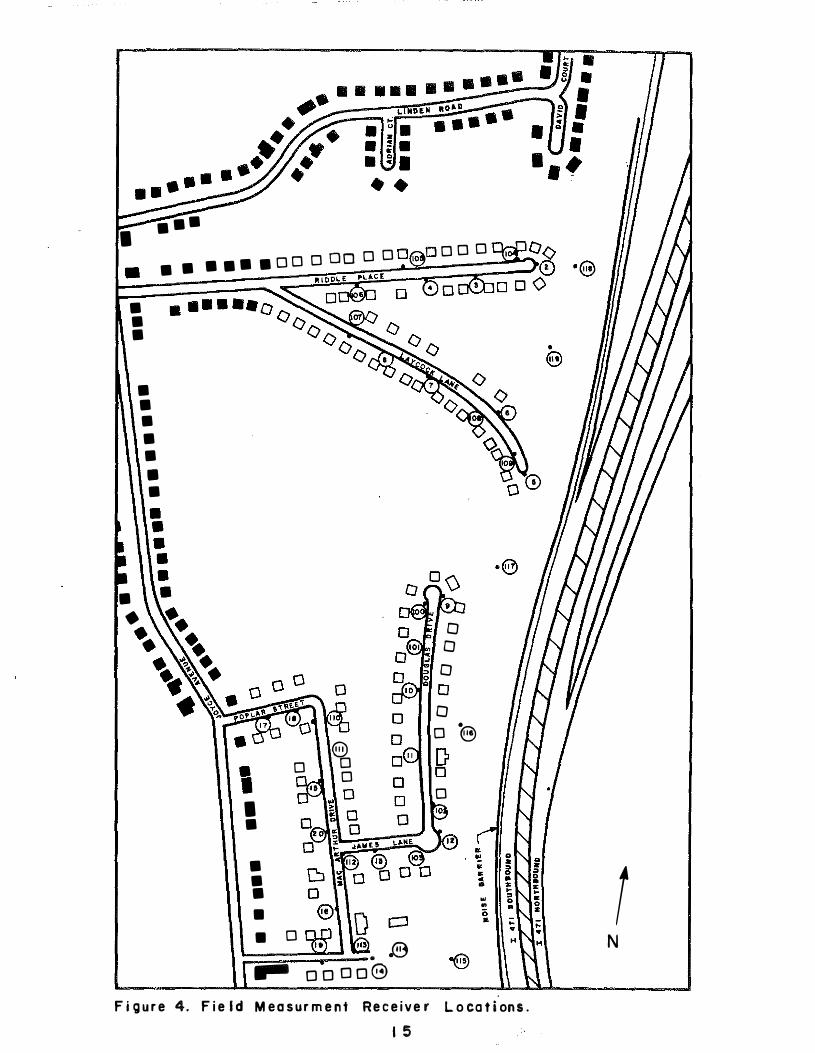
Af ter calibration of the STAMINA 2 . 0 m odel , noise data w ere collected f or peak and off-peak traff ic conditions to estimate the barrier inser tion los s . Study site locations w ere selected thr oughout the neighborhood adjacent to the barr ier and "'af ter"' noise level m easurem ents were obtained at those locations using 1 ) a B & K Noise Level Analyser , and 2 ) a B & K Im pulse Pr ecision Sound Level Meter w i th a Portable Gr aphic Level Recorder . Measur ements for peak traff ic conditions w er e made between 3 : 5 5 p .m . and 6 : 05 p .m . ; off-peak data w er e collected between 10 : 30 a .m . and 3 : 00 p .m . Noise data w er e collected on 2 1 different days with off-peak data collected on 10 days and peak data collected on 13 day s . Noise level measurem ents were made at 10-minute intervals and corresponding traffic volumes w ere r ecorded . To obtain the "' before"' noise levels , the x , y , and z coordinates of the receiver locations were input into the STAMINA 2 . 0 model as described in the m odel calibration. A listing of those coordinates for the 3 9 rece iver locations is i n Appendix A . Receiver locations are noted on the m ap in Figure 4 . The r eceiver locations var ied fr om as close as 135 feet fr om the noise barr ier to as f ar as 740 fee t . Receiver elevations var ied from 5 f eet above the top of the barr ier to 76 f eet below the bottom of the barr ier . Appr opr iate alpha and shielding factors were also inpu t .
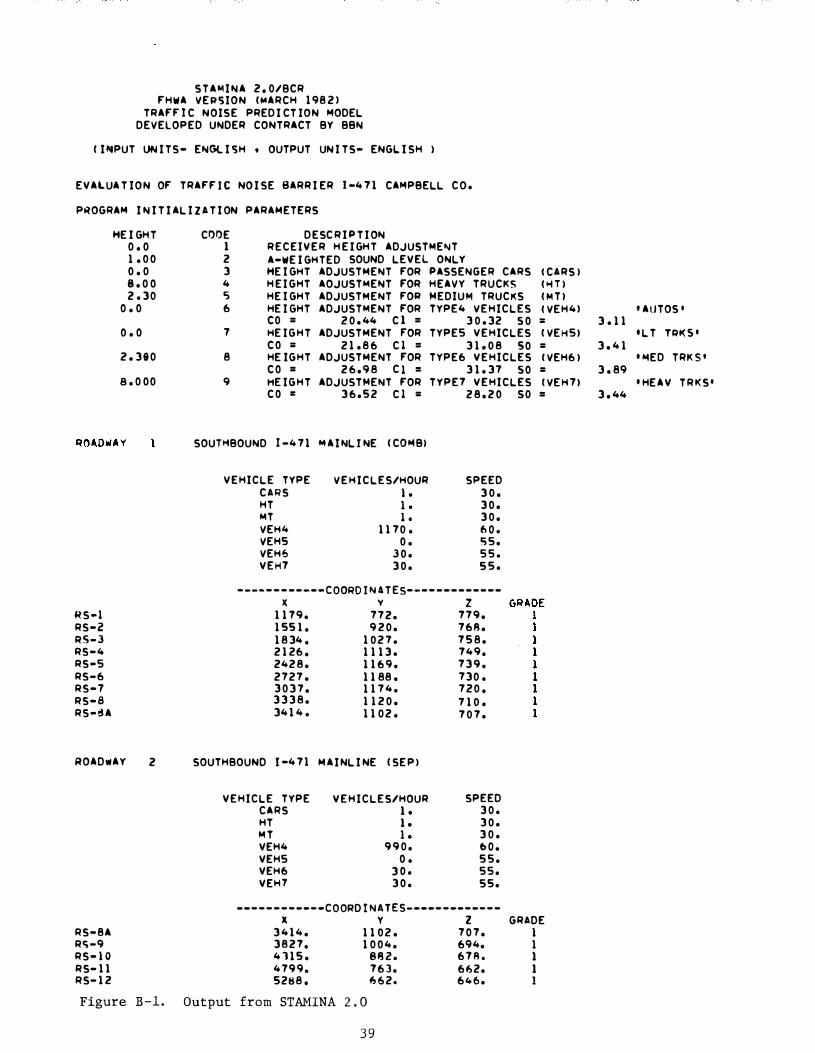
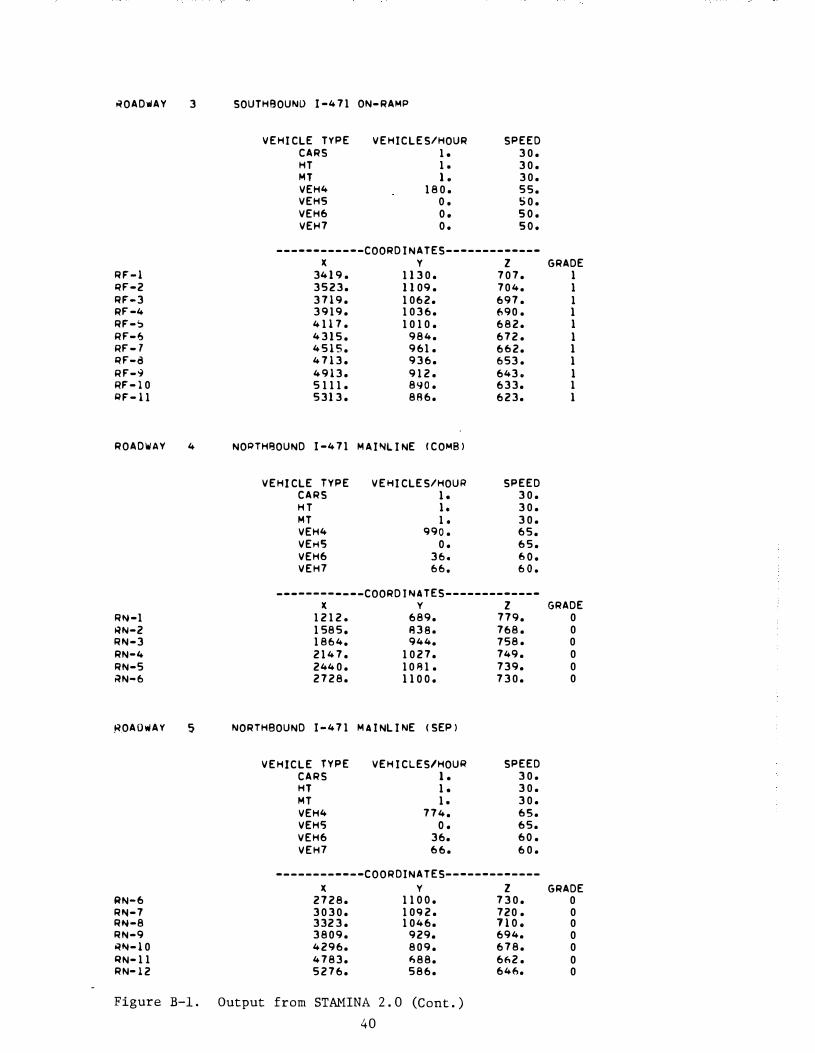
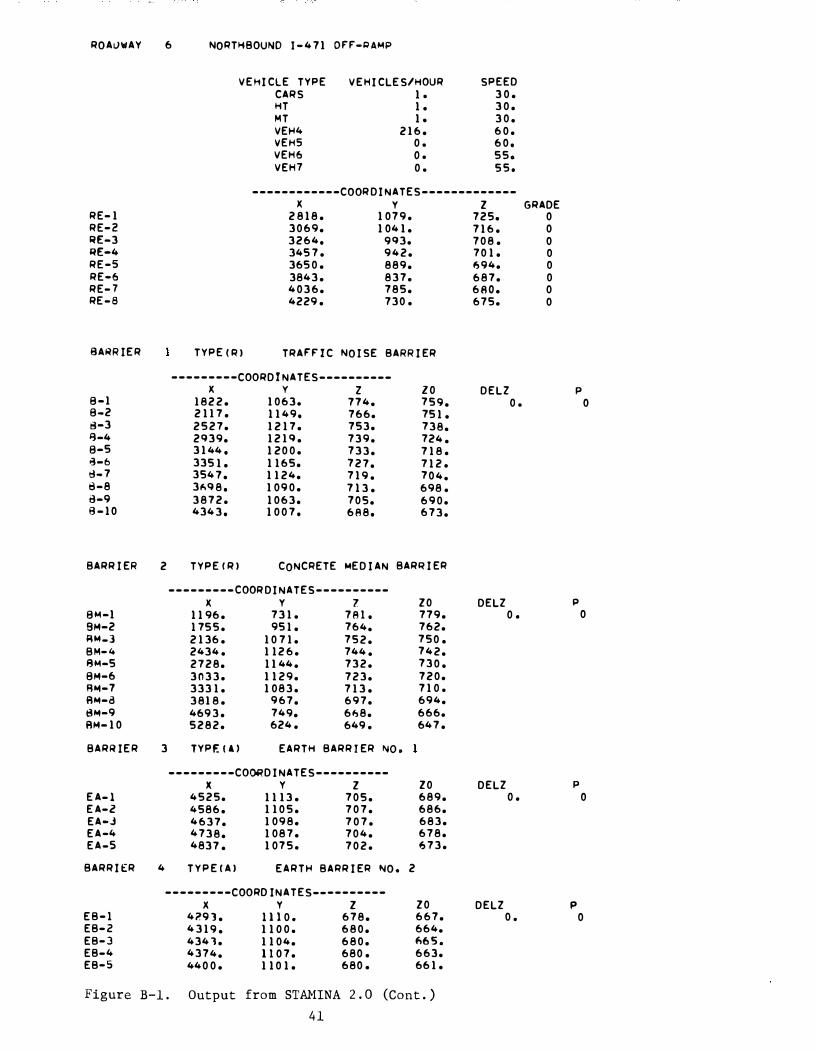
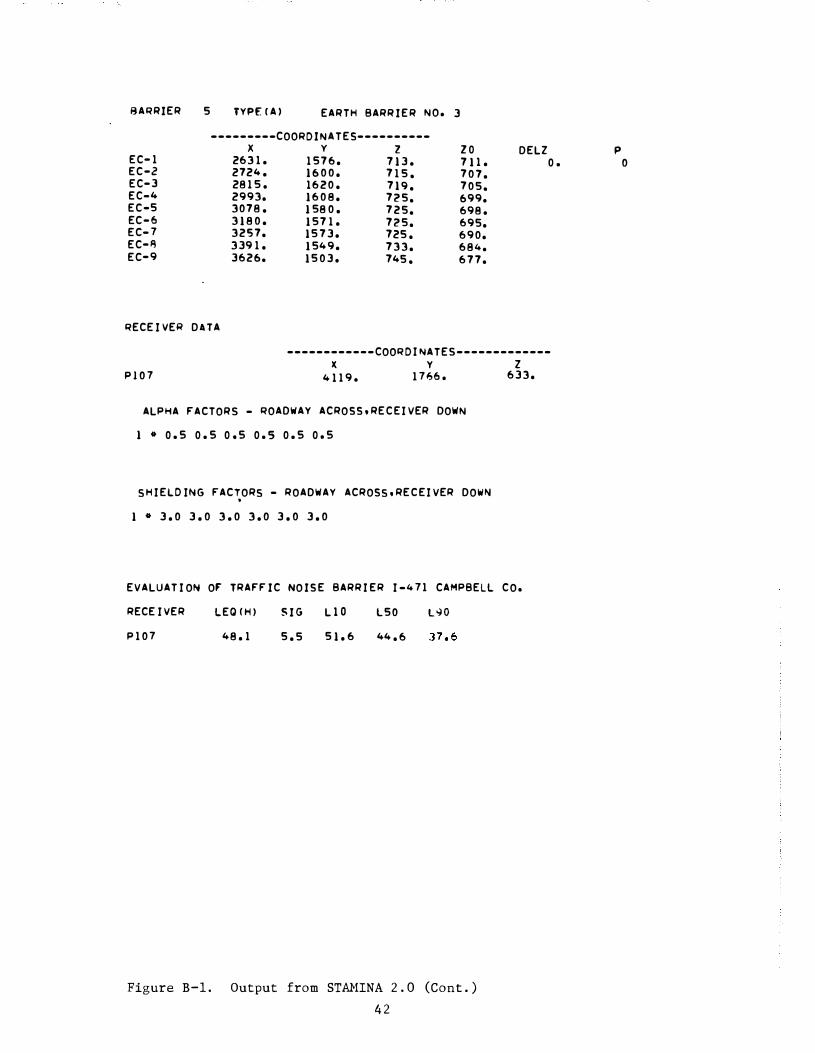
Coordina tes of the noise barr ier were excluded from the m odel to s imulate the situation that w ould exist if no barr ier w ere present . Corresponding traffic volumes and speeds were input into the m odel and the STAMINA 2 . 0 progr am was run to pr edict the noise levels that w ould exist for the study site receiver locations w i thout the noise barr ier . A sam ple output including noise barr ier coordinates from calibration of the STAMINA 2 . 0 model is in Appendix B . The barrier inser tion loss for each receiver location was calculated to be the difference between the "'befor e"' and "'after"' noise levels .
RESULTS
MODEL CALIBRATION
To calibrate the m odel , noise level measurem ents w ere obtained and corr es ponding traff ic volumes and speeds were recorded for the r eference location and the initial study site location. Data w ere collected over s even 10-minute intervals, resulting in seven separate r un s"' . For each run, the traff ic volumes and speeds w ere entered into the STAMINA 2 . 0 m odel; the model used those volumes and speeds to pr edict the noise level. The pr edicted noise levels w ere then compared to m easured traff ic noise levels . For the reference micr ophone location, the allowable difference i n Leq could not be m ore than 1 . 0 dBA . For seven runs , the average difference in Leq was 0 . 8 dBA. The difference r anged fr om 0 . 2 to 1 . 6 dBA. The aver age difference in LlO at the reference m icrophone was 0 . 2 dBA w i th a range of 0 . 0 to 0 . 5 dBA.
The allowable difference in Leq for the study site m i crophone location was 2. 0 dBA. For s even runs , the aver age difference was 0 . 9 dBA, which also was acceptabl e . The differ ences r anged from 0 . 2 t o 2 . 0 dBA. The aver age difference in LlO at the study site m icrophone was 0 . 9 dBA w ith a r ange of
5
0 . 0 to 2 . 3 dBA. Therefore, it wa s a ssumed tha t the STAMINA 2 . 0 model of the noise ba rrier site wa s ca libra ted properly and could be used to predict tra ffic noise levels for the situa tion where no noise ba rrier existed .
FIELD MEASUREMENTS
Traffic noise da ta were collected during off-peak and peak tra ffic conditions a t 3 9 receiver loca tions . The receiver loca tions were selected to cover an area a d jacent to I 471 which could be a f fected by the noise ba rrier. Ma ps and visual inspections were used to select this area . An attempt wa s ma de to select a sufficiently la rge area such tha t any residences that may have been impa cted by the noise barrier would be included . The receiver locations covered an a rea tha t included 108 res idence s .
The da ta were summa rized separately for off-peak and peak conditions . Tra ffic volumes were counted during each mea surement period . The volumes are summa rized in Appendix C . Volumes were counted by direction and by ma inline and ramp . The mea sured noise levels w ere compared to noise levels predicted by the STAMINA 2 . 0 model for the situa t ion tha t would exist i f no ba rrier were presen t . The ba rrier insertion loss wa s calculated to be the difference between the measured existing noise levels and the predicted noise leve l s . The numbers of residences w i thin certain noise level and insertion loss ranges were estimated . The mea sured noise da ta and corresponding tra ffic volumes for off-peak and peak traffic conditions are conta ined in Appendix D .
Off-Peak Conditions
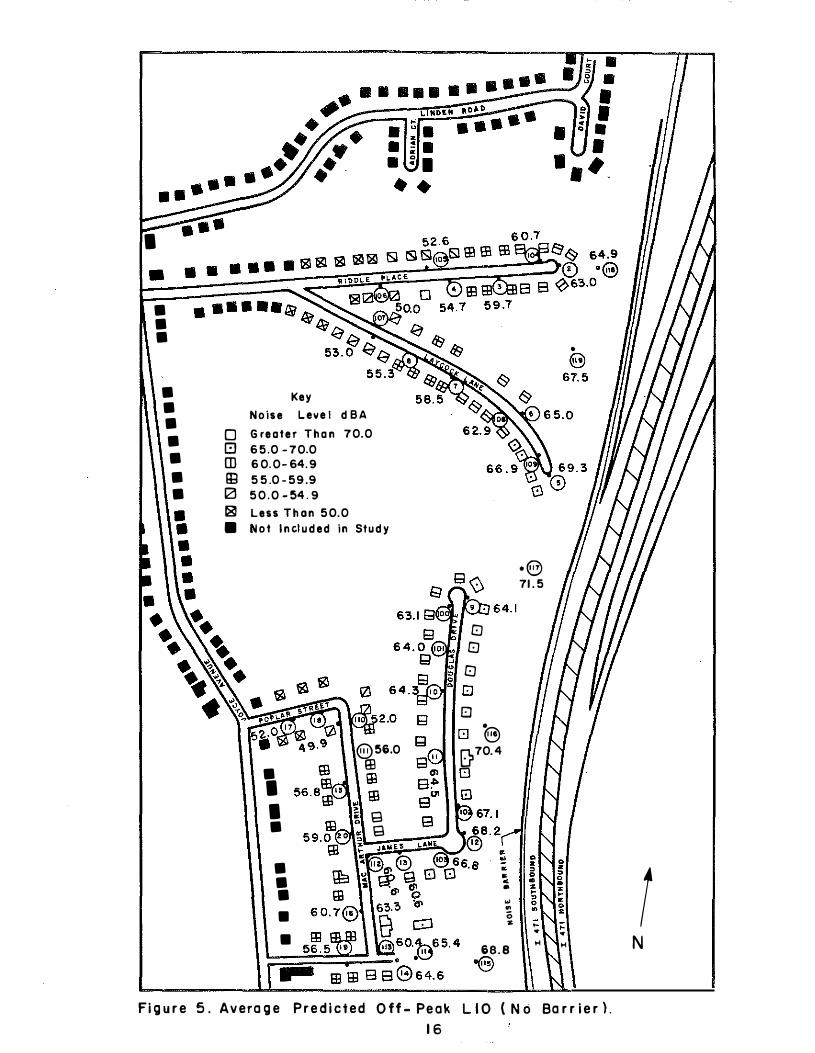
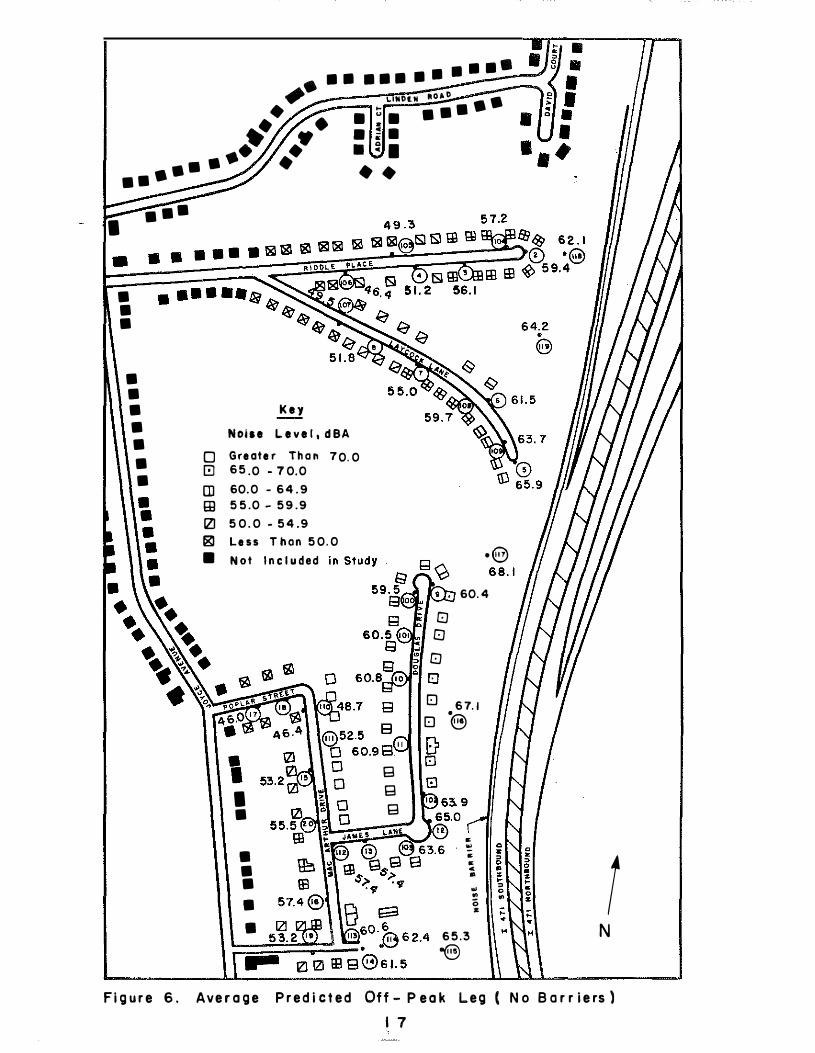
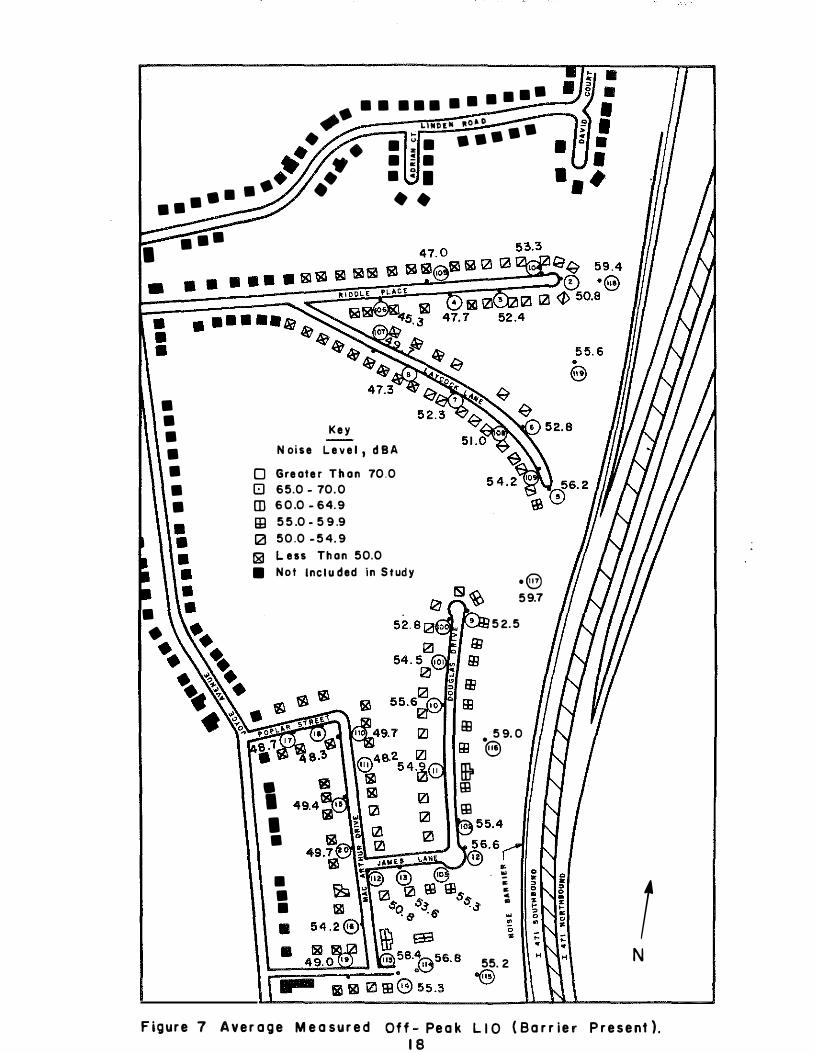
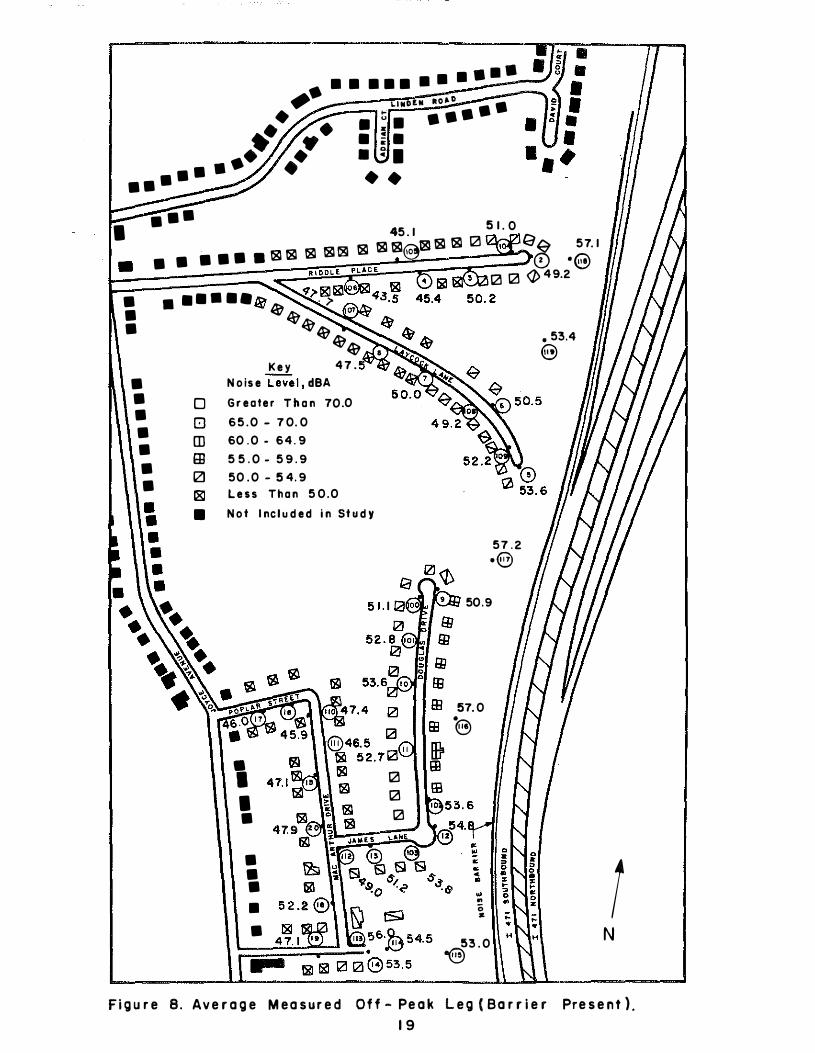
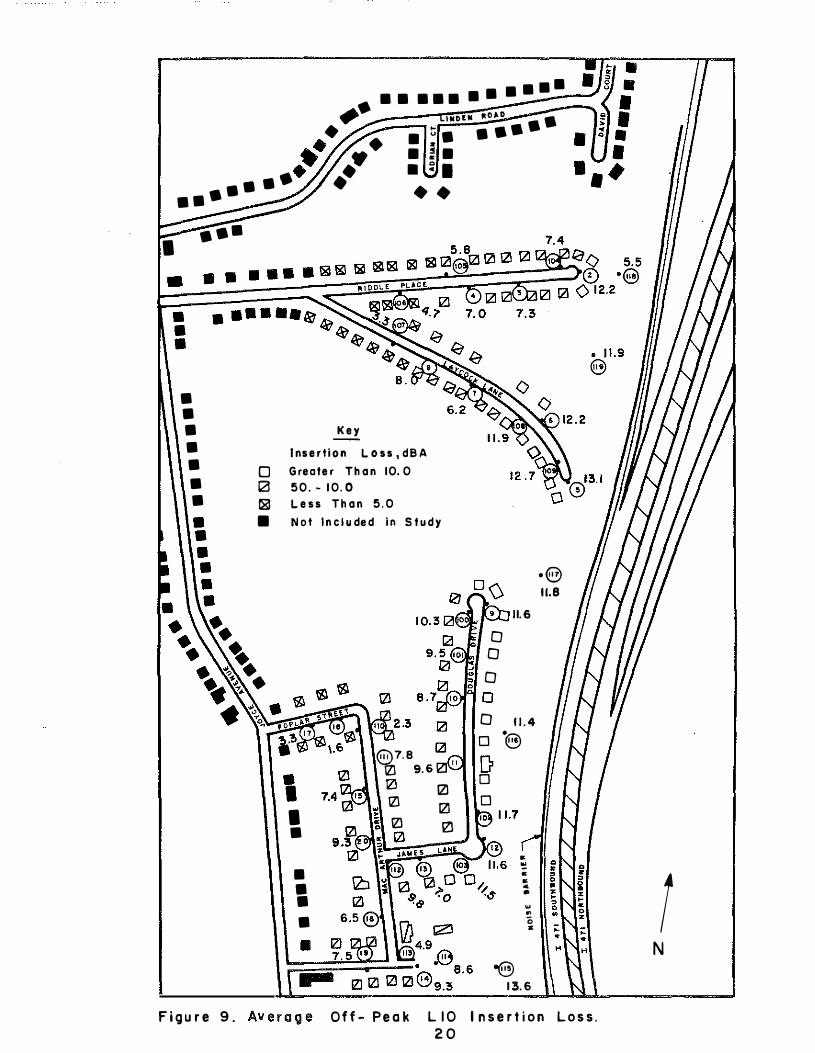
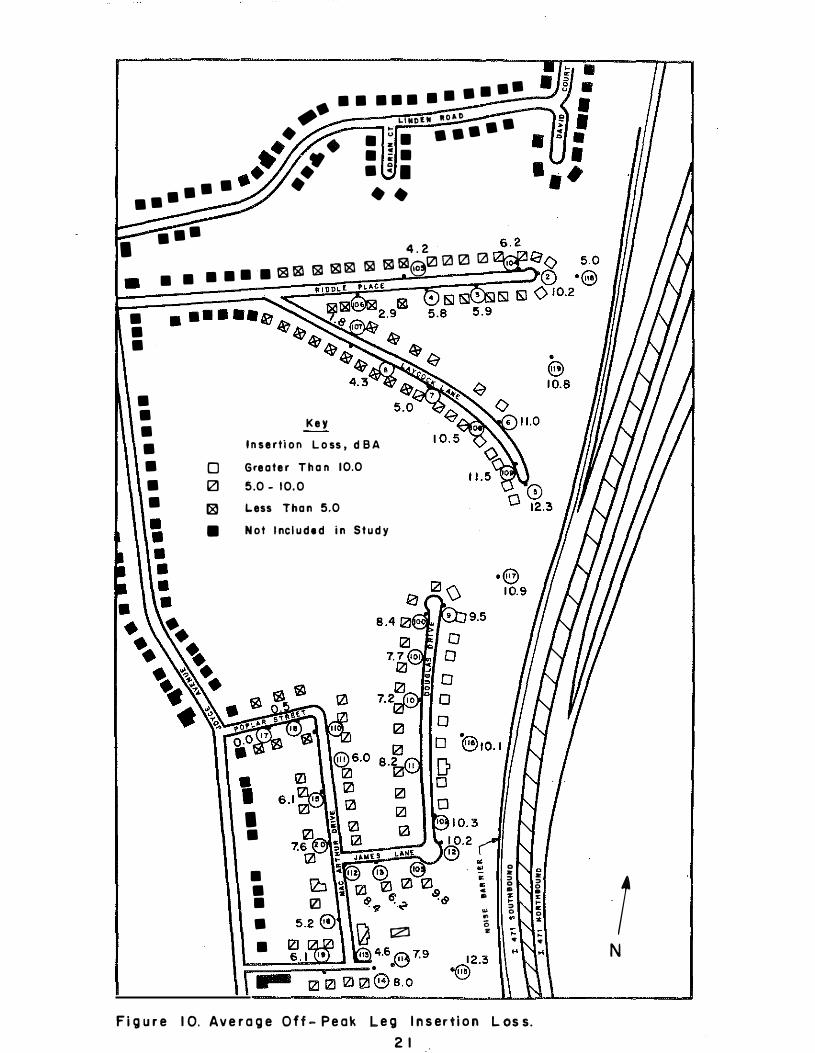
Predicted and mea sured 110 and Leq average noise levels and insertion l oss estima tes for off-peak tra ffic conditions are summarized in Ta ble 1 . Average off-peak hourly volumes for I 4 7 1 are given in Ta ble C-1 . Over the data collection period , total off-peak volumes averaged 2 , 052 a utomobiles per hour , 7 light t rucks per hou r , 84 medium trucks per hour, and 64 heavy trucks per hour . Shown in Figures 5 and 6 are average predicted LlO and Leq noise levels , respectively , a t each receiver location for the conditions tha t would exist if no barrier were present . Figures 7 and 8 show average mea sured 110 and Leq noise leve l s , respect ively , a t each receiver loca tion , while insertion loss estima tes for 1 1 0 and Leq noise levels are shown in Figures 9 and 1 0 , respectively .
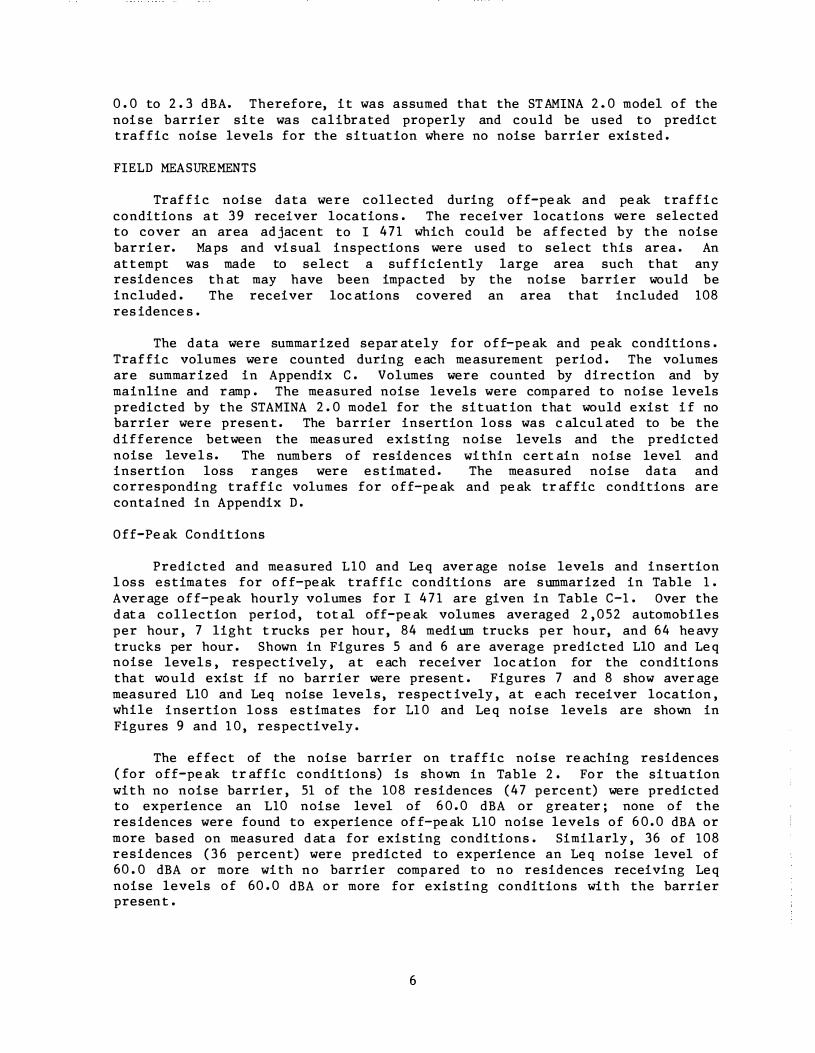
The effect of the noise ba rrier on tra ffic noise reaching residences ( for off-peak traffic conditions) is shown in Ta ble 2 . For the situa tion w ith no noise ba rrier , 51 of the 108 residences (47 percent) were predicted to experience an 110 noise level of 6 0 . 0 dBA or grea ter; none of the residences w ere found to experience of f-peak 110 noise levels of 6 0 . 0 dBA or more ba sed on mea sured data for existing conditions . Simila rly , 36 of 108 residences ( 3 6 percent) w ere predicted to experience an Leq noise level of 60 . 0 dBA or more w ith no barrier compa red to no residences receiving Leq noise levels of 60 . 0 dBA or more for existing conditions with the barrier present .
6
Insertion loss estima tes for residences throughout the study site for o f f-peak tra ffic conditions are given in Ta ble 3 . For 110 noise levels , 24 of 108 residences (22 percent) were found to have experienced an insertion loss of 1 0 . 0 dBA or more, whi le 61 of 108 residences (57 percent) had an insertion loss of 5 . 0 to 9 . 9 dBA. Similarly, 20 residences ( 1 8 percent) were estima ted to receive an Leq insertion loss of 1 0 . 0 dBA or m ore , while 57 residences (53 percent) experienced an Leq insertion loss between 5 . 0 and 9 . 9 dBA .
Peak Conditions
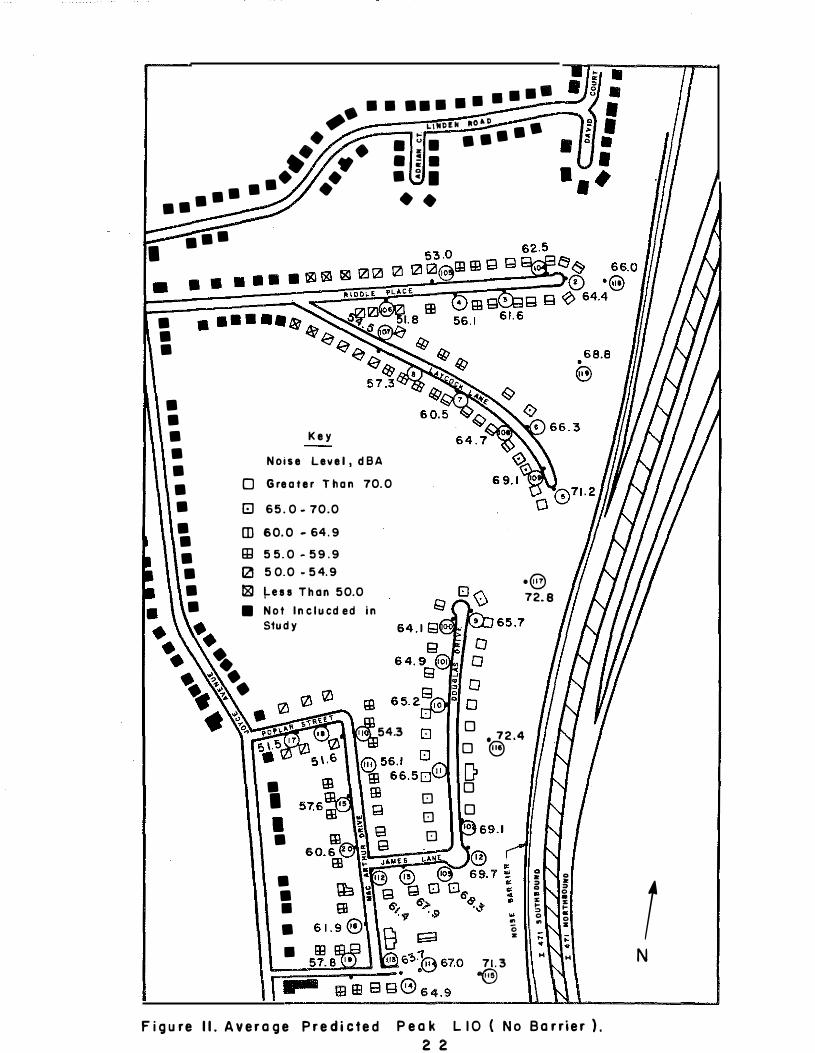
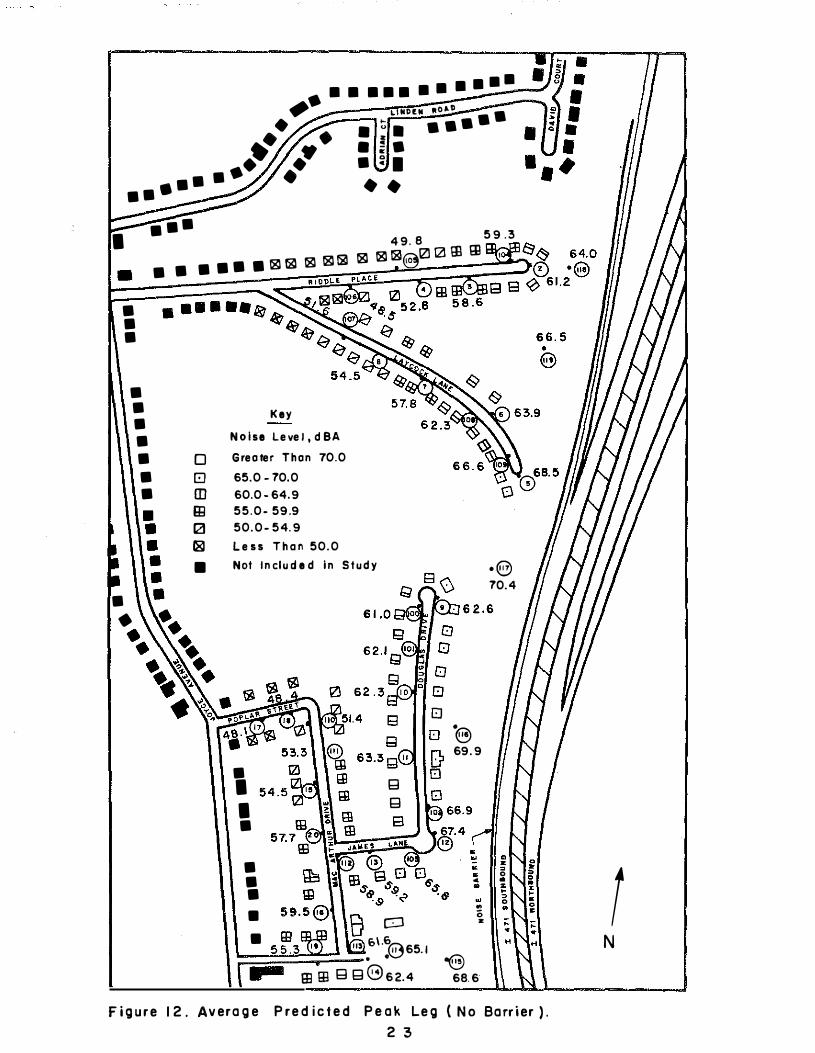
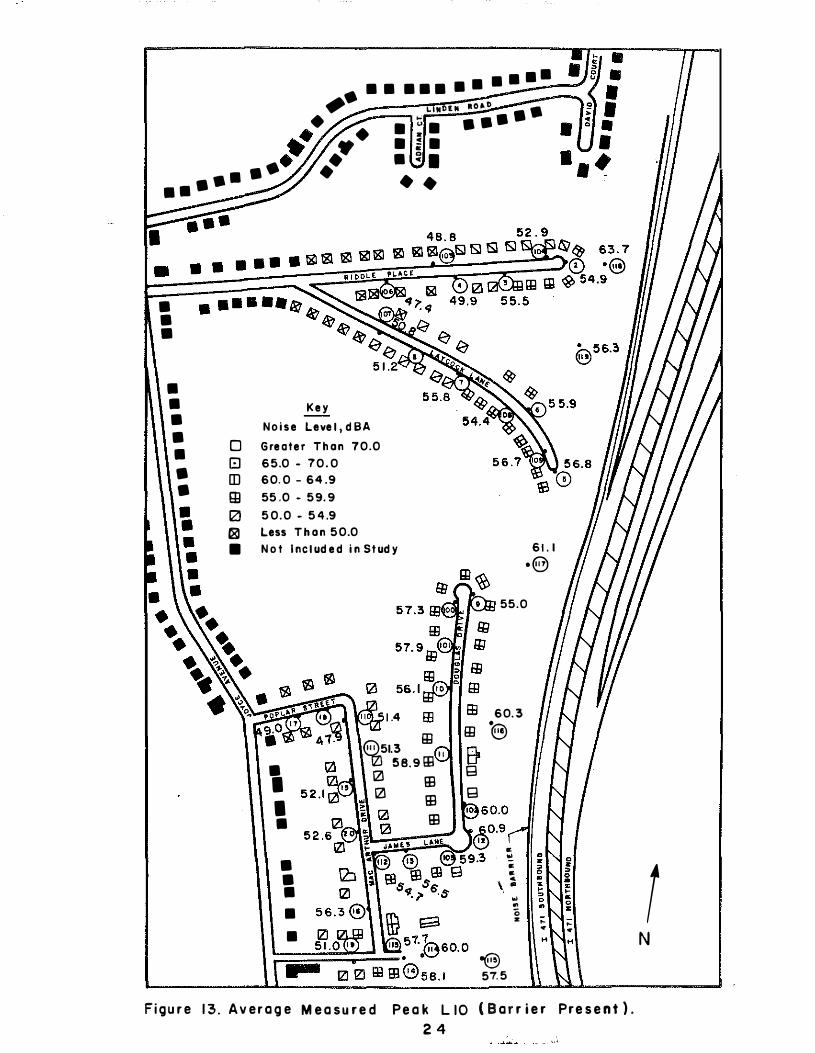
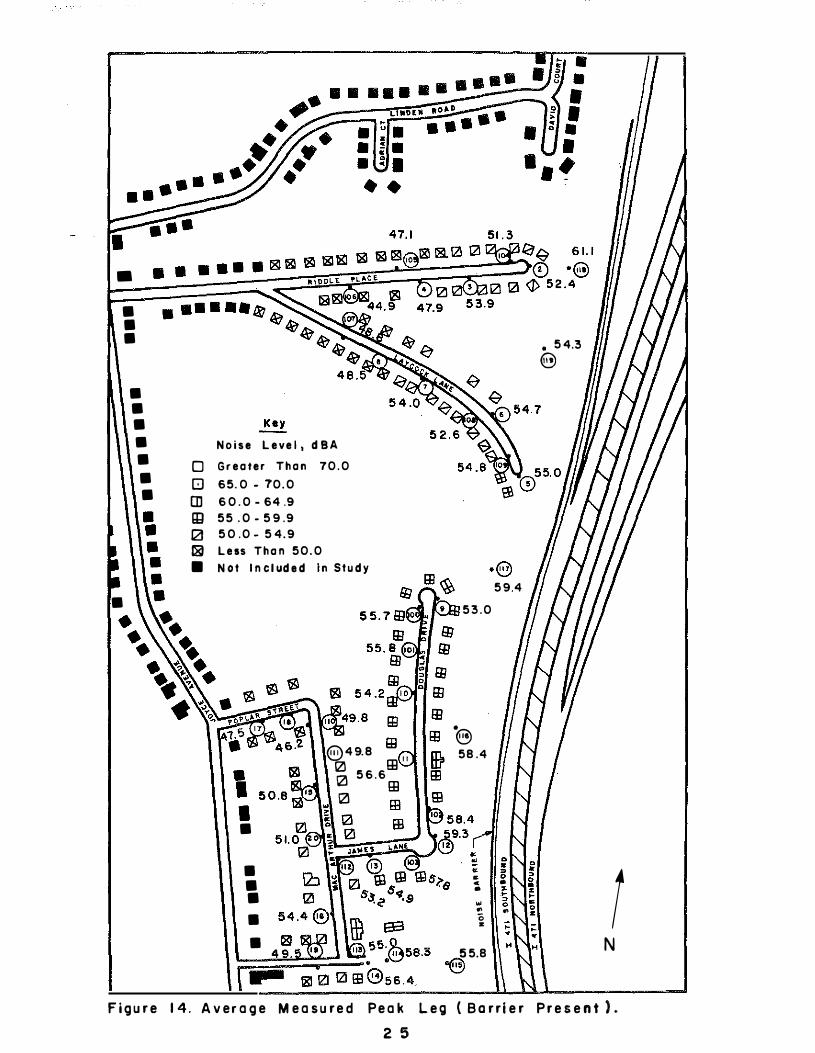
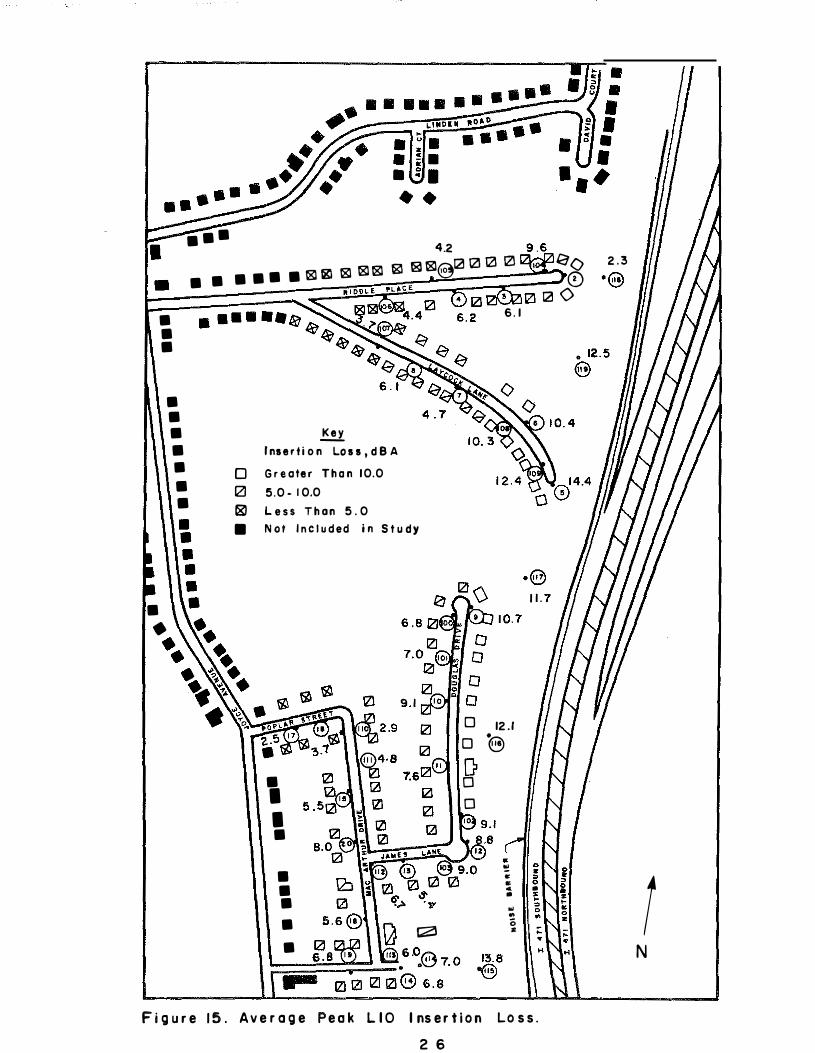
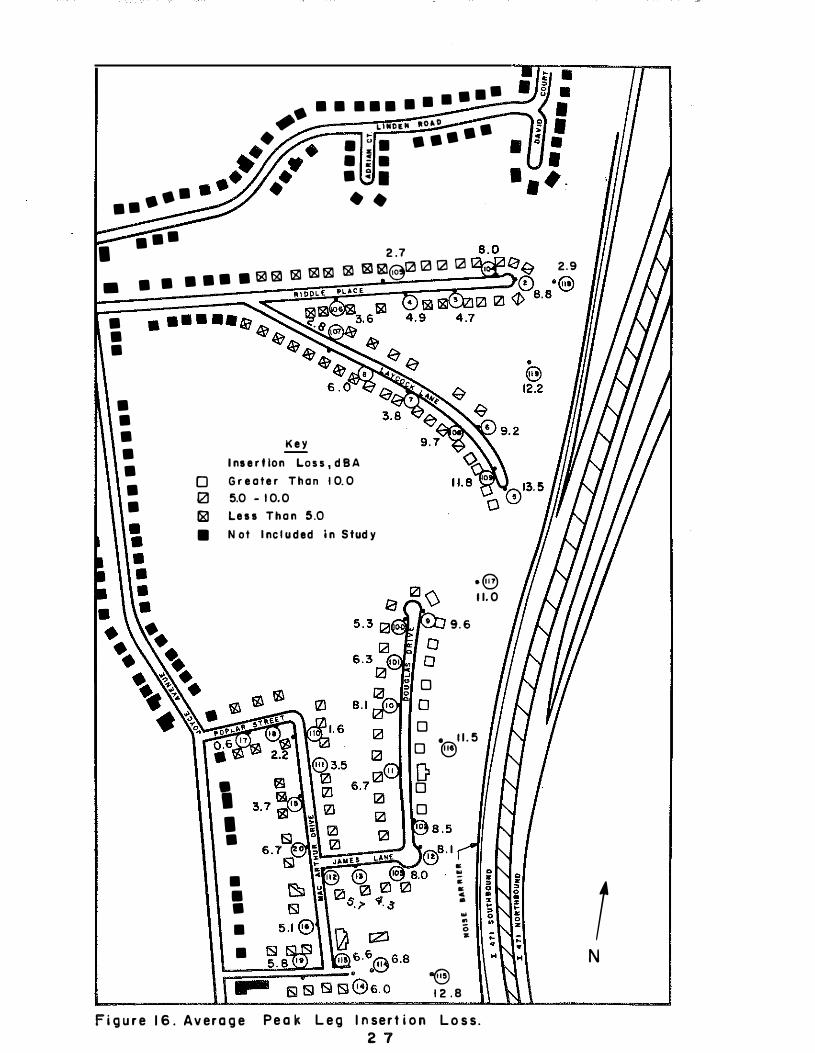
Predicted and m ea sured 110 and Leq average noise levels for peak t ra ffic conditions are given in Ta ble 4 . Corresponding average hourly volumes for I 4 7 1 are given in Ta ble C-2 . Total peak tra ffic volumes over the data collection period averaged 4 , 592 autom obiles per hour , 2 light t rucks per hour , 68 medium trucks per hour, and 3 5 heavy trucks per hour . Figures 1 1 and 1 2 show average predicted 110 and Leq noise levels , respectively , if no ba rrier were presen t . Figures 1 3 and 1 4 show average m easured 11 0 and Leq existing peak noise levels , respectively . Insertion loss estima tes under peak tra ffic conditions for 11 0 and Leq noise levels are shown in Figures 1 5 and 1 6 , respectively .
The effect of the noise ba rrier on tra ffic noise reaching residences for peak conditions is shown in Table 5 . For noise levels predicted by the STAMINA 2 .0 model if no barrier were presen t , 12 of 108 residences (1 1 percent ) would experience an 110 noise level grea ter than or equal t o 7 0 . 0 dBA , while another 4 6 residences (43 percent) would experience 110 levels from 60 . 0 to 69 . 9 dBA. For the existing situa t ion with a ba rrie r , no residences had peak-hour 110 levels m easured a t 7 0 . 0 dBA or m ore; only 5 residences ( 5 percen t ) had measured 110 levels between 60 . 0 and 69 . 9 dBA. Sim i la rly , 46 residences ( 43 percent) had predicted Leq levels for peak conditions from 60 . 0 to 6 9 . 9 dBA, while there were no residences with m easured Leq levels of 60 . 0 dBA or greater with the ba rrier present .
Peak hour insertion loss estima tes for study site residences are given in Ta ble 6 . Twenty-one residences (20 percent) experienced a peak 110 insertion loss of 1 0 . 0 dBA or mor e , while another 63 res idences (58 percent) were estimated to receive an 110 insertion loss of 5 . 0 to 9 . 9 dBA. Sima lar ly , 1 5 residences (1 4 percent) experienced an Leq insertion loss of 1 0 . 0 dBA or m ore , while 58 residences (54 percent) experienced a peak Leq insertion loss of 5 . 0 to 9 . 9 dBA.
MEASURED VERSUS PREDICTED INSERTION LOSS
One obj ective of this study wa s to determine whether computer estimates of insertion loss were being achieved. Field m ea surem ents were used to check the a ccura cy of predicted insertion losse s . To compare predicted with m ea sured insertion los s , the STAMINA 2 . 0 m odel wa s used to predict noise levels with the noise ba rrier in pla c e .
A summa ry of insertion loss using both field measurements a n d STAMINA 2 . 0 to determine noise levels with the ba rrier is shown in Ta ble 7 . Comparisons are given for both 110 and Leq noise levels and for both peak
7
and off-peak traffic conditions. Average insertion loss is given for each noise level and time period.
In three of four cases, the insertion loss using measured values was more than that using predicted values. However, there were only small differences between the compared values with the largest being 2.0 dBA.
There were only small differences between peak and off-peak and LlO and Leq insertion loss values. The LlO insertion loss values were slightly
higher than the Leq values. The insertion loss for off-peak was slightly
higher than peak using measured values while peak was slightly higher than off-peak using predicted values.
This analysis shows that insertion loss values predicted by the STAMINA 2.0 computer program will be achieved by the noise barrier.
S URVEY OF COMMUNITY PERCEPTION
A survey of community perception of the noise barrier was conducted among residents of the homes included in the analysis. A questionnaire and
accompanying cover letter explaining the purpose of the survey, along with a postage-paid return envelope, were mailed to residents in the study area. Those were the same residences included in the area covered by the field measurements.
The questionnaire consisted of common questions asked of residents in
similar noise-barrier evaluations (3, 4, 5, 6, 7, 8). Questionnaire topics included awareness of the barrier, highway-related problems with the barrier, activities affected by the barrier, and the general effectiveness of the noise barrier as perceived by residents of the neighborhood. The cover letter and questionnaire are contained in Appendix E.
Of 103 questionnaires delivered, 66 (64 percent) were returned; 49 (48 percent) were returned initially and 17 of 54 follow-up questionnaires (31 percent) were returned by residents who did not respond initially.
Responses showed that the affected homes were in an old and established neighborhood. The average length of residence was 18 years with an average
of three persons per home. Ninety-eight percent of the respondents owned their homes.
Ninety-six percent of the respondents described the neighborhood as quiet or very quiet before the roadway and barrier were constructed, while only 34 percent felt it to be quiet or very quiet after construction of the roadway and barrier. Ninety-eight percent of the respondents were aware the
-barrier existed; of those, 63 percent learned about the barrier by observing its construction, while 19 percent learned of the barrier from the newspaper.
Concerning the effect of the 78 percent of the respondents improvement in reducing highway
noise barrier on highway-related problems, felt that the barrier made an overall
noise and 71 percent felt the barrier
8
improved their privacy. In addition, 56 percent felt the ba rrier reduced highwa y dust and dirt accumula tion and litter from vehicle s , 5 4 percent felt it reduced headlight gla r e , 52 percent felt it reduced road vibrations , and 48 percent felt it reduced road fum e s .
In relation t o va rious activities , 5 7 percent thought relaxing outdoors wa s less d ifficul t due to the presence of the barrier and 5 6 percent felt tha t conversa tion outdoors wa s less difficult . Als o , 48 percent thought sleeping wa s less difficul t , 46 percent thought conversa tion indoors wa s less difficul t , 44 percent thought relaxing indoors wa s less difficul t , and 42 percent thought telephone use wa s less difficul t . Fifty-seven percent stated the ba rrier did not a f fect the amount they used their ya rds , but 40 percent felt they would have used their ya rds less if the barrier had not been constructed .
Thirty-three percent felt the barrier limited or restricted their view, 1 7 percent thought the ba rrier wa s unsightly , 15 percent felt it crea ted a closed-in feeling , and 1 5 percent felt it ha d a detrim ental effect on the environmen t . I t should be noted tha t many respondents seemed to have d i f f iculty discriminating the benefits of the noise ba rrier from the impa ct of the roadwa y , since their construction wa s coincidenta l . Thus , many of the nega tive answers and comments directed towa rd the noise ba rrier were actua l ly directed toward construction of the roadway.
Seventy-eight percent of the residents who responded to the survey considered the a ppearance of the ba rrier to be a cceptable; 12 percent thought it to be unsightly , while 10 percent thought it to be a ttractive . Compared to having no noise ba rrier , 5 0 percent felt the ba rrier wa s very e ffective in reducing tra f fic noise and 4 5 percent thought i t wa s som ewha t ef fect ive . In rela tion to property va lues , 5 7 percent felt the barrier had no effect , while 2 7 percent felt their property decreased in va lue and 1 6 percent felt tha t i t increased. Overall , 64 percent o f those responding genera lly liked the noise ba rrier, 13 percent disliked i t , and 2 3 percent had no opinion.
SUMMARY
The STAMINA 2 . 0 computer program wa s ca librated using a m odel of the study site so that i t could be used to predict noise levels a ssum ing the noise ba rrier wa s not present. Noise measur ements were then obtained a t 39 receiver locations during both peak and off-peak tra ffic conditions . Tha t a llowed insertion loss est ima tes to be ma d e .
The noise barrier reduced noise levels reaching the adjacent residences substantia l ly . For exam ple , 21 residences (20 percent of the total in the s tudy area ) experienced a peak 110 insertion loss of 1 0 dBA or more , while another 63 res idences (58 percent) were estimated to receive an 1 1 0 insertion loss o f 5 . 0 to 9 . 9 dBA. Also , the STAMINA 2 . 0 m odel predicted (with no barrier present) tha t 12 residences ( 1 1 percent) would experience peak 1 1 0 noise levels grea ter than or equa l to 70 dBA while another 46 residences ( 43 percent) would experience levels from 60 . 0 to 69 . 9 dBA. Mea surem ents found tha t no residences had peak 1 1 0 levels of 70 dBA or m ore and only 5 residences ( 5 percen t ) ha d levels between 6 0 . 0 and 69 . 9 dBA.
9
Noise levels with the barrier in place wer e pr edicted using the STAMINA 2 . 0 model . Compar isons of inser tion loss using both measured levels and pr edicted values wer e close. The analysis indicated that insertion loss values predicted by the STAMINA 2 . 0 computer progr am will be achieved by the noise barr ier .
Of 1 03 questionnair es m ailed to residences to determine their perception of the barr ier , 66 (64 percent) were returned . The community per ception of the barr ier was favorable . Overal l , 64 percent of those responding to the survey generally liked the noise barrier , 13 percent disliked it and 2 3 percent had no opinion. Compared to having no noise barrier , 50 percent felt the barrier was very effective in reducing traffic noise and 45 percent thought it was som ewhat effective.
IMPLEMENTATION
Traffic noise measurem ents and data analyses summar ized in this report show that the I-471 noise barr ier has resulted in a substantial reduction in traffic noise for the affected homes . The success of this noise barrier in providing its pr edicted inser tion loss proves that noise barr ier s provide an e ffective traffic noise abatem ent alternative. The construction of addi tional barr iers should be considered as a viable noise abatement m easur e . Results of this study m ay be used in futur e public hear ings to illustrate the potential effectiveness of proposed noise barr ier s .
REFERENCES
1 . Bowl by , W.; Higgins , J .; and Reagan, J .; "Noise Barr ier Cost u.s. Reduction Procedur e , STAMINA 2 . 0/0PTIMA: User's Manual" ,
Depar tm ent of Tr anspor tation, Federal Highway Adm inistration, Repor t No. FHWA-DP-58-1 , Apr i l 1982.
2 . Agent , K. R.; "Vehicle Noise Em ission Levels in Univer sity of Kentucky Transpor tation Research Progr am , UKTRP-81-1 3 , July 1 98 1 .
Kentucky" , Repor t No .
3 . Perfater , M . A .; " Community Perception of Noise Barr ier s , Volume 1 " , Virginia Highway and Trans por tation Research Counci l , Repor t No . VHTRC 80-R1 4 , Septem ber 1979 .
4 . Hal l , F . L . ; "Attitudes toward Noise Barr ier s before and after Construction" , Transpor tation Research Boar d , Transpor tation Research Record 740 , 1980 .
5 . Bar a s s , A . N.; and Cohn, L . F .; " Noise Abatement and Public Policy Decision s : A Case Study I-440 in Nashville" , Tr anspor tation Research Boar d , Tr ansportation Research Record 789 , 1981 .
6 . Cohn, L . F .; "Highway Noise Barr ier s " , Tr anspor tation Research Boar d , NCHRP Re por t No . 87 , Decem ber 1 981 .
10
7. "An Iowa Noise Barrier: Sound Levels, Air Quality and Public Acceptance", Office of Project Planning, Planning and Research Division, Iowa Department of Transportation, February 1983.
8. "A Determination of Noise Barrier Effectiveness along I-285 in Atlanta, Georgia", Office of Environmental Analysis, Georgia Department of Transportation, 1983.
11
F igure 1. Noise Barrier, Interstate 471, Campbell County, Kentucky.
12
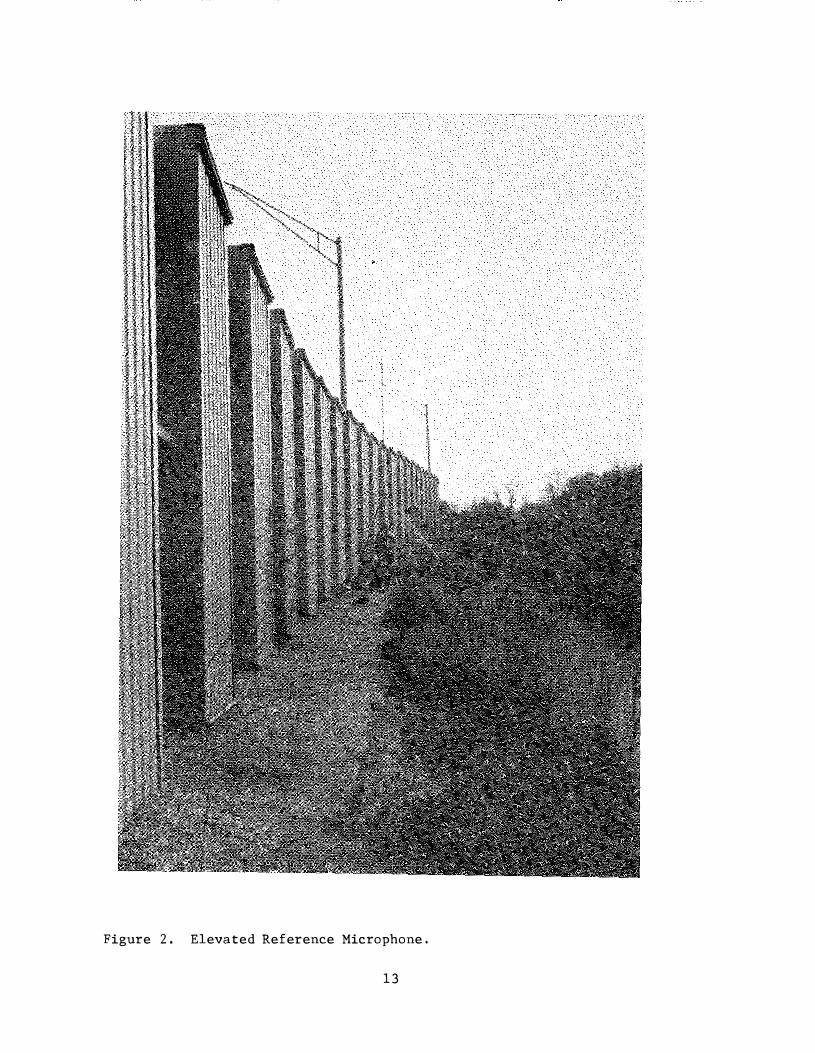
Figure 2 . Elevated Reference Microphone.
13
... II) ... ... c
m
II) "' 0
z
PLAN
Reference Microphone Study Site
Microphone ----------------- ··-------
Microphone
Study Site Microphone
ELEVATION
Figure 3. Reference Microphone Positioning. . "
I •••
•
• • •
• • • • • • •
• •
• • • •• • 0 0 0 DO 0 0 oeo 0 0 0 I
' I •
• • • •
@) 0 0
0
• 0 1!!3
.. ooooe
0 0
0
0 •
0 8 Q 0
• fi 0 •
Figure 4. Field Measurment Receiver .
Locations.
I 5
r N
I
• • •
• • • • • • •
0 13 rn IB 0 181 •
Key
Noise Level dBA
Greater Than 70.0
65.0-70.0
6 0.0-64.9
55.0-59.9
50.0-54.9
Less Than 50.0
Not In cluded in Study
@) 56.0
• t!l t!l I t!l
I � t!l � g • • 0
g
• • • • c;::J •
Figure 5. Average Predict ed Off- Peak 16
·8 71.5
8 8
8
IJ •
8 8 [)70.4
IJ IJ
•
! � • • � 0 a ;: ;: • •
66.8 " " N
-@)
LIO (No· B arrier l.
#. 1111 111111 1111 111111.
• L.INDUI ftOioD
• • 11�11 •••••
.. . -��� all a• •• II � I
••• • •
I •••
• • •
• • • • • • •
0 [!] m til IZJ !gl •
Key
Noise Level, dBA
Greater Than 7 65
0.0 .0 -70.0
60.0 - 64.9
55.0- 59.9
50.0 -54.9
Less Than 50.0
Not Included
' I •
II • • II II
B B B
·@) 60.4
8 8
8
El • 6 7.1
El 8 E} El [!]
• !0' c • • = • 0 c e • : • w = • 0 0 • • ;: •
65.3 ... -€)
! N
Figure 6 . Average Predicted Off- P eak
I 7 Leg ( No B arriers l
# ••• ••• ••••••
• LIMDlM ltOjl. D .... . . ;. ····· •"" .. . . .
•• •• .• • � I
••• • •
I •••
•
• • • • • • •
• •
Key
N oise Level, dBA
0 Greater Than 70.0 (J 65.0- 70.0 rn 6 o .o -64.9 Q;l 55 .0-5 9 .9 121 50.0 -54.9 li.SI Less Than 50.0
• Not lnclu ded in Study
' I •
• • •
ffi ffi
I& m m
·8 59.7
5 2.5
• 59.0
@>
• � • • • •
55. 2 -8
r N
Figure 7 A verage Measured Off- Peak L IS
I 0 (Barrier Present).
••• ••• •• • •••
• # . LINDlN 1110 ... 0
. . . �- ····· ·" . . �. •• •• .• a � I
••• • •
••• I •
45.1 51. 0
• • • •• -�� � �1:1!1 � ��et!!l�� 0 (;:]� 5 7.1
0 •@) 0 0 <:]>49.2
• • •
• • • • • • •
. .. ... ..,. "' /!ij .
;>
0 0 rn 9l IZI 181 •
/!ij/!ij �� � . Key 4 7
Noise Level, dBA .
Greater Than 7 0.0
65.0- 7 0. 0
60.0- 64.9
5 5 . 0 - 59 .9
50.0 - 54.9 Less Than 5 0.0
Not Included in Study
' I •
• • • • •
• 53.4
@)
5 7 . 2
·@> 50.9
IB 57.0
E8 • 8
I& 0 0
EB IB
0
& • • w � ;; &
-63.0 •
t N
Figure 8. Average Measured Off- Peak Leg { Barrier Present). 19
I
••• ••• •• ••••
• ((/If _ L.INOlN JIOJ-0 .... . . �· ····· ... . . . .
.. ..
..
. �. ••• • •
•••
•
• • • • • • •
0 l2l � •
Key
Insertion Lass,dBA
Greater Than 10. 0 50.-10.0 Less Than 5. 0
Not In cluded in Study
' I •
• • • •
@7.8 Ill 9.612]" Ill IZl Ill IZl Ill Ill IZl
11.6 0
0 0
0 11.4 0 • (§ [} 0 0
-(§)
• � • • 4 • w • 0 =
13.6
·@ 11.8
.. � Off- Peak Figure 9 . Averan• L I O Insertion L oss. 20
1 N
••• ••• •• ••••
• # L.INDlM ttO ... O
�· . . �- ····· .. . . �· •• • • � I ••• • •
•• • •
••• I •
4.2
• • • • • • 8 181 18! 181 \81 18! 18118i(§IZIIZI IZl 121 I
• • •
• • • • • • •
0 IZI !lSI •
Key
Insertion Loss, dBA
Greater Than 10.0
5.0- 10.0
Less Than 5.0
Not Included in Study
' I •
• • !2J • IZl • •
121
Figure 10. Average Off- Peak L.eg I nsertion 21
0 • , c c
0 • • • • , w 0 • • ;; • ; •
H
Loss.
0 • , t
0 • • • c 0 •
; • H N
••••••••••••
• # L.\MO!.N ,_olO . . . �- ····· .. . . �·
••• •• •• • � I
•• • •
I •••
• • •
• • • • • • • • • • • • • ••
Key
Noise Level' d BA
0 Greater Than 70_0
[!] 65. 0-70.0
rn so.o -64.9
Hl 55.0-59.9
121 5 0.0 -54.9
181 1-••• Than 50.0
• Not In clued ed in Study
•• •.\ .. w '•
• II 54.3
• m I I • g
• • • • •
0 0 0
t;;l
·® 72.8
0
0 0
-82.4 ,.
[} 0 0
0 • , 0 • � .. , w 0 • • 0 • ;: • H
71.3
-e
0 • , 0 • � .. c 0 • ;: • H
Figure II. Average Predicted P eak L I O ( No Barrier). 2 2
r N
# ••• ••• ••••••
• L.\NO!N ,rtO ... II
. . . �- ····· .. . . �·
a•• •• .• • � I
•• • •
••• I •
49.6 59.3
• • • • • • !&! !&! !&! !&! !&! !&! !&! f&!§IZI r2l Ill Ill I
• • •
• • • • • • •
• •
Figure 12.
0 [!) rn !l3 0 181 •
Key
No lse Level, d BA
Greater Than 70.0
65.0-70.0 60.0-64 .9 55.0-59.9 50.0 -54.9
Less Than 50.0
Not Included in Stud y
• I g
I g
• 9l B
• • • • B CJ • 11! G\·�8
• .u 65.1
... Ill Ill g g @62.4
El El [} El 8
Average P redicted Peak Leg 2 3
·8 70.4
.8 69.9
0 • = • 0 • • • • • w = 0 � 0 � • ; •
"
-8 66.6
(No Barrier).
r N
••
• • •
• • • • • • •
•• •••• •
• • ••• # . I.IMDlM aoolO
••
. .� . . .. .... . . ; . •• •• • s. •
•• •• • ••
0 r::J !D 8:l IZJ 181 •
Key
Noise Level, dB A
Greater Than 70.0 65.0 - 70.0 60. 0- 64.9 55.0- 59.9 50.0 - 54.9 Less Than 50.0 Not Included in Study
• I I •
• • • • •
1.4
IE @51.3 I I IZl 5 a. 91E
IZl IE IZl IE
IE
61. 1 ·®
55.0
9l
9l IE
g. B B
60.3 • e>
c � c c •
\. . .. • 0 •
-(§) 57.5
' • H
' •
.Q56.3 0
Figure 13. Average Measured Peak LI O (Barrier Present). 24
- - '·'
r N
•
• • •
• • • • • • •
• •
0 c:J [D 1±1 121 ll9 •
Key
Noise Level,dBA
Greater Than 70.0
65. 0 - 70.0
6 0 . 0 -64.9 55 . 0-59 .9 50.0-54.9 Less Than 50.0 Not Included
' I •
• • • • •
In Study
@)49.8 IZl ffl" IZl 56.6
ffl IZl
• 54.3
e
59.4
53.0
ffl •
ffl 8 I& 58.4
EB !B
� a • • =
! • a c • • • .� • = a � � 0 • ; ; • •
" H N 55.8
Figure 14. Average Measured Peak Leg ( Barrier Present).
2 5
••• 4.2 I
• • • • • • • 181 181 181 181181 181 181181@121 IZI 121 IZI I fa 0 0
Vl\.'' V>IZI 121 0 • • •
• • • • • • •
• •
Figure 15
0 IZI �
Key
lnserlion�ss,dBA
Greater Than 10.0
5.0-10.0
• Less Than 5 . 0 Nat Included o'n Study
• I I •
• • • • •
Average Peak LIO
0 0 [} 0 0
t2l
Insertion
2 6
6.1
12.1 • 8
• � a
• • • • a � • • • • • • 0 � 0 � •
Loss.
2.3
! N
# ••• ••• ••••••
• L.INDIE.M 111:0"0
..... -· . �- ·····
,. ... . �-
••••• ••• • • • �I
• •
••• 2.7 I
• • • • • • • 181181 181 181181 181 18llill@l2l I2J I2J I2J '
• • •
• • • • • • •
0 121 �ill •
Key
lnsertlonLoss' dB A
Greater Than 10.0
5.0 - 10.0
Less Than s.o Not Inclu ded in Study
·®
' I •
• • • • •
Figure 1 6 . Average
11.0
9.6
0
0 0
"811. 5 ...
[} 0
I2J 0 0
• !! • • .. • w • 0 z ; •
'€)
Peak Leg Insertion 27
12.8
Loss.
2.9
r N
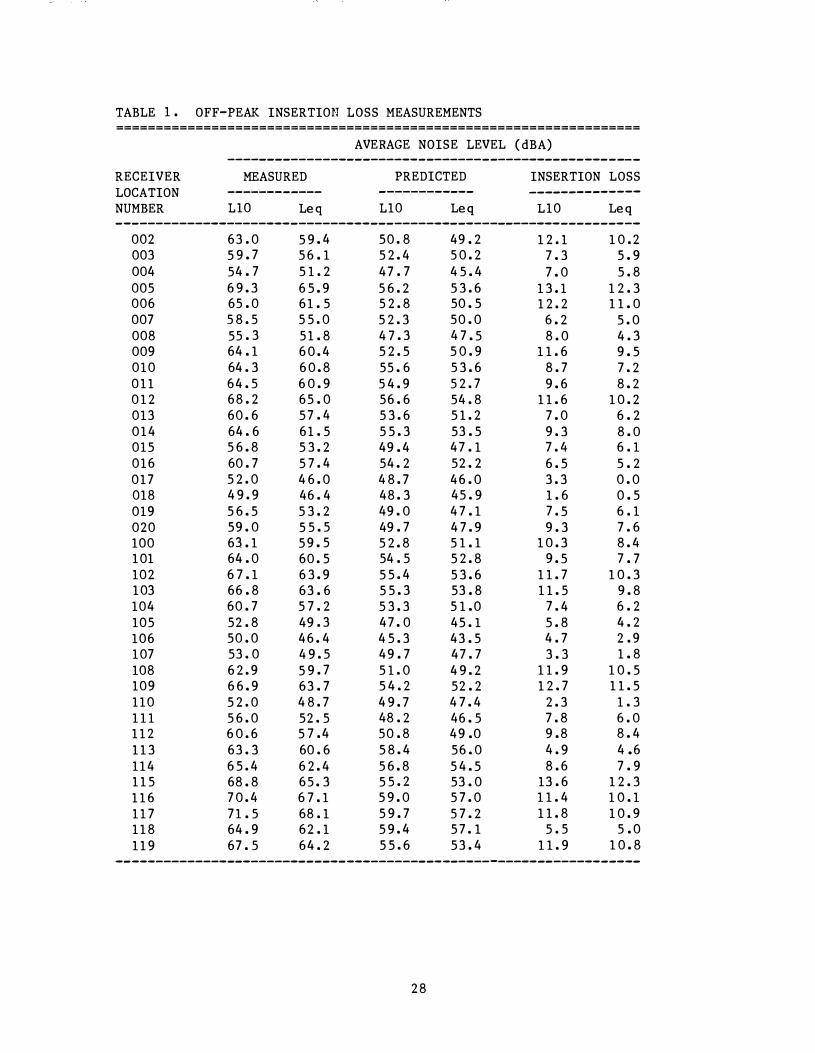
TABLE 1 . OFF-PEAK INSERTION LOSS MEASUREMENTS ==================================================================
AVERAGE NOISE LEVEL ( dBA) --------------------------------------------------- -
RECEIVER MEASURED PREDICTED INSERTION LOSS LOCATION ------------ ------------ --------------
NUMBER L10 Leq L10 Leq L10 Leq ------------------------------------------------------------------
002 63 . 0 5 9 . 4 50 . 8 49 . 2 1 2 . 1 1 0 .2 003 5 9 . 7 5 6 . 1 5 2 . 4 5 0 . 2 7 . 3 5 . 9 004 54 . 7 5 1 . 2 47 . 7 4 5 . 4 7 . 0 5 . 8 005 6 9 . 3 6 5 . 9 5 6 . 2 5 3 . 6 1 3 . 1 1 2 . 3 006 65 . 0 61 . 5 5 2 . 8 50 . 5 1 2 . 2 1 1 . 0 007 5 8 . 5 5 5 . 0 5 2 . 3 50 . 0 6 . 2 5 . 0 008 55 . 3 5 1 . 8 4 7 . 3 4 7 . 5 8 . 0 4 . 3 009 64 . 1 6 0 . 4 5 2 . 5 5 0 . 9 1 1 . 6 9 . 5 010 64 . 3 6 0 . 8 55 . 6 5 3 . 6 8 . 7 7 . 2 0 1 1 64 . 5 6 0 . 9 5 4 . 9 5 2 . 7 9 . 6 8 . 2 0 1 2 68 . 2 65 . 0 56 . 6 54 . 8 1 1 . 6 1 0 . 2 013 60 . 6 5 7 . 4 5 3 . 6 5 1 . 2 7 . 0 6 . 2 014 64 . 6 61 . 5 5 5 . 3 53 . 5 9 . 3 8 . 0 015 5 6 . 8 5 3 . 2 49 . 4 47 . 1 7 . 4 6 . 1 016 60 . 7 5 7 . 4 54 . 2 52 . 2 6 . 5 5 . 2 017 5 2 . 0 4 6 . 0 4 8 . 7 46 . 0 3 . 3 0 . 0 018 4 9 . 9 46 . 4 48 . 3 45 . 9 1 . 6 0 . 5 019 5 6 . 5 5 3 . 2 49 . 0 4 7 . 1 7 . 5 6 . 1 020 59 . 0 5 5 . 5 49 . 7 4 7 . 9 9 . 3 7 . 6 100 63 . 1 5 9 . 5 5 2 . 8 5 1 . 1 1 0 . 3 8 . 4 101 64 . 0 60 . 5 54 . 5 5 2 . 8 9 . 5 7 . 7 102 6 7 . 1 6 3 . 9 5 5 . 4 5 3 . 6 1 1 . 7 1 0 . 3 103 66 . 8 63 . 6 5 5 . 3 53 . 8 1 1 . 5 9 . 8 104 60 . 7 5 7 . 2 5 3 . 3 5 1 .0 7 . 4 6 . 2 105 52 . 8 49 . 3 47 . 0 45 . 1 5 . 8 4 . 2 106 50 . 0 46 . 4 4 5 . 3 43 . 5 4 . 7 2 . 9 107 53 . 0 4 9 . 5 49 . 7 47 . 7 3 . 3 1 . 8 108 6 2 . 9 5 9 . 7 5 1 . 0 4 9 . 2 1 1 . 9 1 0 . 5 109 6 6 . 9 63 . 7 5 4 . 2 52 . 2 1 2 . 7 1 1 . 5 110 5 2 . 0 4 8 . 7 4 9 . 7 4 7 . 4 2 . 3 1 . 3 1 1 1 5 6 . 0 52 . 5 48 . 2 46 . 5 7 . 8 6 . 0 1 1 2 6 0 . 6 5 7 .4 50 . 8 49 .0 9 .8 8 . 4 1 1 3 63 . 3 60 . 6 5 8 . 4 56 . 0 4 . 9 4.6 114 6 5 . 4 6 2 . 4 5 6 . 8 5 4 . 5 8 . 6 7 . 9 1 1 5 68 . 8 65 . 3 5 5 . 2 53 . 0 13 . 6 1 2 . 3 1 1 6 7 0 . 4 6 7 . 1 5 9 . 0 5 7 . 0 1 1 . 4 1 0 . 1 1 1 7 71 . 5 68 . 1 5 9 . 7 5 7 . 2 1 1 . 8 1 0 . 9 1 1 8 64 . 9 62 . 1 5 9 . 4 5 7 . 1 5 . 5 5 . 0 1 1 9 67 . 5 64 . 2 5 5 . 6 53 . 4 1 1 . 9 1 0 . 8
------------------------------------------------------------------
28
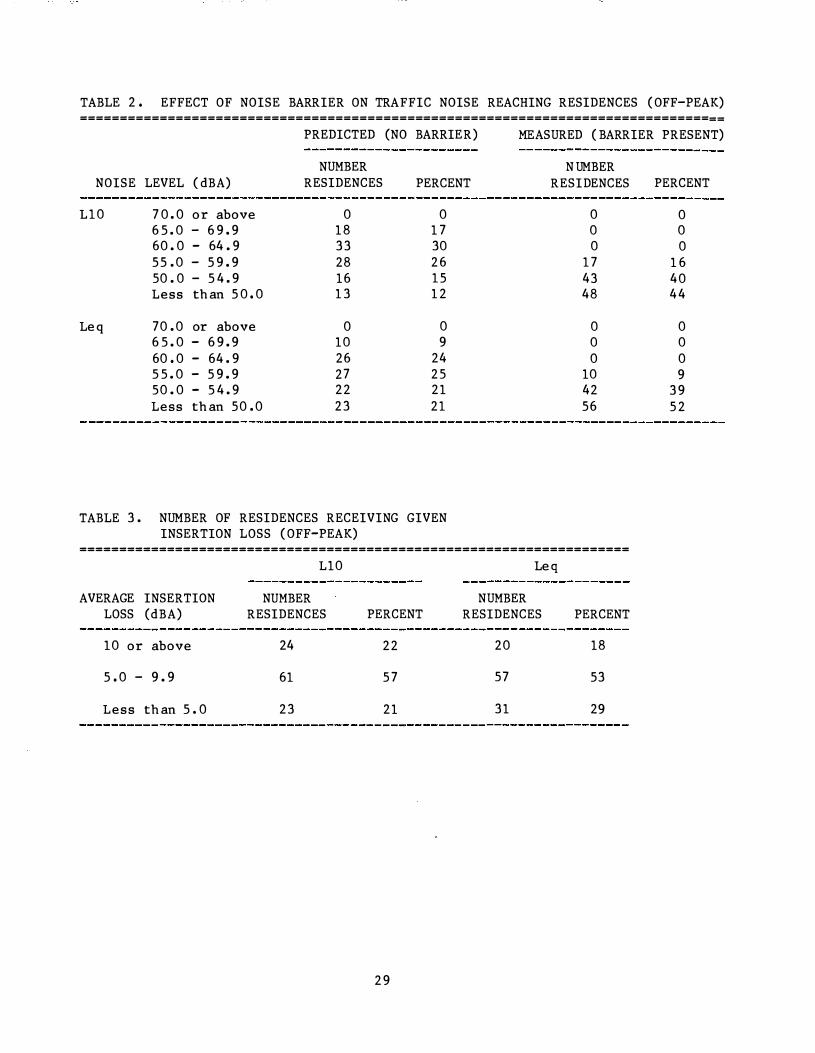
TABLE 2 . EFFECT OF NOISE BARRIER ON TRAFFIC NOISE REACHING RESIDENCES ( OFF-PEAK) ================================================================================ =
PREDICTED (NO BARRIER) ME ASURED ( BARRIER PRESENT)
NUMBER NOISE LEVEL ( dBA)
NUMBER RESIDENCES PERCENT RESIDENCES PERCENT
110 7 0 . 0 or above 0 0 6 5 . 0 - 6 9 . 9 18 1 7 60 . 0 - 64 . 9 33 30 55 . 0 - 5 9 . 9 28 2 6 50 . 0 - 5 4 . 9 16 15 Less than 5 0 . 0 1 3 1 2
Leq 70 . 0 or above 0 0 6 5 . 0 - 6 9 . 9 10 9 60 . 0 - 64 . 9 26 24 5 5 . 0 - 5 9 . 9 27 25 50. 0 - 5 4 . 9 22 21 Less than 50 . 0 23 21
TABLE 3 . NUMBER OF RESIDENCES RECEIVING GIVEN INSERTION LOSS ( OFF-PEAK)
0 0 0
1 7 43 48
0 0 0
10 42 56
=====================================================================
AVERAGE INSERTION LOSS (dBA)
10 or above
5 . 0 - 9 . 9
Less than 5 . 0
L10
NUMBER RESIDENCES
24
61
23
PERCENT
22
5 7
21
2 9
Leq
NUMBER RESIDENCES
20
57
31
PERCENT
18
53
29
0 0 0
1 6 40 44
0 0 0 9
3 9 5 2
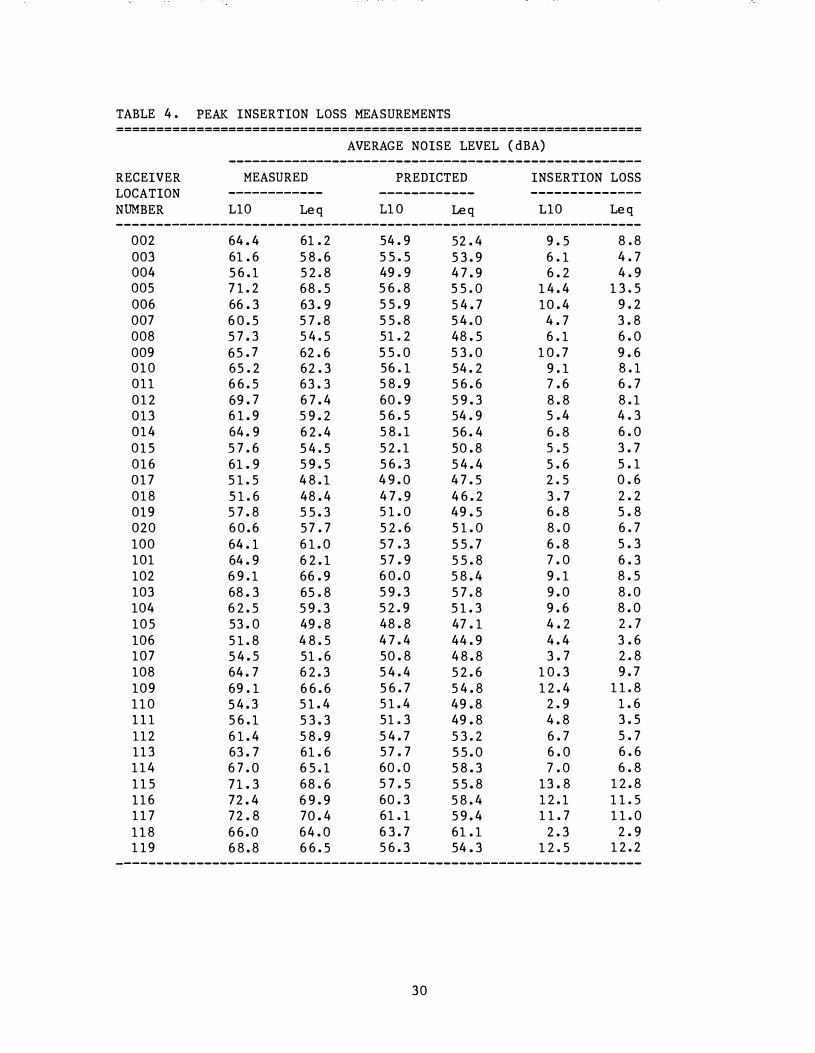
TABLE 4 . PEAK INSERTION LOSS MEASU REMENTS ==================================================================
AVERAGE NOISE LEVEL ( dBA) ----------------------------------------------------
RECEIVER MEASURED PREDICTED INSERTION LOSS LOCATION ------------ ------------ --------------
NUMBER L10 Leq 1 1 0 Leq 110 Leq ----------------------- --------------------- ----------------------
002 64 . 4 61 . 2 54 . 9 52 . 4 9 . 5 8 . 8 003 61 . 6 5 8 . 6 5 5 . 5 5 3 . 9 6 . 1 4 . 7 004 5 6 . 1 5 2 . 8 49 . 9 4 7 . 9 6 . 2 4 . 9 005 7 1 . 2 68 . 5 5 6 . 8 5 5 . 0 1 4 . 4 1 3 . 5 006 66 . 3 63 . 9 5 5 . 9 5 4 . 7 10 . 4 9 . 2 007 6 0 . 5 5 7 . 8 5 5 . 8 5 4 . 0 4 . 7 3 . 8 008 5 7 . 3 5 4 . 5 51 . 2 48 . 5 6 . 1 6 . 0 009 65 . 7 62 . 6 5 5 . 0 5 3 . 0 1 0 . 7 9 . 6 010 65 . 2 62 . 3 56 . 1 54 . 2 9 . 1 8 . 1 011 6 6 . 5 63 . 3 5 8 . 9 5 6 . 6 7 . 6 6 . 7 0 1 2 69 . 7 6 7 . 4 60 . 9 5 9 . 3 8 . 8 8 . 1 013 6 1 . 9 5 9 . 2 5 6 . 5 54 . 9 5 . 4 4 . 3 014 64 . 9 6 2 . 4 5 8 . 1 56 . 4 6 . 8 6 . 0 0 1 5 5 7 . 6 5 4 . 5 5 2 . 1 50 . 8 5 . 5 3 . 7 016 61 . 9 5 9 . 5 5 6 . 3 5 4 . 4 5 . 6 5 . 1 017 5 1 . 5 4 8 . 1 4 9 . 0 4 7 . 5 2 . 5 0 . 6 018 5 1 . 6 48 . 4 4 7 . 9 4 6 . 2 3 . 7 2 . 2 019 5 7 . 8 5 5 . 3 5 1 . 0 49 . 5 6 . 8 5 . 8 020 6 0 . 6 5 7 . 7 5 2 . 6 5 1 . 0 8 . 0 6 . 7 100 64 . 1 6 1 . 0 5 7 . 3 5 5 . 7 6 . 8 5 . 3 101 64 . 9 6 2 . 1 5 7 . 9 5 5 . 8 7 . 0 6 . 3 102 6 9 . 1 66 . 9 6 0 . 0 5 8 . 4 9 . 1 8 . 5 103 68 . 3 65 . 8 5 9 . 3 5 7 . 8 9 . 0 8 . 0 104 6 2 . 5 5 9 . 3 5 2 . 9 5 1 . 3 9 . 6 8 . 0 105 53 . 0 49 . 8 48 . 8 47 . 1 4 . 2 2 . 7 106 5 1 . 8 4 8 . 5 4 7 . 4 44 . 9 4 . 4 3 . 6 107 5 4 . 5 51 . 6 50 . 8 4 8 . 8 3 . 7 2 . 8 108 64 . 7 6 2 . 3 5 4 . 4 5 2 . 6 1 0 . 3 9 . 7 109 69 . 1 6 6 . 6 5 6 . 7 5 4 . 8 1 2 . 4 1 1 . 8 1 1 0 5 4 . 3 5 1 . 4 5 1 . 4 49 . 8 2 . 9 1 . 6 1 1 1 5 6 . 1 5 3 . 3 51 . 3 49 . 8 4 . 8 3 . 5 112 6 1 . 4 5 8 . 9 5 4 . 7 5 3 . 2 6 . 7 5 . 7 113 63 . 7 61 . 6 5 7 . 7 5 5 . 0 6 . 0 6 . 6 1 1 4 6 7 . 0 6 5 . 1 60 . 0 5 8 . 3 7 . 0 6 . 8 1 1 5 7 1 . 3 68 . 6 5 7 . 5 5 5 . 8 13 . 8 1 2 . 8 1 1 6 72 . 4 6 9 . 9 60 . 3 5 8 . 4 1 2 . 1 1 1 . 5 1 1 7 72 . 8 70 . 4 61 . 1 5 9 . 4 1 1 . 7 1 1 . 0 1 1 8 6 6 . 0 64 . 0 6 3 . 7 61 . 1 2 . 3 2 . 9 1 19 6 8 . 8 6 6 . 5 5 6 . 3 54 . 3 1 2 . 5 1 2 . 2
------------------------------------------------------------------
30
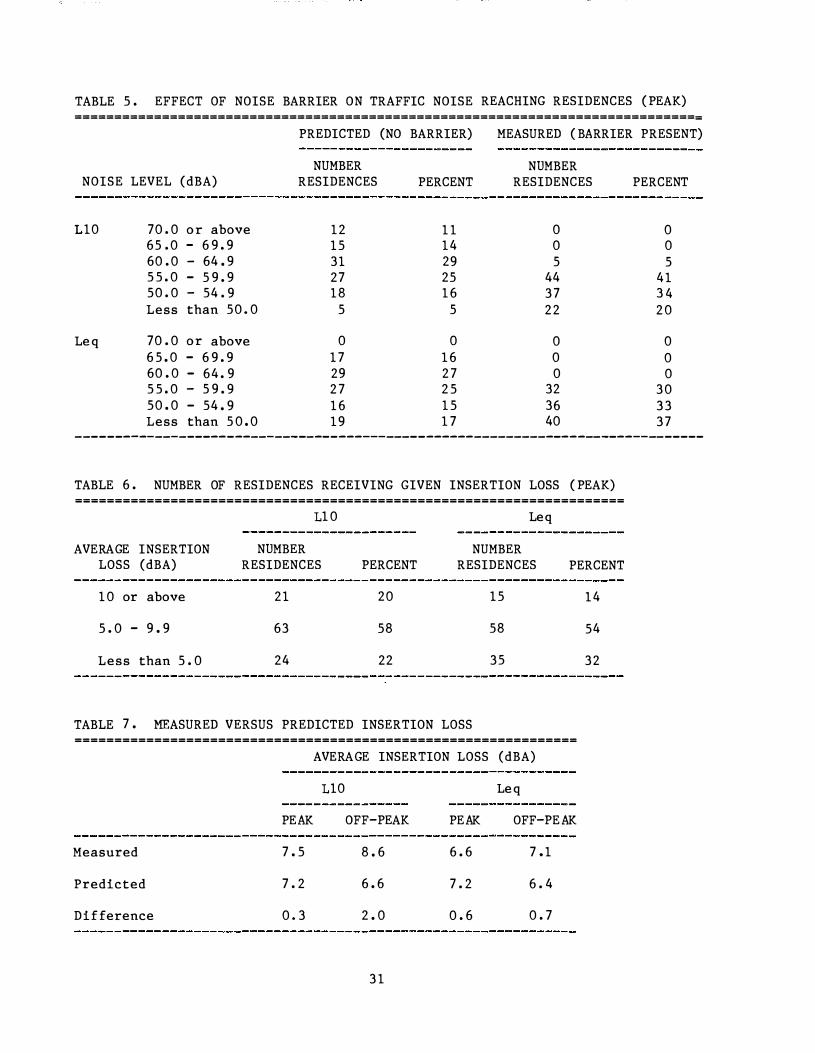
TABLE 5 . EFFECT OF NOISE BARRIER ON TRAFFIC NOISE REACHING RESIDENCES (PEAK) ===============================================================================
PREDICTED (NO BARRIER) MEASURED ( BARRIER PRESENT)
NOISE LEVEL (dBA)
L10 70 . 0 or above 65 . 0 - 6 9 . 9 60 . 0 - 64 . 9 5 5 . 0 - 5 9 . 9 50 . 0 - 54 . 9
Less than 50 . 0
Leq 70 . 0 or above 6 5 . 0 - 6 9 . 9 60 . 0 - 64 . 9 5 5 . 0 - 5 9 . 9 50 . 0 - 54 . 9 Less than 5 0 . 0
NUMBER RESIDENCES
1 2 1 5 31 27 1 8
5
0
1 7 29 2 7
1 6 1 9
PERCENT
1 1 14 29 25 1 6
5
0
1 6 2 7 2 5
1 5 1 7
NUMBER RESIDENCES
0 0
5 44 3 7
2 2
0
0 0
32
36 40
PERCENT
0 0
5 4 1 3 4
2 0
0
0 0
3 0
3 3 3 7
------------------- --------- ---------------------------------------------------
TABLE 6 . NUMBER OF RESIDENCES RECEIVING GIVEN INSERTION LOSS ( PEAK) =====================================================================
11 0 Leq
AVERAGE INSERTION LOSS (dBA)
NUMBER RESIDENCES PERCENT
NUMBER RESIDENCES PERCENT
1 0 or above 2 1 20 1 5 14
5 . 0 - 9 . 9 63 58 58 54
Less than 5 . 0 24 22 35 32
TABLE 7 . MEASURED VERSUS PREDICTED INSERTION LOSS ===============================================================
AVERAGE INSERTION LOSS (dBA)
110 Leq
PEAK OFF-PEAK PEAK OFF-PEAK
Measured 7 . 5 8 . 6 6 . 6 7 . 1
Predicted 7 . 2 6 . 6 7 . 2 6 . 4
Difference 0 . 3 2 . 0 0 . 6 0 . 7
3 1


APPENDIX A
RECEIVER COORDINATES
33

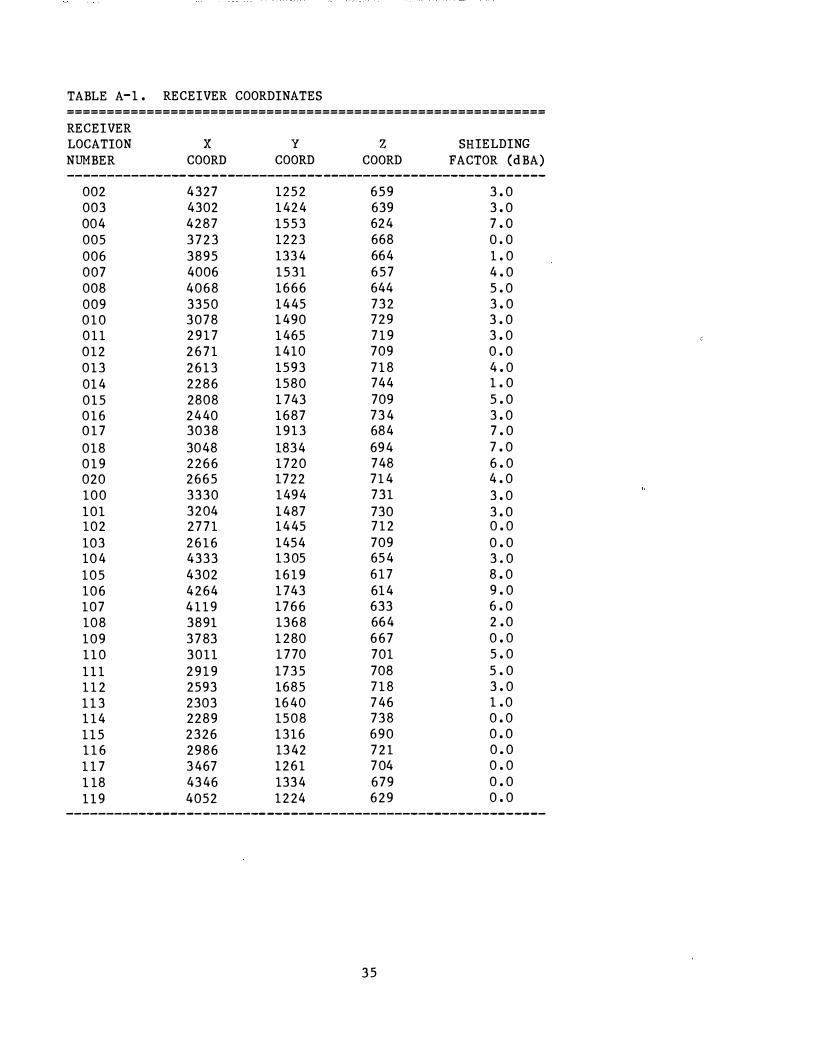
TABLE A-1 . RECEIVER COORDINATES ============================================================
RECEIVER LOCATION X y z SHIELDING
NUMBER COORD COORD COORD FACTOR (dBA)
--------------- ---------------------------------------------
002 4327 1252 659 3 . 0 003 4302 1424 639 3 . 0 004 4287 1553 624 7 . o 005 3 7 2 3 1223 668 o . o 006 3895 1334 664 1 . 0
007 4006 1 5 3 1 6 5 7 4 . 0 008 4068 1666 644 5 . 0
009 3350 1445 732 3 . 0 0 1 0 3078 1490 7 2 9 3 . 0 0 1 1 2 9 1 7 1465 7 1 9 3 . 0
0 1 2 2 6 7 1 1410 709 0 . 0
0 1 3 2 6 1 3 1593 7 1 8 4 . 0
014 2286 1580 744 1 . 0
0 1 5 2808 1 743 709 5 . 0
0 1 6 2440 1687 734 3 . 0 0 1 7 3038 1 9 1 3 684 7 . 0
0 1 8 3048 1834 694 7 . 0
0 1 9 2 2 6 6 1 7 2 0 748 6 . 0 020 2665 1722 714 4 . 0
100 3330 1494 731 3 . 0 1 0 1 3204 1487 730 3 . 0 102 2 7 7 1 1445 7 1 2 0 . 0
103 2 6 1 6 1454 709 0 . 0 104 4333 1 3 05 654 3 . 0
105 4302 1 6 1 9 6 1 7 8 . 0
106 4 2 64 1 743 614 9 . 0
107 4 1 1 9 1 7 6 6 633 6 . 0
108 3891 1368 664 2 . 0
1 0 9 3 7 83 1 280 6 6 7 0 . 0
1 1 0 3 0 1 1 1 7 70 701 5 . 0
1 1 1 2 9 1 9 1 7 3 5 708 5 . 0
1 1 2 2593 1685 7 1 8 3 . 0
1 1 3 2303 1640 746 1 . 0
1 14 2289 1508 738 0 . 0
1 1 5 2 3 2 6 1 3 1 6 6 9 0 0 . 0
1 1 6 2986 1342 7 2 1 0 . 0
1 1 7 3467 1 2 6 1 7 04 0 . 0
1 18 4346 1334 679 0 . 0
1 1 9 4052 1 2 24 6 2 9 0 . 0
-------------------------------------------------------- ----
3 5


APPENDIX B
OUTPUT FROM STAMINA 2 . 0
3 7

S T A � I N A 2 , 0/BCR fHWA �EPSION !�ARCH 1 98 2 )
TRAff i C NOISE PRED I CT ION �ODEL
DE�ELOPED UNDER CONTRACT BY BBN
! INPUT UN I T S • ENGL I SH • OUTPUT UN I TS• ENGL I SH )
EVALUA T ION Of TRAff i C NO I SE BARR I ER 1 •4 7 1 CA�PBELL C O .
P�OGRA� I N I T I AL I Z A T I ON PARAMETERS
R S • l
RS•Z
RS-3 RS•4 RS•S
RS-6 RS•7
RS•8
RS•dA
HE I GHT o . o
1 . 0 0
o . o
e . o o
2 . 30
o . o
o . o
2 . 380
a . o oo
ROADwAY 2
COOE DESC R I P T I ON I RECEIVER H E I GHT ADJUSTMENT
2 A•WE I GHTED SOUND LEVEL ONLY
3 HE I GHT ADJUSTMENT fOR PASSENGER CARS
4 H E I GHT AOJUSTHENT FOR HEA�Y TRUCKS 5 HE I GHT ADJUSTMENT fOR MEDIUM TRUCKS
6 HE I GHT ADJUSTMENT fOR TYPE4 �EHICLES co = 2 0 . 44 C l = 3 0 . 32 s o
7 HE IGHT ADJUSTMENT FOR TYPES VEHICLES
c o = 2 1 . 8 6 C l = 3 1 . 0 8 so 8 HE IGHT ADJUSTMENT FOR TYPE6 VEHICLES
c o = 2 6 . 9 8 C l = 3 1 . 37 so
9 HE IGHT ADJUSTMENT fOR TYPE7 VEHICLES c o • 3 6 . 52 C l = 2 8 . 2 0 so
SOUTI-tBOUND 1 -4 7 1 "4 A I NL ! NE ! C0"4BI
VEHICLE TYPE �EHICLES/HOUR SPEED
C A R S I • 3 0 . HT I • 3 0 . HT l o 3 0 .
�EH4 1 1 70 . b O . �EHS o . !; S . �EH6 3 0 . s s . VEH7 3 0 . 5 5 .
- - - - - - - · · • · • COORD I N A TES- - · - · · · · · · · · ·
SOUTHBOUND
X Y Z 1 1 7 9 . 7 7 2 . 7 7 9 .
1 55 1 , 9 2 0 . 76B.
1 8 34 , 1 02 7 . 7 5 8 .
2 1 26 , 1 1 1 3 . 749,
242 8 . 1 1 6 9 . 7 3 9 .
2727 . 1 1 88 . 730 . 3 0 3 7 . 1 1 7 4 . 7 2 0 , 3 3 3 8 . 1 1 2 0 . 7 1 0 . 34 1 4 . 1 1 02 . 7 0 7 .
1 •4 7 1 M A I NL I NE ! SE P I
VEHICLE TYPE VEHICLES/HOUR SPEED
CARS I • 3 0 .
HT I • 3 0 .
M T I • 3 0 .
VEH4 9 9 0 . t> O . VEHS o . 5 5 . VEH6 3 0 . s s . VE>H 3 0 . 55.
· · - - - - - - · · - ·COORD I NATES - · · · - - · · - · - - -
! CARS I
( H T I
( H T )
( �EH4) = ! �EHS)
= ! �EH6 )
=
! �E H 7 )
=
X y z GRADE
RS•8A 3 4 1 4 . 1 1 02 . 7 0 7 . I RS-9 3 8 2 7 , 1 0 0 4 . 694. I RS• I O 4 1 1 5 . M Z . 6 7 A , I RS- 1 1 4799, 763. 662. I RS- 1 2 52H8 , 662. 646. I Figure B-1. Output from STAMINA 2 . 0
39
• AUTOS •
3 . 1 1 • L T nu< s •
3 . 4 1 ' "4ED TRK S '
3 . 89
' HE A V T R K S • 3 . 44
wOADwAY 3 SOUTHBOUNO 1 -4 7 1 ON- RAMP
VEHI CLE TYPE V E H I C L E S/HOUR SPEED CARS I • 3 0 .
HT I • 3 0 .
MT I . 3 0 .
VEH4 1 8 0 . 5 5 . VEHS o . 5 0 .
VEH6 o . s o . VEH7 o . s o .
------------COORD I NATES-------------X y z GRADE
R F - 1 34 1 9 . 1 1 3 0 . 7 0 7 . I RF-2 3 5 2 3 . 1 1 09 . 7 0 4 . I RF-3 3 7 1 9 . 1 06 2 . 697 . I RF -4 3 9 1 9 . 1 0 3 6 . fl90 . I RF-� 4 1 1 7 . 1 0 1 0 . 6 8 2 . I RF-6 4 3 1 5 . 9 8 4 . 6 7 2 . I RF - 7 4 5 1 5 . 9 6 1 . 6 o 2 . I RF-d 4 7 1 3 . 9 3 6 . b53 . I RF-'1 4 9 1 3 . 9 1 2 . 643 .. I RF- 1 0 5 1 1 1 . 8tlO . 6 3 3 . I RF- 1 1 5 3 1 3 . 8 A 6 . 6 2 3 . I
ROADWAY 4 NORTHBOUND 1 -4 7 1 M A I "'L I NE ! COMB I
VEHI CLE TYPE V E H I CLE S/HOUR SPEED CARS I • 3 0 .
H T I . 3 0 .
MT I • 3 0 .
VEH4 990 . 6 5 .
VEH5 o . o 5 .
VEH6 3 b , o o . VEH7 bb, b O ,
------------COORD I NATES-------------X y z GRADE
RN-1 1 2 1 2 . 6 8 9 . 7 7 9 . 0
R"'-2 1 58 5 , A 3 B . 768 . 0
R"'-3 1 8b4, 944. 758 . 0
RN-4 2 1 4 7 . 1 0 2 7 . 749 . 0
RN-5 244 0 . 1 0 8 1 . 7 3 9 . 0
i'!N- b 2 7 2 8 . I I o o . 7 3 0 . 0
ROA D w A Y s NORTHBOUND 1 -47 1 M A I NL I NE C SEP I
V E H I C L E TYPE VEH I CLES/HOUR SPEED CARS I . 3 0 .
HT I • 3 0 .
MT I • 3 0 .
VEH4 7 7 4 . o s .
VEHS o . o 5 .
VEH6 36. o o .
VEH7 o 6 . 6 0 .
------------COORDINATES-------------
X y z GRADE RN- 6 2 7 2 8 . 1 1 o o . 7 3 0 . 0
R!>l-7 3 0 3 0 . 1 09 2 . 720 . 0 R"'-8 332 3 . 1 046. n o . 0
RN-9 3 8 0 9 . 929. 694. 0
""1- 1 0 4 2 9 6 . 8 0 9 . 6 7 8 . 0
'IN- I I 4 7 8 3 . � 8 8 . 61i2 . 0 RN- 1 2 5 2 7 6 . 5 8 6 . 646. 0
Figure B-1 . Output from STAMINA 2 . 0 (Cont . )
40
ROALJWAY
RE- 1 RE- 2 RE-3 RE-4 RE-5 RE•6 RE- 7 RE- 8
8A�R I E R
B - 1 B-2 �-3 '1-4 B-5 �-6 �- 7 B-8 B-9 B - 1 0
BARR I ER
BM-1 9M-2 RM-3 BM- 4 8M-5 BM-6 Ro.t-7 A"'-a s"'-9 AM- 1 0
BARR I E R
E A- 1 E A-2 EA•J E A-4 E A-5
BARR I ER
E B- 1 EB- 2 EB- 3 EB-4 EB- 5
6 NORT>iBOUNO 1 - 4 7 1 Of"f"-Q AMP
VEHI CLE TYPE VEHI CLE S/HOUR SPEED CARS 1 • 3 0 . HT 1 . 3 0 . MT 1 • 3 0 . VEH4 2 1 6 . 6 0 . VEHS o . 6 0 , VEH6 o . ss. VEH7 o . 5 5 ,
------------COOR D I NATES-------------
2
3
4
K y 2 8 1 8 . 1 07 9 . 3 0 6 9 . 1 04 1 . 3264, 993. 345 7 . 942. 365 0 . 889. 3843 . 8 3 7 . 4 0 3 6 . 7 8 5 . 4229 . 730 .
TYPE ! R I TRAf"f" ! C NO I SE BARR I ER
---------COORD ! NATES----------K Y Z
1 82 2 . 1 06 3 . 774. 2 1 1 7 . 1 1 49, 766. 2 5 2 7 . 1 2 1 7 . 753. 2939. 1 2 1 9 . 7 3 9 . 3 1 44 , 1 20 0 . 7 3 3 . 335 1 . 1 1 65. 7 2 7 . 354 7 . 1 1 24. 7 1 9 . 3�9 8 , 1 09 0 . 7 1 3 . 3 8 7 2 . 1 06 3 . 7 0 5 . 434 3 , 1 0 0 7 , 6 A 8 ,
z o 7 5 9 . 75 1 . 738. 724 . 7 1 8 . 7 1 2 . 7 0 4 . 698 . 6 9 0 . 6 7 3 .
TYPE ! R I CONCRETE MED I AN BARR I ER
---------COOR D I NATES----------K y z zo
1 1 96 . 7 3 1 . 7 A I , 779. 1 75 5 . 95 1 . 764. 762. 2 1 36 . 1 0 7 1 . 7 5 2 . 7 5 0 . 2434 . 1 1 2 6 . 744 . 742. 2728. 1 1 44 . 7 3 2 . 7 3 0 . 3 0 3 3 . 1 1 2 9 . 7 2 3 . 7 2 0 . 333 1 . 1 08 3 . 7 1 3 . 7 1 o . 3 8 1 8 . 9 6 7 . 6 9 7 . 694. 469 3 . 749. 6fl8. 666. 5 2 8 2 . 624 . 649 . 647 .
TYPE ( l l EARTH BARR I ER 1110 . ---------COORD I NATES----------
K y z zo 4525. 1 1 1 3 . 7 0 5 . 689. 4586 . 1 1 0 5 . 7 0 7 . 686. 4 6 3 7 . 1 09 8 . 7 0 7 . 6 8 3 . 4 7 3 8 . 1 08 7 . 7 0 4 . 6 7 8 . 4837 . 1 07 5 . 7 0 2 . 6 7 3 .
T Y P E ! A I EARTH BARR I ER IIIO o 2
---------COORD INATES----------X y z zo
4?.9 '3 . I l l o . 6 7 8 . 6 6 7 . 4 3 1 9 . 1 1 o o . 6 8 0 . 664. 434 1 . 1 1 04. 6 8 0 . M S . 4374. I I 0 7 . 680 . 663. 440 0 . 1 1 0 1 . 680 . 66 1 .
z 725. 7 1 6 . 7 0 8 . 7 0 1 . 1)94. 6 8 7 . 6 A O . 675.
DELZ o .
DELZ o .
DELZ o .
DELZ o .
Figure B-1 . Output from STAMINA 2 . 0 (Cont . )
41
GRADE 0 0 0 0 0 0 0 0
p 0
p 0
p 0
p 0
BARRIER 5 TYPE ! A l EARTH BARR I E R N O . 3
---------COORD INATES----------X y z z o DELZ
EC- 1 263 1 . 1 57 6 . 7 1 3 . 7 1 1 . o . EC-2 2724 . 1 6 0 0 . 7 1 5 , 7 0 7 . EC- 3 28 1 5 . 1 6 2 0 , 7 1 9 . 7 0 5 , EC-4 2993. 1 6 0 8 . 7 ? 5 . 699. EC-5 3078 , 1 58 0 , 7 2 5 . 698 . EC- 6 3 1 8 0 . 1 57 1 . 7 ? 5 . 695. EC- 7 3257, 1 5 7 3 . 725 . 690. EC- � 3 39 1 . 1 54 9 . 7 3 3 . 684. EC- 9 3626, 1 5 0 3 . 745 , 6 7 7 ,
RECE I VER DUA
------------COORD I NATES-------------
P 1 0 7 X Y Z
4 1 1 9 . 1 7�6 . 6 3 3 .
ALPHA FACTORS - ROADWAY ACRO S S o RE C E I VER DOWN
1 • o . s o . s o . s o . s o . s o . s
S H I ELD ING FACTORS - ROADWAY ACROSS o RE C E I VER DOWN .
1 • 3 . 0 3 . 0 3 . 0 3 . 0 3 . 0 3 . 0
EVALUAT I ON OF TRAFF I C NO I S E BARR I ER I -4 7 1 CAMPBELL C O ,
RECE I VER
P 1 0 7
LEQ I H )
48 . 1
S I G
5 . 5
L I O L 5 0 L � O
5 1 . 6 44 . 6
Figure B-1. Output from STAMINA 2 . 0 (Cont . )
4 2
p 0

APPENDIX C
TRAFFIC VOLUME COUNT SUMMARIES
43

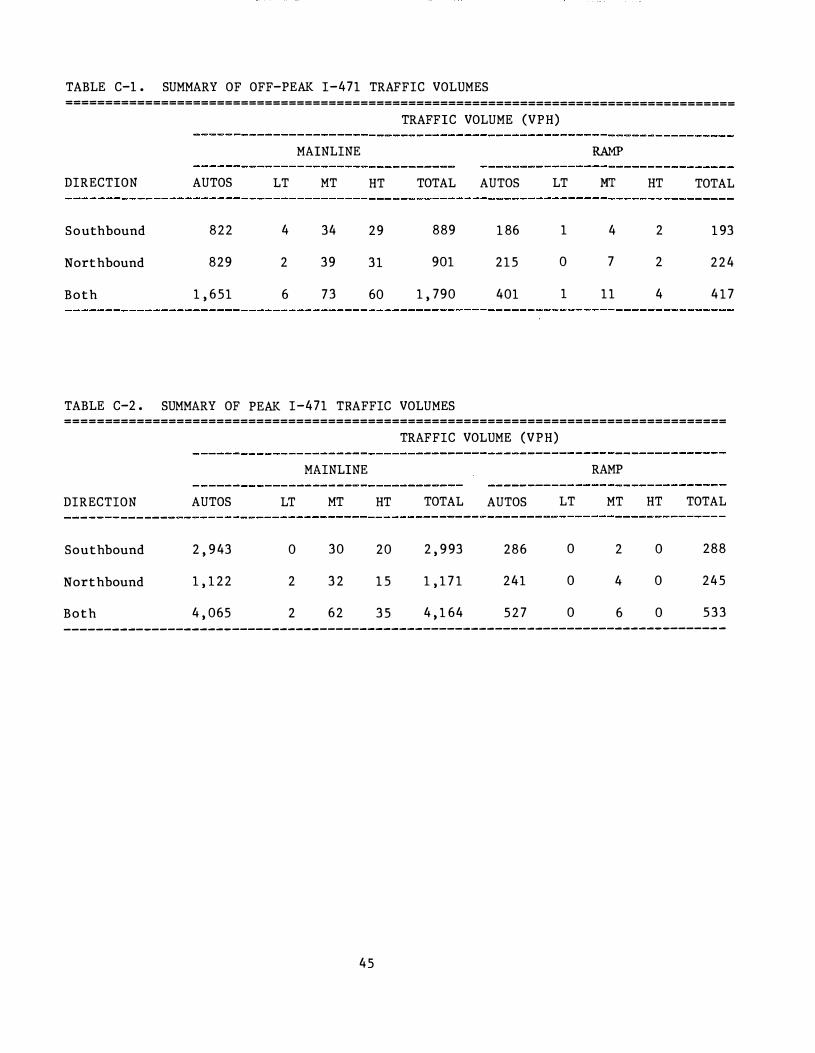
TABLE C-1 . SUMMARY OF OFF-PEAK I-471 TRAFFIC VOLUMES ====================================================================================
DIRECTION AUTOS LT
Southbound 822 4
Northbound 829 2
Both 1 , 651 6
TRAFFIC VOLUME (VPH)
MAINLINE RAMP
MT HT
34 29
39 31
73 60
TOTAL AUTOS
889 1 86
901 215
1 , 790 401
LT MT
1 4
0 7
1 11
HT TOTAL
2 1 93
2 224
4 4 1 7
TABLE C-2 . SUMMARY OF PEAK I-471 TRAFFIC VOLUMES = = = = = ==============================================================================
DIRECTION AUTOS LT
Southbound 2 ' 943 0
Northbound 1 , 1 22 2
Both 4 , 065 2
TRAFFIC VOLUME (VPH)
MAINLINE RAMP
MT HT
30 20
3 2 1 5
62 35
TOTAL AUTOS
2 , 993 286
1 , 1 7 1 241
4 , 1 64 5 2 7
LT
0
0
0
MT HT TOTAL
2 0 288
4 0 245
6 0 533 ------- - --------------------------------------------------- ----------------------- -
45


APPENDIX D
SUMMARY OF DATA BY LOCATION
4 7

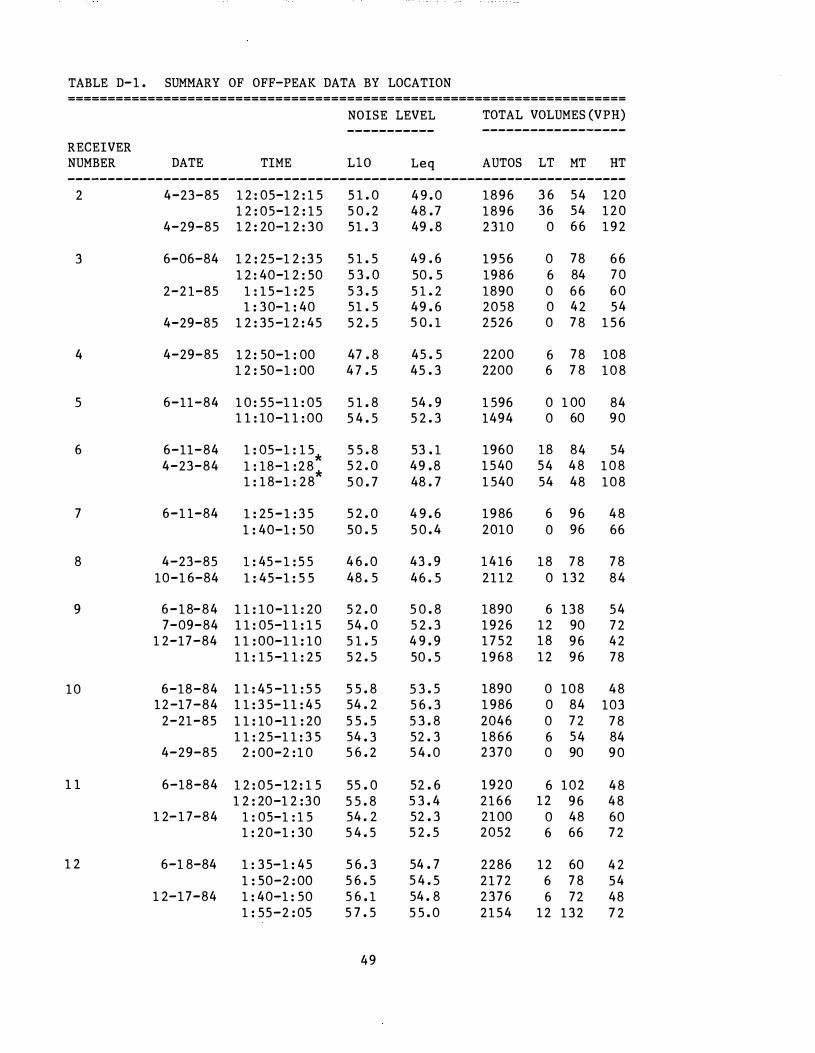
TABLE D-1 . SUMMARY OF OFF-PEAK DATA BY LOCATION ======================================================================
NOISE LEVEL TOTAL VOLUMES (VPH) ----------- ------------------
RECEIVER NUMBER DATE TIME LlO Leq AUTOS LT MT HT ----------------------------------------------------------------------
2 4-23-85 1 2 : 05-1 2 : 1 5 5 1 . 0 4 9 . 0 1896 3 6 54 120 1 2 : 05-1 2 : 15 5 0 . 2 48 . 7 1896 36 54 1 2 0
4-29-85 1 2 : 20-1 2 : 30 51 . 3 49 . 8 2310 0 66 1 9 2
3 6-06-84 1 2 : 25-1 2 : 3 5 5 1 . 5 49 . 6 1956 0 78 66 1 2 : 40-1 2 : 50 5 3 . 0 50 . 5 1986 6 84 70
2-2 1-85 1 : 15-1 : 2 5 5 3 . 5 5 1 . 2 1890 0 66 60 1 : 30-1 : 40 51 . 5 49 . 6 2058 0 42 54
4-29-85 1 2 : 35-1 2 : 45 5 2 . 5 s o . 1 2526 0 7 8 1 5 6
4 4-29-85 1 2 : 50-1 : 00 47 . 8 45 . 5 2200 6 78 108 1 2 : 50-1 : 00 4 7 . 5 45 . 3 2200 6 7 8 1 0 8
5 6-11-84 1 0 : 55-1 1 : 05 5 1 . 8 54 . 9 1 596 0 1 00 84 1 1 : 10-1 1 : 00 5 4 . 5 5 2 . 3 1494 0 60 90
6 6-11-84 1 : 05-1 : 1 5*
5 5 . 8 53 . 1 1960 18 84 54 4-23-84 1 : 18-1 : 2 8*
5 2 . 0 49 .8 1540 54 48 1 0 8 1 : 18-1 : 28 5 0 . 7 48 . 7 1 540 54 48 108
7 6-1 1-84 1 : 25-1 : 3 5 5 2 . 0 4 9 . 6 1986 6 96 48 1 : 40-1 : 50 50 . 5 5 0 . 4 2010 0 96 66
8 4-23-85 1 : 45-1 : 5 5 4 6 . 0 43 . 9 1416 18 7 8 7 8 10-1 6-84 1 : 45-1 : 5 5 48 . 5 46 . 5 2 1 1 2 0 132 84
9 6-18-84 1 1 : 10-1 1 : 20 5 2 . 0 5 0 . 8 1890 6 138 54 7-09-84 1 1 : 05-1 1 : 1 5 54 . 0 5 2 . 3 1926 12 90 7 2
1 2-17-84 1 1 : 00-1 1 : 10 5 1 . 5 4 9 . 9 1752 18 96 42 1 1 : 15-1 1 : 25 5 2 . 5 50 . 5 1968 12 96 78
10 6-18-84 1 1 : 45 -1 1 : 5 5 5 5 . 8 5 3 . 5 1890 0 108 48 12-17-84 1 1 : 3 5-1 1 : 45 54 . 2 5 6 . 3 1 986 0 84 103
2-21-85 1 1 : 10 -1 1 : 20 5 5 . 5 5 3 . 8 2046 0 7 2 7 8 1 1 : 25-1 1 : 3 5 54 . 3 52 . 3 1866 6 54 84
4-29-85 2 : 00-2 : 1 0 5 6 . 2 5 4 . 0 2370 0 90 90
1 1 6-18-84 1 2 : 05-12 : 1 5 55 . 0 52 . 6 1920 6 102 48 1 2 : 20-1 2 :30 5 5 . 8 5 3 . 4 2166 12 96 48
1 2- 1 7-84 1 : 05-1 : 1 5 54 . 2 52 . 3 2100 0 48 60 1 : 20-1 : 30 5 4 . 5 5 2 . 5 2052 6 66 7 2
1 2 6-1 8-84 1 : 35-1 : 45 5 6 . 3 54 . 7 2286 12 60 4 2 1 : 50-2 : 00 5 6 . 5 5 4 . 5 2172 6 7 8 54
1 2-17-84 1 : 40-1 : 50 5 6 . 1 54 . 8 2376 6 72 48 1 : 55-2 : 05 5 7 . 5 5 5 . 0 2154 12 132 7 2
49
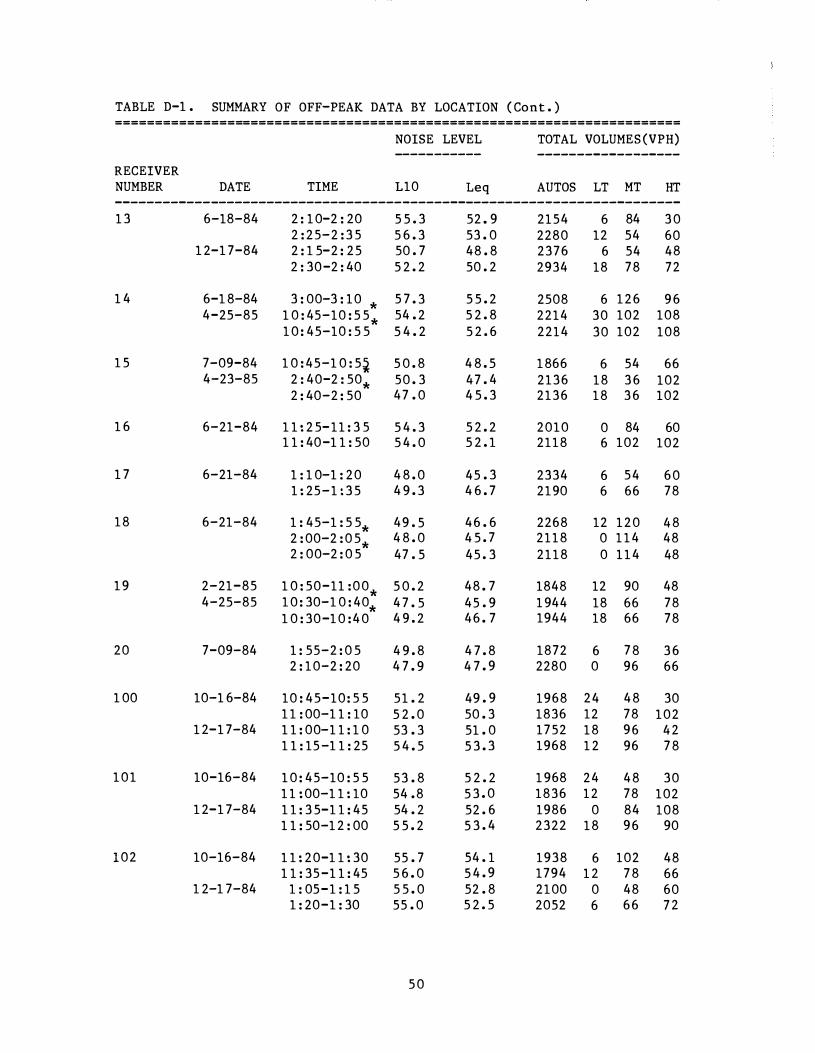
TABLE D-1 . SUMMARY OF OFF-PEAK DATA BY LOCATION ( Cont . ) =======================================================================
NOISE LEVEL TOTAL VOLUMES(VPH) ----------- ------------------
RECEIVER NUMBER DATE TIME 110 Leq AUTOS LT MT HT -----------------------------------------------------------------------1 3 6-18-84 2 : 1 0-2 : 20 5 5 . 3 52 . 9 2154 6 84 3 0
2 : 25-2 : 3 5 5 6 . 3 53 . 0 2280 12 54 60 1 2-1 7-84 2 : 1 5-2 : 25 50 . 7 48 . 8 2376 6 54 48
2 : 30-2 : 40 5 2 . 2 50 . 2 2934 18 78 72
1 4 6-1 8-84 3 : 00-3 : 10 * 5 7 . 3 5 5 . 2 2508 6 1 2 6 9 6 4-25-85 1 0 : 45-10 : 5 5* 54 . 2 5 2 . 8 2214 30 102 108
1 0 : 45-10 : 5 5 5 4 . 2 5 2 . 6 2214 30 102 108
1 5 7-09-84 1 0 : 45-1 0 : 5� 5 0 . 8 4 8 . 5 1866 6 54 66 4-23-85 2 : 40-2 : 50* 50 . 3 47 . 4 2136 18 3 6 102
2 : 40-2 : 50 47 . 0 4 5 . 3 2136 18 3 6 102
1 6 6-21-84 1 1 : 2 5-11 : 3 5 5 4 . 3 5 2 . 2 2010 0 84 60 1 1 : 40-1 1 : 50 5 4 . 0 5 2 . 1 2118 6 102 102
1 7 6-21-84 1 : 1 0-1 : 20 4 8 . 0 45 . 3 2334 6 54 60 1 : 25-1 : 3 5 4 9 . 3 4 6 . 7 2190 6 66 78
18 6-21-84 1 : 45-1 : 5 5* 49 . 5 46 . 6 2268 12 1 2 0 48 2 : 00-2 : 0 5*
4 8 . 0 4 5 . 7 2118 0 1 1 4 48 2 : 00-2 : 0 5 47 . 5 45 . 3 2118 0 1 1 4 48
1 9 2-21-85 1 0 : 50-11 :00* 5 0 . 2 48 . 7 1848 12 90 48
4-25-85 1 0 : 30-1 0 : 40* 4 7 . 5 45 . 9 1 944 18 66 78 1 0 : 30-1 0 : 4 0 4 9 . 2 46 . 7 1944 18 66 78
20 7-09-84 1 : 55-2 : 0 5 4 9 . 8 4 7 . 8 1872 6 7 8 3 6 2 : 10-2 : 20 4 7 . 9 4 7 . 9 2280 0 96 66
1 00 10-1 6-84 10 : 45-10: 5 5 51 . 2 49 . 9 1968 24 48 30 1 1 : 00-1 1 : 10 5 2 . 0 50 . 3 1836 12 78 102
1 2-1 7-84 1 1 : 00-1 1 : 1 0 53 . 3 51 . 0 1752 18 96 42 1 1 : 15 -1 1 : 25 5 4 . 5 5 3 . 3 1968 1 2 96 7 8
1 0 1 10-16-84 1 0 : 45-10 : 5 5 53 . 8 5 2 . 2 1 968 24 48 30 1 1 : 00-1 1 : 10 54 .8 5 3 . 0 1836 12 78 102
1 2-1 7-84 1 1 : 3 5-1 1 : 45 54 . 2 52 . 6 1986 0 84 108 1 1 : 50-1 2 : 00 5 5 . 2 5 3 . 4 2322 18 96 90
102 10-16-84 1 1 : 20-1 1 : 30 55 . 7 54 . 1 1938 6 102 48 1 1 : 35-1 1 : 45 5 6 . 0 5 4 . 9 1794 1 2 7 8 66
1 2-1 7-84 1 : 05-1 : 1 5 5 5 . 0 52 . 8 2100 0 48 60 1 : 20-1 : 30 55 . 0 5 2 . 5 2052 6 66 7 2
5 0
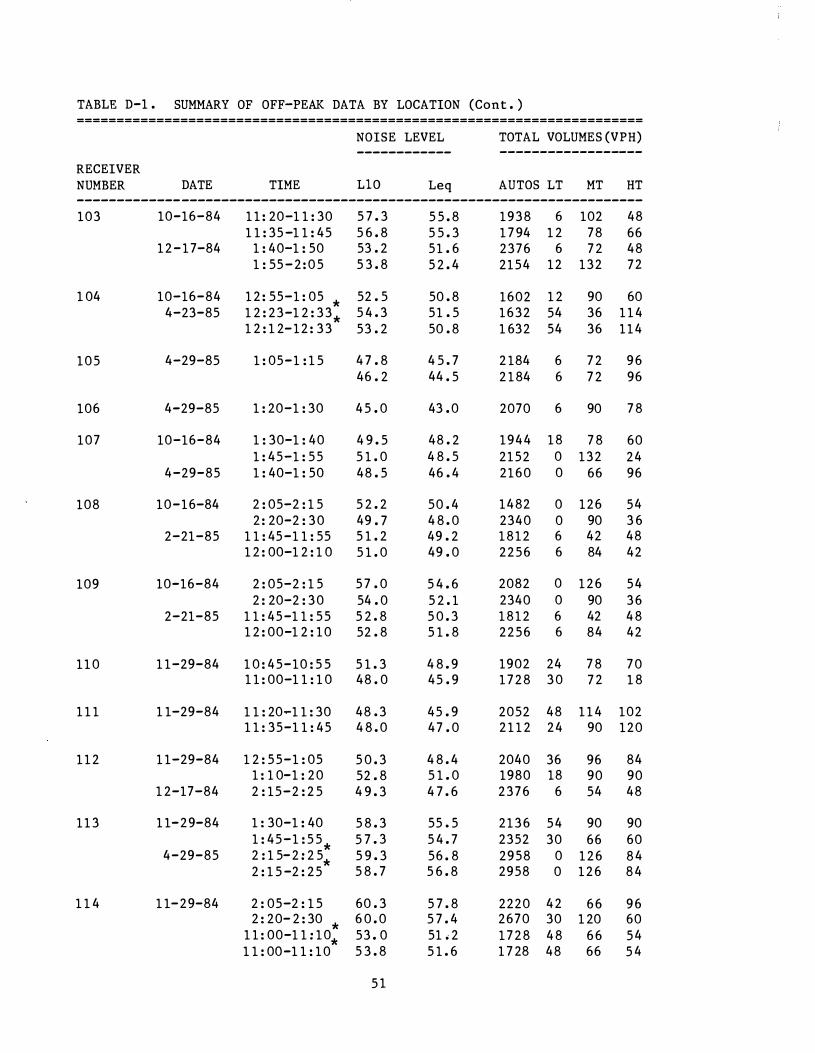
TABLE D-1 . SUMMARY OF OFF-PEAK DATA BY LOCATION (Cont . ) =======================================================================
NOISE LEVEL TOTAL VOLUMES (VPH) ------------ ------------------
RECEIVER NUMBER DATE TIME LlO Leq AUTOS LT MT HT -----------------------------------------------------------------------103 10-16-84 1 1 : 20-1 1 : 30 5 7 . 3 5 5 . 8 1938 6 102 48
1 1 : 35 -1 1 : 45 5 6 . 8 5 5 . 3 1 7 94 1 2 78 66 12-17-84 1 : 40-1 : 50 53 . 2 51 . 6 2376 6 7 2 48
1 : 55 - 2 : 0 5 5 3 . 8 5 2 . 4 2154 12 132 72
1 04 10-16-84 1 2 : 55-1 : 05 * 52 . 5 50 . 8 1602 1 2 90 60 4-23-85 1 2 : 23-1 2 : 33* 5 4 . 3 51 . 5 1632 54 36 1 1 4
1 2 : 1 2-12 : 33 53 . 2 50 . 8 1 632 54 36 114
105 4-29-85 1 : 05-1 : 1 5 4 7 . 8 4 5 . 7 2 184 6 7 2 96 46 . 2 44 . 5 2 184 6 7 2 96
106 4-29-85 1 : 20-1 : 30 45 . 0 43 . 0 2070 6 90 7 8
107 10-16-84 1 : 30-1 : 40 4 9 . 5 48 . 2 1944 18 7 8 60 1 : 45-1 : 55 5 1 . 0 4 8 . 5 2152 0 132 24
4-29-85 1 : 40-1 : 50 48 . 5 46 . 4 2160 0 66 96
108 10-16-84 2 : 05-2 : 1 5 5 2 . 2 50 . 4 1482 0 126 54 2 : 20-2 : 30 49 . 7 4 8 . 0 2340 0 90 3 6
2-21-85 1 1 : 45-1 1 : 55 5 1 . 2 49 . 2 1812 6 42 48 1 2 : 00-1 2 : 1 0 5 1 . 0 49 . 0 2256 6 84 42
109 10-16-84 2 : 05-2 : 1 5 5 7 . 0 5 4 . 6 2082 0 1 2 6 54 2 : 20-2 : 30 54 . 0 5 2 . 1 2340 0 90 36
2-21-85 1 1 : 45-1 1 : 55 5 2 . 8 5 0 . 3 1812 6 42 48 1 2 : 00-1 2 : 10 52 . 8 5 1 . 8 2256 6 84 42
1 1 0 1 1-29-84 1 0 : 45-10 : 5 5 5 1 . 3 4 8 . 9 1902 24 7 8 70 1 1 : 00-1 1 : 1 0 48 . 0 45 . 9 1728 30 7 2 1 8
1 1 1 1 1-29-84 1 1 : 20-1 1 : 30 48 . 3 45 . 9 2052 48 1 1 4 102 1 1 : 35-1 1 : 45 4 8 . 0 47 . 0 2 1 1 2 24 90 120
1 1 2 1 1-29-84 1 2 : 55-1 : 05 5 0 . 3 4 8 . 4 2040 36 96 84 1 : 1 0-1 : 20 52 . 8 5 1 . 0 1980 18 90 90
1 2-17-84 2 : 15-2 : 2 5 4 9 . 3 4 7 . 6 2376 6 54 48
1 1 3 1 1-29-84 1 : 30-1 : 40 5 8 . 3 55 . 5 2136 54 90 90 1 : 45-1 : 5 5* 5 7 . 3 5 4 . 7 2352 30 66 60
4-29-85 2 : 1 5-2 : 2 5* 5 9 . 3 56 . 8 2958 0 1 2 6 8 4 2 : 1 5 -2 : 25 5 8 . 7 5 6 . 8 2958 0 1 2 6 8 4
1 1 4 1 1-29-84 2 : 05-2 : 1 5 60 . 3 5 7 . 8 2220 42 66 96 2 : 20- 2 : 30 * 6 0 . 0 5 7 . 4 2670 30 1 20 60
1 1 : 00-1 1 : 10* 53 . 0 51 . 2 1728 48 66 54 1 1 : 00-1 1 : 10 5 3 . 8 5 1 . 6 1 7 28 48 66 5 4
5 1
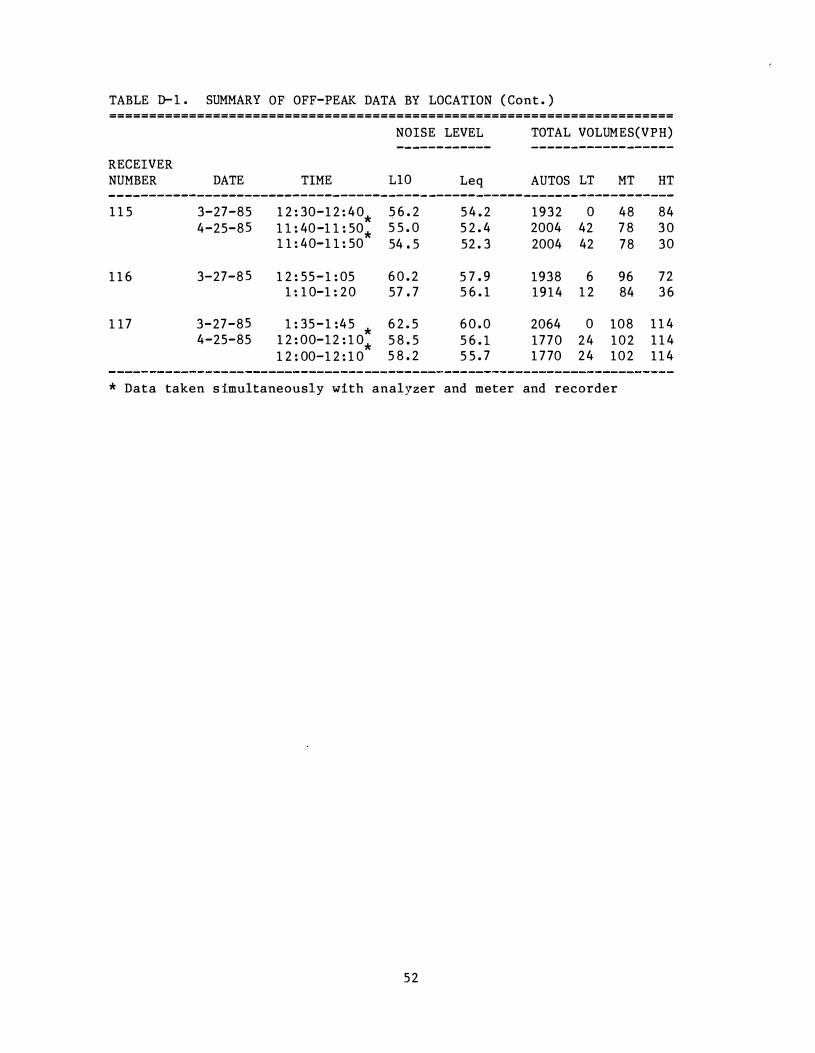
TABLE D-1 . SUMMARY OF OFF-PEAK DATA BY LOCATION ( Cont . ) =======================================================================
NOISE LEVEL TOTAL VOLUMES(VPH) -- ---------- ------------------
RECEIVER NUMBER DATE TIME L10 Leq AUTOS LT MT HT ----------------------------------- ----- -------------------------------1 1 5 3-27-85 1 2 : 30-1 2 : 40* 5 6 . 2 5 4 . 2 1932 0 48 84
4-25-85 1 1 : 40-1 1 : 50* 5 5 . 0 5 2 . 4 2004 42 7 8 3 0 1 1 : 40-1 1 : 50 54 . 5 52 . 3 2004 42 78 30
1 1 6 3-27-85 1 2 : 55-1 : 05 6 0 . 2 5 7 . 9 1938 6 96 72 1 : 1 0-1 : 20 57 . 7 5 6 . 1 1914 1 2 84 3 6
1 17 3-27-85 1 : 35-1 :45 * 6 2 . 5 6 0 . 0 2064 0 108 1 1 4 4-25-85 1 2 : 00-12 : 1 0* 5 8 . 5 5 6 . 1 1770 24 102 1 1 4
1 2 : 00-1 2 : 1 0 5 8 . 2 5 5 . 7 1 770 24 102 1 1 4
* Data taken s imultaneously with analyzer and meter and recorder
52
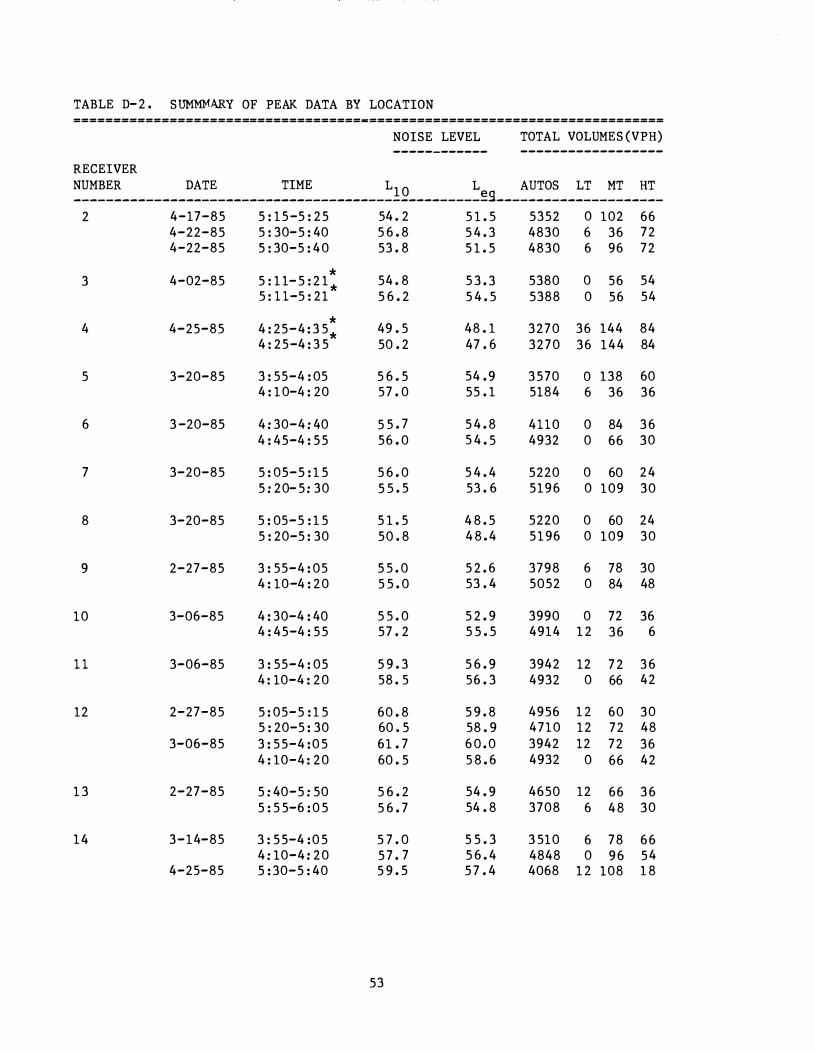
TABLE D-2 . SUMMMARY OF PEAK DATA BY LOCATION ====================================-=====================================
NOISE LEVEL TOTAL VOLUMES (VPH) ------------ ------------------
RECEIVER NUMBER DATE TIME L1 0 Le
AUTOS LT MT HT ____________________________________________________ g _____________________
2 4-17-85 5 : 15-5 : 25 54 . 2 5 1 . 5 5352 0 102 66 4-22-85 5 : 30-5 : 40 5 6 . 8 5 4 . 3 4830 6 36 72 4-22-85 5 : 30-5 : 40 53 . 8 5 1 . 5 4830 6 96 72
* 5380 54 3 4-02-85 5 : 1 1-5 : 2 1 * 54 . 8 5 3 . 3 0 56
5 : l l-5 : 21 5 6 . 2 5 4 . 5 5388 0 56 54
* 48 . 1 144 84 4 4-25-85 4 : 25-4 : 3 5* 49 . 5 3270 36
4 : 25-4 : 3 5 50 . 2 47 . 6 3270 36 144 84
5 3-20-85 3 : 55-4 : 05 5 6 . 5 54 . 9 3570 0 138 60 4 : 1 0-4 : 20 57 . 0 55 . 1 5184 6 36 36
6 3 -20-85 4 : 30-4 : 40 5 5 . 7 5 4 . 8 4ll0 0 84 3 6 4 : 45-4 : 55 56 . 0 5 4 . 5 4932 0 66 30
7 3-20-85 5 : 05-5 : 1 5 5 6 . 0 5 4 . 4 5220 0 60 24 5 : 20- 5 : 30 5 5 . 5 53 . 6 5196 0 109 30
8 3-20-85 5 : 05-5 : 1 5 5 1 . 5 4 8 . 5 5220 0 60 24 5 : 20-5 : 30 50 . 8 4 8 . 4 5 1 96 0 109 30
9 2-27-85 3 : 55-4 : 05 5 5 . 0 5 2 . 6 3798 6 78 30 4 : 10-4 : 20 5 5 . 0 53 . 4 5052 0 84 48
10 3-06-85 4 : 30-4 : 40 5 5 . 0 5 2 . 9 3990 0 72 36 4 : 45-4 : 55 57 . 2 5 5 . 5 4914 1 2 36 6
l l 3-06-85 3 : 55-4 : 05 5 9 . 3 5 6 . 9 3942 12 7 2 3 6 4 : 10-4 : 20 58 . 5 56 . 3 4932 0 66 42
12 2-27-85 5 : 05-5 : 1 5 60 . 8 5 9 . 8 4956 1 2 60 30 5 : 20-5 : 30 60 . 5 58 . 9 4710 12 72 48
3-06-85 3 : 55-4 : 0 5 61 . 7 6 0 . 0 3942 12 72 36 4 : 10-4 : 20 60 . 5 5 8 . 6 4932 0 66 42
1 3 2-27-85 5 : 40-5 : 50 5 6 . 2 54 . 9 4650 12 66 3 6 5 : 5 5-6 : 0 5 5 6 . 7 54 . 8 3708 6 48 30
14 3-14-85 3 : 55-4 : 0 5 5 7 . 0 5 5 . 3 3 510 6 78 66 4 : 10-4 : 20 5 7 . 7 5 6 . 4 4848 0 96 54
4-25-85 5 : 30-5 : 40 5 9 . 5 5 7 . 4 4068 1 2 108 1 8
53
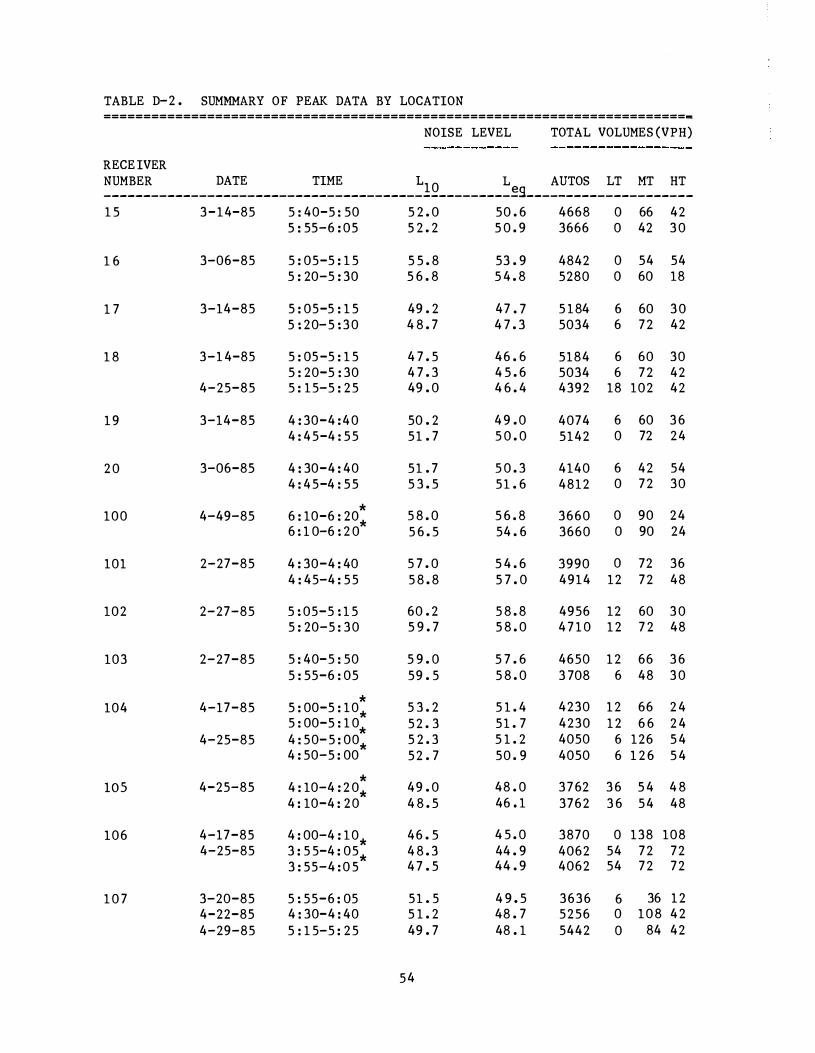
TABLE D-2 . SUMMMARY OF PEAK DATA BY LOCATION =========================================================================-
NOISE LEVEL TOTAL VOLUMES (VPH)
RECEIVER NUMBER DATE TIME L
10 Le
AUTOS LT MT HT ____________________________________________________ g ____________________ _
1 5 3-14-85 5 : 40-5 : 50 5 2 . 0 50 . 6 4668 0 66 42
1 6
1 7
1 8
1 9
2 0
100
101
102
103
104
lOS
106
1 0 7
3-06-85
3-14-85
3-1 4-85
4-25-85
3-14-85
3-06-85
4-49-85
2-27-85
2-27-85
2-27-85
4-17-85
4-25-85
4-25-85
4-17-85 4-25-85
3-20-85 4-22-85 4-29-85
5 : 55-6 : 05 5 2 . 2 5 0 . 9 3666 0 42 3 0
5 : 05-5 : 1 5 5 : 20-5 : 30
5 : 05-5 : 1 5 5 : 20-5 : 3 0
5 : 05-5 : 1 5 5 : 20-5 : 30 5 : 15-5 : 25
4 : 30-4 :40 4 : 45-4 : 55
4 : 30-4 : 40 4 : 45-4 : 55
* 6 : 10-6 : 20* 6 : 1 0-6 : 2 0
4 : 30-4 : 40 4 : 45-4 : 55
5 : 05-5 : 1 5 5 : 20-5 : 30
5 : 40-5 : 50 5 : 55-6 : 05
* 5 : 00-5 : 10* 5 : 00-5 : 1 0* 4 : 50-5 : 00* 4 : 50-5 : 00
* 4 : 10-4 : 2 0* 4 : 10-4 : 20
4 : 00-4 : 10* 3 : 5 5-4 : 05* 3 : 55-4 : 0 5
5 : 55-6 : 05 4 : 30-4 : 40 5 : 1 5-5 : 25
5 5 . 8 5 6 . 8
49 . 2 4 8 . 7
4 7 . 5 4 7 . 3 49 . 0
50 . 2 51 . 7
51 . 7 5 3 . 5
5 8 . 0 5 6 . 5
5 7 . 0 5 8 . 8
60 . 2 5 9 . 7
5 9 . 0 59 . 5
5 3 . 2 52 . 3 5 2 . 3 52 . 7
49 . 0 4 8 . 5
46 . 5 4 8 . 3 4 7 . 5
51 . 5 5 1 . 2 49 . 7
54
53 . 9 5 4 . 8
47 . 7 4 7 . 3
46 . 6 4 5 . 6 4 6 . 4
4 9 . 0 5 0 . 0
5 0 . 3 51 . 6
5 6 . 8 54 . 6
5 4 . 6 5 7 . 0
5 8 . 8 5 8 . 0
5 7 . 6 5 8 . 0
5 1 . 4 51 . 7 5 1 . 2 50 . 9
48 . 0 46 . 1
4 5 . 0 44 . 9 44 . 9
4 9 . 5 48 . 7 48 . 1
4842 0 54 54 5280 0 60 18
5 184 6 60 3 0 5034 6 72 42
5184 6 60 30 5034 6 72 42 4392 18 102 42
4074 6 60 3 6 5142 0 72 24
4140 6 42 54 4812 0 72 30
3660 0 90 24 3660 0 90 24
3990 0 72 36 4914 12 72 48
4956 12 60 3 0 4 7 1 0 12 7 2 48
4650 12 66 3 6 3 708 6 48 3 0
4230 4230 4050 4050
12 66 2 4 12 6 6 2 4
6 126 5 4 6 1 2 6 5 4
3762 3 6 5 4 4 8 3762 3 6 54 48
3870 4062 4062
3636 5256 5442
0 138 108 54 72 72 54 72 72
6 36 12 0 108 42 0 84 42
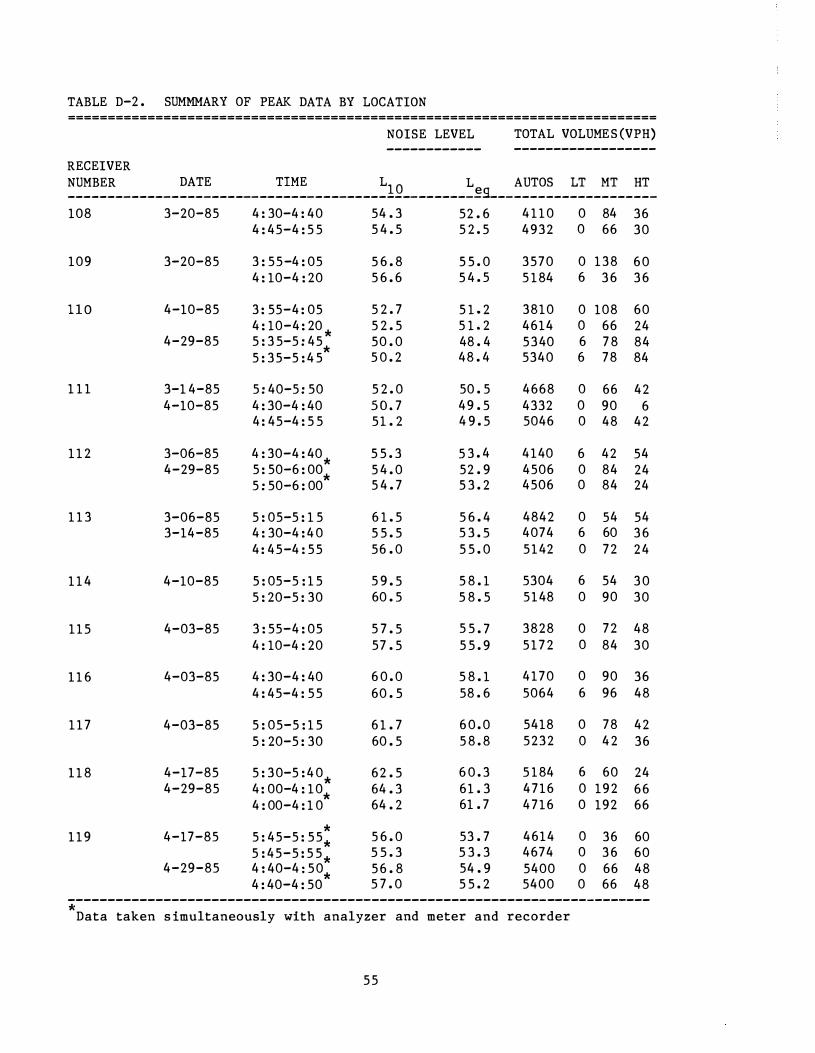
TABLE D-2 . SUMMMARY OF PEAK DATA BY LOCATION ==========================================================================
NOISE LEVEL TOTAL VOLUMES (VPH) ------------ ------------------
RECEIVER NUMBER DATE TIME L
1 0 Le AUTOS LT MT HT
___ ___________ ___ ____ ___ __ ___ __ _ _ ____ __ _ __ __ __ ______ g ___ ____ ________ ___ ___
108 3-20-85
109 3-20-85
l l O 4-10-85
4-29-85
1 1 1 3-1 4-85 4-10-85
1 1 2 3-06-85 4-29-85
1 1 3 3-06-85 3-14-85
1 1 4 4-10-85
115 4-03-85
l 1 6 4-03-85
1 1 7 4-03-85
l 1 8 4-17-85 4-29-85
1 1 9 4-17-85
4-29-85
4 : 30-4 : 40 4 : 45-4 : 5 5
3 : 55-4 : 05 4 : 10-4 : 20
3 : 55-4 : 05 4 : 10-4 : 20 * 5 : 3 5-5 : 45
* 5 : 35-5 : 4 5
5 : 40-5 : 50 4 : 30-4 : 40 4 : 45-4 : 5 5
4 : 30-4 : 40*
5 : 50-6 : 00*
5 : 50-6 : 00
5 : 05-5 : 1 5 4 : 30-4 : 4 0 4 : 45-4 : 55
5 : 05-5 : 1 5 5 : 20-5 : 30
3 : 55-4 : 05 4 : 10-4 : 20
4 : 30-4 : 40 4 : 45-4 : 55
5 : 05-5 : 1 5 5 : 20-5 : 30
5 : 30-5 : 4 0*
4 : 00-4 : 10* 4 : 00-4 : 1 0
* 5 : 45-5 : 55* 5 : 45-5 : 5 5* 4 · 40-4 · 50 . . * 4 : 40-4 : 50
54 . 3 52 . 6 5 4 . 5 5 2 . 5
5 6 . 8 5 5 . 0 5 6 . 6 5 4 . 5
5 2 . 7 5 1 . 2 5 2 . 5 5 1 . 2 50 . 0 48 . 4 5 0 . 2 48 . 4
5 2 . 0 50 . 5 s o . 7 49 . 5 51 . 2 4 9 . 5
5 5 . 3 5 3 . 4 5 4 . 0 52 . 9 5 4 . 7 5 3 . 2
6 1 . 5 5 6 . 4 5 5 . 5 5 3 . 5 56 . 0 5 5 . 0
5 9 . 5 5 8 . 1 60 . 5 5 8 . 5
5 7 . 5 5 5 . 7 57 . 5 5 5 . 9
6 0 . 0 5 8 . 1 60 . 5 58 . 6
6 1 . 7 6 0 . 0 60 . 5 5 8 . 8
62 . 5 6 0 . 3 64 . 3 61 . 3 64 . 2 61 . 7
5 6 . 0 53 . 7 5 5 . 3 5 3 . 3 5 6 . 8 54 . 9 5 7 . 0 5 5 . 2
4110 0 84 36 4932 0 66 30
3570 0 138 60 5 184 6 3 6 3 6
3810 0 108 60 4614 0 66 24 5340 6 7 8 84 5340 6 78 84
4668 0 66 42 4332 0 90 6 5046 0 48 42
4140 6 42 54 4506 0 84 24 4506 0 84 24
4842 0 54 54 4074 6 60 3 6 5142 0 72 24
5304 6 54 3 0 5148 0 90 30
3828 0 72 48 5172 0 84 30
4170 0 90 36 5064 6 96 48
5418 0 78 42 5232 0 42 36
5 184 6 60 24 4716 0 192 66 4716 0 192 66
4614 0 36 60 4674 0 3 6 60 5400 0 66 48 5400 0 66 48
-------------------------------------------------------------------------* Data taken s imultaneously with analyzer and meter and recorder
55


APPENDIX E
COVER LETTER AND QUESTIONNAIRE
5 7

KENTUCKY TRANSPORTATION RESEARCH PROGRAM UNIVERSITY O F KENTUCKY
Dear Resident:
College of Engineering
Transportation Research Building
533 South Li mestone
Lexington, Kentucky 40506-0043 Telephone: 606-257-451 3
The University o f Kentucky Transportation Re search Program, in
conjunction with the Kentucky Transportation Cabinet , is conducting a
research study to evaluate the effect iveness of the traffic noise
barrier located on Interstate 4 7 1 in Campbell County. As part of this
study , it is important to obtain the opinion of the affected ·residents
concerning the noise barrier.
Enclosed is a questionnaire and a self-addressed, pos tage-paid
return envelope. Please fill out the questionnaire and re turn it at
your earliest convenienc e . All information will be kept confidentia l .
Information from the questionnaires will b e used i n determination of
traffic noise barrier effectiveness and as an aid in future decisions
regarding location and construction of noise barriers . Thank you for
your ass istance.
Sincerely ,
Tom Creasey Transportation Research Engineer
59 AN EQUAL OPPORTUNITY INSTITUTION
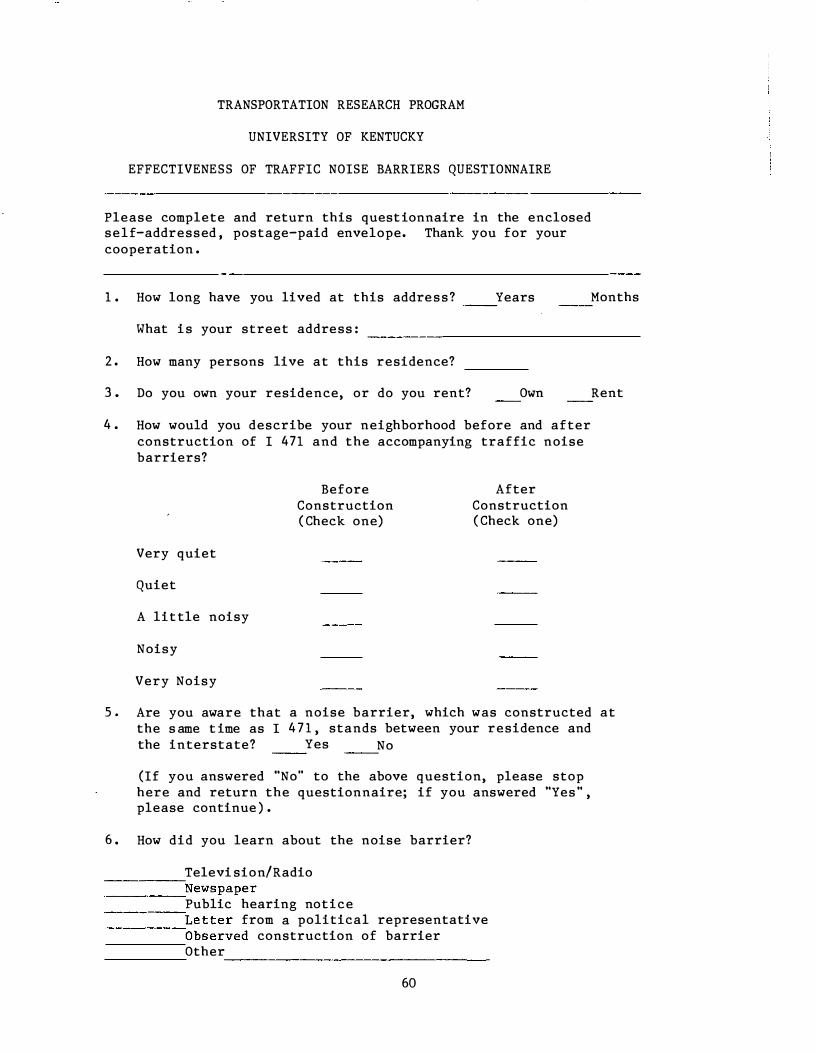
TRANSPORTATION RESEARCH PROGRAM
UNIVERSITY OF KENTUCKY
EFFECTIVENESS OF TRAFFIC NOISE BARRIERS QUESTIONNAIRE
Please complete and return this questionnaire in the enclosed self-addressed , postage-paid envelope. Thank you for your cooperation .
1 . How long have you lived at this address?
What is your street address :
2 . How many persons live at this residence?
3 . Do you own your residence, or do you rent?
Years
Own
4 . How would you describe your neighborhood before and after construction of I 471 and the accompanying traffic noise barriers?
Very quiet
Quiet
A little noisy
Noisy
Very Noisy
Before Construction ( Check one)
After Construction ( Check one)
Months
Rent
5 . Are you aware that the s ame t ime as I the interstate?
a noise barrier, which was constructed at 4 7 1 , stands between your residence and
Yes No
(If you answered "No" to the above question, please stop here and return the questionnaire; if you answered "Yes" , please continue ) .
6 . How did you learn about the noise barrier?
Televi sion/Radio ------, ----------�Newspaper
Public hearing notice Letter from a political representative ------�Observed construction of barrier Other ______________________________ ___
60
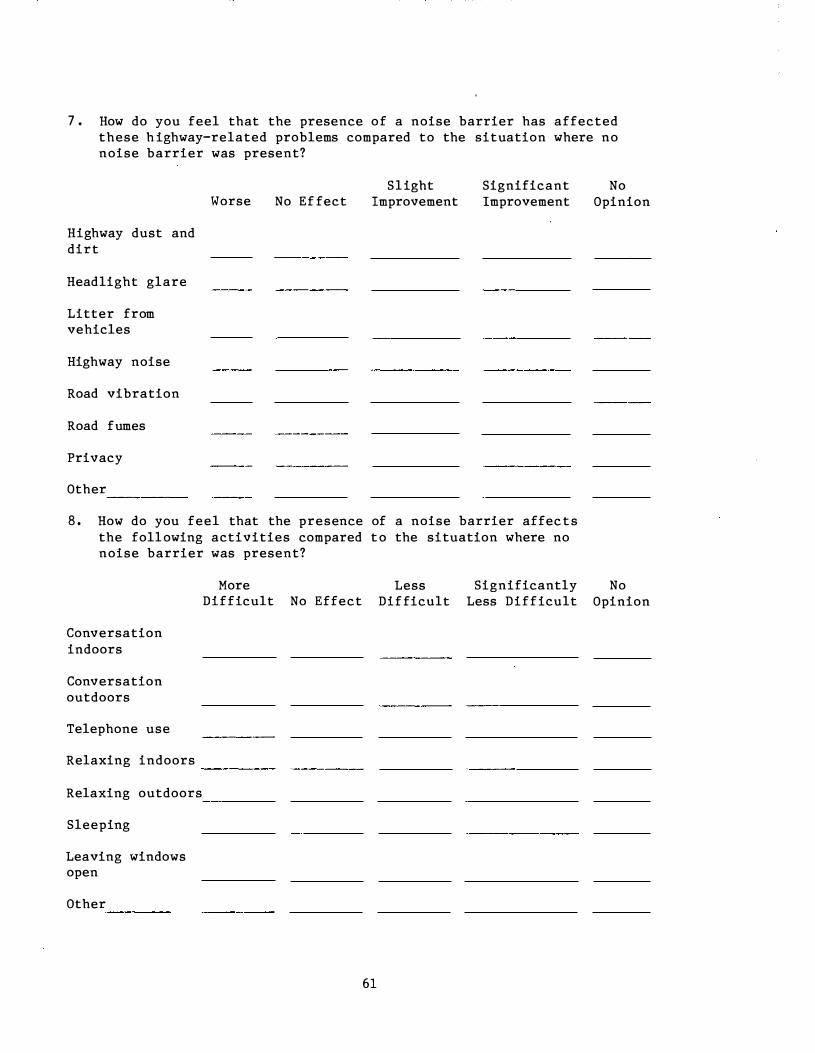
7 . How do you feel that the presence of a noise barrier has affected these h ighway-related problems compared to the situation where no noise barrier was present?
Highway dust and dirt
Headlight glare
Litter from vehicles
Highway noise
Road vibration
Road fumes
Privacy
Other ----
Worse No Ef fect Slight
Improvement Significant Improvement
8 . How do you feel that the presence of a noise barrier affects the following activities compared to the situation where no noise barrier was present?
Conversation indoors
Conversation outdoors
Telephone use
Relaxing indoors
More Difficult No Effect
--
Relaxing outdoors
Sleeping
Leaving windows open
Other ----
61
Less Difficult
Significantly Less Difficult
No Opinion
No Opinion
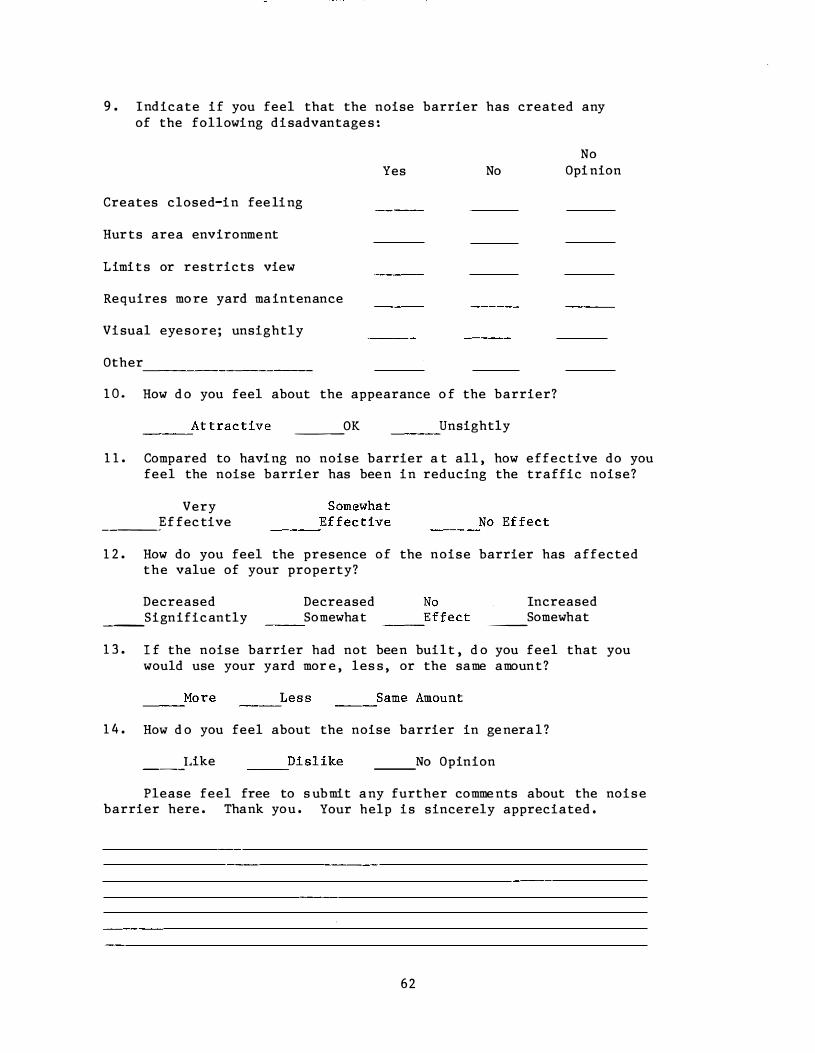
9 . Indicate if you feel that the noise barrier has created any of the following disadvantages :
Yes No
Creates closed-in feeling
Hurts area environm ent
Limits or restricts view
Requires more yard maintenance
Visual eyesore; unsightly
Other ----
1 0 . How d o you feel about the appearance o f the barrier?
At tractive --� ___ OK ___ Unsightly
No Opinion
1 1 . Compared to having no noise barrier a t all , how effective do you feel the noise barrier has been in reducing the traffic noise?
Very
---�Ef fective Som ewhat
__ __,Effective __ __,No Effect
1 2 . How do you feel the presence of the noise barrier has affected the value of your property?
Decreased ___ Significantly
Decreased Som ewhat
No __ ...:Effect
Increased Som ewhat --
1 3 . I f the noise barrier had not been built , d o you feel that you would use your yard mor e , les s , or the same amount?
More ---' Less ---' Same Am ount ---'
1 4 . How d o you feel about the noise barrier in general?
___ L.ike __ ....:
Dislike ___ N.o Opinion
Please feel free to s ubmit any further comments about the noise barrier here . Thank you . Your help is sincerely appreciated .
62


![Lapres Akustik & Getaran [Noise Barrier]](https://img.pdfslide.net/doc/110x75/5599c6321a28ab0e618b460a/lapres-akustik-getaran-noise-barrier.jpg)