Embed Size (px)
Citation preview

Louisiana State UniversityLSU Digital Commons
LSU Historical Dissertations and Theses Graduate School
2000
Effectiveness of Using an Enterprise System toFacilitate Process -Centered Learning in BusinessEducation.Jose H. NogueraLouisiana State University and Agricultural & Mechanical College
Follow this and additional works at: https://digitalcommons.lsu.edu/gradschool_disstheses
This Dissertation is brought to you for free and open access by the Graduate School at LSU Digital Commons. It has been accepted for inclusion inLSU Historical Dissertations and Theses by an authorized administrator of LSU Digital Commons. For more information, please [email protected].
Recommended CitationNoguera, Jose H., "Effectiveness of Using an Enterprise System to Facilitate Process -Centered Learning in Business Education."(2000). LSU Historical Dissertations and Theses. 7162.https://digitalcommons.lsu.edu/gradschool_disstheses/7162

INFORMATION TO USERS
This manuscript has been reproduced from the microfilm master. UMI films the text directly from the original or copy submitted. Thus, some thesis and dissertation copies are in typewriter face, while others may be from any type of computer printer.
The quality of th is reproduction is dependent upon the quality of the copy submitted. Broken or indistinct print, colored or poor quality illustrations and photographs, print bleedthrough, substandard margins, and improper alignment can adversely affect reproduction.
In the unlikely event that the author did not send UMI a complete manuscript and there are missing pages, these win be noted. Also, if unauthorized copyright material had to be removed, a note will indicate the deletion.
Oversize materials (e.g., maps, drawings, charts) are reproduced by sectioning the original, beginning at the upper left-hand comer and continuing from left to right in equal sections with small overlaps.
Photographs included in the original manuscript have been reproduced xerographically in this copy. Higher quality 6" x 9" black and vtfiite photographic prints are available for any photographs or illustrations appearing in this copy for an additional charge. Contact UMI directly to order.
Bell & Howell Information and Learning 300 North Zeeb Road, Ann Arbor, Ml 48106-1346 USA
800-521-0600
Reproduced with permission of the copyright owner. Further reproduction prohibited without permission.

Reproduced with permission of the copyright owner. Further reproduction prohibited without permission.

EFECTTVENESS OF USING AN ENTERPRISE SYSTEM TO FACILITATE PROCESS-CENTERED LEARNING IN BUSINESS EDUCATION
A Dissertation
Submitted to the Graduate Faculty of the Louisiana State University
and Agricultural and Mechanical College in partial fulfillment of the
requirements for the degree of Doctor o f Philosophy
in
The Interdepartmental Program in Business Administration
(Information Systems and Decision Sciences)
byJose H. Noguera
B.S. University o f South Carolina, 1991 M.S. Louisiana State University, 1994 M.S. Louisiana State University, 1996
May, 2000
Reproduced with permission of the copyright owner. Further reproduction prohibited without permission.

UMI Number. 9963957
___ ®
UMIUMI Microform 9963957
Copyright 2000 by Bell & Howell Information and Learning Company. All rights reserved. This microform edition is protected against
unauthorized copying under Title 17, United S tates Code.
Bell & Howell Information and Learning Company 300 North Zeeb Road
P.O. Box 1346 Ann Arbor. Ml 48106-1346
Reproduced with permission of the copyright owner. Further reproduction prohibited without permission.

I dedicate this work to
my wife Mercedes and my son
Joseph
Reproduced with permission of the copyright owner. Further reproduction prohibited without permission.

ACKNOWLEDGEMENTS
I gratefully acknowledge the invaluable support o f my major professor, Dr. Edward
Watson, who made possible for me to complete this work. Thanks also to my committee
members; Dr. Helmut Schneider, Dr. Dan Rinks, Dr. Peter Kelly, and Dr. Kenneth Walsh
for their critical reviews of the document and many helpful suggestions. I specially thank
Dr. Peter Kelly and Dr. Dan Rinks for their support and assistance with data collection.
I am very thankful to many others who collaborated in this research, providing
support and valuable information; Dr. Lisa Murphy who helped me with data collection
and suggestions, the Information Systems Department secretary and technical staff.
I also thanks the fellow graduates students and faculty for providing advice and
companionship. Thank you all.
I am very thankful to two very special friends, Dr. Fred Bryan and Miss. Barbara
Bryan. There is not doubt that their friendship, support, and help are invaluable. Thank you
very much, you are too special.
Special thanks are to my family for their support and understanding and to my wife
Mercedes for being my life, I could not have done it without her. I thank God for them and
for giving me strength when most needed.
Reproduced with permission of the copyright owner. Further reproduction prohibited without permission.

TABLE OF CONTENTS
ACKNOWLEDGMENTS------------------------------------------------------------------------- iil
LIST OF TABLES-----------------------------------------------------------------------------------vi
LIST OF FIG U R ES_____________________________________________________ ix
ABSTRACT____________________________________________________________ x
1. INTRODUCTION_____________________________________________________ 11.1. The Problem Area................................................................................................... 11.2. SAP University Alliance Program........................................................................ 31.3. Integration o f SAP into the Business Curriculum...............................................41.4. Research Questions............................................................................................... 111.5. Objectives.............................................................................................................. 121.6. Contribution o f the Study..................................................................................... 131.7. Organization o f this Document........................................................................... 14
2. LITERATURE REV IEW ______________________________________________152.1. Learning Theory and Curriculum Development............................................... 152.2. Instructional Design............................................................................................. 222.3. Assessment............................................................................................................332.4. Related Previous Research.................................................................................. 342.5. Summary............................................................................................................... 41
3. THEORETICAL FRAM EW ORK______________________________________423.1. Leidner and Jarvenpaa’s Electronic Classroom Learning Model.................... 423.2. Bostrom, Oilman, and Sein’s End-User Training M odel.................................433.3. Research M odel....................................................................................................483.4. Hypotheses............................................................................................................513.5. Summary............................................................................................................... 56
4. RESEARCH M ETHODOLOGY_______________________________________584.1. Research Design...................................................................................................584.2. Course Description.............................................................................................. 614.3. Population and Sample.........................................................................................614.4. Research Variables.............................................................................................. 634.5. Experimental Design Structure............................................................................674.6. Experimental Procedure.......................................................................................684.7. Summary............................................................................................................... 70
5. DATA COLLECTION AND MEASURES______________________________ 715.1. Data Collection..................................................................................................... 715.2. Operationalization o f Research Variables..........................................................715.3. Summary............................................................................................................... 74
iv
Reproduced with permission of the copyright owner. Further reproduction prohibited without permission.

6. DATA ANALYSIS AND RESULTS____________________________________756.1. Statistical Technique for the Analysis...............................................................756.2. Experiment I (BADM 7120).............................................................................. 816.3. Experiment II (ISDS 3115)................................................................................ 926.4. Experiment HI (ISDS 3100)............................................................................. 1126.5. Summary............................................................................................................ 120
7. DISCUSSION AND CONCLUSIONS__________________________________1217.1. Review o f the Findings..................................................................................... 1217.2. Discussion..........................................................................................................1247.3. Conclusions........................................................................................................129
8. CONTRIBUTIONS, LIMITATIONS, AND FUTURE RESEARCH-----------1328.1. Contribution o f the Study-------------------------------- ------ — ------------------1328.2. Limitations o f the Study....................................................................................1348.3. Future Research................................................................................................. 136
REFERENCES________________________________________________________139
APPENDIX A - PRELIMINARY SURVEY_________________________ 147
APPENDIX B - KOLB’S LEARNING STYLE INVENTORY----------------------148
APPENDIX C - INITIAL KNOWLEDGE/SKILLS ASSESSMENT_________149
APPENDIX D - MEASUREMENT PERFOM ANCE______________________ 154
APPENDIX E - MEASUREMENT SELF-EFFICACY ............................161
APPENDIX F - END-USER COMPUTING SATISFACTION______________163
APPENDIX G - USER LECTURE SATISFACTION______________________ 164
APPENDIX H - LECTURE SESSION EVALUATION____________________.165
VITA................................................................................................................................. 166
V
Reproduced with permission of the copyright owner. Further reproduction prohibited without permission.

LIST OF TABLES
Table I - Classification o f Experiments by Academic Program and Content/Task..... 59
Table 2 - Sample Size by Course...................................................................................... 62
Table 3 - Variables to be Considered in the Study.......................................................... 63
Table 4 - Experimental Design Structure for Experiment II ...........................................68
Table 5 - Summary Description o f the Main Attributes of the Experiments................70
Table 6 - Factor Analysis for Multiple-Item Measures, Factor 1.................................... 82
Table 7 - Number of Items and Coefficient Alpha Reliability Estimates for theStudy’s Variable.................................................................................................. 83
Table 8 - Summary o f Response Percentages for Subject’s Atributes byExperimental Group...........................................................................................85
Table 9 - Summary of Mean Responses and Standard Deviations o f Overall Sample from Previous Experience with and Current Use o f Computer Technology Survey.................................................................................................................. 87
Table 10 - Descriptive Statistics for Outcome and Other Variables by ExperimentalGroup (Mean ± Std)..........................................................................................87
Table 11 - Pearson Correlation Coefficients (alpha = 0.05, n = 5 3 ) ..............................88
Table 12 - Results of Kruskal—Wallist T est.....................................................................88
Table 13 - ANOVA Table for Student’s Performance...................................................90
Table 14 - ANOVA Table for Student’s Self-Efficacy..................................................90
Table 15 - ANOVA Table for Student’s Computer Satisfaction..................................90
Table 16 - Power Calculations for Tested Variables....................................................... 91
Table 17 - Results of Kruskal-Wallist Test......................................................................91
Table 18 - Factor Analysis for Multiple-Item Measures, Factor 1.................................. 93
Table 19 - Number o f Items and Coefficient Alpha Reliability Estimates for theStudy’s Variables..............................................................................................94
vi
Reproduced with permission of the copyright owner. Further reproduction prohibited without permission.

Table 20
Table 21
Table 22 ■
Table 23 ■
Table 24
Table 25 •
Table 26 ■
Table 27 ■
Table 28 •
Table 29 ■
Table 30 •
Table 31 •
Table 32 •
Table 33 •
Table 34
Table 35
Table 36
Distribution o f Subjects by Experimental Group and Learning Style Mode..................................................................................................................95
Summary o f Response Percentages for Subject’s Attributes by Experimental Group........................................................................................ 97
Summary of Mean Responses and Standard Deviations o f Overall Sample from Previous Experience with and Current Use o f Computer Technology Survey................................................................................................................98
Knowledge/Skills Assessment, Test Scores by Experimental Group and Learning Style..................................................................................................99
- Descriptive Statistics for Dependent Variables by Experimental Group and Learning Style............................................................................................... 100
Mean Standard Deviation for Attitude Toward Computers, Lecture Satisfaction, and Lecture Evaluation Measures by Experimental Group and Learning Style..........................................................................................101
Pearson Correlation Coefficients (n=217)................................................... 102
Hypotheses to be Tested.................................................................................104
ANOVA Table for Student’s Performance.................................................. 105
ANOVA Table for Student’s Self- Efficacy................................................ 106
ANOVA Table for Student’s Satisfaction................................................... 106
Power Calculations for Tested Hypotheses.................................................. 107
Pearson Correlation Coefficients (R) among Outcome Variables by Experimental Group.......................................................................................108
Standardized Path Coefficients for Performance and Satisfaction Variables by Experimental Group (* Significant at alpha = 0.05).............. 110
• Factor Analysis and Coefficient Alpha Reliability Estimates for the Study’s Variables............................................................................................113
Summary o f Response Percentages for Subject’s Attributes by Experimental Group.......................................................................................114
■ Summary o f Mean Responses and Standard Deviations of Overall Sample from Previous Experience with and Current Use o f Computer Technology Survey.........................................................................................115
VU
Reproduced with permission of the copyright owner. Further reproduction prohibited without permission.
Table 37 - Descriptive statistics for Outcome and Other Variables by ExperimentalGroup (Mean ± Std)..........................................................................................115
Table 38 - Pearson Correlation Coefficients (alpha = 0.05, n=53).............................. 116
Table 39 - Results of Kruskal-Wallis Test......................................................................116
Table 40 - ANOVA Table for Student’s Performance...................................................117
Table 41 - ANOVA Table for Student’s Self- Efficacy.................................................118
Table 42 - ANOVA Table for Student’s Computer Satisfaction..................................118
Table 43 - Power Calculations for Tested Variables......................................................118
viii
Reproduced with permission of the copyright owner. Further reproduction prohibited without permission.

LIST OF FIGURES
Figure 1 - SAP University Alliance (SAP-UA), Where Business Education Meets ERP Industry and the Process-Centered Organization.................................. 4
Figure 2 - Instructional Technology in Education (IT in Education), WhereBusiness Education Meets the SAP R/3 system...............................................8
Figure 3 - Kolb’s Model o f Experiential Learning (Kolb, 1984)...................................17
Figure 4 - Comprehensive Experimental Training Model (Simon, et aL, 1996).......... 21
Figure 5 - Steps for Designing Instructional Material--------------------------- 26
Figure 6 - The Electronic Classroom Learning Model (Leidner and Jarvenpaa,1993).................................................................................................................. 43
Figure 7 - The Research Model for End-User Training (Bostrom, et aL,1990)........... 44
Figure 8 - Research M odel................................................................................................ 49
Figure 9 - Lecture Content................................................................................................ 65
Figure 10 - Experimental Procedure.................................................................................69
Figure 11 - Initial Theoretical Model.............................................................................. 109
Figure 12 - Revised Theoretical Model by Experimental Group, where PI to P4 arePath Coefficients to be Estimated and E1-E4 Represent Residual Terms 109
ix
Reproduced with permission of the copyright owner. Further reproduction prohibited without permission.

ABSTRACT
This research investigates the effectiveness of using a commercial Enterprise
Resource Planning System (ERP) as a supplement tool to teach Enterprise Information
Systems concepts in Business Schools.
A state-of-the-art ERP System is an integrated enterprise software system that
has a windows-based interface, a client-server architecture, and a modular and
expandable structure. This complex computer environment provides a rich content
domain where students can get exposure to key business, computer science, data
communication, and information systems concepts.
A significant challenge facing business school educators is to identify how best
to deploy a commercial ERP System in their academic environment. Furthermore, an
issue that must be addressed, before implementing any new educational innovation, is
whether the costs of changing the curriculum and then maintaining the new program
will be justified in terms o f learning effectiveness and efficiency.
To date, the educational benefits of the instructional uses o f commercial ERP
systems such as the SAP R/3 System have been established on the basis o f anecdotal
statements from faculty and students rather than on empirical and objectively measured
data secured by sound research methods.
Thus, the main objectives of this study are to determine whether or not student’s
performance, self-efficacy, and satisfaction are enhanced by the use of an ERP System
as a support tool in learning business processes.
This study compares three delivery instructional methods. A traditional
instruction method (lecture format plus reading/exercises) acts as the control. The
x
Reproduced with permission of the copyright owner. Further reproduction prohibited without permission.

1. INTRODUCTION
This presentation outlines the challenges facing business schools in order to
remain current with key business and business systems concepts, provides an overview of
what is being done to meet those challenges, and discusses possible implications for the
future. The chapter concludes with the research questions, the objectives, and
contributions o f this study.
1.1. The Problem Area
Business education, in particular Information Systems (IS) education, must
constantly change in order to stay on top of key business and business systems concepts.
How enterprise systems support the process-centered organization is a relatively new
concept being taught today.
Enterprise systems, such as the Systems, Applications and Products in Data
Processing, Release 3.0 (SAP R/3 System), support the need for enterprises to move from
functional-oriented to process-oriented structures by taking a very process-oriented view
of the business. “Process centering, more than anything else, means that people-all
people-in the company recognize and focus on their processes....The key word...is
‘process’: a complete end-to-end set of activities that together create value to the
customer” (Hammer, 1996).
A state-of-the-art Enterprise System is an integrated enterprise software system
(generically referred to as Enterprise Resource Planning, or ERP) which has a windows-
based interface, a client-server architecture, and a modular (each module is dedicated to a
different area o f business activities) and expandable structure. An ERP System
l
Reproduced with permission of the copyright owner. Further reproduction prohibited without permission.

information infrastructure supports fundamental business processes o f a firm , such as
customer order processing, production order processing, purchase order processing, long-
range planning, performance reporting, financial reporting, and accounting. Thus, the
market for people, who can understand, work with, and implement these systems to
support the process-centered organization, is strong and growing (Watson and Schneider,
1999).
To become process-centered, an organization requires a transformation o f its
workforce. Each worker will transform him or herself into a professional, “someone who
is responsible for achieving a result rather than performing a task” (Hammer, 1996). “A
worker is a kind o f organic robot, operated by a manager via remote control.
Professionals, on the other hand, possess ‘whole jobs,’ where they act and think for
themselves” (Hammer, 1996). In addition, “One of the biggest shifts for an agile
company is the shift away from functional or departmental thinking to process thinking.
Functional thinking causes workers to think about their job and their department. Process
thinking, on other hand, helps workers understand how potential improvements affect the
company as a whole” (Howardell, 1999).
Thus, the increasing application o f information technologies to support process-
centered organization requires Business/Information Systems professionals to possess in-
depth business functional knowledge and skills (Davenport and Short, 1990; Farmer,
1987; Hammer, 1990; Sullivan-Trainor, 1988; Nelson, 1991). Furthermore, a student’s
success in the process-centered organization demands increasingly effective and efficient
learning o f Enterprise Resource Planning systems such the SAP R/3 System. Thus,
2
Reproduced with permission of the copyright owner. Further reproduction prohibited without permission.

business schools are expected to graduate students with experience in these emerging
technologies (Alavi, et al., 1995).
On the other hand, previous research suggests that the current Information
Systems curricula in many universities are not well aligned with business needs (Lee, et
al., 1995a). Faced with this challenge, a number of business schools have started the
process of redesigning curriculums (i.e., Accounting, Information Systems, Finance,
Human Resources, Operations Management) and instructional methods a t both
undergraduate and graduate levels. Most of the educational reengineering efforts are
supported by the use of ERP systems such as SAP R/3 System provided by the SAP
University Alliance Program.
1.2. SAP University Alliance Program
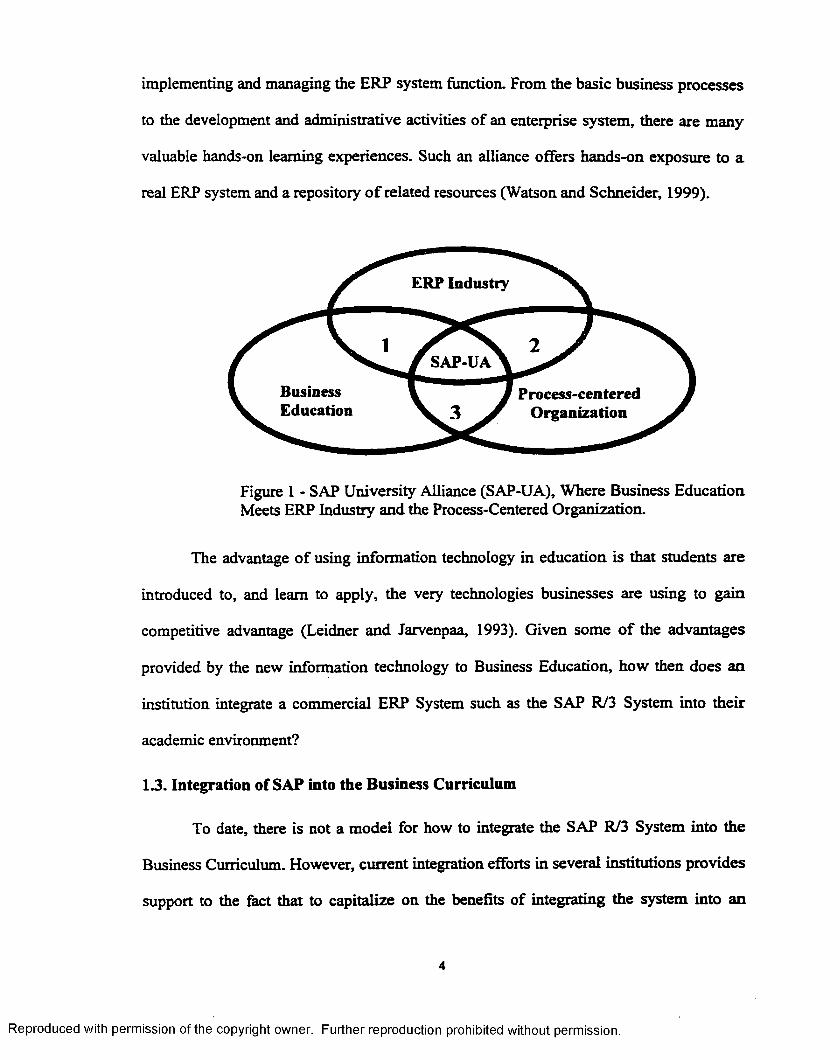
The SAP University Alliance (SAP-UA) program provides the link between
Business Education, the ERP industry, and the Process-Centered Organization (Figure 1).
Figure 1 illustrates the importance o f SAP-UA in closing the gap between business
education and business needs (Lee, et al., 1995a). Without the SAP-UA, isolated
partnerships (represented by numbers 1, 2 and 3 in Figure 1) must be established among
the three entities (Business Education, ERP Industry, and Process-Centered
Organization).
Basically, the SAP-UA Program provides an academic entity (e.g., a University,
College, School, or Department) with a completely functional SAP R/3 system for
teaching and research. The program provides significant learning opportunities in the
classroom. Students can develop a deeper and broader understanding o f both the role that
ERP Systems plays in a process-centered organization and the challenging task of
3
Reproduced with permission of the copyright owner. Further reproduction prohibited without permission.
implementing and managing the ERP system function. From the basic business processes
to the development and administrative activities of an enterprise system, there are many
valuable hands-on learning experiences. Such an alliance offers hands-on exposure to a
real ERP system and a repository o f related resources (Watson and Schneider, 1999).
ERP Industry
SAP-UA
BusinessEducation
Process-centeredOrganization
Figure 1 - SAP University Alliance (SAP-UA), Where Business Education Meets ERP Industry and the Process-Centered Organization.
The advantage o f using information technology in education is that students are
introduced to, and leam to apply, the very technologies businesses are using to gain
competitive advantage (Leidner and Jarvenpaa, 1993). Given some o f the advantages
provided by the new information technology to Business Education, how then does an
institution integrate a commercial ERP System such as the SAP R/3 System into their
academic environment?
1.3. Integration of SAP into the Business Curriculum
To date, there is not a model for how to integrate the SAP R/3 System into the
Business Curriculum. However, current integration efforts in several institutions provides
support to the fact that to capitalize on the benefits of integrating the system into an
4
Reproduced with permission of the copyright owner. Further reproduction prohibited without permission.

academic environment, an institution must first identify how to use the new inform ation
technology. Once a decision has been made to use the system, a set o f questions tends to
resolve around the implications o f such system on business education (i.e., curriculum
development, instruction, and assessment).
1.3.1. SAP R/3 System Use in a Business Curriculum
A number o f potential applications of the SAP R/3 system in Business Schools
have been identified (Watson and Schneider, 1999):
1. R/3 as a computer-based simulator:
Simulations are representations of reality and provide an interactive learning
environment. The learners’ actions are followed by feedback that allows the learner to
deduce relationships between the variables and to formulate hypotheses about the effects
of future manipulations. “Students learn not by memorization but by doing, albeit in a
simulated environment” (Ives and Jarvenpaa, 1996). Business schools are known for
their business simulators that create pseudo-corporate environments and challenge the
decision-making skills o f the students that play them. ERP systems provide such an
environment in which to work. Compared to traditional simulators, ERP systems would
be simulated at the transaction level. Unfortunately, such capabilities do not necessarily
exist in commercial systems. Thus, to use R/3 as a computer-based simulator requires
further research into the capabilities o f specific systems.
2. R/3 for exposing students to the real business world in the classroom:
An ERP system provides a 'real-world exposure.' Student can take a look inside
and see how the ERP system is built and can take it for a test run. After a few years o f a
traditional ‘stove-pipe* business education, students still have trouble understanding how
5
Reproduced with permission of the copyright owner. Further reproduction prohibited without permission.
all the components o f an integrated system fit together. The ERP system provides this
perspective. Students also have access to the “best practices” business models available
in ERP systems.
3. R/3 for supporting a cross-functional curriculum:
Cross-functional business programs have recently regained popularity. ERP
systems can be customized to fit the business processes (cross-functional) defined by an
organization. As such, cross-functional case studies can be developed for an ERP system
where students are required to solve a business problem using that system. Any ERP-
based exercise is a cross-functional exercise, but in-depth ERP-based case studies (that
rival popular cross-functional Harvard Business School cases) are only beginning to
develop.
4. R/3 for enriching specific curricula:
Many business schools are now seeking ways to increase the use o f technology-
supported learning in their existing programs. Specific curricula, at the local level, can
easily be enriched using an ERP system, as this paper illustrates. Traditional ERP
educational material, generally geared toward an end-user audience, must be reworked in
order to consider it university-level educational material.
5. R/3 for research:
ERP systems create research opportunities. How these systems are developed,
implemented, used, and how they will grow, present many opportunities for research.
6. R/3 for creating a competitive advantage:
As indicated earlier in this chapter, an industry has been created based on ERP
systems success. These systems spawned a new job market that has consulting firms and
6
Reproduced with permission of the copyright owner. Further reproduction prohibited without permission.

corporate leaders rethinking recruiting strategy. In addition, they provide an opportunity
for academic units to develop a competitive advantage over rival schools.
Engaging in an ERP initiative can be justified simply by the need to know.
Universities are criticized for their ignorance of and isolation from industry. Students and
faculty knowledgeable about ERP systems help enhance the credibility o f business
schools in the eyes o f industry. Watson and Schneider (1999) suggest that all o f the above
ways to use the SAP R/ 3 System are reasonable but some are more difficult to achieve
than others. In addition, a significant amount o f time, effort, and money is required to
ensure a successful integration o f the SAP R/3 System into the business curriculum
(Watson and Schneider, 1999).
To date, the SAP R/3 System is being used primarily, with the objective of
providing Business/IS students exposure to the real-world from the classroom. In
addition, the SAP R/3 System is being used to enrich specific curriculum such as
operations management, management information systems, accounting, human resources,
etc. However, as stated by Horgan (1998), “Many well-meaning efforts at integrating
technology into the curriculum have failed because they begin with the technology, rather
than with teaching and learning outcomes.” Thus, after identifying the potential use of
the SAP R/3 System in Business Education, one must focus on the implications o f a
particular use of the system in content, instruction, and assessment.
1.3.2. Implications o f Using the SAP R/3 in Business Education
The field of Instructional Technology (IT-in education) embraces the ideas that
determine how learning should be designed and the implications o f integrating the SAP
R/3 System into Business Education. Figure 2 illustrates how important developments in
7
Reproduced with permission of the copyright owner. Further reproduction prohibited without permission.

Instructional Technology in education are in determining the most effective way to
integrate the SAP R/3 System into business education.
SAP R/3
IT in Education \
Business Education
Curriculum
Instruction
Assessment
Figure 2 - Instructional Technology in Education (IT in Education),Where Business Education Meets the SAP R/3 System.
For the purpose o f this study, instructional technology is defined as the use o f any
Information Technology means (i.e., systems, computers, CD-ROMs, CBT, interactive
media, modems, satellite, teleconferencing, etc.) to support learning.
The use of the SAP R/3 System as a teaching tool, to support learning in business
education, has serious implications for decisions regarding curriculum development
(selection and scope o f the content), instruction (which organizational, delivery, and
management strategies should be employed when presenting that content), and
assessment (determining effectiveness of the new learning environment).
1.3.2.1. Curriculum
The educational implications of the SAP R/3 System, to support business
education, are substantial and not difficult to demonstrate in relation to course content
8
Reproduced with permission of the copyright owner. Further reproduction prohibited without permission.
and quality, but the system’s real effectiveness in student performance is unknown. In
content, the SAP R/3 System allows departments to undertake realistic laboratory work
(supplement theory with hands-on application) in support o f courses relating to ERP, IS
strategy, Business Process Reengineering (BPR), Electronic Commerce (EC), Supply
Chain Management (SCM), and Change Management. Furthermore, the R/3 system
supports the teaching of practical knowledge concepts such as integrated business
processes, workflow, system administration, process mapping, etc.
In quality, a basic effect is to facilitate a change from teacher-centered methods of
instruction o f a high prescribed and closed nature to various student-centered approaches.
Examples include laboratory classes with hands-on training, Graphical User Interface
(GUI) navigation, GUI design, transaction processing & control, management reports,
system management, testing, etc. In addition, an integrated software system such as the
SAP R/3 System can be used to give students an appreciation o f information systems
(client/server systems) and the data-processing (relational databases) principles involved
in areas such as accounting, finance, manufacturing, etc. These systems give students
insight into many issues, for example, source document design and use; data integrity and
security; and accounting, finance, manufacturing, etc., principles in real practice.
Thus, the SAP R/3 System in business education provides a number o f benefits in
content and quality o f student learning/experiences and, almost incidentally, better
prepares them for the world o f work.
1.3.2.2. Instruction
A major implication of integrating the SAP R/3 System into the business
curriculum is related to the delivery o f the information (lectures) in the conventional
9
Reproduced with permission of the copyright owner. Further reproduction prohibited without permission.

instruction mode. In general, conventional instruction is marked by instructor-provided
learning objectives and assignments, Iarge-group lectures, structured laboratory
experiences, and periodic multiple-choice tests o f achievement. The R/3 system could
significantly affect the role of teachers, as well as the structure o f schools and classrooms
in the conventional classroom. For example, the most popular approach to delivery of
concepts and facts is the lecture/textbook combination. In a typical lecture, a body of
knowledge, including facts and concepts, is doled out in fifty-minute increments to a
group of students by an instructor who talks for the vast majority of that period. The use
of the SAP R/3 System as a teaching tool in the classroom could change the teacher’s role
from expert to facilitator or coach.
To supplement the lecture and textbook, most instructors provide homework
exercises. These exercises usually serve two purposes — to let the student practice with
the material and give early feedback on learning outcomes (this approach derives from
the “active learn ing” literature, Bonwell and Eison, 1991). The SAP R/3 System can be
used to supplement lectures by providing the interactive learner with the opportunity to
experiment with concepts in a variety of settings. It provides opportunities to use a
concept in a framework that can be designed to reinforce learning.
1.3.2.3. Assessment
A relationship must be established among content, instruction, and assessment. In
general, computer-based instruction methods are assessed by using procedural and
exploratory types o f questions. On the other hand, conceptual and factual questions are
used in traditional instruction methods. Furthermore, instruction will focus more and
more on building feedback loops directly into the learning process.
10
Reproduced with permission of the copyright owner. Further reproduction prohibited without permission.

Thus, our understanding of what students should leam, the effective ways to help
them learn, and assessment of how much they learned should drive our instruction. On
the other hand, information technology should serve content and pedagogy. Yet
information technology has changed content and allows new forms of effective
pedagogy.
1.4. Research Questions
Watson and Schneider pointed out:
For academic entities interested in providing an experiential-learning based hands-on approach to ERP systems education, there are a number o f issues to consider. For example, what is the objective of an ERP initiative, how is an ERP system utilized by students, how does this enrich the curriculum, what are the benefits, and what are the costs? (1999)
To date, the educational benefits o f instructional uses of the SAP R/3 System have
been established on the basis of anecdotal statements from faculty and students rather
than on empirical and objectively measured data secured by educational research
methods. On the other hand, there is no single research effort focusing on the question
related to the effectiveness of using the SAP R/3 System to facilitate knowledge/skills
and understanding o f contemporary business processes at the undergraduate or graduate
levels.
The fact is, when new instructional methods are developed, the problem of
assessing the method arises. Research questions such as the following should be
answered:
1. Does the new instructional method improve student performance?
2. Does the new instructional method promote a positive attitude o f acceptance?
ti
Reproduced with permission of the copyright owner. Further reproduction prohibited without permission.
3. Does the new instructional method heighten interest in further study o f the subject
matter?
4. What are the longitudinal effects on retention in the new instructional method?
5. What is the cost of the old versus the new instructional method?
6. What specific group activities work best in helping students learn particular
concepts and develop particular skills?
7. What types o f assessment procedures and instructional materials best inform
teachers about students’ understanding?
These are but a few of the possible research questions that might be considered.
This research focuses on effectiveness issues that address the following specific research
questions in the context o f ERP education:
(1) How effective is an instructional method that uses the SAP R/3 System as a
support tool when compared to the traditional instructional method? (2) Does it
lead to higher levels of performance, self-efficacy, and satisfaction?
1.5. Objectives
The main objective of this study is to determine whether or not student
performance, self-efficacy, and satisfaction are enhanced by a particular method of
instruction (i.e., traditional instruction, computer based hands-on the SAP R/3 System
and computer based simulated hands-on the SAP R/3). Specifically, the question is
whether using the SAP R/3 System, as a support tool for instruction, facilitates the
gaining o f knowledge and understanding o f business processes (i.e., Manufacturing
Planning and Execution Cycle, Order-to-Catch Cycle), focusing on relations among
12
Reproduced with permission of the copyright owner. Further reproduction prohibited without permission.

functions, logical connections and SAP system’s rules and coverage o f the different
operating steps.
A second objective is to determine whether or not learning styles as assessed by
the Learning Style Inventory (Kolb, 1985) affect learning outcomes within the
instructional methods.
1.6. Contribution of the Study
Stohr pointed out:
First, we have an obligation to our students and their future employers to teach effectively and to deliver an appropriate curriculum. Second, as the competition between business schools intensifies, teaching and curriculum issues are receiving more emphasis and teaching performance is becoming a more important input to faculty salary and promotion decision... There is therefore a pressing need for both IS practitioners and academics to understand the basics of effective teaching and to develop educational programs that fit the needs of their constituencies. This is specially true because the tools o f our own profession, computers and communication networks, promise to revolutionize the business of education. (1995)
From an educational research standpoint, the information collected in this study
can be used to build a body o f knowledge about students’ learning process when learning
about ERP systems. It answers an important question that still needs to be asked: how
does the use o f an ERP system improve student learning of particular concepts and help
overcome particular misconceptions? For example, what kind o f hands-on exercises work
best in developing the idea of particular concepts, such as a business process? Results of
this research, along with the base o f knowledge already existent on the use o f information
technology to enhance education, will help universities rethink what, in business
education, is most important to learn; how it should be taught; and what evidence of
success they should seek.
13
Reproduced with permission of the copyright owner. Further reproduction prohibited without permission.

The results o f the study will have strong implications for the education-
information technology research stream. The education sector can be guided by a better
understanding o f the way an enterprise system can be integrated into the business
curriculum. In addition, it is expected that this study will provide valuable empirical
information on the integration of the SAP R/3 System into the business school curricula
as a primary teaching tool to promote a more effective learning environment for business
education.
1.7. Organization of this Document
In Chapter 2, the fundamental concepts used in previous educational models are
established and some previous significant research is discussed. Training models are
discussed and utilized as theoretical framework to develop a research model in Chapter 3.
The research methodology employed in this study and discussion o f variables and
hypothesis to be tested are examined in chapter 4. Chapter 5 discusses data collection
and data analysis. Data analysis and results are reported in Chapter 6. The discussion and
conclusions o f the study are reported in Chapter 7 and contribution and limitations are
presented in Chapter 8, along with future research directions and suggestions.
14
Reproduced with permission of the copyright owner. Further reproduction prohibited without permission.

2. LITERATURE REVIEW
This chapter provides an overview o f the important theoretical and empirical
findings in the process of integrating information technology into the classroom. First,
three main questions to be addressed when integrating Information Technology (IT) into
Education are examined: 1) How do students leam and what should be learned? (learning
theory and curriculum development), 2) How should learning be designed? (instructional
design), and 3) How will we know if learning occurs? (assessment). Then, a number of
areas of interest and research that focus on specific information technology issues and
their relation to education/training are presented. This review focuses on an examination
of Learning Theory and Instructional Design.
2.1. Learning Theory and Curriculum Development
When describing how students leam or think, a particular learning theory has
implications for the way of structuring the learning material (curriculum development)
and the role o f the student in the learning process (learning style) (Kolb, Robin, and
McIntyre, 1974). On the other hand, determining the effectiveness o f computer-related
technologies on learning must take place within a theoretical framework to be meaningful
(Jarvenpaa, et al., 1985). Thus, this research uses the Experiential Learning Theory
(Kolb, 1984) as platforms to investigate learning effectiveness o f computer-supported
instruction.
The Experiential Learning Theory (Kolb, 1984) conceptualizes the learning
process in such a way that differences in learner styles and corresponding learning
environments can be identified. Briefly, the theory contends that an effective learner has
four different abilities (called learning modes) — concrete experience (CE) skills,
15
Reproduced with permission of the copyright owner. Further reproduction prohibited without permission.

reflective observation (RO) skills, abstract conceptualization (AC) skills, and active
experimentation (AE) skills (Figure 3). That is to state that the learner must be able: 1) to
get involved fully, openly, and without bias in new experiences, the emphasis is on
feelings as opposed to thinking; 2) to reflect on and interpret these experiences from
different perspectives, the emphasis is on understanding as opposed to practical
application; 3) to create concepts that integrate these observations in logically sound
theories, it emphasizes thinking as opposed to feeling; and 4) to use these theories to
make decisions and solve problems leading to new experiences, the emphasis is on
practical applications.
The basic premise o f experiential learning theory is a simple description o f the
learning cycle, o f how experience is translated into concepts that, in turn, are used as
guides in the choice of new experiences (Kolb, Rubin, and McIntyre, 1974). Each step or
mode (Figure 3) emphasizes different preferences. Using Concrete Experience (CE),
individuals immerse themselves affectively in the immediacy o f the learning experience.
Those preferring Abstract Conceptualization (AC) take a rational and logical approach.
With Reflective Observation (RO), a person impartially views a situation from many
different perspectives. Those using Active Experimentation (AE) risk active
participation in learning with “hands on” approaches. Typically, an individual begins the
learning cycle by first having an immediate experience, which becomes the basis of
observations and reflections. The individual then assimilates these observations and
reflections into testable hypotheses, the learner creates a new concrete experience and
starts the cycle anew.
16
Reproduced with permission of the copyright owner. Further reproduction prohibited without permission.
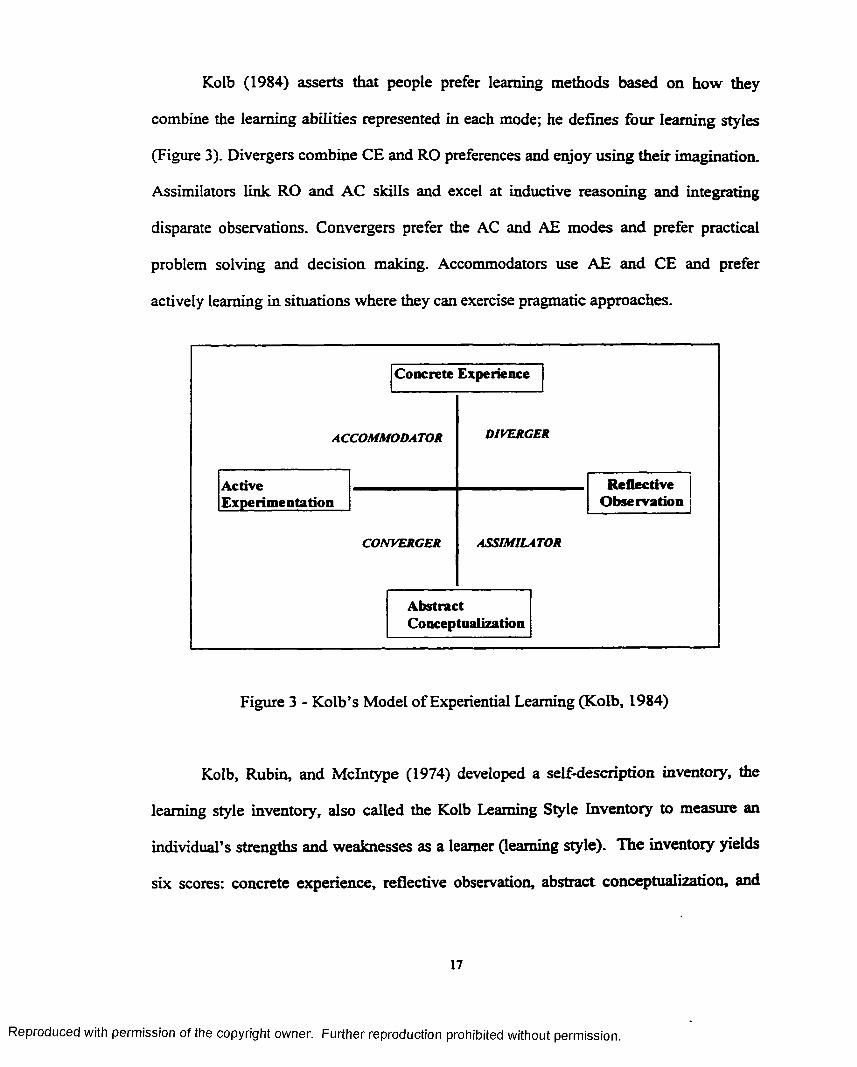
Kolb (1984) asserts that people prefer learning methods based on how they
combine the learning abilities represented in each mode; he defines four learn ing styles
(Figure 3). Divergers combine CE and RO preferences and enjoy using their im agination
Assimilators link RO and AC skills and excel at inductive reasoning and integrating
disparate observations. Convergers prefer the AC and AE modes and prefer practical
problem solving and decision making. Accommodators use AE and CE and prefer
actively learning in situations where they can exercise pragmatic approaches.
ReflectiveObservation
Concrete Experience
ActiveExperimentation
AbstractConceptualization
ACCOMMODATOR
CONVERGER ASSIMILATOR
DIVERGER
Figure 3 - Kolb’s Model of Experiential Learning (Kolb, 1984)
Kolb, Rubin, and Mclntype (1974) developed a self-description inventory, the
learning style inventory, also called the Kolb Learning Style Inventory to measure an
individual's strengths and weaknesses as a learner (learning style). The inventory yields
six scores: concrete experience, reflective observation, abstract conceptualization, and
17
Reproduced with permission of the copyright owner. Further reproduction prohibited without permission.

active experimentation, plus two combination scores that indicate the extent to which the
individual emphasizes abstractness over concreteness (abstract conceptualization*
concrete experience) and the extent to which an individual emphasizes active
experimentation over reflective observation (active experimentation-reflective
observation). Four dominant learning styles can be identified from these scores: the
converger, the diverger, the assimilator, and the accommodator (Figure 3).
The converger’s dominant learning abilities are abstract conceptualization and
active experimentation and their greatest strength lies in the practical application o f ideas.
The diverger (opposite o f convergers) is best at concrete experience and reflective
observation with strong imaginative ability. The diverger excels at viewing concrete
situations from many perspectives. The assimilator’s strengths are in abstract
conceptualization and reflective observation and are strong in creating theoretical models.
Finally, the accommodator (opposite o f assimilator) is best at concrete experience and
active experimentation and his/her strength lies in performing tasks such as carrying out
plans and experiments.
The scores from the Kolb Learning Style Inventory form can be plotted on a
graph with a difference (active experimentation-reflective) observation score on x-axis
and a difference (average abstract conceptualization-concrete experience) score on y-axis.
Intersection of these two average scores determines the location on one of the quadrants
on the graph. The first quadrant represents a diverger, the second an accommodator, the
third a converger, and the fourth an assimilator (Figure 3).
The Kolb Learning Style Inventory has been criticized as having poor construct
and face validity, poor reliability, and an abnormal distribution (Atkinson, 1989; Ruble
18
Reproduced with permission of the copyright owner. Further reproduction prohibited without permission.

and Stout, 1993). Atkinson (1991) evaluated the Kolb Learning Style Inventory and
reviewed studies o f the inventory’s design, reliability, and validity. Findings suggest tfrat
the inventory has weak internal consistency and weak stability. The 1985 revision o f the
Kolb Learning Style Inventory seems to have improved internal consistency, but stability
and classification reliability were unchanged.
Bostrom, Olfman, and Sein (1993) maintain that even though available learning
style instruments require additional validation, important research cannot always wait for
the perfect measurement. Bostrom, Olfman, and Sein (1993) further state that
imperfection in the 1976 version of the Kolb Learning Style Inventory did not
significantly affect the operationalization o f learning style in their studies. This research
will use the Kolb Learning Style Inventory to measure the learning styles o f end users as
suggested by Bostrom, Olfman, and Sein (1993).
There is a relationship between Kolb’s Experiential Learning Theory and
Learning Styles. If one assumes that all experiential learning flows sequentially through
Kolb’s four stages o f learning described earlier (Kolb, 1984), all four o f Kolb’s learning
types experience these four stages. Even though all learners cycle sequentially through
Kolb’s four learning stages while learning new material, not all learners can apply what
they have learned effectively and equally. Because o f their traits (as opposed to state)
each learner ultimately applies what they have learned according to Kolb’s four learning
styles. Thus, learning style is a trait-based phenomenon, whereas the learning process is
a state-based phenomenon. State refers to temporary behavior whereas trait is based on
the long-term behavior o f an individual (Spence, 1995).
19
Reproduced with permission of the copyright owner. Further reproduction prohibited without permission.

The Experiential Leaning Model (Figure 3) provides two fundamental dimensions
to the learning process: (1) concrete experiencing (CE) o f events at one end and abstract
conceptualization (AC) at the other and (2) active experimentation (AE) at one end and
reflective observation (RO) at the other.
The first dimension, CE-AC, provides the basis for curriculum development with
respect to the content o f instruction (Figure 4). It represents two types o f information
content provided to students during instruction: procedural knowledge and concepts and
general knowledge (Simon et al. 1996). Procedural knowledge emphasizes sequences of
steps that tell us how to reach a goal, such as steps necessary to complete a customer
order transaction in software application such as the SAP R/3 System. On the other hand,
concepts and general knowledge emphasizes the more abstract concepts and principles in
some area and tell us, for example, why an integrated system is important to manage
customer orders and provides background information about computers - some history,
components, and how computers work. Nearly, all learning tasks can be taught either
procedurally or declaratively or both. For example, we can know how to complete a
customer order without knowing why, and vice versa. In the case o f the SAP R/3 System
use, conceptual knowledge provides students with key concepts and information on
business processes. It helps students understand the reason to perform a particular
procedure using the system. On the other hand, procedural knowledge provides step-by-
step instructions to help students perform SAP tasks (transactions), some tasks o f which
can be demonstrated by the instructor during class.
The second dimension (Figure 4), AE-RO, represents a chain o f instruction
methods (Simon, et al., 1996). First, at one end o f the chain is the traditional instruction
20
Reproduced with permission of the copyright owner. Further reproduction prohibited without permission.

method that corresponds to reflective observation (RO), a condition where the
learner/trainee has a passive role in the learning process, the student listens and reflects
on the ideas presented by the instructor. Second, the instruction method, behavior
modeling, is a non-traditional technique occupying the middle o f the chain. This method
seeks to change the environment and conditions through which the student understands
and grasps material. The delivery is one that uses a combination of the previous
concepts, providing a lecture format driven by specific learning points and hands-on
experimentation. During the modeling treatment there is continuous feedback between
the instructor and the students, which encourages student participation and
experimentation (Simon, et al., 1996).
Concrete Experience (Procedural Knowledge)
ACCOMMODATORKnowledge/Style
Behavior Modeling
Training
Reflective Observation — (Instructional Training)
Active Experimentation (Exploration Training)
Abstract Conceptualization (Concepts & General Knowledge)
Figure 4 - Comprehensive Experimental Training Model (Simon, et al., 1996)
T hird, at the other end of the chain (Figure 4) is the exploration instruction
method, it matches the active experimentation anchor. This instruction technique
21
Reproduced with permission of the copyright owner. Further reproduction prohibited without permission.

emphasizes the concepts o f hands-on interaction and practical application as a means to
leam the material.
Kolb’s Experiential Learning Theory and Learning Styles (Kolb, 1984; Simon, et
al., 1996) provide an approach to learning that emphasizes the fact that individuals
perceive and process information in very different ways. The theory implies that the
amount o f learning by an individual is a function o f the fit between the educational
experience being provided and an individual’s particular style o f learning. The most
effective methods o f educating/training need to be matched with, the specific needs and
learning styles o f individuals (Nelson, 1991). As a result, the experiential learning theory
as well as an individual’s learning style has implication for curriculum development,
instruction, and assessment
Educators must place emphasis on intuition, feeling, sensing, and imagination, in
addition to traditional skills of analysis, reason, and sequential problem-solving when
developing curriculum material. Instruction methods should be designed to connect with
all four learning styles using various combinations o f experience, reflection,
conceptualization, and experimentation. For example, instructors can introduce a wide
variety of experiential elements into the classroom, such as sound, visuals, movement,
experience, etc. A variety of assessment techniques should be employed that focus on the
development o f “whole brain” capacity and each o f the different learning styles.
2.2. Instructional Design
Instructional design in education is like what architecture is to the building
industry (Jegede, Walkington, and Naidu, 1995). In a particular learning environment, the
expected outcomes o f learning are predetermined and are dependent on an efficient and
22
Reproduced with permission of the copyright owner. Further reproduction prohibited without permission.
effective design of instructional materials often undertaken by a group or team using
relevant ideas from learning theories (Jegede, et al., 1995).
The design and development of the course modules for the lessons that comprise
the treatments for this study is carried out following an instructional system design (ISD)
approach (Rothwell and Kazanas, 1998) to prescribing optimal learning performance.
The goal o f ISD is adaptive instruction, that is, tailoring learning materials to the
particular learning needs of the student at a particular time. ISD seeks to individualize
instruction by adapting to student needs, as these needs are inferred by the system. Thus,
adaptation requires that all students’ needs and system responses be essentially
preplanned and provided for explicitly in the system (Duchastel, 1986; Rothwell and
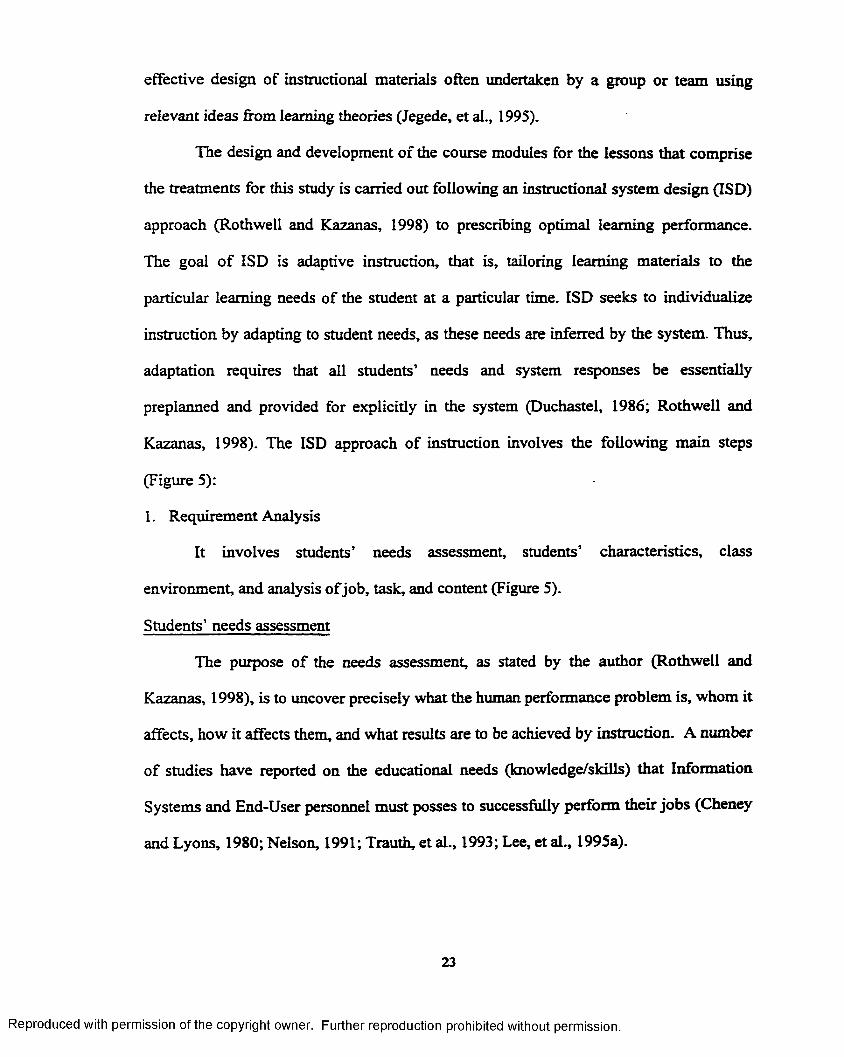
Kazanas, 1998). The ISD approach of instruction involves the following main steps
(Figure 5):
1. Requirement Analysis
It involves students’ needs assessment, students’ characteristics, class
environment, and analysis o f job, task, and content (Figure 5).
Students’ needs assessment
The purpose o f the needs assessment, as stated by the author (Rothwell and
Kazanas, 1998), is to uncover precisely what the human performance problem is, whom it
affects, how it affects them, and what results are to be achieved by instruction. A number
of studies have reported on the educational needs (knowledge/skills) that Information
Systems and End-User personnel must posses to successfully perform, their jobs (Cheney
and Lyons, 1980; Nelson, 1991; Trauth, et al., 1993; Lee, et al., 1995a).
23
Reproduced with permission of the copyright owner. Further reproduction prohibited without permission.

Nelson (1991) reviews the literature pertaining to learning needs of two distinct
classes of employees: IS and end-users personnel. Then based on his research findings,
he provides a number o f recommendations to IS practitioners and academicians: 1)
improve the general IS knowledge o f all employees. For example, it is apparent that both
IS and end-user personnel need to know more about such issues as the use of IS/IT for
competitive advantage, the fit between IS and the organization, and the potential for
information systems and technology within the organization. On the other hand, given the
role that higher education plays on the early stages of employee development, it is
recommended that universities pay more attention to the IS-related education o f all
students, regardless o f major; 2) improve the organizational knowledge of IS personnel.
IS employees need to know something about the environmental constraints within which
the organizations operates (e.g., government regulations, supplier relationships,
competition, etc.); 3) improve the technical and IS product-related skills o f end users.
Technical and IS product-related skills need to be learned as early in a student’s
education as possible and then updated and applied throughout the remainder of his or her
career; 4) educate IS and end-user personnel to make each more sensitive to the other’s
problems. There is a need to close the communication gap that frequently arises between
groups of personnel with dissimilar backgrounds. Often, IS personnel do not know
enough about the business they operate within, and end users do not know enough about
technology and its potential use within the business. Thus, the communication gap is due,
to a great extent, to the lack of knowledge between the two groups, thereby undermining
productivity within the organization. Education and training programs requiring group
discussion provide excellent opportunities to facilitate exchange o f personnel between
24
Reproduced with permission of the copyright owner. Further reproduction prohibited without permission.
functional areas; and 5) conduct periodic needs assessments. A number o f steps should be
undertaken to address the specific needs of individual organizations: a) conduct
knowiedge/skill needs assessment, b) determine requisite areas of significant deficiency,
c) determine appropriate education/training programs, d) implement education/tra in in g
program (s), and e) conduct post-education/training assessment
Lee, et al. (1995a) reports on the impact that current changes in the Information
Systems (IS) field have on the skills and knowledge requirements of IS professionals. He
investigates four broad categories of critical IS knowledge/skills requirements: 1)
technical specialties knowledge/skills, 2) technology management knowledge/skills, 3)
business functional knowledge/skills, and 4) interpersonal and management
knowledge/skills. Then he relates these requirements to the academic preparation of
future IS professionals. He recommends focusing on the career path of the graduates
when designing IS curriculum. For instance, two alternative curriculums could be
designed, one might prepare IS graduates to work in the central IS organization. Such a
curriculum would focus on technology specialties and technology management. The
other curriculum might focus on the growing area o f integrating information technology
with business needs (i.e., reengineering). Such a curriculum would require a radically
different combination of courses in technology, business, and behavioral science.
Furthermore, the content of various courses in each curriculum must be designed
specifically to meet the program’s particular career path objectives. For example, the
content of the systems analysis course would differ significantly for these two types of
programs. Systems analysis for the central IS organization would place new emphasis on
business plann ing and integration; whereas, systems analysis for the users would shift
25
Reproduced with permission of the copyright owner. Further reproduction prohibited without permission.

from the traditional systems development life cycle to business analysis and rapid
prototyping. In addition, some topics, such as systems integration, would be emphasized
across different IS curricula, but with different orientation. I f a program is preparing
people for careers in the central IS organization, then the topic would focus on integrating
the components o f the information technology infrastructure: hardware, software, data,
and systems. If, on the other hand, students are preparing for career in functional areas,
the topic would focus on integrating solutions across facets o f the business operation.
Assess needs
REQUIREMENT ANALYSIS ------------ ►
Xr
SET OBJECTIVES AND PERFORMANCE MEASUREMENT
rDELIVERING THE
INSTRUCTION EFFECTIVELY
ILearners
CharacteristicsI
Work Setting' i —
Job, task, and content
ChooseInstructional
Strategy
DesignInstructional
Material
Figure 5 - Steps for Designing Instructional Material
Learners’ characteristics
Researchers have identified the importance of human factors within the
information systems domain and in various disciplines such as education, psychology,
and computer science (Mason and Mitroff 1973). One o f the key variables that has been
26
Reproduced with permission of the copyright owner. Further reproduction prohibited without permission.

emphasized, in prior research, is the importance o f individual differences in the learning
process (Bostrom, et al., 1988).
Research on individual differences such as cognitive processes and skills (Todd
and Benbasat, 1987; Ramaprasad, 1987), cognitive style (Benbasat and Taylor, 1978),
learning styles (Bostrom, et al., 1993), and demographic differences (Parasuraman and
Igbaria, 1990) indicates their influence on individual performance.
To be effective, an education/training method needs to be matched with the
specific needs and learning styles of individuals (Nelson, 1991, Bostrom, et al., 1990,
Kolb, 1984). On the other hand, educational institutions are being challenged to respond
to the increasing diversity o f students (i.g., variation in motivation, time management,
learning styles, maturity, etc.).
To deal with diversity in the student population, institutions must address two
m ain issues. First, students’ roles in the educational process should be conceptualized in
ways that go beyond the traditional view of them as customers for, or recipients of,
education. Students are the raw materials for education and the primary products of
educational transformation; and, most important, they are key members o f the labor force
involved in creating education (Lengnick-Hall, 1996; Lengnick-Hall and Sanders, 1997).
Then, a measure o f diversity must be established that includes selected demographic,
experiential, and learning style differences among students. Since the focus must be on
learning, learning style differences are expected to be among the most crucial measures
of diversity. Kolb (1984) defines learning styles as the way people leam and how they
solve problems and deal with new situations and information. Kolb’s experiential
27
Reproduced with permission of the copyright owner. Further reproduction prohibited without permission.

learning theory and learning style inventory (Kolb, 1984) provide a means to matrh
instruction and students characteristics as explained in section 2.1.
Thus, individual differences among students as raw materials (e.g., learning
styles, cultural orientations, experience, and interest) must be met by equally diverse
learning process options (e.g., assignments, application contexts, methods for presenting
material) if consistent, high-quality outcomes (i.e., learning and high levels o f
satisfaction) are to result (Lengnick-Hall, 1997).
Class environment
One must ensure that instruction is prepared with regard to available resources,
constraints, and culture o f the institution. The class environment must focus on three
related environments: 1) the development environment, meaning the setting in which
instruction will be prepared; 2) the delivery environment, meaning the work settings in
which instruction will be presented; and 3) the application environment, meaning the
work settings in which learners will be expected to apply what they leam (Rothwell and
Kazanas, 1998).
Analysis of job, task, and content
Job analysis examines what people do, how they do it, and what results they
achieve by doing it. Task analysis involves examining how people perform work
activities. A task is a discrete unit o f work performed by an individual. Training literature
is full of information on developing task-oriented training documents, such as training
manuals. Tasks are divided into two major types: a) cognitive tasks are performed
mentally (i.e., select a personal computer), and b) action tasks, have a set o f clearly
28
Reproduced with permission of the copyright owner. Further reproduction prohibited without permission.
defined steps that are observable, independent o f other actions, and can be measured and
observed (i.e., update a computarized mailing list).
Human ability and task skills, in combination, affect the learning process when
acquiring computer skills (Gattiker, 1992). In addition to task skills, Gattiker (1992)
discusses the relationship between task constraints and the computer skills necessary for
employees to satisfactorily perform computer-mediated tasks on-the-job. Gattiker (1992)
identifies three constraints of task—transfer-of-leaming, complexity, and consistency.
An individual’s performance will be superior if there is an increasing degree of
positive transfer-of-leaming (Gattiker, 1992). Transfer-of-leaming depends on the
similarity between two tasks. For example, an individual’s familiarity with WordPerfect
(Ver. 5.1) software may aid in learning other word processing software such as Microsoft
Word (Ver. 6.0) for windows. Task complexity depends upon how easy is it for an
individual to leam a new task. For example, a novice user may perceive learning a new
software package a more complex process than an individual familiar with a similar
software package. The perceived complexity of the technology increases the demand
upon the individual’s cognitive resources, thereby limiting the transfer-of-training from a
previous job situation (Gattiker, 1992). Task consistency also demands different levels of
cognitive abilities depending upon the degrees o f consistency between tasks (Gattiker,
1992).
Content analysis addresses the question: What should students leam? Two types
of content are defined: concepts and procedures. Concepts are fact-based, ‘knowing that’
or ‘knowing about’ For example, basic definitions, properties, notation, concepts,
relationships, principles, etc., are fact-based concepts. Procedures are task-based,
29
Reproduced with permission of the copyright owner. Further reproduction prohibited without permission.

‘knowing how’; the steps o f procedures are ordered with respect to time. For example,
analyze a system, select a model, formulate a model, use computer software, etc., are
task-based (Simon, et al., 1996).
There is a strong relationship between the content delivery during a class and
teaching method (Leidner and Jarvenpaa, 1993). For example, Leidner and Jarvenpaa
(1993) found that in-class learning had a procedural focus when computer-based methods
were employed and a theoretical focus utilized traditional methods. In-class learning also
depends upon how content is presented to the class. For example, Lusk and Kersnick
(1979) measured the effect o f the presentation mode on learning and performance.
Subjects in their experiment perceived tables to be less complex than graphs. However,
Jarvenpaa and Dickson (1988) and Dickson, DeSanctis, and McBride (1986) found that
the relationship between the presentation format and performance depends upon task
complexity.
2. Set Objectives and Performance Measurement
Instructional designers convert the results o f task or content analysis into specific
performance objectives by three steps (Rothwell and Kazanas, 1998): 1) In establishing
instructional purpose; purpose means the primary reason for a planned instructional
experience. There are typically four choices: a) increasing learners’ knowledge, b)
changing attitudes or feelings, c) building skills, or d) combining one or more o f the other
three choices. 2) In classifying learning tasks, one must ask the question: What kind of
instruction will be necessary to instruct people to perform this task or demonstrate this
knowledge? Only four answers to this question are possible. Instruction can be designed
30
Reproduced with permission of the copyright owner. Further reproduction prohibited without permission.
for a) knowledge, b) feelings, c) skills, or d) some combination o f the first three. 3)
Finally, analyzing the learning task is the last step.
After defining instructional objectives, a set of performance measures can be
used. Some types o f performance measures are essay, flll-in-the-blank, completion,
multiple-choice, true-false, matching, projects, etc.
In the context o f teaching effectiveness, in addition to performance, a number o f
learning outcome variables such as student involvement and participation, cognitive
engagement, technology self-efficacy, attitudes toward the technology employed and the
usefulness o f the technology have been suggested (Leidner and Jarvenpaa, 1995).
Students’ level of involvement and participation in the learning process are particularly
important to teaching effectiveness. Learning is best accomplished through the active
involvement o f students (Leidner and Jarvenpaa, 1993; Alavi, et al., 1995).
The concept of self-efficacy (Bandura, 1986) is relevant to teaching effectiveness.
Compeau and Higgins (1995a) suggested that “the belief that one has the capability” to
interact with a given technology plays a significant role in users’ expectations and
performance.
3. Delivering the Instruction Effectively
A systematic instructional design approach requires the design and development
of the presentation and the management o f instruction once the objectives have been
defined for a course or lesson. It includes choosing the appropriate instructional strategy
and then designing the instructional material (Figure 5). In a general sense, strategies are
a set of decisions that result in a plan, method, or series of activities aimed at obtaining a
specific goal. A strategy is like a blueprint, it shows what must be done, but does not
31
Reproduced with permission of the copyright owner. Further reproduction prohibited without permission.

prescribe how to do i t Instructional strategies describe a general approach to instruction
but do not prescribe how to organize, sequence, or present in instruction (Jonassen, et al.,
1990). Thus, instructional strategies are the plans and techniques that the teacher or
instructional designer uses to engage the learner.
Designing Instructional Material: The Minimalist Theory
The M inim alist theory is a framework for the design of instruction, especially
training materials for operating a computer. It is based on the following minimalist
principles: (1) all learning tasks should be meaningful and self-contained activities, (2)
learners should be given realistic projects as quickly as possible, (3) instruction should
permit self-directed reasoning and improvising by increasing the number o f active
learning activities, (4) training materials and activities should provide for error
recognition and recovery and, (5) there should be a close linkage between the training
and actual system users (Carroll, et al., 1987; Lazonder & Van der Meij, 1993). Previous
research in the computer software training domain provide examples o f training manuals
designed to reflect both exploration-based and instruction-based instructional approaches
(Davis and Bostrom, 1993; Carroll, et al., 1987). The Carroll, et al. (1987) manual uses
an exploration-based approach to train users on word processing programs. The
exploration manual encourages an inductive approach to learning by requiring subjects to
first work through examples provided to them, then create examples on their own. To
encourage subjects to explore the computer system, the exploration manual is left
incomplete (hence, the name “minimal manual” -coined by Carroll, et al., 1987). On the
other hand, the instruction-based manual encourages a deductive approach to learning.
First, it presents subjects with general rules for performing commands or operations.
32
Reproduced with permission of the copyright owner. Further reproduction prohibited without permission.

Then it follows these rules with specific examples. Unlike the exploration m anual, the
instruction-based manual is relatively complete. That is, it leaves little control to the
learner. In addition, it emphasizes specific features o f the system rather than overall tasks.
2 3 . Assessment
Following the analysis of the learning process (how students leam and what they
should leam), the design of the instruction, and the production o f the instructional
program, it is desirable to determine if the instruction program works and what the
students have learned. The assessment of the learning environment can be divided into
two parts: formative evaluation and summative evaluation. The use of formative
evaluation will permit the instructional developers to improve the quality of the current
and future materials. Specifically, formative evaluation is used to define and refine the
goals and methods during the design process. On the other hand, summative evaluation
will ensure that there is a correlation between the intended instruction outcomes and the
real ones. Specifically, summative evaluation is used to determine whether an
instructional method is effective after it has been developed.
For formative evaluation, a pilot study is often implemented to generate
qualitative information based on questionnaires given to the subjects about their opinion
on the prototype instructional method. Based on the results of this pilot study, a number
o f issues such as content, delivery, and assessment are identified and improved for further
implementation.
In terms o f summative assessment, without doubt, a most interesting research
topic is a comparison between technology supported instruction and the traditional
instructional approach. The application of effective instructional methods is an important
33
Reproduced with permission of the copyright owner. Further reproduction prohibited without permission.

consideration in educational and training programs (Alavi, 1994; Maul and Spotts, 1993;
Kulik, et al., 1980). Consequently, this study will concentrate on the summative
assessment, and specifically, on how effectiveness can be measured.
2.4. Related Previous Research
To date, there is no single research effort focusing on overall questions relating to
the effective use of enterprise systems to support business education. There are, however,
two broad categories o f related studies: 1) a number of studies concentrate on the use of
the computer as a tool that is utilized in the “classroom,” addressing children in primary
schools or students in post-secondary education, and 2) several studies report on the use
o f the computer as a tool to be used in future work-related situations. Major concepts as
well as the purpose, findings and limitations o f relevant studies are discussed briefly in
this section.
2.4.1. Education or Training
A distinction must be made between computer-based training (CBT) and
computer-assisted instruction (CAI). CAI deals with learning as opposed to training, with
the implication that certain aspects of education cannot be taught but can be learned. On
the other hand, it is important to realize the word “assisted,” with the implication that it is
the child or the adult learner who is central to the process (Curry and Moutinho, 1992).
Research on CAI applications, where an interactive computer program is used for
delivery of information in sequential or nonlinear modes to challenge a student’s
knowledge and understanding of subject matter, are often reported when examining the
educational use of computers (Alavi, 1994; Leidner and Jarvenpaa, 1993). CAIs provide
a variety of instructional capabilities (i.e., drill and practice, test taking, games,
34
Reproduced with permission of the copyright owner. Further reproduction prohibited without permission.

simulation), subject matter, feedback mechanisms, student's speed and sequence o f
material presentation control (Leidner and Jarvenpaa, 1995,1993).
2.4.2. Computers Use in Education
A study was conducted to determine if two CAI design strategies affected the
outcome of education when controlling for learning styles (Cordell, 1991). A statistically
significant difference was found between the posttest scores for the two instructional
design groups o f CAI: sequential and non-linear (branching). However, no statistically
significant difference was found for factor learning styles and there was no significant
difference on posttest scores for the interaction o f learning styles and instructional design.
Cordell (1991) attributes the results to a number o f limitations such as subject selection,
volunteers who may not have been representative o f the population in general,
geographical location, and instrumentation (i.e., the learning style inventory may not be
valid for all types of learners).
Niemiec and Walberg (1987) provide a synthesis o f computer-assisted instruction
research at all levels of implementation. Results indicated that typical effect o f CAI is to
raise outcome measures moderately by 0.42 standard deviation units. The average and
typical effect of CAI is to place the average students using it at the 66th percentile o f
traditional groups. They based their finding on 16 literature reviews o f CAI.
In a comparison between computer-assisted instruction and teacher-directed
instruction, White and White (1997) reported that community college students receiving
CAI exhibited higher computer competence than those receiving a teacher-directed
method of instruction. The study included a number of dependent variables such as sex,
35
Reproduced with permission of the copyright owner. Further reproduction prohibited without permission.
educational level, major, computer experience, retention rate, computer anxiety, and their
interactions.
Kulik, et al. (1980) carried out a meta-analysis o f past research from 1967 to
1978. A meta-analysis provides a statistical analysis o f a large collection of results from
individual studies for the purpose of integrating findings. Their meta-analysis was based
on 59 studies conducted at the college level. In the meta-analysis, Kulik, et al. (1980)
examined student performance levels on such attributes as learning, student attitudes,
student course completion, instructional time, and the correlation between aptitude and
achievement. They determined that computer-based instruction (CBI) raised students’
achievement by 0.25 standard deviation units. They interpreted this to mean that the
typical CBI college students performed at the 60th percentile as opposed to the 50th
percentile for the control students (conventional instruction). With respect to the validity
o f the studies included in the meta-analysis, they found little relationship between design
features of experiments and experimental outcomes. For the most part, design features of
experiments did not influence outcomes. Quasi-experimental studies and true
experiments produced similar results. Experiments with controls for historical effects
yielded the same results as experiments without historical controls; nor, did settings
influence findings in any substantial way. Only one variable predicted study outcome in
the meta-analysis, and that was use o f a design that controlled for instructor effects.
Studies in which different teachers taught computer-based and conventional sections of a
course produced more clear-cut examination differences and favored computer-based
teaching. In studies in which a single teacher taught both experimental and control
classes, differences were less pronounced.
36
Reproduced with permission of the copyright owner. Further reproduction prohibited without permission.

2.4.3. Computer Use in Training (End User Training)
A number o f studies have investigated the inputs, processes, and outcomes
associated with training end-users to utilize computer systems and software in future
work-related situations. Following Bostrom, et al. (1988), the input to the training process
include cognitive characteristics o f the trainee (i.e., cognitive style, learning style,
abilities), the system/software to be learned (i.e., ease of use, task domain-system match),
and the training environment (i.e., methods o f training such as conceptual models). The
outputs o f the process are changes in the characteristics o f the trainee (i.e., performance,
attitudes). The training process includes exposure to the material to be learned and
exercises to supplement this exposure.
Previous studies on EUT have investigated a variety o f issues. Davis and Bostrom
(1993) conducted a laboratory experiment to investigate the impacts o f two types of
training methods (exploration training and instruction-based training) and two computer
interfaces (a direct manipulation interface (DMI) and a command-based interface). Users’
learning performance (hands-on use) and attitudes toward computer systems (perceptions
o f its ease of use) were the dependent variables. Analysis of the data collected indicated
that only the computer interface effect was significant. Individuals using DMI performed
significantly better than those using the command-based interface. On the other hand,
there was no difference between the two groups in terms of perceived ease o f system use.
Furthermore, no significant difference was found between the two training methods. The
authors attributed three possible limitations which affected the results on the training
method. First, all subjects in the study were college sophomores, thus, it is highly likely
that most of them were accustomed to very structured learning environments. As a result,
37
Reproduced with permission of the copyright owner. Further reproduction prohibited without permission.

they may have been more comfortable with training that provided all steps for them, as
the instruction-based training did. This, in turn, may have mitigated some o f the effects
o f exploration tra in ing. Second, it might be possible that exploration training provides
some advantages that may only be realized when individuals are given longer periods o f
time to use the system. And third, it may be that certain trainee characteristics that had
been unaccounted for canceled out any effects of training methods.
The trainee is the focal point o f end-user training. Each trainee brings their own
set o f personality traits and differences. Researchers have identified the importance o f
human factors within the information systems domain and in various disciplines such as
education, psychology, and computer science (Mason and Mitroff, 1973). One of the key
variables emphasized in prior research is the importance o f individual differences in the
learning process (Bostrom, et al., 1988). Individual differences include trainees’
experience with the software tool, task-domain knowledge, cognitive traits, motivational
traits and so forth (Bostrom, et al., 1988). In addition demographic differences between
individuals such as gender, age, years of experience, and job functions also influence
end-user training.
Bostrom, et al. (1990) investigated the importance of learning styles. They
provided a comprehensive list of prior studies on individual differences associated with
learning about end-user software. They infer that learning is an important variable in the
context of learning about software. The authors believe that while other cognitive traits
lack the theoretical basis for expecting an effect, learning style is well-grounded in
learning theory. There are several competing theoretical models about learning style,
each having merit (Bostrom, et al. 1990). Bostrom, et al. (1990) chose to use Kolb’s
38
Reproduced with permission of the copyright owner. Further reproduction prohibited without permission.

learning style theory in their research because it is widely used in research and practical
information system applications.
Compeau and Higgins (1995a) examined the training process, and compared a
behavioral modeling training program, based on Social Cognitive Theory (Bandura,
1977, 1986, 1991) to a more traditional, lecture-based program. The purpose of their
study was to provide further insight into the questions of training method effectiveness
and learning processes. The context of the study was Lotus 1-2-3 and WordPerfect
training for professionals who had little or no knowledge about computers. Based on the
Social Cognitive Theory premise that behavior modeling influences the observers'
perception of their own ability to perform a task, the study basically compared behavior
modeling versus non-modeling (lecture-based) training methods. The modeling method
manipulation consisted of videotapes demonstrating the steps necessary to achieve certain
tasks in Lotus 1-2-3 and WordPerfect.
Their findings established a strong influence of self-efficacy over performance in
both training methods. They also found that behavior modeling was more effective than
the traditional lecture-based model for training in Lotus 1-2-3, resulting in higher self-
efficacy and higher performance. However, this was not the case for training in
WordPerfect. The internal validity o f these findings might have been affected by the fact
that different actors were used in the videotapes and the fact that there was a practice
session after measuring self-efficacy and before the performance test. The external
validity may have been also threatened by the fact that the subjects were professionals in
small organizations, and generalization to all types of organizations may be limited.
39
Reproduced with permission of the copyright owner. Further reproduction prohibited without permission.

A number of studies have been conducted using either laboratory or field
experiments to compare the effectiveness o f instruction-based training (IBT) versus
computer-based training (CBT) (Czaja, et al., 1986; Maul and Spotts, 1993; Bowman, et
al., 1995). However, these studies have reported conflicting results.
When evaluating three training strategies (IBT, manual, and CBT) for their
effectiveness in teaching naive computer users to use a word processing system, CBT
was found to be a less effective teaching method than either IBT or manual-based
training (Czaja, et al., 1986). None o f the strategies were considered efficient, indicating
a need for the development o f appropriate training methods for computer tasks.
Maul and Spotts (1993) implemented a pretest/posttest experimental design to
compare CBT and the classroom training approach. A total o f 20 employees (10
employees per group) from a large local manufacturing company participated in the
study. They were provided with a basic course stressing the fundamentals o f pneumatic
devices. Performance was measured by using a multiple-choice test. They found no
statistically significant difference in learning. There was significant difference in
instructional time with the CBT showing a large decrease. Two major limitations o f this
study was the small sample size (10 employees) and that it did not address the issue of
stability o f learning over a longer period o f time.
Bowman, et al. (1995) conducted an empirical test to assess the effectiveness of
CBT. They examined the effectiveness of CBT in teaching specific microcomputer
software application skills at a western business college - specifically, the operating
system, word-processing, spreadsheet, and data base skills typically taught in entry-level
computer classes. The study compared two groups: 1) an experimental group using CBT
40
Reproduced with permission of the copyright owner. Further reproduction prohibited without permission.
and 2) a control group using traditional lectures. Three types o f variables were used to
assess effectiveness o f computer-based training: 1) totals for homework scores, 2) scores
on each o f two in-class examinations, and 3) survey measures o f comfort level and
satisfaction were used as a measure o f performance by the control and experimental
groups. They found no significant difference between the two groups. However, the
control group expressed a significant preference for CBT. Bowman, et al. states that “it
is important to note that lack o f statistically-significant differences between CBT-taught
students and the traditionally-taught students in this study do not automatically or
uniformly apply to all other disciplines or all types o f computer tasks” (1995).
The above studies indicate conflicting views about IBT versus CBT. Both IBT
and CBT attempt to provide an understanding about a specific software tool; however,
there is a tradeoff between the quality of training, the cost o f training, and most
importantly, end-user satisfaction with the training because it determines how well a
specific training technique is accepted by trainees.
In summary, the results of the prior studies indicate that independent variables
used were tra in in g methods, training content, and demographic variables. Dependent
variables included performance and attitudes. The research models used field
experiment, laboratory experiment, survey, or were quasi-experiments.
2.5. Summary
This chapter discusses the important theoretical and empirical findings related to
information-technology (computer and communication) use in the classroom. Chapter 3
combines this literature review along with a theoretical framework to provide the
research model used in the study.
41
Reproduced with permission of the copyright owner. Further reproduction prohibited without permission.
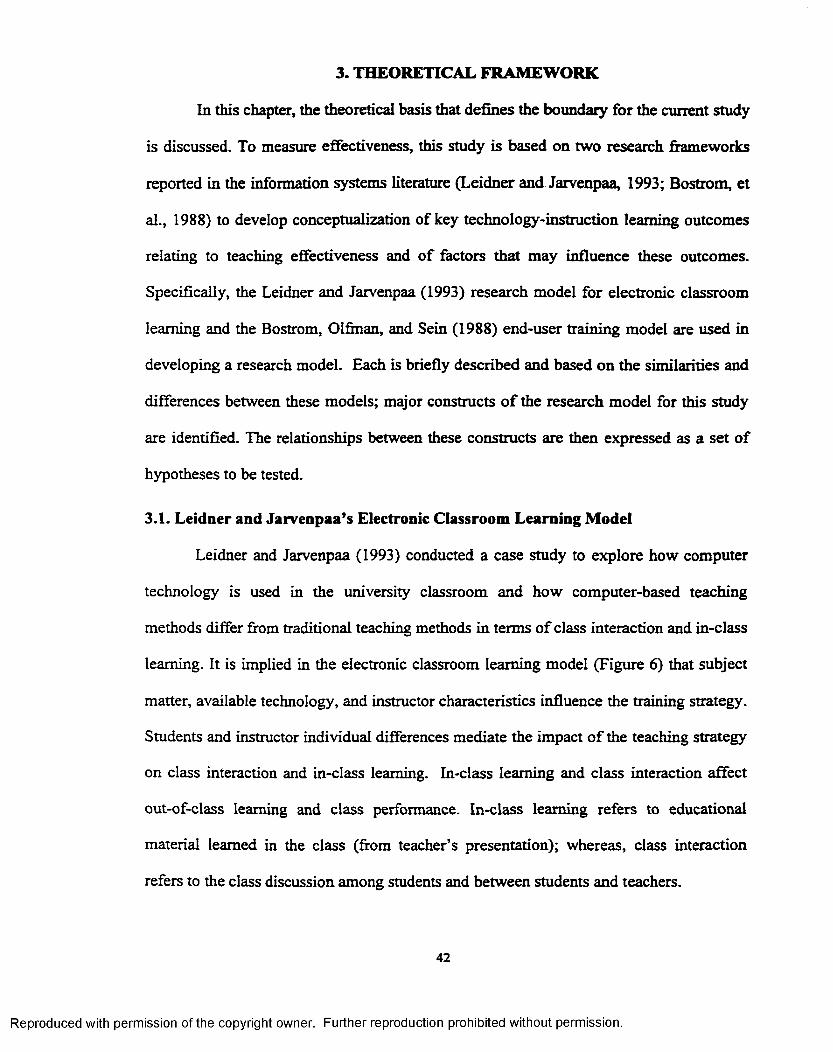
3. THEORETICAL FRAMEWORK
In this chapter, the theoretical basis that defines the boundary for the current study
is discussed. To measure effectiveness, this study is based on two research fiameworks
reported in the information systems literature (Leidner and Jarvenpaa, 1993; Bostrom, et
al., 1988) to develop conceptualization of key technology-instruction learning outcomes
relating to teaching effectiveness and o f factors that may influence these outcomes.
Specifically, the Leidner and Jarvenpaa (1993) research model for electronic classroom
learning and the Bostrom, Olfinan, and Sein (1988) end-user tra in ing model are used in
developing a research model. Each is briefly described and based on the similarities and
differences between these models; major constructs o f the research model for this study
are identified. The relationships between these constructs are then expressed as a set of
hypotheses to be tested.
3.1. Leidner and Jarvenpaa’s Electronic Classroom Learning Model
Leidner and Jarvenpaa (1993) conducted a case study to explore how computer
technology is used in the university classroom and how computer-based teaching
methods differ from traditional teaching methods in terms o f class interaction and in-class
learning. It is implied in the electronic classroom learning model (Figure 6) that subject
matter, available technology, and instructor characteristics influence the training strategy.
Students and instructor individual differences mediate the impact o f the teaching strategy
on class interaction and in-class learning. In-class learning and class interaction affect
out-of-class learning and class performance. In-class learning refers to educational
material learned in the class (from teacher’s presentation); whereas, class interaction
refers to the class discussion among students and between students and teachers.
42
Reproduced with permission of the copyright owner. Further reproduction prohibited without permission.
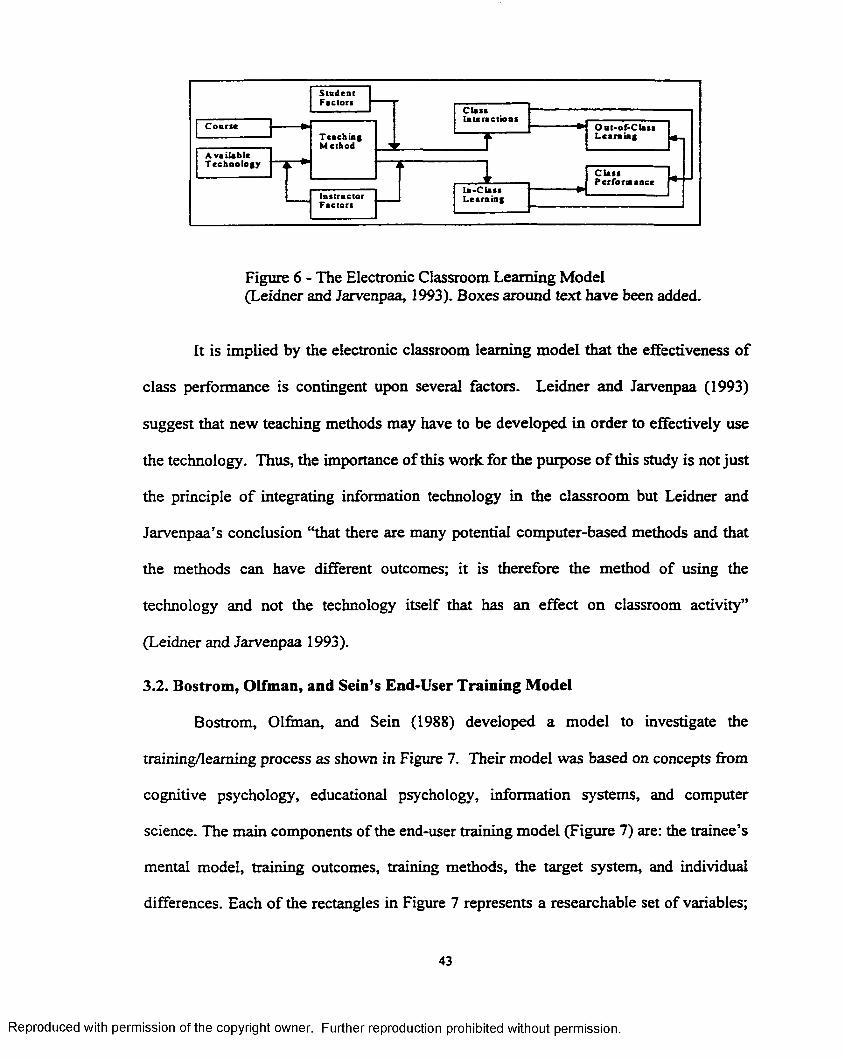
Course
A v t iU b leT echno logy
StudentFactors
T eachingM ethod
Instructo rF acto rs
C U ssIn te rac tio n s
In-C U ss L earning
O ut*of*ClassLearning
C U ssPerforoiaace
Figure 6 - The Electronic Classroom Learning Model(Leidner and Jarvenpaa, 1993). Boxes around text have been added.
It is implied by the electronic classroom learning model that the effectiveness of
class performance is contingent upon several factors. Leidner and Jarvenpaa (1993)
suggest that new teaching methods may have to be developed in order to effectively use
the technology. Thus, the importance of this work for the purpose o f this study is not just
the principle o f integrating information technology in the classroom but Leidner and
Jarvenpaa’s conclusion “that there are many potential computer-based methods and that
the methods can have different outcomes; it is therefore the method of using the
technology and not the technology itself that has an effect on classroom activity”
(Leidner and Jarvenpaa 1993).
3.2. Bostrom, Olfman, and Sein’s End-User Training Model
Bostrom, Olfman, and Sein (1988) developed a model to investigate the
training/learning process as shown in Figure 7. Their model was based on concepts from
cognitive psychology, educational psychology, information systems, and computer
science. The main components of the end-user training model (Figure 7) are: the trainee’s
mental model, training outcomes, training methods, the target system, and individual
differences. Each of the rectangles in Figure 7 represents a researchable set of variables;
43
Reproduced with permission of the copyright owner. Further reproduction prohibited without permission.
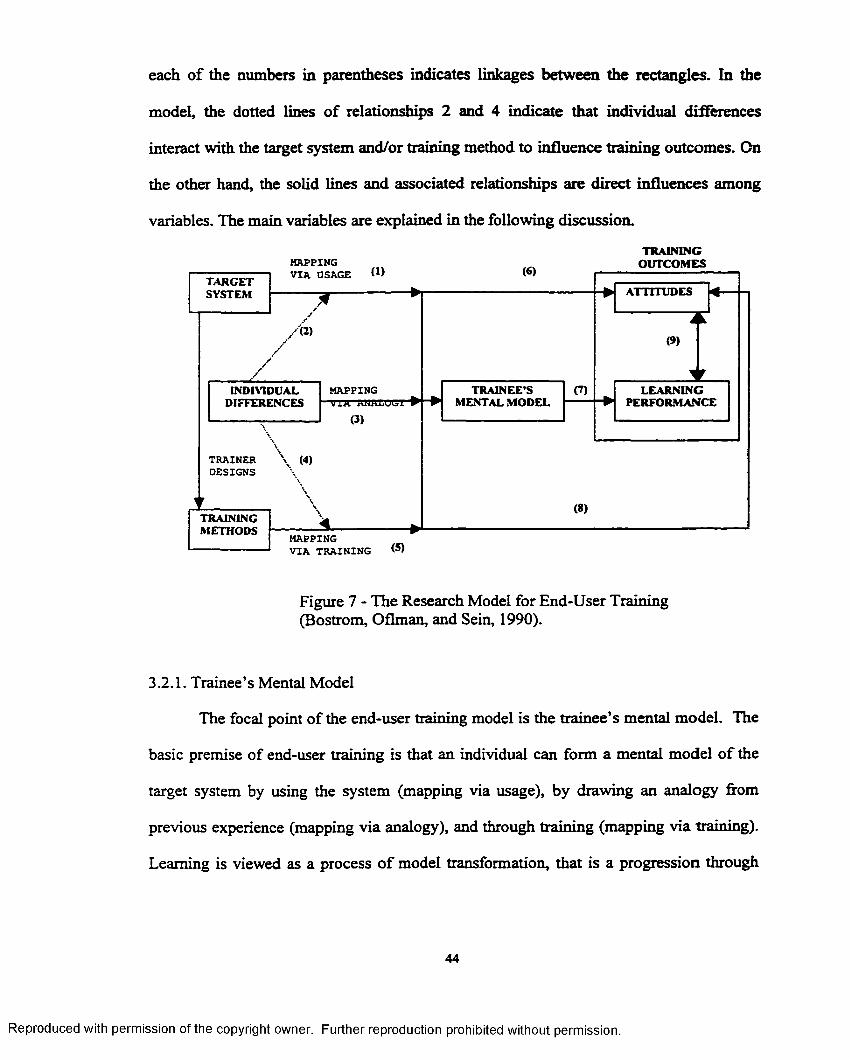
each o f the numbers in parentheses indicates linkages between the rectangles. In the
model, the dotted lines of relationships 2 and 4 indicate that individual differences
interact with the target system and/or training method to influence training outcomes. On
the other hand, the solid lines and associated relationships are direct influences among
variables. The main variables are explained in the following discussion.
TRAININGMAPPING VIA OSAGE
OUTCOMES
MAPPINGVIA ANAIOGT ^
TRAINERDESIGNS
MAPPING V IA TRAINING
ATTITUDESTARGETSYSTEM
TRAININGMETHODS
INDIVIDUALDIFFERENCES
LEARNINGPERFORMANCE
TRAINEE’S MENTAL MODEL
Figure 7 - The Research Model for End-User Training (Bostrom, Oflman, and Sein, 1990).
3.2.1. Trainee’s Mental Model
The focal point of the end-user training model is the trainee’s mental model. The
basic premise of end-user training is that an individual can form a mental model o f the
target system by using the system (mapping via usage), by drawing an analogy from
previous experience (mapping via analogy), and through training (mapping via training).
Learning is viewed as a process o f model transformation, that is a progression through
44
Reproduced with permission of the copyright owner. Further reproduction prohibited without permission.
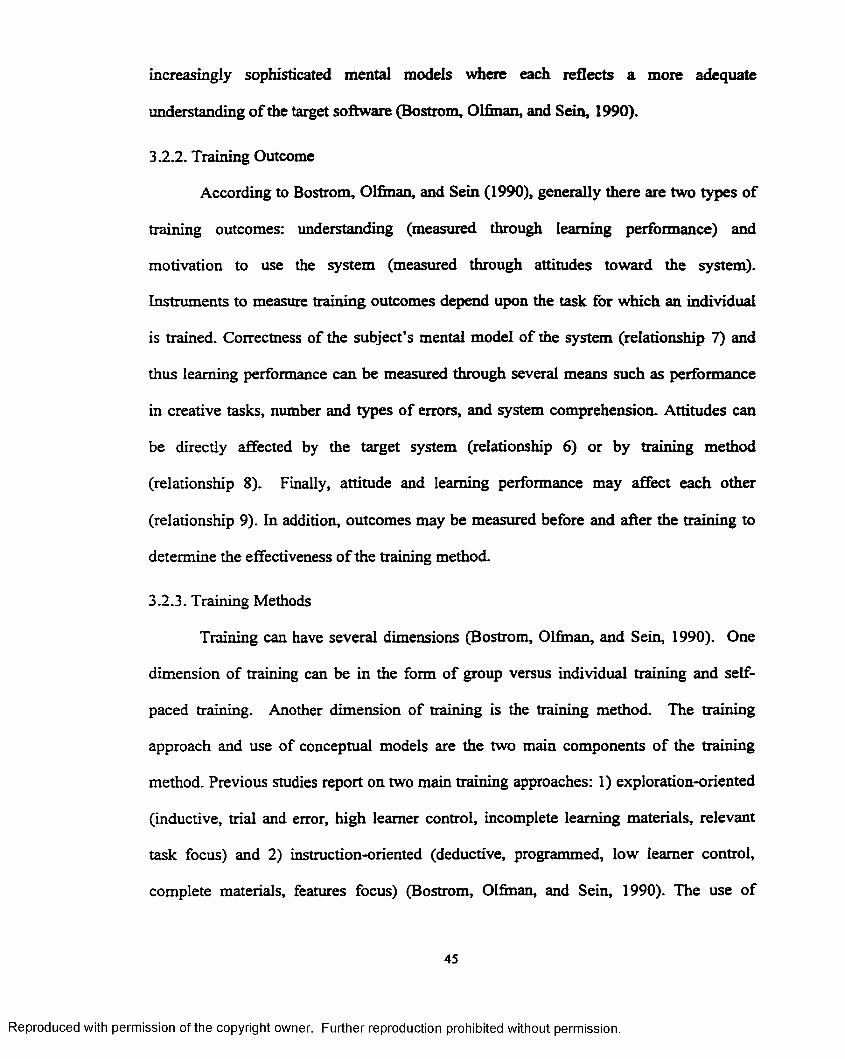
increasingly sophisticated mental models where each reflects a more adequate
understanding o f the target software (Bostrom, Olfman, and Sein, 1990).
3.2.2. Training Outcome
According to Bostrom, Olfman, and Sein (1990), generally there are two types of
training outcomes: understanding (measured through learning performance) and
motivation to use the system (measured through attitudes toward the system).
Instruments to measure training outcomes depend upon the task for which an individual
is trained. Correctness o f the subject’s mental model of the system (relationship 7) and
thus learning performance can be measured through several means such as performance
in creative tasks, number and types of errors, and system comprehension. Attitudes can
be directly affected by the target system (relationship 6) or by training method
(relationship 8). Finally, attitude and learning performance may affect each other
(relationship 9). In addition, outcomes may be measured before and after the training to
determine the effectiveness of the training method.
3.2.3. Training Methods
Training can have several dimensions (Bostrom, Olfman, and Sein, 1990). One
dimension of training can be in the form of group versus individual training and self-
paced training. Another dimension of training is the training method. The training
approach and use of conceptual models are the two main components o f the training
method. Previous studies report on two main training approaches: 1) exploration-oriented
(inductive, trial and error, high learner control, incomplete learning materials, relevant
task focus) and 2) instruction-oriented (deductive, programmed, low learner control,
complete materials, features focus) (Bostrom, Olfman, and Sein, 1990). The use of
45
Reproduced with permission of the copyright owner. Further reproduction prohibited without permission.
conceptual models is another component of the training method. A conceptual model is
an instructional representation o f a target system that will enable a learner to produce a
mental model o f the system. The two types o f conceptual models are analogical and
abstract Analogical models represent the target software in terms of another system.
Abstract models are synthetic representations o f the target software (Bostrom, Olfman,
and Sein, 1990).
3.2.4. Target System
The target system is the system the learner is attempting to learn. A target system
could be a new application software package such as word processor, an interface such as
direct manipulation or command-based, a new programming language, or a database. In
general, to the user, the interface is the system. The interface can provide a model of a
computer system by presenting a manipulatable equivalent o f the conceptual model (as in
icon-based [graphic] direct manipulation systems) or by presenting an implicit model
through the functions provided by a command language or menu system (Bostrom,
Olfman, and Sein, 1990). The target system may directly impact the training outcome as
shown in Figure 7.
3.2.5. Individual Differences
Variations in human behavior, often expressed as individual differences among
end users, may include cognitive traits (e.g., learning style, visual ability, cognitive
process), motivational traits (e.g., self-concept, need for achievement, attitude toward
computers), and demographic factors (e.g., previous computer experience, task domain
knowledge) (Bostrom, Olfman, and Sein, 1988). Thus, differences among end-users
make the individual (student) a contingent factor.
46
Reproduced with permission of the copyright owner. Further reproduction prohibited without permission.

There are three ways by which individual differences influence mental model
formation (Figure 7): direct influence (relationship 3), indirect influence via use o f the
target system (relationship 2), and indirect influence via the training method (relationship
4) (Bostrom, Olfinan, and Sein, 1990).
In summary, the end-user training model (Bostrom, Olfinan, and Sein, 1990,
Figure 7) suggests that training outcomes (user attitudes and learning performance) are
influenced by three important factors: characteristics of the target system (or the system
being learned), training method, and trainee characteristics.
3.2.6. Summary o f the Models
Several conclusions can be drawn from the two models. First, each model
identifies learner (trainee), instructor (trainer), outcome, and training
strategies/methodologies as primary variables.
The electronic classroom learning model (Leidner and Jarvenpaa, 1993) (Figure
6) is described in the context of academic education. The end-user tra in ing model
(Bostrom, Olfinan, and Sein, 1990) (Figure 7) is described in the context of
organizational employees. However, the two models refer to the same primary elements.
Second, the electronic classroom learning and the end-user training models view
learner/teacher control variable as a subset of training method. It means that both learner
and teacher have a certain level o f control during the training process.
Third, even though the two models were developed for educating/training
individuals, each model exhibits a different focus. The electronic classroom model
focuses on effective use o f the computer technology in the classroom. The end-user
training model focuses on the end-user of information technology.
47
Reproduced with permission of the copyright owner. Further reproduction prohibited without permission.

Fourth, the electronic classroom learning and end-user training models do not
address learning strategy as a separate variable but seem to have assumed them to be a
part o f the training outcome.
Finally, the electronic classroom model (Leidner and Jarvenpaa, 1993) implies
that the effectiveness of class performance is contingent upon a number of factors.
Bostrom, Olfinan, and Sein (1990) end-user model also identified contingent factors to be
considered during training. Thus, after identifying a set o f contingent variables, a
comprehensive research model can be proposed to measure the effectiveness o f a
particular learning environment
33. Research Model
The research model (Figure 8 ) developed for this study is based on the analysis of
the previous two models and the Kolb’s Experiential Learning Model (Kolb, 1984;
Simon, et al., 1996) discussed in Chapter 2. The basic elements o f the end-user training
framework used in this study is shown in the research model. Overall, the research model
developed (Figure 8 ) is based on the Bostrom, Olfinan, and Sein (1988) end-user model.
The end-user model suggests that training outcomes (user attitudes and learning
performance) are influenced by three important factors: characteristics of the target
system (or the system being learned), training methods, and individual differences
(Bostrom, Olfinan, and Sein, 1988). Figure 8 focuses only on the influences o f the
individual differences and instruction (training) methods on education outcomes
(training). It defines individual characteristics based on Kolb’s Experiential Learning
Theory/Learning Styles (Kolb, 1984) and instruction methods based on a traditional
method (control) and two computer-based instruction oriented approaches (simulated
48
Reproduced with permission of the copyright owner. Further reproduction prohibited without permission.
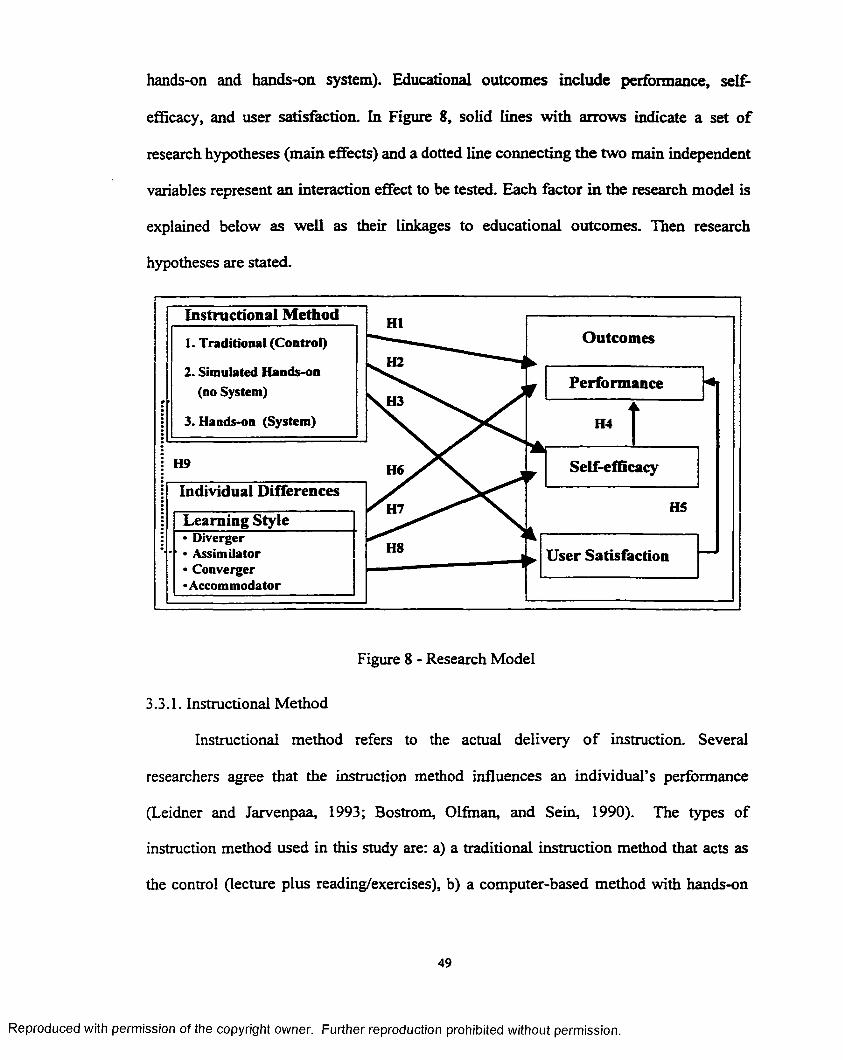
hands-on and hands-on system). Educational outcomes include performance, self-
efficacy, and user satisfaction. In Figure 8 , solid lines with arrows indicate a set o f
research hypotheses (main effects) and a dotted line connecting the two main independent
variables represent an interaction effect to be tested. Each factor in the research model is
explained below as well as their linkages to educational outcomes. Then research
hypotheses are stated.
Instructional Method HIOutcomes1. Traditional (Control)
H22. Simulated Hands-on
(no System) PerformanceH3
3. Hands-on (System) H4
H9 Self-efficacyH6Individual Differences
HSH7Learning Style• Diverger• Assimilator• Converger •Accommodator
H8 User Satisfaction
Figure 8 - Research Model
3.3.1. Instructional Method
Instructional method refers to the actual delivery o f instruction. Several
researchers agree that the instruction method influences an individual’s performance
(Leidner and Jarvenpaa, 1993; Bostrom, Olfinan, and Sein, 1990). The types of
instruction method used in this study are: a) a traditional instruction method that acts as
the control (lecture plus reading/exercises), b) a computer-based method with hands-on
49
Reproduced with permission of the copyright owner. Further reproduction prohibited without permission.

SAP R/3 System, and c) a computer-based method with the simulated hands-on the SAP
R/3 System.
3.3.2. Individual Differences
It is clear from the educational and training models described earlier that the
student or trainee is the focal point of education/training. It was also stated that it is
important to consider individual differences in information systems effectiveness studies
(Bostrom, Olfinan, and Sein, 1988, 1990, 1993; Todd and Benbasat, 1987; Parasuraman
and Igbaria, 1990; Czaja, et al., 1989; Zmud, 1979).
Thus, it is reasonable to consider individual differences among end-users in an
information system education/training program. In this study, individual differences,
“variations in human behavior among end users” include cognitive traits (e.g., learning
style), motivational traits (e.g., self-concept, attitude toward computers), and
demographic factors (e.g., gender, age, previous computer experience, task domain
knowledge).
3.3.3. Outcomes
A key aspect of instruction effectiveness is student performance. However,
reviews of research comparing the effectiveness of educational computer-based and
traditional instruction have found no or few differences in student achievement.
It is argued that “just” evaluating the effectiveness of computer-based instruction
on students’ performance scores may not provide a comprehensive picture o f the
effectiveness of the program (Compeau and Higgins, 1995a). Thus, following this
argument and Leidner and Jarvenpaa’s (1995) taxonomy o f learning outcomes, in
50
Reproduced with permission of the copyright owner. Further reproduction prohibited without permission.

addition to performance, the present study examines such outcomes relating to instruction
effectiveness as self-efficacy and user satisfaction.
3.4. Hypotheses
The relationship between the constructs on the research model (Figure 8 ) are
expressed as a set o f hypotheses (HI to H9) to be tested. The research model suggests
several relationships between the variables. In this section, these relationships are
formulated as a set o f hypotheses. The overall research hypothesis o f this study is that
there will be no difference in performance between the group that receives hands-on
experience with the SAP R/3 System and all other groups (control group, and simulated
hands-on the SAP R/3 System group).
3.4.1. Relationship between Instructional Method and Outcomes
The instructional method refers to the actual delivery o f course material. In the
context of training, several researchers agree that the training method influences trainee’s
performance (Bostrom, Olfmanf, Sein, 1990; Leidner and Jarvenpaa, 1993; Maul and
Spotts, 1993; Czaja, et al., 1986). On the other hand, previous studies have also reported
mixed results about the outcomes of traditional instruction versus computer-based
instruction (Bowman, et al., 1995).
The main focus o f this study is to determine whether there will be any difference
between the performance o f subjects who are provided three different delivery
instructional methods: a) a traditional instruction method that acts as the control (lecture
plus reading/exercises), b) a computer-based method with hands-on SAP R/3 System, and
c) a computer-based method with simulated hands-on the SAP R/3 System. Accordingly,
Hypothesis 1 is as follows:
51
Reproduced with permission of the copyright owner. Further reproduction prohibited without permission.
HI: There will be no difference in performance scores between the group that
receives hands-on experience with the SAP R/3 System and all other groups.
Self-efficacy is "people's judgments o f their capabilities to organize and execute
courses o f action required to attain designated types o f performances. It is concerned not
with skills one has but with judgments o f what one can do with whatever one possesses"
(Bandura, 1986).
Research has shown that low-efficacy beliefs are negatively related to subsequent
task performance (Bandura and Cervone, 1986). Thus, since a major goal o f any
educational program is that the learner will apply the knowledge/skills learned to real life
situations (future work environment), then a desirable outcome would seem to be higher
levels o f self-efficacy in addition to the performance outcome. Accordingly, hypothesis 2
is as follows:
H2: There will be no difference in self-efficacy between the hands-on SAP R/3
System instruction group and the simulated hands-on SAP R/3 System
instruction group.
User Satisfaction may be defined as the extent to which users believe the
information system available to them meets their information requirements (Ives, et al.,
1983). However, in the context of the present study, the purpose o f using a measure of
end-user satisfaction is to evaluate the quality of instruction and instructional materials
(e.g., lecture presentation, tools, manuals, etc.). Furthermore, it has been concluded that
although a training program closely follows suggested training models and prescriptions,
the quality o f instruction and instructional material have a significant impact on the
outcome o f any educational/training program (Cronan and Douglas, 1990). Thus,
52
Reproduced with permission of the copyright owner. Further reproduction prohibited without permission.

satisfaction is not measured to predict behavior (e.g., usage) but to learn how to design
instruction using the information technology available. Satisfaction has been studied in
the context of designing a collaborative learning mode o f instruction (Alavi, 1994; Alavi,
et al., 1995). It has been shown that instruction-supported collaborative learning enhances
learning achievement, student satisfaction with the learning process, and outcomes
promote a positive learning climate (Alavi, 1994; Alavi, et al., 1995; Kulik, et al., 1980).
In the context o f curriculum development, instructional design, and assessment,
two elements of satisfaction are important to measure in any educational setting:
satisfaction with the results of the instruction and satisfaction with the way in which the
instruction was delivered. If an instructional method is effective, then students are
expected to consistently report high levels of satisfaction with both the results of courses
and the learning process (Lengnick-Hall and Sanders, 1997). Accordingly, Hypothesis 3
is as follows:
H3: There will be no difference in user satisfaction between the hands-on
SAP R/3 System instruction group and the simulated hands-on SAP R/3
System instruction group.
3.4.2. Relationship among Self-efficacy, User Satisfaction and Performance
An important effect of self-efficacy is performance (Bandura, 1991; Bandura and
Adams, 1977). Research has shown that self-efficacy perceptions are positively related to
trainee satisfaction and learning in microcomputer training (Gist, et al., 1989; Oliver and
Shapiro, 1993). Based on past performances that are made by low- and high-self-efficacy
individuals, Gist and Mitchell (1992) provide an explanation for the relationship between
self-efficacy and both satisfaction and performance. They argue that when individuals
53
Reproduced with permission of the copyright owner. Further reproduction prohibited without permission.

with high or low self-efficacy succeed, they both make internal attributions for their
success (i.e., ability). However, when individuals fail, those with high self-efficacy
attribute their failure to external factors (e.g., bad luck), while those with low self-
efficacy attribute their failure to lack of ability. Consequently, it is possible that
individuals with high levels of self-efficacy will be more likely (than those with low
levels of self-efficacy) to persist in spite of any experienced difficulty (Gist and Mitchell,
1992). In addition, individuals with high self-efficacy are likely to be more satisfied due
to the perceived value of personal accomplishment (Bandura, 1986). Thus, this study
proposes that Self-efficacy and User Satisfaction will relate positively to individual
performance. Accordingly, Hypotheses 4 and 5 are as follows:
H4: There will be no difference in performance scores between individuals
with high self-efficacy and those with low self-efficacy.
H5: There will be no difference in performance scores between subjects who
are more Satisfied with the learning process and those who are less
Satisfied.
3.4.3. Relationship between Individual’s Learning Style and Outcomes
As stated in Chapter 2, to be effective, an education/training method needs to be
matched with the specific needs and learning styles o f individuals (Nelson, 1991;
Bostrom, et al., 1990; Kolb, 1984). On the other hand, educational institutions are being
challenged to respond to the increasing diversity o f students (i.g., variation in motivation,
time management and learning styles, maturity, etc.). Thus, individual differences among
students as raw materials (e.g., learning styles, cultural orientations, experience, and
interest) must be met by equally diverse learning process options (e.g., assignments,
54
Reproduced with permission of the copyright owner. Further reproduction prohibited without permission.

application contexts, and methods for presenting material) i f consistent, high-quality
outcomes (i.e., learning and high levels o f satisfaction) are to result (Lengnick-Hall and
Sanders, 1997).
The Learning Style variable is used to determine whether or not individual
differences affect student performance, self-efficacy and satisfaction. Learning style is
defined as the way people learn and how they solve problems and deal with new
situations and information (Kolb, 1984). Kolb (1984) argued that effective learning
requires a four-stage cycle. Each stage o f the cycle highlights different learning modes:
concrete experience, reflective observation, abstract conceptualization, and active
experimentation. An individual’s learning style is the combination of the four learning
modes. Kolb (1984) identifies four learning styles: accommodators, divergers,
convergers, and assimilators. Learning styles reflect two dimensions. One dimension,
active/reflective, indicates whether individuals learn best by doing or by thinking. The
other dimension, concrete/abstract, indicates whether individuals emphasize concrete
experience or abstract ideas when they leam.
The objective of incorporating this variable in the study is to examine the role of
the learning style on learning about Enterprise Systems. Previous research (Bostrom, et
al., 1990) has indicated that instruction programs designed to complement an individual’s
learning style increases the instruction program’s effectiveness. However, the
experiential learning theory does not provide help to decide which learners would excel
with which instructional method. Kolb did not theorize about hands-on training and
without hands-on training instructional methods. Thus, it is envisioned that there is a
55
Reproduced with permission of the copyright owner. Further reproduction prohibited without permission.

relationship between the individual’s learning style and outcomes (performance, self-
efficacy, and satisfaction). Accordingly, Hypotheses 6 , 7 and 8 are as follows:
H6: Subjects’ Learning Style does not influence the Performance of Subjects.
H7: Subjects’Learning Style does not influence the Self-efficacy of Subjects.
H8: Subjects’ Learning Style does not influence the Satisfaction of Subjects.
3.4.4. Interaction between Instructional Method and Individual's Learning Style
Research on computer training methods has addressed two main issues. One issue
deals with the examination o f various individual characteristics, such as personality
dimensions and cognitive ability that predicts successful learning o f computer software
(Bostrom, et al., 1990). And the other issue relates to the effectiveness o f training
methods (Sein and Robey, 1991). However, there is a need to examine the interaction
between individual characteristics and training methods. Thus, this study uses learning
style to investigate the impact o f its interaction with the instructional method on the
individual’s performance. This study does not use learning style as a control variable.
The impact of learning style will allow additional explanation o f any difference in
performance between individuals, if necessary. Accordingly, Hypothesis 9 is as follows:
H9: There is no significant interaction effect of learning style and instruction
method on the performance, self-efficacy, and satisfaction of subjects.
3.5. Summary
The research model presented in this chapter is based on the educational and
training models suggested by previous studies. Ramifications o f the Experiential
Learning Theory (Kolb, 1984), the Leidner and Jarvenpaa (1993) research model for
electronic classroom learning and the Bostrom, Olfinan, and Sein (1988) end-user
56
Reproduced with permission of the copyright owner. Further reproduction prohibited without permission.

training model supplied the theoretical basis for selecting the dependent and independent
variables of the research model for this study. The research model depicts the
relationships between the independent and dependent variables. A set o f hypotheses was
developed from the relationships between variables. Hypotheses were stated in the null
form, that is, there is no main interaction effect of instructional method and learning
styles on performance. The research methodology used in the present investigation is
discussed in chapter 4. This includes sections on the research design, the population and
sample, research variables, design structure, and procedures.
57
Reproduced with permission of the copyright owner. Further reproduction prohibited without permission.
4. RESEARCH M ETHODOLOGY
A number of relationships between the constructs identified in the previous
frameworks are suggested as a research framework for this study. These relationships
were expressed as hypotheses and will be tested in the field setting. The research
methodology to be used is a field experiment. A series o f three experiments were
conducted to test the hypotheses developed in Chapter 3. This chapter describes the
research methodology employed. The research design, content, population and sample,
independent and dependent variables, experimental design structure, and procedure are
discussed.
4.1. Research Design
A series of true field experiments (Table 1) were conducted in order to investigate
the effectiveness of using the SAP R/3 System to enhance knowledge and understanding
o f business processes. They are true experiments (as opposed to quasi-experiments) due
to the fact that the randomization element was present when selecting the subjects and
when assigning them to both the treatment and the control groups (Cook and Campbell,
1976). Table 1 presents a characterization of the experiments based on academic program
and content/task of the courses. A detailed description o f the main attributes o f the
experiments is provided in the next section.
When designing field experiments caution must be taken to insure internal
construct, and external validity. Internal validity is “the approximate validity with which
we infer that a relationship between two variables is causal or that the absence of a
relationship implies the absence o f cause” (Cook and Campbell, 1979). For example, in
58
Reproduced with permission of the copyright owner. Further reproduction prohibited without permission.
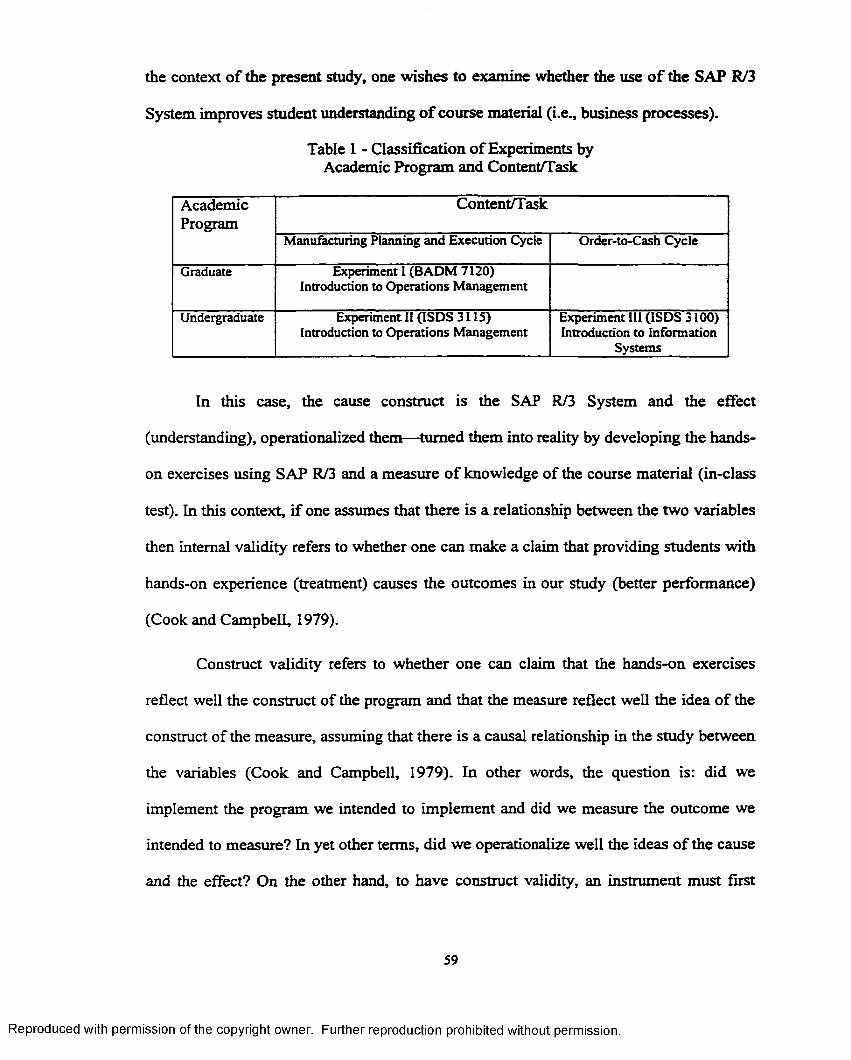
the context o f the present study, one wishes to examine whether the use o f the SAP R/3
System improves student understanding o f course material (i.e., business processes).
Table 1 - Classification o f Experiments by Academic Program and Content/Task
AcademicProgram
Content/Task
Manufacturing Planning and Execution Cycle Order-to-Cash Cycle
Graduate Experiment I (BADM 7120) Introduction to Operations Management
Undergraduate Experiment II (ISDS 3115) Introduction to Operations Management
Experiment III (ISDS 3100) Introduction to Information
Systems
In this case, the cause construct is the SAP R/3 System and the effect
(understanding), operationalized them—turned them into reality by developing the hands-
on exercises using SAP R/3 and a measure o f knowledge of the course material (in-class
test). In this context, if one assumes that there is a relationship between the two variables
then internal validity refers to whether one can make a claim that providing students with
hands-on experience (treatment) causes the outcomes in our study (better performance)
(Cook and Campbell, 1979).
Construct validity refers to whether one can claim that the hands-on exercises
reflect well the construct of the program and that the measure reflect well the idea o f the
construct of the measure, assuming that there is a causal relationship in the study between
the variables (Cook and Campbell, 1979). In other words, the question is: did we
implement the program we intended to implement and did we measure the outcome we
intended to measure? In yet other terms, did we operationalize well the ideas o f the cause
and the effect? On the other hand, to have construct validity, an instrument must first
59
Reproduced with permission of the copyright owner. Further reproduction prohibited without permission.
have content validity. This means that it must adequately represent the domain of interest
and use terminology readily understood and agreed upon by members o f the field of
interest (Churchill, 1979). In the context of the present study, the instruments (pretest
and posttest) used have content validity because the questions are directly tied to various
aspects o f ERP and SAP R/3 literacy (e.g., knowledge about ERP systems, client /server
architecture, business processes, etc.). Furthermore, the questions are clearly worded so
that there is little room for subjective interpretation.
External validity refers to whether one can generalize the effect to other persons,
places or times, assuming that there is a causal relationship in the study between the
constructs o f the cause and the effect. Since there are three ways one can be wrong:
people, place or time, there are three major threats to external validity: a) results could be
attributed to unusual type o f people who were in the study or b) one could argue that it
might only work because o f the unusual place in which the researcher did the study or c)
one might suggest that the researcher did his/her study at a peculiar time. To improve
external validity one should use random selection, then once selected, one should try to
assure that the respondents participate in the study and keep the dropout rates low (Cook
and Campbell, 1979). Thus, the lack of validity in a study results in the inability to make
any statements about cause-and-effect relationships and thereby, invalidates the
experiment.
The focus o f this study is on how different instructional approaches (i.e.,
traditional instruction, computer-based hands-on instruction and computer-based
simulated hands-on instruction) facilitates the knowledge and understanding of business
processes (i.e., Manufacturing Planning and Execution Cycle, Order-to-Cash Cycle).
60
Reproduced with permission of the copyright owner. Further reproduction prohibited without permission.

4.2. Course Description
This study was conducted as part o f regular class lessons in three different courses
offered by the Information Systems and Decisions Science Department at Louisiana State
University (LSU, 1999). The following is a catalog description o f the courses listed in the
LSU General Catalog, 1999-2000. Each course represents an experimental population
(Table I).
Operations Management (BADM 7120) - Experiment I
This is an MBA course that covers major problems and decisions of operations
management: operations strategy, process and capacity planning, quality planning,
materials planning, supply chain management.
Introduction to Operations Management (ISDS 3115) - Experiment II
This is a junior course that covers principles and methodologies concerning
productivity and quality of manufacturing and service organizations; production and
service systems design; process and capacity design; total quality management; systems
for just-in-time and purchasing management; inventory and materials management.
Management o f Information Resources (ISDS 3100) - Experiment in
This is a junior course that covers information as a resource; issues in information
resource management; elements of information systems; development and maintenance
o f information systems; controlling information resources.
4.3. Population and Sample
The population studied in this investigation is undergraduate and graduate
business students in a public university in the State of Louisiana. The study involves
three different student populations (BADM 7120, ISDS 3115, and ISDS 3100).
61
Reproduced with permission of the copyright owner. Further reproduction prohibited without permission.

Populations are differentiated by academic program (undergraduate or graduate),
academic status (part-time or full-time students), age structure, etc. On the other hand, the
target population involves two different domains (operations management and
information systems).
The sample (subjects) size by course and number o f sections is presented in Table
2. The sample comprises a total o f 53 students enrolled in two sections o f the course
entitled Operations Management (BADM 7120). A total o f 284 undergraduate students
were enrolled in five sections of the course entitled Introduction to Operations
Management (ISDS 3115). A total o f 53 students were enrolled in two sections o f the
course entitled Management of Information Resources (ISDS 3100). These three courses
represent three different populations based on the academic level and the course content
as described above.
Table 2 - Sample Size by Course
Course N Number o f Sec.BADM 7120 - Operations Management 53 2
ISDS 3115 - Introduction to Operations Management 284 5ISDS 3100 - Management of Information Resources 53 2
Subjects are randomly assigned to the treatment groups (hands-on exercises using
SAP R/3 System instruction and simulated hands-on exercises using SAP R/3 System
instruction).
The Manufacturing Planning and Execution Cycle is chosen as the domain area to
be used in the experiments I and II (BADM 7120 and ISDS 3115, respectively). The
Customer Order Management Cycle is chosen as the domain area for the course ISDS
3100 (experiment III). None of the students enrolled in ISDS 3115, or ISDS 3100 would
62
Reproduced with permission of the copyright owner. Further reproduction prohibited without permission.

have been exposed to this topic before encountering it in this course. In the case of
BADM 7120, some o f the students have already some exposure to the software.
4.4. Research Variables
The variables to be considered for the present study are provided in Table 3. The
two independent variables are the instructional method (traditional acts as the control,
computer-based hands-on SAP R/3 System, and computer-based simulated hands-on SAP
R/3 System via Web) and Learning Style (Diverger, Assimilator, Converger, and
Accommodator). Experiments I (BADM 7120) and III (ISDS 3100) only compare two
instructional methods (computer-based hands-on SAP R/3 System, and computer-based
simulated hands-on SAP R/3 System via Web) and do not measure learning style. In
contrast, experiment II (ISDS 3115) does involve all three instructional methods and
learning styles.
Table 3 - Variables to be Considered in the Study
Independent Dependent• Instructional Method:
1. Traditional (Control)2. Computer based Hands-on
(System)3. Computer based Simulated
Hands-on (no System) via Web
• Learning Style (Kolb, 1985)1. Diverger2 . Assimilator3. Converger4. Accommodator
• Performance• Self-Efficacy (Compeau and Higgins, 1995b)• User Satisfaction (Doll and Torkzadeh ,1988)
Other Variables- Knowledge/Skills Assessment- Demographic Characteristics- Attitude Toward Computers
Technology- Lecture Satisfaction- Lecture Evaluation
The dependent variables (Table 3) are (1) student performance, which will be
measured by student grades on a test given at the end of the experiments; (2 ) self-
efficacy, which will be measured by a survey instrument developed by Compeau and
63
Reproduced with permission of the copyright owner. Further reproduction prohibited without permission.

Higgins (1995b); (3) satisfaction, which will be measured by a survey instrument
developed by Doll and Torkzadeh (1988).
Information on a number o f other variables will be measured to be used in the
analysis as covariates (Table 3): knowledge/Skills assessment, demographic
characteristics, attitude toward computer technology (Kinzie, et al., 1994), lecture
satisfaction, and lecture evaluation.
4.4.1. Instructional Method
Instructional method refers to the actual delivery o f the content. Several
researchers agree that instructional/training method influences students/trainee’s
performance (Bostrom, Olfinan, and Sein, 1990; Leidner and Jarvenpaa, 1993). The types
of instruction methods (Figure 9) used in this study are: a) a traditional instruction
method that acts as the control (lecture plus reading/exercises), b) a computer-based
method with hands-on SAP R/3 System, and c) a computer-based method with simulated
hands-on the SAP R/3 System via Web. Figure 9 illustrates the operationalization of the
instructional methods (Content).
The content (Figure 9) was a set o f two 50-minute lectures on Enterprise
Resource Planning (ERP) Systems and either a lecture on Manufacturing Planning and
Execution (MPE) or Order-to-Cash Cycle (OTC) designed and taught by the same
instructor. After the first lecture session on ERP, the BADM 7120 and ISDS 3115
groups received a lecture on the Manufacturing Planning and Execution Cycle (MPE)
(Figure 9, solid line). The ISDS 3100 class received instruction on ERP and the Order-to-
Cash Cycle (OTC) instead of the Manufacturing Planning and Execution Cycle (MPE)
given to BADM 7120 and ISDS 3115 students (Figure 9 dashed line). After the two class
64
Reproduced with permission of the copyright owner. Further reproduction prohibited without permission.

lectures were completed, each student received a handbook packet containing the
instruction to do the assignment. For the assignment, a combination of an exploration and
instruction-based manual was operationalized by following the Minimalist theory
(Carroll, et al., 1987; Lazonder & Van der Meij, 1993) as described in Chapter 2.
Course
BADM 7120 ISDS 3100ISDS 3 H 5
Legacy systems Enterprise Systems SAP R/3 System Functionality
ERP
1. Pre-sales activities2. Sales Order Processing3. Inventory Sourcing4. Delivery5. Billing6. Customer Payment
Steps:Order-to-Cash CycleManufacturing Planning & Execution Cycle
Steps:_______________________________1. Forecasting2. Sales and Operations Planning3. Demand Management4. Master Production Schedule (MPS)5. Material Requirement Planning (MRP)6. Manufacturing Execution7. Order Settlement
Figure 9 - Lecture Content
4.4.2. Learning Style
Individual learning style is an independent variable in this study. Researchers
believe that learning style is a good predictor o f an individual’s preferred learning
behavior (Bostrom, Olfman, and Sein, 1993). This study uses learning style to
investigate the impact of its interaction with the instructional method on the individual’s
performance. This study does not use learning style as a control variable. Learning Style
is measured only in Experiment II corresponding to ISDS 3115. The impact o f learning
65
Reproduced with permission of the copyright owner. Further reproduction prohibited without permission.
style will allow additional explanation o f any difference in performance between
students, if necessary. The learning style is measured by the Kolb’s Learning Style
Inventory (Kolb, 1985) (Appendix-B).
4.4.3. Outcome/Performance
Performance (knowledge and understanding o f business process and the SAP R/3
System) is measured at the end of the instruction session in the classroom. Performance
is measured both in quantitative and qualitative terms. Tested scales for the model’s
constructs (Figure 8 ) were used whenever they were available, and were modified only as
absolutely necessary to apply to the study context.
Learning performance is measured at one level: acquisition of declarative
knowledge. Declarative knowledge refers to the concepts, principles, issues, and facts
presented in a learning situation. Thus, the quantitative performance measure will be an
in-class multiple-choice/true-false test on the lecture material and on the class assignment
(reading/exercise, computer-based hands-on SAP R/3 System exercises and simulated
computer-based hands-on SAP R/3 System exercises) (Appendix D).
The qualitative performance measure will include a student’s Self-Efficacy and
student’s Satisfaction with the instructional methods.
4.4.4. Self-Efficacy Instrument
Self-efficacy theory suggests that individuals must feel confident in using a
particular technology in order to effectively employ it (Bandura, 1977). High correlation
is often found between reported self-efficacy and subsequent performance (Bandura and
Adams, 1977). In this study, self-efficacy is measured by administering a ten-item scale
instrument developed by Compeau and Higgins (1995b) (Appendix E). The instrument
66
Reproduced with permission of the copyright owner. Further reproduction prohibited without permission.

has proven to have a high reliability (Cronbach’s alpha = 0.94). The Compeau and
Higgins (1995b) instrument measures "People's judgments o f their capabilities to
organize and execute courses o f action required to attain designated types of
performances. It is concerned not with skills one has but with judgments o f what one can
do with whatever one possesses" (Bandura, 1986).
4.4.5. User Satisfaction Instrument
User satisfaction is measured by administering an instrument based on Doll and
Torkzadeh’s (1988) end-user satisfaction instrument (Appendix F). The Doll and
Torkzadeh (1988) instrument measures the end-user computing satisfaction construct and
uses three major factors: content/format, accuracy/timeliness, and ease o f use/efficiency.
Since a major concern in using an Enterprise System is its ease o f use and content/format
rather than accuracy/timeliness, the Doll and Torkzadeh (1988) instrument is modified
and used as a guideline to include items that focus on ease o f use and content. The
purpose o f using a measure o f user satisfaction is to evaluate the instruction design (e.g.,
manuals). Thus, satisfaction is not measured to predict behavior (e.g., usage) but to leam
how to develop better instructional material.
4.5. Experimental Design Structure
The research design for this study follows a true experimental design.
Experimental units (students) were randomly assigned the treatment groups (computer-
based hands-on SAP R/3 System and computer-based simulated hands-on SAP R/3
System) without consideration o f their learning style. Randomization was done by
following the method established by Neter, et al. (1990) and using a uniform random
number generator from Microsoft Excel. When control over the independent variable(s)
67
Reproduced with permission of the copyright owner. Further reproduction prohibited without permission.

is/are exercised through random assignments, the resulting experimental data provide
much stronger information about cause-and-effect relationships than do observational
data (Neter, et al., 1990).
Experiments I and III involve only one factor (instructional method). Experiment
II is a two-factor design, where instructional method is the independent variable and
learning style is the moderating independent variable. The result is a 3 X 4 factorial
design (Table 4). The main dependent variable is performance as measured by the scores
on a posttest. The test was identical for the three experimental groups.
Table 4 - Experimental Design Structure for Experiment II
Instructional Method (A)Learning Style (B)
Diverger k = 1
Assimilator k = 2
Converger K = 3
Accommodator k = 4
Control O' — 1) AjBi A 1B2 A 1B3 A1B4
Hands-on System O' -2) A2B1 A2B2 A2B3 A2B4
Simulated Hands-on System Q —3) A3B 1 A3B2 A3B3 A3B4
4.6. Experimental Procedure
The implementation of the experiments is illustrated in Figure 10. As depicted in
the figure, the experimental procedure included four main phases. During Phase I, Pre
instruction activities, the course instructor introduced the researcher and gave a brief
introduction to explain the nature and purpose of the study. Subjects (students) were told
that the study’s m ain objective was to investigate ways to improve the business school
curricula. Then, subjects were given enough time to complete an in-class background
knowledge assessment and the Learning Style Inventory, if applicable. A preliminary
survey to collect data on demographic characteristics, attitudes toward computer
68
Reproduced with permission of the copyright owner. Further reproduction prohibited without permission.

technologies, and previous experience with, and current use o f computer technologies
was given to subjects to fill out at home and bring to the next class session. The «ams
script was followed in every class.
During Phase 2, a set of two 50-minute lectures were presented on Enterprise
Resource Planning (ERP) Systems and either a lecture on Order-to-Cash Cycle (OTC) or
Manufacturing Planning and Execution (MPE) business processes. Following the
lectures, an assignment was provided to the students.
EXpERtMENTAL
PROCEDURE
Figure 10 - Experimental Procedure
There were three types of assignments: a) reading & exercises, this is a traditional
textbook reading and homework exercise that is given to students to support in-ciass
lecture, b) hands-on R/3, this is a hands-on experience exercise that ask students to
Phase 1 Pre-instruction Activities
Phue2
LECT
URt
ERP Business Process
C >
Phase3
ASS
1cNME
NT
ControlREADING St EXERCISES
TreatmentsHANDS-ON R/3 SIM ULATED
HANDS-ON R/3 VIA W EB
Phasc4 Posttest
Reproduced with permission of the copyright owner. Further reproduction prohibited without permission.

perform a series o f business transactions using the SAP R/3 Systems, and c) simulated
hands-on R/3 via Web, this is similar to the hands-on R/3 assignment but instead o f using
the system, students are asked to observe a series of Lotus ScreenCam demonstrations of
how to perform the business transactions using the system. Students were given a week
to complete the assignment (Phase 3).
During Phase 4, immediately after the due date of the assignment, subjects were
given enough time to fill out post-instruction surveys (i.e., Self-efficacy, end-user
computing satisfaction, user-Iecture satisfaction, and lecture session evaluation). Then, a
comprehension test was administered. The posttest was composed of multiple
choice/true-false questions that emphasized the understanding o f the declarative
knowledge on ERP and business processes, it lasted approximately 20 minutes.
4.7. Summary
The research design, population and sample, and operationalization o f the
instruments, and experimental procedure for this study were discussed in Chapter 4.
Table 5 presents a summary o f the main attributes by experiment. Data collection and
measures are presented in Chapter 5.
Table 5 - Summary Description of the Main Attributes of the Experiments
Experiment Academicprogram
SampleSize
Independent Variable DependentVariable
I Graduate (BADM 7120) 53
Instructional Method1. Simulated Hands-On2. Hands-On
Performance Self-Efficacy User Satisfaction
II Undergraduate (ISDS 3115) 284
Instructional Method1. Control2. Simulated Hands-On3. Hands-On Learning Style
Performance Self-Efficacy User Satisfaction
III Undergraduate (ISDS 3100) 53
Instructional Method1. Simulated Hands-On2. Hands-On
Performance Self-Efficacy User Satisfaction
Reproduced with permission of the copyright owner. Further reproduction prohibited without permission.
5. DATA COLLECTION AND MEASURES
This chapter discusses the implementation o f the research methodology to test the
hypotheses proposed in Chapter 3. The first section begins with a review o f the data
collection procedure. Then, Section 2 presents the operationalization of the research
variables in the research model.
5.1. Data Collection
5.1.1. Administration of Instruments
Consistency in administrating the instruments is a key factor to the validity o f the
experiment. The researcher administrated the surveys in an identical fashion in all nine
sections. First, the instructor presented a short description of the proposed investigation
and the value added to the educational environment Second, the researcher was
introduced to the class. The researcher explained the questions to the students and asked
for their cooperation in filling out the surveys. The importance of carefully filling out the
questionnaires was emphasized and sufficient time was allowed. The students were
assured that the information they provided will remain strictly confidential and that their
grades will not be affected in any way.
5.2. Operationalization of Research Variables
Operational definitions specified how research constructs and variables will be
measured. Although some of the operationalizations have already been presented in the
discussion o f the literature, all proposed operationalizations are discussed in this chapter
for the sake o f completeness. Thus, this section presents the surveys and the instruments
used to measure the performance, self-efficacy and user satisfaction, as well as a brief
discussion o f the validity and reliability o f the instruments.
71
Reproduced with permission of the copyright owner. Further reproduction prohibited without permission.
5.2.1. Preliminary Survey
In order to establish a baseline o f each sample population, all subjects were
surveyed on the following individual characteristics:
- Demographic information (age, gender)
- Academic information (level, major, GPA)
- Access to a Computer (home, work)
- Access to the Internet (home, work)
Previous Experience with, and current use of, computer technology
- Attitude toward computer technology
Appendix-A shows the 23-question survey. Demographic data were used in assessing the
prior knowledge of the subjects.
5.2.2. Learning Style Instrument
A learning style instrument (Appendix B) was administered to measure subject’s
learning style. Learning style was used to detect any significant interaction between
instructional approaches and learning style. A learning style inventory is designed to
measure an individual’s strengths and weaknesses as a learner. The learning style
inventory measures an individual’s relative emphasis on the four learning abilities
(concrete experience, reflective observation, abstract conceptualization, and active
experimentation) by asking him or her to rank, in order, four words that describe these
different abilities (Kolb, 1984).
5.2.3. Pre-Treatment Knowledge/Skills Assessment
The basic knowledge/skills initial assessment was given to all subjects in the first
lecture (i.e., Enterprise Systems). The assessment was a 15 multiple-choice quiz that
72
Reproduced with permission of the copyright owner. Further reproduction prohibited without permission.
covered basic concepts about legacy systems, Enterprise Resource Planning, the SAP R/3
System, and either Manufacturing Planning Execution or the Order-to-Cash cycle. The
quiz was graded on a scale o f 1 to 10. A copy o f the quiz used in the ISDS 3115 course is
provided in Appendix C.
5.2.4. Measuring Performance
A true-false, multiple-choice examination was used to measure knowledge and
understanding of the concepts underlying Enterprise Systems and either Manufacturing
Planning and Execution or Order-to-Cash cycles processes. The performance measure
instrument used in ISDS 3115 is provided in Appendix D. The test was graded on scale
of 1 to 1 0 0 .
Grades on the assignments were examined, but were not used in the measurement
o f performance. This is because there is no guarantee that these assignments were
undertaken by the sole efforts o f the student; thus, they may not be a reliable measure of
the learning effectiveness.
5.2.5. Measuring Self-Efficacy
Factors such as poor reliability and validity o f measuring instruments have
contributed to weak and inconsistent results in MIS research (Jarvenpaa and Dickson,
1985). As a result, information systems researchers are encouraged to use previously
developed and validated instruments as much as possible. In this study, the Self-Efficacy
measuring instrument developed and validated by Compeau and Higgins (1995) is used
(Appendix-E). The instrument consists of a 10-item questionnaire asking students if they
felt that they could do a task using a software package under various circumstances.
73
Reproduced with permission of the copyright owner. Further reproduction prohibited without permission.

Initially, the students are asked to react with a "yes" or a "no" answer. If "yes," then they
are asked to rank their degree of confidence on a scale of 1 to 1 0 .
5.2.6. Measuring User Satisfaction
This study uses a modified version of the Doll and Torkzadeh (1988) end-user
computing satisfaction instrument (Appendix F). The original twelve question end-user
satisfaction instrument has a Cronbach’s alpha reliability o f r = 0.98 (Doll and
Torkzadeh, 1988). The instrument measures the end-user computing satisfaction
construct and uses three major factors: content/format, accuracy/timeliness, and ease of
use/efficiency. Since a major concern in using an Enterprise System is its ease o f use and
content/format rather than accuracy/timeliness, the Doll and Torkzadeh (1988) instrument
is modified and used as a guideline to include items that focus on ease o f use and content.
5.2.7. Other Measurement items
Two additional instruments were used to measure the students’ satisfaction with
the lecture presentations (Appendix G) and evaluation o f the instructor’s presentation
(Appendix H) o f the class material. It is expected that the information provided by these
instruments can clarify possible hypotheses test results.
5 .3 . S u m m a ry
This chapter discusses the data collection procedures followed by the
operationalization o f the data collection instruments.
74
Reproduced with permission of the copyright owner. Further reproduction prohibited without permission.

6. DATA ANALYSIS AND RESULTS
This chapter presents the results from the data analyses. The chapter begins with
a discussion o f the main statistical techniques that are used for the analyses. Then, for
each experiment, the validity and reliability analysis, descriptive statistics, and
hypotheses testing results are presented. A summary o f the results is presented at the end
of each experiment’s results.
6.1. Statistical Technique for the Analysis
This section briefly explains the main data analysis approaches adopted in the
study, if applicable. The Statistical Analysis Systems (SAS) software package is used to
run the statistical analyses (SAS Institute, 1989).
6.1.1. Nonparametric Statistical Methods
When experimental data are not normally distributed, the efficacy of standard
parametric statistical tests, such the F-test, is affected. Although the F-test for the analysis
of variance is robust against departures from normality, two primary effects result when
the normality assumption is violated. First, nonnormality will influence the ability o f a
statistical test to perform at the stated a-level. Cochran (1947) refers to this effect as the
validity effect Second, nonnormality will also affect the power o f a statistical test to
detect differences when real differences in the data actually exist. Two approaches are
often recommended when data are not normally distributed: a) transform for normality,
or b) apply nonparametric statistical methods (Neter, et al., 1990).
Thus, in this study both procedures, data transformation and use o f nonparametric
test, were implemented. In particular, this study uses the Kruskal-Wallis test as an
75
Reproduced with permission of the copyright owner. Further reproduction prohibited without permission.

alternative to the one-way analysis o f variance method (Neter, et al., 1990) when
appropriate.
6.1.2. Regression Approach to Two Factor Analysis o f Variance
When experimental group sample sizes are unequal, the analysis o f variance for
two-factor studies becomes more complex. A number o f problems must be dealt with to
obtain a valid test o f hypotheses (main and interactions effects). For example, the least
squares equations are no longer o f a simple structure, yielding direct and ease solutions
and the formulas normally used for computation are not appropriate. Furthermore, the
factor effect component sums o f squares are no longer orthogonal - that is, they do not
sum to Sum o f Squares Treatment (Neter, et al., 1990).
An approach often used to obtain the proper stuns of squares for testing factor
interactions and main effects when sample sizes are unequal is through the regression
approach described by Neter, et al. (1990). When compared to the traditional Analysis of
Variance (ANOVA) procedure, the only difference when sample sizes are unequal is that
a reduced model needs to be fitted for each test of factor interaction and main effects.
Regression analysis can be used to conduct ANOVA when sample sizes are
unequal. The outcome in the regression analysis is the same as that in the ANOVA. The
predictors are the grouping factors (experimental groups and learning style). Unlike
ANOVA, one must assign specific values to the predictors. The X matrix has one row
for each experimental observation, and one column for each term in the model including
the constant
76
Reproduced with permission of the copyright owner. Further reproduction prohibited without permission.

A two-factor analysis requires creation o f codes for the levels o f factor one (A)
and factor two (B) as well as codes for the AB interaction. The interaction code is
created by multiplying each column o f A by each column o f B. The regression analysis
including all five variables will generate regression sum o f squares equal to SSa + SSb
+ SSab and residual sum o f squares equals SSettot- In order to estimate the SSa, SSb,
and SSab separate regressions (Full Model (1) and Reduce Models) must be conducted
including only the A-terms, B-terms, and interaction terms, respectively. Then, the F-
tests are computed by hand using the sums o f squares generated (Reduce Models) and
the SSError generated by the full model. The Full Model is:
^ijk ~ t* .. + a 1X ijk 1 + a 2 ^ ijk 2 + P \ X ijk 3 + P i X ijk 4 + P z ^ i j k Si ^ I JV
A Main effect B Main effect
+ faP )ll X ijk 1X ̂ 3 + {ctfi ),2 X ijk ,X ijk 4 + (aft ),3 X jjk , X ;jk 5 +V--------------------------------------------------------------------------------------------------------------------------V --------------------------------------------------------------------------------------------11 ■ ■ /
AB int eraction effect
(a/3 )2, X iyJ2X 1Jt3 + (a/3 L X # 2 X 9i4 + (afi )n X,It2X IJt5 CDV — . _ - _ >
where i represents the instructional method factor effect at three levels (/ = 1, 2, 3) and j
is the learning style factor effect at four levels (j = 1, 2, 3, 4). Since there are unequal
observations per cell, the coefficients and sum o f squares will be different in the foil
model and in the reduced model. In other words, the effects are not orthogonal, sums of
squares and coefficients change as terms are added and deleted from the m odel
The above regression approach can be performed using the Statistical Analysis
System (SAS). Specifically, the outputs that are the equivalent o f the regression results
77
Reproduced with permission of the copyright owner. Further reproduction prohibited without permission.

are provided by the TYPE III or Type IV sum squares in SAS PROC GLM (Neter, et
al., 1990). This study used the above procedure when appropriate.
6.1.2.1. Pairwise Comparisons o f Factor Level Means
The F-test is a very general test. When one rejects the null hypothesis and thus
concludes that the group means differ, one does not know which groups differ from
each other and which ones do not. In the case o f post hoc tests (no specific differences
to be tested were specified prior to conducting the experiment), the Tukey multiple
comparison method is conservative when sample sizes are unequal (Neter, et al., 1990).
Thus, the study uses the Tukey method to perform multiple comparisons among
experimental groups. The family confidence coefficient was specified to be 0.90. This
study uses the formulas provided by Neter et aL (2, 3, 4, and 5) for the point estimates
and estimated variances to compute confidence intervals o f the pairwise comparisons o f
the experimental group factor level means (1990).
Point Estimate (2)P . J = a
Difference (3)
(4)
78
Reproduced with permission of the copyright owner. Further reproduction prohibited without permission.

Variance „ 2 / A \ MSE_2 Z *M / n., n
V ,J v J
(5)
6.1.2.2. Assumptions
The validity o f the hypotheses tests is based on several assumptions. One is that
the errors are normally distributed. This assumption was tested by using the Normal
option in the Proc Univariate SAS statement (SAS, 1989) to perform the Shapiro-Wilk
test ( W).
Another assumption is that the group variances are equal. There are several
ways to test this hypothesis. They all test the null hypothesis that the variances are
equal against the alternative that they are not. The most widely used test is the Bartlett
test o f homogeneity o f variance. It is appropriate when the groups are o f unequal size.
Thus, this study used the Bartlett test o f homogeneity o f variance.
6.1.3. Analysis o f Covariance (ANCOVA)
Covariance analysis is used to reduce error variability (Neter, et a l, 1990). Error
variability is reduced by utilizing the relationship between the dependent variable (Le.,
performance, self-efficacy, satisfaction) and one or more independent quantitative
variables for which observations are available (Le., initial skills/assessment scores,
attitude toward computers) in order to make the study a more powerful one for
comparing treatment effects.
Independent variables are called concomitant variables in ANCOVA.
Concomitant variables often used with human subjects include prior experience with
computers (Santhanam and Sein, 1994; Sein and Bostrom, 1989), knowledge/skills
79
Reproduced with permission of the copyright owner. Further reproduction prohibited without permission.

before treatment (Oilman and Mandviwalla, 1994; Davis and Davis, 1990), pre-study
attitudes, age, etc. In this study, data were collected on a number o f variables (Le.,
knowledge/skills assessment, attitude toward computers, etc.) to be used as covariates.
Thus, the hypothesis test included as an initial step the Analysis o f Covariance.
6.1.4. Power Analysis
Power analysis is used to evaluate the performance o f a particular statistical test
(s) under a particular condition. The power o f a statistical test o f a null hypothesis is the
probability that it will lead to the rejection o f the null when it is false. Thus, the higher
the power, the greater the probability o f detecting a statistically significant difference at
a given alpha level.
Power depends upon three parameters: 0 the significance level (alpha), u) the
sample size (n), and iii) the "effect size" or degree to which the phenomenon exist
(Cohen, 1977). Alpha (a ) is the probability o f a type-I error. A type-I error occurs
when an experiment results in the rejection o f the null hypothesis when the null
hypothesis is true.
The Effect size is the size o f the change in the parameter o f interest that can be
detected by an experiment. For example, what is the performance score difference that
one is interested in determining between experimental groups (i.e., two, three, four,
five, etc. average points difference)? Cohen (1988) has designed value o f Effect Size
less than 0.1 as small, values around 0.2S to be medium, and values over 0.40 to be
large. Effect size is defined as:
/ = ^ » (6) a
80
Reproduced with permission of the copyright owner. Further reproduction prohibited without permission.

where is <rm the standard deviation o f the group means and <r is the standard deviation o f
values within a cell. The value o f am is computed as:
where N is the total number o f observations, MSE is the mean square error, d f is the
numerator degrees o f freedom, and F is the F-ratio o f the term.
There are two main types o f power analyses that are often performed: 1) a power
for a given alpha and beta (Type-II error), where power is 1-beta; 2) a power analysis is
done as a post-hoc analysis, which is after the study is concluded. Power analysis after
data have been collected involves answering questions such as 2a) What sample size
would have been needed to detect a difference (effect size) o f the magnitude observed
in the study with a = 0.05 and beta = 0.20 (power = 0.8)? 2.b) what is the smallest
difference (effect size) that could be detected with this sample size at certain values o f
alpha and beta? 2c) What was the power o f the test procedure?
For the purpose o f this study, Cohen’s (1977) method is used to compute power.
Specifically, power analysis is used to answer question 2c. Thus, the power values
computed are for the case when the effect associated with the alternative hypotheses are
equal to those given by the data.
6.2. Experiment I (BADM 7120)
In this experiment, a completely randomized factorial design was used to
determine if there are any differences in performance, self-efficacy, and satisfaction
between subjects that receive two different instructional methods. In one instructional
(7)
analysis is performed during the design phase o f a study to determine the sample size
81
Reproduced with permission of the copyright owner. Further reproduction prohibited without permission.

method, students receive traditional lecture format, but also have full access to simulated
hands-on SAP R/3 System via Web transaction exercises (Simulated Hands-On). In the
other method, students receive the traditional lecture format with full access to hands-on
SAP R/3 system transaction exercises (Hands-On).
6.2.1. Validity and Reliability Analysis
6.2.1.1. Content Validity
Content validity refers to the extent to which the items making up a measure are a
representative sample of the domain of items associated with the variable being measured
(Straub, 1989). Thus, content validation mostly relies on the expert’s judgement. In this
study, the utilization o f operationalizations from previous studies enhanced the content
validity o f the instruments.
6.2.1.2. Construct Validity
Construct validity refers to the extent to which the instrument is in fact measuring.
It is, in fact, an operational issue (Straub, 1989). For items that were constructed out of
suggestions in the literature and have not been used before, factor analysis is an effective
means of confirming their construct validity (Straub, 1989). Factor analysis was
performed for each o f the instruments used on the study. Table 6 presents the results from
factor analysis for each research variable consisting o f more than three questionnaire
items.
Table 6 - Factor Analysis for Multiple-Item Measures, Factor I
Variable Eigenvalue Variance ExplainedSelf-Efficacy 5.79 58%Computer User Satisfaction 4.12 59%Attitude toward Computers 6.20 69%Lecture Satisfaction 4.39 44%Lecture Evaluation 3.88 55%
82
Reproduced with permission of the copyright owner. Further reproduction prohibited without permission.
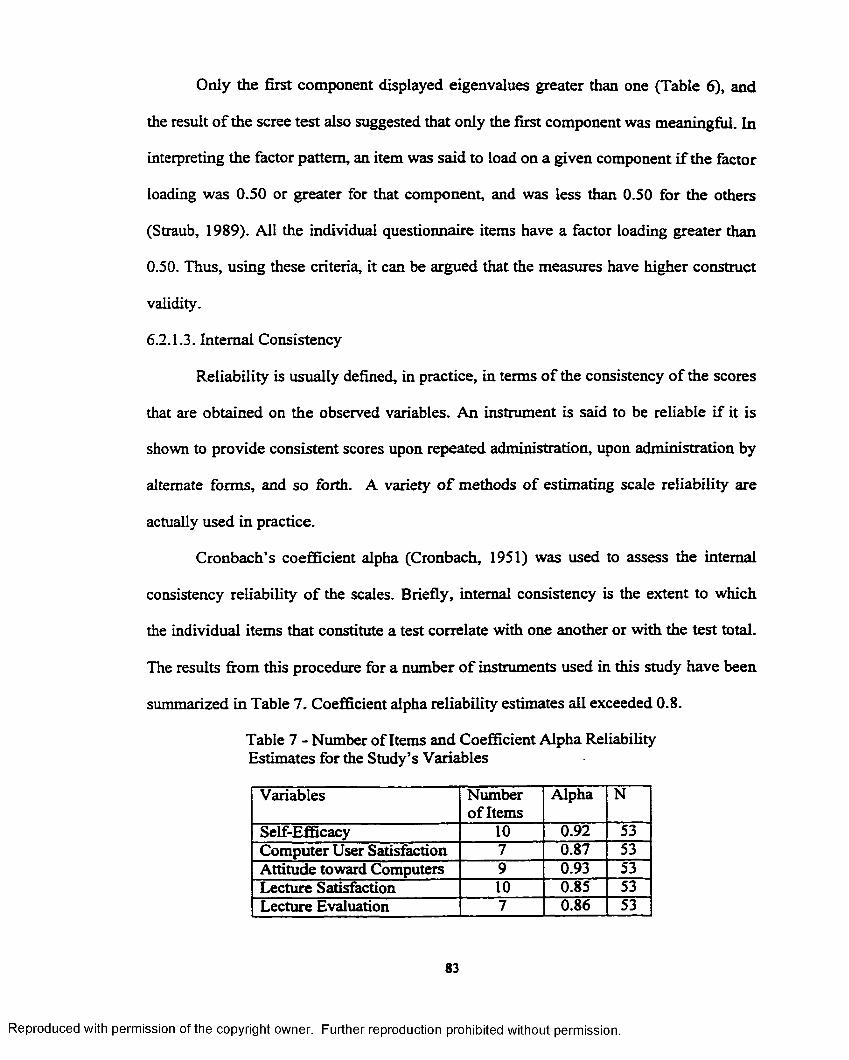
Only the first component displayed eigenvalues greater than one (Table 6), and
the result o f the scree test also suggested that only the first component was meaningful. In
interpreting the factor pattern, an item was said to load on a given component if the factor
loading was 0.50 or greater for that component, and was less than 0.50 for the others
(Straub, 1989). All the individual questionnaire items have a factor loading greater than
0.50. Thus, using these criteria, it can be argued that the measures have higher construct
validity.
6.2.1.3. Internal Consistency
Reliability is usually defined, in practice, in terms o f the consistency o f the scores
that are obtained on the observed variables. An instrument is said to be reliable if it is
shown to provide consistent scores upon repeated administration, upon administration by
alternate forms, and so forth. A variety o f methods o f estimating scale reliability are
actually used in practice.
Cronbach’s coefficient alpha (Cronbach, 1951) was used to assess the internal
consistency reliability o f the scales. Briefly, internal consistency is the extent to which
the individual items that constitute a test correlate with one another or with the test total.
The results from this procedure for a number o f instruments used in this study have been
summarized in Table 7. Coefficient alpha reliability estimates all exceeded 0.8.
Table 7 - Number of Items and Coefficient Alpha Reliability Estimates for the Study’s Variables
Variables Number o f Items
Alpha N
Self-Efficacy 10 0.92 53Computer User Satisfaction 7 0.87 53Attitude toward Computers 9 0.93 53Lecture Satisfaction 10 0.85 53Lecture Evaluation 7 0.86 53
83
Reproduced with permission of the copyright owner. Further reproduction prohibited without permission.

According to Straub (1989), a reliability coefficient greater than or equal to 0.8 is
acceptable. The researcher concluded that the internal consistency reliability coefficient
(alpha) of the instruments was acceptable for purposes of this study.
6.2.2. Descriptive Statistics
Demographic data were collected on all of the subjects. The demographic data
were used to assess the subject’s knowledge and experience about computer technologies
before the treatment and thus, establish if experimental groups were equivalent. Data
were analyzed in two ways. First, a series of frequency distributions were compiled on
the demographic as well as previous experience with, and current use o f computer
technologies to examine the variety o f inputs (individual differences among students) into
the experimental groups. Then appropriate statistical tests were used to compare variety
among the groups. Thus, this section summarizes the results o f the demographic data.
6.2.2.1. Subjects Profile
The distribution o f the subjects’ participation according to their major area of
study, age, work experience, and gender by experimental group (Simulated Hands-On the
SAP R/3 System (n=26) and Hands-On the SAP R/3 System (n=27)) is presented in
Table 8. There were seven categories of study — Finance, Accounting, Marketing,
Information Systems, Operations Management, General Business, and others. O f the
overall subjects sample (n=53), approximately 5.7% of subjects were in Finance, 5.7% in
Accounting, 5.7% in Marketing, 13.2% in Information Systems, 39.6% in Operations
Management, 18.9% in General Business, and about 11.2% had another major.
Approximately 17.0% of the participants were less than 25 years o f age, 62.3% of the
84
Reproduced with permission of the copyright owner. Further reproduction prohibited without permission.
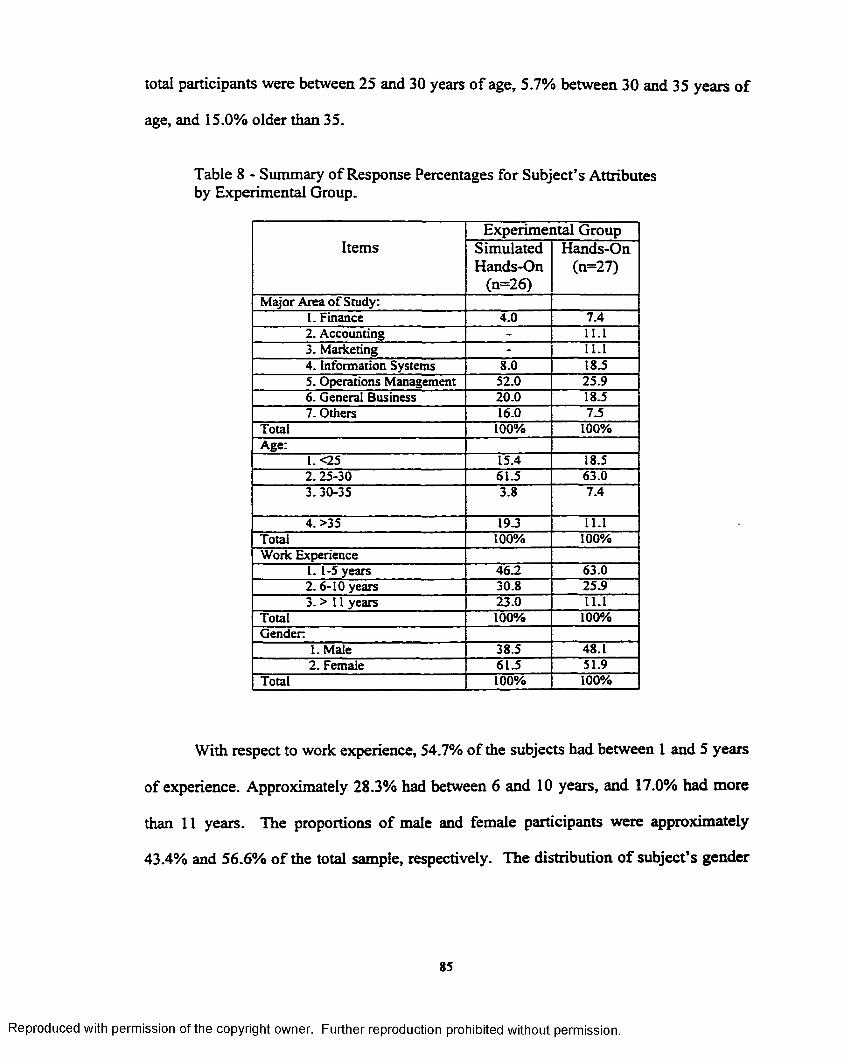
total participants were between 25 and 30 years o f age, 5.7% between 30 and 35 years of
age, and 15.0% older than 35.
Table 8 - Summary of Response Percentages for Subject’s Attributes by Experimental Group.
ItemsExperimental Group
SimulatedHands-On
(n=26)
Hands-On(n=27)
Major Area of Study:I. Finance 4.0 7.42. Accounting - 11.13. Marketing - 11.14. Information Systems 8.0 18.55. Operations Management 52.0 25.96. General Business 20.0 18 J7. Others 16.0 7.5
Total 100% 100%Age:
1. <25 15.4 18.52. 25-30 61.5 63.03. 30-35 3.8 7.4
4. >35 19.3 11.1Total 100% 100%Work Experience
I. 1-5 years 46.2 63.02.6-10 years 30.8 25.93. > 11 years 23.0 11.1
Total 100% 100%Gender.
1. Male 38.5 48.12. Female 61.5 51.9
Total 100% 100%
With respect to work experience, 54.7% of the subjects had between 1 and 5 years
of experience. Approximately 28.3% had between 6 and 10 years, and 17.0% had more
than 11 years. The proportions o f male and female participants were approximately
43.4% and 56.6% o f the total sample, respectively. The distribution o f subject’s gender
85
Reproduced with permission of the copyright owner. Further reproduction prohibited without permission.

by experimental group is presented in Table 8. Overall, there is no difference in male and
female participants by group.
Overall, responses to the preliminary survey on subject’s demographic
characteristics show that participants were mostly operations management and general
business majors (39.6% and 18.9%, respectively), age between 25-30 (62.3%), with a
work experience between 1 to 5 years (54.7%), and 43.4% males and 56.6% females.
A close examination of Table 8 by experimental group indicates that both groups
were similar with respect to major area of study, age, work experience, and gender.
6.2.2.2. Previous Experience with Computers
A summary of subject’s access and previous experience with computers by
experimental group is shown in Table 9.
Overall (n=53), approximately 91% of the subjects had access to computers at
home and 87% had access to the Internet at home. Results indicate that on the average,
subjects were frequent users o f computers (4.17), using computers at home and several
times a week (2.15) at work.
Furthermore, subjects used electronic mail (1.55) and the World Wide Web
search (2.39), about once a day. Overall subjects had familiarity with software to some
extent. On the other hand, data suggest that experimental groups were equivalent with
respect to computer experience and current use of i t
6.2.2.3 .Outcome and Other Variables
Table 10 sum m arizes the mean and standard deviation (Std) for each dependent
variable (Performance, Self-Efficacy, and Computer User Satisfaction) as well as other
86
Reproduced with permission of the copyright owner. Further reproduction prohibited without permission.

variables by experimental group. Statistical inference o f the variables is presented in the
next section.
Table 9 - Summary o f Mean Responses and Standard Deviations o f Overall Sample from Previous Experience with, and Current Use o f Computer Technology Survey.
Item Instrument ScaleExperimental Group
SimulatedHands-On
(n=26)
Hands-On(n=27)
l. Access to computer at home (yes) Yes or No 92.3% 88.9%2. Access to Internet at home (yes) 88.5% 853%3. Previous experience with computers I = No Experience
to5 = Professional User
4.19 ±0.85 4.15 ±0.66
4. Frequency o f computer use at home I = Several Times a Day
to
S = Once a Month
2.11 ±1.14 2.18 ± 134S. Frequency of computer use at work 1.42 ±1.17 130± 1.176. Frequency of Electronic Mail use 138 ±1.13 1.70 ± 1 3 67. Frequency of World Wide Web search 2.19 ± 1 3 6 2.59 ±1.058. Frequency o f Participation in Chat or
Discussion groups333 ±2.12 3.59 ±2.06
9. Knowledge of Word Processing 0 = Not at All
to
5 = To a Very Great Extent
433 ± 1.07 4.44 ± 0 .5110. Knowledge o f Presentation Software 4.15 ± 1.12 4.18 ±0.6811. Knowledge o f Spreadsheets 333 ± 137 3 3 6 ± 1 3 612. Knowledge o f Database Systems 2.69 ±1.35 2.89 ±1.1213. Knowledge o f Electronic Mail 1.85 ± 132 1.93 ± 1.3014. Knowledge o f Statistical Packages 435 ±1.09 4.52 ±0.64
Table 10 - Descriptive Statistics for Outcome and Other Variables by Experimental Group (Mean ± Std).
Variable Experimental GroupSimulated Hands-On (n=26) Hands-On (n=27)
Performance 62.19 ± 7 3 0 60.33 ±5.38
Self-Efficacy 6.30 ±2.01 6.70 ± 1.46
Computer User Satisfaction 3.03 ±0.76 2.69 ±0.76
Skills Assessment 4731 ±10.80 47.59 ± 10.59
Attitude toward Computers 4.78 ±0.92 4.99 ±0.70
Lecture Satisfaction 2.72 ±0.52 2.99 ±0.61
Lecture Evaluation 3.09 ±0.72 331 ±0.72
Reproduced with permission of the copyright owner. Further reproduction prohibited without permission.

6.2.3. Hypotheses Test
6.2.3.1. Relationship Between Main Variables
To test for any relationship between pairs o f variables (bivariate correlation), a
correlation analysis was conducted. Table 11 provides the correlation matrix (Pearson
correlation coefficients) between the variables. Numbers in parenthesis are probabilities.
Table 11 - Pearson Correlation Coefficients (alpha=0.05, n=53)
SkillsAssessment
Performance Self-Efficacy UserSatisfaction
Attitude
SkillsAssessment
1.00000(0.0)
Performance 0.07868(0.5755)
1.00000(0.0)
Self-Efficacy 0.13149(0.3484)
0.19804(0.1552)
1.00000(0.0)
UserSatisfaction
0.20173(0.1475)
0.29271(0.0334)
0.27955(0.0426)
1.00000(0.0)
Attitude 0.14159(0.3119)
0.38564(0.0043)
0.47075(0.0004)
0.06977(0.6196)
1.00000(0.0)
There was a significant correlation between attitude toward computers and
performance scores (r = 0.38564, p = 0.0043) as well as between attitude and self-
efficacy (r = 0.47075, p = 0.0004). There was no other significant correlation between
the other pairs o f variables.
6.2.3.2. Differences Between Experimental Groups Before Treatment
Kruskal-Wallis test was used to test differences in preliminary survey results
between experimental groups.
Table 12 - Results o f Kruskal-Wallis Test
Variable CHISQ Prob>CHISQKnowledge/Skills Assessment 0.0001 0.9924Previous Experience with Computers 0 J6 0.5472Attitudes toward Computers 0.83 0.3636
88
Reproduced with permission of the copyright owner. Further reproduction prohibited without permission.

Chi-Square (CH3SQ) values showed no significant difference between the
experimental group’s knowledge/skills assessment, previous experience with computers,
and attitude toward computers (at the 0.05 alpha level). Table 12 reports the test
result s. Folio wing is the result o f the statistical analyses performed in order to address the
above research questions.
Performance. Self-efficacv. and Satisfaction Difference
A number o f factors associated with learning could influence performance, self-
efficacy, and satisfaction, in the instructional method domain. In order to investigate this
possibility, a series o f covariate analyses were conducted. Covariate analyses were
conducted using skills/knowledge assessment, prior experience with computers, and
attitudes toward computers as covariates. No significant (p>0.05) covariate effects were
found for either o f these variables. This suggests that an ANOVA should have been
computed instead.
Results o f individual Analysis o f Variance (ANOVAs) is provided in Tables 13,
14, and 15 for main research variables Performance, Self-Efficacy, and Satisfaction,
respectively. As can be observed from the tables, there were not significant differences
in student performance, self-efficacy, and satisfaction between the two experimental
groups (p > 0.05). The Power analysis results o f the ANOVA F-tests obtained are
provided in Table 16. Overall, effect sizes were small and powers were low.
An important condition for the application o f parametric statistics is that the error
terms are normally distributed and they have constant variance. Residual analysis was
performed by computing the Shapiro-Wilk test (W) and the Bartlett test to check the
89
Reproduced with permission of the copyright owner. Further reproduction prohibited without permission.

normality and constant variance o f the error terms. The results o f the test are provided for
each dependent variable in Tables 13,14, and IS.
Table 13 - ANOVA Table for Student’s Performance
Source o f Variation Type III Sum of Squares
DF MeanSquare
FValue
Prob>F
Experimental Group (A) 45.77 1 45.77 1.14 0.291Error 2050.04 51 40.20
Corrected Total 2095.81 52i ^ u i u i c u u / r r a i v r i u n u
Homogeneity o f Variance Bartlett’s test: Chi-square=2.08, Alpha=0.148
The conclusion based on the results is that there is not evidence o f departure from
normality and constant variance assumptions. Thus, the application o f the Parametric
statistics is valid for the data analyzed.
Self-Efficacv Difference
Table 14 - ANOVA Table for Student’s Self-Efficacy
Source o f Variation Type III Sum of Squares
DF MeanSquare
FValue
Prob>F
Experimental Group (A) 2.12 1 2.12 0.69 0.410Error 156.54 51 3.07
Corrected Total 158.66 52Normality Test: JFrNormal = 0.9752, Pr<!F=0.5305Homogeneity o f Variance Bartlett’s test: Chi-square=2.46, Alpha=0.116
Computer User Satisfaction Difference
Table 15 - ANOVA Table for Student’s Computer Satisfaction
Source o f Variation Type UI Sum of Squares
DF MeanSquare
FValue
Prob> F
Experimental Group (A) 1.53 1 1.53 2.63 0.111Error 29.59 51 0.58
Corrected Total 31.12 52Normality Test: >F:Normal = 0.9703, Pr<FF=0.3622Homogeneity o f Variance Bartlett’s test: Chi-square=0.0005, Alpha=0.981
90
Reproduced with permission of the copyright owner. Further reproduction prohibited without permission.

Table 16 - Power Calculations for Tested Variables
VariableTested
EffectSize
Noncentrality Parameter (A)
♦Power
Performance 0.1466 1.139 0.182Self-Efficacy 0.1141 0.691 0.129Satisfaction 0.2231 2.630 0.356
* Observed Power computed using alpha=0.05, N = 53
Lecture Satisfaction and Lecture Evaluation Differences
Kruskal-Wallis test was performed on lecture satisfaction and lecture evaluation
variables in the study to determine if there was a significant difference between
experimental groups. Results o f the statistical test (Table 17) indicate that groups (hands-
on and simulated hands-on) are not significantly different with respect to lecture
evaluation and lecture satisfaction.
Table 17 - Results o f Kruskal-Wallis Test
Variable c h is q Prob>CHISQLecture Satisfaction 2.78 0.0901
Lecture Evaluation 1.56 0.2115
6.2.4. Summary o f Experiment I
This study compared, through a classroom experiment, two approaches for
teaching business processes to graduate students taking an Operations Management
course. A total o f 53 students were randomly assigned to two groups. Both groups were
taught in a standard lecture format (using Power Point presentation) by the same
instructor. However, for one group, simulated hands-on, an assignment exercise that
asked students to watch a series o f screencam demonstration movies o f how to perform
transactions using the SAP R/3 System was provided. For the hands-on group, the same
91
Reproduced with permission of the copyright owner. Further reproduction prohibited without permission.

assignment exercise was provided but students were asked to perform the transactions on
real-time using the SAP R/3 System. Both groups were given a week to complete the
assignments.
Both groups were given the same pre- and posttest, as well as questionnaires to
measure self-efficacy, user satisfaction, computer experience, and attitudes. The primary
question o f interest for this study was whether the instructional design for the hands-on
group was more effective than that for the simulated hands-on group as measured by
performance, self-efficacy, and satisfaction.
As a starting point, in comparing simulated hands-on and hands-on experimental
groups, a series o f covariate analyses were conducted using skills/knowledge assessment,
prior experience with computers, and attitudes toward computers as covariates. No
significant covariate effects were found for either o f these variables. Therefore, analysis
o f variance was used to analyze the data. Results o f the analysis o f variance indicated
that there were not significant differences in performance, self-efficacy, and computer
satisfaction between the experimental groups.
6.3. Experiment II (ISDS 3115)
This experiment uses a two-factor design to determine whether or not student
performance, self-efficacy, and satisfaction are enhanced by a particular method o f
instruction (control, simulated hands-on the SAP R/3 System via Web, and hands-on the
SAP R/3 System). A second research objective was to determine whether or not learning
styles (diverger, assimilator, converger, and accommodator) affect learning outcomes
within the instructional methods. The following report reveals the data analyses and
results of the experiment.
92
Reproduced with permission of the copyright owner. Further reproduction prohibited without permission.

6.3.1. Validity and Reliability Analysis
6.3.1.1 .Content and Construct Validity
Content validity, as in Experiment I, was established by using previous validated
instruments and ‘expert judgement’. Factor analysis was used to establish construct
validity. The results o f the factor analysis are displayed in Table 18. All items load higher
than 0.50 for the first component. Thus, one can argue that the measures have higher
construct validity.
Table 18- Factor Analysis for Multiple-Item Measures, Factor I
Sellr-EfllcacvItems Factor I Landing
1 0.762 0.763 0.884 0.865 0.886 0.877 0.868 0.809 0.7910 0.77
Eigenvalue: 6.79Percent Variance Explained: 67.92
Computer User Satisfaction1 0.782 0.773 0.754 0.855 0.877 0.90
Eigenvalue: 4.0SPercent Variance Explained: 67.50
Attitudes toward Competers15 0.8216 0.8417 0.7718 0.8119 0.7920 0.6021 0.7222 0.72
Eigenvalue: 4.67Percent Variance Explained: 58 JO
Lecture SatisfactionItems Factor I Loading
1 0.802 0.803 0.754 0.635 0.656 0.717 0.728 0.739 0.7710 0.89
Eigenvalue: 5.61Percent Variance Explained: 56.10
Lectere EvaluationI 0.742 0.573 0.844 0.865 0.797 0.87
Eigenvalue: 3.69Percent Variance Explained: 61.57
93
Reproduced with permission of the copyright owner. Further reproduction prohibited without permission.
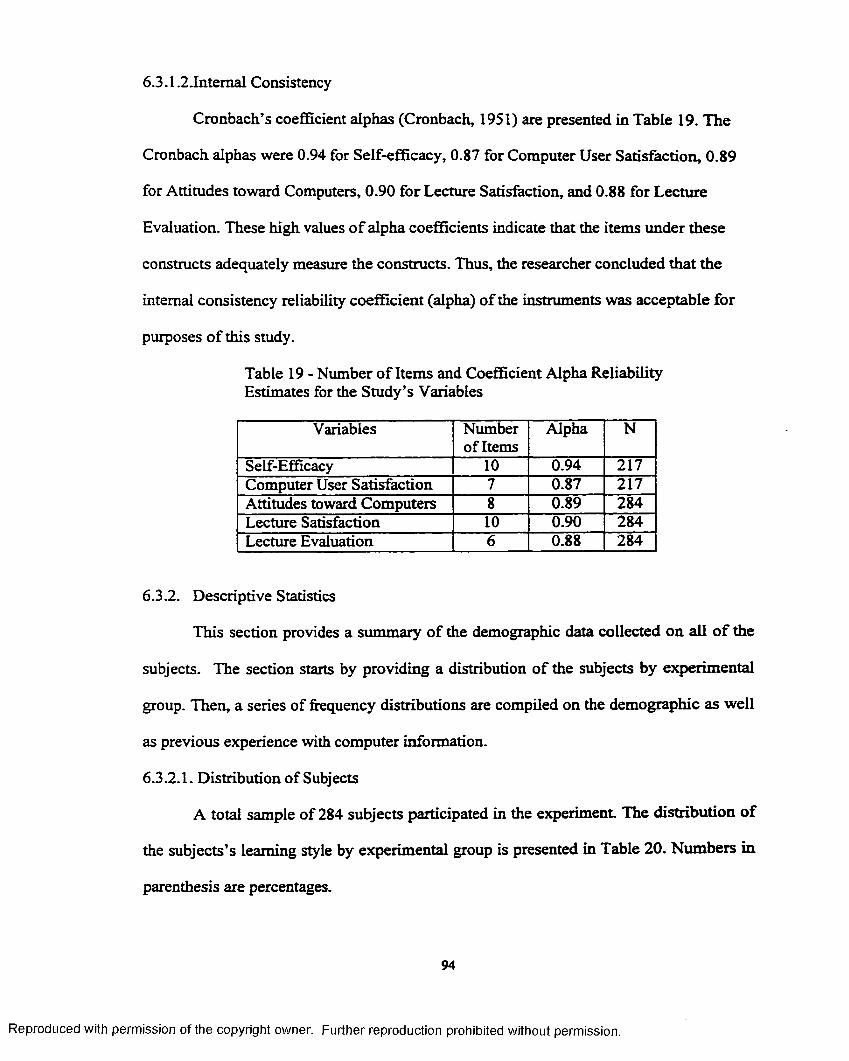
6.3.1.2.Intemal Consistency
Cronbach’s coefficient alphas (Cronbach, 1951) are presented in Table 19. The
Cronbach alphas were 0.94 for Self-efficacy, 0.87 for Computer User Satisfaction, 0.89
for Attitudes toward Computers, 0.90 for Lecture Satisfaction, and 0.88 for Lecture
Evaluation. These high values o f alpha coefficients indicate that the items under these
constructs adequately measure the constructs. Thus, the researcher concluded that the
internal consistency reliability coefficient (alpha) o f the instruments was acceptable for
purposes o f this study.
Table 19 - Number o f Items and Coefficient Alpha Reliability Estimates for the Study’s Variables
Variables Number of Items
Alpha N
Self-Efficacy 10 0.94 217Computer User Satisfaction 7 0.87 217Attitudes toward Computers 8 0.89 284Lecture Satisfaction 10 0.90 284Lecture Evaluation 6 0.88 284
6.3.2. Descriptive Statistics
This section provides a summary o f the demographic data collected on all o f the
subjects. The section starts by providing a distribution o f the subjects by experimental
group. Then, a series of frequency distributions are compiled on the demographic as well
as previous experience with computer information.
6.3.2.1. Distribution of Subjects
A total sample of 284 subjects participated in the experiment. The distribution of
the subjects’s learning style by experimental group is presented in Table 20. Numbers in
parenthesis are percentages.
94
Reproduced with permission of the copyright owner. Further reproduction prohibited without permission.
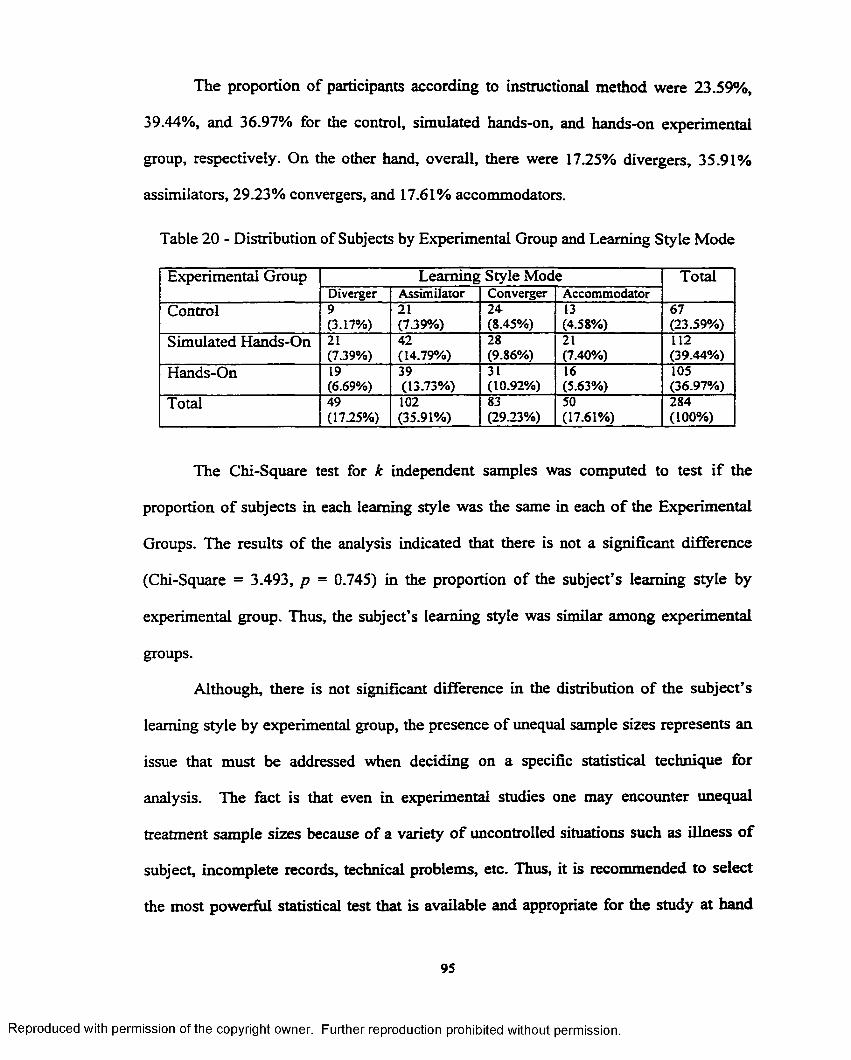
The proportion of participants according to instructional method were 23.59%,
39.44%, and 36.97% for the control, simulated hands-on, and hands-on experimental
group, respectively. On the other hand, overall, there were 17.25% divergers, 35.91%
assimilators, 29.23% convergers, and 17.61% accommodators.
Table 20 - Distribution of Subjects by Experimental Group and Learning Style Mode
Experimental Group Learning Style Mode TotalDiverger Assimilator Converger Accommodator
Control 9(3.17%)
21(7.39%)
24(8.45%)
13(4.58%)
67(23.59%)
Simulated Hands-On 21(7.39%)
42(14.79%)
28(9.86%)
21(7.40%)
112(39.44%)
Hands-On 19(6.69%)
39(13.73%)
31(10.92%)
16(5.63%)
105(36.97%)
Total 49(17.25%)
102(35.91%)
83(29.23%)
50(17.61%)
284(100%)
The Chi-Square test for k independent samples was computed to test if the
proportion o f subjects in each learning style was the same in each o f the Experimental
Groups. The results o f the analysis indicated that there is not a significant difference
(Chi-Square = 3.493, p = 0.745) in the proportion o f the subject’s learning style by
experimental group. Thus, the subject’s learning style was similar among experimental
groups.
Although, there is not significant difference in the distribution o f the subject’s
learning style by experimental group, the presence of unequal sample sizes represents an
issue that must be addressed when deciding on a specific statistical technique for
analysis. The fact is that even in experimental studies one may encounter unequal
treatment sample sizes because of a variety o f uncontrolled situations such as illness of
subject, incomplete records, technical problems, etc. Thus, it is recommended to select
the most powerful statistical test that is available and appropriate for the study at hand
95
Reproduced with permission of the copyright owner. Further reproduction prohibited without permission.

(Baroudi and Orlikowski, 1989). In this study, the regression approach to ANOVA is
used to correct for unequal sample sizes.
6.3.2.2. Subjects Profile
Table 21 reports the distribution o f the subjects’ participation according to their
major area of study, level o f education, overall GPA, age, and gender by experimental
group. Seven categories o f study were included in the survey - Finance, Accounting,
Marketing, Information Systems, Operations Management, General Business, and others.
O f the subjects sample (n=284), approximately 19.0% of the subjects were in
Finance, 16.9% in Accounting, 19.0% in Marketing, 15.9% in Information Systems,
1.1% in Operations Management, 13.7% in General Business, and about 14.4% had other
majors.
There were only three major categories of education - junior, sophomore, and
senior. Approximately 20.40% of subjects were junior, 0.37% sophomore, and 79.23%
senior undergraduates. Experimental groups had a similar percentage o f the subject’s
academic level (Table 21).
Of the total subjects sampled, approximately 8.0% had an overall GPA less than
2.5, 40.2% between 2.5 and 3.0, 35.3% between 3.0 and 3.5, and 16.5% greater than 3.5.
The relative frequency distribution by experimental group is provided in Table 21.
The proportions of male and female participants were approximately 52.8% and
47.2% o f the total sample, respectively. The distribution o f the subject’s gender by
experimental group is presented in Table 21. Overall, there is no difference in male and
female participants by group. Approximately 75% of the total participants were between
20 and 22 years o f age, 16.2% between 22 and 25 years o f age, and 8.8% older than 25.
96
Reproduced with permission of the copyright owner. Further reproduction prohibited without permission.

Table 21 - Summary of Response Percentages for Subject’s Attributes by Experimental Group.
ItemsExperimental Group
Control(n=67)
Simulated Hands-On (n=l 12)
Hands-On (n = 105)
Major Area of Study:I. Finance 17.9 18.7 20.02. Accounting 10.4 17.0 21.03. Marketing 29.9 18.7 12.44. Information Systems 17.9 17.0 1335. Operations Management 1.5 0.9 1.06. General Business 13.4 11.6 1637. Others 9.0 16.1 16.1
Total 100% 100% 100%Academic Class Level:
1. Freshman - - -2. Sophomore 14.9 18.8 25.73. Junior - - 1.04. Senior 85.1 81.2 733
Total 100% 100% 100%Overall GPA:
I. <2.5 10.4 7.1 7.62. 2.5-3.0 493 34.8 40.03. 3.0-3.5 26.9 41.1 34.34. >3.5 13.4 17.0 18.1
Total 100% 100% 100%Age:
I. <19 - - -2. 20-22 73.1 78.6 72.43. 22-25 19.4 143 1634. >25 7.5 7.1 11.4
Total 100% 100% 100%Gender
1. Male 52.2 50.0 5632. Female 47.8 50.0 43.8
Total 100% 100% 100%
Overall, responses to the prelim inary survey on the subject’s demographic
characteristics indicates that participants were mostly marketing and finance majors
(19.0%, respectively), senior academic level (79.23%), with an overall GPA between 2.5-
3.00 (40.2%), age between 20-22 (75%), and 52.8% males and 47.2% females. In
general, data indicate that groups were equivalent at the beginning of the study.
Reproduced with permission of the copyright owner. Further reproduction prohibited without permission.

6.3.2.3. Previous Experience with Computers
Table 22 contains the subject’s access and previous experience with computers by
experimental group. Overall, approximately 83% o f the subjects had access to computers
at home and 73% had access to the Internet at home. On the average, subjects were
frequent users o f computers (3.67), using computers at home and several times a week
(1.39) at work. Furthermore, subjects used electronic mail (2.27) and the World Wide
Web search (2.62) about once a day. Overall, subjects had familiarity with software to
some extent.
Table 22 - Summary of Mean Responses and Standard Deviations o f Overall Sample from Previous Experience with, and Current Use o f Computer Technology Survey.
ItemInstrument Scale Experimental Group
Control(n=67)
Simulated Hands-On (n=l 12)
Hands-On(n=l05)
1. Access to computer at home (yes) Yes or No 89.6% 792% 82.9%2. Access to Internet at home (yes) 83.6% 68.8% 70.5%3. Previous experience with computers 1 = No Experience
to5 = Professional User
3.65 ±0.66 3.62 ±0.81 3.73 ± 0.74
4. Frequency of computer use at home I = Several Times a Day
to
5 = Once a Month
2.40 ± 1.15 2.04 ±1.04 2.13 ± 1.13S. Frequency of computer use at work 1.36 ± 127 1.56 ± 1.82 124 ± 1216. Frequency o f Electronic Mail use 229 ± 129 223 ± 1.17 229 ± 1207. Frequency of World Wide Web search 2.45 ± 128 2.91 ±3.18 2.49 ± 1.198. Frequency o f Participation in Chat or
Discussion groups3.67 ±1.89 3.34 ±2.05 329 ± 1.99
9. Knowledge o f Word Processing 0 = Not at All
to
5 — To a Very Great Extent
422 ±0.69 4.18 ±0.87 425 ± 0.6010. Knowledge o f Presentation Software 3.61 ±0.85 3.51 ±0.92 3.50 ±0.8711. Knowledge o f Spreadsheets 3.37 ± 1.11 327 ±0.99 324 ±0.9912. Knowledge o f Database Systems 2.58 ± 1.16 221 ± 125 2.46 ± 1.1813. Knowledge of Electronic Mail 1.85 ±1.14 1.76 ± 1.16 1.93 ± 12614. Knowledge o f Statistical Packages 426 ±0.93 421 ±0.89 4.12 ±0.84
6.3.2.4.Knowledge/Skill Assessment
The average score and standard deviation (Std) obtained by the participants on the
15-item knowledge/skills assessment test is presented in Table 23. Statistical analysis of
the data is addressed in the next section.
98
Reproduced with permission of the copyright owner. Further reproduction prohibited without permission.

Table 23 - Knowledge/Skills Assessment Test Scores by Experimental Groupand Learning Style.
Experimental Group Mean ! Std Learning Style Mean ± Std NControl 36.96 ! 12.19
(n = 67)
Diverger 37.11 ±1023 9Assimilator 40.90 ±12.12 21Converger 35.12 ±14.51 24Accommodator 33.85 ± 7.41 13
Simulated Hands-on 44.25 ! 10.67
(n = 112)
Diverger 40.68 ± 10.46 21Assimilator 46.59 ± 13.50 42Converger 45.06 ±1335 28Accommodator 3936 ± 9.84 21
Hands-on 44.00 ! 12.60
(n = 105)
Diverger 4232 ±11.92 19Assimilator 44.64 ± 9.24 39Converger 43.57 ±11.45 31Accommodator 46.09 ±11.42 16
6.3.2.5. Dependent Variables
Table 24 presents the mean, standard deviations (Std), and sample sizes (N) for
each dependent variable (outcomes) by experimental group and learning style.
The mean of the performance measurement fluctuated from 59.15 ± 10.98 to
67.07 ! 7.88. On the average, the subject’s self-efficacy ranged from 6.11 ± 2.06 to 7.14
± 1.63 (where 1 indicates "Not at all confidant," 5 indicates "Moderately confidant," and
10 indicates "Totally confidant."). In general, the student’s satisfaction was relatively
low: the mean satisfaction measurement scale ranged from 2.42 ± 0.73 to 2.93 ± 0.72
(where 1 = Very Low, 2 = Low, 3 = Medium, 4 = High, and 5 = very High) (Table 24).
6.3.2.6.Summary of the Mean of Other Variables
The mean and standard deviation of the attitude toward computers, lecture
satisfaction, and lecture evaluation scales were computed (Table 25).
The mean o f the attitude measurement scale fluctuated from 4.18 ± 0.50 to 3.66 ±
0.76. In a similar way, the mean o f the lecture satisfaction and lecture evaluation varied
from 2.63 ± 0.82 to 3.23 ± 1.04 and 2.94 ± 0.67 to 3.34 ± 0.83, respectively.
99
Reproduced with permission of the copyright owner. Further reproduction prohibited without permission.

Table 24 - Descriptive Statistics for Dependent Variables by Experimental Groupand Learning Style.
ExperimentalGroup
Learning Style Outcomes (Mean ± Std) NPerformance Self-Efficacy User
SatisfactionControl Diverger 61.22 ± 10.06 - - 9
Assimilaror 62.62 ± 8.30 - - 21Converger 60.21 ± 11.09 - - 24Accommodator 59.15 ± 10.98 - - 13
Experimental Group Mean ± Std 60.89 ± 9.99 67
SimulatedHands-On
Diverger 64.20 ± 6JO 6.51 ± 1.65 2.77 ±0.70 21Assimilator 67.07 ± 7.88 633 ± 1.80 2.66 ±0.71 42Converger 64.30 ± 7.01 6.85 ±1.63 2.42 ±0.73 28Accommodator 66.52 ± 6.67 6.61 ± 1.65 2.75 ±1.07 21
Experimental Group Mean ± Std 65.53 ± 737 6.54 ± 1.69 2.64 ±0.79 112
Hands-On Diverger 6231 ± 8.14 6.11 ±2.06 2.92 ±0.76 19Assimilator 6636 ± 8.90 6.47 ± 1.73 2.93 ±0.72 39Converger 64.45 ± 9.13 7.14 ±1.63 2.61 ±0.75 31Accommodator 62.69 ± 8.08 6.40 ±1.87 2.82 ±0.63 16
Experimental Group Mean ± Std 64.44 ± 8.74 639 ± 1.80 2.82 ±0.73 105
6.3.3. Hypotheses Test
6.3.3.1. Relationship Between Main Variables
The correlation coefficients between pairs o f variables are shown in Table 26.
Analyses showed that there is a significant relationship (* a = 0.05/10, p<0.005) between
the student’s scores in the skills assessment test and performance, self-efficacy and user
satisfaction, and self-efficacy and attitude (Table 26). The fact that there was not a
significant relationship between performance and either self-efficacy or satisfaction
suggests that a Multivariate Analysis of Variance (MANOVA) may not be appropriate
for this study.
100
Reproduced with permission of the copyright owner. Further reproduction prohibited without permission.

Table 25 - Mean and Standard Deviation for Attitude toward Computers, Lecture Satisfaction, and Lecture Evaluation Measures by Experimental Group and Learning Style.
ExperimentalGroup
LearningStyle
Other Variables (Mean ! Std) NAttitudetoward
Computers
LectureSatisfaction
LectureEvaluation
Control Diverger 3.87 ±0.67 3.23 ± 1.04 3.16 ±1.05 9Assimilator 3.94 ±0.59 2.92 ±0.76 3.34 ±0.83 21Converger 4.10 ±0.75 2.93 ±0.71 3.24 ± 0.84 24Accommodator 3.96 ±0.79 3.02 ± 0.67 3.32 ±0.77 13
Experimental Group Mean ± Std 3.99 ±0.69 2.99 ±0.76 3.27 ±0.84 67
SimulatedHands-On
Diverger 3.66 ±0.76 2.81v 0.70 3.12 ±0.70 21Assimilator 3.72 ±0.79 2.79 ±0.71 3.18 ±0.80 42Converger 4.14 ± 0.66 2.63 ±0.82 3.14 ±0.77 28Accommodator 3.86 ±0.74 2.90 ±0.81 2.94 ±0.98 21
Experimental Group Mean ± Std 3.84 ±0.76 2.78 ±0.75 3.12 ±0.81 112
Hands-On Diverger 3.81 ±0.61 2.98 ± 0.50 3.25 ± 0.62 19Assimilator 3.95 ±0.71 2.89 ±0.71 3.15 ±0.66 39Converger 4.18 ±0.50 2.79 ±0.60 2.94 ±0.67 31Accommodator 4.01 ±0.81 2.84 ±0.60 3.00 ± 0.72 16
Experimental Group Mean ± Std 4.00 ±0.66 2.87 ±0.62 3.09 ±0.66 105
6.3.3.2. Differences Between Experimental Groups Before Treatment
To determine whether or not experimental groups were equivalent before the
experimental treatment was applied, data collected on previous experience with
computers, background knowledge/skills assessment, and attitude toward computers were
analyzed using the Kruskal-Wallis test and Analysis of Variance (ANOVA).
The results o f the Kruskal-Wallis tests show that there is no statistical significant
difference among experimental groups (control, hands-on, and simulated hands-on) with
regard to previous computer experience of the subjects (CHISQ = 1.4976, Prob > CHISQ
= 0.4729).
Reproduced with permission of the copyright owner. Further reproduction prohibited without permission.

Table 26 - Pearson Correlation Coefficients (alpha=0.05, n=217)
SkillsAssessment
Performance Self-Efficacy UserSatisfaction
Attitude
Skills Assessment 1.00000(0-0)
Performance * 0.22396 (0.0009)
1.00000(0-0)
Self-Efficacy 0.14207(0.0365)
0.09327(0.1710)
1.00000(0.0)
User Satisfaction 0.06745(0.3226)
0.18078(0.0076)
• 0.34928 (0.0001)
1.00000(0.0)
Attitude 0.08755(0.1989)
0.01110 (0.8708)
* 034210 (0.0001)
-0.03818(0.5759)
1.00000(0.0)
Note. Numbers in parenthesis are probability values. * significant at alpha = 0.05
The test on background knowledge/skills assessment indicated that there is
significant statistical difference (CHISQ = 17.571, Prob > CHISQ = 0.0002) in
knowledge/skills assessment scores among subjects before the treatment. Students scores
are higher in the simulated hands-on via web instructional method than the control group.
But simulated hands-on scores are similar to the hands-on group. Thus, the results
suggest that pretest scores (knowledge/skills assessment) can be used as a covariate in
further analyses.
Attitude toward computers, a construct, was analyzed by using one-way Analysis
o f Variance (ANOVA) statistical method since the data conformed with the assumptions
o f the F-test previously indicated. The results o f the ANOVA indicated that there is no
significant difference among subjects that received the hands-on instruction method and
those who received the simulated hands-on instruction method (p > 0.05).
6.3.3.3. Differences Between Experimental Groups After Treatment
This section reports the test results o f individual hypotheses previously proposed
in this study (Chapter 3). The main problem was to determine whether or not a particular
102
Reproduced with permission of the copyright owner. Further reproduction prohibited without permission.

instructional method can affect outcomes (performance, self-efficacy, and user
satisfaction) o f learning about business processes.
The independent variables were experimental group (Instructional Method
represented by control, simulated hands-on, and hands-on the R/3 system) and learning
style (four learning style groups: accommodator, assimilator, diverger, and converger).
The average number of subjects per cell was 23.
As an initial step on the analysis, Analysis of Covariance (ANCOVA) was
performed. It was expected that knowledge/skills assessment score (pretest) could affect
the dependent variables. The results of the analysis indicated that the means o f the
treatments do not depend on the value o f the covariate (p> 0.05). Thus, in this case the
next step in the analysis was to use the Regression Approach to ANOVA to test the
hypotheses (compare cell means).
The Regression Approach to Analysis o f variance (ANOVA) was used to analyze
the data collected from the 284 students involved in the study. The main hypotheses to be
tested are listed in Table 27.
Student’s Performance (HI, H6, H9)
Table 28 reports the results o f the analysis. The F-value for the experimental
group was 5.62, which is statistically significant (p < 0.05), indicating a significant
difference on performance scores among the control, simulated hands-on via web, and
hands-on groups. Thus, hypothesis HI was rejected.
The learning style factor was not statistically significant (p > 0.05), indicating no
significant difference on performance scores among the four learning style groups. No
significant interaction effect is present between the two factors. The F for interaction was
103
Reproduced with permission of the copyright owner. Further reproduction prohibited without permission.
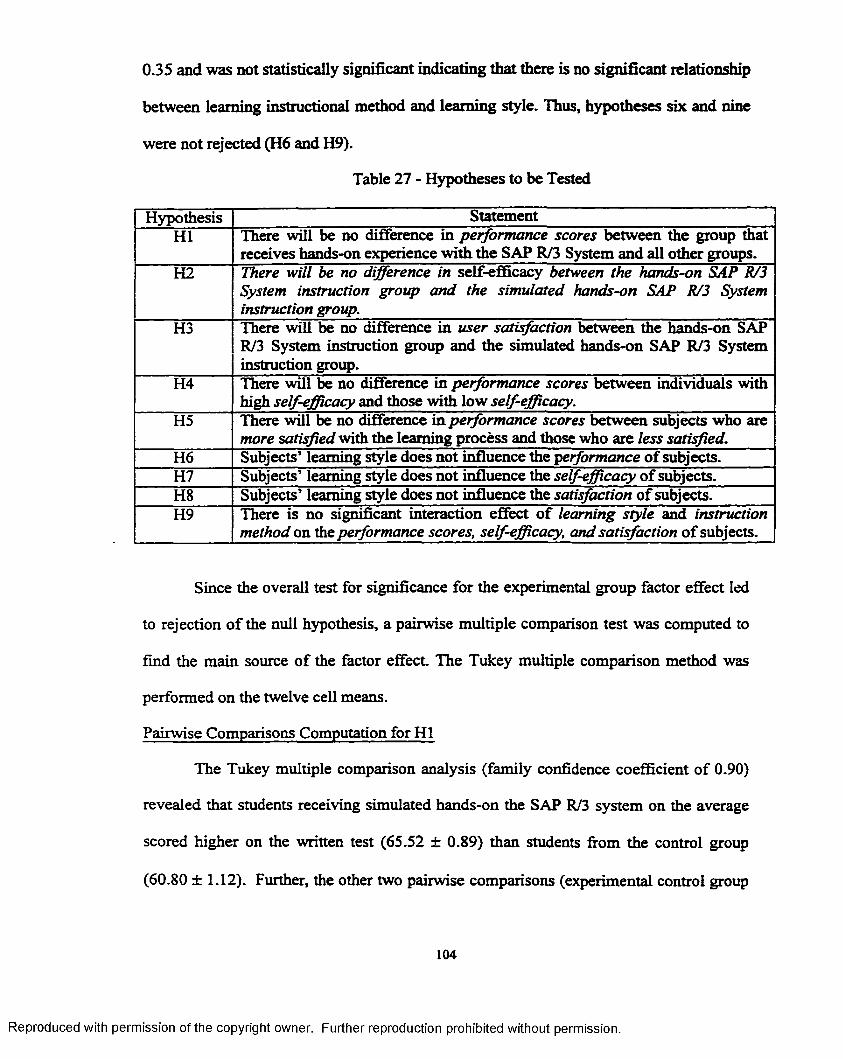
0.35 and was not statistically significant indicating that there is no significant relationship
between learning instructional method and learning style. Thus, hypotheses six and nine
were not rejected (H6 and H9).
Table 27 - Hypotheses to be Tested
Hypothesis StatementHI There will be no difference in performance scores between the group that
receives hands-on experience with the SAP R/3 System and all other groups.H2 There will be no difference in self-efficacy between the hands-on SAP R/3
System instruction group and the simulated hands-on SAP R/3 System instruction group.
H3 There will be no difference in user satisfaction between the hands-on SAP R/3 System instruction group and the simulated hands-on SAP R/3 System instruction group.
H4 There will be no difference in performance scores between individuals with high self-efficacy and those with low self-efficacy.
H5 There will be no difference in performance scores between subjects who are more satisfied with the learning process and those who are less satisfied.
H6 Subjects’ learning style does not influence the performance o f subjects.H7 Subjects’ learning style does not influence the self-efficacy o f subjects.H8 Subjects’ learning style does not influence the satisfaction o f subjects.H9 There is no significant interaction effect o f learning style and instruction
method on the performance scores, self-efficacy, and satisfaction o f subjects.
Since the overall test for significance for the experimental group factor effect led
to rejection o f the null hypothesis, a pairwise multiple comparison test was computed to
find the main source o f the factor effect. The Tukey multiple comparison method was
performed on the twelve cell means.
Pairwise Comparisons Computation for HI
The Tukey multiple comparison analysis (family confidence coefficient of 0.90)
revealed that students receiving simulated hands-on the SAP R/3 system on the average
scored higher on the written test (65.52 ± 0.89) than students from the control group
(60.80 ± 1.12). Further, the other two pairwise comparisons (experimental control group
104
Reproduced with permission of the copyright owner. Further reproduction prohibited without permission.

vs hands-on experimental group (63.90 ± 0.84) and simulated hands-on vs hands-on
experimental groups) did not show significantly different mean changes in performance.
Table 28 - ANOVA Table for Student’s Performance
Source o f Variation Type HI Sum of Squares
DF MeanSquare
FValue
Prob>F
Experimental Group (A) 748.657 2 374.328 5.115 0.007Learning Style (B) 416.520 3 138.840 1.897 0.130
AB Interaction 181.214 6 30.202 0.413 0.870Error 19906.379 272 73.185
Normality T est FFzNormal = 0.9813, Pr<W= 0.3136Homogeneity o f Variance Bartlett’s test: Chi-Square = 13.77, Alpha=0.246
Conclusion
One concludes from these confident intervals with 90 % family confidence
coefficient that students receiving simulated hands-on the SAP R/3 System on the
average scored higher on the written test (Least square mean = 65.52 and Standard Error
= 0.89) than students from the control group (Least square mean = 60.80 and a Standard
Error = 1.12). Furthermore, the other two pairwise comparisons (experimental control✓
group vs. hands-on experimental group) (Least square mean = 63.90 and Standard Error
= 0.84) and (simulated hands-on vs. hands-on experimental groups) do not show
significantly different mean changes in performance.
Self-Efficacv M 2. H7. H9^
Hypotheses 2, 7 and 9 could not be rejected since there were not significant main
effects (instructional methods and learning style) or interaction effect when evaluating
the student’s self-efficacy. Results o f the statistical analysis are reported in Table 29.
105
Reproduced with permission of the copyright owner. Further reproduction prohibited without permission.

Table 29 - ANOVA Table for Student’s Self-Efficacy
Source o f Variation Type HI Sum of Squares
DF MeanSquare
FValue
Prob > F
Experimental Group (A) 0.103 1 0.103 0.034 0.854Learning Style (B) 15.665 3 5.222 1.719 0.164
AB Interaction 3.608 3 1.203 0.396 0.756Error 634.69 209 3.037
Normality Test: PFrNormal = 0.9613, Pt<W = 0.0002Homogeneity o f Variance Bartlett’s test: Chi-Square = 2.03, Alpha=0.958
User Satisfaction fH3. H8. H91
The regression approach to analysis o f variance did not reveal a significant main
effect for instructional method, learning style or an interaction effect between
instructional method and learning style. The results o f the data analysis are provided in
Table 30. Thus, hypotheses three, eight, and nine (H3, H8, and H9) could not be rejected
when using user satisfaction as a dependent variable.
Table 30 - ANOVA Table for Student’s Satisfaction
Source of Variation Type III Sum of Squares
DF MeanSquare
FValue
Prob > F
Experimental Group (A) 1.456 1 1.456 2.522 0.114Learning Style (B) 3.713 3 1238 2.144 0.096
AB Interaction 0.282 3 0.093 0.163 0.921Error 120.669 209 0.577
Normality Test: PT:Normal = 0.9772, Pk W= 0.1506Homogeneity o f Variance Bartlett’s test: Chi-Square = 7.87, Alpha=0.344
Power Analysis
A post-hoc evaluation was performed on the statistical tests computed previously.
The results of the power analyses are reported in Table 31. As stated before, power of a
test is a function o f alpha, sample size, and effect size.
106
Reproduced with permission of the copyright owner. Further reproduction prohibited without permission.
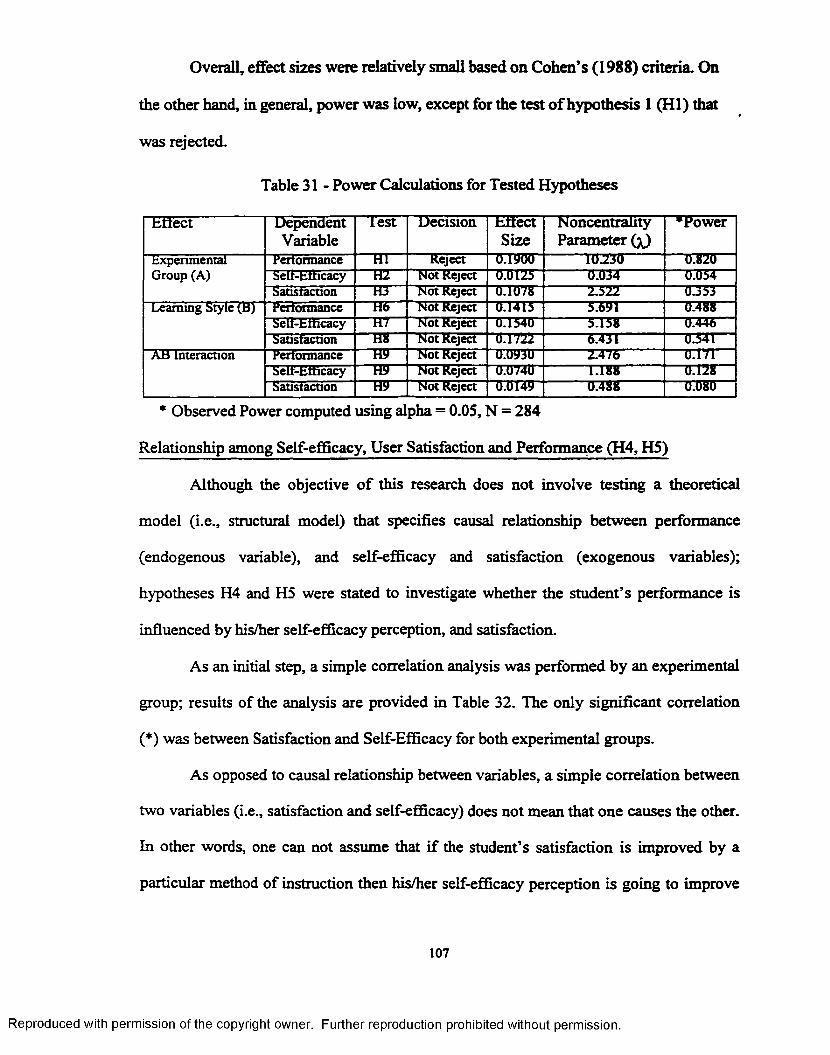
Overall, effect sizes were relatively small based on Cohen’s (1988) criteria. On
the other hand, in general, power was low, except for the test o f hypothesis 1 (HI) that
was rejected.
Table 31 - Power Calculations for Tested Hypotheses
Effect DependentVariable
lest Decision EffectSize
Noncentrality Parameter (^)
’ Power
Experimental Group (A)
Performance HI Reject 0.1900 10230 0.820Selt-btticacy HZ Not Reject 0.0125 0.034 0.054Satisfaction H3” Not Reject 0.1078 2.522 0.353
Learning Style (b) Performance H6 Not Reject 0.1415 5.691 ' 0.488Selt-btticacy H7” Not Reject 0.1540 5.158"" 0.446satisfaction Hit Not Reject 0.1722 6.431 0.541
AB Interaction Performance H9“" Not Reject 0.0930 2.476 0.171”Selt-btticacy H9'~ Not Reject O.O740 1.188 0.128Satisfaction H9 Not Reject 0.0149 0.488 0.080
* Observed Power computed using alpha = 0.05, N = 284
Relationship among Self-efficacy, User Satisfaction and Performance (H4, H5)
Although the objective o f this research does not involve testing a theoretical
model (i.e., structural model) that specifies causal relationship between performance
(endogenous variable), and self-efficacy and satisfaction (exogenous variables);
hypotheses H4 and H5 were stated to investigate whether the student’s performance is
influenced by his/her self-efficacy perception, and satisfaction.
As an initial step, a simple correlation analysis was performed by an experimental
group; results of the analysis are provided in Table 32. The only significant correlation
(*) was between Satisfaction and Self-Efficacy for both experimental groups.
As opposed to causal relationship between variables, a simple correlation between
two variables (i.e., satisfaction and self-efficacy) does not mean that one causes the other.
In other words, one can not assume that if the student’s satisfaction is improved by a
particular method of instruction then his/her self-efficacy perception is going to improve
107
Reproduced with permission of the copyright owner. Further reproduction prohibited without permission.
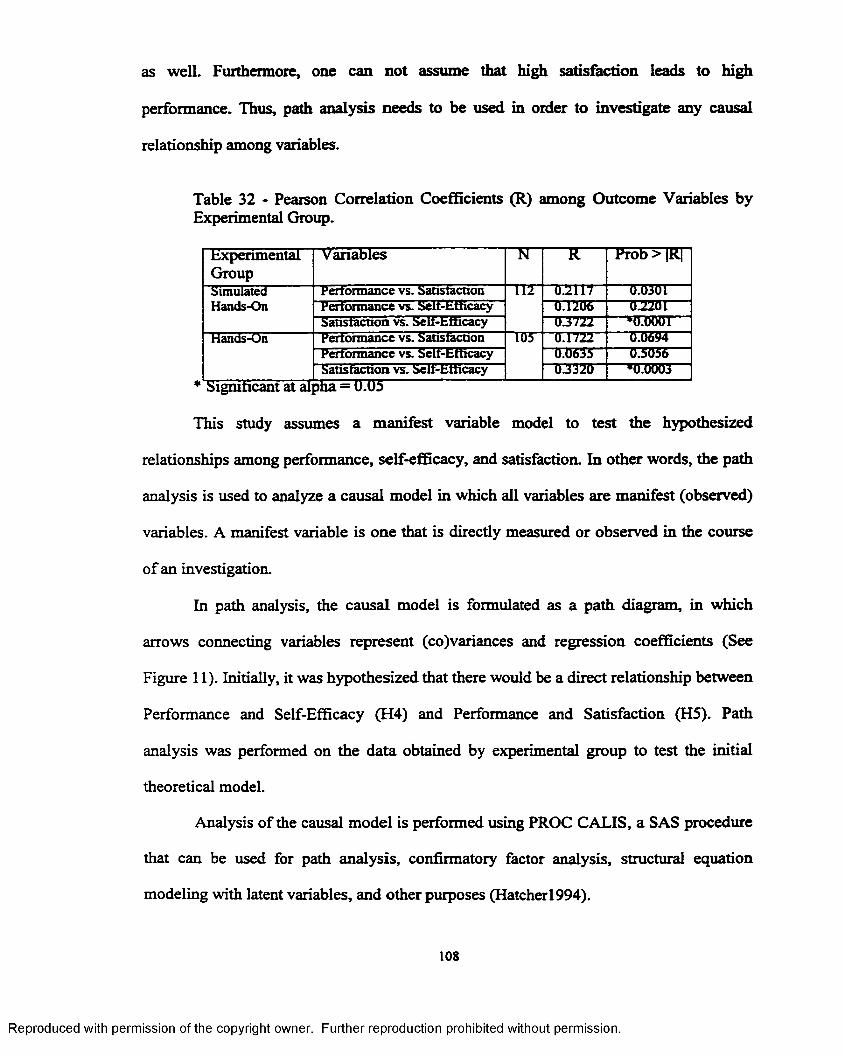
as well. Furthermore, one can not assume that high satisfaction leads to high
performance. Thus, path analysis needs to be used in order to investigate any causal
relationship among variables.
Table 32 - Pearson Correlation Coefficients (R) among Outcome Variables by Experimental Group.
ExperimentalGroup
Variables N ~K— Pro5>lKrSimulated Pertonnance vs. Satisfaction T i l TJL2117 0.0301Hands-On Performance vs. Selt-btticacy u r n 0.2201
Satisfaction vs. Selt-btticacy 03722 *0.0001Hands-On Pertonnance vs. Satisfaction 105 0.1722 0.0604
Pertonnance vs. Self-Efficacy 0.0635 0.5(156Satisfaction vs. Self-Efficacy 0.3320 •02)003
Significant at aipha = 0.05
This study assumes a manifest variable model to test the hypothesized
relationships among performance, self-efficacy, and satisfaction. In other words, the path
analysis is used to analyze a causal model in which all variables are manifest (observed)
variables. A manifest variable is one that is directly measured or observed in the course
of an investigation.
In path analysis, the causal model is formulated as a path diagram, in which
arrows connecting variables represent (co)variances and regression coefficients (See
Figure 11). Initially, it was hypothesized that there would be a direct relationship between
Performance and Self-Efficacy (H4) and Performance and Satisfaction (H5). Path
analysis was performed on the data obtained by experimental group to test the initial
theoretical model.
Analysis of the causal model is performed using PROC CALIS, a SAS procedure
that can be used for path analysis, confirmatory factor analysis, structural equation
modeling with latent variables, and other purposes (Hatcher1994).
108
Reproduced with permission of the copyright owner. Further reproduction prohibited without permission.

Results o f the path analysis did not support the model (Goodness o f Fit Index by
experimental group was highly significant, p < 0.05). Thus, hypotheses H4 and H5 could
not be rejected.
Performance
Satisfaction
Figure 11 - Initial Theoretical Model
A revised theoretical model for each experimental group was proposed (Figure
12). The models propose that an individual’s performance is positively related to an
individual’s satisfaction which is at the same time related to his/her self-efficacy
perceptions.
Satisfaction
Self-Efficacy
Performance
Self-Efficacy
Satisfaction
PerformanceEl
E2
Simulated Hands-On
PI
P2
E3
E4
Hands-On
i i.
i i
P3
P4
Figure 12 - Revised Theoretical Model by Experimental Group, Where PI to P4 are Path Coefficients to be Estimated and E1-E4 Represent Residual Terms.
109
Reproduced with permission of the copyright owner. Further reproduction prohibited without permission.
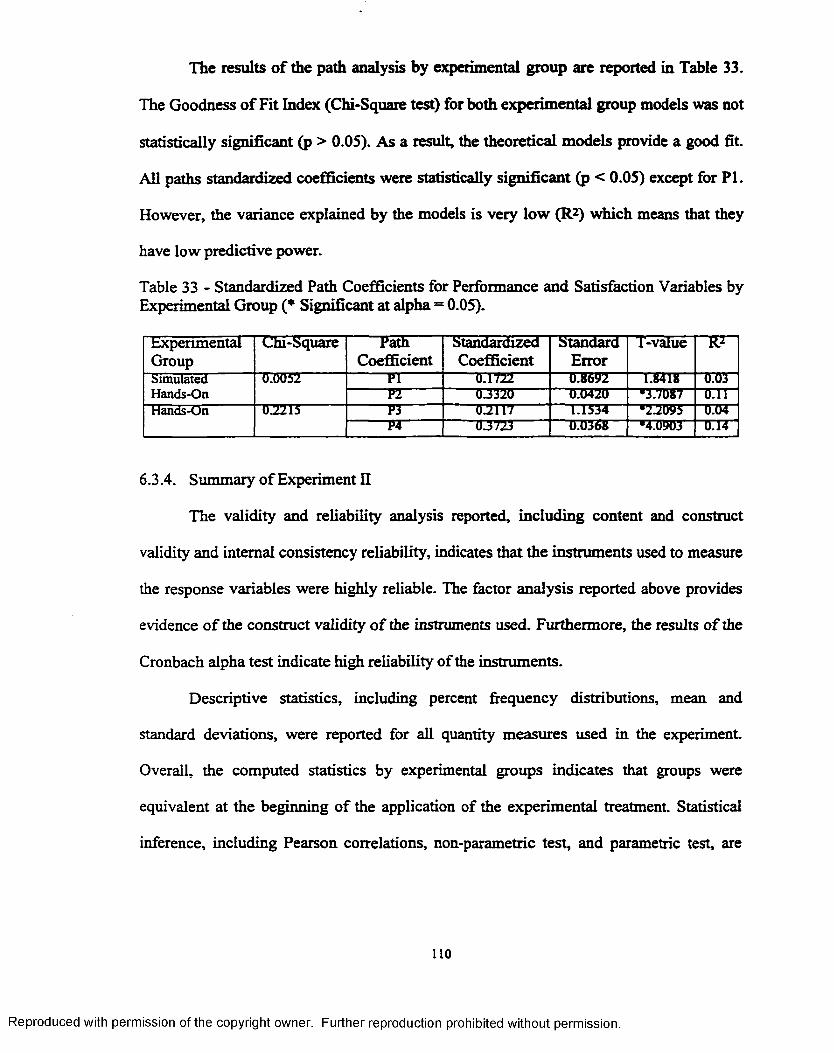
The results o f the path analysis by experimental group are reported in Table 33.
The Goodness o f Fit Index (Chi-Square test) for both experimental group models was not
statistically significant Op > 0.05). As a result, the theoretical models provide a good fit.
All paths standardized coefficients were statistically significant (p < 0.05) except for PI.
However, the variance explained by the models is very low (R?) which means that they
have low predictive power.
Table 33 - Standardized Path Coefficients for Performance and Satisfaction Variables by Experimental Group (* Significant at alpha=0.05).
txpenmentalGroup
Chi-Square PathCoefficient
StandardizedCoefficient
StandardError
I-value R*
SimulatedHands-On
0.0052 PI "" 0.1722 0.8692 □S4181 0.03P2 03320 0.0420 '3.7087 0.11
Hands-On DL2215 P3 0.2117 1.1534 “ •22095 0.04P4 0.3723 0.0368 •4.0903 0.14
6.3.4. Summary o f Experiment II
The validity and reliability analysis reported, including content and construct
validity and internal consistency reliability, indicates that the instruments used to measure
the response variables were highly reliable. The factor analysis reported above provides
evidence o f the construct validity o f the instruments used. Furthermore, the results o f the
Cronbach alpha test indicate high reliability of the instruments.
Descriptive statistics, including percent frequency distributions, mean and
standard deviations, were reported for all quantity measures used in the experiment.
Overall, the computed statistics by experimental groups indicates that groups were
equivalent at the beginning of the application of the experimental treatment. Statistical
inference, including Pearson correlations, non-parametric test, and parametric test, are
110
Reproduced with permission of the copyright owner. Further reproduction prohibited without permission.

reported for investigating the hypotheses proposed. The results o f the main hypothesis
can be stated as follows:
Hypothesis 1 (HI), proposing that there will be no difference in performance
scores between the group that receives hands-on experience with the SAP R/3 System
and all other groups, was not supported. The regression analysis approach for two-factor
analysis o f variance revealed a significant relationship (* a < 0.05) between instructional
method and performance. There was not a significant relationship between learning style
and performance (Hypothesis H6). In addition, there was not a significant interaction
effect (Hypothesis H9).
The Tukey multiple comparison analysis revealed that students receiving the
simulated hands-on the SAP R/3 System on the average scored higher on the written test
(65.52 + 0.89) than students from the control group (60.80 ± 1.12). Furthermore, the
other two pairwise comparisons (experimental control group vs. hands-on experimental
group (63.90 + 0.84) and simulated hands-on vs. hands-on experimental groups) did not
show significantly different mean changes in performance.
Hypothesis 2 (H2), proposing that there will be no difference in self-efficacy
between the hands-on SAP R/3 System instruction group and the simulated hands-on
SAP R/3 System instruction group, was supported. Furthermore, there was not a
significant relationship between learning style and self-efficacy (Hypothesis H7). In
addition, there was not a significant interaction effect (Hypothesis H9).
Hypothesis 3 (H3), proposing that there will be no difference in m er satisfaction
between the hands-on SAP R/3 System instruction group and the simulated hands-on
SAP R/3 System instruction group, was supported. In addition, there was not a significant
ill
Reproduced with permission of the copyright owner. Further reproduction prohibited without permission.

relationship between learning style and satisfaction (Hypothesis H8). On the other hand,
there was not a significant interaction effect (Hypothesis H9).
Path analysis was performed to investigate hypotheses H4 and H5. Results o f the
analysis did support the hypotheses. No significant relationship was found between
Performance and Self-Efficacy (H4) and Performance and Satisfaction (H5).
6.4. Experiment III (ISDS 3100)
6.4.1. Validity and Reliability Analysis
A major concern when using measurement scales such as self-efficacy,
satisfaction, etc., is the validity and reliability of such scales. Two types o f validity must
be addressed: content validity and construct validity. Content validity refers to how the
instrument chosen relates to the nature o f the issue being measured. An extensive survey
of the relevant literature was undertaken to understand the important aspects o f each
major variable and its components, so that content validity was ensured.
Factor analysis was used to examine the construct validity o f the instruments.
Table 34 shows the instrument name, eigenvalue, and corresponding variance explained
for Factor I. The magnitude o f the eigenvalues is greater than one that suggests the
presence of a dominant global factor.
Instruments were tested for reliability using the Cronbach alpha test applied to
inter-item scores. All constructs had measures o f internal consistency that exceeded 0.8
which is typically the criterion value for inter-item reliability. Thus, all of the constructs
were reliable. The results o f the reliability analysis are reported in Table 34. The validity
and reliability analysis results for the instruments used in the study satisfied the criteria
for further use. Thus, no changes to these constructs were performed.
112
Reproduced with permission of the copyright owner. Further reproduction prohibited without permission.
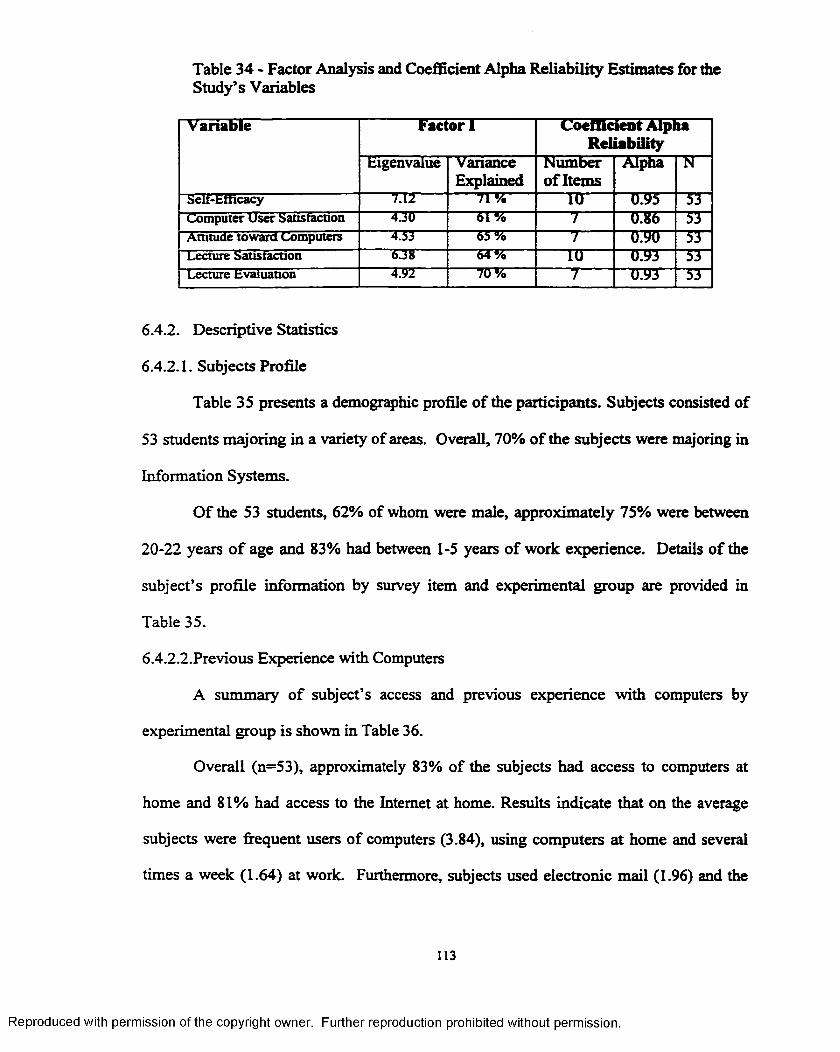
Table 34 - Factor Analysis and Coefficient Alpha Reliability Estimates for the Study’s Variables
Variable Factor 1 Coefficient Alpha Reliability
Eigenvalue VarianceExplained
Number of Items
Alpha N
Selt-£hicacy 7.12 71% 10 0.95 53Computer User Satisfaction 4.30 61 Vo 7 0.86 53Attitude toward computers 4.53 65 Vo 7 0.90 53Lecture Satisfaction 6JS 64% 10 0.93 53Lecture Evaluation 4.92 70% 7 0.93 53
6.4.2. Descriptive Statistics
6.4.2.1. Subjects Profile
Table 35 presents a demographic profile o f the participants. Subjects consisted of
53 students majoring in a variety of areas. Overall, 70% of the subjects were majoring in
Information Systems.
O f the 53 students, 62% of whom were male, approximately 75% were between
20-22 years o f age and 83% had between 1-5 years of work experience. Details o f the
subject’s profile information by survey item and experimental group are provided in
Table 35.
6.4.2.2.Previous Experience with Computers
A summary o f subject’s access and previous experience with computers by
experimental group is shown in Table 36.
Overall (n=53), approximately 83% of the subjects had access to computers at
home and 81% had access to the Internet at home. Results indicate that on the average
subjects were frequent users o f computers (3.84), using computers at home and several
times a week (1.64) at work. Furthermore, subjects used electronic mail (1.96) and the
113
Reproduced with permission of the copyright owner. Further reproduction prohibited without permission.
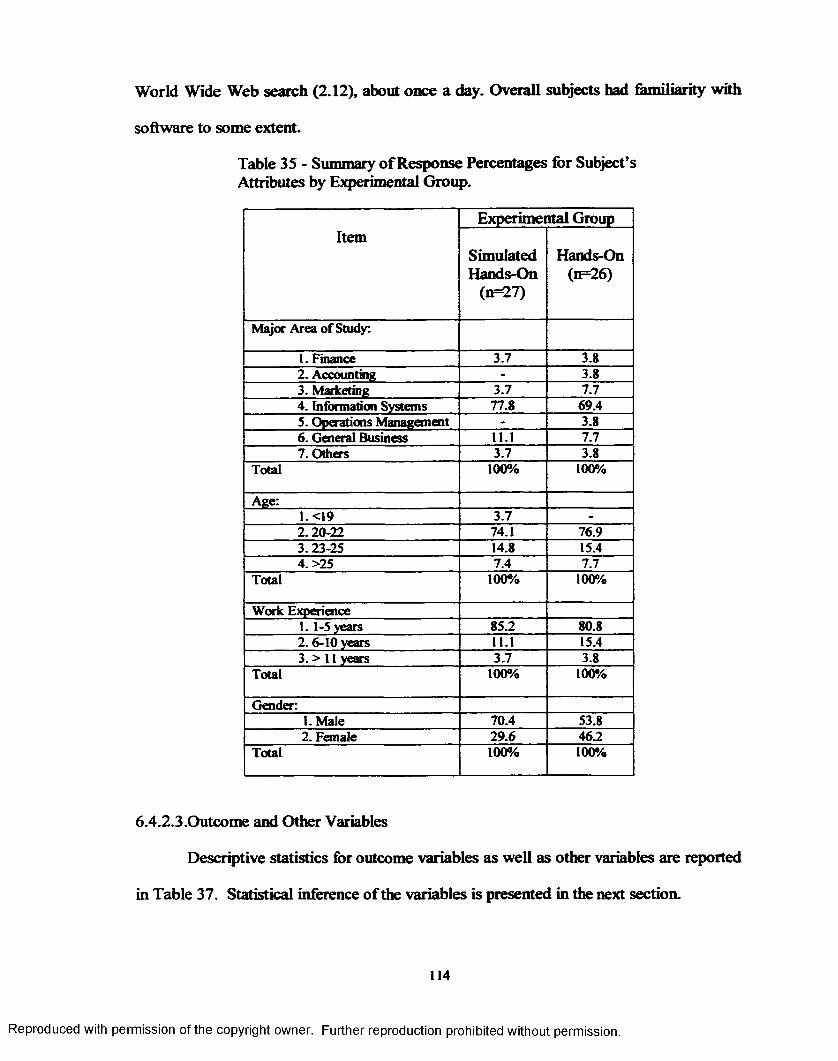
World Wide Web search (2.12), about once a day. Overall subjects had familiarity with
software to some extent.
Table 35 - Summary o f Response Percentages for Subject’s Attributes by Experimental Group.
ItemExperimental Group
SimulatedHands-On
(n=27)
Hands-On(n=26)
Major Area o f Study:
I. Finance 3.7 3.82. Accounting - 3.83. Marketing 3.7 7.74. Information Systems 77.8 69.4S. Operations Management - 3.86. General Business 11.1 7.77. Others 3.7 3.8
Total 100% 100%
Age:1. <19 3.7 -2.20-22 74.1 76.93. 23-25 14.8 15.44. >25 7.4 7.7
Total 100% 100%
Work ExperienceI. 1-5 years 85.2 80.82.6-10 years 11.1 15.43. > 11 years 3.7 3.8
Total 100% 100%
Gender1. Male 70.4 53.82. Female 29.6 46.2
Total 100% 100%
6.4.2.3.Outcome and Other Variables
Descriptive statistics for outcome variables as well as other variables are reported
in Table 37. Statistical inference o f the variables is presented in the next section.
Reproduced with permission of the copyright owner. Further reproduction prohibited without permission.
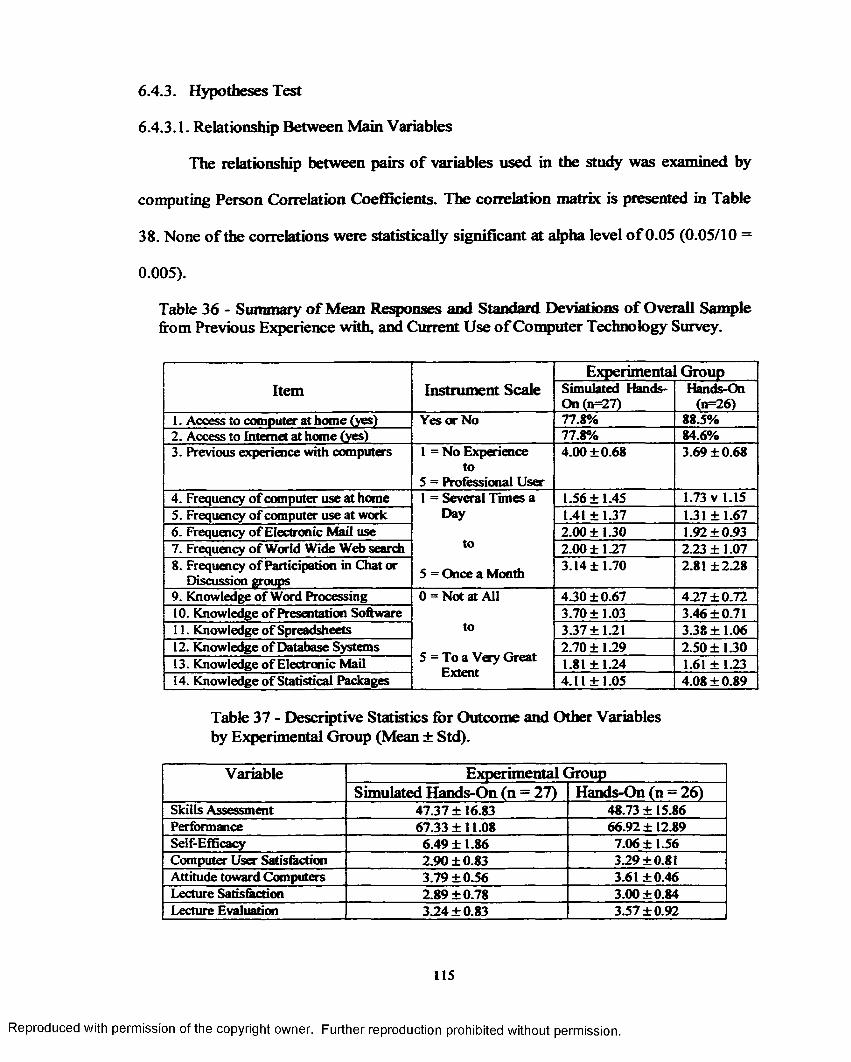
6.4.3. Hypotheses Test
6.4.3.1. Relationship Between Main Variables
The relationship between pairs o f variables used in the study was examined by
computing Person Correlation Coefficients. The correlation matrix is presented in Table
38. None o f the correlations were statistically significant at alpha level o f 0.05 (0.05/10 =
0.005).
Table 36 - Summary o f Mean Responses and Standard Deviations o f Overall Sample from Previous Experience with, and Current Use o f Computer Technology Survey.
Item Instrument ScaleExperimenta Group
Simulated Hands- On (n=27)
Hands-On (n=2 6)
1. Access to computer at home (yes) Yes or No 77.8% 88.5%2. Access to Internet at home (yes) 77.8% 84.6%3. Previous experience with computers 1 = No Experience
to5 = Professional User
4.00 ±0.68 3.69 ±0.68
4. Frequency o f computer use at home I = Several Times a Day
to
5 = Once a Month
1.56 ±1.45 1.73 v 1.155. Frequency of computer use at work 1.41 ± 1.37 1.31 ±1.676. Frequency o f Electronic Mail use 2.00 ±1 JO 1.92 ±0.937. Frequency of World Wide Web search 2.00 ±1.27 2.23 ±1.078. Frequency of Participation in Chat or
Discussion groups3.14 ±1.70 2.81 ±2.28
9. Knowledge o f Word Processing 0 = Not at All
to
5 - To a Very Great Extent
4 JO ± 0.67 4.27 ±0.7210. Knowledge o f Presentation Software 3.70 ±1.03 3.46 ±0.7111. Knowledge o f Spreadsheets 3.37 ±1.21 3.38 ±1.0612. Knowledge o f Database Systems 2.70 ± 1.29 2.50 ±1 JO13. Knowledge o f Electronic Mail 1.81 ±1.24 1.61 ± 1.2314. Knowledge o f Statistical Packages 4.11 ±1.05 4.08 ±0.89
Table 37 - Descriptive Statistics for Outcome and Other Variables by Experimental Group (Mean ± Std).
Variable Experimental GroupSimulated Hands-On (n = 27) Hands-On (n = 26)
Skills Assessment 47.37 ±16.83 48.73 ± 15.86Performance 67.33 ±11.08 66.92 ±12.89Self-Efficacy 6.49 ±1.86 7.06 ±1.56Computer User Satisfaction 2.90 ±0.83 3.29 ±0.81Attitude toward Computers 3.79 ±0.56 3.61 ±0.46Lecture Satisfaction 2.89 ±0.78 3.00 ±0.84Lecture Evaluation 3.24 ± 0.83 3.57 ±0.92
115
Reproduced with permission of the copyright owner. Further reproduction prohibited without permission.

Table 38 - Pearson Correlation Coefficients (alpha — 0.05, n=53)
SkillsAssessment
Performance Self-Efficacy
UserSatisfaction
Attitude
SkillsAssessment
1.00000(0.0)
Performance 0.24019(0.0832)
i.oodoO(0.0)
Selt-tfficacy 0.06315(0.6533)
0.08597(03405)
I.OOOOo(0.0)
UserSatisfaction
-0.20782(0.1354)
-0.00021(0.9988)
030'612(0.0258)
l.odood(0.0)
Attitude 035151(0.0099)
0.06581(0.6392)
0.41735(0.0019)
-0.04914 (0.7267)
1.00000(0.0)
Note. Numbers in parenthesis are probability values.
6.4.3.2.Differences Between Experimental Groups Before Treatment
A non-parametric Kruskal-Wallis test was used to analyze the statistical
differences between the two instructional methods (simulated hand-on and hands-on the
R/3 system). A non-parametric test was considered more appropriate due to the small
sample sizes and nonnormal distributions. The Kruskal-Wallis test results (at the alpha
0.05 level o f significance) indicated no significant differences in responses between the
simulated hands-on and the hands-on experimental group. Table 39 reports the test
statistic (CHISQ) and the probability values (Prob>CHISQ) for each variable tested.
Based on the results o f the test on knowledge/skills assessment, previous experience with
computers, and attitudes toward computers, one can conclude that groups were equivalent
before the experimental treatment was applied.
Table 39 - Results o f Kruskal-Wallis Test
Variable CHISQ Prob>CHlSQKnowledge/Skills Assessment 0.02 0.8992Previous Experience with Computers 1.99 0.1573Attitudes toward Computers 2.04 0.1529Lecture Satisf action ' 0.78" ' ' 03775Lecture Evaluation 2.47 0.1162
116
Reproduced with permission of the copyright owner. Further reproduction prohibited without permission.
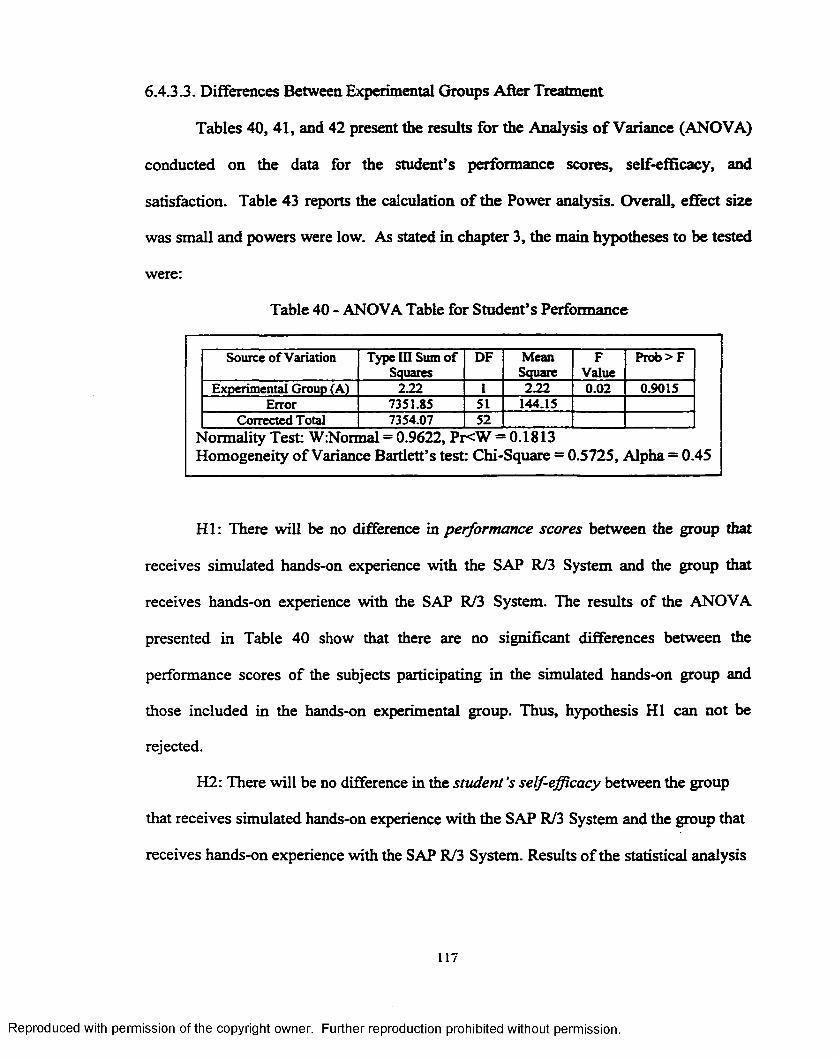
6.4.3.3. Differences Between Experimental Groups After Treatment
Tables 40, 41, and 42 present the results for the Analysis o f Variance (ANOVA)
conducted on the data for the student’s performance scores, self-efficacy, and
satisfaction. Table 43 reports the calculation o f the Power analysis. Overall, effect size
was small and powers were low. As stated in chapter 3, the main hypotheses to be tested
were:
Table 40 - ANOVA Table for Student’s Performance
Source o f Variation Type IH Sum of Squares
DF MeanSquare
FValue
Prob> F
Experimental Group (A) 222 1 2.22 0.02 0.9015Error 7351.85 51 144.15
Corrected Total 7354.07 52Normality Test: W:Normal = 0.9622, Pr<W = 0.1813Homogeneity o f Variance Bartlett’s test: Chi-Square = 0.5725, Alpha = 0.45
H I: There will be no difference in performance scores between the group that
receives simulated hands-on experience with the SAP R/3 System and the group that
receives hands-on experience with the SAP R/3 System. The results of the ANOVA
presented in Table 40 show that there are no significant differences between the
performance scores of the subjects participating in the simulated hands-on group and
those included in the hands-on experimental group. Thus, hypothesis HI can not be
rejected.
H2: There will be no difference in the student's self-efficacy between the group
that receives simulated hands-on experience with the SAP R/3 System and the group that
receives hands-on experience with the SAP R/3 System. Results o f the statistical analysis
117
Reproduced with permission of the copyright owner. Further reproduction prohibited without permission.
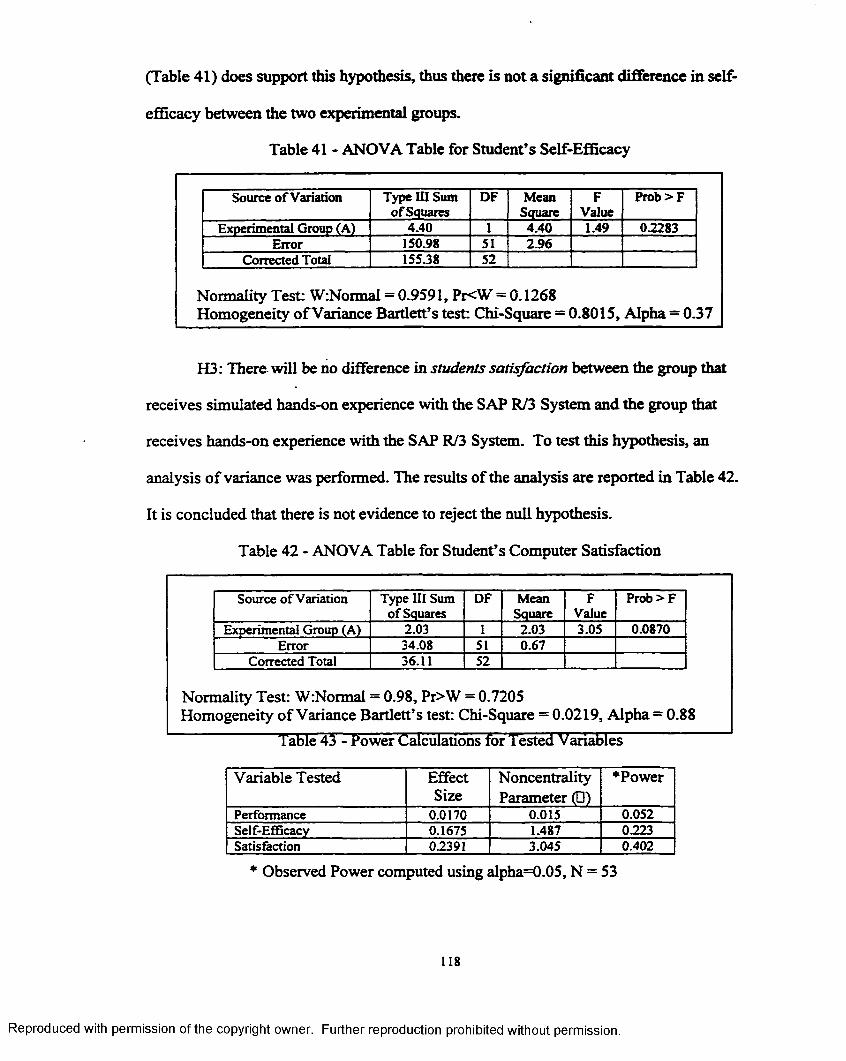
(Table 41) does support this hypothesis, thus there is not a significant difference in self-
efficacy between the two experimental groups.
Table 41 - ANOVA Table for Student’s Self-Efficacy
Source o f Variation Type III Sum of Squares
DF MeanSquare
FValue
Prob>F
Experimental Group (A) 4.40 1 4.40 1.49 02283Error 150.98 51 2.96
Corrected Total 15538 52
Normality Test: W:NormaI = 0.9591, Pr<W = G.1268Homogeneity o f Variance Bartlett’s test: Chi-Square = 0.8015, Alpha = 0.37
H3: There will be no difference in students satisfaction between the group that
receives simulated hands-on experience with the SAP R/3 System and the group that
receives hands-on experience with the SAP R/3 System. To test this hypothesis, an
analysis o f variance was performed. The results of the analysis are reported in Table 42.
It is concluded that there is not evidence to reject the null hypothesis.
Table 42 - ANOVA Table for Student’s Computer Satisfaction
Source o f Variation Type III Sum of Squares
DF MeanSquare
FValue
Prob>F
Experimental Group (A) 2.03 I 2.03 3.05 0.0870Error 34.08 51 0.67
Corrected Total 36.11 52
Normality Test: W:Normal = 0.98, Pr>W = 0.7205Homogeneity o f Variance Bartlett’s test: Chi-Square = 0.0219, Alpha = 0.88
Table 43 - Power Calculations for Tested Variables
Variable Tested EffectSize
Noncentrality Parameter (□)
♦Power
Performance 0.0170 0.015 0.052Self-Efficacy 0.1675 1.487 0223Satisfaction 0.2391 3.045 0.402
* Observed Power computed using alpha=0.05, N = 53
Reproduced with permission of the copyright owner. Further reproduction prohibited without permission.

6.4.4. Summary o f Experiment HI
To evaluate the effectiveness o f using an Enterprise Information System as a
support tool to teach business processes at the undergraduate level, a field experimental
was conducted involving 53 students enrolled in two sections o f an Information Systems
course.
Students were randomly assigned to either the simulated hands-on the SAP R/3
System or the hands-on the SAP R/3 System experimental groups. Both groups received
two one-hour lecture sessions on Enterprise Information Systems and the Order-Cash
Cycle (Customer Order Management) taught by traditional means.
After the lectures were completed, students were given a week to complete an
assignm ent related to the business process. One group was asked to observe a series of
ScreenCam demonstrations o f the business transactions involved in the Business Process.
The task of the other group, the hands-on the SAP R/3 Systems, involved conducting a
number of real time business transactions corresponding to the Customer Order
Management cycle using the R/3 System.
To measure the effectiveness o f using the R/3 system, performance scores, self-
efficacy, and computer satisfaction of the students in the two groups were compared. The
results o f the data analysis indicated that there was not a significant difference between
the two groups. Both groups revealed similar examination scores and expressed similar
levels of self-efficacy and computer satisfaction.
The overall conclusion is that the benefits o f using the SAP R/3 Systems as a
support tool to teach business process at the undergraduate level do not necessarily
translate into better performance scores, self-efficacy, or satisfaction.
119
Reproduced with permission of the copyright owner. Further reproduction prohibited without permission.

6.5. Summary
This chapter discusses the main statistical techniques utilized in the analysis
followed by a presentation of the results.
120
Reproduced with permission of the copyright owner. Further reproduction prohibited without permission.

7. DISCUSSION AND CONCLUSIONS
The primary goal o f the present study was to assess the effectiveness o f using an
Enterprise System to facilitate the understanding of Enterprise Information Systems
concepts, specifically business processes. Effectiveness was measured as a function of
subjects’ performance scores, self-efficacy perceptions, and level of computer
satisfaction. The results reported in the previous chapter provide some interesting
conclusions. This chapter discusses how the findings o f the present study increase our
knowledge of how effective the implementation o f the SAP R/3 System is in support of
business education.
7.1. Review of the Findings
Three experiments were conducted to investigate the effectiveness of using an
Enterprise System to facilitate the understanding of Enterprise Information Systems
concepts. The study used two domains (business processes) for the instructional material,
the production process and the order fulfillment process. Following is a review o f the
results for each experiment.
7.1.1. Experiment I
The first experiment focuses on the influence of the instructional method on
learning about enterprise information systems and the production process. This was a
pilot study conducted to gain experience in applying the methodology (i.e., choice of
variables, techniques for reducing error, and randomization o f subjects) and construct-
oriented evidence of the validity of the instruments.
Learning outcomes (performance, self-efficacy, and satisfaction) were examined
as a function o f instructional method, simulated hands-on and hands-on experience using
121
Reproduced with permission of the copyright owner. Further reproduction prohibited without permission.
an Enterprise System and other moderating variables (i.e., previous knowledge/skills
assessment, attitudes toward computers, etc.).
Graduate students were presented identical material on the domain o f Enterprise
Systems and Manufacturing Planning and Execution Process. After the lecture material
presentation, students were given an assignment to help master the concept given in the
lecture. An assignment asked students to view, via the web, a series o f business process
SceenCam demonstrations (simulated hands-on). The assignment demonstrated to
students how to carry out a specific task using the R/3 system (i.e., create independent
requirements for a specified material). Another group o f students received an assignment
that asked them to perform the same transactions (business process) as the other group,
but in real-time, using an Enterprise System (i.e., SAP R/3 System).
From the study results, it is clear that the use o f the system does not invariably
improve performance test scores, self-efficacy, or satisfaction o f graduate students. Thus,
the author concludes that providing students with the opportunity to perform transactions
on a real-time system does not significantly enhance their understanding o f the material
domain.
A number of factors could have contributed to the similarity in learning outcomes
between the two groups. For example, lack of commitment and motivation among the
students could have been related to poor performance. Furthermore, both groups
experienced low levels o f self-efficacy and satisfaction. Motivation was not measured but
interpreted based on the comments made by the subjects.
122
Reproduced with permission of the copyright owner. Further reproduction prohibited without permission.

7.1.2. Experiment II
This study used a two-factor experimental design. The two factors were
instructional method and learning style. The instructional method involved two
experimental groups (simulated hands-on and hands-on experience using the SAP R/3
System) as described in Experiment I and a control group. The learning style factor
included four levels (Diverger, Assimilator, Converger, and Accommodator).
Subjects from five sections of an undergraduate operations management course
were randomly assigned to a control group and to one o f two experimental conditions:
simulated hands-on experience using SAP R/3 and hands-on experience using the SAP
R/3 System. The differences were examined between groups (traditional instruction-
control, simulated hands-on instruction, and hands-on instruction) using a two-way
ANOVA.
This study demonstrated that there was a significant experimental/control main
effect, but neither the learning style main effect, nor the interaction was significant.
There was a significant difference in performance scores when comparing simulated
hands-on and control groups, but the simulated hands-on and hands-on groups were not
significantly different. The analysis revealed that students receiving simulated hands-on
the SAP R/3 System on the average scored higher on the written test than students from
the control group. Thus, the effectiveness o f the hands-on experimental group was not
supported by the data collected on this study.
7.1.3. Experiment III
This experiment was similar to Experiment I. It involved two experimental
groups (simulated hands-on and hands-on experience using the SAP R/3 System) as
123
Reproduced with permission of the copyright owner. Further reproduction prohibited without permission.

described in Experiment I, but using a different domain. In this study, the order*
fulfillment process, also known as the order-to-cash process, was utilized as the learning
domain. In addition, effectiveness was measured as a function o f performance, self-
efficacy, and satisfaction.
Results were similar to those observed in Experiment I. No significant main
effect o f instructional method existed on students’ performance, self-efficacy, or
satisfaction.
This result may be related to the students’ interest and level of engagement in the
assignment activity. Why did the hands-on the SAP R/3 System lead to unexpectedly
poor results? Observations during the experiment suggest that subjects did not expend
enough time on the exercises and thus failed to relate the lecture material to the exercises
done using the system.
7.2. Discussion
Experimental studies have shown that IT use in the classroom has a positive effect
on students’ academic achievement, their attitude toward the subject matter, and their
perceived satisfaction with the learning experience (Kulik, et al., 1980; Niemiec and
Walberg, 1987; White and White, 1997, Bowman, et al., 1995). On the other hand,
however, integration of IT into the school curricula requires a sound strategy to be
successful.
Previous studies on education/training effectiveness have suggested that a number
o f factors such as instructional method and learning style, may influence important
education/training outcomes (Cordell, 1991; Bostrom, et al., 1988, 1990; Davis and
124
Reproduced with permission of the copyright owner. Further reproduction prohibited without permission.

Bostron, 1993). Thus, this study investigated the influence o f instructional method, and
learning styles on student performance, self-efficacy, and satisfaction.
7.2.1. Effect of Instructional Method on Learning Outcomes
Overall, neither experiment demonstrated a relationship between hands-on
experience using the SAP R/3 System and the subject’s performance, self-efficacy, and
satisfaction.
7.2.1.1. Performance
Why would the learning experienced by students using ScreenCams
demonstration (simulated hands-on assignment) be equivalent to that o f the real system
(hands-on assignment)? Observations during the experiment suggest that initially the
students’ impressions toward the system were apprehensive, thus, they did not have a
chance to become familiar with the R/3 System and because of their uneasiness they
tended not to have learning high as a priority. This behavior will likely not occur during
long-term training sessions. Furthermore, based on the observation o f the study, two main
reasons why this response is given, is that the time is spent worrying about the
appearance of the screen and not enough time on what the message says. Too much time
is spent on trying to enter the correct menu path, and not enough time on how to coax the
ieamer into processing and application.
Why should one expect a better student performance, self-efficacy, and
satisfaction as a result of hands-on experience? The answer to this question may well be
explained based on the experiential learning theory utilized in this study.
Traditionally, the approach to instruction consists of the delivery o f one or two
hours of standard lecture augmented by an assignment (i.e., textbook assignment). In the
125
Reproduced with permission of the copyright owner. Further reproduction prohibited without permission.
standard lecture, a student’s day in the classroom is spent listening, taking notes, and
preparing to recapitvdatetSeTmaterial back to the instructor at some later date. Then,
students are given an assignment to complete in a week, which is related to the domain
being studied in class. A significant problem with conventional lectures is that the
student’s attention and learning decrease significantly over the first twenty minutes
(Sankar, et al., 1997). Thus, an alternative to the traditional lecture approach is the
experiential learning model (Kolb, 1984).
In the Experiential Learning format, a student engages in some activity, reflects
on what happened in a critical manner, and abstracts some useful insight from the
analysis. This form o f learning was first translated into an educational tool in the late
1940s by a behavioral scientist involved with a program for change agents at the National
Training Laboratories (NTL) in Bethel, Maine (Kolb, 1984). Today, this pedagogical
approach is used routinely by a number o f educators, especially those in the fields of
management and organizational behavior.
Kolb’s experiential learning theory (Kolb, 1984) was used to develop the structure
for an Enterprise Systems/business process lecture. The learning mechanism consist of a
transition from declarative knowledge (knowing what) to proceduralized use-oriented
knowledge (knowing how). Declarative knowledge encoded in memory (such as the steps
of a business process) is assumed to be available for the development of skill. One
assumes that the knowledge is deposited in memory as a product of language
comprehension through reading a text or through oral instruction and lecture. Procedural
knowledge consists o f sets of production rules that define the skill in each domain. The
126
Reproduced with permission of the copyright owner. Further reproduction prohibited without permission.

theory holds that effective and conditionalized knowledge of procedures can be acquired
only through actual use of the declarative knowledge in solving problems.
Thus, based on the application o f the experiential learning theory and previous
studies (Kolb, 1984; Gattiker and Paulson, 1987), it was expected that hands-on would
provide superior performance results when compared to traditional instruction or
simulated hands-on.
7.2.1.2. Self-Efficacy
Bandura’s (1977) self-efficacy theory suggests that individuals must feel
confident in using computer technologies that are important tools for learning and
communication. One could predict that by providing students with real-life interaction
with a system, it may help to increase his/her level of self-efficacy perception. Previous
research with university students have suggested that positive affect can be encouraged
through educational experiences with computers (Gilroy and Desai, 1986; Lambert and
Lenthall, 1989).
Thus, it is anticipated that hands-on experience exercises will increase self-
efficacy in students toward new computer technologies. Individuals who exhibit a low
self-efficacy perception with technological innovations are more apt to be resistant to
them. Furthermore, perceived ability to perform a new task or behavior is a strong
determinant o f willingness and openness to change (Hill, et al., 1987).
7.2.1.3. Subjects’ Satisfaction
Satisfaction has been found to be a key factor in the positive attitudes by students
toward the new technology (Alavi, 1994; Alavi, et al., 1995; Kulik, et al., 1980). The
research in this study found that satisfaction o f students with the system as well as lecture
127
Reproduced with permission of the copyright owner. Further reproduction prohibited without permission.

presentation were not significant Overall, the level o f satisfaction was higher in the
hands-on experimental group than in the simulated hands-on group, though the results
were not significant Thus, these studies indicate that satisfaction has an important
in fluence on the extent to which subjects actually leam the material presented to them
during a lecture program.
7.2.2. Effect o f Learning Style on Learning Outcomes
Individual differences, such as gender, age, motivation, and learning style have
been addressed by several researchers (Bostrom, et al., 1990; Gattiker, 1992; Cazja, et al.,
1989). These variables, with emphasis on learning styles, were examined in this study.
This study indicates that learning style does not significantly influence the
subjects' learning. Even though Sein and Bostrom (1989) indicated that learning style
has important implications for the effectiveness o f end-user training, this research did not
find the direct impact o f learning style on performance. Furthermore, its interaction with
instructional method was not significant. Thus, it seems that use o f the SAP R/3 System
does not appear to be biased toward students with a particular learning style; rather it
provides students an equal opportunity for success. Overall, analysis of performance
scores in various categories indicate that assimilators had better learning retention
compared to accommodators, convergers, and divergers, though the results were not
significant.
However, the Kolb’s learning style instrument has been criticized by researchers,
particularly with regard to its forced-choice scoring format, poor construct and face
validity, poor reliability, and an abnormal distribution (Atkinson, 1991; Ruble and Stout,
1993). Atkinson (1991) evaluated the Kolb Learning Style Inventory (LSI) and reviewed
128
Reproduced with permission of the copyright owner. Further reproduction prohibited without permission.

studies of the inventory’s design, reliability, and validity. Findings suggest that the
inventory has weak internal consistency and weak stability. The 1985 revision o f the
Kolb Learning Style Inventory seems to have improved internal consistency, but stability
and classification reliability were unchanged. Although this study used the revised form
of the LSI, it is recommended that an alternative (Allinson and Hayes, 1988) learning
style questionnaire be administered (or adopted) instead.
1 3 . Conclusions
Enterprise systems are emerging as useful tools for enhancing student learning of
business concepts. Specifically, they provide a way to transport the classroom to the real
world of business.
Reasons for using the SAP R/3 System are related not only to the enhancement of
learning, but also to students’ increasing awareness of developments in information
technology and its applications in information practice.
Many different universities are using the SAP R/3 System in similar ways, for
similar reasons, and with similar anxieties: that is what makes this study significant. A
number of possibilities exist for the integration of Enterprise Systems such as the SAP
R/3 System into business schools (Watson and Schneider, 1999). As a support tool to
facilitate the knowledge and understanding of business concepts, SAP R/3 can be
integrated in different forms o f education as lectures, courses, project work, and masters’
theses. The focus of this study was on the use of the SAP R/3 System as a complement to
a lecture in Business Processes Education. Thus, this study was driven by the need to
determine the effectiveness o f using an Enterprise System to facilitate the learning of
business processes in business education.
129
Reproduced with permission of the copyright owner. Further reproduction prohibited without permission.

In this study, effectiveness was defined as the extent to which a given
instructional method actually contributes to enhancements in student performance, self-
efficacy, and satisfaction. Thus, the present study was designed to examine the effects of
a number o f factors on performance, self-efficacy, and satisfaction. Based on previous
research in this area (e.g., Kulik, et al., 1980; Bowman, et al., 1995), it was hypothesized
that there would be no difference in performance scores, self-efficacy, and satisfaction
between the group that receives hands-on experience with the SAP R/3 System and all
other groups. In addition, it was hypothesized that the subjects’ learning style will not
influence the performance, self-efficacy, and satisfaction of subjects (Bostrom, et al.,
1988).
A two-way ANOVA design was performed based upon these hypotheses. With
respect to the between group effect, no significant differences were found between the
hands-on group and the other groups on the multiple-choice/true-false pre-test/post-test
scores, self-efficacy or satisfaction. One must note that lack o f statistical-significant
differences between the control group, the simulated hands-on, and the hands-on
experimental groups in this study do not automatically or uniformly apply to all other
disciplines or all types of computer tasks. Thus, the present study results demonstrated
that technology-enhanced instruction can assist the learning o f business concepts by
students in business majors at least as well as, and possibly somewhat better than, a more
traditional instructional format.
In conclusion, the results o f this study provide interesting insights into the
variables related to student performance, self-efficacy, and satisfaction when learning
about enterprise systems. However, the findings together with others in the literature, as
130
Reproduced with permission of the copyright owner. Further reproduction prohibited without permission.

discussed in previous chapters, suggest that with respect to performance, self-efficacy,
and satisfaction, the added value o f the technology is questionable.
The data suggest that the teaching o f the business processes topic to college
students can be done effectively with hands-on when it is used as a supplement tool, or as
effective as simulated hands-on. Thus, the evidence clearly indicates that the hands-on
experience group performed as well as the simulated hands-on and control groups. On the
other hand, a general conclusion is that a SAP-based course is much more laborious and
demanding than that o f a conventional course.
131
Reproduced with permission of the copyright owner. Further reproduction prohibited without permission.

8. CONTRIBUTIONS, LIMITATIONS, AND FUTURE RESEARCH
This chapter discusses the theoretical and methodological limitations o f the study.
Based on this discussion, potential future research directions are outlined.
8.1. Contribution of the Study
Given the significance of providing business students with knowledge and skills
in Enterprise Information Systems to effectively lead organizational integration and
process reengineering efforts, it is imperative that business schools design and implement
instruction in the most effective manner, and that they understand the factors that
contribute to teaching effectiveness.
Perhaps the greatest challenge facing business schools is to distinguish the activities
that can take best advantage o f the new learning information technology from those that
cannot be replaced in the foreseeable future. To date, the educational benefits (i.e.,
enhanced student’s business functional knowledge/skills through hands-on experience) of
instructional uses o f the SAP R/3 System are established on the basis of anecdotal
statements from faculty and students rather than on empirical and objectively measured
data secured by educational research methods. On the other hand, there is no single
research effort that focuses on the question related to the effectiveness of using a
commercial ERP system such the SAP R/3 System to facilitate knowledge/skills and
understanding of contemporary business processes at the undergraduate or graduate
levels.
From both IS practitioners and academicians’ research standpoint, the information
collected on this study can be used to build a body of knowledge about student learning
processes when learning about Enterprise Resource Planning Systems such the SAP R/3
132
Reproduced with permission of the copyright owner. Further reproduction prohibited without permission.

System. It answers an important question that still need to be asked: How does the use of
the SAP R/3 System improve student learning o f particular concepts/skills and help
overcome particular misconceptions about IS? For example, what kind o f hands-on R/3
exercises work best in developing the idea o f particular concepts such as distributed
client/server systems and business process reengineering. Results o f this research study,
along with the base of knowledge already existent on the use o f information technology
to enhance education, will help universities rethink what in business
education/information systems is most important to learn, how it should be taught, and
what evidence o f success should be anticipated.
The results of this study should have important theoretical and methodological
significance. From the theoretical perspective, this research builds upon the exciting
Information Technology literature on learning models (e.g., Kolbs, 1984; Leidner and
Jarvenpaa, 1993; Bostrom, et al., 1988), by adapting the Social Cognitive Theory to the
Information Technology field (Compeau and Higgins, 1995a; Bandura, 1977, Gist, et al.,
1989), and on the educational literature on Instructional Design (Rothwell and Kazanas,
1998). Furthermore, it provides an initial working model to examine instructional
effectiveness o f using the SAP R/3 System to enhance business education. In addition,
the study explores whether the various moderator variables (i.e., attitude, experience,
etc.) differentially affect instruction effectiveness.
The study also has methodological implications. Often the measure of
effectiveness of instruction using information technology is based on one process
outcome variable, final grade. In this study, two perceptual measures were included (self-
efficacy and satisfaction) to help in the understanding of the learning environment.
133
Reproduced with permission of the copyright owner. Further reproduction prohibited without permission.

8.2. Limitations of the Study
No research is without limitations and this study is no exception. This section
identifies and discusses some o f the theoretical and methodological limitations o f the
study so that they can be addressed and improved in future research studies.
8.2.1. Theoretical Limitations
Previous educational studies provide evidence o f the power o f providing
conceptual models or organizing constructs to assist in student learning (Mayer, 1989). In
the present study, all subjects received the same lecture; however, half the subjects were
given a simulated hands-on exercise, and half were given a hands-on assignment
exercise. An important question not included on this study is whether providing students
with a conceptual model would enhance their understanding o f Enterprise Information
Systems concepts, in addition to their interaction with the real-time system.
Borgman (1986) states that “mental models is a general concept used to describe a
cognitive mechanism for representing and making inferences about a system or problem
which the user builds as he or she interacts with and learns about the system.” An
important question related to the application of mental models in training is whether a
user will build a mental model spontaneously or whether it is necessary to provide a
conceptual model on which a mental model can be based.
Thus, a theoretical limitation of the present study was the not consideration of the
mental model theory. It will be necessary to evaluate Kolb’s experiential learning theory
based on mental model change. One would expect that as individuals move through the
cycle, their mental model is either maintained or changed.
134
Reproduced with permission of the copyright owner. Further reproduction prohibited without permission.

8.2.2. Methodological Limitations
This study uses a two-phase methodology for investigating the effectiveness of
integrating SAP R/3 into the business curriculum. A preliminary field experiment
(Experiment I) was conducted to ensure an appropriate research design (i.e., choice of
variables, techniques for reducing error, and randomization of subjects). The pilot testing
was carried out in consultation with faculty, industry, and students for critical evaluation
of possible limitations, intemal/extemal validity issues, cost, logistics, etc.
A number o f control measures were taken: a) all subjects were given similar set of
activities to perform (reading/writing exercises), b) pre-test and post-test measures as
well as selection o f significant levels where established, c) data were collected on a
number of variables to be used as covariates if applicable (i.e., learning style, attitude
toward computers, age, GPA, Major, etc.), and d) a multiple-choice test was developed to
measure performance. The test was provided to Information Systems faculty
knowledgeable o f the domain (ERP and core Business Processes such as Order-to-Cash
Cycle and Manufacturing Planning and Execution) to be revised for further use. In
addition, previous developed and validated instruments were used to measure self-
efficacy and satisfaction.
Even though a number of measures were undertaken to avoid significant
limitations, there were still a number of limitations incurred in the study. First, unequal
cell sizes represented a potential limitation although analysis of variance is quite robust to
unequal cell sizes. Second, experiments should have been based on a longer time frame
(semester) or longitudinal to capture mental model formation/change. Third, this study
135
Reproduced with permission of the copyright owner. Further reproduction prohibited without permission.
focused on leaning style as a key individual difference between subjects. However,
subjects were not grouped according to their learning style. Assigning individuals to
treatment within learning style may offer more insight into the effect o f learning style on
subject performance. Thus, the above stated limitations must be resolved in future
research.
83. Future Research
The accelerated use o f the R/3 system to support instruction demands sound
research on the effectiveness o f the innovation. Thus, this research project addressed an
issue that had existed in the literature with respect to the use of information technology in
education, how effective is it? However, a number of unresolved issues and future
research opportunities also remained after the study.
There seems to be a general agreement about the benefits o f using the SAP R/3
System in business education. However, when it comes to investigating the question of
its effectiveness to enhance student performance, self-efficacy, and satisfaction, this
study does not support it. On the other hand, research should examine some other
important questions such as ‘how do educators create curriculum content for the effective
use of the R/3 system’?
8.3.1. Theoretical Extension of the Research Model
Future studies should include mental model formation as part of the research
model used in this investigation. Sein and Bostrom (1989) provide conclusive evidence
of the effectiveness o f using conceptual models in aiding users to build mental models of
computer systems. Furthermore, The Kolb (1984) and Simon, et al. (1996) learning
136
Reproduced with permission of the copyright owner. Further reproduction prohibited without permission.
models provide an important platform for future research concerning education/training
effectiveness.
8.3.2. Methodological Improved Research Design
Longitudinal studies should be conducted to investigate the learning process and
user-behavior when utilizing the R/3 system, especially from a cognitive perspective.
These type o f studies would be conclusive to track user-behavior over a period of time.
Perhaps it could be expected that as students become more familiar with the system, they
could concentrate more on relating the system model with the lecture material and thus
improving their level o f knowledge and understanding o f the domain. Therefore, in future
studies, it would be valuable to examine the long-term learning effect o f instruction using
the R/3 system.
A follow-up study is recommended, but also many left for others to attempt. In
addition to gathering more data on the research model, future research is aimed at
addressing other factors that are believed to influence learning outcomes.
The assessment of the overall effectiveness o f a particular instructional method
involves two main questions: 1) Does using the SAP R/3 System lead to higher levels of
learning or knowledge than some other instructional method? 2) What practices within
the use of the SAP R/3 System lead to the highest learning levels? To answer the first
question, a substantive study could be conducted, which concentrates on the results
produced by the method compared with other methodologies. On the other hand, a
procedural study is performed to answer the second question. A procedural study
concentrates on what usages and procedures are associated with superior results. This
study concentrated on the first question and, thus it is suggested that the research effort
137
Reproduced with permission of the copyright owner. Further reproduction prohibited without permission.

should be put into answering the second question. No hypotheses were rigorously posed
as to why the use o f the SAP R/3 System would enhance learning o f business processes.
An intent was made by including outcome variables such as self-efficacy and satisfaction.
The present study was not designed to examine what usage of the SAP R/3
System lead to the highest learning levels. It is known that other SAP Alliance
universities are utilising the system in different ways besides the one adopted in this
study (Gable, et al., 1997). However, other techniques being used go more toward the
training o f students on the software rather than educating on the subject of Enterprise
Systems. Thus, it is recommended that studies be conducted to examine the second
question as well as the first
Finally, although the instructional program closely followed suggested
instructional models and prescriptions, the quality o f instruction and instructional
material have a significant impact on the outcome of any educational program. Thus,
additional empirical research is needed in the area o f instructional design related to
Enterprise Information Systems.
138
Reproduced with permission of the copyright owner. Further reproduction prohibited without permission.

REFERENCES
Alavi, M. (1994). “Computer-Mediated Collaborative Learning: An Empirical Evaluation.” MIS Quarterly 18 (June 1994): pp. 159-174.
Alavi, M., Wheeler, B.C., and Valacich, J.S. (1995). “Using IT to Reengineer Business Education: An Exploratory Investigation of Collaborative Teleleaming.” MIS Quarterly 19(3) (September 1995): pp. 293-312.
Allinson, C.W. and Hayes, J. (1988). “The Learning Styles Questionnaire: an Alternative to Kolb’s Inventory?” Journal o f Management Studies 25(3): pp. 269-281.
Anderson, J.C. and Gerbing, D.W. (1988). “Structural Equation Modeling in Practice: A review and recommended two-step approach.” Psychological Bulletin 103: pp. 411-423.
Atkinson, G. (1991). “Kolb’s Learning Style Inventory: A Practitioner’s Perspective.” Measurement and Evaluation in Counseling and Development 23 (January): pp. 149-161.
Bandura, A (1977). “Self-Efficacy: Toward a Unifying Theory o f Behavior Change.” Psychology Review 84: pp. 191-215.
Bandura, A. and Adams, N.E. (1977). “Analysis of Self-Efficacy Theory of Behavioral Change.” Cognitive Therapy and Research 1: pp. 287-310.
Bandura, A. (1986). “Social Foundation for Thought and Action.” Englewood Cliffs, NJ, Prentice Hall.
Bandura, A. (1991). “Social Cognitive Theory of Self-Regulation.” Organizational Behavior and Human Decision Processes 50: pp. 248-287.
Bandura, A. and Cervone, D. (1986). “Differential Engagement of Self-Reactive Influences in Cognitive Motivation.” Organizational Behavior and Human Decision Processes 38(1): pp. 92-113.
Baroudi, J.J. and Orlikowski, W.J. (1989). “The Problem o f Statistical Power in MIS Research.” MIS Quarterly 13(1): pp. 87-106.
Benbasat, I. and Taylor, R.N. (1978). “The Impact of Cognitive Styles on Information System Design.” MIS Quarterly 2(2): pp. 43-54.
Bonwell, C.C., and J.A. Eison. (1991). “Active Learning: Creating Excitement in the Classroom."”ASHE_ERIC Higher Education Rep. 1. Washington, DC: The George Washington University ERIC Clearinghouse on Higher Education.
139
Reproduced with permission of the copyright owner. Further reproduction prohibited without permission.
Borgman, C. (1986). “ The User’s Mental Model o f an Information Retrieval System: an Experiment on a Prototype Online Catalog.” International Journal Man-Machine Studies 24: pp. 47-64.
Bostrom, R.P., Oilman, L., and Sein, M.K. (1990). “The importance o f Learning Style in End-User Training.” MIS Quarterly 14(1): pp. 101-119.
Bostrom, R.P., Olfinan, L., and Sein, M.K. (1993). “Learning Styles and End-User Training: A First Step.” MIS Quarterly 17 (March): pp. 118-120.
Bostrom, R.P., Olfinan, L., and Sein, M.K. (1988). “End User Computing: A Framework to Investigate the Training/Learning Process.” In Human Factors in Management Information Systems, J.M. Carey (ed.), Ablex Publishing Corporation, Norwood, NJ, pp. 221-250.
Bowman, B.J., Grupe, FT!., and Simkin, M.G. (1995). ‘Teaching End-User Applications with Computer-Based Training: Theory and an Empirical Investigation.” Journal o f End- User Computing 7 (Spring): pp. 12-18.
Carroll, J.R., Smith-Kerker, P.L., Ford, J.R., and Mazur-Rimetz, S.A. (1987). “The M in im al Manual.” Human-Computer Interaction 3(2): pp. 123-153.
Cheney, P.H. and Lyons, N.R. (1980). “Information Systems Skill Requirements: A Survey.” MIS Quarterly 4(1): pp. 35-43.
Churchill, G.A., Jr. (1979). “ A Paradigm for Developing Better Measures o f Marketing Constructs.” Journal of Marketing Research 16: pp. 64-73.
Cohen, J. (1977). Statistical Power Analysis for the Behavioral Sciences. Academic Press. New York, New York, USA.
Cohen, J. (1988). Statistical Power Analsysis o f the Behavioral Sciences, Lawrence Erlbaum Associates, Hillsdale, New Jersey.
Compeau, D.R. and Higgins, C.A. (1995a). “Application o f Social Cognitive Theory to Training for Computer Skills.” Information Systems Research 6(2): pp. 118-143.
Compeau, D.R. and Higgins, C.A. (1995b). “Computer Self-Efficacy: Development of a Measure and Initial Test.” MIS Quarterly 19(2): pp. 189-211.
Cook, T.D. and Campbell, D.T. (1976). “The Design and Conduct of Quasi-Experiment and True Experiments in Field Settings.” Handbook o f Industrial and Organizational Psychology. M. Dunnette. Chicago, Rand McNally College Publishing Company.
Cook, T.D. and Campbell, D.T (1979). “Quasi-Experimentation: Design & Analysis Issues for Field Settings.” Houghton Mifflin, Boston, Massachusetts.
140
Reproduced with permission of the copyright owner. Further reproduction prohibited without permission.

Cordell, B.J. (1991). “A Study of Learning Styles and Computer-Assisted Instruction.” Computers Education 16(2): pp. 183-1991.
Cronan, T.P. and Douglas, D.E. (1990). “End-User Training and Computing Effectiveness in Public Agencies: An Empirical Study.” Journal o f Management Information Systems 6(4): pp. 21-39.
Cronbach, L.J. (1951). “Coefficient Alpha and the Internal Consistency o f Tests.” Psychometrika 16: pp. 297-334.
Curry, B. and Moutinho, L. (1992). “ Using Computer Simulations in Management Education.” Management Education and Development 23 (Summer): pp. 155-167.
Czaja, S.J., H am m ond, K., Blascovich, J.J., and Swede, H. (1986). “Learning to Use a Word-Processing System as a Function of Training Strategy.” Behavior and Information technology 5 (July): pp. 203-216.
Czaja, S.J., Hammond, K., Blascovich, J.J., and Swede, H. (1989). “Age Related Differences in Learning to Use a Text-Editing System.” Behavior and Information Technology 8 (July-August): pp. 309-319.
Davenport, T.H. and Short, J.E. (1990). “ The New Industrial Engineering: Information Technology and Business Process Redesign.” Sloan Management Review 31(4): pp. 11-27.
Davis, S.A. and Bostrom, R.P. (1993). “Training End Users: An Experimental Investigation o f the Roles of the Computer Interface and Training Method.” MIS Quarterly pp. 61-85.
Davis, D.L. and Davis, D.F. (1990). “The Effect o f Training Techniques and Personal Characteristics on Train ing End Users of Information Systems.” Journal o f Management Information Systems 7: pp. 93-110.
Delcourt, M.B., and Kinzie, M.B. (1993). “Computer Technologies in Teacher Education: The Measurement of Attitudes and Self-Efficacy.” Journal o f Research & Development in Education 27: pp. 31-37.
Dickson, G.W., DeSanctis, G., and McBride, D.J. (1986). “Understanding the Effectiveness o f Computer Graphics for Decision Support: A Cumulative Experiment Approach.” Communication of ACM 29 (January): pp. 40-47.
Doll, W.J. and Torkzadeh, G. (1988). “The Measurement of End-user Computing Satisfaction.” MIS Quarterly (June): pp. 258-274.
141
Reproduced with permission of the copyright owner. Further reproduction prohibited without permission.

Duchastel, P. (1986). “Intelligent Computer Assisted Instructional Systems: The Nature o f Learner Control.” Journal o f Educational Computing Research 2(3): pp. 379-393.
Farmer, D.F. (1987). “Good Managers Are Hard to Find.” ComputerWorld 21(27): pp. 70.
Gable, G., Heever, R., Scott, J., and Erlank, S. (1997). “Large Packaged Software: the need for Research.” Proceedings of the 3rd Pacific Asia Conference of Information Systems. Bribane, Australia, pp. 381-388.
Gattiker, U. (1992). “Computer Skills Acquisition: A Review and Future Directions for Research.” Journal o f Management 18 (September): 547-574.
Gattiker, U., and Paulson, D. (1987). “The Quest for Effective Teaching Methods: Achieving Computer Literacy for End-Users.” Information Systems and Operations Research 25(3): pp. 256-271.
Gilroy, F.D., and Desai, H.B. (1986). “Computer Anxiety: Sex, Race, and Age.” International Journal of Man-Machine Studies, Vol. 25, pp. 711-719.
Gist, M.E., Schwoerer, C., and Rosen, B. (1989). “Effects o f Alternative Training Methods on Self-Efficacy and Performance in Computer Software Training.” Journal of Applied Psychology 74 (December): pp. 884-891.
Gist, M.E. and Mitchell, T.R. (1992). “Self-Efficacy: A Theoretical Analysis of Its Determinants and Malleability.” Academy of Management Review 17: pp. 183-211.
Golsmith, T.E., Johnson, P.J., and Acton, W.H. (1991). “Assessing Structural Knowledge.” Journal of Educational Psychology 83: pp. 88-96.
Hatcher, L. (1994). “A Step-by-Step Approach to Using the SAS System for Factor Analysis and Structural Equation Modeling.” SAS Institute Inc. Cary, NC, USA.
Hammer, M. (1990). “Reengineering Work: Don’t Automate, Obliterate.” Harvard Business Review 68(4) July-August, pp. 104-112.
Hammer, M. (1996). Beyond Reengineering: How the Process-Centered Organization is Changing Our Work and Our Lives. Harper Business, New York, NY.
Hill, T., Smith N.D., and Mann, M.F. (1987). “Role of Self-Efficacy Expectations in Predicting the Decision to Use Advanced Technologies: The Case of Computers.” Journal of Applied Psychology 72(2): pp. 307-313.
Horgan, B. (1998). “Faculty, Instruction, and Information Technology.” The Technology Source, Retrieved April 6, 1999 from the World Wide Webhttp://horizon.unc.edu/TS/development/1998-08.asp
142
Reproduced with permission of the copyright owner. Further reproduction prohibited without permission.

Howardell, D. (1999). “Creating a Next Generation Workforce.” APICS 9(3)
Ives, B. and Jarvenpaa, SX. (1996). “Will the Internet Revolutionize Business Education and Research.” Sloan Management Review 37: pp. 33-41.
Ives, B-, Olson, M.H., and Baroudi, J.J. (1983). “The Measurement o f User Information Satisfaction.” Communications o f the ACM 26(10): pp. 785-793.
Jarvenpaa, S. L., G. Dickson, et al. (1985). “Methodological Issues in Experimental IS Research: Experiences and Recommendations.” MIS Quarterly 9(2) (June 1985): pp. 141-156.
Jarvenpaa, S.L. and Dickson, G.W. (1988). “Graphics and Managerial Decision Making: Research Based Guidelines.” Communication of ACM 31 (June): pp. 764-774.
Jegede, O.J., Walkington, J., and Naidu, S. (1995). “An investigation into Students’ Disposition to the Use of Objectives in Distance Learning Materials.” Educational Research 37(3): pp. 293-304.
Jonassen, D.H., Grabinger, R.S., and Harris, N.D. (1990). “Analyzing and Selecting Instructional Strategies and Tactics.” Performance Improvement Quarterly 3(2): pp. 29- 47.
Kinzie, M.B., Delcourt, A.B., and Powers, S.M. (1994). “Computer Technologies: Attitudes and Self-Efficacy Across Undergraduate Disciplines.” Research in Higher Education 35(6): pp. 745-768.
Kolb, D.A. 1984. Experimental Learning: Experience as The Source of Learning and Development, Pretice-Hall, Englewood Cliffs, NJ.Kolb, D.A. 1985. Learning Style Inventory Technical Manual. Boston: McBer & Co.
Kolb, D.A., Rubin, I.M., and McIntyre, J.M. (1974). “Learning and Problem Solving: On the Management and Learning Process.” In Organizational Psychology: A Book o f Readings, ed. Herbert A. Simon, 27-42. Englewood Cliffs, NJ: Prentice-Hall.
Kulik, J.A., Kulik, C.C., and Cohen, P.A. (1980). “ Effectiveness o f Computer-based College Teaching: A Meta-analysis of Findings.” Review of Educational Research 50(4): pp. 525-544.
Lambert, M.E., and Lenthall, G. (1989). “Effects of Psychology Courseware Use on Computer Anxiety in Students.” Computers in Human Behavior 5: pp. 207-214.
Lazonder, A.W. and Meij, H.Van Der. (1993). “The Minimal m anual: is less really more?” International Journal o f Man-Machine Studies 39: pp. 729-752.
143
Reproduced with permission of the copyright owner. Further reproduction prohibited without permission.

Lee, D.M.S., Trauth, E.M., and Farwell, D. (1995a). “Critical Skills and Knowledge Requirements o f IS Professionals: A Joint Academic/Industry Investigation.” MIS Quarterly 19(3): pp. 313-340.
Leidner, D. and S. Jarvenpaa (1993). “The Information Age Confronts Education: Case Studies on Electronic classrooms.” Information Systems Research 4:l(March 1993): pp. 24-54.
Leidner, D. E. and S. L. Jarvenpaa (1995). “The Use o f Information to Enhance Management School Education: A Theoretical View.” MIS Quarterly 19(3) (September 1995): pp.265-291.
Lengnick-Hall, C A . (1996). “Customer Contribution to Quality: A Different View o f the Customer Oriented Finn.” Academy o f Management Review 21: pp. 791-824.
Lengnick-Hall, C.A. and Sanders, M.M. (1997). “Designing Effective Learning Systems for Management Education: Student Roles, Requisite Variety, and Practicing What We Teach.” The Academy of Management Journal 40(6): pp. 1334-1368.
Louisiana State University. (1999). “LSU General Catalog: Undergraduate/Graduate 1999-2000.”
Lusk, E.J. and Kersnick, M. (1979). “ The Effect of Cognitive Style and Report Format on Task Performance: The MIS Design Consequences.” Management Science 25 (August): pp. 787-798.
Mason, R.O. and Mitroff, I.I. (1973). “ A Program for Research on Management Information Systems.” Management Science 19 (January): pp. 475-487.
Maul, G.P. and Spotts, D. (1993). “A Comparison of Computer Based Training and Classroom Instruction.” Industrial Engineering 25(February): pp. 25-27.
Mayers, R.E. (1989). “ Models for Understanding.” Review o f Educational Research 59: pp. 43-64.
Nelson, R.R. (1991). “Educational Needs as Perceived by IS and End-User Personnel: A Survey of Knowledge and Skill Requirements.” MIS Quarterly 15(4): pp. 503-525.
Neter, J., Wasserman, W., and Kutner, M.H. (1990). Applied Linear Statistical Models 3rd ed. Richard D. Irwin, Inc. Homewood, IL.
Niemiec, R. and Walberg, H.J. (1987). “ Comparative Effect o f Computer-Assisted Instruction: A Synthesis of Review.” Journal o f Educational Computing Research 3(1): pp. 19-37.
144
Reproduced with permission of the copyright owner. Further reproduction prohibited without permission.

Olfinan, L. and Mandviwalla, M. (1994). “Conceptual Versus Procedural Software T ra in in g for Graphical User Interfaces: A Longitudinal Field Experiment.” Management Information Systems Quarterly 18: pp. 405-426.
Olivier, T.A. and Shapiro, F. (1993). “Self-Efficacy and Computers.” Journal o f Computer-Based Instruction 20(3): pp. 81-85.
Parasuraman, S. and Igbaria, M. (1990). “An examination o f Gender Differences in the Determinants o f Computer Anxiety and Attitudes Toward Microcomputers Among Managers.” International Journal Man-Machine Studies 32 (January): pp. 327-340.
Ramaprasad, A. (1987). “Cognitive Process as a Basis for MIS and DSS Design.” Management Science 33 (February): pp. 139-148.
Rothwell, William J. and Kazan as, H.C. “Mastering the Instructional Design Process,” (2nd ed.) San Francisco: Jossey-Bass Publishers. 1998.
Ruble, T.L. and Stout, D.E. (1993). “Learning Styles and End-User Training: An Unwanted Leap o f Faith.” MIS Quarterly 17 (March): pp. 115-118.
Sankar, C.S., Ford, NJF., and Terase, N. (1997). “Impact of Videoconferencing in Teaaching an Introductory MIS Course.” Journal o f Educational Technology Systems 26(1): pp. 67-85.
Santhanam, R. and Sein, M.K. (1994). “Improving End-User Proficiency Effects of Conceptual Training and Nature of Interaction.” Information Systems Research 5: pp. 378-399.
SAS Institute Inc. (1989). SAS/STAT users guide, version 6, fourth edition, Vol. 1. Cary, NC: SAS Institute Inc.
Sein, M.K. and Bostrom, R.P. (1989). “Individual Differences and Conceptual Models in Training Novice Users.” Human-Computer Interaction 4: pp. 197-229.
Sein, M.K. and Robey, D. (1991). “Learning Style and the Efficacy of Computer Training Methods.” Perceptual and Motor Skills 72: pp. 243-248.
Simon, S.J., Grover, V., Teng, J.T.C., and Whitcomb, K. (1996). “The Relationship of Information System Training Methods and Cognitive Ability to End-User Satisfaction, Comprehension, and Skill Transfer: A Longitudinal Field Study.” Information Systems Research 7(4)(December): pp. 466-490.
Spence, J.W. (1995). “Human-Computer Interaction: A General Behavioral Model for MIS Research.” Proceedings of the First Americas Conference on Information Systems, ed. Marja K. Ahuja, Dennis F. Galletta, and Hugh J. Watson, August 25-27. Pittsburgh, PA: Association for Information Systems.
145
Reproduced with permission of the copyright owner. Further reproduction prohibited without permission.

Stohr, E.A. (1995). “Introduction to Special Issue: IS Curricula and Pedagogy.” MIS Quarterly 19(3) (September 1995).
Straub, D.W. (1989). “Validating Instruments in MIS Research.” MIS Quarterly (June) pp. 147-170.
Sullivan-Trainor, M. (1988). “MIS Stares at Skills Crunch.” Computerworld 22(10): p. 1
Todd, P. and Benbasat, I. (1987). “Process Tracing Methods in Decision Support Systems Research: Exploring the Black Box.” MIS Quarterly 1 l(December): pp. 494-514.
Trauth, E., Farwell, D., and Lee, D.M.S. (1993). “The IS Expectation Gap: Industry Expectations and Academic Preparation.” MIS Quarterly 13(3): pp. 293-307.
Watson, E.E. and Schneider, H. (1999) “Using ERP Systems in Education.” Communication of the Association for Information Systems 1(9).
White, M.J. and White, B.R. (1997). “The Effect of Using a Computer Authoring System on Student Achievement” Journal of Business and Training Education 6(Spring): pp. 87- 99.
Zmud, R.W. (1979). “Individual Differences and MIS Success: A Review of the Empirical Literature.” Management Science 25(10): pp. 966-979.
146
Reproduced with permission of the copyright owner. Further reproduction prohibited without permission.

APPENDIX A - PRELIMINARY SURVEY
Demographic Characteristics
Name: ISDS 3115 —Sec:____
Please answer the following questions to the best o f your knowledge. The information provided in this questionnaire will remain strictly confidential and will not affect your grade in this course.
PLEASE PUT AN “X” ON ANY OF THE FOLLOWING THAT APPLY
1. What is your major?
n Female 1 it 20-22 years
□ Male C D <19 years
□ Sophomore □ Junior □Freshm an
Please Specify______________2. Age
□ 3.0-3.5 □ 2.5-3.0 □ >3.5 Q Senior
3. Gender
□ No □ <2.5
4. What is your academic level
□ Yes □ No |— [ Yes □ Senior
5. Overall GPA
□ <2.5 Q 2.5-3.0 □ 3.0-33 □ > 3.5
6. Do you have access to a Computer at home?
□ Yes □ No
7. Do you have access to an Internet Connection at home?
□ Yes □ No
147
Reproduced with permission of the copyright owner. Further reproduction prohibited without permission.

APPENDIX B - KOLB’S LEARNING STYLE INVENTORY
Learning Style InventoryExample:
W hen I learn2
[ am haopy4
C u r o re r .il C u n last 1 am logical
I . W hen I leam1 like co deal
wich my- fedings1 like co oink about ides
I like co be doing chinas
1 tike co watch and liacen
2. I team best whenI tisrer. and
watch carefullyC reiyon
logical chinking1 trust my hunches
and ixd inp[ work hard
co get things done
5- When [ am teaming1 cend co
reason things out1 aat responsible
about thingsI am quire
and reserved1 have strong
feelings and reactions
4. I team by
5- W hen [ team
feeling
1 am open co new experiences
doing watching chinking
[ took at ad 1 like co analyze things, break I tike co aysides of issues arena d o w n into cheir para things out
6. W hen I im teamingI am an
observing persont am an
acsve person1 am an
intuitive seasonlam a
logical person
7. I team best fromooservaaoa personal
refacooshiosradooal a chance co ay
out and p richer
3. When I team1 tike co see results
from my work1 tike ideas
andchcocis1 cake asy time before among
1 fed personally involved in doings
9. I leam best whenI rely on my observations
I rely on my feelings
C a n cry things out for myself
1 cdy on my ideas
10. When I am teamingI am a
reserved season1 am an
acmpdng person1 am a
resoonsibte o croonl ama
caconal oerson
11. W hen [team
12- I team best when
1 get involved
1 analyze ideas
1 tike co observe
[ am receptive and open-minced
i evaluate cmr.p
1 am earend
1 tike co be active
[ am pneheal
Hay/WcSer Copyrights 1999 DavidA. Safa. aperients luce kesnutg interns, toe. .All ngha re
148
Reproduced with permission of the copyright owner. Further reproduction prohibited without permission.

APPENDIX C - INITIAL KNOWLEDGE/SKILLS ASSESSMENT
Previous Experience With, and Current Use of Computer Technologies
Name: ISDS 3115 —Sec:_
Please answer the following questions about your previous experience with, and current use o f computer technologies (i.e., word processing, electronic mail, spreadsheets, database programs, statistical packages, and CD-ROM databases).
8. How would you describe your previous experience with computers? (Circle number)1 No experience2 Somewhat3 Occasional4 Frequent user5 Professional user
Please circle a num ber fro m 1 to 5 o f the fo llow ing th a t applywhere:
1 = Several Times a Day2 = About Once a Day3 = A Few Times a Week4 = A Few Times a Month5 = Once a Month
9. If you have computer at home, how frequently do you use it?
10. If you have computer at work, how frequently do you use it?
11. How frequently do you use Electronic Mail?
12. How frequently do you use Search the World Wide Web?
13. How frequently do you participate in Chat or Discussion Groups?
2
2
2
2
2
3
3
3
3
3
4
4
4
4
4
14. For each of the following types of software, rate your familiarity with it.0 = Not at all 3 = To some extent1 = To a very little extent 4 = To a great extent2 = To a little extent 5 = To a very great exten
Word Processors (e.g. MS Word)
Spread Sheets (e.g. MS Excel)
Presentation Software (e.g. MS PowerPoint)
Database Management Systems (e.g. Access)
Statistical Packages
Electronic Mail
0
0
0
0
0
0
2
2
2
2
2
2
3
3
3
3
3
4
4
4
4
4
4
5
5
5
5
5
5
149
Reproduced with permission of the copyright owner. Further reproduction prohibited without permission.

Name:
Attitudes Toward Computer Technologies
_____________ ISDS 3115 -Sec:
Please answer the following questions about your attitude toward computer technologies (i.e., word processing electronic mail, spreadsheets, database programs, statistical packages, and CD-ROM databases).
Please circle a numberfrom I to 5 ofthe following that apply where:
1 = Strongly Disagree2 = Disagree3 = Undecided4 = Agree5 = Strongly Agree
IS. I am confident about my ability to do well in a course thatrequires me to use computer technologies. I 2 3 4 5
16. I feel at ease learning about computer technologies. 1 2 3 4 5
17. I am not the type to do well with computer technologies. 1 2 3 4 5
18. The thought of using computer technologies frightens me. 1 2 3 4 5
19. Computer technologies are confusing to me. 1 2 3 4 5
20. I do not feel threatened by the impact of computertechnologies. , 1 2 3 4 5
21. 1 am anxious about computers because I don’t know whatto do if something goes wrong. 1 2 3 4 5
22. I enjoy working with computers 1 2 3 4 5
23. I feel comfortable about my ability to work withcomputer technologies. 1 2 3 4 5
150
Reproduced with permission of the copyright owner. Further reproduction prohibited without permission.

Background Knowledge Assessment
ISDS 3115 - SEC SPRING 1999
N A M E______________________________ SS#:____________________________
This is a basic background knowledge assessment. The objective is to determine your prior knowledge o f the class material. Please answer to the best o f your knowledge. This assessment will not affect your grade in the course in any way.
MULTIPLE CHOICE
1. A legacy system might be defined asa. a series of disparate mainframe based software applications.b. a group o f systems that support a company business needs.c. a system that provides information support to business processes.d. a system that provides information support to different functional areas within
a company but it is not fully integrated.
2. A company should be concern about having a Legacy System becausea. such as system does not provides support to compete in the current dynamic
marketb. the system does not support the cross-functional models o f a business.c. the system creates data redundancy within the organization.d. All o f the above
3. An Enterprise System can be defined asa. a group of software packages connected together.b. a Manufacturing and Logistics application software.c. an application package that supports core-business operational functions.d. a and c
4. Companies should integrate systems becausea. system integration allows a company to lower operating cost, decreases
quality, and facilitates cross-functional integration.b. it increases inefficiencies inherent in the functional model supported by legacy
systems, and links business processes.c. it provides competitive advantage, low customer satisfaction, and eliminates
redundancy o f data.d. an integrated system facilitates cross-functional integration, eliminates
redundancy o f data, links business processes.
151
Reproduced with permission of the copyright owner. Further reproduction prohibited without permission.

5. How would you define the SAP R/3 System?a. It is an application software.b. It is an application software that supports different functional areas o f an
organization.c. It is a modular integrated system build around best practices in a particular
industry.d. All o f the above
6. An SAP R/3 System module isa. a group o f related business processes.b. the level o f functionality in the SAP R/3 system.c. a group o f related business transactions.d. a business application within SAP R/3 System.
7. The supply chain extends froma. supplier to manufacturer.b. supplier to supplier.c. dealer to customer.d. supplier to customer.
8. SAP three-tier client/server architecture isa. a system divided into presentation, application, and database layers
interconnected.b. A system with three different servers, application, database, and tools.c. A system made up of three computers.d. All o f the above
9. What is a Client/Server system?a. A system where a Client computer accesses a Server computer over a
network.b. A system where a Server computer accesses a Client computer over a
network.c. A group o f computers interconnected on a network.d. A single-user workstation connected over a network to a server (s) that
contains database, (s)
10. The following are examples of a business process except:a. order fulfillmentb. payrollc. salesd. production scheduling
152
Reproduced with permission of the copyright owner. Further reproduction prohibited without permission.

11. A bill of material specifies all o f the following excepta. a brief description of each component in the productb. when a component is needed in the assembly processc. lot sizes and lead timesd. how many o f each component is needede. all o f the statements above are specified on the BOM
12. The Manufacturing Planning and Execution Cycle includesa. Forecasting, Demand Management, Material Masterb. Customer M aster, Forecasting, Sales and Operations Planningc. Material Requirement Planning, Forecasting, Bill o f Materiald. Forecasting, Demand Management, Material Requirement Planninge. None o f the above
13. Material Requirements Planning (MRP) is a system fora. computing economic order quantities.b. determining when to release orders.c. computing safety stocks.d. determining service levels.
14. All o f the following are major inputs to the MRP process except:a. work orders.b. the master production schedule.c. the inventory master file.d. the product structure file.e. All o f the above are major input to MRP.
15. The Master Production Schedule (MPS) specifiesa. which components a firm is to produce.b. how many components are needed.c. when the finished product is needed.d. None of the above statements are true.
153
Reproduced with permission of the copyright owner. Further reproduction prohibited without permission.
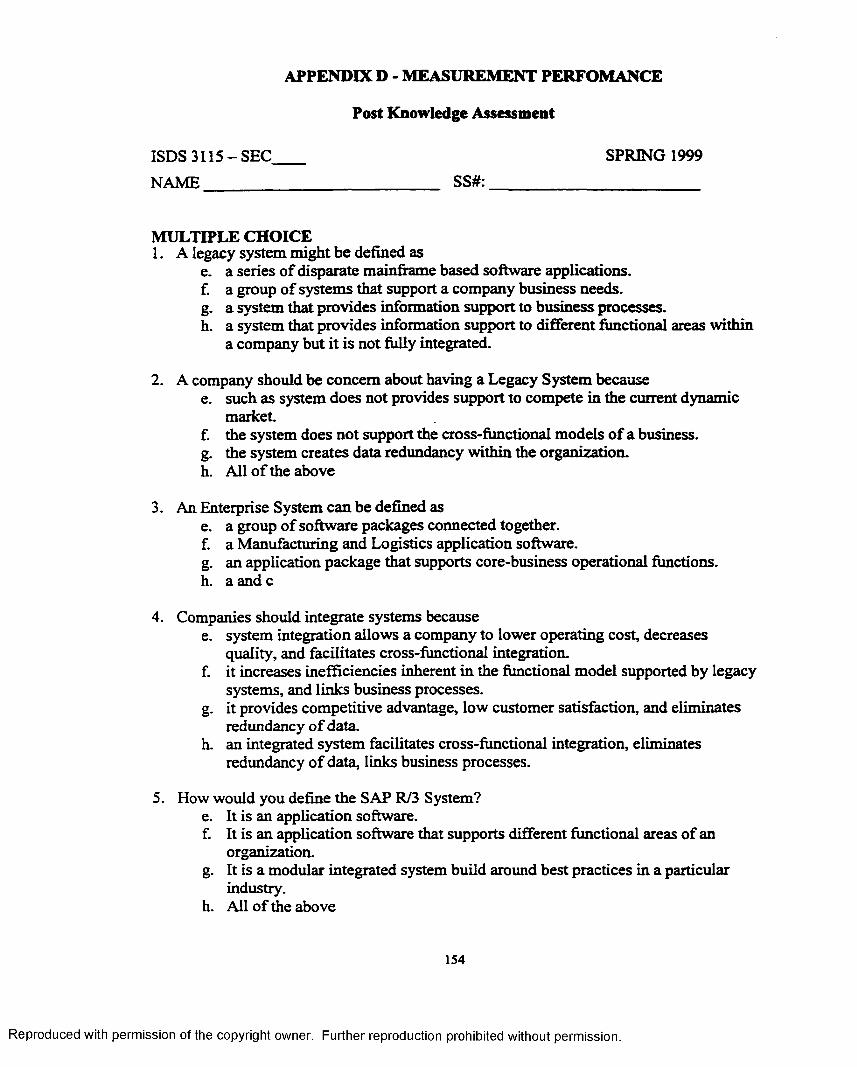
APPENDIX D - MEASUREMENT PERFOMANCE
Post Knowledge Assessment
ISDS 3115-S E C
NAME________
MULTIPLE CHOICE1. A legacy system might be defined as
e. a series of disparate mainframe based software applications.f. a group of systems that support a company business needs.g. a system that provides information support to business processes.h. a system that provides information support to different functional areas within
a company but it is not fully integrated.
2. A company should be concern about having a Legacy System becausee. such as system does not provides support to compete in the current dynamic
market.f. the system does not support the cross-functional models of a business.g. the system creates data redundancy within the organization.h. All o f the above
3. An Enterprise System can be defined ase. a group of software packages connected together.f. a Manufacturing and Logistics application software.g. an application package that supports core-business operational functions.h. a and c
4. Companies should integrate systems becausee. system integration allows a company to lower operating cost, decreases
quality, and facilitates cross-functional integration.f. it increases inefficiencies inherent in the functional model supported by legacy
systems, and links business processes.g. it provides competitive advantage, low customer satisfaction, and eliminates
redundancy o f data.h. an integrated system facilitates cross-functional integration, eliminates
redundancy o f data, links business processes.
5. How would you define the SAP R/3 System?e. It is an application software.f. It is an application software that supports different functional areas of an
organization.g. It is a modular integrated system build around best practices in a particular
industry.h. All o f the above
154
SPRING 1999SS#:
Reproduced with permission of the copyright owner. Further reproduction prohibited without permission.
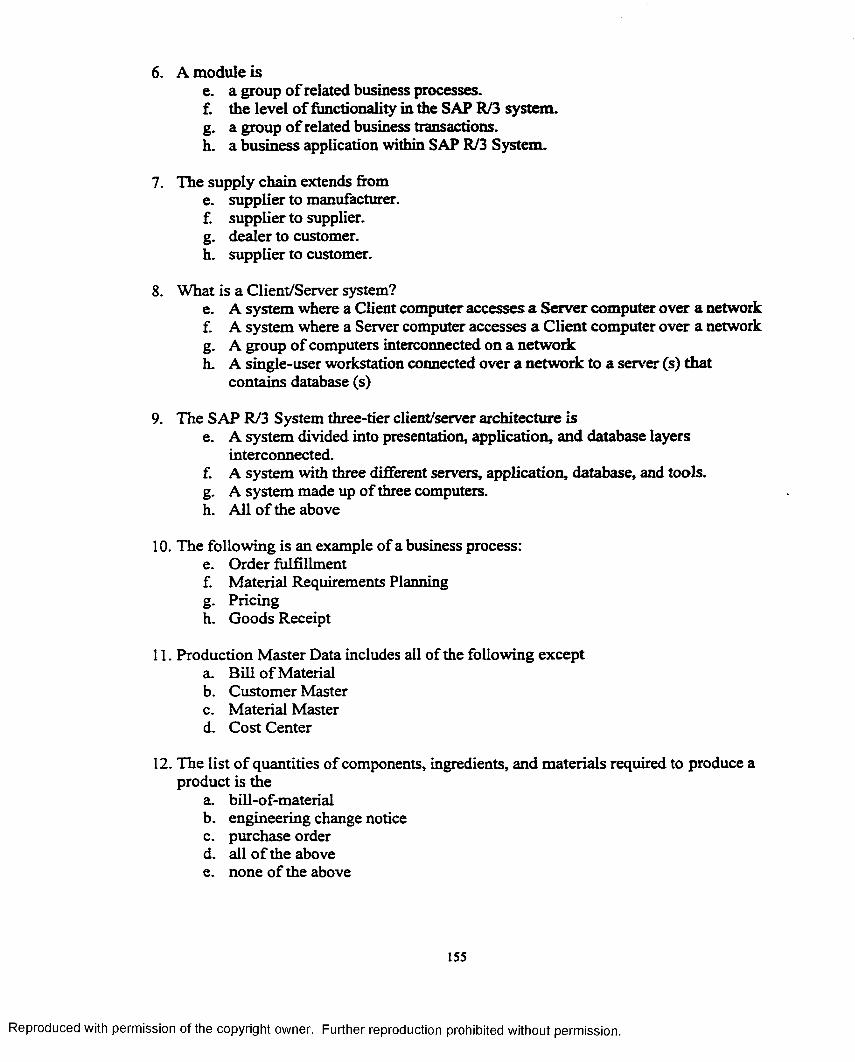
6. A module ise. a group o f related business processes.f. the level o f functionality in the SAP R/3 system.g. a group o f related business transactions.h. a business application within SAP R/3 System.
7. The supply chain extends frome. supplier to manufacturer.f. supplier to supplier.g. dealer to customer.h. supplier to customer.
8. What is a Client/Server system?e. A system where a Client computer accesses a Server computer over a networkf. A system where a Server computer accesses a Client computer over a networkg. A group o f computers interconnected on a networkh. A single-user workstation connected over a network to a server (s) that
contains database (s)
9. The SAP R/3 System three-tier client/server architecture ise. A system divided into presentation, application, and database layers
interconnected.f. A system with three different servers, application, database, and tools.g. A system made up of three computers.h. All o f the above
10. The following is an example of a business process:e. Order fulfillmentf. Material Requirements Planningg. Pricingh. Goods Receipt
11. Production Master Data includes all of the following excepta. Bill o f Materialb. Customer Masterc. Material Masterd. Cost Center
12. The list o f quantities of components, ingredients, and materials required to produce a product is the
a. bill-of-materialb. engineering change noticec. purchase orderd. all o f the abovee. none of the above
155
Reproduced with permission of the copyright owner. Further reproduction prohibited without permission.

13. The Manufacturing Planning and Execution Cycle includesf. Forecasting, Demand Management, Material Masterg. Customer M aster, Forecasting, Sales and Operations Planningh. Material Requirement Planning, Forecasting, Bill o f Materiali. Forecasting, Demand Management, Material Requirement Planning j. None o f the above
14. Material Requirements Planning (MRP) is a system fore. computing economic order quantities.f. determining when to release orders.g. computing safety stocks.h. determining service levels.
15. The Master Production Schedulea. drives the MRP process.b. provides a schedule for all component items.c. represents customer demand.d. All of the above
16. MRP cana. calculate demand for component items.b. keep track o f when component items are needed.c. generate work orders.d. generate purchase orders which incorporate lead time.e. All of the above
17. All of the following statements concerning MRP are true except:a. MRP is useful for assemble-to-order environments.b. MRP is useful for discrete demand items.c. MRP is useful when lead time is uncertain.d. MRP is designed primarily for repetitive and continuous manufacturing.e. All of the above are true
18. All of the following are major inputs to the MRP process exceptf. work orders.g. the master production schedule.h. the inventory master file.i. the product structure file.j . All of the above are major input to MRP.
19. The Master Production Schedule (MPS) specifiese. which components a firm is to produce.f. how many components are needed,g. when the finished product is needed.h. None of the above statements are true
156
Reproduced with permission of the copyright owner. Further reproduction prohibited without permission.

20. All o f the following statements concerning the Master Production Schedule are true except:
a. the MPS does not consider specific resource needs and may actually produce an infeasible schedule.
b. the quantities on the MPS represent demand forecasts, not production plans.c. the quantities on the MPS may only be predictions, not actual customer
orders.d. the quantities on the MPS may undergo many revisions before the schedule is
completed.e. All of the statements above are true
21. Which of the following is the input that is said to “drive” the MRP system?a. Inventory master fileb. Capacity requirements planc. Master production scheduled. Product structure filee. None o f the above
22. Business transactions that are included in the Manufacturing Planning and Execution process are
a. Goods Issueb. Production Order Receiptc. Purchasing Requisitiond. Production Ordere. All of the above
23. In the Sales and Operations Planning Table, the four lines of the table that can be maintained (changed) are
a. Sales, Stock Level, Production, and Days’ supply.b. Sales, Production, Target Stock Level, and Target days’ supply.c. Sales, Days’ supply, Production, and Target days’ supplyd. Sales, Production, Stock Level, and days’ supply
24. The Production Order Execution Process involvesa. Order Release, Goods Issue, Completion Confirmation, Goods Receipt, and
Order Settlement.b. Planned Order, Order Release, Goods Issue, Completion Confirmation,
Goods, and Order Settlementc. Order Release, Purchase Requisition, Goods Issue, Completion Confirmation,
and Goods Receipt.d. Order Release, Goods Issue, MPS, Goods Receipt, and Order Settlement.
157
Reproduced with permission of the copyright owner. Further reproduction prohibited without permission.

TRUE/FALSE
25. All SAP R/3 system application modules share data through the R/3 database which contains the data for all modules.
a. Trueb. False
26. When you enter data in the SAP R/3 System for any o f the modules, the data is placed in the R/3 database and is immediately available to all other R/3 application modules.
a. Trueb. False
27. A key advantage o f the SAP R/3 system is that it is both integrated using a common database and it consists o f a single robust business process.
a. Trueb. False
28. Motor Sports International (MSI) receives an order for 50 o f its 1200cc motorcycles from its wholesale customer, Cycle Concepts in Philadelphia, with a request for delivery in one month. By running a Master Production schedule (MPS), MIS determines how many and which components they need for its production plan.
a. Trueb. False
29. Independent Requirements are created by using the Sales and Operations Planning Table or by entering them directly through demand management
a. Trueb. False
30. A production plan can be generated via target stock level. As a result o f changing the target stock level, the R/3 system calculates the production quantities needed to achieve target stock levels.
a. Trueb. False
31. The quantities listed in the Stock/Requirement List (Received/required quantity field) correspond to the production plan values displayed in the planning table.
a. Trueb. False
32. Updating the entries on the SOP planning table will automatically update the entries on the Stock/requirements list.
a. Trueb. False
158
Reproduced with permission of the copyright owner. Further reproduction prohibited without permission.

33. Master Production Scheduling (MPS) generates planned orders that satisfy the independent requirement for each master schedule material. These planned orders contain the dependent requirements for the first-level components in each products’ bill o f material
a. Trueb. False
34. The difference between the stock/requirement list and the MRP list is that the Stock/requirement list displays all current stock, expected receipts, and requirements. The MRP list displays only the results o f the last planning run.
a. Trueb. False
35. Following the MPS run, the MRP list displays the independent requirements from the SOP and the planned orders that were generated in MPS to satisfy these requirements.
a. Trueb. False
36. The primary purpose o f the MRP planning run is to schedule material availability and prevents excessive inventory o f component materials.
a. Trueb. False
37. The Multi-level MRP determines the required quantity o f each component material by exploding the entire bill o f material using the quantity per to calculate the necessary quantities.
a. Trueb. False
38. The dependent requirements (Figure 1) for the MRP item (i.e., frame assembly) are generated during the MPS run of the MPS item (i.e., Bicycle).
a. Trueb. False
Figure 1
K cjcM D
W M s ( 2 ) F m t ( l )
159
Reproduced with permission of the copyright owner. Further reproduction prohibited without permission.

39. The Manufacturing Execution process is started by releasing each production order to the Shop floor.
a. Trueb. False
40. After being converted from a planned order, a production order must be released to the Shop floor before any component material is issued or any finished product is received.
a. Trueb. False
160
Reproduced with permission of the copyright owner. Further reproduction prohibited without permission.
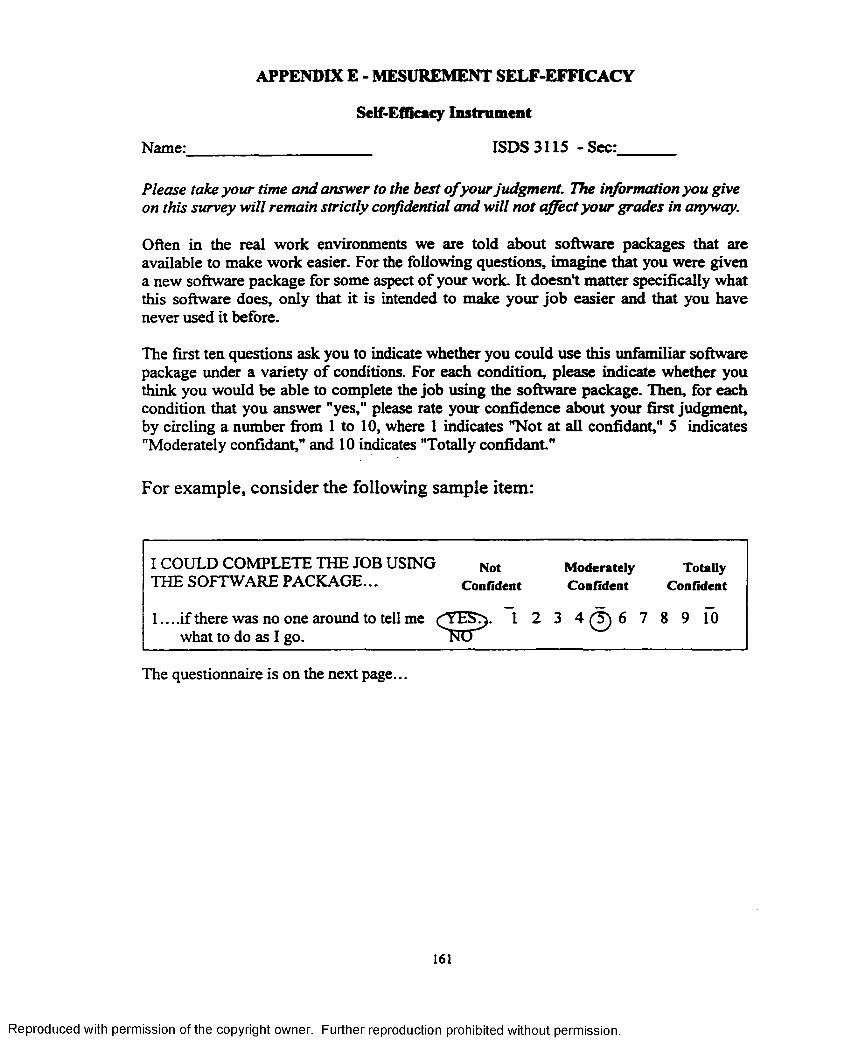
APPENDIX E - MESUREMENT SELF-EFFICACY
Self-Efficacy Instrument
Name: ISD S31I5 -Sec:
Please take your time and answer to the best o f your judgment. The information you give on this survey will remain strictly confidential and will not affect your grades in anyway.
Often in the real work environments we are told about software packages that are available to make work easier. For the following questions, imagine that you were given a new software package for some aspect of your work. It doesn't matter specifically what this software does, only that it is intended to make your job easier and that you have never used it before.
The first ten questions ask you to indicate whether you could use this unfamiliar software package under a variety o f conditions. For each condition, please indicate whether you think you would be able to complete the job using the software package. Then, for each condition that you answer "yes," please rate your confidence about your first judgment, by circling a number from 1 to 10, where 1 indicates "Not at all confidant," 5 indicates "Moderately confidant," and 10 indicates "Totally confidant."
For example, consider the following sample item:
I COULD COMPLETE THE JOB USING THE SOFTWARE PACKAGE...
NotConfident
Moderately TotallyConfident Confident
1.. ..if there was no one around to tell me what to do as I go.
}). 1 2 3 4 Q 6 7 8 9 10
The questionnaire is on the next page...
161
Reproduced with permission of the copyright owner. Further reproduction prohibited without permission.

I COULD COMPLETE THEJOB USING THE SOFTWAREPACKAGE...
1. .. .if there was no one around to tell me what to do as I go.
2. .. .if I had never used a package like it before.
3. .. .if I had only the software manuals for reference.
4. . . .if I had seen someone else using it before trying it myself.
5. ... if I could call someone for help if I got stuck.
6. ... if someone else had helped me get started.
7. if I had a lot o f time tocomplete the job for which the software was provided.
8. . . .i f I had just the built-in help facility for assistance.
9. ... if someone showed me how to do it first
10. . . .i f I had used similar packages before this one to do the same job
Not Moderately TotallyConfident Confident Confident
YES... 1 2 3 4 5 6 7 8 9 TO NO
YES... 1 2 3 4 5 6 7 8 9 10 NO
YES... 1 2 3 4 5 6 7 8 9 10 NO
YES... 1 2 3 4 5 6 7 8 9 10 NO
YES... 1 2 3 4 5 6 7 8 9 10 NO
YES... 1 2 3 4 5 6 7 8 9 10 NO
YES... 1 2 3 4 5 6 7 8 9 10 NO
YES... 1 2 3 4 5 6 7 8 9 10 NO
YES... 1 2 3 4 5 6 7 8 9 10 NO
YES... 1 2 3 4 5 6 7 8 9 10 NO
162
Reproduced with permission of the copyright owner. Further reproduction prohibited without permission.

APPENDIX F - END-USER COMPUTING SATISFACTION
Please circle the response below which best describes your feeling about the Manufacturing Planning and Execution Exercises (Assignment) with the SAP R/3 System.
where:1 = Very Low2 = Low3 = Medium4 = High5 = very High
1. The clarity and understanding o f the exercise documentation was
2. The assistance gained from the exercise documentation was
3. The match between the exercises outcome and my expectation about the exercises outcome was
4. The usefulness of the exercises to understand the lecture material is
5. The benefits o f the exercises to understanding the lecture material are
6. The time provided to complete the exercises was
7. Overall rating for the Assignment exercises content and documentation is
2
2
Please circle the response below which best describes your feeling about the System you worked with to perform the Manufacturing Planning and Execution Exercise.
where:1 = Almost Never2 = Some of the Time3 = About Haft of the Time4 = Most of the Time5 = Almost Always
8. Is the system user friendly?
9. Is the system ease to use?
10. Is the Information clear?
1 2
2
2
4
4
163
Reproduced with permission of the copyright owner. Further reproduction prohibited without permission.
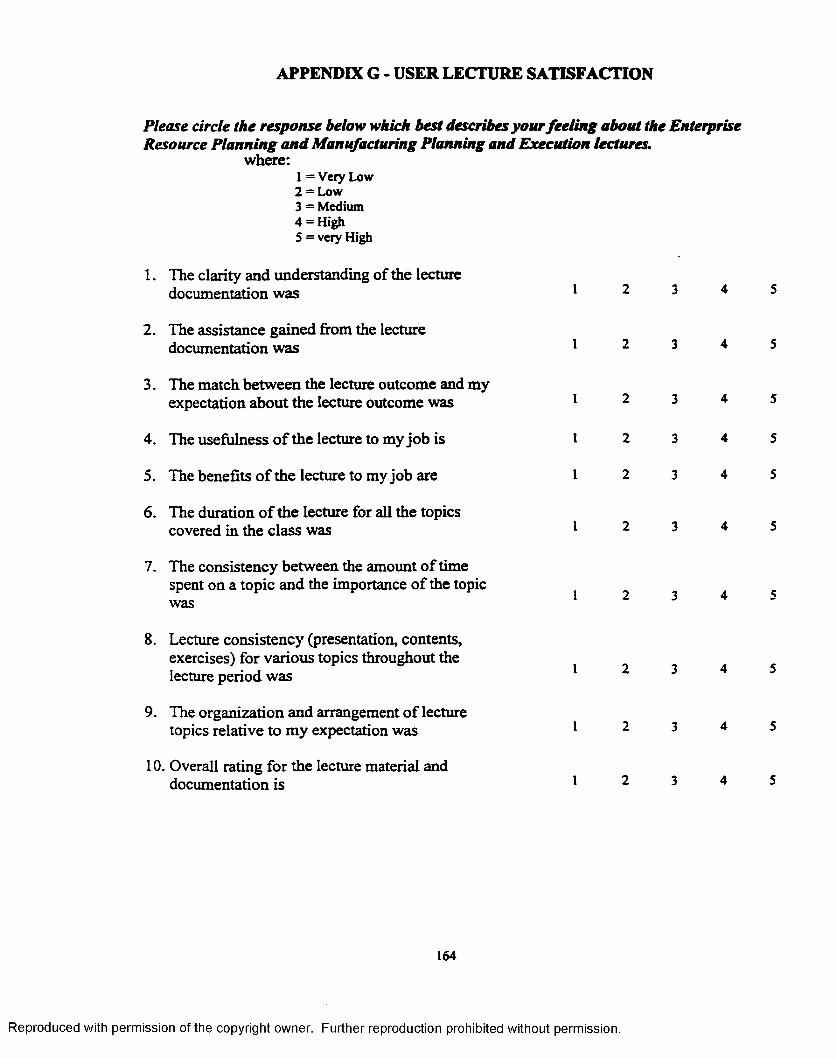
APPENDIX G - USER LECTURE SATISFACTION
Please circle the response below which best describes your feeling about the Enterprise Resource Planning and Manufacturing Planning and Execution lectures.
where:1 = Very Low2 = Low3 = Medium4 = High5 = very High
1. The clarity and understanding of the lecturedocumentation was 1 2 3 4 5
2. The assistance gained from the lecturedocumentation was 1 2 3 4 5
3. The match between the lecture outcome and myexpectation about the lecture outcome was 1 2 3 4 5
4. The usefulness o f the lecture to my job is 1 2 3 4 5
5. The benefits o f the lecture to my job are 1 2 3 4 5
6. The duration o f the lecture for all the topicscovered in the class was 1 2 3 4 5
7. The consistency between the amount of timespent on a topic and the importance o f the topic 1 2 3 4 5
8. Lecture consistency (presentation, contents, exercises) for various topics throughout the lecture period was
9. The organization and arrangement o f lecture topics relative to my expectation was
1 2 3 4 5
1 2 3 4 5
10. Overall rating for the lecture material anddocumentation is 1 2 3 4 5
164
Reproduced with permission of the copyright owner. Further reproduction prohibited without permission.
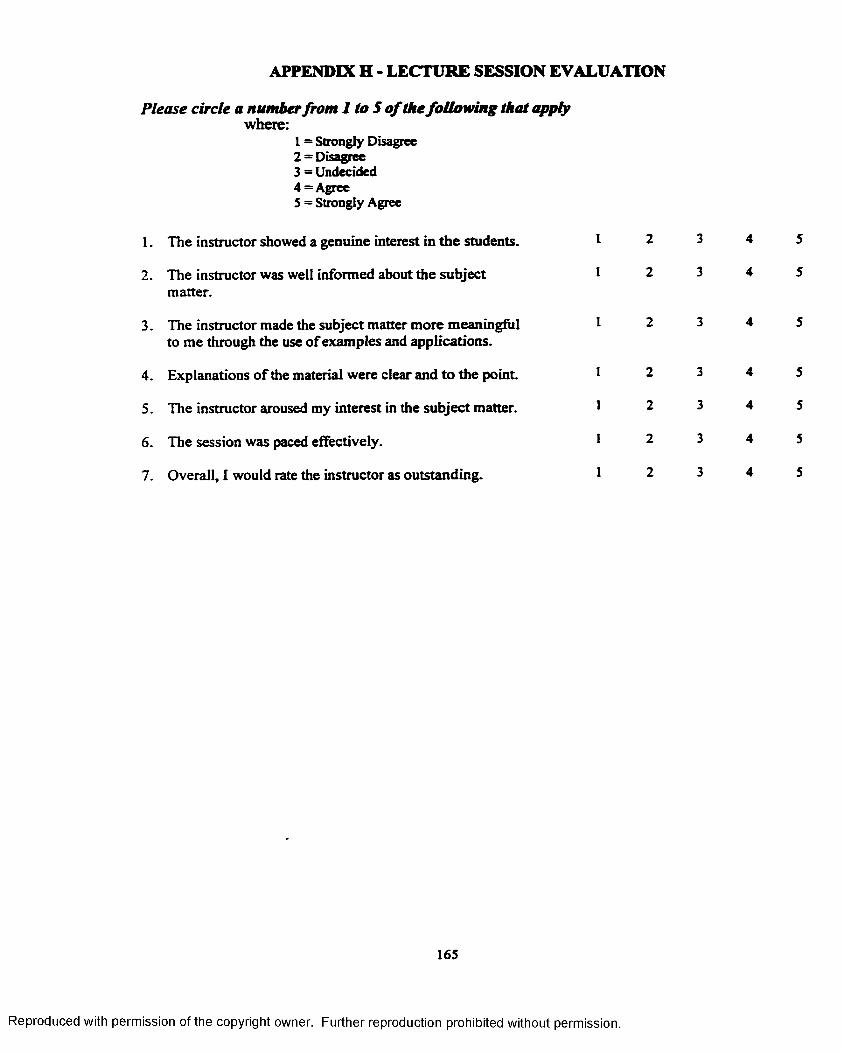
APPENDIX H - LECTURE SESSION EVALUATION
Please circle a numberfrom 1 to 5 o f thefollowing that applywhere:
1 = Strongly Disagree 2 -Disagree3 = Undecided4 = Agree5 = Strongly Agree
1. The instructor showed a genuine interest in the students.
2. The instructor was well informed about the subject matter.
3. The instructor made the subject matter more meaningful to me through the use o f examples and applications.
4. Explanations o f the material were clear and to the point.
5. The instructor aroused my interest in the subject matter.
6. The session was paced effectively.
7. Overall, I would rate the instructor as outstanding.
2
2
2
2
2
2
3
3
5
5
5
5
5
5
165
Reproduced with permission of the copyright owner. Further reproduction prohibited without permission.
VITA
The author, Jose, was bom in the Pacific Coast of Costa Rica, Golfito. He grew up
in a rural area enjoying what nature can offer.
He came to LSU in Fall 1991, to pursue graduate studies at The Department o f
Oceanography and Coastal Sciences. He graduated in 1994 with a Master o f Science
degree in Oceanography. He continued graduate studies at LSU and obtained a Master o f
Science degree in Information Systems and Decision Sciences in 1996.
Today the author is a candidate for the degree o f Doctor o f Philosophy in Business
Administration (Information Systems and Decisions Sciences). He is an assistant professor
at Florida International University, Miami. He is currently involve on research and
teaching in the areas o f Enterprise Information Systems, Analysis and Design o f
Information Systems, Business Process Reengineering, and Supply Chain Management.
166
Reproduced with permission of the copyright owner. Further reproduction prohibited without permission.

DOCTORAL EXAMINATION AND DISSERTATION REPORT
Candidate: Jose H. Noguera
Major Field: Business Administration
Title of n i»«^f«-at~ionr Effectiveness of Using an Enterprise System to
Facilitate Process-Centered Learning in Business Education
Approved:
Major Profeai
School
EXAMINING COMMITTEE:
tC-~—
Date of Kxaeination:
November 29, 1999
Reproduced with permission of the copyright owner. Further reproduction prohibited without permission.