Embed Size (px)
Citation preview
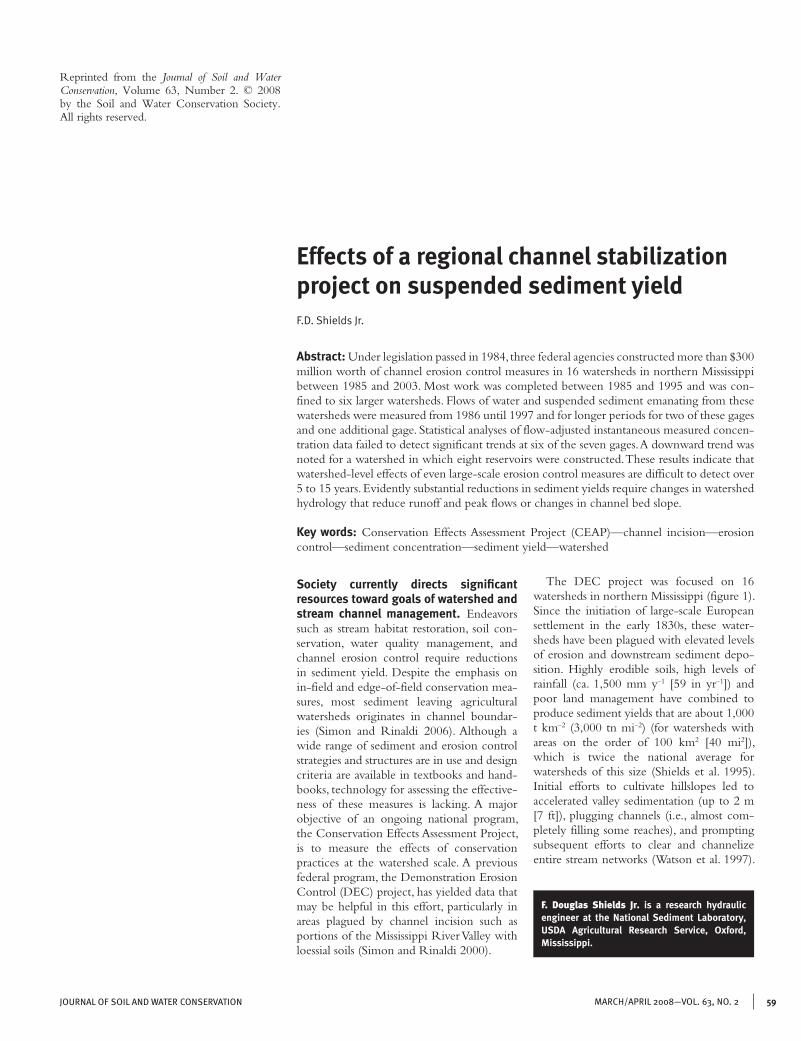
59March/april 2008—vol. 63, no. 2journal of soil and water conservation
Effects of a regional channel stabilization project on suspended sediment yieldF.D. Shields Jr.
Abstract: Under legislation passed in 1984, three federal agencies constructed more than $300 million worth of channel erosion control measures in 16 watersheds in northern Mississippi between 1985 and 2003. Most work was completed between 1985 and 1995 and was con-fined to six larger watersheds. Flows of water and suspended sediment emanating from these watersheds were measured from 1986 until 1997 and for longer periods for two of these gages and one additional gage. Statistical analyses of flow-adjusted instantaneous measured concen-tration data failed to detect significant trends at six of the seven gages. A downward trend was noted for a watershed in which eight reservoirs were constructed. These results indicate that watershed-level effects of even large-scale erosion control measures are difficult to detect over 5 to 15 years. Evidently substantial reductions in sediment yields require changes in watershed hydrology that reduce runoff and peak flows or changes in channel bed slope.
Key words: Conservation Effects Assessment Project (CEAP)—channel incision—erosion control—sediment concentration—sediment yield—watershed
Society currently directs significant resources toward goals of watershed and stream channel management. Endeavors such as stream habitat restoration, soil con-servation, water quality management, and channel erosion control require reductions in sediment yield. Despite the emphasis on in-field and edge-of-field conservation mea-sures, most sediment leaving agricultural watersheds originates in channel boundar-ies (Simon and Rinaldi 2006). Although a wide range of sediment and erosion control strategies and structures are in use and design criteria are available in textbooks and hand-books, technology for assessing the effective-ness of these measures is lacking. A major objective of an ongoing national program, the Conservation Effects Assessment Project, is to measure the effects of conservation practices at the watershed scale. A previous federal program, the Demonstration Erosion Control (DEC) project, has yielded data that may be helpful in this effort, particularly in areas plagued by channel incision such as portions of the Mississippi River Valley with loessial soils (Simon and Rinaldi 2000).
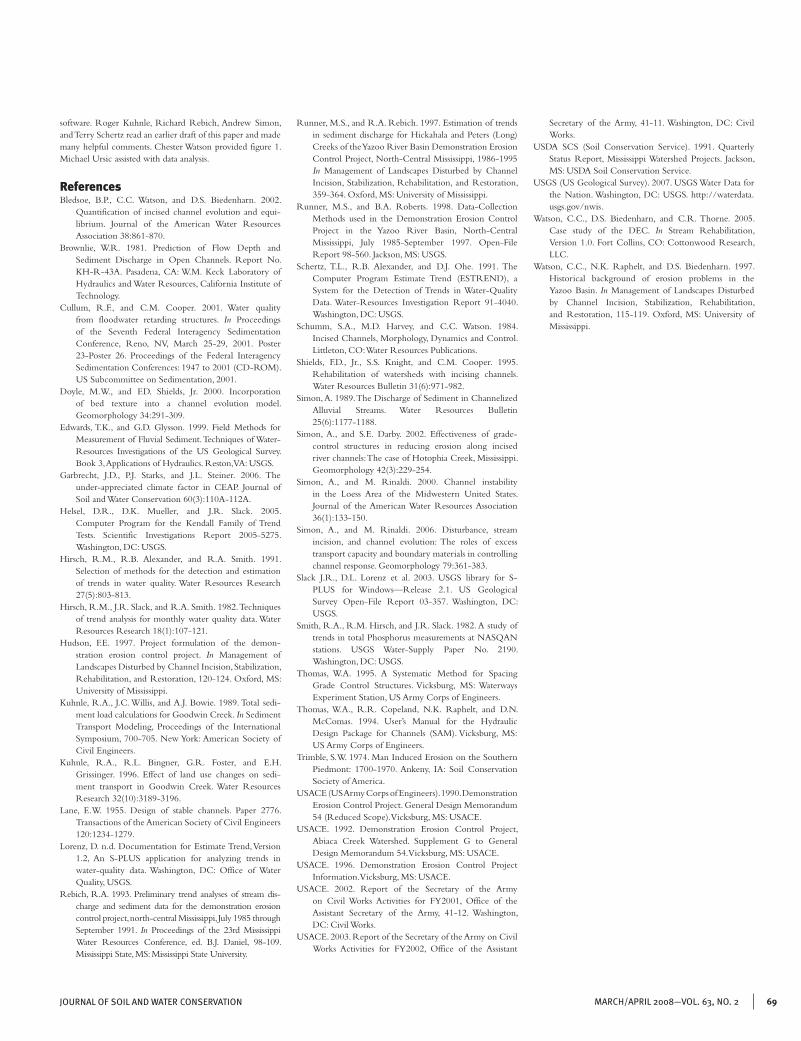
The DEC project was focused on 16 watersheds in northern Mississippi (figure 1). Since the initiation of large-scale European settlement in the early 1830s, these water-sheds have been plagued with elevated levels of erosion and downstream sediment depo-sition. Highly erodible soils, high levels of rainfall (ca. 1,500 mm y–1 [59 in yr–1]) and poor land management have combined to produce sediment yields that are about 1,000 t km–2 (3,000 tn mi–2) (for watersheds with areas on the order of 100 km2 [40 mi2]), which is twice the national average for watersheds of this size (Shields et al. 1995). Initial efforts to cultivate hillslopes led to accelerated valley sedimentation (up to 2 m [7 ft]), plugging channels (i.e., almost com-pletely filling some reaches), and prompting subsequent efforts to clear and channelize entire stream networks (Watson et al. 1997).
F. Douglas Shields Jr. is a research hydraulic engineer at the National Sediment Laboratory, USDA Agricultural Research Service, Oxford, Mississippi.
Reprinted from the Journal of Soil and Water Conservation, Volume 63, Number 2. © 2008 by the Soil and Water Conservation Society. All rights reserved.
60 journal of soil and water conservationMarch/april 2008—vol. 63, no. 2
Channelization, coupled with large, federal flood-control reservoirs that reduced flood stages, triggered headward-progressing chan-nel incision. Channel widths and depths often increased by a factor of five. Channel incision processes were typical of those observed in many other regions throughout the world and are generally described in popular con-ceptual models proposed by Schumm et al. (1984) and Simon (1989).
In response to problems created by erosion and downstream sedimentation, beginning in the 1930s a succession of federal flood- and erosion-control projects targeted the hilly
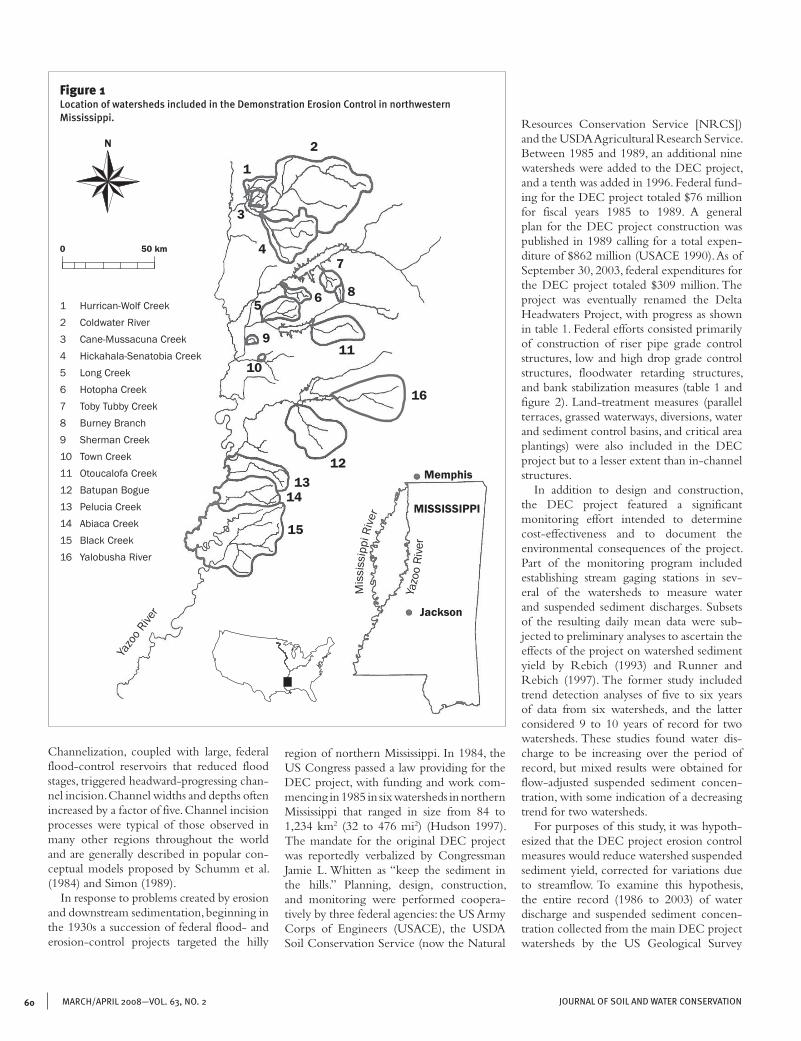
Figure 1Location of watersheds included in the Demonstration Erosion Control in northwestern Mississippi.
N
0 50km
1 Hurrican-WolfCreek2 ColdwaterRiver3 Cane-MussacunaCreek4 Hickahala-SenatobiaCreek5 LongCreek6 HotophaCreek7 TobyTubbyCreek8 BurneyBranch9 ShermanCreek10 TownCreek11 OtoucalofaCreek12 BatupanBogue13 PeluciaCreek14 AbiacaCreek15 BlackCreek16 YalobushaRiver
12
16
1314
15
1110
9
5 6
7
8
4
3
1
2
Yazo
oRive
r
Mis
siss
ippi
Rive
r
Memphis
Mississippi
Jackson
Yazo
oRi
ver
region of northern Mississippi. In 1984, the US Congress passed a law providing for the DEC project, with funding and work com-mencing in 1985 in six watersheds in northern Mississippi that ranged in size from 84 to 1,234 km2 (32 to 476 mi2) (Hudson 1997). The mandate for the original DEC project was reportedly verbalized by Congressman Jamie L. Whitten as “keep the sediment in the hills.” Planning, design, construction, and monitoring were performed coopera-tively by three federal agencies: the US Army Corps of Engineers (USACE), the USDA Soil Conservation Service (now the Natural
Resources Conservation Service [NRCS]) and the USDA Agricultural Research Service. Between 1985 and 1989, an additional nine watersheds were added to the DEC project, and a tenth was added in 1996. Federal fund-ing for the DEC project totaled $76 million for fiscal years 1985 to 1989. A general plan for the DEC project construction was published in 1989 calling for a total expen-diture of $862 million (USACE 1990). As of September 30, 2003, federal expenditures for the DEC project totaled $309 million. The project was eventually renamed the Delta Headwaters Project, with progress as shown in table 1. Federal efforts consisted primarily of construction of riser pipe grade control structures, low and high drop grade control structures, floodwater retarding structures, and bank stabilization measures (table 1 and figure 2). Land-treatment measures (parallel terraces, grassed waterways, diversions, water and sediment control basins, and critical area plantings) were also included in the DEC project but to a lesser extent than in-channel structures.
In addition to design and construction, the DEC project featured a significant monitoring effort intended to determine cost-effectiveness and to document the environmental consequences of the project. Part of the monitoring program included establishing stream gaging stations in sev-eral of the watersheds to measure water and suspended sediment discharges. Subsets of the resulting daily mean data were sub-jected to preliminary analyses to ascertain the effects of the project on watershed sediment yield by Rebich (1993) and Runner and Rebich (1997). The former study included trend detection analyses of five to six years of data from six watersheds, and the latter considered 9 to 10 years of record for two watersheds. These studies found water dis-charge to be increasing over the period of record, but mixed results were obtained for flow-adjusted suspended sediment concen-tration, with some indication of a decreasing trend for two watersheds.
For purposes of this study, it was hypoth-esized that the DEC project erosion control measures would reduce watershed suspended sediment yield, corrected for variations due to streamflow. To examine this hypothesis, the entire record (1986 to 2003) of water discharge and suspended sediment concen-tration collected from the main DEC project watersheds by the US Geological Survey
61March/april 2008—vol. 63, no. 2journal of soil and water conservation
(USGS) was considered. Mean daily values of water discharge and suspended sediment concentration were used for initial explor-atory analyses. Instantaneous measured values of water discharge and cross-sectional mean suspended sediment concentration were subjected to trend detection analysis.
Table 1Construction activities funded by Demonstration Erosion Control project in 16 northern Mississippi watersheds, 1985 to 2004.
Totalcompleted
Typeofstructure Totalplanned Asofsept.1989 AsofJune1996* Asofsept.2001† Asofsept.2002†
Highdropgradecontrolstructure 12 1 9 5 5Lowdropgradecontrolstructure 218 9 149 190 195Riserpipegradecontrolstructure 2,369 249 766 1,160 1,246Bankstabilization(km) 452 74.3 144 298 302Channelization(km) 105 12.2 29.4 24.0 25.6Smalldam‡ 72 1 9 6 7Source USACE1990 USACE1990 USACE1996 USACE2002 USACE2003*TotalsinthiscolumnincludestructuresconstructedbytheUSArmyCorpsofEngineersandbytheUSDASoilConservationService/NaturalResourcesConservationService.†TotalsinthiscolumnareforstructuresconstructedbytheUSArmyCorpsofEngineersanddonotincludethoseconstructedbytheUSDASoilConservationService/NaturalResourcesConservationService.‡ Referred to in source documents as “floodwater retarding structure.”
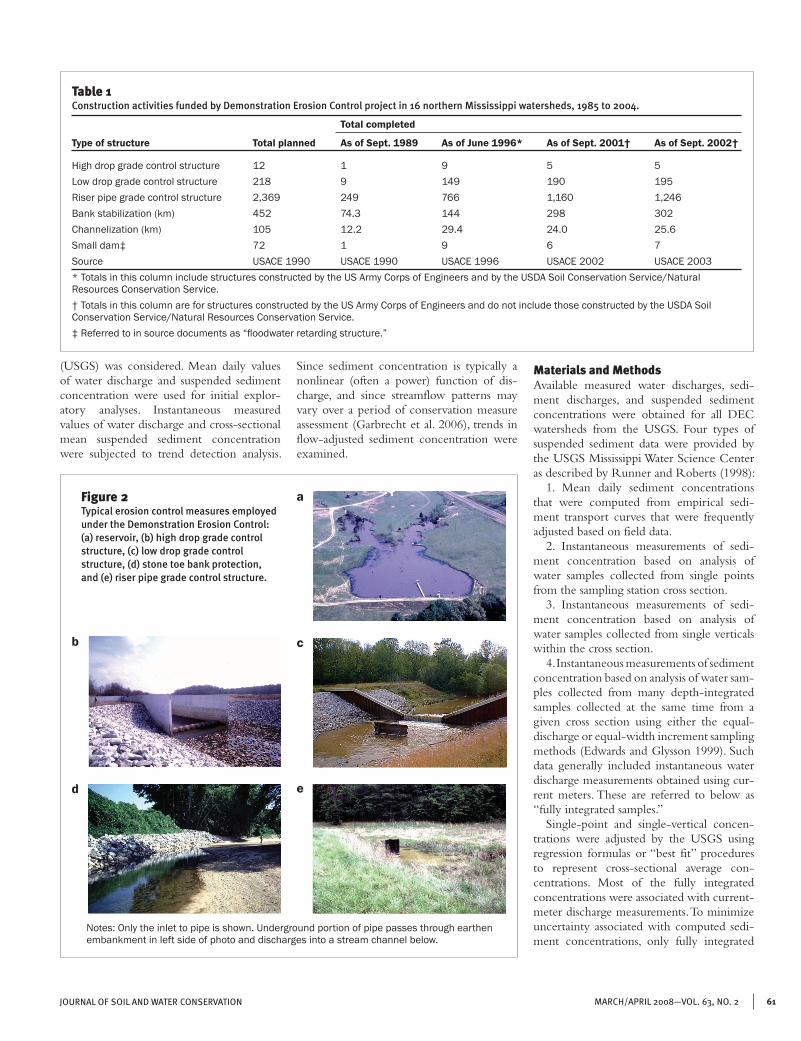
Figure 2Typical erosion control measures employed under the Demonstration Erosion Control: (a) reservoir, (b) high drop grade control structure, (c) low drop grade control structure, (d) stone toe bank protection, and (e) riser pipe grade control structure.
Notes:Onlytheinlettopipeisshown.Undergroundportionofpipepassesthroughearthenembankmentinleftsideofphotoanddischargesintoastreamchannelbelow.
a
b c
d e
Since sediment concentration is typically a nonlinear (often a power) function of dis-charge, and since streamflow patterns may vary over a period of conservation measure assessment (Garbrecht et al. 2006), trends in flow-adjusted sediment concentration were examined.
Materials and MethodsAvailable measured water discharges, sedi-ment discharges, and suspended sediment concentrations were obtained for all DEC watersheds from the USGS. Four types of suspended sediment data were provided by the USGS Mississippi Water Science Center as described by Runner and Roberts (1998):
1. Mean daily sediment concentrations that were computed from empirical sedi-ment transport curves that were frequently adjusted based on field data.
2. Instantaneous measurements of sedi-ment concentration based on analysis of water samples collected from single points from the sampling station cross section.
3. Instantaneous measurements of sedi-ment concentration based on analysis of water samples collected from single verticals within the cross section.
4. Instantaneous measurements of sediment concentration based on analysis of water sam-ples collected from many depth-integrated samples collected at the same time from a given cross section using either the equal-discharge or equal-width increment sampling methods (Edwards and Glysson 1999). Such data generally included instantaneous water discharge measurements obtained using cur-rent meters. These are referred to below as “fully integrated samples.”
Single-point and single-vertical concen-trations were adjusted by the USGS using regression formulas or “best fit” procedures to represent cross-sectional average con-centrations. Most of the fully integrated concentrations were associated with current-meter discharge measurements. To minimize uncertainty associated with computed sedi-ment concentrations, only fully integrated
62 journal of soil and water conservationMarch/april 2008—vol. 63, no. 2
Table 2Suspended sediment records which bracket major construction activity in selected Demonstration Erosion Control (DEC) watersheds.
DECstructurescompletedasof1989*/1996†
Contributingarea suspended Gradecontrol Bankprotection RiserpipesWatershed UsGsstation (km2) sedimentrecord structures(no) (km) (no)
HotophaCreek 07273100 90 1986to1997(11.2y) 2/15 4.3/9.8 26/46PetersCreek 07275530 205 1986to1996(9.8y) 10/15 11/20 45/56HickahalaCreek 07277700 313 1987to2003(16.7y) 5/34 4.3/10 87/119OtoucalofaCreek 07274252 251 1986to1997(11.3y) 0/3 23/12 31/48BatupanBogue 07285400 622 1985to1996(10.9y) 8/32 16/27 7/76HarlandCreek‡ 07287404 161 1986to2000(13.7y) 0/3 14/45 28/95AbiacaCreek 07287160 202 1991to2003(11.9y) 0/3 0 9*FromUSACE(1990).†FromUSACE(1996).‡ConstructiondataarefortheBlackCreekwatershed.SedimentrecordsareforUSGSstation07287404,HarlandCreek,asubwatershedcomprisingabout13%ofBlackCreekwatershed.
sediment concentrations for which instan-taneous measured discharges were available were used for the monotonic trend detection analyses described below. More qualitative step-trend analyses were completed using mean daily discharges and mean daily sus-pended sediment concentrations (data type 1 above). These data are generally available to the public via the Internet (USGS 2007).
Suspended sediment records were avail-able for sites located near the outlets of five of the original six watersheds for the period commencing shortly after initiation of the DEC project (i.e., 1986 to 1987) and end-ing 10 to 11 years later (1996 to 1997). A sixth watershed, Black Creek, is represented in table 2 by a gage located on Harland Creek, a key tributary. Much of the DEC construction in these six watersheds was also completed during this period (tables 1 and 2). In addition, longer periods of record were available for two gages, Hickahala Creek and Harland Creek (table 2). An extensive data set was also available for a seventh watershed, Abiaca Creek, but these measurements covered a later period, 1991 to 2003 (table 2). Sediment control work in Abiaca Creek watershed was also performed later than for the other six watersheds and involved a much different structural approach (using levee setbacks to create a natural floodway and sediment sink; USACE 1992). Gaging sites for all seven watersheds are within reaches with sand (D50 ~ 0.3 mm) or sand and gravel beds (gravel D50 ~ 20 mm) downstream from incising channel networks (Doyle and Shields 2000).
Data were screened by examining time series plots of mean daily discharge and mean daily sediment concentration and load,
susp
ende
dse
dim
entc
once
ntra
tion
(mg
L–1)
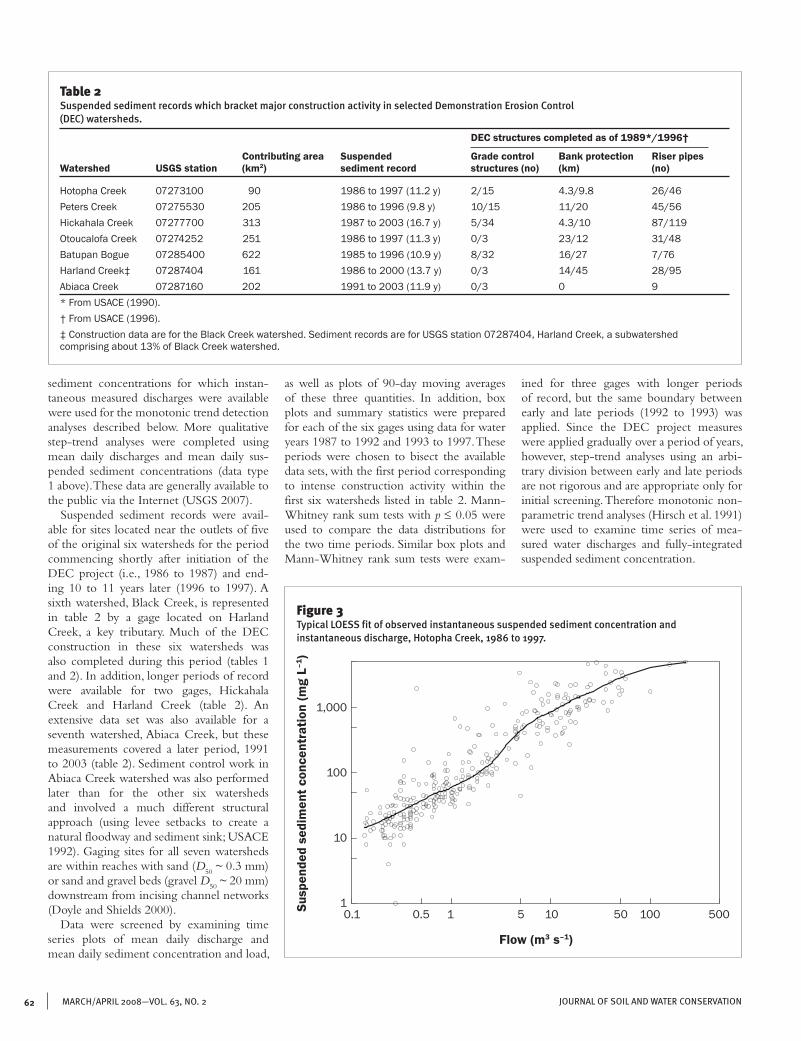
Figure 3Typical LOESS fit of observed instantaneous suspended sediment concentration and instantaneous discharge, Hotopha Creek, 1986 to 1997.
1,000
100
10
1 0.1 0.5 1 5 10 50 100 500
Flow(m3s–1)
as well as plots of 90-day moving averages of these three quantities. In addition, box plots and summary statistics were prepared for each of the six gages using data for water years 1987 to 1992 and 1993 to 1997. These periods were chosen to bisect the available data sets, with the first period corresponding to intense construction activity within the first six watersheds listed in table 2. Mann-Whitney rank sum tests with p ≤ 0.05 were used to compare the data distributions for the two time periods. Similar box plots and Mann-Whitney rank sum tests were exam-
ined for three gages with longer periods of record, but the same boundary between early and late periods (1992 to 1993) was applied. Since the DEC project measures were applied gradually over a period of years, however, step-trend analyses using an arbi-trary division between early and late periods are not rigorous and are appropriate only for initial screening. Therefore monotonic non-parametric trend analyses (Hirsch et al. 1991) were used to examine time series of mea-sured water discharges and fully-integrated suspended sediment concentration.
63March/april 2008—vol. 63, no. 2journal of soil and water conservation
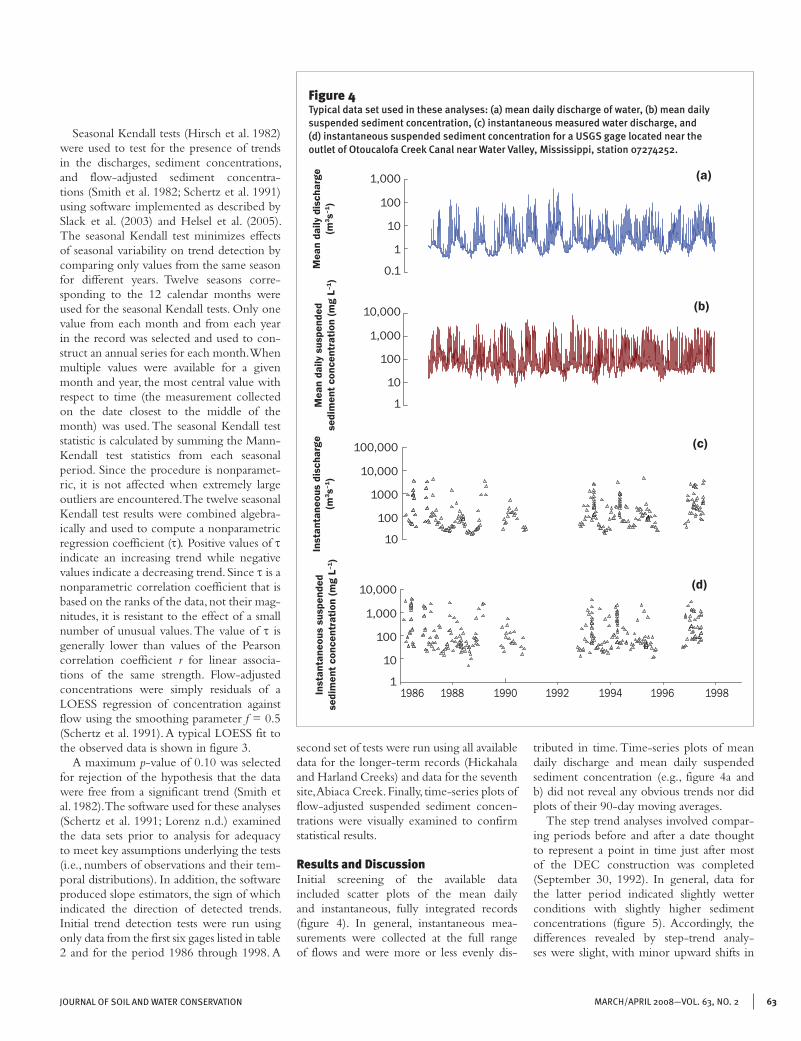
Figure 4Typical data set used in these analyses: (a) mean daily discharge of water, (b) mean daily suspended sediment concentration, (c) instantaneous measured water discharge, and (d) instantaneous suspended sediment concentration for a USGS gage located near the outlet of Otoucalofa Creek Canal near Water Valley, Mississippi, station 07274252.
Mea
nda
ilyd
isch
arge
(m
3 s–1
)M
ean
daily
sus
pend
ed
sedi
men
tcon
cent
ratio
n(m
gL–1
)in
stan
tane
ous
disc
harg
e(m
3 s–1
)in
stan
tane
ous
susp
ende
dse
dim
entc
once
ntra
tion
(mg
L–1)
1,000
100
10
1
0.1
10,000
1,000
100
10
1
100,000
10,000
1000
100
10
10,000
1,000
100
10
11986 1988 1990 1992 1994 1996 1998
(a)
(b)
(c)
(d)
Seasonal Kendall tests (Hirsch et al. 1982) were used to test for the presence of trends in the discharges, sediment concentrations, and flow-adjusted sediment concentra-tions (Smith et al. 1982; Schertz et al. 1991) using software implemented as described by Slack et al. (2003) and Helsel et al. (2005). The seasonal Kendall test minimizes effects of seasonal variability on trend detection by comparing only values from the same season for different years. Twelve seasons corre-sponding to the 12 calendar months were used for the seasonal Kendall tests. Only one value from each month and from each year in the record was selected and used to con-struct an annual series for each month. When multiple values were available for a given month and year, the most central value with respect to time (the measurement collected on the date closest to the middle of the month) was used. The seasonal Kendall test statistic is calculated by summing the Mann-Kendall test statistics from each seasonal period. Since the procedure is nonparamet-ric, it is not affected when extremely large outliers are encountered. The twelve seasonal Kendall test results were combined algebra-ically and used to compute a nonparametric regression coefficient (τ). Positive values of τ indicate an increasing trend while negative values indicate a decreasing trend. Since τ is a nonparametric correlation coefficient that is based on the ranks of the data, not their mag-nitudes, it is resistant to the effect of a small number of unusual values. The value of τ is generally lower than values of the Pearson correlation coefficient r for linear associa-tions of the same strength. Flow-adjusted concentrations were simply residuals of a LOESS regression of concentration against flow using the smoothing parameter f = 0.5 (Schertz et al. 1991). A typical LOESS fit to the observed data is shown in figure 3.
A maximum p-value of 0.10 was selected for rejection of the hypothesis that the data were free from a significant trend (Smith et al. 1982). The software used for these analyses (Schertz et al. 1991; Lorenz n.d.) examined the data sets prior to analysis for adequacy to meet key assumptions underlying the tests (i.e., numbers of observations and their tem-poral distributions). In addition, the software produced slope estimators, the sign of which indicated the direction of detected trends. Initial trend detection tests were run using only data from the first six gages listed in table 2 and for the period 1986 through 1998. A
second set of tests were run using all available data for the longer-term records (Hickahala and Harland Creeks) and data for the seventh site, Abiaca Creek. Finally, time-series plots of flow-adjusted suspended sediment concen-trations were visually examined to confirm statistical results.
Results and DiscussionInitial screening of the available data included scatter plots of the mean daily and instantaneous, fully integrated records (figure 4). In general, instantaneous mea-surements were collected at the full range of flows and were more or less evenly dis-
tributed in time. Time-series plots of mean daily discharge and mean daily suspended sediment concentration (e.g., figure 4a and b) did not reveal any obvious trends nor did plots of their 90-day moving averages.
The step trend analyses involved compar-ing periods before and after a date thought to represent a point in time just after most of the DEC construction was completed (September 30, 1992). In general, data for the latter period indicated slightly wetter conditions with slightly higher sediment concentrations (figure 5). Accordingly, the differences revealed by step-trend analy-ses were slight, with minor upward shifts in
64 journal of soil and water conservationMarch/april 2008—vol. 63, no. 2
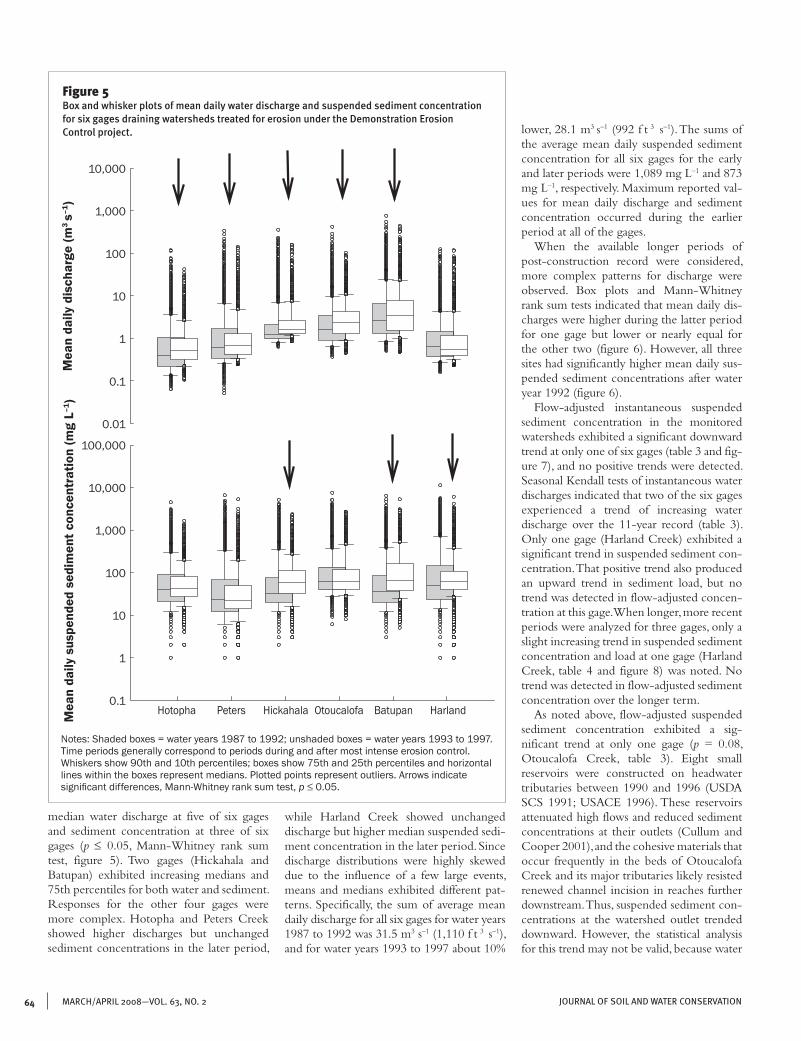
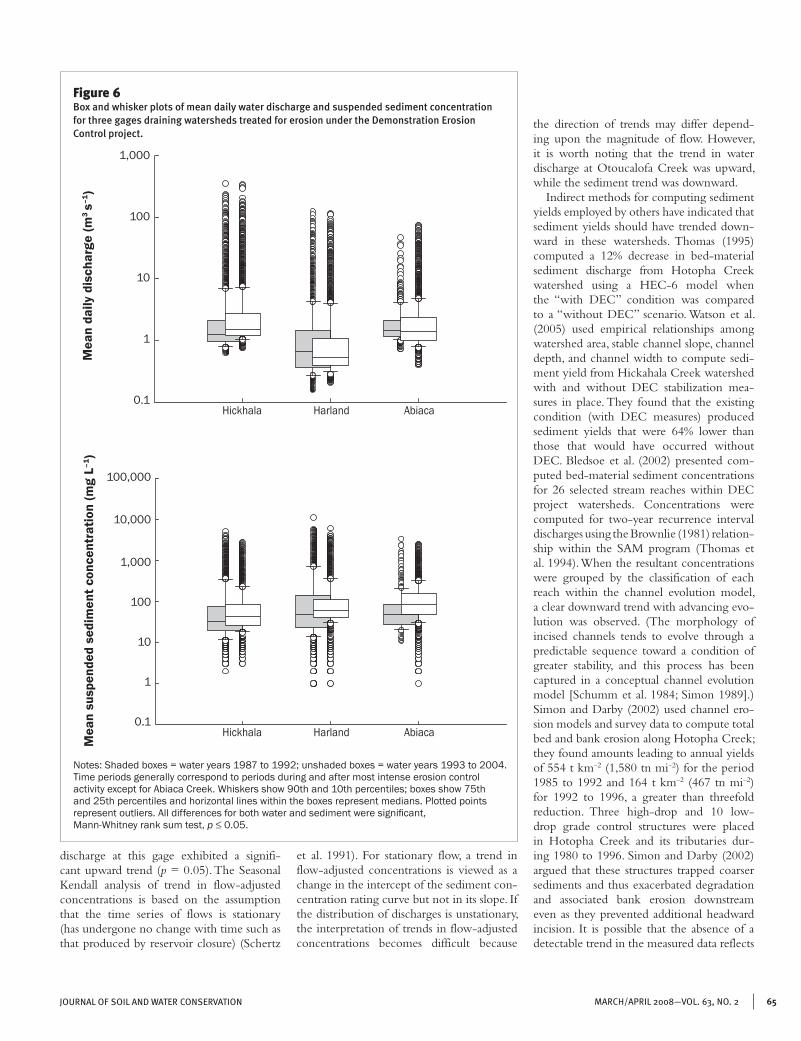
Figure 5Box and whisker plots of mean daily water discharge and suspended sediment concentration for six gages draining watersheds treated for erosion under the Demonstration Erosion Control project.
Notes:Shadedboxes=wateryears1987to1992;unshadedboxes=wateryears1993to1997.Timeperiodsgenerallycorrespondtoperiodsduringandaftermostintenseerosioncontrol.Whiskersshow90thand10thpercentiles;boxesshow75thand25thpercentilesandhorizontallineswithintheboxesrepresentmedians.Plottedpointsrepresentoutliers.Arrowsindicatesignificant differences, Mann-Whitney rank sum test, p ≤ 0.05.
Mea
nda
ilyd
isch
arge
(m3
s–1)
Mea
nda
ilys
uspe
nded
sed
imen
tcon
cent
ratio
n(m
gL–1
)
10,000
1,000
100
10
1
0.1
0.01
100,000
10,000
1,000
100
10
1
0.1Hotopha Peters Hickahala Otoucalofa Batupan Harland
median water discharge at five of six gages and sediment concentration at three of six gages (p ≤ 0.05, Mann-Whitney rank sum test, figure 5). Two gages (Hickahala and Batupan) exhibited increasing medians and 75th percentiles for both water and sediment. Responses for the other four gages were more complex. Hotopha and Peters Creek showed higher discharges but unchanged sediment concentrations in the later period,
while Harland Creek showed unchanged discharge but higher median suspended sedi-ment concentration in the later period. Since discharge distributions were highly skewed due to the influence of a few large events, means and medians exhibited different pat-terns. Specifically, the sum of average mean daily discharge for all six gages for water years 1987 to 1992 was 31.5 m3 s–1 (1,110 f t 3 s–1), and for water years 1993 to 1997 about 10%
lower, 28.1 m3 s–1 (992 f t 3 s–1). The sums of the average mean daily suspended sediment concentration for all six gages for the early and later periods were 1,089 mg L–1 and 873 mg L–1, respectively. Maximum reported val-ues for mean daily discharge and sediment concentration occurred during the earlier period at all of the gages.
When the available longer periods of post-construction record were considered, more complex patterns for discharge were observed. Box plots and Mann-Whitney rank sum tests indicated that mean daily dis-charges were higher during the latter period for one gage but lower or nearly equal for the other two (figure 6). However, all three sites had significantly higher mean daily sus-pended sediment concentrations after water year 1992 (figure 6).
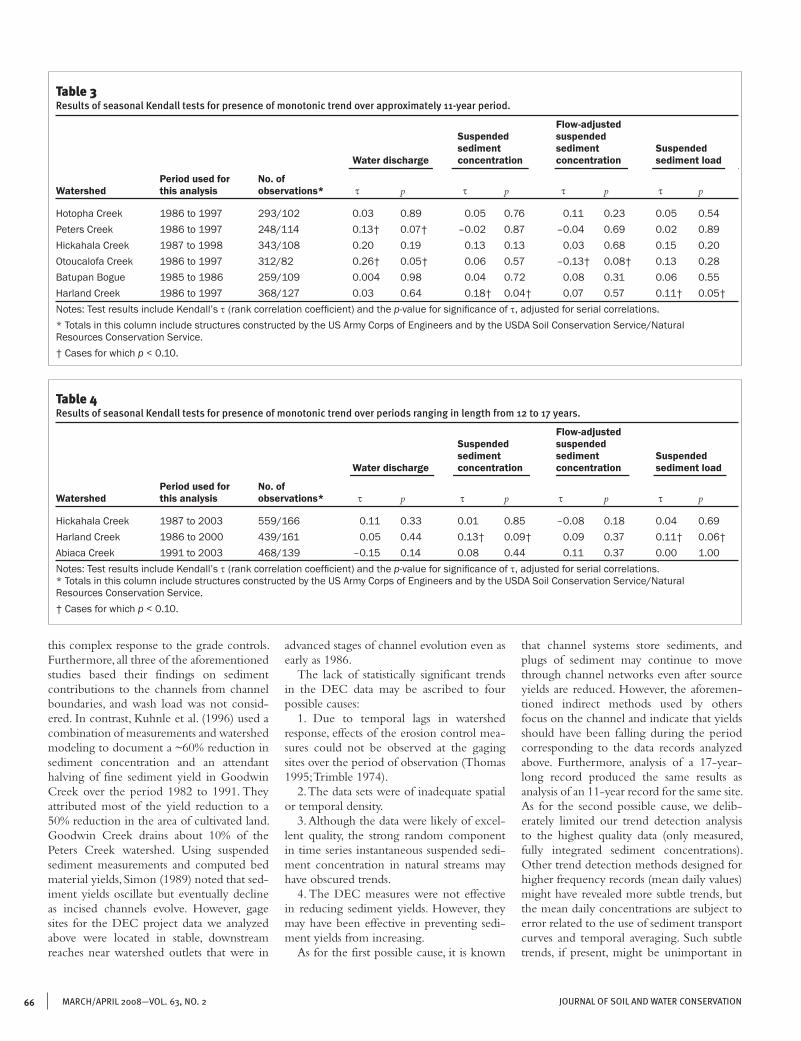
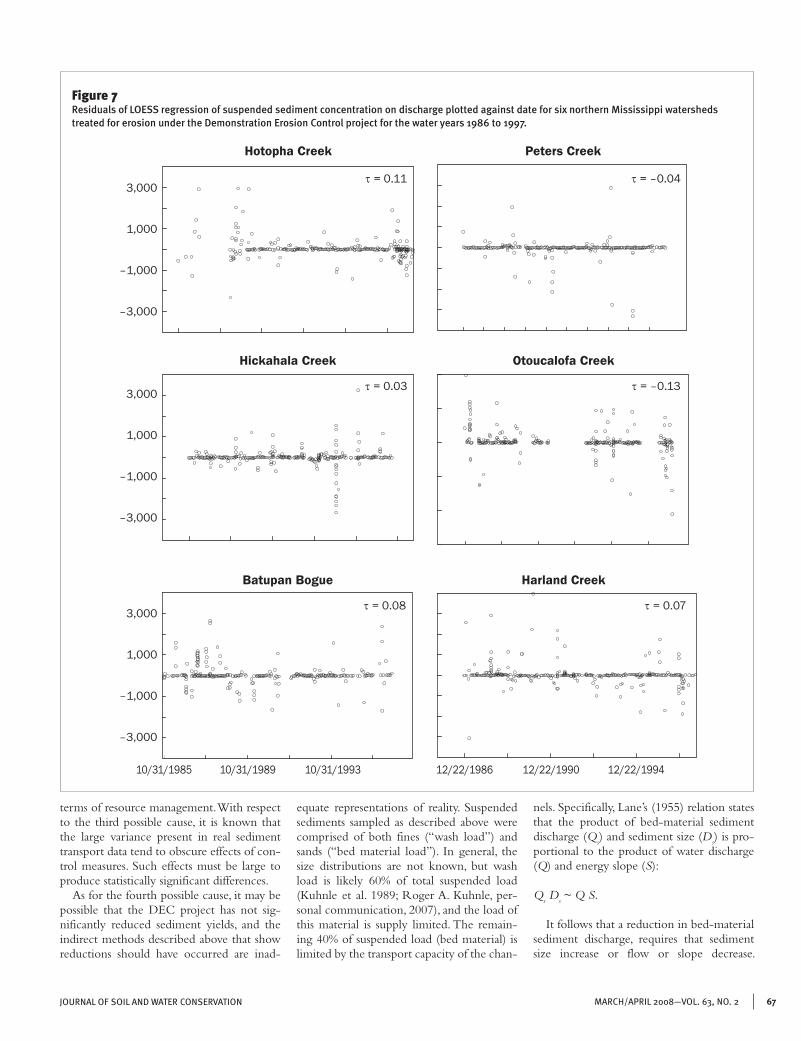
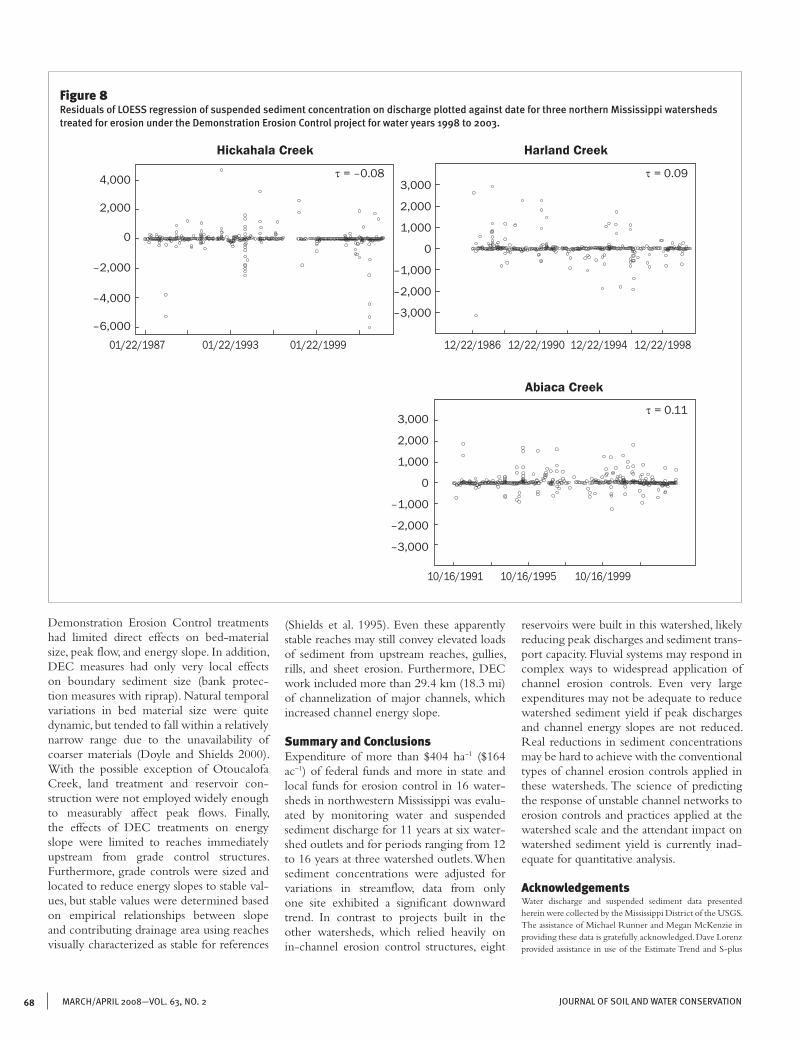
Flow-adjusted instantaneous suspended sediment concentration in the monitored watersheds exhibited a significant downward trend at only one of six gages (table 3 and fig-ure 7), and no positive trends were detected. Seasonal Kendall tests of instantaneous water discharges indicated that two of the six gages experienced a trend of increasing water discharge over the 11-year record (table 3). Only one gage (Harland Creek) exhibited a significant trend in suspended sediment con-centration. That positive trend also produced an upward trend in sediment load, but no trend was detected in flow-adjusted concen-tration at this gage. When longer, more recent periods were analyzed for three gages, only a slight increasing trend in suspended sediment concentration and load at one gage (Harland Creek, table 4 and figure 8) was noted. No trend was detected in flow-adjusted sediment concentration over the longer term.
As noted above, flow-adjusted suspended sediment concentration exhibited a sig-nificant trend at only one gage (p = 0.08, Otoucalofa Creek, table 3). Eight small reservoirs were constructed on headwater tributaries between 1990 and 1996 (USDA SCS 1991; USACE 1996). These reservoirs attenuated high flows and reduced sediment concentrations at their outlets (Cullum and Cooper 2001), and the cohesive materials that occur frequently in the beds of Otoucalofa Creek and its major tributaries likely resisted renewed channel incision in reaches further downstream. Thus, suspended sediment con-centrations at the watershed outlet trended downward. However, the statistical analysis for this trend may not be valid, because water
65March/april 2008—vol. 63, no. 2journal of soil and water conservation
Figure 6Box and whisker plots of mean daily water discharge and suspended sediment concentration for three gages draining watersheds treated for erosion under the Demonstration Erosion Control project.
Notes:Shadedboxes=wateryears1987to1992;unshadedboxes=wateryears1993to2004.TimeperiodsgenerallycorrespondtoperiodsduringandaftermostintenseerosioncontrolactivityexceptforAbiacaCreek.Whiskersshow90thand10thpercentiles;boxesshow75thand25thpercentilesandhorizontallineswithintheboxesrepresentmedians.Plottedpointsrepresent outliers. All differences for both water and sediment were significant, Mann-Whitneyranksumtest,p ≤ 0.05.
Mea
nda
ilyd
isch
arge
(m3
s–1)
Mea
nsu
spen
ded
sedi
men
tcon
cent
ratio
n(m
gL–1
)
1,000
100
10
1
0.1
100,000
10,000
1,000
100
10
1
0.1Hickhala Harland Abiaca
Hickhala Harland Abiaca
discharge at this gage exhibited a signifi-cant upward trend (p = 0.05). The Seasonal Kendall analysis of trend in flow-adjusted concentrations is based on the assumption that the time series of flows is stationary (has undergone no change with time such as that produced by reservoir closure) (Schertz
et al. 1991). For stationary flow, a trend in flow-adjusted concentrations is viewed as a change in the intercept of the sediment con-centration rating curve but not in its slope. If the distribution of discharges is unstationary, the interpretation of trends in flow-adjusted concentrations becomes difficult because
the direction of trends may differ depend-ing upon the magnitude of flow. However, it is worth noting that the trend in water discharge at Otoucalofa Creek was upward, while the sediment trend was downward.
Indirect methods for computing sediment yields employed by others have indicated that sediment yields should have trended down-ward in these watersheds. Thomas (1995) computed a 12% decrease in bed-material sediment discharge from Hotopha Creek watershed using a HEC-6 model when the “with DEC” condition was compared to a “without DEC” scenario. Watson et al. (2005) used empirical relationships among watershed area, stable channel slope, channel depth, and channel width to compute sedi-ment yield from Hickahala Creek watershed with and without DEC stabilization mea-sures in place. They found that the existing condition (with DEC measures) produced sediment yields that were 64% lower than those that would have occurred without DEC. Bledsoe et al. (2002) presented com-puted bed-material sediment concentrations for 26 selected stream reaches within DEC project watersheds. Concentrations were computed for two-year recurrence interval discharges using the Brownlie (1981) relation-ship within the SAM program (Thomas et al. 1994). When the resultant concentrations were grouped by the classification of each reach within the channel evolution model, a clear downward trend with advancing evo-lution was observed. (The morphology of incised channels tends to evolve through a predictable sequence toward a condition of greater stability, and this process has been captured in a conceptual channel evolution model [Schumm et al. 1984; Simon 1989].) Simon and Darby (2002) used channel ero-sion models and survey data to compute total bed and bank erosion along Hotopha Creek; they found amounts leading to annual yields of 554 t km–2 (1,580 tn mi–2) for the period 1985 to 1992 and 164 t km–2 (467 tn mi–2) for 1992 to 1996, a greater than threefold reduction. Three high-drop and 10 low-drop grade control structures were placed in Hotopha Creek and its tributaries dur-ing 1980 to 1996. Simon and Darby (2002) argued that these structures trapped coarser sediments and thus exacerbated degradation and associated bank erosion downstream even as they prevented additional headward incision. It is possible that the absence of a detectable trend in the measured data reflects
66 journal of soil and water conservationMarch/april 2008—vol. 63, no. 2
Table 3Results of seasonal Kendall tests for presence of monotonic trend over approximately 11-year period.
Flow-adjusted suspended suspended sediment sediment suspended Waterdischarge concentration concentration sedimentload
periodusedfor No.ofWatershed thisanalysis observations* τ p τ p τ p τ p
HotophaCreek 1986to1997 293/102 0.03 0.89 0.05 0.76 0.11 0.23 0.05 0.54PetersCreek 1986to1997 248/114 0.13† 0.07† –0.02 0.87 –0.04 0.69 0.02 0.89HickahalaCreek 1987to1998 343/108 0.20 0.19 0.13 0.13 0.03 0.68 0.15 0.20OtoucalofaCreek 1986to1997 312/82 0.26† 0.05† 0.06 0.57 –0.13† 0.08† 0.13 0.28BatupanBogue 1985to1986 259/109 0.004 0.98 0.04 0.72 0.08 0.31 0.06 0.55HarlandCreek 1986to1997 368/127 0.03 0.64 0.18† 0.04† 0.07 0.57 0.11† 0.05†Notes:TestresultsincludeKendall’sτ (rank correlation coefficient) and the p-value for significance of τ,adjustedforserialcorrelations.*TotalsinthiscolumnincludestructuresconstructedbytheUSArmyCorpsofEngineersandbytheUSDASoilConservationService/NaturalResourcesConservationService.†Casesforwhichp<0.10.
this complex response to the grade controls. Furthermore, all three of the aforementioned studies based their findings on sediment contributions to the channels from channel boundaries, and wash load was not consid-ered. In contrast, Kuhnle et al. (1996) used a combination of measurements and watershed modeling to document a ~60% reduction in sediment concentration and an attendant halving of fine sediment yield in Goodwin Creek over the period 1982 to 1991. They attributed most of the yield reduction to a 50% reduction in the area of cultivated land. Goodwin Creek drains about 10% of the Peters Creek watershed. Using suspended sediment measurements and computed bed material yields, Simon (1989) noted that sed-iment yields oscillate but eventually decline as incised channels evolve. However, gage sites for the DEC project data we analyzed above were located in stable, downstream reaches near watershed outlets that were in
advanced stages of channel evolution even as early as 1986.
The lack of statistically significant trends in the DEC data may be ascribed to four possible causes:
1. Due to temporal lags in watershed response, effects of the erosion control mea-sures could not be observed at the gaging sites over the period of observation (Thomas 1995; Trimble 1974).
2. The data sets were of inadequate spatial or temporal density.
3. Although the data were likely of excel-lent quality, the strong random component in time series instantaneous suspended sedi-ment concentration in natural streams may have obscured trends.
4. The DEC measures were not effective in reducing sediment yields. However, they may have been effective in preventing sedi-ment yields from increasing.
As for the first possible cause, it is known
Table 4Results of seasonal Kendall tests for presence of monotonic trend over periods ranging in length from 12 to 17 years.
Flow-adjusted suspended suspended sediment sediment suspended Waterdischarge concentration concentration sedimentload
periodusedfor No.ofWatershed thisanalysis observations* τ p τ p τ p τ p
HickahalaCreek 1987to2003 559/166 0.11 0.33 0.01 0.85 –0.08 0.18 0.04 0.69HarlandCreek 1986to2000 439/161 0.05 0.44 0.13† 0.09† 0.09 0.37 0.11† 0.06†AbiacaCreek 1991to2003 468/139 –0.15 0.14 0.08 0.44 0.11 0.37 0.00 1.00Notes:TestresultsincludeKendall’sτ (rank correlation coefficient) and the p-value for significance of τ,adjustedforserialcorrelations.*TotalsinthiscolumnincludestructuresconstructedbytheUSArmyCorpsofEngineersandbytheUSDASoilConservationService/NaturalResourcesConservationService.†Casesforwhichp<0.10.
that channel systems store sediments, and plugs of sediment may continue to move through channel networks even after source yields are reduced. However, the aforemen-tioned indirect methods used by others focus on the channel and indicate that yields should have been falling during the period corresponding to the data records analyzed above. Furthermore, analysis of a 17-year-long record produced the same results as analysis of an 11-year record for the same site. As for the second possible cause, we delib-erately limited our trend detection analysis to the highest quality data (only measured, fully integrated sediment concentrations). Other trend detection methods designed for higher frequency records (mean daily values) might have revealed more subtle trends, but the mean daily concentrations are subject to error related to the use of sediment transport curves and temporal averaging. Such subtle trends, if present, might be unimportant in
67March/april 2008—vol. 63, no. 2journal of soil and water conservation
Figure 7Residuals of LOESS regression of suspended sediment concentration on discharge plotted against date for six northern Mississippi watersheds treated for erosion under the Demonstration Erosion Control project for the water years 1986 to 1997.
3,000
1,000
–1,000
–3,000
3,000
1,000
–1,000
–3,000
3,000
1,000
–1,000
–3,000
HotophaCreek petersCreek
HickahalaCreek OtoucalofaCreek
τ=0.11 τ=–0.04
τ=0.03 τ=–0.13
BatupanBogue HarlandCreek
τ=0.08 τ=0.07
10/31/1985 10/31/1989 10/31/1993 12/22/1986 12/22/1990 12/22/1994
terms of resource management. With respect to the third possible cause, it is known that the large variance present in real sediment transport data tend to obscure effects of con-trol measures. Such effects must be large to produce statistically significant differences.
As for the fourth possible cause, it may be possible that the DEC project has not sig-nificantly reduced sediment yields, and the indirect methods described above that show reductions should have occurred are inad-
equate representations of reality. Suspended sediments sampled as described above were comprised of both fines (“wash load”) and sands (“bed material load”). In general, the size distributions are not known, but wash load is likely 60% of total suspended load (Kuhnle et al. 1989; Roger A. Kuhnle, per-sonal communication, 2007), and the load of this material is supply limited. The remain-ing 40% of suspended load (bed material) is limited by the transport capacity of the chan-
nels. Specifically, Lane’s (1955) relation states that the product of bed-material sediment discharge (Q
s) and sediment size (D
s) is pro-
portional to the product of water discharge (Q) and energy slope (S):
Qs D
s ~ Q S.
It follows that a reduction in bed-material sediment discharge, requires that sediment size increase or flow or slope decrease.
68 journal of soil and water conservationMarch/april 2008—vol. 63, no. 2
τ=0.09
τ=0.11
12/22/1998
Figure 8Residuals of LOESS regression of suspended sediment concentration on discharge plotted against date for three northern Mississippi watersheds treated for erosion under the Demonstration Erosion Control project for water years 1998 to 2003.
4,000
2,000
0
–2,000
–4,000
–6,000
HickahalaCreek HarlandCreek
AbiacaCreek
01/22/1987 01/22/1993 01/22/1999
3,000
2,000
1,000
0
–1,000
–2,000
–3,000
12/22/1986 12/22/1990 12/22/1994
3,000
2,000
1,000
0
–1,000
–2,000
–3,000
10/16/1991 10/16/1995 10/16/1999
Demonstration Erosion Control treatments had limited direct effects on bed-material size, peak flow, and energy slope. In addition, DEC measures had only very local effects on boundary sediment size (bank protec-tion measures with riprap). Natural temporal variations in bed material size were quite dynamic, but tended to fall within a relatively narrow range due to the unavailability of coarser materials (Doyle and Shields 2000). With the possible exception of Otoucalofa Creek, land treatment and reservoir con-struction were not employed widely enough to measurably affect peak flows. Finally, the effects of DEC treatments on energy slope were limited to reaches immediately upstream from grade control structures. Furthermore, grade controls were sized and located to reduce energy slopes to stable val-ues, but stable values were determined based on empirical relationships between slope and contributing drainage area using reaches visually characterized as stable for references
(Shields et al. 1995). Even these apparently stable reaches may still convey elevated loads of sediment from upstream reaches, gullies, rills, and sheet erosion. Furthermore, DEC work included more than 29.4 km (18.3 mi) of channelization of major channels, which increased channel energy slope.
Summary and ConclusionsExpenditure of more than $404 ha–1 ($164 ac–1) of federal funds and more in state and local funds for erosion control in 16 water-sheds in northwestern Mississippi was evalu-ated by monitoring water and suspended sediment discharge for 11 years at six water-shed outlets and for periods ranging from 12 to 16 years at three watershed outlets. When sediment concentrations were adjusted for variations in streamflow, data from only one site exhibited a significant downward trend. In contrast to projects built in the other watersheds, which relied heavily on in-channel erosion control structures, eight
reservoirs were built in this watershed, likely reducing peak discharges and sediment trans-port capacity. Fluvial systems may respond in complex ways to widespread application of channel erosion controls. Even very large expenditures may not be adequate to reduce watershed sediment yield if peak discharges and channel energy slopes are not reduced. Real reductions in sediment concentrations may be hard to achieve with the conventional types of channel erosion controls applied in these watersheds. The science of predicting the response of unstable channel networks to erosion controls and practices applied at the watershed scale and the attendant impact on watershed sediment yield is currently inad-equate for quantitative analysis.
AcknowledgementsWater discharge and suspended sediment data presented herein were collected by the Mississippi District of the USGS. The assistance of Michael Runner and Megan McKenzie in providing these data is gratefully acknowledged. Dave Lorenz provided assistance in use of the Estimate Trend and S-plus
τ=–0.08
69March/april 2008—vol. 63, no. 2journal of soil and water conservation
software. Roger Kuhnle, Richard Rebich, Andrew Simon, and Terry Schertz read an earlier draft of this paper and made many helpful comments. Chester Watson provided figure 1. Michael Ursic assisted with data analysis.
ReferencesBledsoe, B.P., C.C. Watson, and D.S. Biedenharn. 2002.
Quantification of incised channel evolution and equi-librium. Journal of the American Water Resources Association 38:861-870.
Brownlie, W.R. 1981. Prediction of Flow Depth and Sediment Discharge in Open Channels. Report No. KH-R-43A. Pasadena, CA: W.M. Keck Laboratory of Hydraulics and Water Resources, California Institute of Technology.
Cullum, R.F., and C.M. Cooper. 2001. Water quality from floodwater retarding structures. In Proceedings of the Seventh Federal Interagency Sedimentation Conference, Reno, NV, March 25-29, 2001. Poster 23-Poster 26. Proceedings of the Federal Interagency Sedimentation Conferences: 1947 to 2001 (CD-ROM). US Subcommittee on Sedimentation, 2001.
Doyle, M.W., and F.D. Shields, Jr. 2000. Incorporation of bed texture into a channel evolution model. Geomorphology 34:291-309.
Edwards, T.K., and G.D. Glysson. 1999. Field Methods for Measurement of Fluvial Sediment. Techniques of Water-Resources Investigations of the US Geological Survey. Book 3, Applications of Hydraulics. Reston, VA: USGS.
Garbrecht, J.D., P.J. Starks, and J.L. Steiner. 2006. The under-appreciated climate factor in CEAP. Journal of Soil and Water Conservation 60(3):110A-112A.
Helsel, D.R., D.K. Mueller, and J.R. Slack. 2005. Computer Program for the Kendall Family of Trend Tests. Scientific Investigations Report 2005-5275. Washington, DC: USGS.
Hirsch, R.M., R.B. Alexander, and R.A. Smith. 1991. Selection of methods for the detection and estimation of trends in water quality. Water Resources Research 27(5):803-813.
Hirsch, R.M., J.R. Slack, and R.A. Smith. 1982. Techniques of trend analysis for monthly water quality data. Water Resources Research 18(1):107-121.
Hudson, F.E. 1997. Project formulation of the demon-stration erosion control project. In Management of Landscapes Disturbed by Channel Incision, Stabilization, Rehabilitation, and Restoration, 120-124. Oxford, MS: University of Mississippi.
Kuhnle, R.A., J.C. Willis, and A.J. Bowie. 1989. Total sedi-ment load calculations for Goodwin Creek. In Sediment Transport Modeling, Proceedings of the International Symposium, 700-705. New York: American Society of Civil Engineers.
Kuhnle, R.A., R.L. Bingner, G.R. Foster, and E.H. Grissinger. 1996. Effect of land use changes on sedi-ment transport in Goodwin Creek. Water Resources Research 32(10):3189-3196.
Lane, E.W. 1955. Design of stable channels. Paper 2776. Transactions of the American Society of Civil Engineers 120:1234-1279.
Lorenz, D. n.d. Documentation for Estimate Trend, Version 1.2, An S-PLUS application for analyzing trends in water-quality data. Washington, DC: Office of Water Quality, USGS.
Rebich, R.A. 1993. Preliminary trend analyses of stream dis-charge and sediment data for the demonstration erosion control project, north-central Mississippi, July 1985 through September 1991. In Proceedings of the 23rd Mississippi Water Resources Conference, ed. B.J. Daniel, 98-109. Mississippi State, MS: Mississippi State University.
Runner, M.S., and R.A. Rebich. 1997. Estimation of trends in sediment discharge for Hickahala and Peters (Long) Creeks of the Yazoo River Basin Demonstration Erosion Control Project, North-Central Mississippi, 1986-1995 In Management of Landscapes Disturbed by Channel Incision, Stabilization, Rehabilitation, and Restoration, 359-364. Oxford, MS: University of Mississippi.
Runner, M.S., and B.A. Roberts. 1998. Data-Collection Methods used in the Demonstration Erosion Control Project in the Yazoo River Basin, North-Central Mississippi, July 1985-September 1997. Open-File Report 98-560. Jackson, MS: USGS.
Schertz, T.L., R.B. Alexander, and D.J. Ohe. 1991. The Computer Program Estimate Trend (ESTREND), a System for the Detection of Trends in Water-Quality Data. Water-Resources Investigation Report 91-4040. Washington, DC: USGS.
Schumm, S.A., M.D. Harvey, and C.C. Watson. 1984. Incised Channels, Morphology, Dynamics and Control. Littleton, CO: Water Resources Publications.
Shields, F.D., Jr., S.S. Knight, and C.M. Cooper. 1995. Rehabilitation of watersheds with incising channels. Water Resources Bulletin 31(6):971-982.
Simon, A. 1989. The Discharge of Sediment in Channelized Alluvial Streams. Water Resources Bulletin 25(6):1177-1188.
Simon, A., and S.E. Darby. 2002. Effectiveness of grade-control structures in reducing erosion along incised river channels: The case of Hotophia Creek, Mississippi. Geomorphology 42(3):229-254.
Simon, A., and M. Rinaldi. 2000. Channel instability in the Loess Area of the Midwestern United States. Journal of the American Water Resources Association 36(1):133-150.
Simon, A., and M. Rinaldi. 2006. Disturbance, stream incision, and channel evolution: The roles of excess transport capacity and boundary materials in controlling channel response. Geomorphology 79:361-383.
Slack J.R., D.L. Lorenz et al. 2003. USGS library for S-PLUS for Windows—Release 2.1. US Geological Survey Open-File Report 03-357. Washington, DC: USGS.
Smith, R.A., R.M. Hirsch, and J.R. Slack. 1982. A study of trends in total Phosphorus measurements at NASQAN stations. USGS Water-Supply Paper No. 2190. Washington, DC: USGS.
Thomas, W.A. 1995. A Systematic Method for Spacing Grade Control Structures. Vicksburg, MS: Waterways Experiment Station, US Army Corps of Engineers.
Thomas, W.A., R.R. Copeland, N.K. Raphelt, and D.N. McComas. 1994. User’s Manual for the Hydraulic Design Package for Channels (SAM). Vicksburg, MS:US Army Corps of Engineers.
Trimble, S.W. 1974. Man Induced Erosion on the Southern Piedmont: 1700-1970. Ankeny, IA: Soil Conservation Society of America.
USACE (US Army Corps of Engineers). 1990. Demonstration Erosion Control Project. General Design Memorandum 54 (Reduced Scope). Vicksburg, MS: USACE.
USACE. 1992. Demonstration Erosion Control Project, Abiaca Creek Watershed. Supplement G to General Design Memorandum 54. Vicksburg, MS: USACE.
USACE. 1996. Demonstration Erosion Control Project Information. Vicksburg, MS: USACE.
USACE. 2002. Report of the Secretary of the Army on Civil Works Activities for FY2001, Office of the Assistant Secretary of the Army, 41-12. Washington, DC: Civil Works.
USACE. 2003. Report of the Secretary of the Army on Civil Works Activities for FY2002, Office of the Assistant
Secretary of the Army, 41-11. Washington, DC: Civil Works.
USDA SCS (Soil Conservation Service). 1991. Quarterly Status Report, Mississippi Watershed Projects. Jackson, MS: USDA Soil Conservation Service.
USGS (US Geological Survey). 2007. USGS Water Data for the Nation. Washington, DC: USGS. http://waterdata.usgs.gov/nwis.
Watson, C.C., D.S. Biedenharn, and C.R. Thorne. 2005. Case study of the DEC. In Stream Rehabilitation, Version 1.0. Fort Collins, CO: Cottonwood Research, LLC.
Watson, C.C., N.K. Raphelt, and D.S. Biedenharn. 1997. Historical background of erosion problems in the Yazoo Basin. In Management of Landscapes Disturbed by Channel Incision, Stabilization, Rehabilitation, and Restoration, 115-119. Oxford, MS: University of Mississippi.