Embed Size (px)
Citation preview

doi: 10.3319/TAO.2011.03.03.01(A)
* Corresponding author E-mail: [email protected]
Terr. Atmos. Ocean. Sci., Vol. 22, No. 4, 403-420, August 2011
Effects of Cloud Parameterization on Radiation and Precipitation: A Comparison Between Single-Moment Microphysics and
Double-Moment Microphysics
Seoung Soo Lee1, * and Leo J. Donner 2
1 NOAA/ESRL, Chemical Sciences Division, Boulder, Colorado, USA 2 Geophysical Fluid Dynamics Laboratory, Princeton University, Princeton, New Jersey, USA
Received 3 July 2010, accepted 3 March 2011
ABStRACt
This study compares a single-moment microphysics scheme to a double-moment microphysics scheme using four ob-served cases of a mesoscale cloud system. Previous studies comparing a single-moment microphysics scheme to a double-moment microphysics scheme have focused on microphysical processes or overall dynamics, precipitation and morphology of cloud systems. However, they have not focused on how the different representation of microphysical processes between a single- and double-moment microphysics scheme affects precipitation. This study shifts its focus from that of previous stud-ies to the effect of the different representation of microphysics on precipitation. In addition, this study examines the effect of the different representation of microphysical processes on different radiation budgets between single- and double-moment microphysics schemes.
The temporal evolution of precipitation simulated by a single-moment microphysics scheme is significantly different from that by a double-moment microphysics scheme in this study. This is mostly due to different physical representations of key processes (i.e., autoconversion, saturation, and nucleation). Also, a simulation by a single-moment microphysics scheme results in different radiation budgets compared to a double-moment microphysics scheme. More reflection of incident solar radiation in a simulation with a double-moment microphysics scheme than that with a single-moment microphysics scheme is simulated.
Key words: Single-moment microphysics, Double-moment microphysics, PrecipitationCitation: Lee, S. S. and L. J. Donner, 2011: Effects of cloud parameterization on radiation and precipitation: A comparison between single-moment micro-physics and double-moment microphysics. Terr. Atmos. Ocean. Sci., 22, 403-420, doi: 10.3319/TAO.2011.03.03.01(A)
1. IntRoDuCtIon
In bulk microphysics schemes, the prediction of both the mass and number of droplets and crystals as advected quantities enables the prediction of their sizes, for an as-sumed form of the particle size distribution. Such schemes are referred to as the “double-moment microphysics.” Schemes predicting only the mass of the particles and (gen-erally) diagnosing the number of cloud particles from pre-scribed sizes are referred to as the “single-moment micro-physics.”
The immediate radiative impact of clouds depends on the size as well as the mass of their particles. The par-
ticle size also influences cloud lifetime and spatial extent through the preferential sedimentation of larger particles and through the coagulation of cloud particles to form pre-cipitation. Hence, the double-moment microphysics can provide more rigorous solutions for aerosol-cloud interac-tions, a source of the large uncertainties in the prediction of climate changes, than single-moment microphysics: the prediction of the particle number in the double-moment mi-crophysics enables the explicit simulation of the effect of changing aerosol properties on the size of cloud particles (and thus on radiation and precipitation), while the pre-scribed size of single-moment microphysics does not vary with the changing aerosol properties. Although some of single-moment schemes predict the size by using empirical relations between aerosol and cloud-particle numbers, this

Seoung Soo Lee & Leo J. Donner404
prediction is not able to consider aerosol properties as ex-plicitly as double-moment schemes. Thus, this prediction is not able to provide solutions for aerosol-cloud interactions as rigorously as double-moment schemes.
In the last few years, some general circulation mod-els (GCMs) and cloud-system resolving models (CSRMs) migrated from single-moment microphysics to double-moment microphysics (Lohmann et al. 2007; Morrison and Gettelman 2008; Salzmann et al. 2010). This represents ef-forts toward the development of more physically-based and self-consistent cloud models to better assess the effect of aerosol on clouds and thus climate. Changes in the micro-physics parameterization (from single-moment microphys-ics to double-moment microphysics) lead to different cloud simulations, with different radiative cloud properties and precipitation which in turn affect hydrological and energy circulations. It is desirable to analyze how these changes affect cloud simulations and an agreement between the simulations and observation through studies which compare the single-moment microphysics with the double-moment microphysics as is performed by Morrison et al. (2009) and Straka et al. (2005, 2007). Morrison et al. (2009) focused on the effect of the different representation of rain evapora-tion between a double-moment microphysics and a single-moment microphysics on the structure of a squall line. They examined this effect on the dynamics and morphology of convective and stratiform regions in a squall line, which is a mesoscale cloud system driven by deep convection. Straka et al. (2005, 2007) examined differences in the conservation of hydrometeor number concentrations between a double-moment microphysics and a single-moment microphysics. In this paper, we also compare double-moment microphys-ics with single-moment microphysics for simulated me-soscale cloud systems; however, our focus shifts from that of Morrison et al. (2009) and Straka et al. (2005, 2007). We focus on the identification of the role of different physical representations of key microphysical processes in differ-ences in simulated precipitation between double-moment microphysics and single-moment microphysics. Also, we examine the effect of different physical representations of microphysical processes (between a double-moment micro-physics and single-moment microphysics) on radiation. The identification of the role the different representations of key processes play in precipitation is partly motivated by the fact that more sophisticated microphysics schemes gener-ally raise computational costs. Examining how the differ-ent representations of key processes affect simulations and focusing on the improvement of their physical representa-tions should lead to an efficient and accurate parameteriza-tion for a better simulation of precipitation. Also, this study evaluates single- and double-moment microphysics via a comparison with observed precipitation and radiation. The comparison of the different schemes with observation re-veals how different representations of physical processes af-
fect the agreement between the simulations and observation. This identifies weaknesses and strengths of each scheme, which can be useful for the development of microphysics parameterization in terms of a better simulation of precipita-tion and radiation.
2. CSRM2.1 Dynamics, turbulence, and Radiation
For numerical experiments, the Weather Research and Forecasting (WRF) model (Michalakes et al. 2001) is used as a nonhydrostatic compressible model. Detailed equations of the dynamical core of WRF are described by Klemp et al. (2007). Hong and Pan’s (1996) scheme, which includes non-gradient flux for heat and moisture and calculates ver-tical eddy diffusion, is used for delineating the planetary boundary layer. For radiation, a simplified version of the Geophysical Fluid Dynamics Laboratory (GFDL) radiation code is incorporated into the WRF (Freidenreich and Ra-maswamy 1999). Effective sizes of cloud liquid and cloud ice are predicted using assumed size distributions (see sec-tion 2.2 for assumed size distributions).
2.2 Double-Moment Microphysics
To represent microphysical processes, the WRF is modified to use the double-moment bulk representation of Phillips et al. (2007). The size distribution of cloud liquid and cloud ice (x = c, i) obeys a gamma distribution:
expn D n D D,x x xp
x x0x m= -^ ^h h (1)
where Dx is the equivalent spherical diameter and n (Dx) dDx is the number concentration (or density) of particles in the size range dDx. Also, λx is the slope, nx, 0 is the intercept, and px is the shape parameter of the distribution:
p qp n
14 6
xx x
x x x31
mt r
C
C= +
+^
^h
h> H (2)
n n p1,x x a xp
x01 xt m C= ++^ ^h h (3)
Here, Γ is the Gamma function, xt , nx and qx are the par-ticle bulk density, number mixing ratio (particle number per unit air mass, which is in kg-1) and mass mixing ratio, respectively. at is air density. pi and pc are set to unity and 3.5, respectively, based on field experiments described in Phillips et al. (2007). The linearized scheme that predicts the in-cloud supersaturation and diffusional growth of cloud particles is adopted. This linearized scheme solves equa-tions for the evolution of the water-vapor mixing ratio and
A Comparison Between Bulk-Microphysics Schemes 405
temperature by considering diffusional growth of both liq-uid and solid hydrometeors and is described in more detail in Appendix in Phillips et al. (2007). For precipitable hydro-meteors (snow, graupel, and rain) the exponential form of the size distribution in the scheme used by Lin et al. (1983) is applied. The sedimentation of cloud ice is taken into ac-count. The microphysics is the single-moment, predicting hydrometeor mass only, for snow, graupel, and rain and the double-moment, predicting hydrometeor mass and num-ber both, for cloud liquid and cloud ice. Autoconversion of droplets to rain is performed in the same manner as present-ed by Eq. (50) in Lin et al. (1983), except that the threshold on the cloud-liquid mixing ratio is replaced by the prod-uct of the predicted droplet number mixing ratio (kg-1) and the mass of a droplet of a critical size (in diameter), Dw, auto (20 μm). Once cloud-liquid mixing ratio exceeds the thresh-old, rain is formed through this autoconversion scheme; see Lin et al. (1983) for details. Accretion of cloud liquid and cloud ice by precipitation represents, to a degree, the depen-dence of collision efficiency on their size following Phillips et al. (2007); see the section 2h in Phillips et al. (2007) for details.
Droplet nucleation follows the nucleation parameter-ization of Ming et al. (2006). In their parameterization, an aerosol can take any form of size, distribution and chemical composition. Critical super-saturation and critical radius are calculated considering the aerosol’s chemical composition, based on the Köhler theory. Lohmann and Diehl’s (2006) parameterizations, taking into account the dependence of ice nuclei (IN) activation on dust and black carbon (BC) aerosol mass concentration, are used for contact, immersion, and condensation-freezing activation of IN. For deposition nu-cleation, the parameterization of Möhler et al. (2006), calcu-lating the fraction of dust activated, is implemented [see Lee et al. (2008) for details of ice-particle nucleation].
Homogeneous aerosol (haze particles) freezing is as-sumed to occur instantaneously when a size and tempera-ture dependent critical super-saturation with respect to ice for freezing is exceeded. Graphically, this phenomenon is represented by considering the predicted size distribution of unactivated aerosols. A “look-up” table for the critical super-saturation ratio at which cloud condensation nuclei (CCN) freezes homogeneously is based on the theory proposed by Koop et al. (2000). Homogenous droplet freezing is per-formed by instantaneous conversion of supercooled cloud droplets to cloud ice at temperatures colder than -36°C. In the present study, the fraction by number of cloud droplets that are frozen homogeneously just above the -36°C level is parameterized with a 3D look-up table considering super-saturation. This procedure is identical to that elucidated by Phillips et al. (2007).
Secondary production of ice occurs by the Hallet-Mossop process of rime splintering (Hallet and Mossop 1974) and involves 350 ice splinters emitted for every mil-
ligram of rimed liquid at -5.5°C. The number of splinters per milligram of rime liquid is linearly interpolated to zero between -3 and -8°C.
2.3 Single-Moment Microphysics
A single-moment microphysics used in Phillips and Donner (2006) is adopted by the WRF for the comparison with the double-moment microphysics. This single-moment microphysics predicts the mass of all types of cloud hydro-meteors but not their number. This single-moment micro-physics is the version provided by Lin et al. (1983) micro-physics scheme. It has five classes of hydrometeors (cloud liquid, cloud ice, snow, graupel and rain) and includes sedimentation of cloud ice as in the double-moment micro-physics adopted in this study. As in the double-moment mi-crophysics, automatic conversion of droplets to rain is per-formed in the same manner as presented by Eq. (50) in Lin et al. (1983). However, the threshold is fixed in this single-moment microphysics while the threshold is predicted in the double-moment microphysics (as described in the section 2.2). No dependence on the particle size is considered for the accretion of cloud liquid and cloud ice by precipitation in the single-moment microphysics due to the absence of the particle-number and -size prediction, whereas the depen-dence is considered in the double-moment microphysics.
The saturation adjustment scheme proposed by Lord et al. (1984) is included, replacing the prediction of super-sat-uration in the double-moment microphysics. In this adjust-ment scheme, water vapor exceeding the saturation level is immediately condensed or deposited. In this scheme, water vapor below the saturation level is assumed to immediately reach the saturation level through the evaporation or subli-mation of hydrometeors, if there are available hydromete-ors. Also, the initial formation of cloud particles (i.e., nucle-ation) is diagnosed by the saturation adjustment.
Due to the absence of the particle-number prediction, the effective particle size diameter of a cloud droplet is as-sumed to be 20 μm, and that of cloud ice is given by em-pirical functions of height (McFarquhar et al. 1999). The homogeneous freezing of all supercooled droplets and rain is performed at -36°C or below. However, the homogeneous freezing is assumed not to occur above -36°C in the single-moment microphysics due to the absence of the super-sat-uration prediction; the parameterization for freezing above -36°C requires the predicted super-saturation. In our study, the freezing occurs above -36°C in the double-moment mi-crophysics adopted here as described in the section 2.2. The homogeneous freezing of haze particles is not taken into ac-count in the single-moment microphysics but is calculated in double-moment microphysics, which is enabled by the super-saturation prediction. The freezing of haze particles requires the predicted super-saturation as described in the section 2.2.

Seoung Soo Lee & Leo J. Donner406
Rime-splintering is not considered in single-moment microphysics but is considered in double-moment micro-physics due to predictability of the particle number; see sec-tion 2.2 for details of the splintering. Except for differences between single-moment microphysics and double-moment microphysics, described in this section, single-moment mi-crophysics is identical to double-moment microphysics in this study.
3. IntEgRAtIon DESIgn3.1 Control Run
The WRF coupled with double-moment microphysics (described in section 2.2) is used for the control run. The model domain has 3 dimensions. The horizontal and verti-cal domains are 168 × 168 km2 and 20 km, respectively, to cover a mesoscale cloud system. The horizontal grid length is 500 m and the vertical grid length is 300 m. Arakawa C-grid staggering scheme is used. Periodic boundary condi-tions are set on horizontal boundaries, and heat and mois-ture fluxes are prescribed at the surface. To initiate clouds, random water-vapor perturbations are imposed at the first time step following Lee et al. (2008).
For the control run, Atmospheric Radiation Measure-ment (ARM) sub-case A (2330 UTC 26 June - 2330 UTC 30 June 1997) observations provide the initial and large-scale forcings of temperature and humidity. Large-scale forc-ings represent synoptic conditions in this situation. Initial temperature and humidity profiles are shown in Fig. 1. The large-scale advective cooling rates associated with the ma-jor precipitation event of sub-case A reach its maximum of 1.8 K h-1 at 7 km, while the large-scale advective moistening rates have maxima of 0.4 g kg-1 h-1 at 2 and 5 km. The zonal wind component has a moderate low-level shear for sub-case A. More detailed descriptions of large-scale forcings of the ARM sub-case A can be found in Xu et al. (2002). The details of the procedure for applying large-scale forcings are described in Lee et al. (2008).
The aerosol mass profiles were extracted from a ver-sion of the GFDL AM2 (2004) nudged by NCEP re-analysis with aerosol chemistry. These extracted mass-concentration profiles, averaged over a one-day period, were obtained at (36.61°N, 97.49°W) on 26 June 1997. These averaged verti-cal profiles act as background aerosol-mass profiles for the control run and are shown in Fig. 2. The background aerosol mass varies in the vertical domain and is homogeneous in the horizontal domain. Sulfate, organic and salt aerosols are assumed to act only as CCN and to have tri-modal lognor-mal size distributions. The mode diameter and standard de-viation of the distributions, as well as the partitioning among modes, are assumed to follow Whitby’s (1978) values for clean continental air mass and not to vary spatiotemporally. Dust and BC aerosols are assumed to act only as IN with
uni-modal lognormal size distributions. For BC and dust, mode diameter and standard deviation are from Seinfeld and Pandis’s (1998) values for remote continental areas and
Fig. 1. Vertical profiles of the initial conditions for the ARM sub-case A: (a) potential temperature and (b) relative humidity.
Fig. 2. Vertical profiles of aerosol species for the ARM sub-case A. Salt is present, but its values are less than 0.01 μg m-3.
(a)
(b)

A Comparison Between Bulk-Microphysics Schemes 407
also assumed not to vary spatiotemporally. Within clouds, aerosols are advected, diffused, and depleted by nucleation. Depending on predicted aerosol mass within a cloud, the total aerosol number for each aerosol species varies and is reset to the background value at all levels outside cloud. The aerosol number concentration in each bin of the size spectrum is determined based on aerosol mass, an assumed aerosol-particle density, and the assumed log-normal size distribution at each grid point. Initially aerosol-mass mix-ing ratio is everywhere set equal to its background value. The background aerosol-mass concentration for all aerosol species in each aerosol size mode are assumed not to vary during time integration since the variation of the extracted aerosols from GFDL AM2 was not significant on the date of simulations.
3.2 Sensitivity tests
Five experiments are performed using the same model setup as in the control run but with different microphysics. The first experiment, which is performed with the WRF coupled with the single-moment microphysics (described in section 2.3), is compared to the control run and examines differences in simulated cloud properties (e.g., precipitation and radiation) between single- and double-moment micro-physics. This first experiment is referred to as the “single-moment run.” The comparison between the control and single-moment runs accompanies another four experiments which examine the role of different physical representations of key processes in different precipitation between single- and double-moment microphysics.
In the single-moment microphysics in this study, only the autoconversion parameterization considers cloud droplet number concentration (CDNC). CDNC for the autoconver-sion parameterization in the double-moment microphysics varies spatiotemporally but it is assumed to be a fixed value in the single-moment microphysics due to the absence of the number prediction. The comparison of the double-moment microphysics (the control run) with the single-moment mi-crophysics (the single-moment run) requires a consistency in the background aerosol properties as well as background thermodynamic conditions. In the single-moment micro-physics, CDNC in the autoconversion parameterization acts as a proxy for the aerosol number concentration. Though it is not possible to be perfectly consistent in aerosol proper-ties between the schemes due to the intrinsic differences, a rough consistency in aerosol number concentration can be made. The CDNC predicted by the double-moment micro-physics can be fed into the autoconversion parameterization in the single-moment microphysics. This enables the single-moment run to represent a similar level of aerosol number concentration to that in the control run. Since a constant CDNC is assumed in the single-moment microphysics, in-cloud average CDNC from the double-moment microphys-
ics (the control run), which is 170 cm-3, is adopted for the autoconversion parameterization in the single-moment run. For this, the average CDNC is assumed to represent the av-erage level of aerosol number concentration in the control run. For the calculation of in-cloud averaged values (in the simulations with the double-moment microphysics), it is needed to determine the grid points in cloud. Grid points are assumed to be in cloud if the number concentration and volume-mean size of droplets is typical for clouds and fogs (1 cm-3 or more, 1 μm or more; Pruppacher and Klett 1978). To calculate the in-cloud average of a variable of interest, first, the conditional average over the grid points in cloud is obtained at each time step; the conditional average is the arithmetic mean of the variable over collected grid points in cloud (grid point in clear air is excluded from the col-lection). Then, those conditional averages are collected and averaged over time to obtain the in-cloud average; only time steps with non-zero conditional averages are included in the collection over time.
Although there are a number of differences which can contribute to different simulations of precipitation between single- and double-moment microphysics, two differences are key candidates: a difference in the saturation scheme and that in the treatment of autoconversion. Autoconver-sion affects the initiation and duration of precipitation. The saturation scheme controls condensation, and, thereby, the amount of precipitation. To investigate the role these two key processes play in different precipitation, four more ex-periments in addition to the control and single-moment runs are conducted.
The model setup of the first experiment of these four more experiments is the same as in the control run but the CDNC in the autoconversion parameterization does not vary spatiotemporally and is set to the same value as in the single-moment run. Thus, the autoconversion threshold does not vary in this experiment and is referred to as the “double-threshold run.” A comparison among the control run, single-moment run and double-threshold run identifies the role of the different treatment of autoconversion in mak-ing precipitation differences between the single-moment and double-moment microphysics.
The model setup of the second experiment of the four more experiments is the same as in the double-threshold run but the super-saturation prediction is replaced by the saturation adjustment used in the single-moment run and is referred to as the “double-saturation run.” In the double-saturation run, the mass concentration of nucleated cloud particles is diagnosed by the saturation adjustment, replac-ing the explicit nucleation parameterizations in the double-threshold run. In the double-saturation run, the number concentration of cloud particles produced from nucleation is diagnosed by dividing the diagnosed initial (or nucleated) cloud-mass concentration by an assumed particle mass of newly formed droplet or ice crystal. In the double-saturation

Seoung Soo Lee & Leo J. Donner408
run, the diagnosed initial (or nucleated) cloud mass by the saturation adjustment results in a cloud-liquid and cloud-ice mass which formed at gird points where the cloud-liquid and cloud-ice mixing ratios are zero, respectively. The diag-nosed number concentration from the saturation adjustment is fed to processes associated with the particle number (e.g., homogeneous freezing of droplets) in the double-moment microphysics. Hence, in the double-saturation run, cloud processes associated with the prediction of cloud particle number except for nucleation operate in the same manner as in the double-threshold run.
The third experiment of the four more experiments is the same as the double-saturation run but with auto-conver-sion threshold which is treated in the same manner as in the control run. This experiment is referred to as the “double-saturation-only run.” The double-saturation-only run is to isolate the effect of the different representation of nucleation and saturation on different precipitation between the single-moment and double-moment microphysics by a comparison
among the control, single-moment, double-saturation, and double-saturation-only runs.
The last experiment, referred to as the “double-other run” is performed. The purpose of this experiment is to fur-ther elucidate the importance of the key processes in de-termining differences in precipitation between the single-moment and double-moment microphysics. The detailed purpose and description of the double-other run are given in the next section, and a brief description of this run (and all the other runs) is shown in Table 1 which summarizes differences among the runs.
Also, some of the above-mentioned simulations are re-peated for the ARM sub-cases B (0000 UTC 7 July - 0000 12 July 1997) and C (0000 UTC 12 July - 0000 17 July 1997), which are described in Lee et al. (2008) and Xu et al. (2002), and for the Tropical Warm Pool International Cloud Experiment (TWP-ICE) campaign (1200 UTC 23 January - 1200 UTC 25 January 2006), described in May et al. (2008) and Fridlind et al. (2009). This is to confirm and support
Table l. Differences in the design of simulation among the single-moment, control, double-threshold, double-saturation, double-saturation-only and double-other runs.
Simulation Microphysics Scheme
Cloud Particle number
CDnC for Autoconversion
SaturationScheme
nucleationScheme
other processes (i.e., accretion, homogeneous freezing and rime splintering)
Single-moment Single-moment No prediction Fixed (170 cm-3) Saturation adjustment
Diagnosis of initial mass of cloud particles
No size dependent col-lection efficiency for accretion, homogeneous freezing of all cloud liquid at -36°C or below, no homogeneous freezing of haze particles and no rime splintering
Control Double-moment Predicted Predicted Prediction of supersaturation
Explicit predic-tion of number and mass of cloud particles
Size dependent collection efficiency for accretion, explicit homogeneous freezing of haze and cloud particles, and the consider-ation of rime splintering
Double-threshold Double-moment Predicted Fixed (170 cm-3) Prediction of supersaturation
Explicit predic-tion of number and mass of cloud particles
Same as in the control run
Double-saturation Double-moment Diagnosed (for nucle-ation) /Predicted (for the other processes)
Fixed (170 cm-3) Saturation adjustment
Diagnosis of initial mass and number of cloud particles
Same as in the control run
Double-saturation-only Double-moment Diagnosed (for nucle-ation) /Predicted (for the other processes)
Predicted Saturation adjustment
Diagnosis of initial mass and number of cloud particles
Same as in the control run
Double-other Double-moment Predicted Predicted Prediction of supersaturation
Explicit predic-tion of number and mass of cloud particles
Same as in the single-moment run
A Comparison Between Bulk-Microphysics Schemes 409
findings from the ARM sub-case A. These repeated simula-tions are described in section 4.1.
4. RESultS4.1 Precipitation
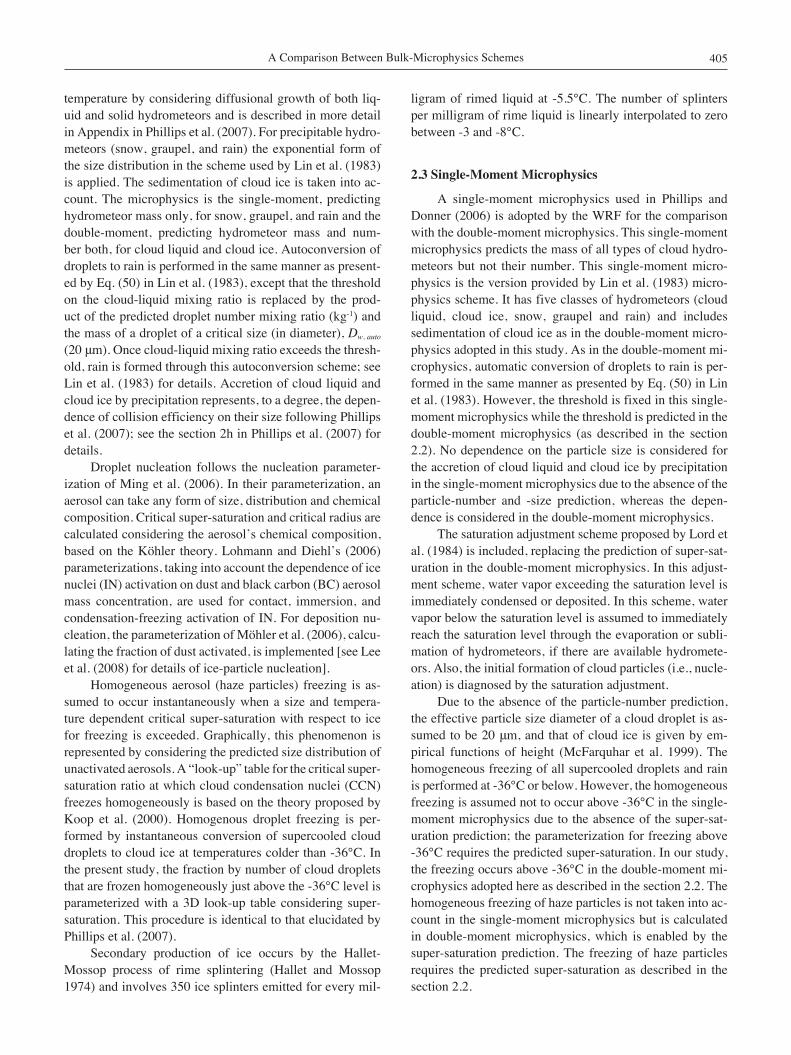
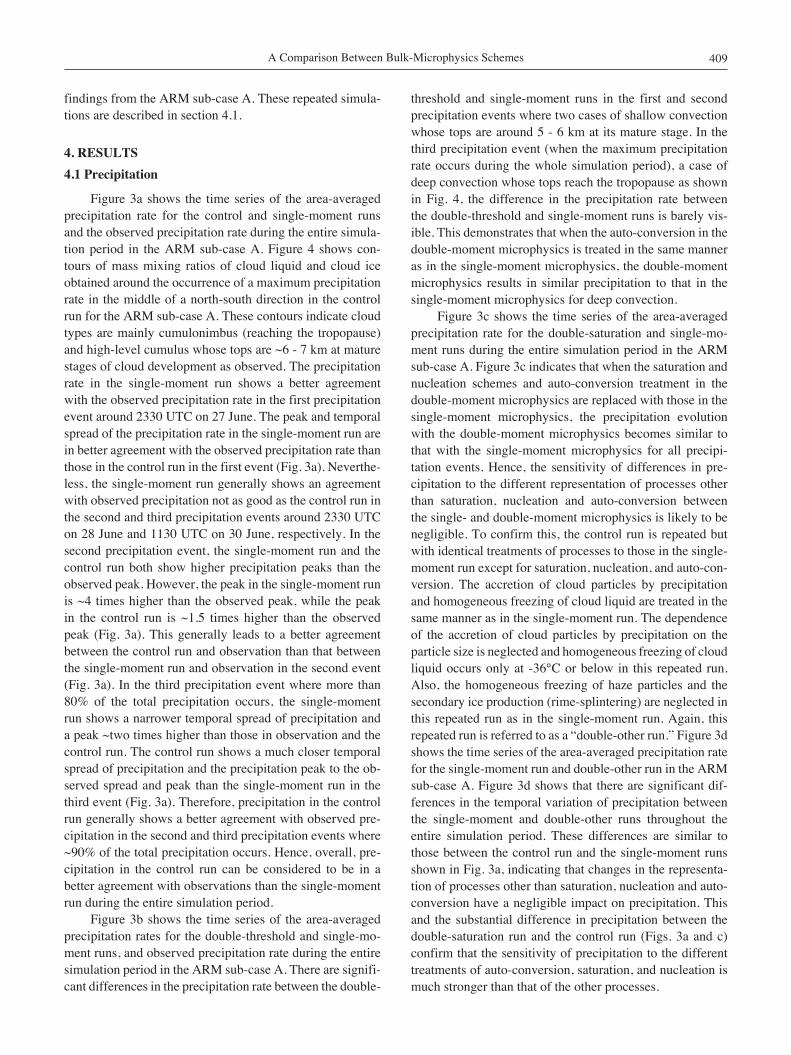
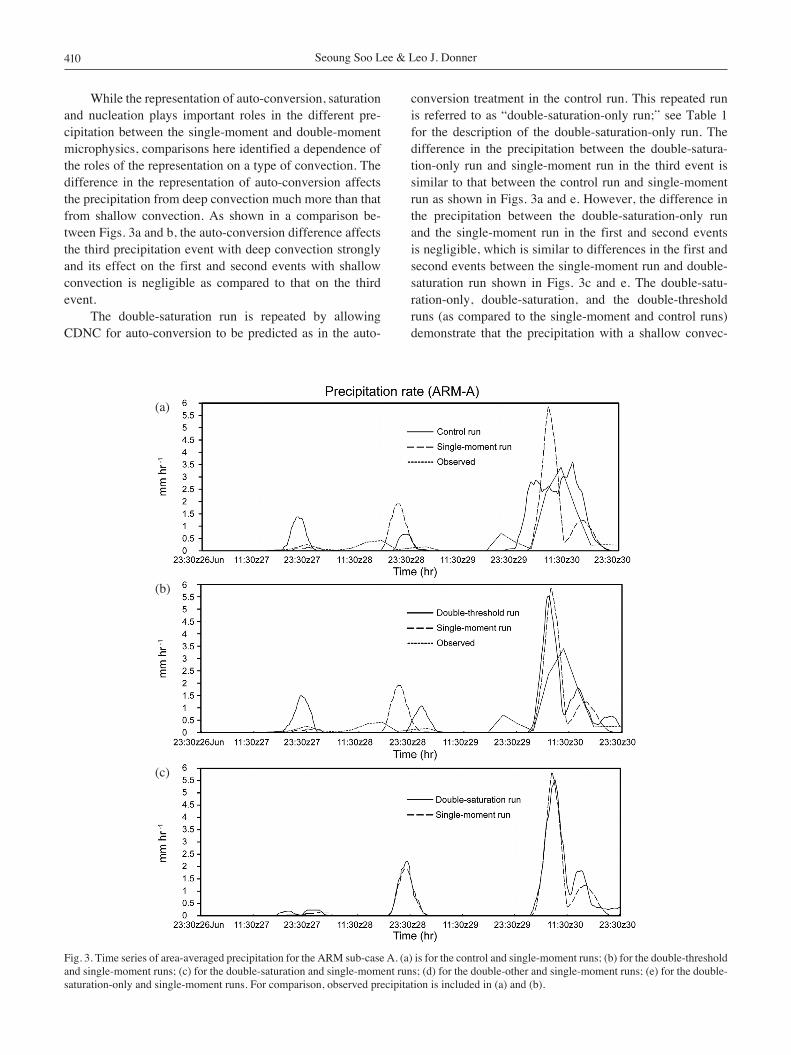
Figure 3a shows the time series of the area-averaged precipitation rate for the control and single-moment runs and the observed precipitation rate during the entire simula-tion period in the ARM sub-case A. Figure 4 shows con-tours of mass mixing ratios of cloud liquid and cloud ice obtained around the occurrence of a maximum precipitation rate in the middle of a north-south direction in the control run for the ARM sub-case A. These contours indicate cloud types are mainly cumulonimbus (reaching the tropopause) and high-level cumulus whose tops are ~6 - 7 km at mature stages of cloud development as observed. The precipitation rate in the single-moment run shows a better agreement with the observed precipitation rate in the first precipitation event around 2330 UTC on 27 June. The peak and temporal spread of the precipitation rate in the single-moment run are in better agreement with the observed precipitation rate than those in the control run in the first event (Fig. 3a). Neverthe-less, the single-moment run generally shows an agreement with observed precipitation not as good as the control run in the second and third precipitation events around 2330 UTC on 28 June and 1130 UTC on 30 June, respectively. In the second precipitation event, the single-moment run and the control run both show higher precipitation peaks than the observed peak. However, the peak in the single-moment run is ~4 times higher than the observed peak, while the peak in the control run is ~1.5 times higher than the observed peak (Fig. 3a). This generally leads to a better agreement between the control run and observation than that between the single-moment run and observation in the second event (Fig. 3a). In the third precipitation event where more than 80% of the total precipitation occurs, the single-moment run shows a narrower temporal spread of precipitation and a peak ~two times higher than those in observation and the control run. The control run shows a much closer temporal spread of precipitation and the precipitation peak to the ob-served spread and peak than the single-moment run in the third event (Fig. 3a). Therefore, precipitation in the control run generally shows a better agreement with observed pre-cipitation in the second and third precipitation events where ~90% of the total precipitation occurs. Hence, overall, pre-cipitation in the control run can be considered to be in a better agreement with observations than the single-moment run during the entire simulation period.
Figure 3b shows the time series of the area-averaged precipitation rates for the double-threshold and single-mo-ment runs, and observed precipitation rate during the entire simulation period in the ARM sub-case A. There are signifi-cant differences in the precipitation rate between the double-
threshold and single-moment runs in the first and second precipitation events where two cases of shallow convection whose tops are around 5 - 6 km at its mature stage. In the third precipitation event (when the maximum precipitation rate occurs during the whole simulation period), a case of deep convection whose tops reach the tropopause as shown in Fig. 4, the difference in the precipitation rate between the double-threshold and single-moment runs is barely vis-ible. This demonstrates that when the auto-conversion in the double-moment microphysics is treated in the same manner as in the single-moment microphysics, the double-moment microphysics results in similar precipitation to that in the single-moment microphysics for deep convection.
Figure 3c shows the time series of the area-averaged precipitation rate for the double-saturation and single-mo-ment runs during the entire simulation period in the ARM sub-case A. Figure 3c indicates that when the saturation and nucleation schemes and auto-conversion treatment in the double-moment microphysics are replaced with those in the single-moment microphysics, the precipitation evolution with the double-moment microphysics becomes similar to that with the single-moment microphysics for all precipi-tation events. Hence, the sensitivity of differences in pre-cipitation to the different representation of processes other than saturation, nucleation and auto-conversion between the single- and double-moment microphysics is likely to be negligible. To confirm this, the control run is repeated but with identical treatments of processes to those in the single-moment run except for saturation, nucleation, and auto-con-version. The accretion of cloud particles by precipitation and homogeneous freezing of cloud liquid are treated in the same manner as in the single-moment run. The dependence of the accretion of cloud particles by precipitation on the particle size is neglected and homogeneous freezing of cloud liquid occurs only at -36°C or below in this repeated run. Also, the homogeneous freezing of haze particles and the secondary ice production (rime-splintering) are neglected in this repeated run as in the single-moment run. Again, this repeated run is referred to as a “double-other run.” Figure 3d shows the time series of the area-averaged precipitation rate for the single-moment run and double-other run in the ARM sub-case A. Figure 3d shows that there are significant dif-ferences in the temporal variation of precipitation between the single-moment and double-other runs throughout the entire simulation period. These differences are similar to those between the control run and the single-moment runs shown in Fig. 3a, indicating that changes in the representa-tion of processes other than saturation, nucleation and auto-conversion have a negligible impact on precipitation. This and the substantial difference in precipitation between the double-saturation run and the control run (Figs. 3a and c) confirm that the sensitivity of precipitation to the different treatments of auto-conversion, saturation, and nucleation is much stronger than that of the other processes.
Seoung Soo Lee & Leo J. Donner410
While the representation of auto-conversion, saturation and nucleation plays important roles in the different pre-cipitation between the single-moment and double-moment microphysics, comparisons here identified a dependence of the roles of the representation on a type of convection. The difference in the representation of auto-conversion affects the precipitation from deep convection much more than that from shallow convection. As shown in a comparison be-tween Figs. 3a and b, the auto-conversion difference affects the third precipitation event with deep convection strongly and its effect on the first and second events with shallow convection is negligible as compared to that on the third event.
The double-saturation run is repeated by allowing CDNC for auto-conversion to be predicted as in the auto-
conversion treatment in the control run. This repeated run is referred to as “double-saturation-only run;” see Table 1 for the description of the double-saturation-only run. The difference in the precipitation between the double-satura-tion-only run and single-moment run in the third event is similar to that between the control run and single-moment run as shown in Figs. 3a and e. However, the difference in the precipitation between the double-saturation-only run and the single-moment run in the first and second events is negligible, which is similar to differences in the first and second events between the single-moment run and double-saturation run shown in Figs. 3c and e. The double-satu-ration-only, double-saturation, and the double-threshold runs (as compared to the single-moment and control runs) demonstrate that the precipitation with a shallow convec-
Fig. 3. Time series of area-averaged precipitation for the ARM sub-case A. (a) is for the control and single-moment runs; (b) for the double-threshold and single-moment runs; (c) for the double-saturation and single-moment runs; (d) for the double-other and single-moment runs; (e) for the double-saturation-only and single-moment runs. For comparison, observed precipitation is included in (a) and (b).
(a)
(b)
(c)

A Comparison Between Bulk-Microphysics Schemes 411
tion is mostly affected by how the saturation and nucleation are represented. They also confirm that the effect of how the auto-conversion is treated on precipitation with shallow convection can be considered negligible.
To confirm the above findings from simulations for the ARM-A case, simulations are repeated for the ARM-B and -C sub-cases and the TWP-ICE case. The ARM-B and -C cases (the TWP-ICE case) are cases of a mesoscale cloud
Fig. 4. Contours of cloud liquid (solid line) and cloud ice (dashed line) (g kg-1) at the time of the occurrence of maximum precipitation rate (1730 GMT 30 June) in the middle of a north-south direction in the control run for the ARM sub-case A. Contour starts at 0 g kg-1 and contour interval is 0.3 g kg-1.
Fig. 3. (Continued)
(d)
(e)
Seoung Soo Lee & Leo J. Donner412
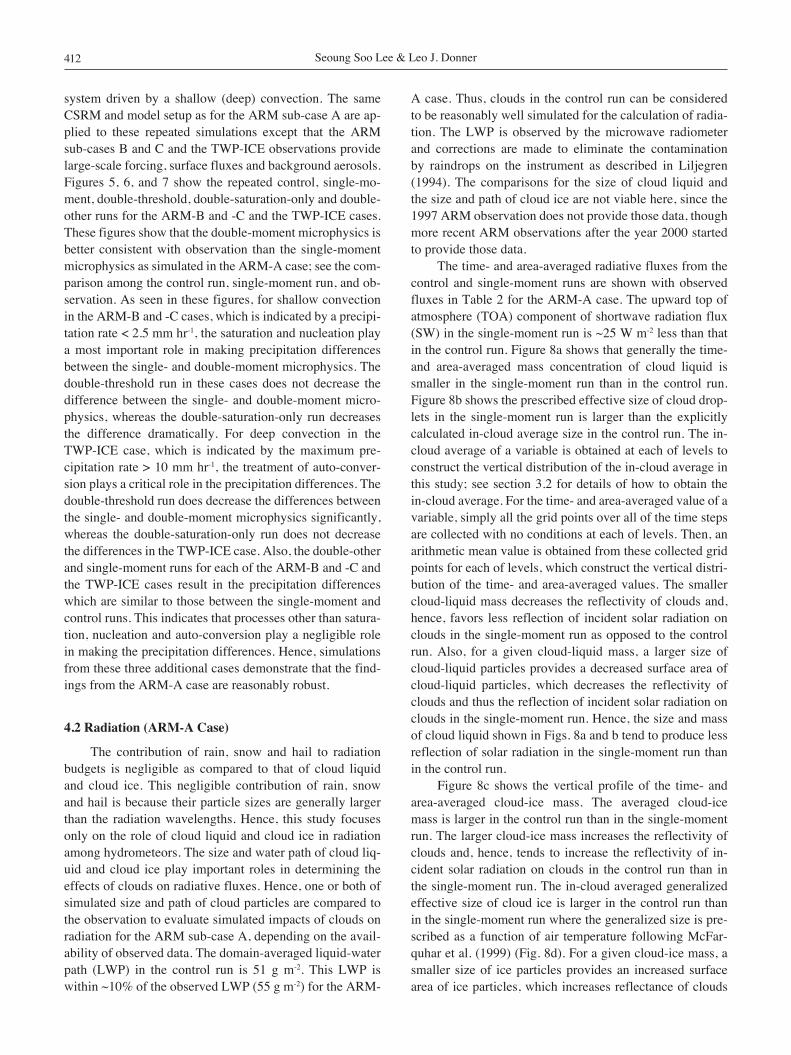
system driven by a shallow (deep) convection. The same CSRM and model setup as for the ARM sub-case A are ap-plied to these repeated simulations except that the ARM sub-cases B and C and the TWP-ICE observations provide large-scale forcing, surface fluxes and background aerosols. Figures 5, 6, and 7 show the repeated control, single-mo-ment, double-threshold, double-saturation-only and double-other runs for the ARM-B and -C and the TWP-ICE cases. These figures show that the double-moment microphysics is better consistent with observation than the single-moment microphysics as simulated in the ARM-A case; see the com-parison among the control run, single-moment run, and ob-servation. As seen in these figures, for shallow convection in the ARM-B and -C cases, which is indicated by a precipi-tation rate < 2.5 mm hr-1, the saturation and nucleation play a most important role in making precipitation differences between the single- and double-moment microphysics. The double-threshold run in these cases does not decrease the difference between the single- and double-moment micro-physics, whereas the double-saturation-only run decreases the difference dramatically. For deep convection in the TWP-ICE case, which is indicated by the maximum pre-cipitation rate > 10 mm hr-1, the treatment of auto-conver-sion plays a critical role in the precipitation differences. The double-threshold run does decrease the differences between the single- and double-moment microphysics significantly, whereas the double-saturation-only run does not decrease the differences in the TWP-ICE case. Also, the double-other and single-moment runs for each of the ARM-B and -C and the TWP-ICE cases result in the precipitation differences which are similar to those between the single-moment and control runs. This indicates that processes other than satura-tion, nucleation and auto-conversion play a negligible role in making the precipitation differences. Hence, simulations from these three additional cases demonstrate that the find-ings from the ARM-A case are reasonably robust.
4.2 Radiation (ARM-A Case)
The contribution of rain, snow and hail to radiation budgets is negligible as compared to that of cloud liquid and cloud ice. This negligible contribution of rain, snow and hail is because their particle sizes are generally larger than the radiation wavelengths. Hence, this study focuses only on the role of cloud liquid and cloud ice in radiation among hydrometeors. The size and water path of cloud liq-uid and cloud ice play important roles in determining the effects of clouds on radiative fluxes. Hence, one or both of simulated size and path of cloud particles are compared to the observation to evaluate simulated impacts of clouds on radiation for the ARM sub-case A, depending on the avail-ability of observed data. The domain-averaged liquid-water path (LWP) in the control run is 51 g m-2. This LWP is within ~10% of the observed LWP (55 g m-2) for the ARM-
A case. Thus, clouds in the control run can be considered to be reasonably well simulated for the calculation of radia-tion. The LWP is observed by the microwave radiometer and corrections are made to eliminate the contamination by raindrops on the instrument as described in Liljegren (1994). The comparisons for the size of cloud liquid and the size and path of cloud ice are not viable here, since the 1997 ARM observation does not provide those data, though more recent ARM observations after the year 2000 started to provide those data.
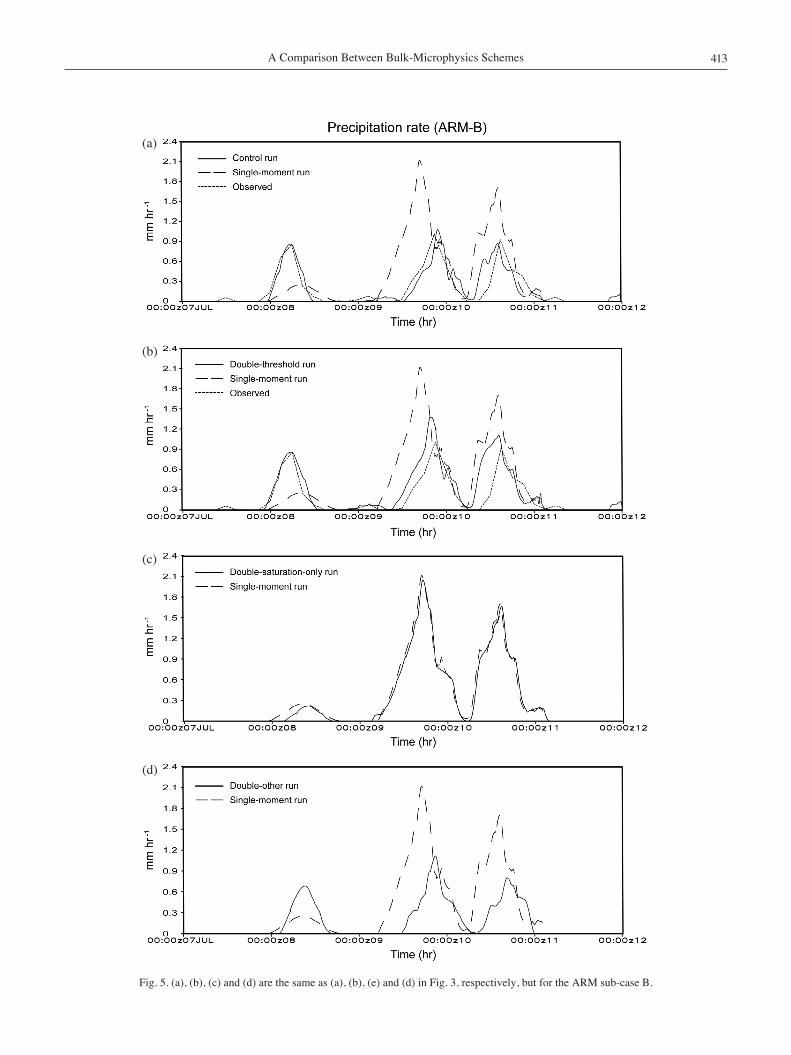
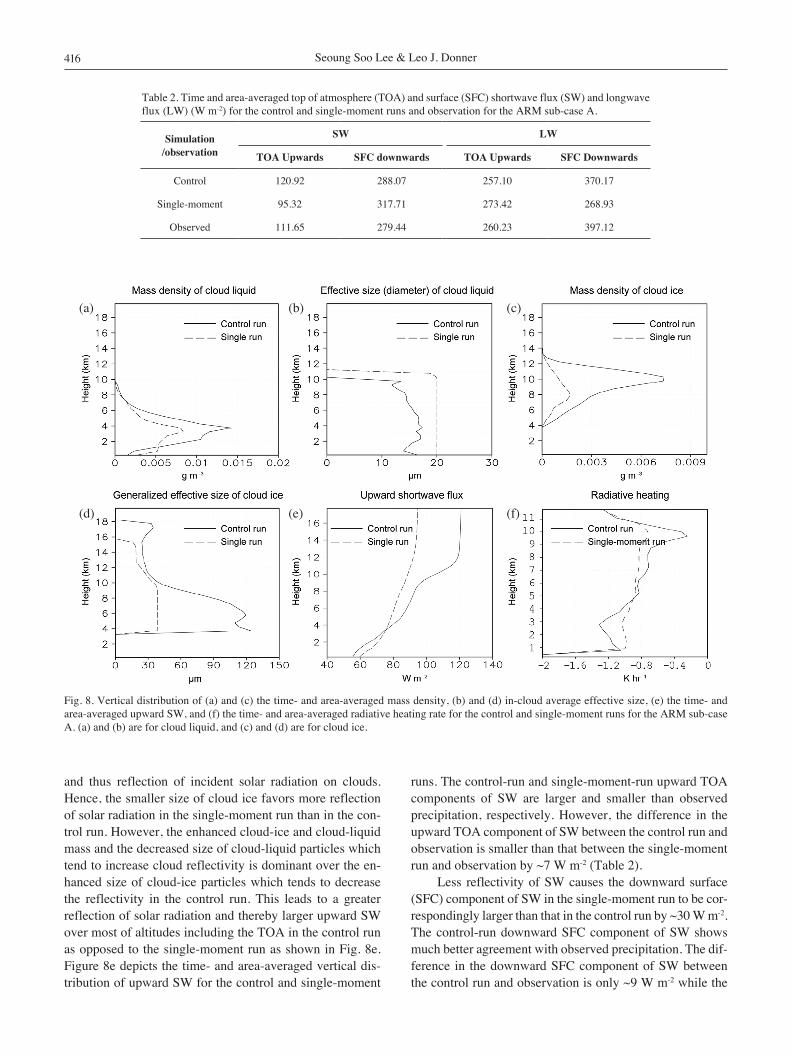
The time- and area-averaged radiative fluxes from the control and single-moment runs are shown with observed fluxes in Table 2 for the ARM-A case. The upward top of atmosphere (TOA) component of shortwave radiation flux (SW) in the single-moment run is ~25 W m-2 less than that in the control run. Figure 8a shows that generally the time- and area-averaged mass concentration of cloud liquid is smaller in the single-moment run than in the control run. Figure 8b shows the prescribed effective size of cloud drop-lets in the single-moment run is larger than the explicitly calculated in-cloud average size in the control run. The in-cloud average of a variable is obtained at each of levels to construct the vertical distribution of the in-cloud average in this study; see section 3.2 for details of how to obtain the in-cloud average. For the time- and area-averaged value of a variable, simply all the grid points over all of the time steps are collected with no conditions at each of levels. Then, an arithmetic mean value is obtained from these collected grid points for each of levels, which construct the vertical distri-bution of the time- and area-averaged values. The smaller cloud-liquid mass decreases the reflectivity of clouds and, hence, favors less reflection of incident solar radiation on clouds in the single-moment run as opposed to the control run. Also, for a given cloud-liquid mass, a larger size of cloud-liquid particles provides a decreased surface area of cloud-liquid particles, which decreases the reflectivity of clouds and thus the reflection of incident solar radiation on clouds in the single-moment run. Hence, the size and mass of cloud liquid shown in Figs. 8a and b tend to produce less reflection of solar radiation in the single-moment run than in the control run.
Figure 8c shows the vertical profile of the time- and area-averaged cloud-ice mass. The averaged cloud-ice mass is larger in the control run than in the single-moment run. The larger cloud-ice mass increases the reflectivity of clouds and, hence, tends to increase the reflectivity of in-cident solar radiation on clouds in the control run than in the single-moment run. The in-cloud averaged generalized effective size of cloud ice is larger in the control run than in the single-moment run where the generalized size is pre-scribed as a function of air temperature following McFar-quhar et al. (1999) (Fig. 8d). For a given cloud-ice mass, a smaller size of ice particles provides an increased surface area of ice particles, which increases reflectance of clouds
A Comparison Between Bulk-Microphysics Schemes 413
Fig. 5. (a), (b), (c) and (d) are the same as (a), (b), (e) and (d) in Fig. 3, respectively, but for the ARM sub-case B.
(a)
(b)
(c)
(d)

Seoung Soo Lee & Leo J. Donner414
Fig. 6. (a), (b), (c) and (d) are the same as (a), (b), (e) and (d) in Fig. 3, respectively, but for the ARM sub-case C.
(a)
(b)
(c)
(d)

A Comparison Between Bulk-Microphysics Schemes 415
Fig. 7. (a), (b), (c) and (d) are the same as (a), (b), (e) and (d) in Fig. 3, respectively, but for the TWP-ICE case.
(a)
(b)
(c)
(d)
Seoung Soo Lee & Leo J. Donner416
and thus reflection of incident solar radiation on clouds. Hence, the smaller size of cloud ice favors more reflection of solar radiation in the single-moment run than in the con-trol run. However, the enhanced cloud-ice and cloud-liquid mass and the decreased size of cloud-liquid particles which tend to increase cloud reflectivity is dominant over the en-hanced size of cloud-ice particles which tends to decrease the reflectivity in the control run. This leads to a greater reflection of solar radiation and thereby larger upward SW over most of altitudes including the TOA in the control run as opposed to the single-moment run as shown in Fig. 8e. Figure 8e depicts the time- and area-averaged vertical dis-tribution of upward SW for the control and single-moment
runs. The control-run and single-moment-run upward TOA components of SW are larger and smaller than observed precipitation, respectively. However, the difference in the upward TOA component of SW between the control run and observation is smaller than that between the single-moment run and observation by ~7 W m-2 (Table 2).
Less reflectivity of SW causes the downward surface (SFC) component of SW in the single-moment run to be cor-respondingly larger than that in the control run by ~30 W m-2. The control-run downward SFC component of SW shows much better agreement with observed precipitation. The dif-ference in the downward SFC component of SW between the control run and observation is only ~9 W m-2 while the
Fig. 8. Vertical distribution of (a) and (c) the time- and area-averaged mass density, (b) and (d) in-cloud average effective size, (e) the time- and area-averaged upward SW, and (f) the time- and area-averaged radiative heating rate for the control and single-moment runs for the ARM sub-case A. (a) and (b) are for cloud liquid, and (c) and (d) are for cloud ice.
Table 2. Time and area-averaged top of atmosphere (TOA) and surface (SFC) shortwave flux (SW) and longwave flux (LW) (W m-2) for the control and single-moment runs and observation for the ARM sub-case A.
Simulation/observation
SW lW
toA upwards SFC downwards toA upwards SFC Downwards
Control 120.92 288.07 257.10 370.17
Single-moment 95.32 317.71 273.42 268.93
Observed 111.65 279.44 260.23 397.12
(a) (b) (c)
(d) (e) (f)
A Comparison Between Bulk-Microphysics Schemes 417
difference is ~38 W m-2 between the single-moment run and observation (Table 2). The TOA upward component of long-wave radiation flux (LW) is larger in the single-moment run than in the control run by ~16 W m-2, resulting in its larger difference between the single-moment run and observation than that between the control run and observed precipitation (Table 2). This is due to the smaller mass concentration of cloud liquid and cloud ice in the single-moment run than in the control run, which provides decreased absorption of infrared radiation emitted from the surface in the single-moment run.
Also, it is worth pointing out that the predicted cloud-liquid and -ice mass and size in the control run show larger vertical variations than those in the single-moment run as shown in Figs. 8a - d. The smaller vertical variations of the size in the single-moment run in contrast to the control run are due to the prescription of cloud-particle size in the single-moment run. These larger vertical variations lead to a much larger vertical variation of radiation fluxes in the control run than in the single-moment run (for example, see Fig. 8e for the SW variation). This result indicates a large difference in the vertical distribution of radiatively driven atmospheric heating or cooling between the control and single-moment runs as shown in Fig. 8f; since the variation of fluxes is negligible above 12 km, Fig. 8f depicts heating only up to 12 km. The much larger vertical variation of fluxes leads to a much larger variation of the time- and area-averaged radiative heating (i.e., shortwave heating + longwave heat-ing) in the control run than in the single-moment run in Fig. 8f. Note that the radiatively driven heating and cooling are proportional to the vertical gradient of radiation fluxes.
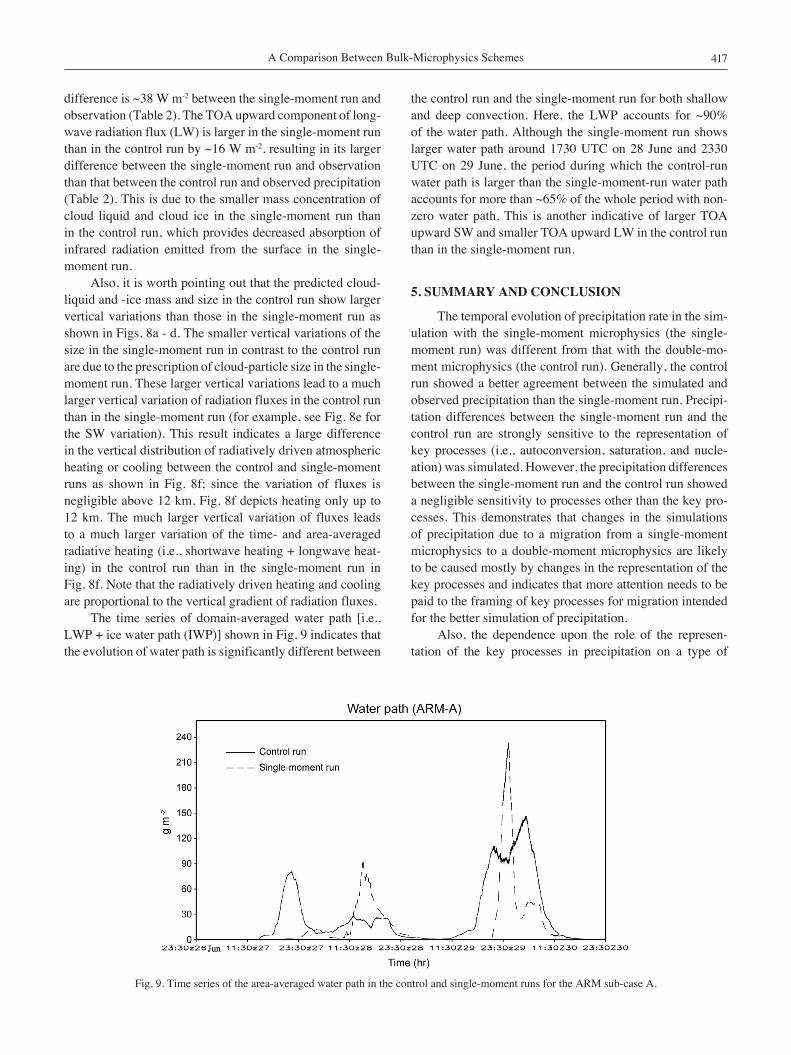
The time series of domain-averaged water path [i.e., LWP + ice water path (IWP)] shown in Fig. 9 indicates that the evolution of water path is significantly different between
the control run and the single-moment run for both shallow and deep convection. Here, the LWP accounts for ~90% of the water path. Although the single-moment run shows larger water path around 1730 UTC on 28 June and 2330 UTC on 29 June, the period during which the control-run water path is larger than the single-moment-run water path accounts for more than ~65% of the whole period with non-zero water path. This is another indicative of larger TOA upward SW and smaller TOA upward LW in the control run than in the single-moment run.
5. SuMMARy AnD ConCluSIon
The temporal evolution of precipitation rate in the sim-ulation with the single-moment microphysics (the single-moment run) was different from that with the double-mo-ment microphysics (the control run). Generally, the control run showed a better agreement between the simulated and observed precipitation than the single-moment run. Precipi-tation differences between the single-moment run and the control run are strongly sensitive to the representation of key processes (i.e., autoconversion, saturation, and nucle-ation) was simulated. However, the precipitation differences between the single-moment run and the control run showed a negligible sensitivity to processes other than the key pro-cesses. This demonstrates that changes in the simulations of precipitation due to a migration from a single-moment microphysics to a double-moment microphysics are likely to be caused mostly by changes in the representation of the key processes and indicates that more attention needs to be paid to the framing of key processes for migration intended for the better simulation of precipitation.
Also, the dependence upon the role of the represen-tation of the key processes in precipitation on a type of
Fig. 9. Time series of the area-averaged water path in the control and single-moment runs for the ARM sub-case A.
Seoung Soo Lee & Leo J. Donner418
convection was simulated. The representation of auto-conversion threshold (saturation and nucleation) played an important role in making the precipitation difference be-tween the single- and double-moment microphysics in deep (shallow) convection but played a negligible role in shallow (deep) convection and indicates a need to differentiate the focus of the parameterization development based upon the type of convection in climate models. In regions of shallow convection such as trade cumuli, we need to focus primarily upon the representation of saturation and nucleation and do not have to focus so much upon the representation of the autoconversion threshold. However, in strong convection regions, we need to focus primarily on the representation of autoconversion threshold but less so on the saturation and nucleation.
The predicted size and mass of cloud particles in the control run better represented cloud radiative properties than the prescribed size and predicted mass of cloud par-ticles in the single-moment run. Hence, there is a better agreement in the TOA and SFC radiative fluxes between the double-moment microphysics and observation than be-tween the single-moment microphysics and observation. Also, the vertical distributions of cloud-particle mass and size and thus radiation fluxes simulated by the single-mo-ment microphysics were significantly different from those evinced by the double-moment microphysics. The prescrip-tion of cloud-particle size in the single-moment microphys-ics was not able to emulate the large vertical variation of particle size simulated by the double-moment microphysics and led to the different radiative heating and cooling be-tween the single- and double-moment microphysics. This result implies that the atmospheric instability induced by radiation is likely to be different between the single- and double-moment microphysics. The atmospheric instability affects hydrologic and dynamic circulations. A mesoscale convective system like the one simulated here is a building block of systems like the Asian and Indian Monsoon, storm tracks, and intertropical convergence zone. These systems play an important role in global hydrologic and energy cir-culations. Hence, the difference in heating and cooling by radiation (inducing that in the atmospheric instability) can lead to differences in global circulation patterns and thus in the assessment of the effect of clouds on climate between the single-moment and double-moment microphysics in cli-mate models. The better representation of cloud radiative properties by the double-moment microphysics simulated here indicates that the effect of radiative heating and cool-ing on circulation patterns is likely to be better represented by the double-moment microphysics than by the single-mo-ment microphysics.
As can be seen in Fig. 8c, the large portion of mass of cloud ice is concentrated around or above the level of homogeneous freezing (around 9 - 10 km) where the con-version of cloud ice to precipitable snow is known to be
very inefficient due to the absence of liquid-phase particles. Hence, although we assumed the collection efficiency of 1 for collisions between cloud ice and liquid-phase particles, just around 5% of the ice formed by deposition was convert-ed into snow in this study. The low conversion efficiency of cloud ice, which is around 5%, even with the collection efficiency of 1 demonstrates that there will be negligible changes in the mass of cloud ice with different crystal habits assumed. This indicates that results here are not likely to de-pend on the variation of conversion of ice crystals to snow due to the variation of an assumed crystal habit for collec-tion processes. This study assumed the columnar shape of ice crystals for the characterization of the optical properties and thus calculation of radiative fluxes, following Phillips et al. (2007). Fu (2007) and Wendisch et al. (2007) demon-strated that the qualitative nature of the results of this study does not depend on this assumption.
In this study, the spectral information for riming is considered in the double-moment microphysics following Phillips et al. (2007) but not in the single-moment micro-physics. Lee et al. (2010) showed that the consideration of spectral information does not affect the qualitative nature of results. This is because the riming is predominantly affected by the bulk property of cloud liquid, i.e., cloud-liquid mass, but not by the microphysical property of cloud liquid, i.e., cloud-liquid particle size. Hence, it is not likely that there is a strong dependence of results on the consideration of the spectral information for riming processes.
Acknowledgements The authors wish to thank Dr. Venka-tachalam Ramaswamy for valuable discussions. This paper was prepared under award NA17RJ2612 from the National Oceanic and Atmospheric Administration, US Department of Commerce.
REFEREnCES
Berezinskiy, N. A., G. V. Stepanov, and V. G. Khorguani, 1986: Altitude variation of relative ice-forming activ-ity of natural aerosol. S. Meterol. Hydr., 12, 86-89.
DeMott, P. J., D. J. Cziczo, A. J. Prenni, D. M. Murphy, S. M. Kreidenweis, D. S. Thomson, R. Borys, and D. C. Rogers, 2003: Measurements of the concentration and composition of nuclei for cirrus formation. Proc. Natl. Acad. Sci. USA, 100, 14655-14660, doi: 10.1073/pnas.2532677100. [Link]
Freidenreich, S. M. and V. Ramaswamy, 1999: A new multiple-band solar radiative parameterization for gen-eral circulation models. J. Geophys. Res., 104, 31389-31409, doi: 10.1029/1999JD900456. [Link]
Fridlind, A., A. Ackerman, J. Petch, P. Field, A. Hill, G. Mc-Farquhar, S. Xie, and M. Zhang, 2009: ARM/GCSS/SPARC TWP-ICE CRM intercomparison study. Avail-able at http://science.arm.gov/wg/cpm/scm/scmic6/in
A Comparison Between Bulk-Microphysics Schemes 419
dex.html.Fu, Q., 2007: A new parameterization of an asymmetry fac-
tor of cirrus clouds for climate models. J. Atmos. Sci., 64, 4140-4150, doi: 10.1175/2007JAS2289.1. [Link]
Georgii, H. W. and E. Kleinjung, 1967: Relations between the chemical composition of atmospheric aerosol par-ticles and the concentration of natural ice nuclei. J. Rech. Atmos., 3, 145-156.
Hallet, J. and S. C. Mossop, 1974: Production of secondary ice particles during the riming process. Nature, 249, 26-28, doi: 10.1038/249026a0. [Link]
Hong, S. Y. and H. L. Pan, 1996: Nonlocal boundary layer vertical diffusion in a medium-range forecast model. Mon. Weather Rev., 124, 2322-2339, doi: 10.1175/1520-0493(1996)124<2322:NBLVDI>2.0.CO;2. [Link]
Klemp, J. B., W. C. Skamarock, and J. Dudhia, 2007: Conservative split-explicit time integration methods for the compressible nonhydrostatic equations. Mon. Weather Rev., 135, 2897-2913, doi: 10.1175/MWR34 40.1. [Link]
Koop, T., B. Luo, A. Tsias, and T. Peter, 2000: Water ac-tivity as the determinant for homogeneous ice nucle-ation in aqueous solutions. Nature, 406, 611-614, doi : 10.1038/35020537. [Link]
Lee, S. S., L. J. Donner, V. T. J. Phillips, and Y. Ming, 2008: Examination of aerosol effects on precipitation in deep convective clouds during the 1997 ARM summer ex-periment. Q. J. R. Meteorol. Soc., 134, 1201-1220, doi: 10.1002/qj.287. [Link]
Lee, S. S., L. J. Donner, and J. E. Penner, 2010: Thunder-storm and stratocumulus: How does their contrasting morphology affect their interactions with aerosols? At-mos. Chem. Phys., 10, 6819-6837, doi: 10.5194/acp-10- 6819-2010. [Link]
Liljegren, J. C., 1994: Two-channel microwave radiometer for observations of total column precipitable water vapor and cloud liquid water path. In: Proceedings of the 5th Symposium on Global Change, 23-28 January 1994, Nashville, TN, USA, Am. Meteorol. Soc., Bos-ton, MA, USA, 266-269.
Lin, Y. L., R. D. Farley, and H. D. Orville, 1983: Bulk pa-rameterization of the snow field in a cloud model. J. Climate Appl. Meteorol., 22, 1065-1092, doi: 10.1175/1520-0450(1983)022<1065:BPOTSF>2.0.CO;2. [Link]
Lohmann, U. and K. Diehl, 2006: Sensitivity studies of the importance of dust ice nuclei for the indirect aerosol effect on stratiform mixed-phase clouds. J. Atmos. Sci., 63, 968-982, doi: 10.1175/JAS3662.1. [Link]
Lohmann, U., P. Stier, C. Hoose, S. Ferrachat, S. Kloster, E. Roeckner, and J. Zhang, 2007: Cloud microphysics and aerosol indirect effects in the global climate model ECHAM5-HAM. Atmos. Chem. Phys., 7, 3425-3446. doi: 10.5194/acp-7-3425-2007. [Link]
Lord, S. J., H. E. Willoughby, and J. M. Piotrowicz, 1984: Role of a parameterized ice-phase microphysics in an axisymmetric nonhydrostatic tropical cyclone model. J. Atmos. Sci., 41, 2836-2848, doi: 10.1175/1520-0469(1984)041<2836:ROAPIP>2.0.CO;2. [Link]
May, P. T., J. H. Mather, G. Vaughan, and C. Jakob, 2008: Characterizing oceanic convective cloud systems - The Tropical Warm Pool International Cloud Experiment. Bull. Amer. Meteorol. Soc., 89, 153-155, doi: 10.1175/BAMS-89-2-153. [Link]
McFarquhar, G. M., A. J. Heymsfield, A. Macke, J. Iaquin-ta, and S. M. Aulenbach, 1999: Use of observed ice crystal sizes and shapes to calculate mean-scattering properties and multispectral radiances: CEPEX April 4, 1993, case study. J. Geophys. Res., 104, 31763-31779, doi: 10.1029/1999JD900802. [Link]
Meyers, M. P., P. J. DeMott, and W. R. Cotton, 1992: New primary ice-nucleation parameterizations in an explicit cloud model. J. Appl. Meteorol., 31, 708-721, doi: 10. 1175/1520-0450(1992)031<0708:NPINPI>2.0.CO;2. [Link]
Michalakes, J., S. Chen, J. Dudhia, L. Hart, J. Klemp, J. Middlecoff, and W. Skamarock, 2001: Development of a next generation regional weather research and fore-cast model. In: Zwieflhofer, W. and N. Kreitz (Eds.), Developments in Teracomputing, Proceedings of the Ninth ECMWF Workshop on the Use of High Perfor-mance Computing in Meteorology, World Scientific, Singapore, 269-276.
Ming, Y., V. Ramaswamy, L. J. Donner, and V. T. J. Phil-lips, 2006: A new parameterization of cloud droplet activation applicable to general circulation models. J. Atmos. Sci., 63, 1348-1356, doi: 10.1175/JAS3686.1. [Link]
Morrison, H. and A. Gettelman, 2008: A new two-moment bulk stratiform cloud microphysics scheme in the com-munity atmosphere model, version 3 (CAM3). Part I: Description and numerical tests. J. Climate, 21, 3642-3659, doi: 10.1175/2008JCLI2105.1. [Link]
Morrison, H., G. Thomson, and V. Tatarskii, 2009: Impact of cloud microphysics on the development of trailing strat-iform precipitation in a simulated squall line: Compari-son of one- and two-moment schemes. Mon. Weather Rev., 137, 991-1007, doi: 10.1175/2008MWR2556.1. [Link]
Möhler, O., P. R. Field, P. Connolly, S. Benz, H. Saathoff, M. Schnaiter, R. Wagner, R. Cotton, M. Krämer, A. Mangold, and A. J. Heymsfield, 2006: Efficiency of the deposition mode ice nucleation on mineral dust particles. Atmos. Chem. Phys., 6, 3007-3021, doi: 10. 5194/acp-6-3007-2006. [Link]
Phillips, V. T. J. and L. J. Donner, 2006: Cloud micro-physics, radiation and vertical velocities in two- and three-dimensional simulations of deep convection. Q.
Seoung Soo Lee & Leo J. Donner420
J. R. Meteorol. Soc., 132, 3011-3033, doi: 10.1256/qj. 05.171. [Link]
Phillips, V. T. J., L. J. Donner, and S. T. Garner, 2007: Nucleation processes in deep convection simulated by a cloud-system-resolving model with double-moment bulk microphysics. J. Atmos. Sci., 64, 738-761, doi: 10. 1175/JAS3869.1. [Link]
Pruppacher, H. R. and J. D. Klett, 1978: Microphysics of Clouds and Precipitation, D. Reidel, 714 pp.
Salzmann, M., Y. Ming, J. C. Golaz, P. A. Ginoux, H. Mor-rison, A. Gettelman, M. Krämer, and L. J. Donner, 2010: Two-moment bulk stratiform cloud microphys-ics in the GFDL AM3 GCM: Description, evaluation, and sensitivity tests. Atmos. Chem. Phys., 10, 8037-8064, doi: 10.5194/acp-10-8037-2010. [Link]
Seinfeld, J. H. and S. N. Pandis, 1998: Atmospheric Chem-istry and Physics: From Air Pollution to Climate Change, John Wiley & Sons, 1326 pp.
Straka, J. M., M. S. Gilmore, K. M. Kanak, and E. N. Ras-mussen, 2005: A comparison of the conservation of number concentration for the continuous collection and vapor diffusion growth equations using one- and two-moment schemes. J. Appl. Meteorol., 44, 1844-1849, doi: 10.1175/JAM2314.1. [Link]
Straka, J. M., K. M. Kanak, and M. S. Gilmore, 2007: The behavior of number concentration tendencies for the continuous collection growth equation using one- and two-moment bulk parameterization schemes. J. Appl. Meteorol. Climatol., 46, 1264-1274, doi: 10.1175/JAM 2527.1. [Link]
Wendisch, M., P. Yang, P. Pilewskie, 2007: Effects of ice crystal habit on thermal infrared radiative properties and forcing of cirrus. J. Geophys. Res., 112, D08201, doi: 10.1029/2006JD007899. [Link]
Whitby, K. T., 1978: The physical characteristics of sul-fur aerosols. Atmos. Environ., 12, 135-159, doi: 10.10 16/0004-6981(78)90196-8. [Link]
Xu, K. M., R. T. Cederwall, L. J. Donner, W. W. Grabows-ki, F. Guichard, D. E. Johnson, M. Khairoutdinov, S. K. Krueger, J. C. Petch, D. A. Randall, C. J. Seman, W. K. Tao, D. Wang, S. C. Xie, J. J. Yio, and M. H.
Zhang, 2002: An intercomparison of cloud-resolving models with the atmospheric radiation measurement summer 1997 intensive observation period data. Q. J. R. Meteorol. Soc., 128, 593-624, doi: 10.1256/003590 002321042117. [Link]
APPEnDIx A
Deposition nucleation at temperatures warmer than -40°C
At temperatures between -30 and -40°C and between -5 and -30°C, DeMott et al. (2003, personal communica-tion) and Meyers et al.’s (1992) parameterizations, multi-plied by a scaling factor, are used for deposition nucleation, respectively. For temperatures between -30 and -40°C:
1000 . .expN m S12 96 1 1 .IN i
3 0 3#W= --^ ^h h6 @" , (A1)
Here, NIN is ice-crystal number concentration, Si the satura-tion ratio with respect to ice and W a scaling factor to take into account the dependence of IN activation on dust mass concentration. W is DU DU. .
*2 5 2 5 , where DU2.5 is mass con-
centration of dust particles with diameter less than 2.5 μm and DU .
*2 5 is a reference dust mass concentration. DU .
*2 5 is
set at 0.11 μg m-3 based on dust data from the Mount Wer-ner project used to derive (A1) (DeMott et al. 2003, per-sonal communication). Hence, (A1) computes NIN based on variation of dust-mass concentration relative to dust-mass concentration observed at the Mount Werner project. It was observed that IN concentrations were almost linear with the concentrations of large aerosol particles (Georgii and Kleinjung 1967; Berezinskiy et al. 1986), supporting the as-sumption that NIN is proportional to DU2.5. For temperatures between -5 and -30°C, the same scaling factor as used in (A1) is applied to Meyers et al.’s (1992) parameterization as follows, since the data of dust-mass concentration are not available in Meyers et al. (1992):
1000 . .expN m S12 96 1 0 639IN i3
#W= - --^ ^h h6 @ (A2)