Embed Size (px)
Citation preview

Biogeosciences, 7, 1133–1142, 2010www.biogeosciences.net/7/1133/2010/© Author(s) 2010. This work is distributed underthe Creative Commons Attribution 3.0 License.
Biogeosciences
Effects of environmental factors and soil properties on topographicvariations of soil respiration
K. Tamai
Forestry and Forest Products Research Institute, Tsukuba, Japan
Received: 24 August 2009 – Published in Biogeosciences Discuss.: 24 November 2009Revised: 17 March 2010 – Accepted: 17 March 2010 – Published: 26 March 2010
Abstract. Soil respiration rates were measured along differ-ent parts of a slope in (a) an evergreen forest with commonbrown forest soil and (b) a deciduous forest with immaturesoil. The effects of soil temperature, soil moisture and soilproperties were estimated individually, and the magnitudesof these effects in the deciduous and evergreen forests werecompared. In the evergreen forest with common brown forestsoil, soil properties had the greatest effect on soil respirationrates, followed by soil moisture and soil temperature. Theseresults may be explained by the fact that different soil proper-ties matured within different environments. It can be arguedthat the low soil respiration rates in the low parts of the slopein the evergreen forest resulted from soil properties and notfrom wet soil conditions. In the deciduous forest, soil respi-ration rates were more strongly affected by soil moisture andsoil temperature than by soil properties. These effects werelikely due to the immaturity of the forest soil.
1 Introduction
To estimate carbon uptake in forests, several researchers havecompared soil respiration rates with tower-based flux mea-surements (Davidson et al., 2002; Kominami et al., 2003;Sugawara et al., 2005). However, for scientifically robustcomparisons, the soil respiration rates must represent an areaas large as the area represented by the tower-based flux. Sucha requirement is problematic, because many factors such astopography can cause substantial spatial variation in soil res-piration rates.
Studies of spatial variation have been focused on a variousscale, ranging from several meters (Kosugi et al., 2007) to a
Correspondence to:K. Tamai([email protected])
national scale (Ishizuka et al., 2006). Because most forestedareas in Japan involve complex terrain, the topographic scaleis extremely important when comparing soil respiration rateswith tower-based fluxes.
Soil respiration rates are affected by environmental factorssuch as soil moisture and soil temperature (Davidson et al.,1998) and by soil properties such as root biomass and poros-ity (Hanson et al., 2000; Dannoura et al., 2006). Therefore,both environmental factors and soil properties can affect to-pographic variation in soil respiration. Generally, soil mois-ture declines as elevation along a slope increases. Moreover,due to soil classifications, soil type is often different fromeach other between low and high parts in a slope. Thus, slopescale should focus on the various topological scales to esti-mate topological effect on soil respiration.
Spatial variation in soil respiration on slopes has been ex-amined in many forest types including Japanese cedar forests(Ohashi et al., 2007), Japanese cypress forests (Mitani et al.,2006), deciduous broadleaf forests (Hanson et al., 1993; Jiaet al., 2003) and tropical rain forests (Sotta et al., 2006; Ko-sugi et al., 2007). The slope heights in these studies variedsubstantially (between 7 and 70 m), but most studies reportedlower soil respiration rates in lower parts of the slopes. Jia etal. (2003), Mitani et al. (2006) and Kosugi et al. (2007) notedthat the decreased soil respiration rates on lower slopes werecaused by higher soil moisture ratios. However, in a studyof a weathered granitic area of southern Kyoto Prefecture,Tamai et al. (2005a) linked lower soil respiration rates in ar-eas of elevated topography to increased dryness. This resultshows that the relationship between soil respiration and soilmoisture is not unique to any forest and remains unclear.
To ensure that soil respiration rates represent an area aslarge as the area represented by tower-based fluxes, estimatesof the effects of environmental factors and soil propertiesare necessary (Fang et al., 1998). However, it is importantto note that environmental factors and soil properties both
Published by Copernicus Publications on behalf of the European Geosciences Union.
1134 K. Tamai: Effects of environmental factors and soil properties
vary depending on slope locations. Most soil properties suchas carbon content, soil microorganisms, root biomass andporosity exist under unique environmental conditions suchas soil moisture at each location during the process of soilmaturation. Thus, it is impossible to estimate environmentalfactors and soil properties individually by simply comparingthe spatial variations of environmental factors and soil prop-erties with soil respiration.
Some studies have been performed to estimate these varia-tions individually. In a secondary broadleaf forest in northernJapan, Hashimoto et al. (2008) examined the spatial variationof environmental factors such as the soil moisture ratio andphysical factors such as the basal area of stems and soil respi-ration. The researchers concluded that the basal area of stemspotentially affects soil respiration via the soil moisture ratio.Palmroth et al. (2005) measured soil respiration rates in adja-cent pine plantations and hardwood areas in the Duke Forest,North Carolina, USA. They reported that differences in soilrespiration rates were more strongly controlled by the effectsof soil temperature than by soil moisture or soil properties.
In this study, the effects of environmental factors includingsoil moisture and soil temperature and soil property on soilrespiration are estimated individually in a slope scale. Theeffects in an evergreen forest with common forest soil thatdeveloped individually under each environmental conditionon a slope are compared with the effects in a deciduous forestwith very immature soil that is not developed and has similarproperties on a slope.
2 Site Description
The study sites were located in the Yamashiro. Experimen-tal Forest (34◦ 47′ N, 135◦51′ E) and the Kahoku Experimen-tal Forest (33◦08′ N, 130◦43′ E) in Japan (Fig. 1a). The Ya-mashiro forest is a deciduous forest with immature soil, andthe Kahoku forest is an evergreen forest with common brownforest soil.
2.1 Yamashiro experimental forest
The Yamashiro Experimental Forest has been denuded byheavy logging and soil erosion. The ground surface has beenbarren with no vegetation for a long time. A picture drawnin the seventeenth century shows that the Yamashiro areahad no vegetation at that time (Yamashiro town history ed-itorial board, 1986) and remained bare until erosion controland plantation work was performed after 1875 (Goto et al.,2004). Thus, the soil in this location is immature, even today(Araki et al., 1997). The soils, which originate from granite,are Regosols of sandy loam or loamy sand and contain finegranitic gravel (53% by weight). Consequently, the surfacesoil layer at a 5-cm depth has carbon ratios ranging from 38to 42 mg g−1 (Table 1). Most of the trees planted after 1875have died, and the area is currently covered by deciduous for-
R
V
200
170
200
200
200
230
230
(b)
0 100m
N
T
UM
L
(c)
5
10
15
20
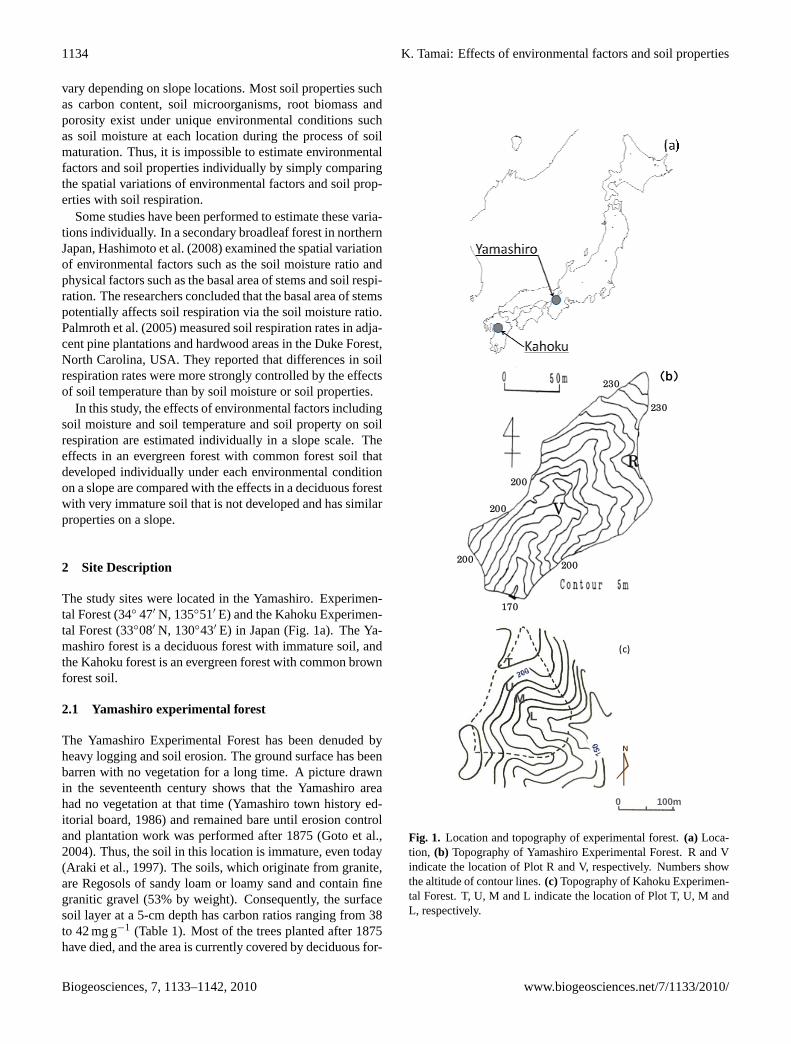
Fig.1 Location and topography of experimental forest.
(a) Location.
(b) Topography of Yamashiro Experimental Forest.
R and V indicate the location of Plot R and V, respectively.
Numbers show the altitude of contour lines.
(c) Topography of Kahoku Experimental Forest.
T, U, M and L indicate the location of Plot T, U, M and L, respectively.
R
V
200
170
200
200
200
230
230
(b)
0 100m
N
T
UM
L
(c)
5
10
15
20
Fig.1 Location and topography of experimental forest.
(a) Location.
(b) Topography of Yamashiro Experimental Forest.
R and V indicate the location of Plot R and V, respectively.
Numbers show the altitude of contour lines.
(c) Topography of Kahoku Experimental Forest.
T, U, M and L indicate the location of Plot T, U, M and L, respectively.
Fig. 1. Location and topography of experimental forest.(a) Loca-tion, (b) Topography of Yamashiro Experimental Forest. R and Vindicate the location of Plot R and V, respectively. Numbers showthe altitude of contour lines.(c) Topography of Kahoku Experimen-tal Forest. T, U, M and L indicate the location of Plot T, U, M andL, respectively.
Biogeosciences, 7, 1133–1142, 2010 www.biogeosciences.net/7/1133/2010/

K. Tamai: Effects of environmental factors and soil properties 1135
Table 1. Outline of the observation plots.
Experimental Plot Slope Slope Altitude Basal area Dominant Total CForest name direction angle (m) of stem species (mg g−1)
(m2 100 m−2)
Yamashiro V S 53◦ W 2◦ 188 0.131 Clethra barvinervis 42R S 52◦ E 18◦ 222 0.322 Ilex pedunclosa 38
Kahoku B S 48◦ W 43◦ 166 0.753 Cryptomeria japonica 81M S 32◦ W 32◦ 184 0.564 Cryptomeria japonica 62U S 5◦ W 22◦ 213 0.382 Chamaecyparis obtusa Sieb. et Zucc. 118T S 17◦ E 6◦ 221 3.855 Chamaecyparis obtusa Sieb. et Zucc. 79
Table 2. Comparison of the variations in factors between experimental forests.
Experimental Variation Variation VariationForest in topography in vegetation in Soil property
Yamashiro Remarkable; Altitude Slight; All plots is Slight;difference is≈30 m covered by deciduous species. Extremely immature soil
Kahoku Remarkable; Altitude Remarkable; Japanese cedar Supposed to be remarkable;difference is≈70 m (Plot B, M) Japanese cypress (Plot U, T) matured forest soil
Duke Slight; Slope angle<5% Remarkable; Hard wood forest(Palmroth et al., 2005) and pine plantation
est dominated by oaks. The mean annual precipitation from1999 to 2002 was 1449.1 mm, with a mean air temperatureof 15.5◦C (Goto et al., 2003).
2.2 Kahoku experimental forest
The lower area of the Kahoku Experimental Forest is cov-ered by an approximately 50-year-old Japanese cedar (Cryp-tomeria japonica) forest and the upper area is covered by a27- to 50-year-old Japanese cypress (Chamaecyparis obtusaSieb. et Zucc.) forest. Crystalline schist underlies the water-shed. The forest soil is classified as brown forest soil (Cam-bisol) with a clay loam texture. This soil is common andjudged to be more mature than that in Yamashiro. The meanannual precipitation from 1992 to 2003 was 2160 mm, andthe mean annual air temperature was 15.4◦C for the sametime period. (Kobayashi and Shimizu, 2007). Detailed soilinformation has been provided by Ishizuka et al. (2006). Thecarbon ratios of the soil surface layer are larger than those atYamashiro, ranging from 78 to 119 mg g−1. The basal areatends to have a larger ratio at the plots at lower altitude, al-though the carbon ratio does not reflect this tendency as itrelates to slope location (Table 1).
2.3 Comparison of the features of experimental forests
The features of the experimental forests including the DukeForest (Palmroth et al., 2005) are summarized in Table 2.These features are compared with those for this study andare presented in the Discussion section.
Altitudinal differences existed at approximately 30 m and70 m in the Yamashiro and Kahoku forests, respectively. To-pographic variability was lower in the pine plantation andhardwood plots of the Duke Forest, with<5% incline in each(Palmroth et al., 2005).
The difference in vegetation among the plots in Yamashirois smaller than those in Kahoku and Duke. The YamashiroExperimental Forest, which is dominated by oaks, exhibitslittle variation in tree species. Conversely, at the KahokuExperimental Forest, Plots L and M were dominated byJapanese cedar, and Plots U and T were dominated byJapanese cypress. The difference in the soil property amongthe plots is supposed to be the smallest in Yamashiro, wheresoils are immature because of heavy disturbance in the past.Thus, soil property is supposed to be same in Plots V andR. In contrast, the soil in Kahoku, which is brown forest soilwith an organized soil structure, is supposed to vary greatlyamong each plot compared to that in Yamashiro. For ex-ample, Kobayashi and Shimizu (2007) reported that soil wa-ter repellency occurred below a threshold water content ofapproximately 0.29 m3 m−3 on the top part of the slope in
www.biogeosciences.net/7/1133/2010/ Biogeosciences, 7, 1133–1142, 2010

1136 K. Tamai: Effects of environmental factors and soil properties
Kahoku. Moreover, the soil in the lower part of the slopein Kahoku includes many fist-sized stones that rolled to thebase of the slope and accumulated there.
3 Observation methodology
3.1 Yamashiro experimental forest
The Yamashiro Experimental Forest is located in a moun-tainous area and includes an approximately 10-m-wide valleywith a 30-m-high ridge (Fig. 1b). The plots are 10 m×10 m.Plot V was at the valley bottom, and Plot R was on a ridgeabove the valley (see Table 1 for plot details). The distancebetween the plots was approximately 70-m horizontally and30-m vertically.
The automated chamber system, with a closed static cham-ber of transparent acrylic, was used to monitor soil respira-tion at the centre of each plot. The inner space of the chamberhad a cross section of 28 cm×13 cm and was 13-cm high.A stainless steel collar was inserted into the soil at 10-cmdepth, and a motor opened and closed the chamber lid au-tomatically (Tamai et al., 2005b). An infrared gas analyzer(IRGA; GMT222, Vaisala, Finland) and thermocouple en-closed in the chamber monitored the CO2 concentration ra-tio and air temperature. Nobuhiro et al. (2003) and Tamaiet al. (2005b) verified the accuracy of this type of enclosedIRGA chamber. The soil temperature and soil moisture ra-tio were monitored simultaneously at a 5-cm depth with aSS-201A (Rogu Denshi, Japan) and a HYDRA (Stevens Vi-tel, USA), respectively, in both plots. No plants were presentin the automated chamber. Observations were made fromJuly 2004 to June 2005. Throughout the winter (December–March), the automated chamber was closed to take measure-ments at 30-min intervals and then opened and inactive for150-min intervals. The active and inactive intervals were 12and 48 min, respectively, for the remaining months. Soil res-piration was monitored by the automated chamber at 1-h in-tervals in summer and 3-h intervals in winter. Analyses werebased on the daily average rate.
To investigate spatial variation in the soil respiration rate,measurements were performed around the automated cham-ber by manually placing an IRGA (GMD-20, Vaisala) en-closed chamber onto eight soil collars set around the auto-mated chamber and inserting it into the soil at a 5-cm depth.The inner space of the chamber was a circle 9.1 cm in di-ameter and 13-cm high (Tamai et al., 2005a). No plantswere present in the soil collars. The manual chamber ob-servations were performed 11 times at Plot V and 10 timesat Plot R. Manual measurements were taken once or twicea day in the afternoon. The manual chamber was closed for30 min from December to March and for 12 min for the othermonths. The closed times for the automated and manualchambers were 12 or 30 min; these time periods were rela-tively longer than those in other studies (Mitani et al., 2006;
Kosugi et al., 2007). However, it was confirmed that the CO2concentration in the chamber increased linearly while below1300 ppm, beyond which CO2 concentration rate tended todecrease (Nobuhiro et al., 2003). The CO2 concentration inthe chamber took much longer than 12 or 30 min to increaseto around 1300 ppm in this experimental forest (Nobuhiro etal., 2003). Thus, the closed times of 12 or 30 min did notcause underestimation of Soil respiration.
3.2 Kahoku experimental forest
In Kahoku, Plots T, U, M and L were established at the top,upper, middle and lower areas, respectively, of a south-facingslope that was approximately 70-m high (Fig. 1c). Detailedplot information is provided in Table 1. The plot size was10 m×10 m. The soil respiration was measured for 24 soilcollars at the centre in each plot using the manual chamberthat was used at Yamashiro. Measurements were performed13 to 14 times in each plot from August 2005 to August 2006.The distances between the collars were around 20 to 30 cm.The frequency was once or twice each month. The closedtime of the manual chamber was 30 min from December toMarch and 12 min for other months. The soil temperature(S-TMB, Onset, USA) and soil moisture (S-SMA, Onset) ata 5-cm depth were also monitored. The soil respiration ratespresented in this study correspond to the average rates mea-sured for the 24 soil collars in each plot.
4 Analysis method
The soil respiration rate was calculated from the soil temper-ature and soil moisture using Eq. (1) (Tamai et al., 2005b;Palmroth et al., 2005):
Fp
(Tp,θp
)= aEXP(bTp)
(θp
c+θp
)(1)
whereFp(Tp,θp) is the soil respiration rate (mg CO2 m−2
s−1), T is the soil temperature (◦C) at 5-cm depth,θ is thesoil moisture ratio (m3 m−3) at 5-cm depth, anda, b andc
are constants. The subscript letter denotes the name of thetest plot, withp = R, V, T, U, M or L.
The magnitudes of the effects of soil temperature, soilmoisture and soil properties on soil respiration rates were es-timated individually using Eqs. (2), (3) and (4), respectively:
EF(T )= Fc (Tt ,θc)−Fc(Tc,θc) (2)
EF(θ)= Fc (Tc,θt )−Fc(Tc,θc) (3)
EF(Soil) = Ft(Tc,θc)−Fc(Tc,θc) (4)
where terms with subscriptsc and t refer to parameters forthe control plot and test plot, respectively.
Measured values forT andθ and previously determinedvalues for the constantsa, b andc were substituted into the
Biogeosciences, 7, 1133–1142, 2010 www.biogeosciences.net/7/1133/2010/

K. Tamai: Effects of environmental factors and soil properties 1137
relevant terms on the right-hand side of Eqs. (2) through (4)to estimate the magnitude of the effect of each parameter onthe soil respiration rate. For example, to estimate the effectof T on the difference in soil respiration rates between thetest plot and control plot, values ofa, b, candθ for the con-trol plot were substituted into both terms of the right-handside of Eq. (2). Only values ofT for test and control plotswere substituted into the first and second terms, respectively,of the right-hand side of Eq. (2). Equation (4) can be used toestimate the effect of soil properties on soil respiration rate,because its parameters,a, b andc, are thought to representfeatures of soil properties (Palmroth et al., 2005). Positive,negative and larger absolute values calculated using Eqs. (2)through (4) imply accelerated, suppressed and greater influ-ence, respectively, of each factor on the soil respiration rate.
5 Results
5.1 Yamashiro experimental forest
Figures 2a and b present seasonal variations in the soil res-piration rate (F ) at Plots V and R, respectively. Spatial vari-ation inF within each plot was large, with the widest rangeof values recorded in the manual chamber (approximately0.2 mg CO2 m−2 s−1). Nevertheless, the soil respiration raterecorded by the automated chamber and the average respira-tion rate based on data from the manual chamber were almostidentical in every case. These results suggest that the valueof F measured with the automated chamber can be regardedas the soil respiration rate for each plot.
TR was slightly higher thanTV in winter, andθV tended tobe slightly higher thanθR (Fig. 2d). However, this differencewas, in general, very small.
Using the minimum total square difference method to es-timate the values for the constants in Eq. (1) for Plots R andV, Eq. (1) can be written as Eqs. (5) and (6), respectively:
FR (TR,θR) = 0.1111EXP(0.1000TR)
(θR
0.6752+θR
)(5)
FV (TV ,θV ) = 0.0424EXP(0.0878TV )
(θV
0.1368+θV
)(6)
The soil respiration rates for Plots R and V, calculated us-ing Eqs. (5) and (6), respectively, agreed well with themeasured soil respiration rates (Fig. 3). The root meansquare error between the calculated and observed respira-tion rates and the ratio between the two over the averageobserved ratio were 0.0002 mg CO2 m−2 s−1 and 1.1% and0.0002 mg CO2 m−2 s−1 and 1.1% for Plots R and V, respec-tively.
5.2 Kahoku experimental forest
T andθ were compared in each of the four plots (Figs. 4e,f). The results indicate that the measured values ofT were
almost the same in each of the four plots. However, the mea-sured values ofθ differed greatly between the plots. PlotL generally had the highestθ values, but the values fluctu-ated the least within a narrow range of values forθL (0.35–0.45 m3 m−3). The widest range ofθ was recorded at Plot T,where the measured values forθT ranged between 0.12 and0.38 m3 m−3. Interestingly, while rapid increases inθU , θM
and θL were recorded after a precipitation event, no com-parable increases inθT were measured, particularly duringwinter. Kobayashi and Shimizu (2007) attributed water re-pellency in forest soil in the Kahoku Experimental Forest tosoil dryness. We also propose soil repellency as the reasonfor the lack of an observed increase inθT following a rainfallevent during this study. Indeed, soil moisture differed greatlybetween the four Kahoku plots.
Using the minimum total square difference method to cal-culate the constants, Eq. (1) can be rewritten as Eqs. (7, 8, 9and 10) for Plots T, U, M and L, respectively.
FT (TT ,θT ) = 0.0904EXP(0.0619TT )
(θT
0.4648+θT
)(7)
FU (TU ,θU ) = 0.0464EXP(0.1049TU )
(θU
0.6935+θU
)(8)
FM (TM ,θM) = 0.0357EXP(0.0969TM)
(θM
0.4716+θM
)(9)
FL(TL,θL) = 0.0159EXP(0.0890TL)
(θL
0.1989+θL
)(10)
The soil respiration rates calculated using Eqs. (7) through(10) agreed well with the observations made at the Kahokuplots (Fig. 5). Seasonal changes in soil respiration ratesfor Plots T, U, M and L, calculated using Eqs. (7) through(10), are shown in Figs. 4a through d, respectively. Theroot mean square error between the calculated and observedrates and the ratio of the two over the averaged observed ra-tio in the four plots were 0.014 mg CO2 m−2 s−1 and 14.6%,0.014 mg CO2 m−2 s−1 and 12.7%, 0.005 mg CO2 m−2 s−1
and 9.9% and 0.017 mg CO2 m−2 s−1 and 16.6% for Plots T,U, M and L, respectively.
5.3 Spatial variations of the estimated annual soilrespiration rates and observed environmentalfactors
The annual rate ofF was estimated to be 21.56 t CO2 ha−1
year−1 and 21.10 t CO2 ha−1 year−1 in Plots R and V, re-spectively, in Yamashiro from 1 July 2004 to 30 June 2005using Eqs. (5) and (6). These two rates are almost equal.These results do not agree with those of Jia et al. (2003), Mi-tani et al. (2006) and Kosigi et al. (2007), who report that thesoil respiration was less at the plots on the lower part of theslope. On the other hand, the annual rate ofF was estimatedto be 24.79 t CO2 ha−1 year−1, 25.13 t CO2 ha−1 year−1,
www.biogeosciences.net/7/1133/2010/ Biogeosciences, 7, 1133–1142, 2010

1138 K. Tamai: Effects of environmental factors and soil properties
0.1
0.2
0.3
Res
pira
tion
CO
2 m
-2 s
-1)
(a)
0.0
2004/7/1 2004/9/1 2004/11/1 2005/1/1 2005/3/1 2005/5/1 2005/7/1
Soi
l
(m
g
n )
0 0
0.1
0.2
0.3
Soil R
espir
ati
on
(mgC
O2
m-2
s-1
(b)
0.0
2004/7/1 2004/9/1 2004/11/1 2005/1/1 2005/3/1 2005/5/1 2005/7/1
10
20
30
tem
pera
ture
(oC
)
(c)0
2004/7/1 2004/9/1 2004/11/1 2005/1/1 2005/3/1 2005/5/1 2005/7/1
Soil
t)
( )
0.05
0.10
0.15
0.20
Mois
ture
(m
3 m
-3
(d)
0.00
2004/7/1 2004/9/1 2004/11/1 2005/1/1 2005/3/1 2005/5/1 2005/7/1Soil M
Fig. 2. Seasonal variation of soil respiration, soil temperature and soil moisture ratio in Yamashiro Experimental Forest.(a) and(b), Soilrespirations in Plot V and R, respectively. Black point: Observed soil respiration by automated chamber system. Gray line: Calculatedsoil respiration by Eqs. (5) and (6), respectively. White square: Averaged soil respiration by manual chamber system. Bar: The range ofmaximum and minimum rate by manual chamber.(c) and(d), Soil temperature and soil moisture, respectively, at 5 cm depth. White dot:Plot V. Black dot: Plot R.
(a) (b)
5
10
15
20
25
Fig.3 Comparison of observed and calculated respiration rate in Yamashiro Experimental
Forest.
(a) Plot R.
(b) Plot V.
Fig. 3. Comparison of observed and calculated respiration rate in Yamashiro Experimental Forest.(a) Plot R.(b) Plot V.
Biogeosciences, 7, 1133–1142, 2010 www.biogeosciences.net/7/1133/2010/

K. Tamai: Effects of environmental factors and soil properties 1139
0.2
0.3
ration
-2s-
1) (a)
0
0.1
0.2
0.3
2005/8/16 2005/10/16 2005/12/16 2006/2/16 2006/4/16 2006/6/16 2006/8/16
Soil
Resp
irat
ion
(mgC
O2
m-2s-
1) (a)
0
0.1
0.2
0.3
2005/8/16 2005/10/16 2005/12/16 2006/2/16 2006/4/16 2006/6/16 2006/8/16
Soil
Resp
irat
ion
(mgC
O2
m-2s-
1)
0.3
(a)
(b)
0
0.1
0.2
0.3
2005/8/16 2005/10/16 2005/12/16 2006/2/16 2006/4/16 2006/6/16 2006/8/16
Soil
Resp
irat
ion
(mgC
O2
m-2s-
1)
0.1
0.2
0.3
Soil
Resp
irat
ion
(mgC
O2
m-2s-
1)
(a)
(b)
0
0.1
0.2
0.3
2005/8/16 2005/10/16 2005/12/16 2006/2/16 2006/4/16 2006/6/16 2006/8/16
Soil
Resp
irat
ion
(mgC
O2
m-2s-
1)
0
0.1
0.2
0.3
2005/8/16 2005/10/16 2005/12/16 2006/2/16 2006/4/16 2006/6/16 2006/8/16
Soil
Resp
irat
ion
(mgC
O2
m-2s-
1)
(a)
(b)
0
0.1
0.2
0.3
2005/8/16 2005/10/16 2005/12/16 2006/2/16 2006/4/16 2006/6/16 2006/8/16
Soil
Resp
irat
ion
(mgC
O2
m-2s-
1)
0
0.1
0.2
0.3
2005/8/16 2005/10/16 2005/12/16 2006/2/16 2006/4/16 2006/6/16 2006/8/16
Soil
Resp
irat
ion
(mgC
O2
m-2s-
1)
0 1
0.2
0.3
Resp
irat
ion
gCO
2m
-2s-
1)
(a)
(c)
(b)
0
0.1
0.2
0.3
2005/8/16 2005/10/16 2005/12/16 2006/2/16 2006/4/16 2006/6/16 2006/8/16
Soil
Resp
irat
ion
(mgC
O2
m-2s-
1)
0
0.1
0.2
0.3
2005/8/16 2005/10/16 2005/12/16 2006/2/16 2006/4/16 2006/6/16 2006/8/16
Soil
Resp
irat
ion
(mgC
O2
m-2s-
1)
0
0.1
0.2
0.3
2005/8/16 2005/10/16 2005/12/16 2006/2/16 2006/4/16 2006/6/16 2006/8/16
Soil
Resp
irat
ion
(mgC
O2
m-2s-
1)
(a)
(c)
(b)
0.2
0.3
pira
tion
m-2s-
1) (d)
0
0.1
0.2
0.3
2005/8/16 2005/10/16 2005/12/16 2006/2/16 2006/4/16 2006/6/16 2006/8/16
Soil
Resp
irat
ion
(mgC
O2
m-2s-
1) (d)
0
0.1
0.2
0.3
2005/8/16 2005/10/16 2005/12/16 2006/2/16 2006/4/16 2006/6/16 2006/8/16
Soil
Resp
irat
ion
(mgC
O2
m-2s-
1)
30
(d)
0
0.1
0.2
0.3
2005/8/16 2005/10/16 2005/12/16 2006/2/16 2006/4/16 2006/6/16 2006/8/16
Soil
Resp
irat
ion
(mgC
O2
m-2s-
1)
10
20
30
oil
tem
pera
ture
(oC
)
(e)
(d)
0
0.1
0.2
0.3
2005/8/16 2005/10/16 2005/12/16 2006/2/16 2006/4/16 2006/6/16 2006/8/16
Soil
Resp
irat
ion
(mgC
O2
m-2s-
1)
0
10
20
30
2005/8/16 2005/10/16 2005/12/16 2006/2/16 2006/4/16 2006/6/16 2006/8/16
Soil
tem
pera
ture
(oC
)
(e)
(d)
0
0.1
0.2
0.3
2005/8/16 2005/10/16 2005/12/16 2006/2/16 2006/4/16 2006/6/16 2006/8/16
Soil
Resp
irat
ion
(mgC
O2
m-2s-
1)
0
10
20
30
2005/8/16 2005/10/16 2005/12/16 2006/2/16 2006/4/16 2006/6/16 2006/8/16
Soil
tem
pera
ture
(oC
)
0 2
0.3
0.4
0.5
ure
rat
io
m-3)
(e)
(d)
0
0.1
0.2
0.3
2005/8/16 2005/10/16 2005/12/16 2006/2/16 2006/4/16 2006/6/16 2006/8/16
Soil
Resp
irat
ion
(mgC
O2
m-2s-
1)
0
10
20
30
2005/8/16 2005/10/16 2005/12/16 2006/2/16 2006/4/16 2006/6/16 2006/8/16
Soil
tem
pera
ture
(oC
)
0.0
0.1
0.2
0.3
0.4
0.5
2005/8/16 2005/10/16 2005/12/16 2006/2/16 2006/4/16 2006/6/16 2006/8/16
Soil
mois
ture
rat
io
(m3m
-3)
(f)
(e)
(d)
Fig. 4. Seasonal variation of soil respiration, soil temperature and soil moisture ratio in Kahoku Experimental Forest. (a, b, candd), Soilrespirations in Plot T, U, M and L, respectively Black line: Calculated soil respiration by Eqs. (7–10), respectively. White square: Averagedsoil respiration by manual chamber system. Bar: The range of maximum and minimum rate by manual chamber.(e)Soil temperature at 5cmdepth Gray dot: Plot T. Line: Plot U. Black dot: Plot M. Plus: Plot L.(f) soil moisture ratio at 5cm depth Gray dot: Plot T. White dot: PlotU. Black dot: Plot M. Plus: Plot L.
www.biogeosciences.net/7/1133/2010/ Biogeosciences, 7, 1133–1142, 2010
1140 K. Tamai: Effects of environmental factors and soil properties
Fig.5
0.25
0.20
0.25
m-2s-
1)
0 10
0.15
on (
mgC
O2
0.05
0.10
oil
resp
irat
io
0.00
0 10 20 30
S
Soil temperature(℃)Soil temperature(℃)
Fig. 5. Comparison of observed and calculated respiration rate inKahoku Experimental Forest. Cross: Plot T. Black diamond: PlotU. White square: Plot M. Gray diamond:Plot L.
Fig. 6 Comparison between soil respiration and soil temperature in Kahoku Experimental
Forest. 5
10
Black square: Plot T. Black circle: Plot U. Cross: Plot M. Black and white triangle: Plot
L.
Three points in dotted circle and white triangle were observed on 27th June, 2006.
Fig. 6. Comparison between soil respiration and soil temperaturein Kahoku Experimental Forest. Black square: Plot T. Black cir-cle: Plot U. Cross: Plot M. Black and white triangle: Plot L.Three points in dotted circle and white triangle were observed on27th June, 2006.
23.87 t CO2 ha−1 year−1 and 14.42 t CO2 ha−1 year−1 forPlots T, U, M and L, respectively, in Kahoku from 16 Au-gust 2005 to 15 August 2006 using Eqs. (7) through (10).The rates in Plots M, U and T are not much different fromeach other. The fact that the rate in only Plot L is much lessis in agreement with the findings of Jia et al. (2003), Mitaniet al. (2006) and Kosigi et al. (2007).
Jia et al. (2003) presumed that soil moisture suppressessoil respiration at the lower slope. Figure 6 shows the re-lationship betweenF andT in four plots in Kahoku. Theobserved values forF in Plots T, U and M on 27 June 2006(dotted circle in Fig. 6) were much greater than other mea-sured soil respiration rates atT ≈ 22◦C. This result can beattributed to elevated values ofθ at this time: 328 mm ofrain fell between 22 June 2006 and 26 June 2006, and themeasurements ofF were made a day after this precipitationevent, whenθ was very large. The observed value ofF inPlot L on 27 June 2006 (shown as1 in Fig. 6) was alsogreater than the other observed rates for Plot L.
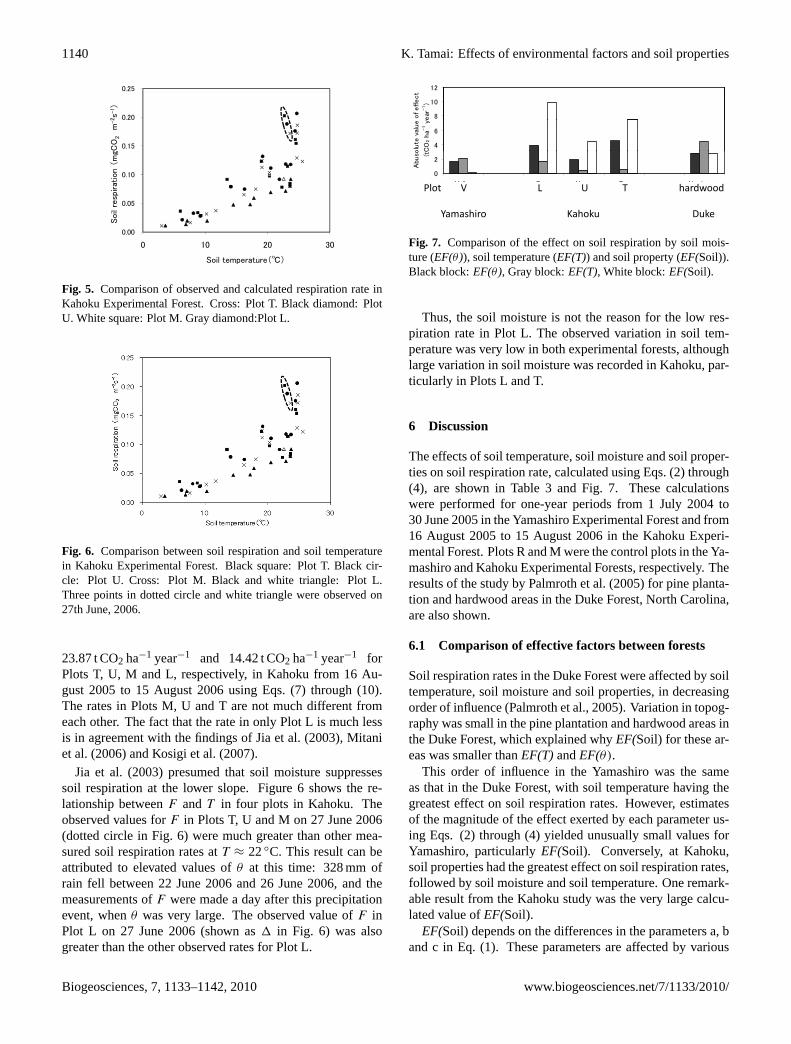
Fig.7
12
8
10
12
of effect
year
-1)
4
6
olu
te v
alue
CO
2 h
a-1 y
0
2
V ll B U T H d d
Abu
so (tC
Valley Base Upper Top Hard wood
Soil moisture Soil temperature Parameter
Plot V L U T hardwood
Yamashiro Kahoku DukeYamashiro Kahoku Duke
Fig. 7. Comparison of the effect on soil respiration by soil mois-ture (EF(θ )), soil temperature (EF(T)) and soil property (EF(Soil)).Black block:EF(θ ), Gray block:EF(T), White block:EF(Soil).
Thus, the soil moisture is not the reason for the low res-piration rate in Plot L. The observed variation in soil tem-perature was very low in both experimental forests, althoughlarge variation in soil moisture was recorded in Kahoku, par-ticularly in Plots L and T.
6 Discussion
The effects of soil temperature, soil moisture and soil proper-ties on soil respiration rate, calculated using Eqs. (2) through(4), are shown in Table 3 and Fig. 7. These calculationswere performed for one-year periods from 1 July 2004 to30 June 2005 in the Yamashiro Experimental Forest and from16 August 2005 to 15 August 2006 in the Kahoku Experi-mental Forest. Plots R and M were the control plots in the Ya-mashiro and Kahoku Experimental Forests, respectively. Theresults of the study by Palmroth et al. (2005) for pine planta-tion and hardwood areas in the Duke Forest, North Carolina,are also shown.
6.1 Comparison of effective factors between forests
Soil respiration rates in the Duke Forest were affected by soiltemperature, soil moisture and soil properties, in decreasingorder of influence (Palmroth et al., 2005). Variation in topog-raphy was small in the pine plantation and hardwood areas inthe Duke Forest, which explained whyEF(Soil) for these ar-eas was smaller thanEF(T) andEF(θ).
This order of influence in the Yamashiro was the sameas that in the Duke Forest, with soil temperature having thegreatest effect on soil respiration rates. However, estimatesof the magnitude of the effect exerted by each parameter us-ing Eqs. (2) through (4) yielded unusually small values forYamashiro, particularlyEF(Soil). Conversely, at Kahoku,soil properties had the greatest effect on soil respiration rates,followed by soil moisture and soil temperature. One remark-able result from the Kahoku study was the very large calcu-lated value ofEF(Soil).
EF(Soil) depends on the differences in the parameters a, band c in Eq. (1). These parameters are affected by various
Biogeosciences, 7, 1133–1142, 2010 www.biogeosciences.net/7/1133/2010/

K. Tamai: Effects of environmental factors and soil properties 1141
Table 3. Comparion of the effect on soil respiration by soil moisture (EF(θ)), soil temperature (EF(T)) and soil property (EF(Soil)).
Experimental Forest Yamashiro Kahoku Duke(Palmroth et al., 2005)
Plot R V L M U T Pine HardPlantation Wood
EstimatedFc 21.56 21.10 14.42 23.87 25.13 24.79 41.80 51.66(tCO2 ha−1 year−1)
Deifference ofFc Standard −0.46 −9.45 Standard 1.27 0.92 Standard 9.86from the standard site site site site(tCO2 ha−1 year−1)
Effect of θ 1.66 3.89 −1.90 −4.55 2.79tCO2 ha−1 year−1)
Effect ofT −2.10 −1.74 −0.48 −0.54 4.40(tCO2 ha−1 year−1)
Effect of parameters 0.20 −9.84 4.41 7.61 2.67(tCO2 ha−1 year−1)
properties including total C, microbial biomass and activ-ity, root biomass and activity and porosity. These propertiesdevelop within the environment, e.g. soil temperature, soilmoisture and vegetation, at each location. The soil in Ya-mashiro is immature and its properties have not developed ateach location. Thus, the soil characteristics exhibited mini-mal variation and created a very small value ofEF(Soil) forYamashiro. Conversely, many factors such as topography,vegetation and soil moisture varied greatly among the plotsin Kahoku. Properties of the forest soil at this location devel-oped under the conditions that in turn were influenced by thelarge variation of many factors. Thus, each soil type fromthe four plots in Kahoku had different characteristics. Forexample, the soil in Plot T had water repellency properties,which suggests peculiar microbial or root activity.
The smallerEF(Soil) in Yamashiro is the result of imma-ture soil that has not developed enough to make it differentamong the plots. On the other hand, the largerEF(Soil) inKahoku is the result of the soil that has developed under theconditions present at each location, thus making it differentamong the plots.
6.2 Relation between EF(θ ) and EF(Soil) in Kahoku
The annual calculated soil respiration rate was almost thesame (23–26 t CO2 ha−1 year−1) in three of the plots at Ka-hoku, with the exception of Plot L. The positive and negativevalues ofEF(θ) andEF(Soil) differed from each other in ev-ery plot in Kahoku. This suggests that the effects ofEF(θ)
andEF(Soil) cancel each other out in Kahoku, and that soilrespiration rates become nearly equal. This discussion can beapplied forEF(θ) andEF(T) in Plots R and V in Yamashiro.
F in Plot L was much less thanF in the other three plots inKahoku. Soil respiration was increased after heavy precipi-tation events in every plot in Kahoku, as shown in Fig. 6. The
value ofEF(θ) in Plot L is positive, 3.89 t CO2 ha−1 year−1,and indicates that soil moisture accelerated soil respiration inPlot L. In contrast, the value ofEF(Soil) in Plot L is negative,at −9.84 t CO2 ha−1 year−1, and indicates that soil propertydecelerates soil respiration. Thus, it is concluded that the re-stricting factor in Plot L is soil respiration, not the wet soilcondition. The peculiar characteristics of the soil in Plot Lincluded many fist-sized stones that rolled to the base of theslope and accumulated there. Consequently, the soil volumecontributing to soil respiration was small. This characteristicis supposed to minimize soil respiration in Plot L.
7 Conclusions
This study concludes as follows:
1. The cause of the smallerEF(Soil) in Yamashiro was im-mature soil and the fact that the soil had not developedenough to be different among the plots. Whereas thecause of the largerEF(Soil) in Kahoku was the fact thatthe soil had developed under the conditions at each lo-cation and was different among the plots.
2. The positive and negative effects of soil moisture andsoil properties,EF(θ) andEF(Soil), differed from eachother in every plot in Kahoku and Yamashiro. Conse-quently, their effects cancelled out each other, possiblyleading to nearly equal annual rates of soil respirationin Plots T, U and M in Kahoku. This can be appliedfor EF(θ) and EF(T) in Plots V and R in Yamashiro,respectively.
3. The restricting factor of soil respiration in Plot L isjudged to be the soil property, not the wet soil condi-tion.
www.biogeosciences.net/7/1133/2010/ Biogeosciences, 7, 1133–1142, 2010
1142 K. Tamai: Effects of environmental factors and soil properties
Acknowledgements.This study was supported by JSPS A3Foresight Program, the Global Environment Research Accountfor National Institutes Long-term Monitoring of Carbon Flux andPromotion of Data Network in Asian Terrestrial Ecosystems andResearch Fund (Evaluation, Adaptation and Mitigation of GlobalWarming in Agriculture, Forestry and FisheriesFResearch andDevelopment) by Ministry of Agriculture, Forestry and Fisheriesof Japan.
Edited by: J. Chen
References
Araki, M., Torii, A., Kaneko, S., and Yoshioka, J.: Estimation ofthe soil water holding capacity and soil water content in a granitesmall watershed, Applied Forest Science, (in Japanese), 6, 49–52, 1997.
Dannoura, M., Kominami, Y., Tamai, K., Jomura, M., Miyama, T.,Goto, Y., and Kanazawa, Y.: Development of an automatic cham-ber system for long-term measurements of CO2 flux from roots,Tellus, 58B, 502–512, 2006.
Davidson, E. A., Belk, E., and Boone, R. D.: Soil water contentand temperature as independent and confounded factors control-ling soil respiration in a temperate mixed hardwood forest, Glob.Change Biol., 4, 217–227, 1998.
Davidson, E. A., Savage, K., Verchot, L. V., and Navarro, R.: Min-imizing artifacts and biases in chamber-based measurements ofsoil respiration, Agric. and For. Meteorol., 113, 21–37, 2002.
Fang, C., Moncrieff, J. B., Gholz, H. L., and Clark, K. L.: Soil CO2efflux and its spatial variation in a Florida slash pine plantation,Plant Soil, 205, 135–146, 1998.
Goto, Y., Kominami, Y., Miyama, T., Tamai, K., and Kanazawa ,Y.:Aboveground biomass and net primary production of a broad-leaved secondary forest in the southern part of Kyoto Prefec-ture, central Japan, Bull. of the For. and For. Prod. Res. Inst.,(inJapanese with English abstract), 2, 115–147, 2003.
Goto, Y., Tamai, K., Miyama, T., and Kominami, Y.: Stand structureand dynamics during a 5-year period in a broad-leaved secondaryforest in southern Kyoto Prefecture, central Japan, Jpn. J. Ecol.,(in Japanese with English summary), 54, 71–84, 2004.
Hanson P. J., Edwards, N. T., Garten, C. T., and et al.: Separatingroot and soil microbial contributions to soil respiration in a forestecosystem, Biogeochemistry, 48, 115–146, 2000.
Hanson, P. J., Wullschleger, S. D., Bohlman, S. A., and Todd, D.E.: Seasonal and topographic patterns of forest floor CO2 effluxfrom an upland oak forest, Tree Physiol., 13, 1–15, 1993.
Hashimoto, T., Miura, S., Ikeda, S., and Shichi, K.: Estimation ofspatial variation of soil CO2 efflux from tree index, J. Jpn. For.Soc., (in Japanese with English summary), 90, 386–390, 2008.
Ishizuka S., Sakata, T., Sawata, S., Ikeda, S., Takenaka C., TamaiN., Sakai H., Shimizu, T., Kan-na, K., Onodera, S, Tanaka, N.,and Takahashi, M.: High potential for increase in CO2 flux fromforest soil surface due to global warming in cooler areas of Japan,Ann. For. Sci., 63, 537–546, 2006.
Jia, S., Akiyama, T., Mo, W., Inatomi, M., and Koizumi, H.: Tem-poral and spatial variability of soil respiration in a cool tempera-ture broad-leaved forest. 1.Measurement of spatial variance andfactor analysis, Jpn. J. Ecol., 53, 13–22, 2003. (in Japanese withEnglish abstract)
Kobayashi, M. and Shimizu, T.: Soil water repellency in a Japanesecypress plantation restricts increases in soil water storage duringrainfall events, Hydrol. Process., 21, 2356–2364, 2007.
Kominami, Y., Miyama, T., Tamai, K., Nobuhiro, T., and Goto, Y.:Characteristics of CO2 flux over a forest on complex topography,Tellus, 55B, 313–321, 2003.
Kosugi, Y., Mitani, T., Itoh, M., Noguchi, S., Tani, M., Matso, N.,Takanashi, S., Ohkubo, S., and Nik, A. R.: Spatial and temporalvariation in soil respiration in a Southeast Asian tropical rainfor-est, Agric. For. Meteorol., 147, 16–34, 2007.
Mitani, T., Kosugi, Y., Osaka,K., Ohkubo,S., Takanashi, S., andTani, M.: Spatial and temporal variability of soil respiration rateat a small watershed revegetated with Japanese cypress, J. Jpn.For. Soc., (in Japanese with English summary), 88, 496–507,2006.
Nobuhiro, T., Tamai, K., Kominami, Y., Miyama, T., Goto, Y., andKanazawa, Y.: Development of IRGA enclosed-chamber systemfor soil CO2 efflux measurement and its application to a spatialvariation measurement, J. For. Res., 8, 297–301, 2003.
Ohashi M. and Gyokusen K.: Temporal change in spatial variabil-ity of soil respiration on a slope of Japanese ceder (Cryptomeriajaponica D. Don) forest, Soil Biol. Biochemi., 39, 1130–1138,2007.
Palmroth, S., Maier, C. A., McCarthy, H. R., Oishi, A. C., Kim,H.-S., Johnsen, K. H., Katul, G. G., and Oren, R.: Contrastingresponses to drought of forest floor CO2 efflux in a Loblolly pineplantation and a nearby Oak-Hickory forest, Glob. Change Biol.,11, 1–14, 2005.
Sotta, E. D., Veldkamp, E., Guimaraes, B. R., Paixao, R. K., Ruivo,M. L. P., and Almeida, S. S.: Landscape and climatic controlson spatial and temporal variation in soil CO2 efflux in an EasternAmazonian rainforest, Caxiuana,Brazil, For. Ecol. Manage., 237,57–64, 2006.
Sugawara, T., Kumagai, T., Ohashi, M., Morooka, T., and Suzuki,M.: Nighttime CO2 flux over a Bornean tropical rainforest, J.Jpn. Soc. Hydrol. Water Resour., 18, 64–77, 2005.
Tamai, K., Kominami, Y., Miyama, T., and Goto, Y.: The estimationof time series data for soil respiration based on soil temperatureand soil moisture content ratio and its spatial variations in a smallmountainous catchment: in the case of weathered granite regionin southern Kyoto Prefecture, J. Jpn. For. Soc., (in Japanese withEnglish summary), 87, 331–339, 2005a. .
Tamai, K., Kominami, Y., Miyama, T., and Goto, Y.: Temporal fluc-tuations in the CO2 efflux on a forest floor—the case of an ex-tremely immature forest soil, J. Agric. Meteorol., 60, 773–776,2005b.
Yamashiro town history editorial board: Yamashiro town history –text part –, pp. 999, Yamashiro town hall, (in Japanese), 1986.
Biogeosciences, 7, 1133–1142, 2010 www.biogeosciences.net/7/1133/2010/