Embed Size (px)
Citation preview

EFFECTS OF INTRODUCED GROUNDWATER ON WATER CHEMISTRY
AND FISH ASSEMBLAGES IN CENTRAL FLORIDA LAKES
By
PATRICK COONEY
A THESIS PRESENTED TO THE GRADUATE SCHOOL OF THE UNIVERSITY OF FLORIDA IN PARTIAL FULFILLMENT
OF THE REQUIREMENTS FOR THE DEGREE OF MASTER OF SCIENCE
UNIVERSITY OF FLORIDA
2004

Copyright 2004
by
Patrick Cooney

To my dad, Michael Leo Cooney, you are missed, and I will never stop loving and thinking about you.

ACKNOWLEDGMENTS
I first thank Dr. Mike Allen for serving as my advisor and committee chair. I am
very grateful for his guidance throughout this project.
I also thank Doug Leeper at the Southwest Florida Water Management District
(SWFWMD) for his time and providing necessary access and information, and Dr. Daniel
Canfield Jr. and Dr. Tom Frazer for their advice while serving as members of my
graduate committee. Similarly, I thank Mark Hoyer of the Department of Fisheries and
Aquatic Sciences for his advice.
I especially express my gratitude to the following people for their tremendous
support in the field and lab: M. Bennett, T. Bonvechio, S. Cooney, K. Dockendorf, D.
Dutterer, J. Harris, K. Henry, G. Kaufman, S. Larson, C. Mwatela, E. Nagid, M. Rogers,
N. Trippel and G. Warren. I also thank all of the people in the LAKEWATCH laboratory
for their time and use of laboratory equipment.
Most importantly, I thank and dedicate this to the people closest to me. Sean’s help
on my project meant a lot to me. As his younger brother, I have greatly appreciated his
guidance and encouragement throughout my life. The foundation that my mom and dad
built and the constant support they both provided along the way made me who I am
today. I never could have attained this goal without all of them and the rest of my family.
Finally, I thank Julie. She has been with me every step of the way for the duration of this
venture. Aside from the tremendous help she provided on this project, I most appreciated
when she was there at the end of the day to make me smile.
iv

TABLE OF CONTENTS page ACKNOWLEDGMENTS ................................................................................................. iv
LIST OF TABLES............................................................................................................. vi
LIST OF FIGURES .......................................................................................................... vii
ABSTRACT..................................................................................................................... viii
INTRODUCTION ...............................................................................................................1
METHODS ..........................................................................................................................4
Study Sites ....................................................................................................................4 Electrofishing................................................................................................................7 Fish Population Measures.............................................................................................8 Fish Population Analysis ............................................................................................10
RESULTS ..........................................................................................................................14
Comparison of Limnological Variables......................................................................14 Groundwater Pumping History...................................................................................15 Fish Population Comparisons .....................................................................................16 Multiple Regression Analysis.....................................................................................17 Canonical Correspondence Analysis ..........................................................................18 Cluster Analysis..........................................................................................................20
DISCUSSION....................................................................................................................35
MANAGEMENT IMPLICATIONS .................................................................................46
APPENDIX COMMONLY HARVESTED FISH SPECIES...........................................48
LIST OF REFERENCES...................................................................................................49
BIOGRAPHICAL SKETCH .............................................................................................55
v
LIST OF TABLES
Table page 1 The county, wellfield in closest proximity, location, surface area, average depth
determined with fathometer and year of first groundwater augmentation for the seven study lakes. .....................................................................................................27
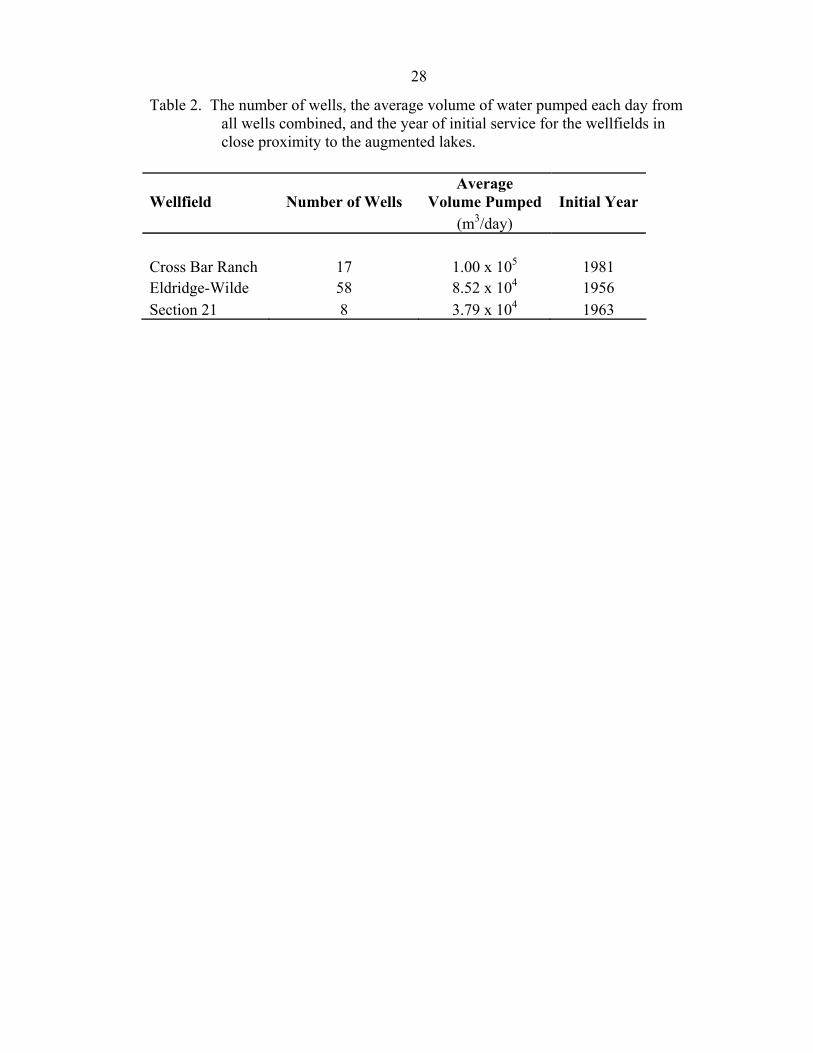
2 The number of wells, the average volume of water pumped each day from all wells combined, and the year of initial service for the wellfields in close proximity to the augmented lakes. ...........................................................................28
3 Mean limnological characteristics in 2003...............................................................29
4 Groundwater pumping history in augmented lakes..................................................30
5 Water chemistry of groundwater from well samples and historical lake water samples prior to initial augmentation. ......................................................................31
6 Fish population measures of augmented and nonaugmented lakes..........................32
7 Significant linear regression models predicting dependent fish variables at nonaugmented and augmented lakes combined. ......................................................33
8 Results of canonical correspondence analysis (CCA) for 34 fish species abundances, as measured by catch per unit effort, from 43 lakes in Florida. ..........34
9 Intraset correlation between the limnological variables examined and the three axes in the canonical correspondence analysis (CCA) using 34 fish species abundances, as measured by catch per unit effort, from 43 lakes in Florida ...........34
A-1 Commonly harvested fish species, and the total length (mm) at which they are generally first harvested. ..........................................................................................48
vi

LIST OF FIGURES
Figure page 1 Augmented lakes sampled in three Florida counties................................................22
2 Simple linear regressions of (a) Log10 transformation of species evenness by number of fish versus Secchi depth, and (b) diversity by number of fish versus Secchi depth .............................................................................................................23
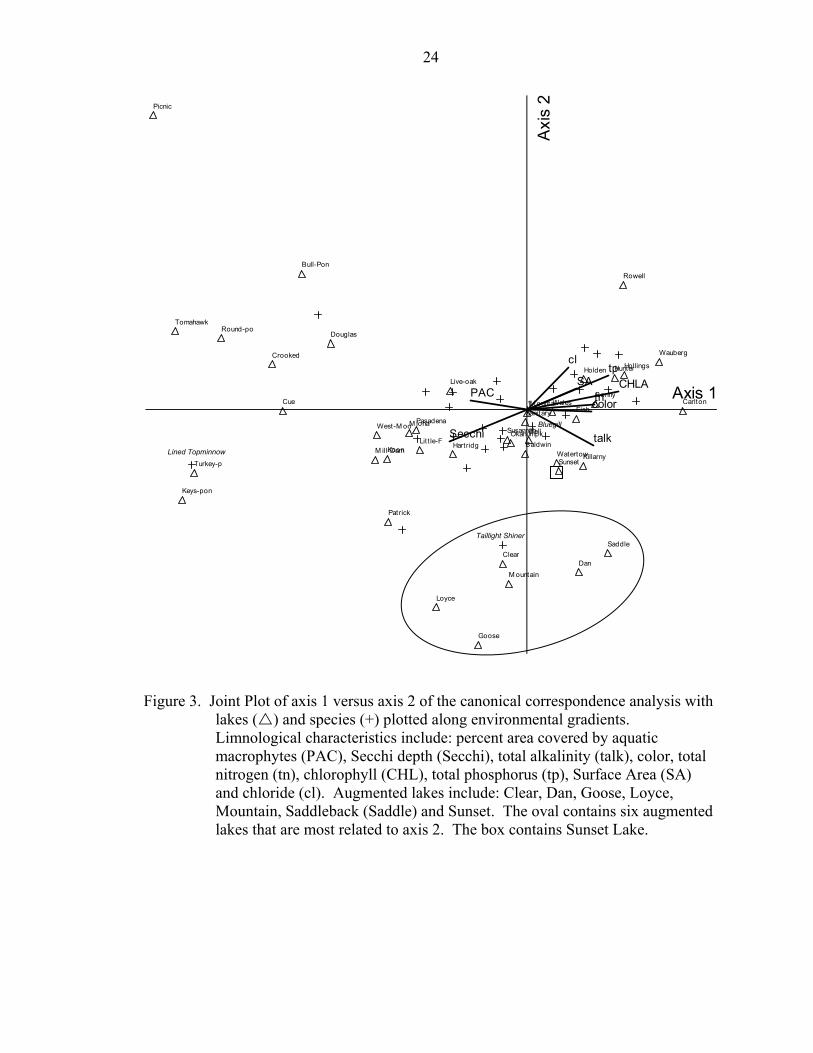
3 Joint Plot of axis 1 versus axis 2 of the canonical correspondence analysis with lakes and species plotted along environmental gradients.........................................24
4 Joint Plot of axis 2 versus axis 3 of the canonical correspondence analysis with lakes and species plotted along environmental gradients.........................................25
5 Cluster analysis of lakes using total alkalinity, chloride, total phosphorus, and Secchi depth. ............................................................................................................26
vii

Abstract of Thesis Presented to the Graduate School
of the University of Florida in Partial Fulfillment of the Requirements for the Degree of Master of Science
EFFECTS OF INTRODUCED GROUNDWATER ON WATER CHEMISTRY AND FISH ASSEMBLAGES IN CENTRAL FLORIDA LAKES
By
Patrick Cooney
August 2004
Chair: Micheal S. Allen Major Department: Fisheries and Aquatic Sciences
Water levels in central Florida lakes have declined since the 1960s as a result of
numerous factors. To maintain water levels in these lakes, the Southwest Florida Water
Management District (SWFWMD) issued permits to pump water from limestone aquifers
into lakes. I assessed effects of groundwater augmentation on limnological variables and
fish assemblages in seven Central Florida lakes.
Pumping history information indicated that lake level fluctuations were reduced,
and pumping volumes could replace the volume of water in a lake multiple times in a
single year. Well water samples, when compared with current lake water samples,
indicated that well water had higher mean total alkalinity and total phosphorus
concentrations, and lower concentrations of total nitrogen and chlorides. The
replacement of original lake water with aquifer water indicated similar patterns when
comparing current lake water samples to historical samples prior to initial introduction of
groundwater. Current lake water samples had higher mean pH, Secchi depth, total
viii
alkalinity, total phosphorus, and chloride concentrations, and lower mean color, nitrogen
and chlorophyll concentrations than historical means.
Historical fish population studies did not exist on these lakes therefore data from
the augmented lakes were compared to 36 nonaugmented lakes in Florida. The mean
values for catch per unit effort (CPUE), species richness and biomass of harvestable
fishes were lower in augmented lakes than those in nonaugmented lakes. However,
significant multiple linear regressions indicated that fish population responses of
augmented lakes to environmental variables were similar to nonaugmented lakes with
similar limnological characteristics.
Canonical correspondence analysis (CCA) was used to examine the relationship
between the abundance of individual fish species and measured limnological
characteristics. Most fish species and nonaugmented lakes were correlated with axis one
of the CCA, whereas augmented lakes were more related to axis two, indicating that
augmented lakes were characteristic of high total alkalinity and Secchi depth, and low
chloride and phosphorus concentrations. Cluster analysis with these four variables
further demonstrated the similarities in limnological characteristics among augmented
lakes. Joint plots of the CCA indicated a high probability of a low abundance of
individual species in augmented lakes compared to a majority of nonaugmented lakes.
One of the augmented lakes had much lower pumping rates than the others, and
exhibited less of a shift in limnological variables from historical values, as well as had
fish population characteristics more closely resembling those of nonaugmented lakes in
the joint plot of the CCA. Therefore, reduced volumes of groundwater introduction could
reduce the alteration of limnological and fish population characteristics.
ix

INTRODUCTION
Lake water levels in central Florida have drastically decreased since the 1960s due
to multiple influences. As a consequence of low precipitation (Stewart and Hughes
1974), groundwater levels were depressed and discharges of inlet streams were
significantly reduced, causing lakes to receive little water input (Dooris and Martin
1979). Further, urban development changed Florida’s drainage systems and diverted
storm runoff away from lakes (Stewart and Hughes 1974), and agriculture endeavors
withdrew water from lakes for citrus irrigation and freeze protection (Dooris and Moresi
1975). Population expansion also increased water demand, resulting in increased
pumping of aquifer water at wellfields, subsequently lowering groundwater and lake
levels (Stewart 1968; Stewart and Hughes 1974; Allen 1999).
Groundwater is utilized for public, industrial and agricultural purposes (Southwest
Florida Water Management District [SWFWMD] 1998; Brenner et al. 2000). In the
northern Tampa area, groundwater pumping at wellfields began in 1963 to meet the
increased demands for water (Stewart and Hughes 1974). Wells ranged from 120 to 180
meters in depth and produced thousands of cubic meters of water a day from the Tampa
and Suwannee Limestone Formations, the two uppermost layers of the Floridan Aquifer
(Stewart and Hughes 1974; Sinclair 1977). The Floridan Aquifer is comprised of sand
and clay in the upper regions, with dolomite comprising the lower regions (Stewart and
Hughes 1974; Belanger and Kirkner 1994).
1

2
Lakes in the vicinity of the wellfields were hydraulically connected to the water
table aquifer, meaning that water moved naturally between the lakes and the water table
aquifer, a surficial aquifer located two to five meters below land surface (Stewart and
Hughes 1974). As groundwater was pumped at wellfields, a localized cone of depression
formed in the Floridan Aquifer, inducing an increase in leakage from the water table
aquifer to the Floridan Aquifer. As a result, flow increased from the lakes to the water
table aquifer, causing a decline in water levels in lakes near wellfields considerably
greater than those that would naturally occur in lakes away from wellfields (Stewart
1968; Stewart and Hughes 1974; BRA 1996).
Landowners expressed concern with the declining lake water levels, and in order to
address the issue, the SWFWMD permitted landowners to construct wells of similar
depths to those in the wellfields for pumping water from the Floridan Aquifer into lakes
(BRA 1982; Dooris et al. 1982; Belanger and Kirkner 1994; BRA 1996; Allen 1999).
Water levels in these lakes are now constantly maintained slightly above original mean
lake levels and are not pumped to a degree that will allow spill over (Stewart and Hughes
1974). However, maintaining lake levels at higher than normal levels accelerates
evaporation rates, and also increases leakage of lake water, further increasing the
permeability of lake-bottom sediments (Stewart and Hughes 1974; Belanger and Kirkner
1994). As lake water leakage increases, even more groundwater is necessary to maintain
water levels year round (Stewart and Hughes 1974).
Previous investigations evaluated the altered water chemistry of augmented lakes
and the consequent change in macrophyte growth and phytoplankton diversity. For
example, Martin et al. (1976b) found that the elevated hardness of pumped groundwater

3
increased the ability of augmented lakes to support hydrilla, Hydrilla verticillata, growth,
and Dooris et al. (1982) found that phytoplankton diversity was enhanced in augmented
lakes due to increased concentrations of inorganic carbon via groundwater input.
Little work has assessed effects of groundwater augmentation on fish communities
(Bartos 1998; Allen 1999). I evaluated the influence of lake augmentation on
limnological charateristics and fish populations in seven augmented lakes in central
Florida in the summer of 2002. My objectives were to 1) determine limnological
characteristics and pumping history of seven augmented lakes and their corresponding
groundwater wells and compare the limnological characteristics between lakes, wells and
historical data, 2) estimate fish population parameters in the lakes, and 3) compare
augmented lake limnological characteristics and fish populations with those from a data
base of 36 nonaugmented Florida Lakes.

METHODS
Study Sites
The seven augmented lakes are located in Pasco, Hillsborough, and Polk counties
in central Florida (Figure 1). The lake surface areas (SA) were obtained from the
Gazetteer of Florida Lakes (Shafer et al. 1986) and unpublished SWFWMD reports, and
the locations of the lakes were obtained using global positioning system (GPS)
coordinates from a Garmin GPSMAP 76 (Table 1). These lakes are not spring-fed from
the Floridan Aquifer but do exchange water with surficial aquifers. Each lake exhibited
significant declines in water levels due to reduced rainfall and wellfield pumping, where
hundreds of thousands of cubic meters of water were removed from the Floridan Aquifer
each day (Table 2), creating the necessity to pump Floridan Aquifer water into each lake
to maintain lake levels. Goose Lake was the first of the study lakes to be augmented,
(1954), and Loyce Lake the most recent (1996) (Table 1).
Limnological Characteristics
I assessed some important limnological characteristics of my study lakes in August,
2003. The percent lake area covered by aquatic macrophytes (PAC) was recorded using
a boat-mounted Raytheon DE-719 Precision Survey Fathometer (Maceina and Shireman
1980). Seven transects were made across each lake at a constant speed while the
fathometer recorded the presence or absence of plants on a paper roll. The total length of
paper recorded on for each lake was divided into 100 equally spaced instantaneous
samples, and the presence or absence of plants at these locations was recorded. The
4

5
number of locations with aquatic vegetation present was expressed as a percentage
(Canfield and Hoyer 1992).
For water chemistry, three 1-liter samples of water were collected at arm depth
(~0.5m) in acid-cleaned Nalgene bottles at three mid-lake sampling stations established
in each lake in August of 2003. The samples were immediately placed on ice and
returned to the laboratory for analysis. Secchi depth (m) was measured at each station
and averaged to determine mean Secchi depth. Dissolved oxygen concentration (mg/L)
and temperature (oC) were also measured with a Model 85 Yellow Springs Instrument
(YSI) meter at about 40% of the depth at each mid-lake station and at the location of
pumped water discharge.
Upon arriving at the laboratory (University of Florida, Gainesville, Florida), pH
was measured immediately using an Orion Model 601A pH meter calibrated against
buffers at pH 4.0, 7.0, and 10.0. Total alkalinity (mg/L as CaCO3) was determined by
titration with 0.02 molar H2SO4 (APHA 1989). Chlorophyll concentrations (µg/L) were
determined spectrophotometrically (method 10200 H (2c), APHA 1989) following
pigment extraction with ethanol (Sartory and Grobbelaar 1984). Total phosphorus
concentrations (µg/L) were determined using procedures of Murphy and Riley (1962)
with a persulfate digestion (Menzel and Corwin 1965). Total nitrogen concentrations
(µg/L) were determined by oxidizing water samples with alkaline persulfate and
determining nitrate-nitrogen with second derivative spectroscopy (D’Elia et al. 1977;
Simal et al. 1985; Wollin 1987; Crumpton 1992). Chloride concentrations (mg/L) were
determined by titration of the water samples with 0.0141 mole mercuric nitrate and using
diphenylcarbazone for determining endpoints (Hach Chemical Company 1975). To

6
analyze for color (platinum-cobalt units), water samples were first filtered through a
Gelman type A-E glass fiber filter. Color was then determined by using the platinum-
cobalt method and a spectrophotometer (APHA 1989).
Three 1-liter water samples were also collected from each of the wells supplying
water to the lakes in August of 2003. The volume of the well delivery pipe was
measured, and the pump was run to flush the pipe with at least twice the calculated
volume before water samples were taken. These samples were placed on ice and returned
to the laboratory and analyzed at the same time as the lake samples for pH, total
alkalinity, total phosphorus, total nitrogen, and chloride concentrations. Chlorophyll
concentrations and color were not determined for the well samples because natural
filtration and lack of sunlight exposure that is characteristic of the Floridan Aquifer
makes the levels of these variables negligible. Secchi depth was not measured within the
well pipe.
The pumping history of each study lake was determined from unpublished
SWFWMD reports. The daily, monthly and yearly averages from these reports were
used to determine the average amount of groundwater pumped on a yearly basis. The
volume of each lake was determined by multiplying the surface area of the lake by the
average depth determined from the fathometer transects. The average volume of water
pumped per year was then divided by the volume of the lake to determine the amount of
times per year the water pumped would replace the current volume of water in each lake.
Mountain Lake and Sunset Lake each share pumps with other lakes, and the amount of
pumped water for individual lakes was not separately recorded. Therefore, I calculated

7
the volume of all lakes receiving water from a shared pump, and determined the
percentage of the total volume attributed to Mountain and Sunset lakes.
Finally, I compared the ranges and means of limnological characteristics of the
augmented lakes to the well water, and to the limited amount of historical water
chemistry data for the augmented lakes that existed prior to initial pumping of aquifer
water.
Electrofishing
Fish populations in the seven augmented lakes were sampled during the warm
season in July or August of 2002 using electrofishing. Electrofishing transects of
continuous DC current were conducted for ten minutes to collect fish in the littoral area
of each lake with a 4.3 m aluminum jon boat powered by a 15 horsepower outboard
motor. Six transects were conducted at Clear, Dan and Sunset lakes, seven transects at
Goose, Loyce and Saddleback lakes, and eight at Mountain Lake. The number of 10-
minute transects indicate how many transects were necessary to circumnavigate the entire
lake. Electrofishing equipment consisted of a generator (5000 Watt AC), pulsator
(Coffelt model VVP 15) and a bow-mounted cathode probe supplying an electrical output
of approximately seven amps. All collected fish from each transect were counted,
measured to the nearest millimeter total length (TL), weighed to the nearest gram, and
identified to species. Fish with total lengths less than 20 mm TL were not included in
analyses due to selectivity of the gear (Reynolds 1996).
Due to the lack of fish population studies on these augmented lakes prior to the
initial pumping of water, I compared the data collected from augmented lakes to a data
set of 60 nonaugmented Florida lakes (Canfield and Hoyer 1992; Bachmann et al. 1996).
Two lakes, Mountain and Gate, were removed from the 60 lake data set because they

8
were augmented lakes. Three lakes, Apopka, Lochloosa and Harris, were also removed
due to their surface areas being orders of magnitude larger than all other study lakes,
because lake size influences species richness (Bachmann et al. 1996).
To assess the likelihood that more electrofishing transects would add additional
species, I constructed curves, using Bachmann et al.’s method, for augmented and
nonaugmented lakes demonstrating the cumulative number of fish species captured as
more transects were conducted (Bachmann et al. 1996). To ensure that the right-hand
portion of the curves flattened, the number of species captured in the next to last
electrofishing transect was divided by the number of species captured in the last transect,
and expressed as a percentage, which was termed the exhaustion index (Bachmann et al.
1996). All seven augmented lakes had exhaustion indexes of 100%, meaning that all
captured species from each lake had already been captured by the next to last transect. In
19 of the 55 nonaugmented lakes, the exhaustion indexes were less than 90%, possibly
indicating that these lakes were inadequately sampled. Therefore, these 19 lakes were
not used in the analyses. The remaining 36 nonaugmented lakes had exhaustion indexes
that equaled or exceeded 90%, indicating that the right-hand portion of the curves had
flattened. These 36 nonaugmented lakes were used for comparison with the seven
augmented lakes.
Fish Population Measures
For the seven augmented lakes and the remaining 36 nonaugmented lakes, I
estimated catch per unit effort (CPUE) and species richness. Catch per unit effort
(CPUE) was calculated by dividing the total number of individual fish captured in each
transect by 10 minutes (duration of one transect), and then averaging across the total

9
number of transects conducted in the particular lake (number of fish/minute). Species
richness was calculated as the total number of fish species collected in each lake.
Evenness was calculated for both the number of individuals and the total weight of
each species using Simpson’s measure of evenness (Krebs 1999). Evenness attempts to
measure how evenly the number of individuals or weight is distributed among all species
in a community. The Simpson’s measure of evenness (E) is defined as:
Ep Ps
i=
∑1 2/ ( / ) (eq. 1)
where pi is the number of individuals or total weight of the ith species, P is the total
number of individuals or total weight of all species, and s is the total number of species in
each lake. This index is relatively unaffected by the rare species in the sample and ranges
from 0 to 1 (Krebs 1999).
In addition, I also calculated a Shannon-Wiener index of diversity for both the
number of individuals and the total weight of each species collected in each lake (Krebs
1999). Diversity attempts to account for evenness and richness by looking at both the
number of species and how evenly distributed the number of individuals or weight is
amongst the total number of species in each lake. The Shannon-Weiner index of species
diversity (H’) is defined as:
Hp
PpP
i
i
si
' (log=−
=∑
12 ) (eq. 2)
where pi is the number of individuals or total weight of the ith species, P is the total
number of individuals or total weight of all species, and s is the total number of species in
each lake. For biological communities, H’ ranges from zero to five (Krebs 1999), and is
expressed in bits per individual (bits/individual).

10
I also calculated the total biomass of harvestable fish caught per minute in each of
the lakes (Canfield and Hoyer 1990). These fish exceeded lengths at which anglers
generally harvest the given species (Appendix A).
Fish Population Analysis
The relationships between fish population variables (CPUE, evenness, diversity,
richness and harvestable biomass) and limnological variables (total alkalinity, chlorides,
total phosphorus, total nitrogen, lake surface area, Secchi depth, chlorophyll, color and
percent composition of submersed aquatic vegetation) were examined for the augmented
and nonaugmented lakes using multiple linear regression. Prior to model selection, a
Wilk-Shapiro test was performed on all dependent fish variables, except diversity, to test
for normality (Procedure UNIVARIATE NORMAL, SAS 1996). The evenness index for
both fish weight and number of fish, as well as CPUE and harvestable biomass, were
log10(x+1) transformed to increase normality. Stepwise model selection procedure was
used to create multiple regression models (STEPWISE option, SAS 1996) with a
significance level of 0.05 for independent variables to remain in the model.
Multiple regression models with only one significant independent variable
predicting a fish population variable were graphed. Confidence limits of 95% were
placed above and below the predicted regression line for each model, and the points
corresponding to augmented lakes were examined for influence or diverging patterns.
Models with multiple significant habitat variables predicting a fish population
variable were examined for possible influence by augmented lakes. This was done using
influence diagnostics, including DFFITS, COVRATIO and studentized-residuals (SAS
1996). The DFFITS value represents the number of estimated standard errors that the
fitted value changes if the point is removed from the data set (Myers 1990). A value

11
close to zero indicates a low influence of the given point. The COVRATIO values
display the reduction in the estimated generalized variance of the coefficient over what
would be produced without the data point. A value close to one indicates little influence
on the estimated generalized variance. Finally, studentized-residuals were used to detect
outliers. A value close to zero indicates a minimal residual for the given point, indicating
a non-outlier (Myers 1990). I concluded that if augmented lakes did not have extreme
values for DFFITS, COVRATIO, and studentized residuals, then the observation would
be within the overall pattern for nonaugmented lakes.
Canonical correspondence analyses (CCA) (PC-ORD 1999) is a multivariate
analysis technique that utilizes data from two matrices to relate community composition
to known variation in the environment (Ter Braak 1986). The CCA was used to arrange
lakes and species of fish along environmental gradients. Catch per unit effort (fish/min.)
was calculated as a measure of relative abundance for each species in each lake and
placed in the primary matrix for comparison of community patterns across lake samples
(Hinch and Collins 1993). Species observed in less than three of the 43 lakes (seven
augmented and 36 nonaugmented) were removed from the analysis to reduce the effects
of rare taxa. No rare taxa were found in the augmented lakes. The same limnological
variables as in the multiple regressions were placed in the secondary matrix across lakes.
Percent data (percent lake area covered by aquatic macrophytes) were arcsine(x/100)
transformed (Zarr 1999) and all other directly measured environmental variables were
log10(x+1) transformed to reduce kurtosis (Palmer 1993).
Canonical correspondence analysis is not hampered by high multicollinearity
between species, or between environmental variables (Palmer 1993). Therefore,

12
preprocessing or elimination of multicollinear data is unnecessary. Similarly, CCA
estimates the modal locations of highly skewed species distributions quite well, and is
robust to violations of assumptions (Palmer 1993).
In CCA, lakes were assigned scores determined from weighted-averages of species
abundances (Palmer 1993). A multiple linear least-squares regression was then
performed with environmental variables as independent variables, and lake scores as the
dependent variables. New lake scores were then assigned as the value predicted from the
resulting regression equation. The algorithm continued re-standardizing lakes and
species scores until they remained constant with progressing iterations. The product was
the first ordination axis, which was a linear combination of environmental variables that
maximized the correlation between lake and species scores. Second and higher
ordination axes also maximized correlations with scores, uncorrelated with the previous
axes (Ter Braak 1986).
Intraset correlations are the correlation coefficients between the environmental
variables and the ordination axes (Ter Braak 1986). The signs and magnitudes of the
intraset correlations were examined to assess the relative importance of each
environmental variable in structuring the fish community. Intraset values less than -0.350
and greater than 0.350 were considered more highly correlated than those between -0.350
and 0.350. This criterion was arbitrary and was not intended to reflect statistical
significance, and all intraset values are presented.
The canonical correspondence analysis was graphed on a joint plot, with the first
three ordination axes (PC-ORD 1999). The lakes and species were examined for the
dominant patterns in community composition as explained by the environmental

13
variables, and the augmented lakes were further examined for diverging patterns. The
intraset values of the CCA were also examined to determine which environmental
variables were most strongly correlated with augmented lake scores. Those intraset
values less than -0.350 and greater than 0.350 were considered more highly correlated,
and were used to construct a cluster diagram (PC-ORD 1999).

RESULTS
Comparison of Limnological Variables
Augmented lakes had a smaller average surface area than nonaugmented lakes.
The seven augmented lakes in this study had surface areas ranging from 13 ha to 39 ha
(Table 1) with an average of 21 ha, whereas the nonaugmented lakes ranged from 1.8 ha
to 271 ha, with an average of 83 ha. The range of percent lake area covered by aquatic
macrophytes (PAC) displayed large variation for both augmented (10% to 58%) and
nonaugmented lakes (0% to 100%) (Table 3). Four of the augmented lakes had Secchi
depths greater than the average of the nonaugmented lakes (2.04 m), whereas all of the
augmented lakes had pH levels higher than the average for the nonaugmented lakes
(7.56) (Table 3). Three of the seven augmented lakes exceeded the range of the total
alkalinity for the nonaugmented lakes (0.28 to 106 mg/L as CaCO3), and all augmented
lakes had values greater than the nonaugmented average (31.1 mg/L as CaCO3). All
augmented lakes but Saddleback had lower chlorophyll concentrations than the average
for nonaugmented lakes (26.5 µg/L), and all had lower phosphorus and nitrogen
concentrations than the average nonaugmented values (30.5 µg/L, and 939 µg/L
respectively). Sunset Lake was the only augmented lake to exceed the average chloride
concentration for the nonaugmented lakes (18.5 mg/L). Finally, the color values of the
augmented lakes were within the range (1.25 to 57.5 Pt-Co units) and near the average
(20.6 Pt-Co units) of the nonaugmented lakes (Table 3).
14

15
Groundwater Pumping History
Clear Lake had the smallest volume of the augmented lakes (1.20 x 10⁵ m3), and
Mountain Lake had the largest volume (1.13 x 10⁶ m3) (Table 4). Similarly, Mountain
Lake had the largest average volume of groundwater pumped into the lake (2.67 x 10⁶
m3/year), whereas, Sunset Lake had a dramatically smaller average than the rest of the
lakes (9.97 x 10⁴ m3/year). The number of times that the volume of pumped groundwater
replaced the volume of water in the lakes ranged from 0.238 to 3.28 times/year, with
Sunset Lake having the lowest rate and Clear Lake having the highest (Table 4).
After investigating the water chemistry of the groundwater pumped from the wells
at each lake and the historical data from several of the lakes prior to initial pumping
(Table 5), numerous patterns were found. Loyce Lake was the only lake with historical
Secchi depths prior to augmentation, and upon the addition of groundwater, the Secchi
depth increased from 0.8 to 3.05 meters. In all of the lakes, the total alkalinity and total
phosphorus concentrations in the well samples were higher than the current lake water
samples, and in every case, the lakes increased in pH, alkalinity and total phosphorus
since their historical measurements. Conversely, all but one well water sample,
Saddleback lake, had lower total nitrogen concentrations than the current lake samples,
coinciding with a decrease in nitrogen when compared to historical water samples (Table
5). The well water samples also had lower chloride concentrations than the current
samples from the lakes; however, the two lakes with historical chloride data increased in
chloride concentrations since the initiation of augmentation. Loyce, Saddleback, and
Sunset lakes experienced a decrease in color, and Loyce Lake exhibited a decrease in
chlorophyll when compared with from historical data, coinciding with groundwater
pumping.
16
In each of the augmented lakes, groundwater was pumped at a location about 100
meters from the lake, and either formed a small stream or was run down a pipe where the
water was released in an upward fashion, like a fountain. The mean oxygen and
temperature levels measured at mid-lake stations were nearly identical to those measured
at the end of these streams and pipes, where groundwater is introduced into the lakes.
Fish Population Comparisons
Catch per unit effort (CPUE) of all fish varied among the augmented lakes, with
Goose Lake having the lowest (1.16 fish/minute) and Sunset Lake having the highest
(10.7 fish/minute) (Table 6). Goose Lake also had the lowest species richness (5
species), and Clear Lake had the highest (11 species). However, Goose Lake had the
highest index of evenness (E) by number of fish per species (0.70), and Sunset Lake had
the lowest (0.21). Similarly, Goose Lake had the highest index of evenness by weight of
fish per species (0.61), and Mountain Lake had the lowest (0.32). Species diversity (H’)
by number ranged from 1.37 to 2.41 at Sunset Lake and Clear Lake, respectively, and
species diversity by weight ranged from 1.67 to 2.38 at lakes Dan and Sunset,
respectively. Biomass of harvestable length fish ranged from 15.1 grams per minute at
Clear Lake to 173 grams per minute at Mountain Lake.
The averages of mean CPUE and species richness of the nonaugmented lakes
exceeded values at six of the seven augmented lakes (Table 6). The ranges and averages
of the evenness and diversity variables of both the augmented and nonaugmented lakes
were similar. However, the average of the mean harvestable fish biomass for the
nonaugmented lakes exceeded the values of all seven augmented lakes (Table 6).

17
Multiple Regression Analysis
The multiple linear regressions with stepwise model selection for the augmented
and nonaugmented lakes combined were all significant (P < 0.05) (Table 7).
Limnological variables explained 13% to 63% of the variability in fish population
variables in the nonaugmented lakes. Secchi depth was negatively related to diversity by
number, and positively related to logarithm evenness (E) by number. Species diversity
(H’) by weight was positively related to color and surface area. Log CPUE was
positively related to chlorides and negatively related to Secchi depth and PAC. The log
(E) by weight was positively related to total nitrogen as well as Secchi depth. Species
richness was negatively related to total nitrogen and Secchi depth and positively related
to chlorides and lake surface area. Log (harvestable biomass) was positively related to
lake surface area and negatively related to Secchi and PAC. Diversity by weight was the
only fish variable that was not related to Secchi depth.
The simple linear regressions of Secchi depth versus the logarithm transformation
of evenness by number (Figure 2a) and Secchi depth versus diversity by number (Figure
2b) show that the data points for the augmented lakes are not outside of the 95%
confidence intervals. However, the Secchi depth values of a majority of the augmented
lakes are higher than the majority of the nonaugmented lakes.
The remaining four fish population parameters were all determined by multiple
habitat variables. Therefore, I examined the influence diagnostics to determine the
influence of augmented lakes on the multiple regressions. In each case, the absolute
values of the studentized residuals were minimal, the COVRATIO values were close to
one, and the absolute values of the DFFITS values were minimal, indicating that the

18
augmented lakes had little influence on the multiple regressions, similar to the results of
the simple linear regressions.
Canonical Correspondence Analysis
Canonical correspondence analysis (CCA) was used to explore the relationship
between the abundance, as determined by catch per unit effort, of fish species, the lakes
where they were found, and the tested limnological variables. The first three axes in the
CCA, which are linear combinations of limnological variables that maximize the
correlation between site and species scores, explained 26% of the variation (Table 8).
The first canonical axis, which explained 12% of the variation, was positively correlated
(>0.350) with chlorophyll, total phosphorus, total nitrogen, total alkalinity, color, surface
area and chlorides, and negatively correlated (<-0.350) with Secchi depth and percent
area covered by aquatic macrophytes (Table 9). The second canonical axis, which
explained 7.7% of the variation, was positively correlated (>0.350) with chlorides and
total phosphorus, and negatively correlated (<-0.350) with total alkalinity and Secchi
depth. The third canonical axis, which explained 5.6% of the variation, was negatively
correlated (<-0.350) with chlorides and color.
By definition, the majority of the variation was explained by the first axis.
However, all of the augmented lakes, except for Sunset, were most highly correlated with
axis two, in a negative fashion. There were only four other nonaugmented lakes that
were most highly correlated with axis two in a negative fashion, demonstrating the
similarities of the augmented lakes to each other in relation to environmental gradients.
The six augmented lakes correlated with axis two were more characteristic of lower
chlorides and total phosphorus, and higher Secchi depths and total alkalinity. In contrast,

19
Sunset Lake, more negatively correlated to axis three, was characterized by higher
chlorides and color (Table 9).
The joint plot of axis one versus axis two displayed the general pattern of the
nonaugmented lakes along axis one (Figure 3). The six augmented lakes Clear, Dan,
Goose, Loyce, Mountain and Saddle, were more negatively correlated to axis two than
they were correlated to axis one, and were all located in the same general location of the
joint plot (Figure 3). Similarly, in the joint plot of axis two versus axis three (Figure 4),
these same augmented lakes were more highly correlated with axis two in a negative
fashion than they were with axis three, and again were all located in the same general
area of the joint plot, whereas Sunset Lake was more related to axis three, with only a
slight negative correlation with axis two.
In joint plots, the lake points are found at the centroid of the species points that
occur at that lake, allowing inferences to which species are likely to be present at a
particular lake (Ter Braak 1986). Also, the species points are approximately the optima
of where they are found in highest abundance, hence the abundance or probability of
occurrence of a species decreases with distance from its location in the diagram. For
example, the lined topminnow, Fundules lineolatus, was highly negatively related to axis
one, as were two lakes, Turkey Pond and Keys Pond, that the topminnow was found in
close proximity to in the joint plot (Figure 3). This species was found in only six of the
43 lakes, and in highest abundance in these two lakes, explaining its closeness to these
two lakes (Figure 3). The lined topminnow’s low abundance or absence in the other
lakes demonstrates its distance from those lakes. Bluegill, Lepomis macrochirus, was
found in all but two lakes, demonstrating this species ability to survive across varying

20
environmental gradients. Accordingly, bluegill were located near the intersection of all
three axes, where there is little correlation to high or low values of environmental
variables (Figure 3 and 4). Consequently, those lakes within close proximity to the
intersection of the axes, with little correlation to any of the three axes, have a higher
probability of having higher abundances of bluegill and other fish species that are found
near the intersection than those on the perimeter.
Six of the seven augmented lakes were found on the perimeter of the joint plots.
Accordingly, all but one species of fish was at relatively large distances in the diagram
from the six augmented lakes that were more correlated to axis two (Figure 3 and 4). The
one fish species, taillight shiner, Notropis maculatus, which was found in close proximity
to these six lakes, was only found in one of the augmented lakes, Clear Lake. This fish
represented the second highest abundant fish species in Clear Lake, and was only found
in four other lakes, at low abundances, explaining the close proximity to Clear Lake.
Therefore, the lack of other species in close proximity to these six augmented lakes
demonstrates that there is a higher probability that abundance of individual fish species in
these six augmented lakes is lower than other lakes more close in proximity to species
points. Sunset Lake is closer in proximity to several fish species points indicating a
higher probability of a higher abundance of individual fish species in this lake as
compared to the other augmented lakes.
Cluster Analysis
The intraset correlations of axis two of the CCA demonstrate that six of the
augmented lakes were correlated with higher total alkalinity and Secchi depth, and lower
chlorides and total phosphorus. These four environmental variables were used to create a
cluster diagram (Figure 5). The cluster diagram displayed five of the augmented lakes

21
Clear, Goose, Loyce, Mountain and Dan, in a small cluster. Saddleback Lake, the other
augmented lake correlated with axis two of the CCA, is grouped in the next closest small
cluster. This further demonstrates the similar limnological characteristics of the
augmented lakes with large volumes of groundwater introduction. Sunset Lake is not
closely clustered with any of the other augmented lakes, but rather with two other
nonaugmented lakes that, like Sunset Lake, were also most correlated with axis three in a
negative fashion.

22
#S
#S
#S#S
#S#S#S
Polk
Hillsborough
Pasco
Study Sites Loyce Lake Clear Lake
Goose Lake
N
Dan Lake Sunset Lake Saddleback Lake Mountain Lake
40 Kilometers
Figure 1. Augmented lakes sampled in three Florida counties.

23
-1
-0.8
-0.6
-0.4
-0.2
0
0.2
0 1 2 3 4 5 6
Secchi Depth (meters)
log 1
0 Eve
nnes
s by
Num
ber
0.4(a)
0
0.5
1
1.5
2
2.5
3
3.5
0 1 2 3 4 5 6
Secchi Depth (meters)
Div
ersi
ty b
y N
umbe
r
4(b)
Figure 2. Simple linear regressions of (a) Log10 transformation of species evenness by number of fish versus Secchi depth (r2=0.298, df=42, p-value<0.001), and (b) diversity by number of fish versus Secchi depth (r2=0.134, df=42, p-value=0.016), with regression lines (—) and 95% confidence intervals for an observation around the lines (- -) for nonaugmented ( ) and augmented lakes ( ).
24
Keys-pon
Okahumpk
Wauberg
M iona
Wales
Baldwin
Susannah
Cue
Crooked
Round-po
HollingsHunter
HartridgKillarny
Holden
Bell
Bonny
Live-oak
Koon
oore
Watertow
Patrick
Tomahawk
Carlton
Rowell
Turkey-p
Fish
Bull-Pon
M ill-Dam
West-M oo
1M ountai
Douglas
PasadenaSanitary
Lit t le-F
Picnic
ClearDan
Goose
Loyce
M ountain
Saddle
Sunset
talk
cltp
tnSA
Secchi
CHLA
colorPAC Axis 1
Axi
s 2
Bluegill
Lined Topminnow
Taillight Shiner
Figure 3. Joint Plot of axis 1 versus axis 2
lakes ( ) and species (+) plottLimnological characteristics inmacrophytes (PAC), Secchi denitrogen (tn), chlorophyll (CHLand chloride (cl). Augmented lMountain, Saddleback (Saddle)lakes that are most related to ax
M
of the canonical correspondence analysis with ed along environmental gradients. clude: percent area covered by aquatic pth (Secchi), total alkalinity (talk), color, total ), total phosphorus (tp), Surface Area (SA) akes include: Clear, Dan, Goose, Loyce, and Sunset. The oval contains six augmented is 2. The box contains Sunset Lake.

25
Keys-pon
Okahumpk
Wauberg
M iona
Wales
Baldwin
Susannah
CueCrooked
Round-po
Hollings
Hunter
Hartridg
Killarny
Holden
Bell
Bonny
M oore
Live-oak
Koon
Watertow
Patrick
Tomahawk
Carlton
Rowell
Turkey-p
Fish
Bull-Pon
M ill-DamWest-M oo
1M ountai
Douglas
Pasadena
Sanitary
Lit t le-F
Picnic
Clear
Dan
Goose
Loyce
M ountainSaddle
Sunset
talk
cl
tptn
SA
Secchi
CHLA
color
PAC
Axis 2A
xis
3
ill
Taillight Shiner
Blueg
Lined Topminnow
Figure 4. Joint Plot of axis 2 versus axis 3 of the canonical correspondence analysis with
lakes ( ) and species (+) plotted along environmental gradients. Limnological variables include: percent area covered by aquatic macrophytes (PAC), Secchi depth (Secchi), total alkalinity (talk), color, total nitrogen (tn), chlorophyll (CHL), total phosphorus (tp), surface area (SA) and chloride (cl). Augmented lakes include: Clear, Dan, Goose, Loyce, Mountain, Saddleback (Saddle) and Sunset. The oval contains six augmented lakes that are most related to axis 2. The box contains Sunset Lake.

Distan
Infor
6.7E-03
100
7.6E+00
75
Keys-ponRound-poTurkey-pCueCrookedTomahaw kMooreKoonMill-DamBull-PonPicnicOkahumpkSanitarySunsetHartridgWest-MooPatrickDouglasRow ellFish1MountaiMionaBellPasadenaLive-oakWalesSusannahLittle-FBaldw inKillarnyWatertowSaddleClearGooseLoyceMountainDanWaubergHollingsHunterHoldenBonnyCarlton
Figure 5. Cluster analysis of lakes using total alkalinityinclude Clear, Dan, Goose, Loyce, Mountain
ce (Objective Function)
mation Remaining (%)
1.5E+01
50
2.3E+01
25
3E+01
0
26
, chloride, total phosphorus, and Secchi depth. Augmented lakes (boxed) , Saddleback (Saddle) and Sunset.

27
Table 1. The county, wellfield in closest proximity, location, surface area, average depth determined with fathometer and year of first groundwater augmentation for the seven study lakes. Mountain Lake is not within the vicinity of a wellfield, but rather, requires augmentation due to its proximity to the highest elevation in peninsular Florida, on the Lake Wales Ridge, increasing its elevation above the surficial aquifer.
Lake County Wellfield Latitude Longitude Surface Area Average
Depth Year of First
Augmentation
(ha)
(m)
Clear
Pasco Eldridge-Wilde 28.3625ºN 82.4789ºW 16 1.50 1978Dan Hillsborough
Cross Bar Ranch 28.1667ºN 82.6464ºW 14 3.18 Early 1970's
Goose Pasco Eldridge-Wilde 28.3559ºN 82.4702ºW 15 1.49 1954Loyce Pasco
Eldridge-Wilde
28.3758ºN 82.4958ºW 18 1.73 1996
Mountain Polk Elevation 27.9348ºN 81.5898ºW 39 2.92 1975Saddleback Hillsborough Section 21 28.1194ºN 82.4942ºW 13 2.56 1968Sunset Hillsborough Cross Bar Ranch 28.1345ºN 82.6267ºW 15 2.83 1976
28
Table 2. The number of wells, the average volume of water pumped each day from all wells combined, and the year of initial service for the wellfields in close proximity to the augmented lakes.
Wellfield Number of Wells Average
Volume Pumped Initial Year (m3/day) Cross Bar Ranch 17 1.00 x 10⁵ 1981 Eldridge-Wilde 58 8.52 x 10⁴ 1956 Section 21 8 3.79 x 10⁴ 1963

29
Table 3. Mean limnological characteristics in 2003. These include percent lake area covered by aquatic macrophytes (PAC), Secchi depth, ph, total alkalinity, total chlorophyll, total phosphorus, total nitrogen, chloride, and color. Water chemistry means were based on three samples per lake, and PAC was measured using transects with a recording fathometer. Nonaugmented lake means are from 36 Florida lakes.
Lake PAC
Secchi
pH
Total
AlkalinityTotal
Chlorophyll Total
PhosphorusTotal
Nitrogen Chloride
Color
(%)
(m)(mg/L as CaCO3) (µg/L) (µg/L) (µg/L) (mg/L) (Pt-Co units)
Augmented
Clear 58 2.44 7.80 115 5.60 13.3 427 6.00 23.3Dan
14 1.52 8.00 120 15.6 16.7 890 9.92 53.0Goose 52 3.35 7.90 107 3.20 12.3 670 6.92 31.7Loyce 28 3.05 7.80 103 1.60 8.00 463 7.17 16.0Mountain 44 3.35 9.03 64.7 8.40 14.3 487 9.67 15.0Saddleback 12 1.52 8.27 76.3 34.4 19.3 737 7.67 42.0Sunset 10 1.83 7.77 56.0 20.2 18.0 810 27.1 44.0Mean 31.1 2.44 8.08 91.7 12.7 14.6 641 10.6 32.1
Nonaugmented
Mean 44.2 2.04 7.56 31.1 26.5 30.5 939 18.5 20.6Range 0-100 0.30-5.80 4.30-9.18 0.28-106 0.82-159 0.83-159 99.0-1750 2.50-51.7 1.25-57.5

30
Table 4. Groundwater pumping history in augmented lakes. Variables include lake volume, the average volume of groundwater pumped per year, the years of historical pumping data averaged, and the number of times the volume of pumped water would replace the volume of water in the lake in one year.
Lake Name Lake VolumeAverage
Volume Pumped Years Fill Rate
(m3) (m3/year) (times/year) Clear 1.20 x 10⁵ 3.94 x 10⁵ 1990-98 3.28 Dan 4.77 x 10⁵ 7.61 x 10⁵ 1994-98 1.60 Goose 2.23 x 10⁵ 3.19 x 10⁵ 1990-98 1.43 Loyce 3.13 x 10⁵ 3.50 x 10⁵ 1995-98 1.12 Mountain 1.13 x 10⁶ 2.67 x 10⁶ 1989-94 2.36 Saddleback 3.33 x 10⁵ 4.43 x 10⁵ 1968-71 1.33 Sunset 4.19 x 10⁵ 9.97 x 10⁴ 1977-01 0.24

31
Table 5. Water chemistry of groundwater from well samples and historical lake water samples prior to initial augmentation. Variables include date of collection (month/year), Secchi depth, pH, total alkalinity, total chlorophyll, total phosphorus, total nitrogen, chloride, and color. Secchi depth, total chlorophyll and color were not determined for groundwater. Blanks for historical lake samples indicate missing data.
Lake Name Date Secchi
pH
Total Alkalinity
Total Chlorophyll
Total Phosphorus
Total Nitrogen Chloride Color
(month/year)
(m)
(mg/L asCaCO3)
(µg/L)
(µg/L) (µg/L) (mg/L)
(Pt-Co units)
Well Samples
Clear 8/2003 7.7 177 25.0 310 5.95 Dan
8/2003 7.8 210 77.0 440 7.50Goose 8/2003 7.6 184 40.0 330 5.00Loyce 8/2003 7.6 178 28.0 420 5.50Mountain 8/2003 7.7 152 60.0 450 3.00Saddleback
8/2003 7.2 232 40.0 910 4.50
Sunset 8/2003
7.8 189 68.0 660 8.60Mean 7.6 189 48.3 503 5.73 Historical Lake Samples
Loyce 7/1995 0.80 6.9 36.0 28.0 5.00 2670 5.00 50.0Loyce
7/1984 6.1 6.00 3.00 78.0Sunset 5/1976 5.6 20.0 16.5 90.0 Saddleback 3/1968 5.5 14.0 40.0Saddleback 2/1968 6.1 14.0 60.0

32
Table 6. Fish population measures of augmented and nonaugmented lakes. These include number of electrofishing transects (N), mean catch per unit effort (CPUE), standard deviation of the catch per unit effort (CPUE SD), species richness, species evenness by number, species evenness by weight, species diversity by number, species diversity by weight and mean harvestable fish biomass. Nonaugmented lake averages are from 36 Florida lakes.
Lake N Mean CPUE Richness Evenness Evenness Diversity Diversity Mean
CPUE
SD by Number
by Weight
by Number
by Weight
Harvestable Fish Biomass
(transects)
(fish/ minute)
(species)
(grams/ minute)
Augmented
Clear 6 7.05 5.96 11 0.37 0.40 2.41 2.30 74.7Dan
6 1.65 0.68 7 0.54 0.33 2.26 1.67 15.1Goose 7 1.16 0.89 5 0.70 0.66 1.95 1.86 51.9Loyce 7 1.31 0.51 8 0.57 0.44 2.35 2.13 32.6Mountain 8 3.38 0.92 9 0.38 0.32 2.18 1.77 173Saddleback 7 1.71 0.45 10 0.36 0.35 2.38 2.12 38.4Sunset 6 10.7 3.76
10 0.21 0.47 1.37 2.38 26.5
Mean 6.71 3.85 8.57 0.45 0.42 2.13 2.03 58.9
Nonaugmented
Mean 5.26 7.45 10.4 0.44 0.37 2.22 1.98 208
Range 3-6 0.58-36.1 2-18 0.28-0.96 0.17-0.66 0.28-3.15 0.31-2.82 3.87-1150

33
Table 7. Significant linear regression models predicting dependent fish variables at nonaugmented and augmented lakes combined. Dependent fish variables include log10 of catch per unit effort (lcpue), log10 species evenness by number (levennum) and weight (levenwt), species diversity by number (divnum) and weight (divwt), species richness (rich), and log10 harvestable fish biomass. Independent variables include surface area of lake (ha, sa), percent area coverage of aquatic macrophytes (%, pac), Secchi depth (m, Secchi), total alkalinity (mg/L, talk), total chlorophyll (µg/L, chl), total phosphorus (µg/L, tp), total nitrogen (µg/L, tn), chloride (mg/L, cl), and color (color).
Model R-square df P-value lcpue = 0.724 + 0.016(cl) - 0.134(Secchi) - 0.004(PAC) 0.509 42 <0.001 levennum = -0.561 + 0.072(Secchi) 0.298 42 <0.001 levenwt = -0.669 + 0.00008(tn) + 0.069(Secchi) 0.246 42 0.004 divnum = 2.448 - 0.017(Secchi) 0.134 42 0.016 divwt = 1.215 + 0.004(sa) +0.017(color) 0.495 42 <0.001 rich = 10.803 + 0.113(cl) - 0.002(tn) + 0.019(sa) - 1.407(Secchi) 0.626 42 <0.001 lharvest = 2.302 + 0.002(SA) - 0.133(Secchi) - 0.005(PAC) 0.402 42 <0.001

34
Table 8. Results of canonical correspondence analysis (CCA) for 34 fish species abundances, as measured by catch per unit effort, from 43 lakes in Florida. Proportional limnological variables were arcsine(x/100) transformed; all other limnological variables were log10(x+1) transformed. Species - environmental correlations were conducted using Pearson tests.
Statistic Axis 1 Axis 2 Axis 3 Eigenvalue 0.335 0.214 0.153
0.875 0.866 0.822 Species-Environmental Correlations
12.2 7.7 5.6 % Variance in species data explained by the axis
12.2 19.9 25.5 Cumulative % of variance in species explained Table 9. Intraset correlation between the limnological variables examined and the three axes in
the canonical correspondence analysis (CCA) using 34 fish species abundances, as measured by catch per unit effort, from 43 lakes in Florida. Percent area covered by aquatic macrophytes (PAC) was arcsine(x/100) transformed. All other environmental parameters were log10(x+1) transformed. Intraset correlation may help indicate which environmental variables structure the community, as well as help determine which environmental variables are most influential in a site. The higher the absolute value of the intraset correlation, the more the parameter explains the variation. Values below -0.350 and above 0.350 were considered more highly correlated than those between -0.350 and above 0.350, and are followed by a * for emphasis.
Variable Axis 1 Axis 2 Axis 3 Total Alkalinity 0.643* -0.450* 0.185 Chloride 0.400* 0.526* -0.574* Total Phosphorus 0.793* 0.420* 0.317 Total Nitrogen 0.649* 0.064 0.211 Surface Area of Lake 0.479* 0.262 -0.124 Secchi Depth -0.753* -0.399* -0.296 Chlorophyll 0.888* 0.299 0.239 Color 0.629* -0.027 -0.506* PAC -0.553* 0.117 -0.279

DISCUSSION
Historically, the water chemistry of lakes in central Florida differs significantly
from the chemistry of aquifer water in the same vicinity (Dooris and Martin 1979; BRA
1996; Hassell et al. 1997). The historical data from the augmented lakes prior to initial
groundwater introduction demonstrated lower levels of pH, alkalinity, and water clarity
prior to augmentation, similar to typical small lakes in central Florida that contain acidic,
soft, tannin-colored water, with low levels of bicarbonate, inorganic carbon, alkalinity,
conductivity, and calcium (Canfield 1981; Canfield and Hoyer 1988; BRA 1996; Hassell
et al. 1997).
The water chemistry of the augmented lakes in this study shifted to levels
resembling the water chemistry of aquifer water upon the introduction of large volumes
of groundwater, by which an entire lakes volume can be replaced several times a year.
As groundwater is introduced, the replacement of original lake water is generally
characterized by increases in clarity, pH, hardness, bicarbonate, inorganic carbon,
alkalinity, conductivity, calcium, magnesium, dissolved solids, nitrogen and sodium
concentrations, all of which are chemical characteristics of water contained in the
Floridan Aquifer (Stewart and Hughes 1974; Martin et al. 1976a; BRA 1982; Dooris et
al. 1982; BRA 1996; Hassell et al. 1997). Dooris and Martin (1979) noted that increased
pumping of aquifer water caused a shift in the water chemistry of augmented lakes to
closely resemble the chemical characteristics of aquifer water. It is apparent that the
35
36
patterns of increasing pH, alkalinity and clarity in my study lakes are analogous to those
of previously studied augmented lakes.
Another noted effect of groundwater pumping, as reported by Canfield and Hoyer
(1990) in Gate Lake and Mountain Lake, Florida, is the addition of nutrients. The well
water samples in the seven augmented lakes had higher mean concentrations of
phosphorus than both historical and current lake water sample levels. Conversely, in all
sampled augmented lakes but Saddleback Lake, nitrogen concentrations were lower than
sampled well water and historical values. However, the nitrogen to phosphorus ratios are
much greater than 17, suggesting that phosphorus is the limiting nutrient in each of the
seven augmented lakes (Florida Lakewatch 2000). The addition of groundwater
demonstrates an increase in the limiting nutrient in the augmented lakes.
Despite the overall increase in phosphorus by groundwater introduction, these
augmented lakes are still characterized by low total phosphorus (< 20 µg/L). Trophic
states, according to concentrations of phosphorus, indicate that all of the studied
augmented lakes were either oligotrophic or mesotrophic (Forsberg and Ryding 1980).
Therefore, there is little expected change in fish population parameters due to increased
nutrient introduction in the studied augmented lakes.
The cluster analysis (Figure 6) of total alkalinity, chlorides, total phosphorus and
Secchi depth versus all 43 lakes demonstrated the similarity in water chemistry of six of
the augmented lakes to each other, and of one of the augmented lakes to a group of
nonaugmented lakes. Despite being in three different counties, six of the augmented
lakes were similarly characterized by higher alkalinity, lower chlorides, lower
phosphorus and higher Secchi depths, whereas Sunset Lake was more characterized by

37
lower total alkalinity and higher chloride concentrations. This was likely a result of the
lower average volume of groundwater pumped into Sunset Lake each year (9.97 x 10⁴
m3/year) compared to the range of yearly averages of the other augmented lakes (3.19 x
105 to 2.67 x 10⁶ m3/year). Therefore, reduced groundwater introduction could decrease
the effects of shifted water chemistry, resulting in a lake more characteristic of natural
limnological characteristics.
Another change that augmented lakes endure is reduced water level fluctuation.
For example, Mountain Lake experienced lake level fluctuations of approximately 3 m
during the 1940s and 1950s, whereas the recent stage fluctuation indicates a much
narrower overall range of variation of about 1 m during the past decade (BRA 2001).
Similarly, Saddleback Lake experienced less than 0.5 m of fluctuation in the ten years
following augmentation, and showed very little response to heavy rainfall, as caused by
the artificial head placed on the lake above the already lowered potentiometric head
(Jones 1978). The other augmented lakes were also characterized by comparable lake
level fluctuation reduction.
The combination of increased water clarity, increased nutrients, increased hardness,
and reduced water level fluctuation could change the characteristics of aquatic plant
communities in augmented lakes. Increased water clarity increases light penetration,
often allowing plants to grow faster and at greater depths (Canfield et al. 1985).
Likewise, increased nutrients also increase plant growth. Also, Martin et al. (1976b)
found that the elevated hardness of pumped groundwater increased the ability of
augmented lakes to support hydrilla, Hydrilla verticillata, growth. Consequently, many
of the augmented lakes have had a history of aquatic plant problems. For example,

38
Mountain and Saddleback lakes have been stocked with grass carp, Ctenopharyngodon
idella, treated with aquatic herbicides and had harvest programs to decrease the amount
of plants (Canfield and Hoyer 1990; personal communication with lake residents).
Conversely, Goose Lake and Clear Lake are in the middle of a wellfield, and do not have
public access or people living on them. Therefore, there is no concern for aquatic
vegetation control. These two lakes yielded the highest PAC of the augmented lakes.
Little work has assessed effects of groundwater augmentation, and the ensuing
alterations to lake characteristics, on fish communities (Allen 1999). Cowx (2000) found
that the discharge of groundwater lowered dissolved oxygen concentrations and reduced
water temperatures in the River Ouse, Yorkshire, UK, and suggested that the low
dissolved oxygen concentrations could cause asphyxiation of fish with possible loss of
sensitive species if chronic, and the low water temperatures could reduce fish growth,
leading to a decline in stock (Cowx 2000). In Florida, groundwater generally has lower
temperatures and dissolved oxygen concentrations than surface water (McKinset and
Chapman 1998). However, well introduced groundwater is not pumped directly into the
lakes in Florida as is the case in the River Ouse. The streams and the pipes that deliver
the groundwater to the lakes in Florida allow the water to warm up and aerate before
entering the water body, as demonstrated by the similarity of mid-lake and discharge
measurements. Further, the difference in temperature between groundwater and lake
water in Florida is less than that of the study in Yorkshire, decreasing this concern in
Florida lakes.
The effects of the nutrient introduction by means of groundwater pumping in the
previously mentioned Canfield and Hoyer (1990) study were not detrimental to the fish

39
populations, and instead, were possibly beneficial with respect to species diversity, total
fish biomass, and sport-fish-abundance. Allen (1999) found similar results with respect
to increased fish species diversity in one augmented lake in Florida (Round Lake).
However, in contrast to Canfield and Hoyer (1990), Allen (1999) found that Round Lake
had significantly lower total fish biomass and density as compared to two nonaugmented
lakes.
The augmented lakes in my study had little influence on the regressions of fish
population parameters versus limnological variables, suggesting that the fish populations
in the augmented lakes were similar to fish populations in nonaugmented lakes with
similar limnological characteristics. However, there is evidence that the limnological
variables shifted from their original levels to those more indicative of aquifer water.
Therefore, one must consider that as the limnological variables shifted with groundwater
introduction, the fish populations in the augmented lakes responded by shifting
correspondingly along the gradient of the regression.
The data from the nonaugmented lakes in this study were collected from 1986 to
1990. Therefore, the limnological and fish population parameters could have changed in
these lakes over time in a similar fashion to the augmented lakes, making it difficult to
compare the two samples. However, upon inspection of numerous limnological
variables, including pH, total phosphorus, total nitrogen and total alkalinity, from several
of the nonaugmented lakes, the changes were either small or obsolete. For example, both
Lake Susannah had the same pH (7.8) in 1988 and 1999, and similar alkalinities over the
same time period (30.8 and 30.7 respectively). Also, the magnitudes of change from the
few limnological parameters measured historically from the augmented lakes were much

40
greater than the magnitudes of change for the nonaugmented lakes. Although extensive
limnological parameter studies were not performed on the augmented lakes prior to
groundwater introduction, several patterns emerged from the limited data available.
As groundwater was pumped, the augmented lakes were characterized by increased
Secchi depths, total alkalinity, phosphorus and chloride. They were also characterized by
decreases in total nitrogen and color, and would most likely all increase in percent area
covered by aquatic macrophytes if people did not control their levels. Augmentation also
increases surface area.
Upon placing these characteristics in the multiple regressions for all lakes, several
fish population responses can be predicted for augmented lakes. However, it is difficult
to predict exact changes on a temporal scale due to the lack of previous limnological
studies on these lakes. For example, there were no previous estimates of PAC on the
augmented lakes, and only one lake had a historical secchi depth measurement.
Therefore, the following are projected patterns for fish population parameters based on
general observed patterns for the limnological parameters. The pattern of increase or
decrease for catch per unit effort over time with groundwater introduction is difficult to
determine since chloride concentrations, Secchi levels and PAC increase with
groundwater pumping, acting as opposing terms in the regression. However, the average
catch per unit effort for the augmented lakes (3.85 fish/minute) was much lower than
average catch per unit effort of the nonaugmented lakes (7.45 fish/minute), suggesting
that catch per unit effort decreased. Evenness by number would increase because Secchi
depth increases with groundwater pumping. Evenness by weight would have opposing
terms since total nitrogen decreases and Secchi increases, making it difficult to determine

41
the pattern. Diversity by number would decrease with groundwater pumping due to
increasing Secchi depth, opposing the results reported by Canfield and Hoyer (1990) and
Allen (1999). Conversely, diversity by weight would increase due to increasing surface
area and color. Both richness and harvestable biomass have opposing values as
groundwater increases, making their change with groundwater augmentation difficult to
determine. However, similar to catch per unit effort, mean species richness and mean
harvestable fish biomass were lower for the seven augmented lakes (8.57 species and
58.9 g/minute respectively) than for the 36 nonaugmented lakes (10.4 species and 208
g/minute respectively), indicating a lower average number of species, individuals and
weight of fish of harvestable size than those lakes without groundwater being pumped.
The multiple regression analyses were useful for indicating that fish populations of
augmented lakes did not deviate from the patterns of nonaugmented lakes. However,
multiple regressions are unable to indicate the patterns for numerous individual fish
species across multiple limnological variables in multiple lakes. The joint plots of the
CCA suggested that the abundance, expressed as catch per unit effort, of individual
species in six of the augmented lakes had a high probability of being low compared to a
majority of nonaugmented lakes, agreeing with the Round Lake study by Allen (1999).
This also corresponded with the finding that catch per unit effort of all species and
species richness were low in these lakes compared to nonaugmented lakes. Further, a
majority of all fish species abundances were more correlated to the first axis of the CCA,
whereas the majority of augmented lakes were highly correlated to the second axis,
explaining that the gradient of environmental patterns determining the fish community in

42
these augmented lakes was different than the gradient determining fish communities in a
majority of nonaugmented lakes.
A study in Max Lake, Wisconsin, examined the effects of groundwater pumping on
fish population dynamics for largemouth bass and yellow perch populations (Engel et al.
2000). The groundwater pumping failed to alter growth, abundance, biomass, or
mortality of yellow perch and largemouth bass 3 to 7 years old. However, very little
water was pumped into the lake as compared to the amount of water pumped into the
studied augmented lakes in Florida. Only 5% of the water in Max Lake was replaced
each year by augmentation, as compared to the range of about 24% to 328% in the seven
augmented lakes. However, similar to the comparison of Sunset Lake to the other studied
augmented lakes, low volumes of introduced groundwater could have reduced effects on
water chemistry and fish population responses compared to lakes with high volumes of
groundwater introduction.
Numerous studies discuss fish growth and biomass responses to alterations in water
chemistry. Many have focused on the relationship between trophic states (as described
by Forsberg and Ryding 1980) and fish communities in lakes. Both fish growth (Larkin
and Northcote 1969; Bayne et al. 1994) and fish production (Downing et al. 1990; Ney
1996) are closely correlated with total phosphorous concentrations in lakes. Similarly,
total phosphorous concentrations (Kautz 1980; Hanson and Leggett 1982; Yurk and Ney
1989; Hoyer and Canfield 1991; Lee et al. 1991; Bayne et al. 1994; Bachmann et al.
1996), total nitrogen concentrations (Bachmann et al. 1996), and chlorophyll
concentrations (McConnell et al. 1977; Ogelsby 1977; Jones and Hoyer 1982; Bachmann
et al. 1996), are all positively related to total fish biomass in lakes. Conversely,

43
oligotrophication, the reversal of the eutrophication process, is accompanied by declines
in growth, standing stock, and harvest in fish (Ney 1996). Each of these studies displays
a positive correlation between fish productivity, fish biomass, and fish abundance as
eutrophication proceeds. The Forsberg and Ryding (1980) guidelines for trophic state
indicate that the augmented lakes range from oligotrophic to mesotrophic, possibly
explaining for the low CPUE and low harvestable biomass found in these lakes.
However, the slight increase in nutrients caused by groundwater introduction may have
slightly increased these fish population variables from their original levels.
Several investigations have also reported decreases in the relative abundance of
piscivorous fish, with possible losses of sensitive species, as a consequence of
eutrophication (Larkin and Northcote 1969; Persson et al. 1988; Bachmann et al. 1996;
Ney 1996). Opportunistic, eurytolerant, non-piscivorous species are likely to replace
stenotolerant, piscivorous fishes with increasing fertility of lakes (Ney 1996), causing
higher standing crops of such fish species as gizzard shad, Dorsoma cepadianum,
threadfin shad, Dorosoma petenense, and common carp, Cyprinus carpio, in eutrophic
and hypereutrophic lakes (Hasler 1947; Larkin and Northcote 1969; Bachmann et al.
1996).
No evidence was found in this group of augmented lakes to suggest that
piscivorous fish were being replaced by eurytolerant, non-piscivorous fish. For example,
bluegill was the most abundant fish species present in six of the seven augmented lakes.
Also, threadfin shad were found in only one of the augmented lakes, Sunset Lake, where
limnological variables are more closely related to nonaugmented lakes. Further, in
Sunset Lake there were healthy populations of reproducing largemouth bass, bluegill,

44
black crappie, warmouth and redear sunfish of multiple size ranges, while only one
school of shad was encountered. Therefore, these lakes are far from being in the
hypereutrophic range where these problems occur in fish populations, and there is no
evidence that the increase in nutrients from groundwater introduction into the studied
augmented lakes caused losses of species.
Numerous studies have found that lake size is the dominant factor determining fish
species richness in Florida lakes, in which the number of fish species increases with
increasing lake surface area (Barbour and Brown 1974; Matuszek and Beggs 1988; Keller
and Crisman 1990; Bachmann et al. 1996). In this study, species richness was positively
correlated to the surface area of augmented and nonaugmented lakes combined in the
multiple regression. Florida lakes are generally shallow, with flat slopes, and a small
decrease or increase in lake level stage creates a dramatic alteration in surface area
(Dooris 1982), possibly having a major effect on fish communities. For example,
Mountain Lake is listed as having a surface area of 55 hectares prior to lake level declines
(BRA 2001). Corresponding with the drop in water level was a decrease in the lake
surface area, upon which augmentation returned the surface area to 39 hectares. This was
a decline from the original surface area, but larger than the surface area without
augmentation. Therefore, the lake could display a decrease in species richness from
historical fish population data prior to water level declines, but an increase from periods
immediately prior to augmentation.
Allen (1999) suggested that fish population responses to augmentation may be
variable and depend on the original water chemistry of the natural lake relative to the
water chemistry of the pumped groundwater. Therefore, prior to initial groundwater

45
introduction for augmentation of lake levels, a comparison of water chemistry
characteristics from lake water and well water from within close proximity, and
estimating the volume of pumped water that will be necessary to maintain lake levels,
may be useful in determining expected shifts in water chemistry and fish populations. If
surface area is also a dominant factor in determining fish population parameters, it may
be important to not only monitor water chemistry, but also surface area prior to initial
declines and initial pumping.

MANAGEMENT IMPLICATIONS
Hassel (1994) suggested that augmentation is not a good long-term solution to
restore lake levels to reasonable levels because of altered environmental factors. He
further states that lake augmentation is a short-term remedy for a long-term problem. It is
apparent that Hassel is correct in stating that environmental factors have been altered in
augmented lakes. However, without augmentation, many of the lakes would go dry, as
was the case of Loyce Lake prior to groundwater introduction.
Augmentation allows for lakes to be utilized for boating, swimming and other
recreational activities. It also allows for lake and wetland hydrology to be maintained
and fish and wildlife habitat to be provided. Further, fish, bird, reptilian, mammalian,
insect and aquatic plant populations were all seen in the augmented lakes in this study.
Without augmentation, it is likely fish would die, and the use of the lakes for recreational
purposes would be compromised.
The human population in the Tampa area is constantly increasing, along with the
demand for water. As the population further expands from Tampa into the suburbs, more
wellfields will be created, and more lakes will be affected. Similarly, as the existing
wellfields increase the amount of water they withdraw the cones of depression will
increase, affecting more lakes in the future. Granting more permits for lake level
augmentation with groundwater pumping will further alter limnological characteristics
until the demand for groundwater is decreased. However, lakes will still be able to be
utilized and fish populations will still be able to exist and reproduce, despite possible
46

47
shifts with altered environmental patterns. It has also been suggested that these shifts
were minimized with reduced levels of groundwater pumping.
Another change that could improve fish population parameters, and reduce changes
in plant community characteristics, is an increase in water level fluctuation (Bonvechio
and Allen in press). A more natural water level regime could be created by augmenting
during rainy seasons, and allowing the lakes to decrease in level during the dry season.

APPENDIX COMMONLY HARVESTED FISH SPECIES
Table A-1. Commonly harvested fish species, and the total length (mm) at which they are generally first harvested.
Species Name
Scientific Name
Size (mm)
Chain pickerel Esox niger 400 Yellow bullhead Amerius natalis 280 Brown bullhead Ameirus nebulosus 280 White catfish Ameirus catus 280 Channel catfish Ictalurus punctatus 280 Largemouth bass Micropterus salmoides 280 Sunshine bass Morone chrysops x M. saxatilis 280 Black crappie Pomoxis nigromaculatus 240 Redbreast sunfish Lepomis auritus 200 Warmouth Lepomis gulosus 200 Bluegill Lepomis macrochirus 200 Redear sunfish Lepomis microlophus 200 Flier Centrarchus macropterus 200
48

LIST OF REFERENCES
Allen, M. S. 1999. Assessment of fish assemblages in Lakes Dosson, Halfmoon and Round in Hillsborough County, Florida. Southwest Florida Water Management District, Brooksville.
Allen, M. S., and K. I. Tugend. 2000. Effects of a large-scale habitat enhancement project on habitat quality for age-0 largemouth bass at Lake Kissimmee, Florida. Pages 265-276 in D. Phillipp and M. Ridgeway, editors. Black Bass: Ecology, Conservation and Management. American Fisheries Society, Bethesda, Maryland.
American Public Health Association. 1989. Standard methods for the examination of water and waste water. 17th edition. New York.
Bachmann, R. W., B. L. Jones, D. D. Fox, M. Hoyer, L. A. Bull, and D. E. Canfield, Jr. 1996. Relations between trophic state indicators and fish in Florida (U.S.A.) Lakes. Canadian Journal of Fisheries and Aquatic Sciences 53:842-855.
Barbour, C. D., and J. H. Brown. 1974. Fish species diversity in lakes. American Naturalist 108(962):473-489.
Bartos, L. F. 1998. Environmental augmentation. The resource regulation newsletter. Southwest Florida Water Management District 10(3).
Bayne, D. R., M. J. Maceina, and W. C. Reeves. 1994. Zooplankton, fish and sport fishing quality among four Alabama and Georgia reservoirs of varying trophic status. Lake and Reservoir Management 8:153-163.
Belanger, T. V., and R. A. Kirkner. 1994. Groundwater/surface water interaction in a Florida augmentation lake. Lake and Reservoir Management 8:165-174.
Biological Research Associates (BRA). 1982. Ecological impact of augmentation in three lakes in Hillsborough County, Florida. Pinellas County Water System, Tampa.
Biological Research Associates (BRA). 1996. General limnological assessment of three augmented lakes in Northwest Hillsborough County, Florida. Pinellas County Water System, Clearwater.
Biological Research Associates (BRA). 2001. Mountain Lake limnological evaluation and lake management alternatives. Mountain Lake Corporation, Lake Wales, Florida.
49

50
Brenner, M., J. M. Smoak, M. S. Allen, C. L. Schelske, and D. A. Leeper. 2000. Biological accumulation of 226Ra in a groundwater-augmented Florida lake. Limnology and Oceanography 45:710-715.
Canfield, D. E., Jr. 1981. Guide to the physiographic divisions of Florida. Report to Florida Cooperative Extension Service. Institute of Food and Agricultural Sciences. University of Florida, Gainesville.
Canfield, D. E., Jr., K. A. Langeland, S. B. Linda, and W. T. Haller. 1999. Relations between water transparency and maximum depth of macrophyte colonization in lakes. Journal of Aquatic Plant Management 23:25-28.
Canfield, D. E., Jr., and M. V. Hoyer. 1988. Regional geology and the chemical andtrophic state characteristics of Florida Lakes. Lake and Reservoir Management 4(1):21-31.
Canfield, D. E., Jr., and M. V. Hoyer. 1990. A characterization of fish populations in two central Florida Lakes. Final Report. Florida Turfgrass Association, Gainesville.
Canfield, D. E., Jr., and M. V. Hoyer. 1992. Aquatic macrophytes and their relation to the limnology of Florida lakes. Final Report submitted to the bureau of Aquatic Plant Management, Florida Department of Natural Resources, Tallahassee.
Cowx, I. G. 2000. Potential impact of groundwater augmentation of river flows on fisheries: a case study from the River Ouse, Yorkshire, UK. Fisheries Management and Ecology 7:85-96.
Crumpton, W. G., T. M. Isenhart, and P. D. Mitchell. 1992. Nitrate and organic N analysis with second-derivative spectroscopy. Limnology and Oceanography 37:907-913.
D’Elia, C. F., P. A. Steudler, and N. Corwin. 1977. Determination of total nitrogen in aqueous samples using persulfate digestion. Limnology and Oceanography 22:760-764.
Dooris, P. M. 1982. Lake augmentation in northwest Hillsborough County. Technical Report of the Southwest Florida Water Management District, Brookesville.
Dooris, P. M., and D. F. Martin. 1979. Groundwater induced changes in lake chemistry. Ground Water 17:324-327.
Dooris, P. M., G. M. Dooris, and D. F. Martin. 1982. Phytoplankton responses to ground water addition in central Florida Lakes. Water Resources Bulletin 18:335-337.

51
Dooris, P. M. and R. J. Moresi. 1975. Evaluation of lake augmentation practices in northwest Hillsborough County, Florida. Technical Report of the Southwest Florida Water Management District, Brookesville.
Downing, J. A., C. Plante, and S. Lalonde. 1990. Fish reproduction correlated with primary productivity, not the morphodoedaphic index. Canadian Journal of Fisheries and Aquatic Sciences 47:1929-1936.
Engel, S., M. H. Hoff, M. T. Vogelsang Jr., K. E. Bass, and J. S. Anderson. 2000. Fish population dynamics in Max Lake, a softwater Wisconsin lake subject to ground-water pumping. Wisconsin Department of Natural Resources Research Report, Woodruff.
Forsberg, C., and S. O. Ryding. 1980. Eutrophication parameters and trophic state indices in 30 Swedish waste-receiving lakes. Archive fur Hydrobiologie 88:189-207.
Frey, D. G. 1955. Distribution ecology of the cisco in Indiana. Investigation of Indiana Lakes-Streams 4:177.
Gottgens, J. F. 1994. Redistribution of organic sediments in a shallow lake following a short-term drawdown. Hydrobiologia 130:179-194.
Hach Chemical Company. 1975. Water and wastewater analysis procedures, third edition. Ames, Iowa.
Hanson, J. M., and W. C. Leggett. 1982. Empirical prediction of fish biomass and yield. Canadian Journal of Fisheries and Aquatic Sciences 39: 257-263.
Hasler, A. D. 1947. Eutrophication of lakes by domestic drainage. Ecology 28:383-395.
Hassell, A. L. 1994. A chemical and biochemical characterization of lakes Cooper, Strawberry, Crystal, Hobbs, Starvation, and Saddleback in Hillsborough County (Florida). Master’s thesis submitted to the Department of Chemistry at the University of South Florida, Tampa.
Hassell, A. L., P. M. Dooris, and D. F. Martin. 1997. Maucha diagrams and chemical analyses to diagnose changes in lake chemistry. Environmental Chemistry 60:75-80.
Hinch, S. G. and N. C. Collins. 1993. Relationships of littoral fish abundance to water chemistry and macrophyte variables in central Ontario lakes. Canadian Journal of Fisheries and Aquatic Sciences 50:1870-1878.
Hoyer, M. V., and D. E. Canfield Jr. 1991. A phosphorus-fish standing crop relationship for streams? Lake and Reservoir Management 7(1):25-32.

52
Jones, J. R., and M. V. Hoyer. 1982. Sportfish harvest predicted by summer chlorophyll a concentration in Midwestern lakes and reservoirs. Transactions of the American Fisheries Society 111:176-179.
Jones, K. C. 1978. Lake augmentation alternatives in Northwest Hillsborough Basin. Memorandum. File No. 14-000-REG-31-00.
Kautz, E. S. 1980. Effects of eutrophication on the fish communities of Florida lakes. Proceedings of Annual Conference of Southeastern Association of Fish and Wildlife Agencies 34:67-80.
Kellar, A. E., and T. L. Crisman. 1990. Factors influencing fish assemblages and species richness in subtropical Florida lakes and a comparison with temperate lakes. Canadian Journal of Fisheries and Aquatic Sciences 47:2137-2146.
Krebs, C. J. 1999. Ecological methodology, second edition. Benjamin Cummings, Menlo Park, California.
Florida Lakewatch. 2000. A beginner’s guide to water management – nutrients. Information circular #102. Department of Fisheries and Aquatic Sciences, University of Florida, Gainesville.
Larkin, P. A., and T. G. Northcote. 1969. Fish as indices of eutrophication. Pages 256-273 in Eutrophication, causes, consequences, correctives. National Academy of Sciences, Washington D. C.
Lee, G. F., P. E. Jones, and R. A. Jones. 1991. Effects of eutrophication on fisheries. Review of Aquatic Sciences 5:287-305.
Maceina, M. J., and J. V. Shireman. 1980. The use of a recording fathometer for determination of distribution and biomass of Hydrilla. Journal of Aquatic Plant Management. 18:34-39.
Martin, D. F., D. M. Victor, and P. M. Dooris. 1976a. Effects of artificially introduced ground water on the chemical and biochemical characteristics of six Hillsborough County (Florida) Lakes. Water Research 10:65-69.
Martin, D. F., D. M. Victor, and P. M. Dooris. 1976b. Implications of lake augmentation on Hydrilla growth. Environmental Science Engineering A11:245-253.
Matuszek, J. E., and G. L. Beggs. 1988. Fish species richness in relation to lake area, pH, and other abiotic factors on Ontario lakes. Canadian journal of Fisheries and Aquatic Sciences 45:1931-1941.
McConnell, W. J., S. Lewis, and J. E. Olson. 1977. Gross photosynthesis as an estimator of potential fish production. Transactions of the American Fisheries Society 106:417-423.

53
McKinsey, D. M., and L. J. Chapman. 1998. Dissolved oxygen and fish distribution in a Florida spring. Environmental Biology of Fishes 53:211-223.
Menzel, D. W., and N. Corwin. 1965. The measurement of total phosphorus in seawater based on the liberation of organically bound fractions of persulfate oxidation. Limnology and Oceanography 10:280-282.
Murphy, J., and J. P. Riley. 1962. A modified single solution method for the determination of phosphate in natural waters. Analytica Chimica Acta 27:31-36.
Myers, R. H. 1990. Classical and modern regression with applications, second edition. PWS-Kent Publishing Company, Boston, Massachusetts.
Ney, J. J. 1996. Oligotrophication and its discontents: effects of reduced nutrient loading on reservoir fisheries. Pages 285-295 in L. E. Miranda and D. R. Devries, editors. Multidimensional approaches to reservoir fisheries management. American Fisheries Society, Bathesda, Maryland.
Ogelsby, R. F. 1977. Relationships of fish yield to lake phytoplankton standing crop, production, and morphoedaphic factors. Journal of Fisheries Research Board of Canada 34:2271-2279.
Palmer, M. W. 1993. Putting things in even better order: the advantages of canonical correspondence analysis. Ecology 74(8):2215-2230.
PC-ORD. 1999. Multivariate analysis of ecological data, version 4. MjM Software Design, Gleneden Beach, Oregon.
Persson, L., Andersson, G., Hamrin, S. F., and Johansson, L. 1988. Predator regulation and primary production along the productivity gradient of temperate lake ecosystems. Pages 45-65 in S. R. Carpenter., editor. Complex interactions in freshwater ecosystems. Springer-Verlag, New York.
Reynolds, J. B. 1996. Electrofishing. Pages 221-253 in B. R. Murphy and D. W. Willis, editors. Fisheries Techniques, second edition. American Fisheries Society. Bethesda, Maryland.
Sartory, D. P., and J. U. Grobbelaar. 1984. Extraction of chlorophyll a from freshwater phytoplankton for spectrophotometric analysis. Hydrobiologia 114:177-187.
Statistical Analysis Systems (SAS). 1996. SAS statistics user’s guide. SAS Institute, Inc., Cary, North Carolina.
Shafer, M. D., R. E. Dickinson, J. P. Heaney and W. C. Huber. 1986. Gazetteer of Florida lakes. Florida Water Resources Research Center, Publication 96, Gainesville, Florida.

54
Simal, J., M. A. Lage, and I. Iglesias. 1985. Second derivative ultraviolet spectroscopy and sulfamic acid method for determination of nitrates in water. Journal - Association of Official Analytical Chemists 68:962-964.
Sinclair, W. C. 1977. Experimental study of artificial recharge alternatives in Northwest Hillsborough County, Florida. United States Geological Survey: Water-Resources Investigations 77-13.
Stewart, J. W. 1968. Hydrologic effects of pumping from the Floridan Aquifer in Northwest Hillsborough, Northeast Pinellas, and Southwest Pasco Counties, Florida. United States Geological Survey, Tallahassee.
Stewart, J. W., and G. H. Hughes. 1974. Hydrologic consequences of using groundwater to maintain lake levels affected by water wells near Tampa, Florida. Florida Department of Natural Resources, Tallahassee.
Southwest Florida Water Management District (SWFWMD). 1998. Water supply assessment 1995-2020. Resource Projects Department, Southwest Florida Water Management District, Brookesville.
Ter Braak, C. J. F. 1986. Canonical correspondence analysis: a new eigenvector technique for multivariate direct gradient analysis. Ecology 67(5):1167-1179.
Wollin, K. M. 1987. Nitrate determination in surface waters as an example of the application of UV derivative spectrometry to environmental analysis. Acta Hydrochemica Hydrobiologia 15:459-469.
Yurk, J. J., and J. J. Ney. 1989. Phosphorus-fish community biomass relationships in southern Appalachian reservoirs: can lakes be too clean for fish? Lake and Reservoir Management 5(2):83-90.
Zar, J. H. 1999. Biostatistical analysis, fourth edition. Prentice-Hall, Upper Saddle River, NJ.

BIOGRAPHICAL SKETCH
Patrick Cooney was born and raised in El Dorado Hills, a small and fast growing
town in the Sierra-Nevada Mountain Range in northeastern California. Upon graduating
from high school, he moved to Miami, Florida, to pursue a degree in both biology and
marine science from the University of Miami. During this time, he enjoyed studying
abroad and conducting research on marine life and marine ecosystems in Townsville,
Australia, while attending James Cook University, near the Great Barrier Reef. After
graduating from the University of Miami, he promptly moved to Bahia de Kino, Mexico
(located on the Sea of Cortez), to study an obligate mutualism between the Senita moth
and the Senita cactus, and fish for Dorado, Coryphaena hippurus. Once this research was
completed, he returned to Florida to spend time with friends and conduct research on
freshwater fish and water chemistry at the University of Florida in Gainesville. He will
continue to feed his hunger for knowledge, and teach others the knowledge he has
attained.
55