Embed Size (px)
Citation preview
Effects of long-term administration of saturated and n-3 fatty acid-richdiets on lipid utilisation and oxidative stress in rat liver and muscle tissues
Christine Feillet-Coudray1*, Manar Aoun2, Gilles Fouret1, Beatrice Bonafos1,Jeanne Ramos3, Francois Casas1, Jean Paul Cristol2 and Charles Coudray1
1INRA UMR 866, Dynamique Musculaire et Metabolisme, 34060 Montpellier, France2UMR 204 NUTRIPASS IRD/Montpellier-1/Montpellier-2/Supagro, 34000 Montpellier, France3Laboratoire d’Anatomie Pathologique, CHU Gui de Chauliac, 80, Avenue Augustin Fliche,
34295 Montpellier Cedex 5, France
(Submitted 19 October 2012 – Final revision received 26 March 2013 – Accepted 26 March 2013 – First published online 9 May 2013)
Abstract
The incidence of metabolic syndrome components including obesity, lipid deregulation, insulin resistance (IR) and non-alcoholic fatty liver
disease is increasing rapidly in wealthy societies. The present study was designed to determine the effect of different nutritional lipid
patterns (quantity and quality) on lipid utilisation and oxidative stress in the liver and muscle of rats in an integrated fashion. A total of
forty-eight Wistar male rats were fed for 12 weeks with a mixed, lard or fish-oil diet, containing either 50 or 300 g lipid/kg. Rats developed
liver steatosis associated with moderate liver injury when fed the 30 % lipid diets, in spite of the absence of overt obesity or IR, except when
fed the lard 30 % lipid diet. The intake of the 30 % lipid diets decreased hepatic lipogenesis and mitochondriogenesis and increased lipid per-
oxidation and protein oxidation. Surprisingly, muscle lipid content was not modified whatever the administered diet. The intake of the 30 %
lipid diets increased the muscle protein expression of fatty acid (FA) translocase/cluster of differentiation 36 (FAT/CD36), PPARg co-activator
1a (PGC-1a) and muscle carnitine palmitoyltransferase 1 (m-CPT1), reflecting increased FA transport in the muscle associated with increased
oxidative metabolism. The lard 30 % lipid diet led to IR without modifying the muscle lipid content. The fish-oil 30 % lipid diet failed to prevent
the development of hepatic steatosis and made the tissues more prone to oxidation. Overall, the present study suggests that the FA composition
of muscle is more important than lipid accumulation itself in the modulation of insulin sensitivity, and indicates that precaution should be taken
when advising an unphysiologically high (pharmacological) supplementation with long-chain n-3 PUFA.
Key words: SFA: n-3 PUFA: High-lipid diets: Steatosis: Insulin resistance: Oxidative stress: Mitochondria
Insulin resistance (IR) is a key component in the development
of the metabolic syndrome (MetS), a very frequent condition
characterised by dyslipidaemia, abdominal obesity and
hypertension, which are related to an elevated risk of type 2
diabetes mellitus and CVD(1). The incidence of MetS
components, in particular obesity, IR and non-alcoholic fatty
liver disease (NAFLD), is increasing rapidly in wealthy
societies and has become a major public health problem,
with a great impact on morbidity and mortality(2). Liver
lipid accumulation is the first stage of NAFLD and can occur
as a result of the diet, de novo lipogenesis or the lipids
released from adipose tissue. Then, oxidative stress, mito-
chondrial dysfunction and IR can lead to large hepatocyte
injury, inflammation and fibrosis, which characterise the
second stage of NAFLD that is called non-alcoholic steato-
hepatitis(3). Fish oils that contain considerable amounts of
n-3 fatty acid (FA) (in particular EPA and DHA) have been
reported to be protective against a number of disease states
and, in particular, n-3 FA supplementation may prevent or
reduce the progression of hepatic steatosis(4). Reduced hepatic
TAG synthesis and increased b-oxidation are known to
contribute to the hypolipidaemic effect of fish-oil diets.
However, as tissue FA composition reflects partly dietary FA
content(5), fish-oil diet intake may increase PUFA levels in
the targeted tissues and hence render them more prone to
peroxidative damage.
*Corresponding author: Dr C. Feillet-Coudray, fax þ33 4 67 54 56 94, email [email protected]
Abbreviations: b-HAD, b-hydroxyacyl-CoA dehydrogenase; ACC, acetyl-CoA carboxylase; FA, fatty acids; FAS, fatty acid synthase; FAT/CD36, fatty acid
translocase/cluster of differentiation 36; FATP4, fatty acid transport protein 4; GSH, reduced glutathione; GSSG, oxidised glutathione; IR, insulin
resistance; m-CPT1, muscle carnitine palmitoyltransferase 1; MetS, metabolic syndrome; OGTT, oral glucose tolerance test; p-ACC, phospho-acetyl-CoA
carboxylase; p-Akt, phospho-Akt; PGC-1a, PPARg co-activator 1a; PI, peroxidisability index; NAFLD, non-alcoholic fatty liver disease; SCD1, stearoyl-
CoA desaturase 1; SOD, superoxide dismutase; TBARS, thiobarbituric acid-reactive substances.
British Journal of Nutrition (2013), 110, 1789–1802 doi:10.1017/S0007114513001311q The Authors 2013
British
Journal
ofNutrition
Dow
nloaded from https://w
ww
.cambridge.org/core . IP address: 65.21.228.167 , on 24 N
ov 2021 at 03:04:23 , subject to the Cambridge Core term
s of use, available at https://ww
w.cam
bridge.org/core/terms . https://doi.org/10.1017/S0007114513001311
Skeletal muscle is an essential tissue for whole-body energy
metabolism, where FA metabolism is subject to extensive
in vivo regulation, in particular the control of FA entry into
the cell, the transfer of FA into the mitochondria and the
capacity of the b-oxidation cycle. The balance between the
uptake and utilisation of FA determines the magnitude of
lipid accumulation in the muscle. Skeletal muscle is an import-
ant site for insulin action, and the accumulation of TAG and
NEFA patterns in the muscle seems to affect insulin-mediated
glucose uptake(6). Insulin sensitivity is affected by the quality
and quantity of dietary fat, independently of its effects on
body weight. Many reports have shown that a high intake of
dietary saturated fat worsens IR(7). On the contrary, long-
chain n-3 FA may prevent IR and delay the progression of
the MetS(8), although some randomised controlled trials have
failed to confirm such beneficial effects(9).
The present study was designed to determine the impacts of
three relevant nutritional lipid patterns on lipid utilisation and
FA composition and their content in rat liver and muscle, two
highly metabolically interrelated organs that are central to
MetS pathology. These nutritional lipid patterns include the
following: (1) recommended lipid diet (mixed diet); (2) con-
sumed lipid diet in the industrialised countries (lard diet);
(3) healthy lipid diet rich in long-chain n-3 PUFA (fish-oil
diet). These dietary lipid patterns have been investigated at
two dietary lipid levels, 5 and 30 %, of diet weight. Most pub-
lished studies that have examined the effect of fat quality and/
or quantity in many different physiological and pathological
models have been interested in individual FA or in individual
oils that do not reflect any nutritional lipid profile(10,11).
Finally, we also investigated the oxidative/antioxidative
stress balance in rat liver and muscle and its relationship
with tissue FA content, as it is known that oxidative stress
may be implicated in the progression of liver steatosis and
muscle IR. The novelty of the present study is the comparison
of the three diet patterns and their impacts on the pheno-
types of two highly metabolically interrelated organs (liver
and muscle) that are central to MetS pathology with a
large number of outcomes measured, which allows an inte-
grated overview of the physiological impact of dietary fat
composition.
Materials and methods
Animals and diets
The French dietary lipid recommendation, updated in 2010,
represents the core of our dietary design (http://www.anses.
fr/Documents/NUT2006sa0359Ra.pdf). The French recom-
mendation for lipids is 35–40 % of energy intake (85–95 g
lipids/d), which is divided into ,12 % SFA, 18–20 % MUFA
and 5–10 % PUFA (with 1–2 % n-3). Although it is very diffi-
cult to replicate the human recommendations in the rat diet,
we have designed the rodent diet to be broadly reflective of
human dietary recommendations and patterns. The mixed
diet was set up to reproduce the recommended lipid
diet and composed of a blend of different lipid sources
(40 % lard þ 25 % sunflower oil þ 25 % olive oil þ 10 % colza
oil). The lard diet was set up to reproduce the currently
consumed diet in many developed countries and composed
of a large percentage of animal saturated lipids (90 %
lard þ 10 % sunflower oil). Finally, the fish-oil diet was set
up to reproduce a very healthy diet and composed of a high
percentage of marine polyunsaturated lipids rich in long-
chain n-3 FA (35 % lard þ 20 % sunflower oil þ 20 % olive
oil þ 5 % colza oil þ 20 % fish oils (12 % tuna oil þ 8 % sardine
oil)). This mixture of tuna and sardine oils provided 3 g
EPA þ DHA/kg and about 0·70 g/kg of other n-3 PUFA in the
5 % lipid diets, and 18 g EPA þ DHA/kg and about 4·3 g/kg of
other n-3 PUFA in the 30 % lipid diets. This mixture was made
to ensure an optimal DHA:EPA ratio (2:1) in this diet that pri-
vileges the DHA level that is mostly incorporated in membrane
phospholipids. The recommended amount of EPA þ DHA for
humans is 500 mg/d (0·2 % of energy intake), and it is up to
1 g/d (0·4 % of energy intake) for those with diagnosed MetS
and CVD. However, higher doses (up to 13 g/d) have been
investigated in several controlled trials(12). The dose used in
the present study is 3 g EPA þ DHA/kg diet in the 5 % lipid
diet (0·70 % of energy intake) and 18 g/kg diet in the 30 %
lipid diet supplemented with fish oils (3·15 % of energy
intake). An adult man consumes about 500 g of dry diet/d,
which means that our dose of 3 g EPA þ DHA/kg diet
(60 mg/rat per d) may be considered as physiological (supra-
nutritional) and the dose 18 g/kg diet (360 mg/rat per d) is
rather unphysiologically high (pharmacological). The detailed
composition of the six experimental diets is given in Table S1
(available online).
A total of forty-eight male Wistar rats (Charles River) aged
6 weeks were housed under the conditions of constant
temperature (20–228C), humidity (45–50 %) and a standard
dark cycle (20.00–08.00 hours). The animals were randomised
into six groups of eight and fed for 12 weeks one of the
following semi-purified diets: mixed diet with 5 or 30 %
lipid; lard diet with 5 or 30 % lipid; fish-oil diet with 5 or
30 % lipid. Rats were given free access to tap water and
food. Body weight and diet consumption were determined
weekly. Our institution guidelines for the care and use of
laboratory animals were observed, and all the experimental
procedures were approved by the local ethical committee in
Montpellier, France (Reference CEEA-LR-11 009).
Oral glucose tolerance test
The OGTT was performed as described previously(13). Briefly,
in week 11, 16 h fasting rats were orally administered 2 g
glucose/kg body weight. Blood was collected through the
tail vein of conscious rats immediately before the oral admin-
istration and 10, 20, 30, 45, 60, 90, 120 and 180 min afterwards,
and glucose was measured using a commercial glucometer
(AccuChek Active; Roche Diagnostics). The AUC values are
expressed as mg glucose/l £ min.
Sampling and routine biochemical analysis
Pentobarbital was used to anaesthetise 16 h fasted rats (Ceva
Sante Animale) and blood was obtained by puncture of the
C. Feillet-Coudray et al.1790
British
Journal
ofNutrition
Dow
nloaded from https://w
ww
.cambridge.org/core . IP address: 65.21.228.167 , on 24 N
ov 2021 at 03:04:23 , subject to the Cambridge Core term
s of use, available at https://ww
w.cam
bridge.org/core/terms . https://doi.org/10.1017/S0007114513001311
abdominal artery. Blood was centrifuged at 1000 g for 10 min
at 48C, and plasma or serum was collected and stored at
2808C until analysis. Liver and gastrocnemius muscle were
removed, rinsed with 0·9 % NaCl, frozen in N2 and kept
at 2808C until analysis. Plasma glucose, total cholesterol,
HDL-cholesterol, TAG and NEFA levels were measured by
enzymatic techniques (Konelab; Thermo Electron Corpor-
ation). Alanine transaminase and g-glutamyl transferase
were determined using standard methods on a Cobas MIRA
automated analyser (Roche Diagnostics). Plasma insulin
and leptin levels were quantified using ELISA kits (Linco
Research).
Histological analysis
For microscopic studies, liver samples were fixed in 10 % neu-
tral buffered formalin and embedded in paraffin. Serial tissue
sections (5mm) were processed. Liver injury, such as steatosis,
portal inflammatory infiltrate and fibrosis, was evaluated
by histological examination after haematoxylin and eosin
staining(14).
b-Oxidation and oxidative stress parameters in theliver and muscle
Liver and muscle homogenates were prepared on ice
(1 g with 9 ml phosphate buffer, 50 mM, pH 7·0) using a
Polytron homogeniser. Homogenate samples were saved for
thiobarbituric acid-reactive substances (TBARS) and reduced
glutathione (GSH)/oxidised glutathione (GSSG) measure-
ments. The remaining homogenates were centrifuged at
1000 g for 10 min at 48C and the supernatants were aliquoted
and kept at 2808C until analysis. Supernatant protein level
was measured by Bradford’s technique(15).
b-Hydroxyacyl-CoA dehydrogenase (b-HAD) was deter-
mined by a spectrophotometric technique according to the
procedure of Yang et al.(16). TBARS, sulphydryl groups
(–SH), GSH and GSSG levels and catalase, glutathione per-
oxidase, total superoxide dismutase (SOD) and Mn-SOD
activities in the tissues were measured by spectrophotometric
techniques as described previously(17).
Immunoblotting
Tissue samples were homogenised using an Ultra Turax
homogeniser in an ice-cold extraction buffer. Proteins were
separated with 10 or 8 % SDS–PAGE and then transferred
onto nitrocellulose membranes. The membranes were
blocked in 5 % non-fat milk for 1 h at room temperature.
The membranes were incubated overnight with a primary
antibody against acetyl-CoA carboxylase (ACC, 1:1000), phos-
pho-ACC (p-ACC, 1:1000), Akt (1:1000), phospho-Akt (p-Akt,
1/1000), FA translocase/cluster of differentiation 36 (FAT/CD36,
1:500), muscle carnitine palmitoyltransferase 1 (m-CPT1,
1:200), FA synthase (FAS, 1:1000), fatty acid transport protein 4
(FATP4, 1:1000), PPARg co-activator 1a (PGC-1a, 1:1000) and
stearoyl-CoA desaturase 1 (SCD1, 1:200) in a blocking buffer.
After washes in Tris-buffered saline/Tween, the membranes
were incubated for 1 h with horseradish peroxidase-labelled
antibodies (1:2000). After further washes, the blots were
treated with enhanced chemiluminescence detection reagents.
b-Actin was used as the loading reference, and blot intensities
were measured using ImageJ software (NIH). The antibodies
of ACC, p-ACC, Akt, p-Akt and FAS were obtained from Cell
Signaling Technology, Inc.; FAT/CD36 and FATP4 from
Abcam; m-CPT1 and SCD1 from Santa Cruz Biotechnology;
and PGC-1a from Calbiochem, Millipore SAS.
Liver and muscle mRNA expression
Real-time quantitative PCR was used to measure the mRNA
expression of the target genes in the tissues and was
performed as described previously(18). The primer sequences
used for real-time RT-PCR are given in Table S2 (available
online). After normalisation by 18S for the liver and
RPS9 for the muscle, all results are expressed as a percentage
of the control.
Extraction and analysis of liver and muscle lipids
Tissue samples were homogenised in NaCl (9 g/l) and Triton
X-100 (0·1 %), and NEFA, TAG and total cholesterol levels
in the tissue homogenates were quantified by enzymatic
methods (Wako-NEFA-C kit – Oxoid; Cholesterol RTU kit
and TG PAP kit – Biomerieux). The lipids were then extracted
from the tissue homogenates using the method of Folch
et al.(19), and P was quantified in the chloroform–methanol
extracts in order to determine total phospholipid quantity
as described previously(20). The chloroform–methanol lipid
extract, spiked with 17 : 0 (2·5mg/l) as an FA internal standard,
was used for total FA analysis by GC after trans-esterification
as described previously(8).
Tissue desaturase, unsaturation andperoxidisation indices
Because it is not possible to directly measure the activity of the
enzymes that catalyse the desaturation and elongation reac-
tions in FA metabolic pathways, results obtained in animals
have supported the use of surrogate measures of desaturase
activity such as the use of desaturase indices(21). These indices
are based on the ratio of the product to the precursor of indi-
vidual FA. Desaturase indices were calculated as follows: D9,
16 : 1n-7/16 : 0; D6, 18 : 3n-6/18 : 2n-6; D5, 20 : 4n-6/20 : 3n-6.
However, the D6 index in our muscle homogenates was esti-
mated as 20 : 3n-6/18 : 2n-6, since the proportion of 18 : 3n-6
was too low for reliable quantification. It should be noted
that this ratio also measures the elongase activity, but this
step is not considered to be rate limiting, suggesting that this
ratio is also a good estimate of D6 activity(22). The unsaturation
index is the sum of the fraction of each FA multiplied by the
number of double bonds in that acid(23). The peroxidisability
index (PI) was calculated as described previously(24):
PI ¼ ð% dienoic £ 1Þ þ ð% trienoic £ 2Þ þ ð% tetraenoic £ 3Þ
þ ð%pentaenoic £ 4Þ þ ð% hexaenoic £ 5Þ:
Dietary lipid patterns and lipid metabolism 1791
British
Journal
ofNutrition
Dow
nloaded from https://w
ww
.cambridge.org/core . IP address: 65.21.228.167 , on 24 N
ov 2021 at 03:04:23 , subject to the Cambridge Core term
s of use, available at https://ww
w.cam
bridge.org/core/terms . https://doi.org/10.1017/S0007114513001311
Statistical analysis
Results are expressed as means and standard deviations.
Statistical analysis was based on a two-way ANOVA followed
by Fisher’s multiple comparison test. When there was no sig-
nificant interaction between the quantity and quality of the
lipid groups, the comparison between the 5 and 30 % lipid
groups was done on the basis of the mean response for the
three lipid quality groups combined. However, when there
was a significant interaction, Fisher’s post hoc test was per-
formed among the lipid quality groups, testing the effect of
the diet pattern (lipid type) within the 5 and 30 % lipid
groups, separately. Correlations were performed with the
Spearman method. The limit of statistical significance was
set at P , 0·05. Statistical analysis was performed using the
StatView program (SAS Institute).
Results
Characteristics of the rats
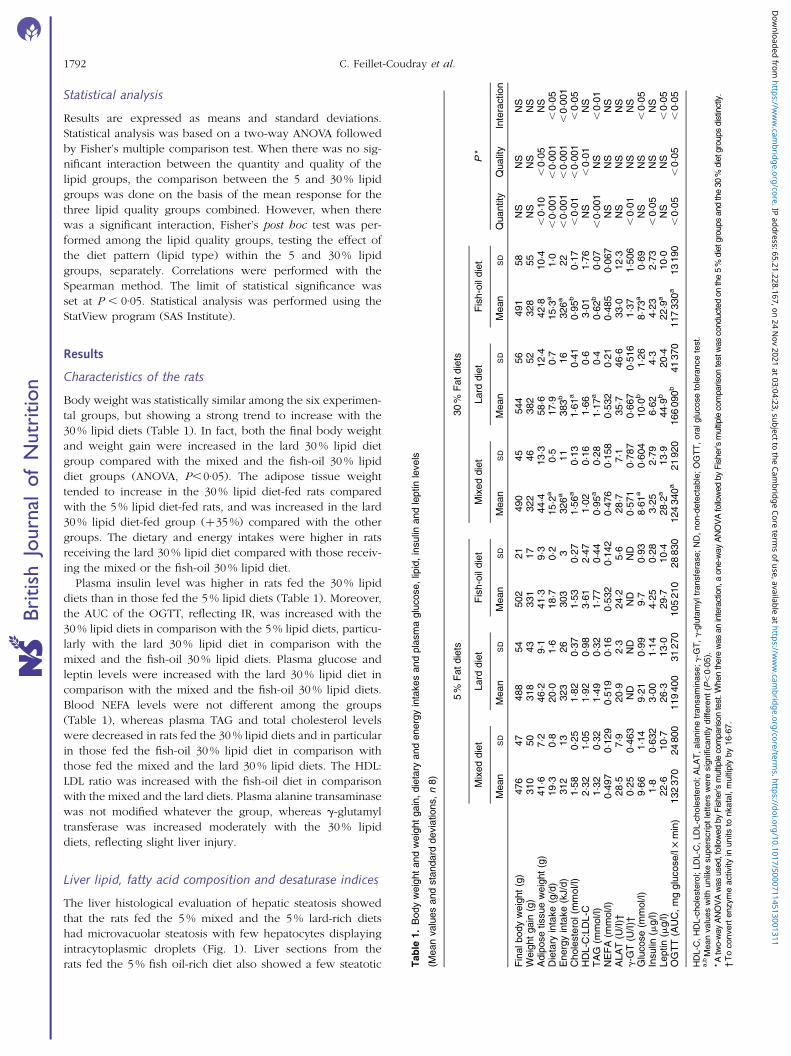
Body weight was statistically similar among the six experimen-
tal groups, but showing a strong trend to increase with the
30 % lipid diets (Table 1). In fact, both the final body weight
and weight gain were increased in the lard 30 % lipid diet
group compared with the mixed and the fish-oil 30 % lipid
diet groups (ANOVA, P,0·05). The adipose tissue weight
tended to increase in the 30 % lipid diet-fed rats compared
with the 5 % lipid diet-fed rats, and was increased in the lard
30 % lipid diet-fed group (þ35 %) compared with the other
groups. The dietary and energy intakes were higher in rats
receiving the lard 30 % lipid diet compared with those receiv-
ing the mixed or the fish-oil 30 % lipid diet.
Plasma insulin level was higher in rats fed the 30 % lipid
diets than in those fed the 5 % lipid diets (Table 1). Moreover,
the AUC of the OGTT, reflecting IR, was increased with the
30 % lipid diets in comparison with the 5 % lipid diets, particu-
larly with the lard 30 % lipid diet in comparison with the
mixed and the fish-oil 30 % lipid diets. Plasma glucose and
leptin levels were increased with the lard 30 % lipid diet in
comparison with the mixed and the fish-oil 30 % lipid diets.
Blood NEFA levels were not different among the groups
(Table 1), whereas plasma TAG and total cholesterol levels
were decreased in rats fed the 30 % lipid diets and in particular
in those fed the fish-oil 30 % lipid diet in comparison with
those fed the mixed and the lard 30 % lipid diets. The HDL:
LDL ratio was increased with the fish-oil diet in comparison
with the mixed and the lard diets. Plasma alanine transaminase
was not modified whatever the group, whereas g-glutamyl
transferase was increased moderately with the 30 % lipid
diets, reflecting slight liver injury.
Liver lipid, fatty acid composition and desaturase indices
The liver histological evaluation of hepatic steatosis showed
that the rats fed the 5 % mixed and the 5 % lard-rich diets
had microvacuolar steatosis with few hepatocytes displaying
intracytoplasmic droplets (Fig. 1). Liver sections from the
rats fed the 5 % fish oil-rich diet also showed a few steatotic Table
1.
Body
weig
ht
and
weig
ht
gain
,die
tary
and
energ
yin
takes
and
pla
sm
aglu
cose,
lipid
,in
sulin
and
leptin
levels
(Mean
valu
es
and
sta
ndard
devia
tions,n
8)
5%
Fat
die
ts30
%F
at
die
ts
Mix
ed
die
tLard
die
tF
ish-o
ildie
tM
ixed
die
tLard
die
tF
ish-o
ildie
tP
*
Mean
SD
Mean
SD
Mean
SD
Mean
SD
Mean
SD
Mean
SD
Quantity
Qualit
yIn
tera
ction
Fin
albody
weig
ht
(g)
476
47
488
54
502
21
490
45
544
56
491
58
NS
NS
NS
Weig
ht
gain
(g)
310
50
318
43
331
17
322
46
382
52
328
55
NS
NS
NS
Adip
ose
tissue
weig
ht
(g)
41
·67·2
46
·29·1
41
·39·3
44
·413
·358·6
12·4
42
·810·4
,0·1
0,
0·0
5N
SD
ieta
ryin
take
(g/d
)19
·30·8
20
·01·6
18
·70·2
15
·2a
0·5
17·9
0·7
15
·3a
1·0
,0·0
01
,0·0
01
,0·0
5E
nerg
yin
take
(kJ/d
)312
13
323
26
303
3326
a11
383
b16
326
a22
,0·0
01
,0·0
01
,0·0
01
Chole
ste
rol(m
mol/l)
1·5
80·2
51·8
20·3
71·5
30·2
71·5
6a
0·1
31·6
1a
0·4
10·9
5b
0·1
7,
0·0
1,
0·0
01
,0·0
5H
DL-C
:LD
L-C
2·3
21·0
51·9
20·9
83·6
12·4
71·0
20·1
61·6
60·6
3·0
11·7
6N
S,
0·0
1N
ST
AG
(mm
ol/l)
1·3
20·3
21·4
90·3
21·7
70·4
40·9
5a
0·2
81·1
7a
0·4
0·6
2b
0·0
7,
0·0
01
NS
,0·0
1N
EF
A(m
mol/l)
0·4
97
0·1
29
0·5
19
0·1
60·5
32
0·1
42
0·4
76
0·1
58
0·5
32
0·2
10·4
85
0·0
67
NS
NS
NS
ALA
T(U
/I)†
28
·57·9
20
·92·3
24
·25·6
28
·77·1
35·7
46·6
33
·012·3
NS
NS
NS
g-G
T(U
/I)†
0·2
50·4
63
ND
ND
ND
ND
0·5
71
0·7
87
0·6
67
0·5
16
1·3
71·5
06
,0·0
1N
SN
SG
lucose
(mm
ol/l)
9·6
61·1
49·2
10·9
99·7
0·9
38·6
1a
0·6
04
10·0
b1·2
68·7
3a
0·6
9N
SN
S,
0·0
5In
sulin
(mg/l)
1·8
0·6
32
3·0
01·1
44·2
50·2
83·2
52·7
96·6
24·3
4·2
32·7
3,
0·0
5N
SN
SLeptin
(mg/l)
22
·610·7
26
·313·0
29
·710·4
28
·2a
13
·944·9
b20·4
22
·9a
10·0
NS
NS
,0·0
5O
GT
T(A
UC
,m
gglu
cose/l£
min
)132
370
24
800
119
400
31
270
105
210
28
830
124
340
a21
920
166
090
b41
370
117
330
a13
190
,0·0
5,
0·0
5,
0·0
5
HD
L-C
,H
DL-c
hole
ste
rol;
LD
L-C
,LD
L-c
hole
ste
rol;
ALA
T,
ala
nin
etr
ansam
inase;g-G
T,g-g
luta
myltr
ansfe
rase;
ND
,non-d
ete
cta
ble
;O
GT
T,
ora
lglu
cose
tole
rance
test.
a,b
Mean
valu
es
with
unlik
esupers
cript
lett
ers
were
sig
nifi
cantly
diffe
rent
(P,
0·0
5).
*A
two-w
ay
AN
OV
Aw
as
use
d,f
ollo
wed
by
Fis
her’s
multi
ple
com
paris
on
test
.When
there
was
an
inte
ract
ion,a
one-w
ay
AN
OV
Afo
llow
ed
by
Fis
her’s
multi
ple
com
paris
on
test
was
conduct
ed
on
the
5%
die
tgro
ups
and
the
30
%die
tgro
ups
dis
tinct
ly.
†T
oconvert
enzym
eactivity
inunits
tonkata
l,m
ultip
lyby
16·6
7.
C. Feillet-Coudray et al.1792
British
Journal
ofNutrition
Dow
nloaded from https://w
ww
.cambridge.org/core . IP address: 65.21.228.167 , on 24 N
ov 2021 at 03:04:23 , subject to the Cambridge Core term
s of use, available at https://ww
w.cam
bridge.org/core/terms . https://doi.org/10.1017/S0007114513001311
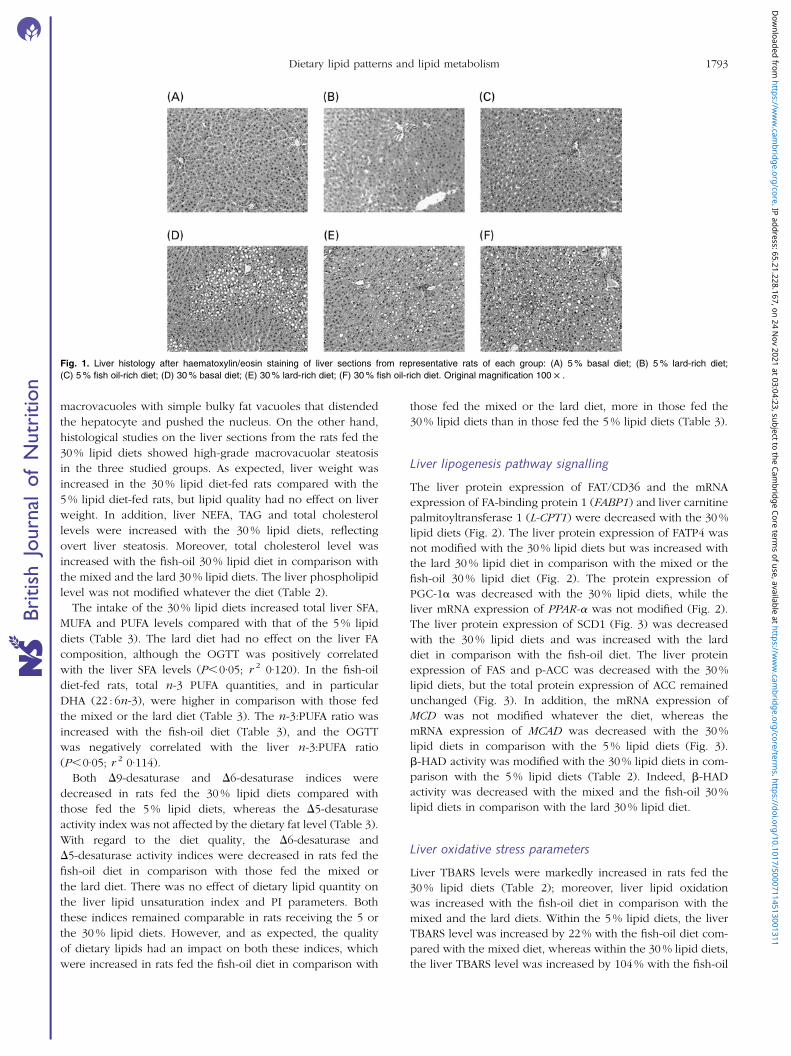
macrovacuoles with simple bulky fat vacuoles that distended
the hepatocyte and pushed the nucleus. On the other hand,
histological studies on the liver sections from the rats fed the
30 % lipid diets showed high-grade macrovacuolar steatosis
in the three studied groups. As expected, liver weight was
increased in the 30 % lipid diet-fed rats compared with the
5 % lipid diet-fed rats, but lipid quality had no effect on liver
weight. In addition, liver NEFA, TAG and total cholesterol
levels were increased with the 30 % lipid diets, reflecting
overt liver steatosis. Moreover, total cholesterol level was
increased with the fish-oil 30 % lipid diet in comparison with
the mixed and the lard 30 % lipid diets. The liver phospholipid
level was not modified whatever the diet (Table 2).
The intake of the 30 % lipid diets increased total liver SFA,
MUFA and PUFA levels compared with that of the 5 % lipid
diets (Table 3). The lard diet had no effect on the liver FA
composition, although the OGTT was positively correlated
with the liver SFA levels (P,0·05; r 2 0·120). In the fish-oil
diet-fed rats, total n-3 PUFA quantities, and in particular
DHA (22 : 6n-3), were higher in comparison with those fed
the mixed or the lard diet (Table 3). The n-3:PUFA ratio was
increased with the fish-oil diet (Table 3), and the OGTT
was negatively correlated with the liver n-3:PUFA ratio
(P,0·05; r 2 0·114).
Both D9-desaturase and D6-desaturase indices were
decreased in rats fed the 30 % lipid diets compared with
those fed the 5 % lipid diets, whereas the D5-desaturase
activity index was not affected by the dietary fat level (Table 3).
With regard to the diet quality, the D6-desaturase and
D5-desaturase activity indices were decreased in rats fed the
fish-oil diet in comparison with those fed the mixed or
the lard diet. There was no effect of dietary lipid quantity on
the liver lipid unsaturation index and PI parameters. Both
these indices remained comparable in rats receiving the 5 or
the 30 % lipid diets. However, and as expected, the quality
of dietary lipids had an impact on both these indices, which
were increased in rats fed the fish-oil diet in comparison with
those fed the mixed or the lard diet, more in those fed the
30% lipid diets than in those fed the 5% lipid diets (Table 3).
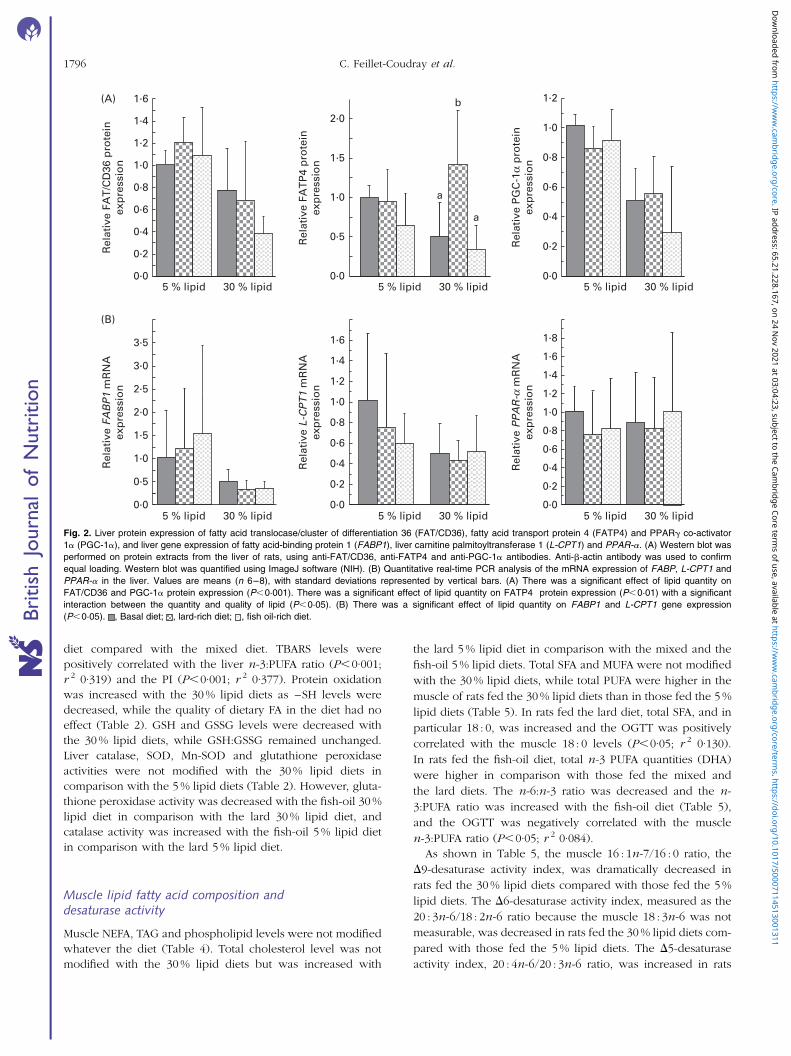
Liver lipogenesis pathway signalling
The liver protein expression of FAT/CD36 and the mRNA
expression of FA-binding protein 1 (FABP1) and liver carnitine
palmitoyltransferase 1 (L-CPT1) were decreased with the 30 %
lipid diets (Fig. 2). The liver protein expression of FATP4 was
not modified with the 30 % lipid diets but was increased with
the lard 30 % lipid diet in comparison with the mixed or the
fish-oil 30 % lipid diet (Fig. 2). The protein expression of
PGC-1a was decreased with the 30 % lipid diets, while the
liver mRNA expression of PPAR-a was not modified (Fig. 2).
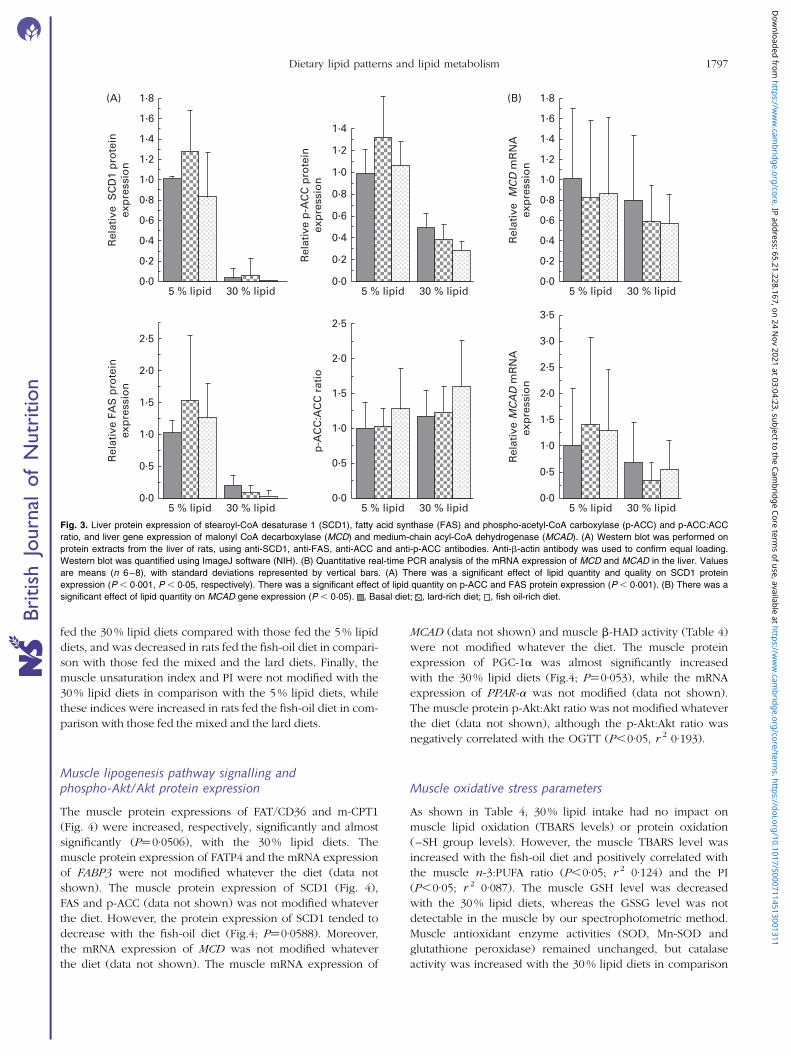
The liver protein expression of SCD1 (Fig. 3) was decreased
with the 30 % lipid diets and was increased with the lard
diet in comparison with the fish-oil diet. The liver protein
expression of FAS and p-ACC was decreased with the 30 %
lipid diets, but the total protein expression of ACC remained
unchanged (Fig. 3). In addition, the mRNA expression of
MCD was not modified whatever the diet, whereas the
mRNA expression of MCAD was decreased with the 30 %
lipid diets in comparison with the 5 % lipid diets (Fig. 3).
b-HAD activity was modified with the 30 % lipid diets in com-
parison with the 5 % lipid diets (Table 2). Indeed, b-HAD
activity was decreased with the mixed and the fish-oil 30 %
lipid diets in comparison with the lard 30 % lipid diet.
Liver oxidative stress parameters
Liver TBARS levels were markedly increased in rats fed the
30 % lipid diets (Table 2); moreover, liver lipid oxidation
was increased with the fish-oil diet in comparison with the
mixed and the lard diets. Within the 5 % lipid diets, the liver
TBARS level was increased by 22 % with the fish-oil diet com-
pared with the mixed diet, whereas within the 30 % lipid diets,
the liver TBARS level was increased by 104 % with the fish-oil
Fig. 1. Liver histology after haematoxylin/eosin staining of liver sections from representative rats of each group: (A) 5 % basal diet; (B) 5 % lard-rich diet;
(C) 5 % fish oil-rich diet; (D) 30 % basal diet; (E) 30 % lard-rich diet; (F) 30 % fish oil-rich diet. Original magnification 100 £ .
Dietary lipid patterns and lipid metabolism 1793
British
Journal
ofNutrition
Dow
nloaded from https://w
ww
.cambridge.org/core . IP address: 65.21.228.167 , on 24 N
ov 2021 at 03:04:23 , subject to the Cambridge Core term
s of use, available at https://ww
w.cam
bridge.org/core/terms . https://doi.org/10.1017/S0007114513001311
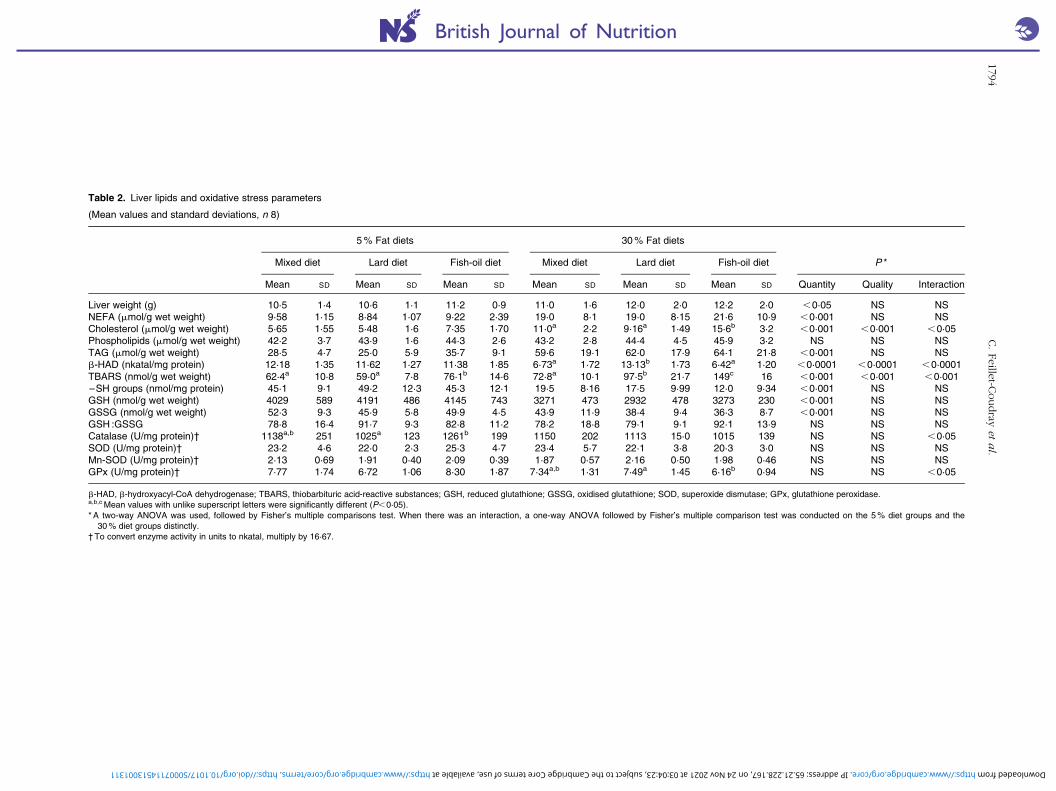
Table 2. Liver lipids and oxidative stress parameters
(Mean values and standard deviations, n 8)
5 % Fat diets 30 % Fat diets
Mixed diet Lard diet Fish-oil diet Mixed diet Lard diet Fish-oil diet P *
Mean SD Mean SD Mean SD Mean SD Mean SD Mean SD Quantity Quality Interaction
Liver weight (g) 10·5 1·4 10·6 1·1 11·2 0·9 11·0 1·6 12·0 2·0 12·2 2·0 ,0·05 NS NSNEFA (mmol/g wet weight) 9·58 1·15 8·84 1·07 9·22 2·39 19·0 8·1 19·0 8·15 21·6 10·9 ,0·001 NS NSCholesterol (mmol/g wet weight) 5·65 1·55 5·48 1·6 7·35 1·70 11·0a 2·2 9·16a 1·49 15·6b 3·2 ,0·001 ,0·001 ,0·05Phospholipids (mmol/g wet weight) 42·2 3·7 43·9 1·6 44·3 2·6 43·2 2·8 44·4 4·5 45·9 3·2 NS NS NSTAG (mmol/g wet weight) 28·5 4·7 25·0 5·9 35·7 9·1 59·6 19·1 62·0 17·9 64·1 21·8 ,0·001 NS NSb-HAD (nkatal/mg protein) 12·18 1·35 11·62 1·27 11·38 1·85 6·73a 1·72 13·13b 1·73 6·42a 1·20 ,0·0001 ,0·0001 ,0·0001TBARS (nmol/g wet weight) 62·4a 10·8 59·0a 7·8 76·1b 14·6 72·8a 10·1 97·5b 21·7 149c 16 ,0·001 ,0·001 ,0·001–SH groups (nmol/mg protein) 45·1 9·1 49·2 12·3 45·3 12·1 19·5 8·16 17·5 9·99 12·0 9·34 ,0·001 NS NSGSH (nmol/g wet weight) 4029 589 4191 486 4145 743 3271 473 2932 478 3273 230 ,0·001 NS NSGSSG (nmol/g wet weight) 52·3 9·3 45·9 5·8 49·9 4·5 43·9 11·9 38·4 9·4 36·3 8·7 ,0·001 NS NSGSH :GSSG 78·8 16·4 91·7 9·3 82·8 11·2 78·2 18·8 79·1 9·1 92·1 13·9 NS NS NSCatalase (U/mg protein)† 1138a,b 251 1025a 123 1261b 199 1150 202 1113 15·0 1015 139 NS NS ,0·05SOD (U/mg protein)† 23·2 4·6 22·0 2·3 25·3 4·7 23·4 5·7 22·1 3·8 20·3 3·0 NS NS NSMn-SOD (U/mg protein)† 2·13 0·69 1·91 0·40 2·09 0·39 1·87 0·57 2·16 0·50 1·98 0·46 NS NS NSGPx (U/mg protein)† 7·77 1·74 6·72 1·06 8·30 1·87 7·34a,b 1·31 7·49a 1·45 6·16b 0·94 NS NS ,0·05
b-HAD, b-hydroxyacyl-CoA dehydrogenase; TBARS, thiobarbituric acid-reactive substances; GSH, reduced glutathione; GSSG, oxidised glutathione; SOD, superoxide dismutase; GPx, glutathione peroxidase.a,b,c Mean values with unlike superscript letters were significantly different (P,0·05).* A two-way ANOVA was used, followed by Fisher’s multiple comparisons test. When there was an interaction, a one-way ANOVA followed by Fisher’s multiple comparison test was conducted on the 5 % diet groups and the
30 % diet groups distinctly.† To convert enzyme activity in units to nkatal, multiply by 16·67.
C.Feille
t-Coudray
eta
l.1794
British Journal of NutritionDownloaded from https://www.cambridge.org/core. IP address: 65.21.228.167, on 24 Nov 2021 at 03:04:23, subject to the Cambridge Core terms of use, available at https://www.cambridge.org/core/terms. https://doi.org/10.1017/S0007114513001311
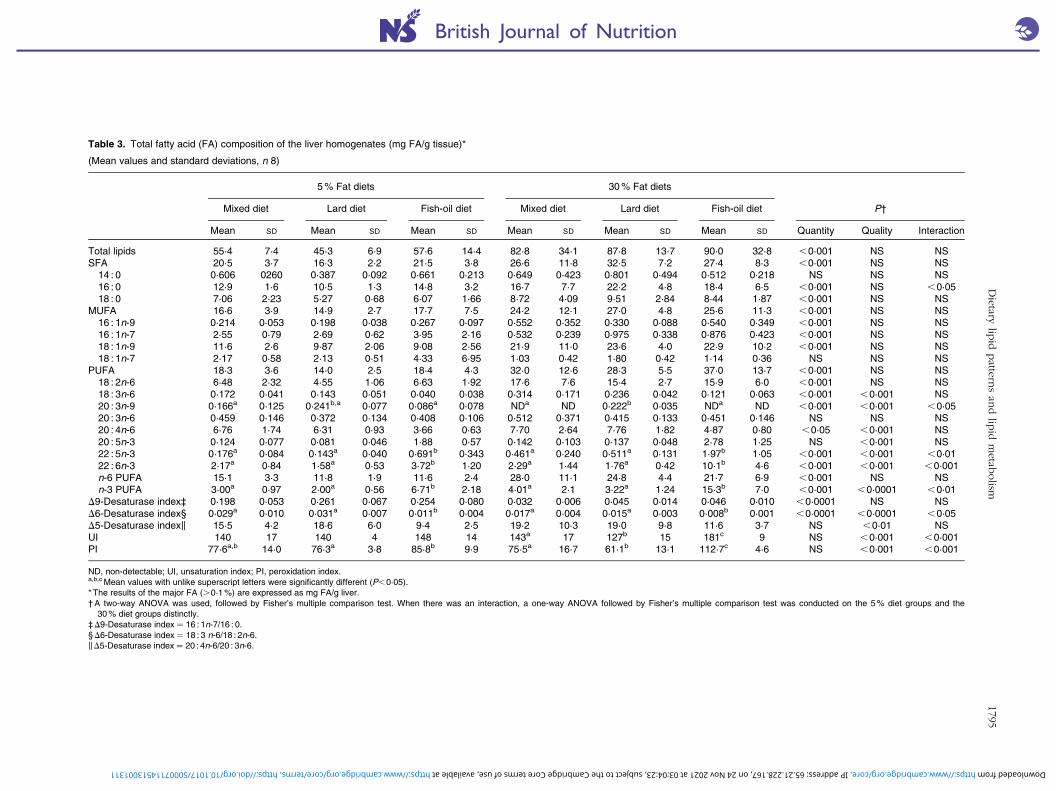
Table 3. Total fatty acid (FA) composition of the liver homogenates (mg FA/g tissue)*
(Mean values and standard deviations, n 8)
5 % Fat diets 30 % Fat diets
Mixed diet Lard diet Fish-oil diet Mixed diet Lard diet Fish-oil diet P†
Mean SD Mean SD Mean SD Mean SD Mean SD Mean SD Quantity Quality Interaction
Total lipids 55·4 7·4 45·3 6·9 57·6 14·4 82·8 34·1 87·8 13·7 90·0 32·8 ,0·001 NS NSSFA 20·5 3·7 16·3 2·2 21·5 3·8 26·6 11·8 32·5 7·2 27·4 8·3 ,0·001 NS NS
14 : 0 0·606 0260 0·387 0·092 0·661 0·213 0·649 0·423 0·801 0·494 0·512 0·218 NS NS NS16 : 0 12·9 1·6 10·5 1·3 14·8 3·2 16·7 7·7 22·2 4·8 18·4 6·5 ,0·001 NS ,0·0518 : 0 7·06 2·23 5·27 0·68 6·07 1·66 8·72 4·09 9·51 2·84 8·44 1·87 ,0·001 NS NS
MUFA 16·6 3·9 14·9 2·7 17·7 7·5 24·2 12·1 27·0 4·8 25·6 11·3 ,0·001 NS NS16 : 1n-9 0·214 0·053 0·198 0·038 0·267 0·097 0·552 0·352 0·330 0·088 0·540 0·349 ,0·001 NS NS16 : 1n-7 2·55 0·79 2·69 0·62 3·95 2·16 0·532 0·239 0·975 0·338 0·876 0·423 ,0·001 NS NS18 : 1n-9 11·6 2·6 9·87 2·06 9·08 2·56 21·9 11·0 23·6 4·0 22·9 10·2 ,0·001 NS NS18 : 1n-7 2·17 0·58 2·13 0·51 4·33 6·95 1·03 0·42 1·80 0·42 1·14 0·36 NS NS NS
PUFA 18·3 3·6 14·0 2·5 18·4 4·3 32·0 12·6 28·3 5·5 37·0 13·7 ,0·001 NS NS18 : 2n-6 6·48 2·32 4·55 1·06 6·63 1·92 17·6 7·6 15·4 2·7 15·9 6·0 ,0·001 NS NS18 : 3n-6 0·172 0·041 0·143 0·051 0·040 0·038 0·314 0·171 0·236 0·042 0·121 0·063 ,0·001 ,0·001 NS20 : 3n-9 0·166a 0·125 0·241b,a 0·077 0·086a 0·078 NDa ND 0·222b 0·035 NDa ND ,0·001 ,0·001 ,0·0520 : 3n-6 0·459 0·146 0·372 0·134 0·408 0·106 0·512 0·371 0·415 0·133 0·451 0·146 NS NS NS20 : 4n-6 6·76 1·74 6·31 0·93 3·66 0·63 7·70 2·64 7·76 1·82 4·87 0·80 ,0·05 ,0·001 NS20 : 5n-3 0·124 0·077 0·081 0·046 1·88 0·57 0·142 0·103 0·137 0·048 2·78 1·25 NS ,0·001 NS22 : 5n-3 0·176a 0·084 0·143a 0·040 0·691b 0·343 0·461a 0·240 0·511a 0·131 1·97b 1·05 ,0·001 ,0·001 ,0·0122 : 6n-3 2·17a 0·84 1·58a 0·53 3·72b 1·20 2·29a 1·44 1·76a 0·42 10·1b 4·6 ,0·001 ,0·001 ,0·001n-6 PUFA 15·1 3·3 11·8 1·9 11·6 2·4 28·0 11·1 24·8 4·4 21·7 6·9 ,0·001 NS NSn-3 PUFA 3·00a 0·97 2·00a 0·56 6·71b 2·18 4·01a 2·1 3·22a 1·24 15·3b 7·0 ,0·001 ,0·0001 ,0·01
D9-Desaturase index‡ 0·198 0·053 0·261 0·067 0·254 0·080 0·032 0·006 0·045 0·014 0·046 0·010 ,0·0001 NS NSD6-Desaturase index§ 0·029a 0·010 0·031a 0·007 0·011b 0·004 0·017a 0·004 0·015a 0·003 0·008b 0·001 ,0·0001 ,0·0001 ,0·05D5-Desaturase indexk 15·5 4·2 18·6 6·0 9·4 2·5 19·2 10·3 19·0 9·8 11·6 3·7 NS ,0·01 NSUI 140 17 140 4 148 14 143a 17 127b 15 181c 9 NS ,0·001 ,0·001PI 77·6a,b 14·0 76·3a 3·8 85·8b 9·9 75·5a 16·7 61·1b 13·1 112·7c 4·6 NS ,0·001 ,0·001
ND, non-detectable; UI, unsaturation index; PI, peroxidation index.a,b,c Mean values with unlike superscript letters were significantly different (P,0·05).* The results of the major FA (.0·1 %) are expressed as mg FA/g liver.† A two-way ANOVA was used, followed by Fisher’s multiple comparison test. When there was an interaction, a one-way ANOVA followed by Fisher’s multiple comparison test was conducted on the 5 % diet groups and the
30 % diet groups distinctly.‡D9-Desaturase index ¼ 16 : 1n-7/16 : 0.§D6-Desaturase index ¼ 18 : 3 n-6/18 : 2n-6.kD5-Desaturase index ¼ 20 : 4n-6/20 : 3n-6.
Die
tarylip
idpatte
rns
and
lipid
metab
olism
1795
British Journal of NutritionDownloaded from https://www.cambridge.org/core. IP address: 65.21.228.167, on 24 Nov 2021 at 03:04:23, subject to the Cambridge Core terms of use, available at https://www.cambridge.org/core/terms. https://doi.org/10.1017/S0007114513001311
diet compared with the mixed diet. TBARS levels were
positively correlated with the liver n-3:PUFA ratio (P,0·001;
r 2 0·319) and the PI (P,0·001; r 2 0·377). Protein oxidation
was increased with the 30 % lipid diets as –SH levels were
decreased, while the quality of dietary FA in the diet had no
effect (Table 2). GSH and GSSG levels were decreased with
the 30 % lipid diets, while GSH:GSSG remained unchanged.
Liver catalase, SOD, Mn-SOD and glutathione peroxidase
activities were not modified with the 30 % lipid diets in
comparison with the 5 % lipid diets (Table 2). However, gluta-
thione peroxidase activity was decreased with the fish-oil 30 %
lipid diet in comparison with the lard 30 % lipid diet, and
catalase activity was increased with the fish-oil 5 % lipid diet
in comparison with the lard 5 % lipid diet.
Muscle lipid fatty acid composition anddesaturase activity
Muscle NEFA, TAG and phospholipid levels were not modified
whatever the diet (Table 4). Total cholesterol level was not
modified with the 30 % lipid diets but was increased with
the lard 5 % lipid diet in comparison with the mixed and the
fish-oil 5 % lipid diets. Total SFA and MUFA were not modified
with the 30 % lipid diets, while total PUFA were higher in the
muscle of rats fed the 30 % lipid diets than in those fed the 5 %
lipid diets (Table 5). In rats fed the lard diet, total SFA, and in
particular 18 : 0, was increased and the OGTT was positively
correlated with the muscle 18 : 0 levels (P,0·05; r 2 0·130).
In rats fed the fish-oil diet, total n-3 PUFA quantities (DHA)
were higher in comparison with those fed the mixed and
the lard diets. The n-6:n-3 ratio was decreased and the n-
3:PUFA ratio was increased with the fish-oil diet (Table 5),
and the OGTT was negatively correlated with the muscle
n-3:PUFA ratio (P,0·05; r 2 0·084).
As shown in Table 5, the muscle 16 : 1n-7/16 : 0 ratio, the
D9-desaturase activity index, was dramatically decreased in
rats fed the 30 % lipid diets compared with those fed the 5 %
lipid diets. The D6-desaturase activity index, measured as the
20 : 3n-6/18 : 2n-6 ratio because the muscle 18 : 3n-6 was not
measurable, was decreased in rats fed the 30 % lipid diets com-
pared with those fed the 5 % lipid diets. The D5-desaturase
activity index, 20 : 4n-6/20 : 3n-6 ratio, was increased in rats
1·6(A)
(B)
1·2
0·8
1·0
1·2
1·4
1·0
1·5
2·0
a
b
0·6
0·8
1·0
Rel
ativ
e FA
T/C
D36
pro
tein
exp
ress
ion
0·0
0·2
0·4
0·6
Rel
ativ
e FA
TP
4 p
rote
inex
pre
ssio
n
0·0
0·5
a
0·0
0·2
0·4
Rel
ativ
e P
GC
-1α
pro
tein
exp
ress
ion
1·2
1·4
1·6
2·5
3·0
3·5
1·2
1·4
1·6
1·8
0·2
0·4
0·6
0·8
1·0
0·5
1·0
1·5
2·0
0·2
0·4
0·6
0·8
1·0
Rel
ativ
e L-
CP
T1
mR
NA
exp
ress
ion
0·00·030 % lipid5 % lipid 30 % lipid5 % lipid 30 % lipid5 % lipid
30 % lipid5 % lipid 30 % lipid5 % lipid 30 % lipid5 % lipid
Rel
ativ
e FA
BP
1 m
RN
Aex
pre
ssio
n
0·0R
elat
ive
PP
AR
-a m
RN
Aex
pre
ssio
nFig. 2. Liver protein expression of fatty acid translocase/cluster of differentiation 36 (FAT/CD36), fatty acid transport protein 4 (FATP4) and PPARg co-activator
1a (PGC-1a), and liver gene expression of fatty acid-binding protein 1 (FABP1), liver carnitine palmitoyltransferase 1 (L-CPT1) and PPAR-a. (A) Western blot was
performed on protein extracts from the liver of rats, using anti-FAT/CD36, anti-FATP4 and anti-PGC-1a antibodies. Anti-b-actin antibody was used to confirm
equal loading. Western blot was quantified using ImageJ software (NIH). (B) Quantitative real-time PCR analysis of the mRNA expression of FABP, L-CPT1 and
PPAR-a in the liver. Values are means (n 6–8), with standard deviations represented by vertical bars. (A) There was a significant effect of lipid quantity on
FAT/CD36 and PGC-1a protein expression (P,0·001). There was a significant effect of lipid quantity on FATP4 protein expression (P,0·01) with a significant
interaction between the quantity and quality of lipid (P,0·05). (B) There was a significant effect of lipid quantity on FABP1 and L-CPT1 gene expression
(P,0·05). , Basal diet; , lard-rich diet; , fish oil-rich diet.
C. Feillet-Coudray et al.1796
British
Journal
ofNutrition
Dow
nloaded from https://w
ww
.cambridge.org/core . IP address: 65.21.228.167 , on 24 N
ov 2021 at 03:04:23 , subject to the Cambridge Core term
s of use, available at https://ww
w.cam
bridge.org/core/terms . https://doi.org/10.1017/S0007114513001311
fed the 30 % lipid diets compared with those fed the 5 % lipid
diets, and was decreased in rats fed the fish-oil diet in compari-
son with those fed the mixed and the lard diets. Finally, the
muscle unsaturation index and PI were not modified with the
30 % lipid diets in comparison with the 5 % lipid diets, while
these indices were increased in rats fed the fish-oil diet in com-
parison with those fed the mixed and the lard diets.
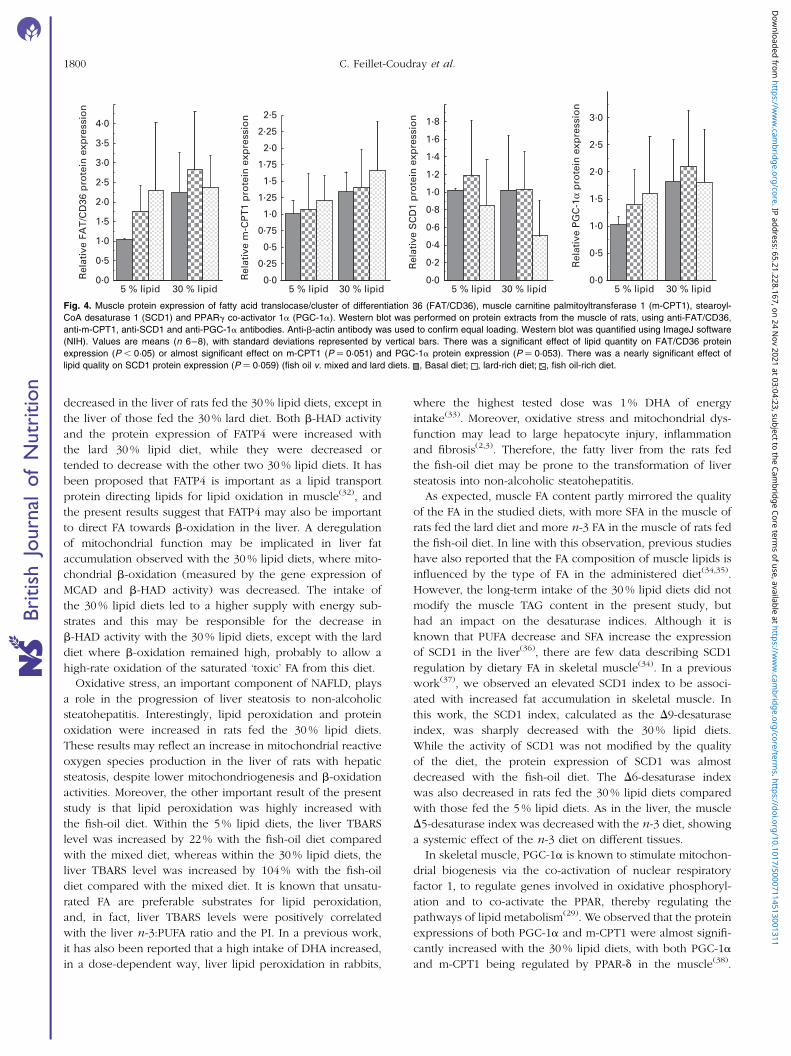
Muscle lipogenesis pathway signalling andphospho-Akt/Akt protein expression
The muscle protein expressions of FAT/CD36 and m-CPT1
(Fig. 4) were increased, respectively, significantly and almost
significantly (P¼0·0506), with the 30 % lipid diets. The
muscle protein expression of FATP4 and the mRNA expression
of FABP3 were not modified whatever the diet (data not
shown). The muscle protein expression of SCD1 (Fig. 4),
FAS and p-ACC (data not shown) was not modified whatever
the diet. However, the protein expression of SCD1 tended to
decrease with the fish-oil diet (Fig.4; P¼0·0588). Moreover,
the mRNA expression of MCD was not modified whatever
the diet (data not shown). The muscle mRNA expression of
MCAD (data not shown) and muscle b-HAD activity (Table 4)
were not modified whatever the diet. The muscle protein
expression of PGC-1a was almost significantly increased
with the 30 % lipid diets (Fig.4; P¼0·053), while the mRNA
expression of PPAR-a was not modified (data not shown).
The muscle protein p-Akt:Akt ratio was not modified whatever
the diet (data not shown), although the p-Akt:Akt ratio was
negatively correlated with the OGTT (P,0·05, r 2 0·193).
Muscle oxidative stress parameters
As shown in Table 4, 30 % lipid intake had no impact on
muscle lipid oxidation (TBARS levels) or protein oxidation
(–SH group levels). However, the muscle TBARS level was
increased with the fish-oil diet and positively correlated with
the muscle n-3:PUFA ratio (P,0·05; r 2 0·124) and the PI
(P,0·05; r 2 0·087). The muscle GSH level was decreased
with the 30 % lipid diets, whereas the GSSG level was not
detectable in the muscle by our spectrophotometric method.
Muscle antioxidant enzyme activities (SOD, Mn-SOD and
glutathione peroxidase) remained unchanged, but catalase
activity was increased with the 30 % lipid diets in comparison
1·8(B)1·8(A)
0·8
1·0
1·2
1·4
1·6
0·8
1·0
1·2
1·4
1·0
1·2
1·4
1·6
0·0
0·2
0·4
0·6
Rel
ativ
e M
CD
mR
NA
exp
ress
ion
Rel
ativ
e p
-AC
C p
rote
inex
pre
ssio
n
0·0
0·2
0·4
0·6
5 % lipid 30 % lipid5 % lipid 30 % lipid 5 % lipid 30 % lipid
5 % lipid 30 % lipid5 % lipid 30 % lipid 5 % lipid 30 % lipid
0·0
0·2
0·4
0·6
0·8
Rel
ativ
e S
CD
1 p
rote
inex
pre
ssio
n
2·5
3·0
3·5
2·0
2·5
2·0
2·5
0·5
1·0
1·5
2·0
p-A
CC
:AC
C r
atio
0·5
1·0
1·5
0·5
1·0
1·5
Rel
ativ
e FA
S p
rote
inex
pre
ssio
n
0·0R
elat
ive
MC
AD
mR
NA
exp
ress
ion
0·00·0
Fig. 3. Liver protein expression of stearoyl-CoA desaturase 1 (SCD1), fatty acid synthase (FAS) and phospho-acetyl-CoA carboxylase (p-ACC) and p-ACC:ACC
ratio, and liver gene expression of malonyl CoA decarboxylase (MCD) and medium-chain acyl-CoA dehydrogenase (MCAD). (A) Western blot was performed on
protein extracts from the liver of rats, using anti-SCD1, anti-FAS, anti-ACC and anti-p-ACC antibodies. Anti-b-actin antibody was used to confirm equal loading.
Western blot was quantified using ImageJ software (NIH). (B) Quantitative real-time PCR analysis of the mRNA expression of MCD and MCAD in the liver. Values
are means (n 6–8), with standard deviations represented by vertical bars. (A) There was a significant effect of lipid quantity and quality on SCD1 protein
expression (P , 0·001, P , 0·05, respectively). There was a significant effect of lipid quantity on p-ACC and FAS protein expression (P , 0·001). (B) There was a
significant effect of lipid quantity on MCAD gene expression (P , 0·05). , Basal diet; , lard-rich diet; , fish oil-rich diet.
Dietary lipid patterns and lipid metabolism 1797
British
Journal
ofNutrition
Dow
nloaded from https://w
ww
.cambridge.org/core . IP address: 65.21.228.167 , on 24 N
ov 2021 at 03:04:23 , subject to the Cambridge Core term
s of use, available at https://ww
w.cam
bridge.org/core/terms . https://doi.org/10.1017/S0007114513001311
with the 5 % lipid diets (Table 4), and was increased with the
fish-oil 30 % lipid diet in comparison with the mixed and the
lard 30 % lipid diets.
Discussion
The present study was designed to determine the impacts of
different relevant patterns of dietary lipids (quantity and qual-
ity) on lipid utilisation and FA content in rat liver and muscle
tissues and their consequences on NAFLD and IR. The present
results show that the intake of 30 % lipid diets increased liver
FA and TAG contents and led to liver steatosis (liver lipid dro-
plets). The lard diet had no effect on liver FA composition,
probably because of the high dietary level of MUFA or the
in vivo synthesis of MUFA from SFA. In accordance with this
observation, the protein expression of SCD1, a D9-desaturase
that catalyses the synthesis of monounsaturated long-chain FA
from saturated fatty acyl-CoA, was increased with the lard diet.
In contrast, the fish-oil diet considerably modulated the liver
FA composition, where n-3 PUFA level was increased in the
liver of rats fed the fish-oil diet. Moreover, the fish-oil diet
decreased the liver D6-desaturase and D5-desaturase activity
indices, which is in line with the recent reports(25).
Liver FA can be derived from the diet and are synthesised
de novo in case of excess carbohydrates, and then they are
oxidised or esterified to glycerol for the synthesis of TAG(26).
In the present study, the protein expression of the major
actors of lipid metabolism (FAT/CD36, FABP1, ACC and FAS)
was decreased and the protein expression of SCD1 was
almost suppressed in rats fed the 30 % lipid diets. Moreover,
the p-ACC:ACC ratio and the gene expression of MCD were
unchanged. Surprisingly, the protein expression of FATP4
was increased in rats fed the lard 30 % lipid diet. As the con-
tent of palmitic acid is higher in the lard diet than in the
mixed and the fish-oil diets, it is possible that the protein
expression of FATP4 was increased because FATP4 was
more effective than the other FA transporters in palmitate
transport, as suggested previously(27). It has been well docu-
mented that hepatic lipogenesis is markedly reduced with
high-lipid diets, with the transcription of hepatic genes encod-
ing FAS, SCD1 and ACC being rapidly suppressed, and that
this effect is more pronounced with n-3 FA(28). Moreover, it
has been reported that n-3 supplementation may prevent or
reduce hepatic steatosis(4). However, in the present study,
we did not observe any reduced lipogenesis or lower liver
lipid content with the fish-oil diet compared with the other
two studied diets.
Mitochondrial biogenesis is largely controlled by the tran-
scriptional co-activator PGC-1a. This later induces the genes
involved in mitochondrial b-oxidation, such as MCAD and
L-CPT1 (29,30). In the present study, the protein expression of
PGC-1a was decreased with the 30 % lipid diets, without any
effect of the dietary lipid quality. In accordance with this,
the gene expression of L-CPT1, which allows FA to cross the
mitochondrial membrane(31), and the gene expression of
MCAD, the first enzyme in the b-oxidation cycle, were
down-regulated with the 30 % lipid diets. Moreover, b-HAD
activity, the third enzyme in the b-oxidation cycle, wasTable
4.
Muscle
lipid
sand
oxid
ative
str
ess
(Mean
valu
es
and
sta
ndard
devia
tions,n
8)
5%
Fat
die
ts30
%F
at
die
ts
Mix
ed
die
tLard
die
tF
ish-o
ildie
tM
ixed
die
tLard
die
tF
ish-o
ildie
tP
*
Mean
SD
Mean
SD
Mean
SD
Mean
SD
Mean
SD
Mean
SD
Quantity
Qualit
yIn
tera
ction
Muscle
weig
ht
(g)
2·7
60·3
32·5
91·7
22·7
00·1
92·6
20·1
42·6
70·2
02·5
80·1
8N
SN
SN
SN
EF
A(m
mol/g
wet
weig
ht)
1·9
80·6
01·9
50·4
51·8
60·1
81·8
00·1
91·8
50·4
51·8
90·2
7N
SN
SN
SC
hole
ste
rol(m
mol/g
wet
weig
ht)
1·3
0a
0·2
21·5
5b
0·8
71·3
6a,b
0·1
71·3
00·1
61·1
60·2
61·3
40·1
9,
0·0
5N
S,
0·0
5P
hospholip
ids
(mm
ol/g
wet
weig
ht)
10·2
2·0
10
·82·4
11
·51·7
11·3
2·2
11
·82·2
12
·62·7
NS
NS
NS
TA
G(m
mol/g
wet
weig
ht)
2·7
31·0
93·6
41·8
42·5
50·6
82·5
10·7
42·6
31·2
13·2
21·3
5N
SN
SN
Sb
-HA
D(n
kat/
mg
pro
tein
)2·8
30·7
52·7
70·7
32·4
31·0
02·7
00·4
72·6
50·4
82·9
51·2
0N
SN
SN
ST
BA
RS
(nm
ol/g
wet
weig
ht)
85·5
26
·276
·926
·3137
82
118
66
106
57
150
74
NS
,0·0
5N
S–
SH
gro
up
(nm
ol/m
gpro
tein
)25·0
3·2
23
·23·3
22
·33·7
24·8
2·3
24
·33·3
23
·12·2
NS
NS
NS
GS
Hto
tal(n
mol/g
wet
weig
ht)
654
95
665
75
594
108
530
61
553
77
561
58
,0·0
01
NS
NS
Cata
lase
(U/m
gpro
tein
)†14·9
2·8
15
·41·4
14
·42·6
15
·7a
3·5
15·1
a2·4
19
·5b
4·5
,0·0
5N
S,
0·0
5S
OD
(U/m
gpro
tein
)†5·2
60·5
25·1
60·3
54·8
50·7
15·2
10·4
35·0
40·4
05·0
30·7
8N
SN
SN
SM
n-S
OD
(U/m
gpro
tein
)†0·9
17
0·1
92
0·9
44
0·2
20
0·7
67
0·2
12
0·8
77
0·2
16
0·8
20
0·1
96
0·8
35
0·2
12
NS
NS
NS
GP
x(U
/mg
pro
tein
)†0·6
53
0·2
10
0·6
61
0·1
78
0·4
70
0·1
40
0·5
13
0·1
50
0·5
77
0·1
28
0·5
48
0·1
56
NS
NS
NS
b-H
AD
,b
-hydro
xyacyl-C
oA
dehydro
genase;
TB
AR
S,
thio
barb
ituric
acid
-reactive
substa
nces;
GS
H,
reduced
glu
tath
ione;
SO
D,
supero
xid
edis
muta
se;
GP
x,
glu
tath
ione
pero
xid
ase.
a,b
Mean
valu
es
with
unlik
esupers
cript
lett
ers
were
sig
nifi
cantly
diffe
rent
(P,
0·0
5).
*A
two-w
ay
AN
OV
Aw
as
used,
follo
wed
by
Fis
her’s
multip
lecom
parison
test.
When
there
was
an
inte
raction,
aone-w
ay
AN
OV
Afo
llow
ed
by
Fis
her’s
multip
lecom
parison
test
was
conducte
don
the
5%
die
tgro
ups
and
on
the
30
%die
tgro
ups
dis
tinctly.
†T
oconvert
enzym
eactivity
inunits
tonkata
l,m
ultip
lyby
16·6
7.
C. Feillet-Coudray et al.1798
British
Journal
ofNutrition
Dow
nloaded from https://w
ww
.cambridge.org/core . IP address: 65.21.228.167 , on 24 N
ov 2021 at 03:04:23 , subject to the Cambridge Core term
s of use, available at https://ww
w.cam
bridge.org/core/terms . https://doi.org/10.1017/S0007114513001311
Table 5. Total fatty acid (FA) composition of the muscle homogenates (mg FA/g tissue)*
(Mean values and standard deviations, n 8)
5 % Fat diets 30 % Fat diets
Mixed diet Lard diet Fish-oil diet Mixed diet Lard diet Fish-oil diet P†
Mean SD Mean SD Mean SD Mean SD Mean SD Mean SD Quantity Quality Interaction
Total lipids 28·9 9·4 31·1 12·5 22·1 4·9 28·5 6·9 29·2 12·2 24·0 4·8 NS NS NSSFA 11·5 2·9 12·9 5·4 8·88 1·87 9·56 2·05 12·8 4·9 9·18 1·95 NS ,0·05 NS
14 : 0 0·601 0·253 0·73 0·505 0·374 0·148 0·286 0·063 0·516 0·304 0·316 0·155 ,0·01 ,0·01 NS16 : 0 7·63 2·05 8·9 3·82 6·1 1·38 5·86 1·25 7·89 3·17 12·6 13·6 NS NS NS18 : 0 2·88 0·83 3·06 0·89 2·32 0·44 3·37 0·89 4·18 1·43 3·11 0·73 ,0·01 ,0·01 NS
MUFA 9·52 4·43 10·4 6·4 6·06 2·39 8·62 2·71 8·15 5·05 5·85 1·93 NS NS NS16 : 1n-9 0·145 0·043 0·146 0·102 0·13 0·056 0·138 0·059 0·128 0·076 0·231 0·3 NS NS NS16 : 1n-7 1·83 1·04 2·33 2·06 1·27 0·61 0·364 0·114 0·589 0·394 1·38 2·26 ,0·05 NS NS18 : 1n-9 6·32 3·07 6·54 3·77 3·73 1·56 7·38 2·43 6·57 4·19 4·74 1·71 NS ,0·05 NS18 : 1n-7 1·18 0·39 1·33 0·63 0·898 0·216 0·684 0·159 0·808 0·411 0·585 0·099 ,0·001 NS NS
PUFA 7·98 2·7 7·77 2·18 7·11 1·00 10·3 2·4 8·25 3·47 8·98 2·07 ,0·05 NS NS18 : 2n-6 3·86 1·31 3·39 0·99 2·56 0·41 5·1 1·5 3·83 1·75 3·8 0·84 ,0·01 ,0·05 NS20 : 3n-6 0·128 0·033 0·149 0·118 0·095 0·044 0·133 0·103 0·072 0·053 0·053 0·046 NS NS NS20 : 4n-6 1·99 0·38 2·01 0·38 1·05 0·52 2·41 0·62 2·12 1·0 1·11 0·19 NS ,0·001 NS20 : 5n-3 0·040 0·038 0·032 0·031 0·212 0·077 0·067 0·047 0·033 0·035 0·216 0·035 NS ,0·001 NS22 : 5n-3 0·281 0·085 0·269 0·086 0·303 0·059 0·324 0·107 0·367 0·184 0·236 0·061 NS NS NS22 : 6n-3 1·46 0·81 1·54 0·82 2·73 0·55 1·97 0·55 1·53 0·83 3·35 1·51 NS ,0·001 NSn-6 PUFA 6·07 1·76 5·76 1·34 3·78 0·91 7·82 1·96 6·14 2·68 5·00 0·93 ,0·05 ,0·001 NSn-3 PUFA 1·87 0·9 1·95 0·96 3·29 0·59 2·48 0·63 2·09 1·07 3·96 1·44 NS ,0·001 NS
D9-Desaturase index‡ 0·228 0·092 0·227 0·126 0·199 0·056 0·062 0·011 0·069 0·034 0·063 0·018 ,0·0001 NS NSD6-Desaturase index§ 0·035 0·009 0·053 0·024 0·037 0·014 0·03 0·034 0·028 0·012 0·023 0·005 ,0·05 NS NSD5-Desaturase indexk 16·0 3·5 14·1 4·2 11·3 2·1 24·0 8·7 24·2 7·1 14·1 1·4 ,0·001 ,0·002 NSUI 126 14 128 27 162 21 154 14 129 34 170 34 NS ,0·001 NSPI 66·9 12·2 69·9 26·4 102·7 20·3 87·4 12·9 74·1 32·1 108·7 31·3 NS ,0·001 NS
UI, unsaturation index; PI, peroxidation index.* The results of the major FA (.0·1 %) are expressed as mg FA/g skeletal muscle.† A two-way ANOVA was used, followed by Fisher’s multiple comparison test. When there was an interaction, a one-way ANOVA followed by Fisher’s multiple comparison test was conducted on the 5 % diet groups and the
30 % diet groups distinctly.‡D9-Desaturase index ¼ 16 : 1n-7/16 : 0.§D6-Desaturase index ¼ 20 : 3n-6/18 : 2n-6. Because 18 : 3n-6 quantification was not possible in many muscle samples, we applied the 20 : 3n-6/18 : 2n-6 ratio to assess the D6-desaturase index according to Warensjo et al.(22).kD5-Desaturase index ¼ 20 : 4n-6/20 : 3n-6.
Die
tarylip
idpatte
rns
and
lipid
metab
olism
1799
British Journal of NutritionDownloaded from https://www.cambridge.org/core. IP address: 65.21.228.167, on 24 Nov 2021 at 03:04:23, subject to the Cambridge Core terms of use, available at https://www.cambridge.org/core/terms. https://doi.org/10.1017/S0007114513001311
decreased in the liver of rats fed the 30 % lipid diets, except in
the liver of those fed the 30 % lard diet. Both b-HAD activity
and the protein expression of FATP4 were increased with
the lard 30 % lipid diet, while they were decreased or
tended to decrease with the other two 30 % lipid diets. It has
been proposed that FATP4 is important as a lipid transport
protein directing lipids for lipid oxidation in muscle(32), and
the present results suggest that FATP4 may also be important
to direct FA towards b-oxidation in the liver. A deregulation
of mitochondrial function may be implicated in liver fat
accumulation observed with the 30 % lipid diets, where mito-
chondrial b-oxidation (measured by the gene expression of
MCAD and b-HAD activity) was decreased. The intake of
the 30 % lipid diets led to a higher supply with energy sub-
strates and this may be responsible for the decrease in
b-HAD activity with the 30 % lipid diets, except with the lard
diet where b-oxidation remained high, probably to allow a
high-rate oxidation of the saturated ‘toxic’ FA from this diet.
Oxidative stress, an important component of NAFLD, plays
a role in the progression of liver steatosis to non-alcoholic
steatohepatitis. Interestingly, lipid peroxidation and protein
oxidation were increased in rats fed the 30 % lipid diets.
These results may reflect an increase in mitochondrial reactive
oxygen species production in the liver of rats with hepatic
steatosis, despite lower mitochondriogenesis and b-oxidation
activities. Moreover, the other important result of the present
study is that lipid peroxidation was highly increased with
the fish-oil diet. Within the 5 % lipid diets, the liver TBARS
level was increased by 22 % with the fish-oil diet compared
with the mixed diet, whereas within the 30 % lipid diets, the
liver TBARS level was increased by 104 % with the fish-oil
diet compared with the mixed diet. It is known that unsatu-
rated FA are preferable substrates for lipid peroxidation,
and, in fact, liver TBARS levels were positively correlated
with the liver n-3:PUFA ratio and the PI. In a previous work,
it has also been reported that a high intake of DHA increased,
in a dose-dependent way, liver lipid peroxidation in rabbits,
where the highest tested dose was 1 % DHA of energy
intake(33). Moreover, oxidative stress and mitochondrial dys-
function may lead to large hepatocyte injury, inflammation
and fibrosis(2,3). Therefore, the fatty liver from the rats fed
the fish-oil diet may be prone to the transformation of liver
steatosis into non-alcoholic steatohepatitis.
As expected, muscle FA content partly mirrored the quality
of the FA in the studied diets, with more SFA in the muscle of
rats fed the lard diet and more n-3 FA in the muscle of rats fed
the fish-oil diet. In line with this observation, previous studies
have also reported that the FA composition of muscle lipids is
influenced by the type of FA in the administered diet(34,35).
However, the long-term intake of the 30 % lipid diets did not
modify the muscle TAG content in the present study, but
had an impact on the desaturase indices. Although it is
known that PUFA decrease and SFA increase the expression
of SCD1 in the liver(36), there are few data describing SCD1
regulation by dietary FA in skeletal muscle(34). In a previous
work(37), we observed an elevated SCD1 index to be associ-
ated with increased fat accumulation in skeletal muscle. In
this work, the SCD1 index, calculated as the D9-desaturase
index, was sharply decreased with the 30 % lipid diets.
While the activity of SCD1 was not modified by the quality
of the diet, the protein expression of SCD1 was almost
decreased with the fish-oil diet. The D6-desaturase index
was also decreased in rats fed the 30 % lipid diets compared
with those fed the 5 % lipid diets. As in the liver, the muscle
D5-desaturase index was decreased with the n-3 diet, showing
a systemic effect of the n-3 diet on different tissues.
In skeletal muscle, PGC-1a is known to stimulate mitochon-
drial biogenesis via the co-activation of nuclear respiratory
factor 1, to regulate genes involved in oxidative phosphoryl-
ation and to co-activate the PPAR, thereby regulating the
pathways of lipid metabolism(29). We observed that the protein
expressions of both PGC-1a and m-CPT1 were almost signifi-
cantly increased with the 30 % lipid diets, with both PGC-1a
and m-CPT1 being regulated by PPAR-d in the muscle(38).
3·5
4·0
1·6
1·8
2·5
3·02·25
2·5
1·5
2·0
2·5
3·0
0·6
0·8
1·0
1·2
1·4
1·0
1·5
2·0
0·75
1·0
1·25
1·5
1·75
2·0
0·0
0·5
1·0
Rel
ativ
e FA
T/C
D36
pro
tein
exp
ress
ion
Rel
ativ
e m
-CP
T1
pro
tein
exp
ress
ion
0·0
0·2
0·4
Rel
ativ
e S
CD
1 p
rote
in e
xpre
ssio
n
0·0
0·5
5 % lipid 30 % lipid5 % lipid 30 % lipid5 % lipid 30 % lipid5 % lipid 30 % lipid
Rel
ativ
e P
GC
-1α
pro
tein
exp
ress
ion
0·0
0·25
0·5
Fig. 4. Muscle protein expression of fatty acid translocase/cluster of differentiation 36 (FAT/CD36), muscle carnitine palmitoyltransferase 1 (m-CPT1), stearoyl-
CoA desaturase 1 (SCD1) and PPARg co-activator 1a (PGC-1a). Western blot was performed on protein extracts from the muscle of rats, using anti-FAT/CD36,
anti-m-CPT1, anti-SCD1 and anti-PGC-1a antibodies. Anti-b-actin antibody was used to confirm equal loading. Western blot was quantified using ImageJ software
(NIH). Values are means (n 6–8), with standard deviations represented by vertical bars. There was a significant effect of lipid quantity on FAT/CD36 protein
expression (P , 0·05) or almost significant effect on m-CPT1 (P ¼ 0·051) and PGC-1a protein expression (P ¼ 0·053). There was a nearly significant effect of
lipid quality on SCD1 protein expression (P ¼ 0·059) (fish oil v. mixed and lard diets. , Basal diet; , lard-rich diet; , fish oil-rich diet.
C. Feillet-Coudray et al.1800
British
Journal
ofNutrition
Dow
nloaded from https://w
ww
.cambridge.org/core . IP address: 65.21.228.167 , on 24 N
ov 2021 at 03:04:23 , subject to the Cambridge Core term
s of use, available at https://ww
w.cam
bridge.org/core/terms . https://doi.org/10.1017/S0007114513001311
Similarly, increased mitochondriogenesis had been previously
reported with a high-fat diet(39). In contrast, in a previous
work(37), we observed that the gene expression of PGC-1a
was down-regulated by a high-fat/high-sucrose diet, and
some authors have demonstrated that palmitic acid or high
SFA down-regulate the mRNA expression of PGC-1a(40). In
parallel to the increase in the protein expression of PGC-1a
with the 30 % lipid diets, we observed an increase in the pro-
tein expression of FAT/CD36. However, the protein or gene
expressions of other transporters such as FATP4 and FABP3
were not modified. It has been demonstrated that the promo-
ter of FAT/CD36 has a PPAR response element sequence(41);
therefore, an increased protein expression of PGC-1a could
result in an enhanced protein expression of FAT/CD36, as
has been reported already, while the gene or protein
expressions of other FA transporters were not modified(42).
The present results are in favour of an increased uptake of
FA with the 30 % lipid diets and in favour of an activation of
muscle oxidative metabolism that prevented the accumulation
of lipids in the muscle.
We observed that the AUC of the OGTT was positively cor-
related with the muscle SFA levels and negatively correlated
with the muscle n-3:PUFA ratio. This observation was not sur-
prising as several studies in animals have demonstrated a
differential impairment in the degree of insulin sensitivity,
after feeding with a saturated fat diet or n-6 or n-3 polyunsa-
turated fat diets(43). In the present study, only the rats fed the
lard 30 % lipid diet were insulin resistant. So, it was probably
the modification of the FA composition in the muscle cell
membrane that led to IR rather than the modification of the
lipid content in the muscle.
Lipid peroxidation and protein oxidation were not modified
in the muscle of rats fed the 30 % lipid diets, while total GSH
was decreased and catalase activity was increased. These
results, associated with the probable activation of muscle
oxidative metabolism, might reflect increased mitochondrial
reactive oxygen species production that was counteracted by
the antioxidant systems. Moreover, muscle TBARS levels
were positively correlated with the muscle n-3:PUFA ratio
and the peroxidisation index. This means that the muscle
from the rats fed the fish-oil diet, as in the case of the liver,
may be more prone to oxidative injury. However, with
the fish-oil 30 % lipid diet, catalase activity was increased,
once again probably to protect the cells against H2O2 and
the oxidation of membrane phospholipids.
In conclusion, we examined in the present study the impact
of fat quantity and quality on liver and muscle metabolism in
an integrated fashion. The present results demonstrated that
high lipid intake differently influenced the rat liver and
muscle lipid utilisation and their FA composition. In the
liver, lipogenesis was markedly reduced with the 30 % lipid
diets to prevent liver lipid accumulation, whereas mitochon-
driogenesis was decreased, maybe to limit mitochondrial
reactive oxygen species overproduction, and finally led to
liver lipid accumulation and peroxidation. On the contrary,
the muscle uptake of FA from the 30 % lipid diets was
increased, but the high activation of muscle oxidative metab-
olism tended to prevent the accumulation of lipids in the
muscle. The lard diet led to the development of IR, without
an increase in the muscle lipid content, pointing out that the
lipid quality (such as ceramides) and the FA composition of
the muscle modulated insulin sensitivity rather than the tissue
lipid accumulation itself. The fish-oil diet failed to prevent
hepatic steatosis and the high level of PUFA in this diet made
the tissues more prone to oxidation, and thus there is a risk
for the transformation of liver steatosis into non-alcoholic stea-
tohepatitis. These results clearly show that the dietary intake of
SFA should be reduced, and precaution should be taken when
advising a high unphysiological intake of PUFA-rich products
such as fish oils.
Supplementary material
To view supplementary material for this article, please visit
http://dx.doi.org/10.1017/S0007114513001311
Acknowledgements
The authors acknowledge Drs Alain Grynberg and Delphine
Rousseau (INRA, Paris) for their assistance, whose advices
were important for diet conception and preparation. The
authors also thank the staff of the animal facilities for animal
use. The present study received no specific grant from any
funding agency in the public, commercial or not-for-profit
sectors.
C. F.-C. and C. C. designed the research; C. F.-C., M. A., G. F.,
B. B. and J. R. conducted the research, C. F.-C., M. A., F. C., J.
P. C. and C. C. analysed the data; C. F.-C. wrote the paper and
had responsibility for the final content. All the authors read
and approved the final manuscript.
The authors declare that there is no conflict of interest.
References
1. Misra A, Singhal N & Khurana L (2010) Obesity, the meta-bolic syndrome, and type 2 diabetes in developing countries:role of dietary fats and oils. J Am Coll Nutr 29, 289S–301S.
2. Cave M, Deaciuc I, Mendez C, et al. (2007) Nonalcoholicfatty liver disease: predisposing factors and the role of nutri-tion. J Nutr Biochem 18, 184–195.
3. Mantena SK, King AL, Andringa KK, et al. (2008) Mitochon-drial dysfunction and oxidative stress in the pathogenesis ofalcohol- and obesity-induced fatty liver diseases. Free RadicBiol Med 44, 1259–1272.
4. Shapiro H, Tehilla M, Attal-Singer J, et al. (2011) Thetherapeutic potential of long-chain omega-3 fatty acids innonalcoholic fatty liver disease. Clin Nutr 30, 6–19.
5. Abbott SK, Else PL, Atkins TA, et al. (2012) Fatty acidcomposition of membrane bilayers: importance of dietpolyunsaturated fat balance. Biochim Biophys Acta 1818,1309–1317.
6. Kraegen EW, James DE, Storlien LH, et al. (1986) In vivoinsulin resistance in individual peripheral tissues of thehigh fat fed rat: assessment by euglycaemic clamp plus deox-yglucose administration. Diabetologia 29, 192–198.
7. Manco M, Mingrone G, Greco AV, et al. (2000) Insulin resist-ance directly correlates with increased saturated fatty acids inskeletal muscle triglycerides. Metabolism 49, 220–224.
Dietary lipid patterns and lipid metabolism 1801
British
Journal
ofNutrition
Dow
nloaded from https://w
ww
.cambridge.org/core . IP address: 65.21.228.167 , on 24 N
ov 2021 at 03:04:23 , subject to the Cambridge Core term
s of use, available at https://ww
w.cam
bridge.org/core/terms . https://doi.org/10.1017/S0007114513001311
8. Poudyal H, Panchal SK, Diwan V, et al. (2011) Omega-3 fattyacids and metabolic syndrome: effects and emerging mech-anisms of action. Prog Lipid Res 50, 372–387.
9. Smith DA (2012) Omega-3 polyunsaturated fatty acidsupplements do not reduce major cardiovascular events inadults. Ann Intern Med 157, JC6–5.
10. Hill JO, Peters JC, Lin D, et al. (1993) Lipid accumulation andbody fat distribution is influenced by type of dietary fat fedto rats. Int J Obes Relat Metab Disord 17, 223–236.
11. Buettner R, Parhofer KG, Woenckhaus M, et al. (2006) Defin-ing high-fat-diet rat models: metabolic and molecular effectsof different fat types. J Mol Endocrinol 36, 485–501.
12. Parker HM, Johnson NA, Burdon CA, et al. (2012) Omega-3supplementation and non-alcoholic fatty liver disease: a sys-tematic review and meta-analysis. J Hepatol 56, 944–951.
13. Gomez-Perez Y, Amengual-Cladera E, Catala-Niell A, et al.(2008) Gender dimorphism in high-fat-diet-induced insulinresistance in skeletal muscle of aged rats. Cell Physiol Bio-chem 22, 539–548.
14. Aoun M, Fouret G, Michel F, et al. (2012) Dietary fatty acidsmodulate liver mitochondrial cardiolipin content and its fattyacid composition in rats with non alcoholic fatty liver dis-ease. J Bioenerg Biomembr 44, 439–452.
15. Bradford MM (1976) A rapid and sensitive method for thequantitation of microgram quantities of protein utilizing theprinciple of protein-dye binding. Anal Biochem 72,248–254.
16. Yang SY, He XY & Schulz H (2005) 3-Hydroxyacyl-CoAdehydrogenase and short chain 3-hydroxyacyl-CoA dehy-drogenase in human health and disease. FEBS J 272,4874–4883.
17. Feillet-Coudray C, Sutra T, Fouret G, et al. (2009) Oxidativestress in rats fed a high-fat high-sucrose diet and preventiveeffect of polyphenols: involvement of mitochondrial andNAD(P)H oxidase systems. Free Radic Biol Med 46,624–632.
18. Aoun M, Michel F, Fouret G, et al. (2010) A polyphenolextract modifies quantity but not quality of liver fatty acidcontent in high-fat-high-sucrose diet-fed rats: possible impli-cation of the sirtuin pathway. Br J Nutr 104, 1760–1770.
19. Folch J, Lees M & Sloane Stanley GH (1957) A simple methodfor the isolation and purification of total lipides from animaltissues. J Biol Chem 226, 497–509.
20. Bartlett GR (1959) Phosphorus assay in column chromatog-raphy. J Biol Chem 234, 466–468.
21. Warensjo E, Ohrvall M & Vessby B (2006) Fatty acid compo-sition and estimated desaturase activities are associated withobesity and lifestyle variables in men and women. NutrMetab Cardiovasc Dis 16, 128–136.
22. Warensjo E, Riserus U, Gustafsson IB, et al. (2008) Effects ofsaturated and unsaturated fatty acids on estimated desaturaseactivities during a controlled dietary intervention. Nutr MetabCardiovasc Dis 18, 683–690.
23. Pietrangelo A, Grandi R, Tripodi A, et al. (1990) Lipid com-position and fluidity of liver mitochondria, microsomes andplasma membrane of rats with chronic dietary iron overload.Biochem Pharmacol 39, 123–128.
24. Hu ML, Frankel EN & Leibovitz BE (1989) Effect of dietarylipids and vitamin E on in vitro lipid peroxidation in ratliver and kidney homogenates. J Nutr 119, 1574–1582.
25. Lamaziere A, Wolf C & Barbe U (2013) Lipidomics of hepaticlipogenesis inhibition by omega 3 fatty acids. ProstaglandinsLeukot Essent Fatty Acids 88, 149–154.
26. Dobrzyn A & Ntambi JM (2005) The role of stearoyl-CoAdesaturase in the control of metabolism. ProstaglandinsLeukot Essent Fatty Acids 73, 35–41.
27. Nickerson JG, Alkhateeb H, Benton CR, et al. (2009) Greatertransport efficiencies of the membrane fatty acid transportersFAT/CD36 and FATP4 compared with FABPpm and FATP1and differential effects on fatty acid esterification and oxi-dation in rat skeletal muscle. J Biol Chem 284, 16522–16530.
28. Jump DB & Clarke SD (1999) Regulation of gene expressionby dietary fat. Annu Rev Nutr 19, 63–90.
29. Lin J, Handschin C & Spiegelman BM (2005) Metabolic con-trol through the PGC-1 family of transcription coactivators.Cell Metab 1, 361–370.
30. Lehman JJ, Barger PM, Kovacs A, et al. (2000) Peroxisomeproliferator-activated receptor gamma coactivator-1 pro-motes cardiac mitochondrial biogenesis. J Clin Invest 106,847–856.
31. Kerner J & Hoppel C (2000) Fatty acid import into mitochon-dria. Biochim Biophys Acta 1486, 1–17.
32. Jeppesen J, Jordy AB, Sjoberg KA, et al. (2012) Enhancedfatty acid oxidation and FATP4 protein expression afterendurance exercise training in human skeletal muscle.PLOS ONE 7, e29391.
33. Gladine C, Roy NC, Rigaudiere JP, et al. (2012) Increasingintake of long-chain n-3 PUFA enhances lipoperoxidationand modulates hepatic gene expression in a dose-dependentmanner. Br J Nutr 107, 1254–1273.
34. Lee JS, Pinnamaneni SK, Eo SJ, et al. (2006) Saturated, butnot n-6 polyunsaturated, fatty acids induce insulin resist-ance: role of intramuscular accumulation of lipid metab-olites. J Appl Physiol 100, 1467–1474.
35. Abbott SK, Else PL & Hulbert AJ (2010) Membrane fatty acidcomposition of rat skeletal muscle is most responsive to thebalance of dietary n-3 and n-6 PUFA. Br J Nutr 103,522–529.
36. Ntambi JM (1999) Regulation of stearoyl-CoA desaturase bypolyunsaturated fatty acids and cholesterol. J Lipid Res 40,549–558.
37. Aoun M, Michel F, Fouret G, et al. (2011) A grapepolyphenol extract modulates muscle membrane fatty acidcomposition and lipid metabolism in high-fat–high-sucrosediet-fed rats. Br J Nutr 106, 491–501.
38. Dressel U, Allen TL, Pippal JB, et al. (2003) The peroxisomeproliferator-activated receptor beta/delta agonist,GW501516, regulates the expression of genes involved inlipid catabolism and energy uncoupling in skeletal musclecells. Mol Endocrinol 17, 2477–2493.
39. Gomez-Perez Y, Capllonch-Amer G, Gianotti M, et al. (2012)Long-term high-fat-diet feeding induces skeletal musclemitochondrial biogenesis in rats in a sex-dependent andmuscle-type specific manner. Nutr Metab (Lond) 9, 15.
40. Coll T, Jove M, Rodrıguez-Calvo R, et al. (2006) Palmitate-mediated downregulation of peroxisome proliferator-activated receptor-gamma coactivator-1alpha in skeletalmuscle cells involves MEK1/2 and nuclear factor-kappaBactivation. Diabetes 55, 2779–2787.
41. Teboul L, Febbraio M, Gaillard D, et al. (2001) Structuraland functional characterization of the mouse fatty acid trans-locase promoter: activation during adipose differentiation.Biochem J 360, 305–312.
42. Choi CS, Befroy DE, Codella R, et al. (2008) Paradoxicaleffects of increased expression of PGC-1alpha on musclemitochondrial function and insulin-stimulated muscle glu-cose metabolism. Proc Natl Acad Sci U S A 105,19926–19931.
43. Galgani JE, Uauy RD, Aguirre CA, et al. (2008) Effect of thedietary fat quality on insulin sensitivity. Br J Nutr 100,471–479.
C. Feillet-Coudray et al.1802
British
Journal
ofNutrition
Dow
nloaded from https://w
ww
.cambridge.org/core . IP address: 65.21.228.167 , on 24 N
ov 2021 at 03:04:23 , subject to the Cambridge Core term
s of use, available at https://ww
w.cam
bridge.org/core/terms . https://doi.org/10.1017/S0007114513001311


![Seismic low-frequency effects from oil-saturated reservoir ... · [2] G.M.Goloshubin, and V.A.Korneev, 2000, Seismic low-frequency effects from fluid-saturated reservoir: Expanded](https://img.pdfslide.net/doc/110x75/5f09860b7e708231d4273bc4/seismic-low-frequency-effects-from-oil-saturated-reservoir-2-gmgoloshubin.jpg)