Embed Size (px)
Citation preview

Effects of micronutrients micnobit and salt fertilization on lettuce
Blom-Zandstra, M., De Visser, W., Van der Werf, A.K., Van der Lee, M.K., Vos, C.H., Jongschaap, R.E.E., C. Dimkpa, and Bindraban, P.S.
VFRC Report 2016/1

i Blom-Zandstra et al., VFRC Report 2016/x.
Effects of micronutrients micnobit and salt fertilization on lettuce
Blom-Zandstra, M. 1, De Visser, W. 1, Van der Werf, A.K. 1, Van der Lee2, M.K., Vos, C.H. 1, .Jongschaap, R.E.E. 1, Dimkpa, C.3 and Bindraban, P.S. 3 1 Plant Research International, Wageningen University and Research Centre, P.O. Box 616 6700 AP Wageningen The Netherlands T. +31 317 480493 E. [email protected] 2 Rikilt, Wageningen University and Research Centre, P.O. Box 230 6700 AE Wageningen The Netherlands 3 Virtual Fertilizer Research Center, 1050 Connecticut Avenue NW Washington D.C. 20036 USA

ii Blom-Zandstra et al., VFRC Report 2016/x.
VFRC Report 2016/x Washington, D.C., USA © 2016, Washington, D.C., USA All rights reserved. Reproduction and dissemination for educational or non-commercial purposes are permitted without prior written permission provided the source is fully acknowledged and a copy of any reproduction is submitted to the VFRC. Reproduction of materials for resale or other commercial purposes is prohibited without prior written permission from the VFRC. Applications for such permission should be addressed to: Executive Director Virtual Fertilizer Research Center 1050 Connecticut Avenue NW, Suite 500 Washington, D.C. 20036 USA E-mail: [email protected] This publication is created with utmost care. However, the author(s) and/or publisher(s) and/or the VFRC organization cannot be held liable for any damage caused by the use of this publication or any content therein, in whatever form, whether caused by possible errors or faults, nor for any consequences thereof. Additional information on VFRC can be accessed through http://www.vfrc.org. Citation M. Blom-Zandstra, W. de Visser, A. van der Werf, M.K. van der Lee, C.H. de Vos, R.E.E. Jongschaap, C. Dimkpa and P.S. Bindraban, 2016.
Effects of micronutrients micnobit and salt fertilization on lettuce. VFRC Report 2016/x. Virtual Fertilizer Research Center, Washington, D.C. 38 pp.; 6 tables; 19 figs.; 52 ref.
Virtual Fertilizer Research Center

iii Blom-Zandstra et al., VFRC Report 2016/x.
Summary
Plants can absorb nano- and micro-size particles containing nutrients, opening the possibility for instantaneous uptake of nutrients supplied through roots or leaves. Here, we studied the uptake by lettuce (Lactuca sativa L.) of particulate nutrients from a micnobit (mixture of nanoparticles producing different nano and micro-scale sizes) formulation composed of ZnO, CuO, Fe3O4, MnO, and B2O3 used as fertilizers, in comparison to a similar mixture of their ionic equivalents from salts of Zn, Cu, Fe, Mn and boric acid at levels optimal for growth, yield, metabolism and nutritional quality attributes in food crops. In the case of Zn, the effect of a double dose compared to the basic fertilization was also studied to evaluate the possibility of increasing Zn levels in vegetable crops, as a potential strategy for alleviating Zn deficiency in human/animal diets. A greenhouse pot experiment was conducted using a sandy soil (pH 7.1) poor in most nutrients, including micronutrients but rich in calcium, and with very low content of organic matter to study the effects of micronutrient fertilization on lettuce. For application of the micronutrients, four fertilizer treatments were used: i) traditional (ionic) fertilizer; ii) micnobit particle coated seeds, iii) micnobit foliar application (spraying treatment), and iv) micnobit soil application. The lettuce plants were grown for 73 days and harvested periodically to study fresh and dry weight production and leaf greenness by SPAD measurements over time. Shoot or root materials from the final harvest was used to determine contents of micronutriënts, leaf chlorophyll and biomolecules (vitamins, flavonoids, phenolics, and antioxidants). Values from SPAD measurements significantly differed between the harvests and showed an increase with time up to 59 days after sowing. Differences between the treatments were less distinct, but showed the highest values between the Priming and Control treatments. Chlorophyll contents did not significantly differ between the treatments. The lettuce plants showed S-shaped growth under all treatments, although the foliar applications, both with micnobits and ions, caused necrosis at the leaf edges in the long run. Also, Foliar application with micnobits caused deposition and showed black spots on the leaves that could not be removed by rinsing methods described in the literature. Growth analysis, i.e. production of fresh weight, dry weight and root-total weight ratio over time, showed that for both shoot and root, the Control treatment resulted in the best growth. Priming of seeds resulted in similar growth as at the Control treatment. Addition of micronutrients to soil or leaves, both applied as ions or as micnobits, even decreased fresh weight and dry weight production of lettuce. Moreover, the shoots and roots of plants in the Control treatment also showed accumulation of micronutrients, while no micronutrients had been applied. No significant differences were found between the Foliar application and Soil treatments. Moreover, even no significant differences were found between application of micnobits or application of ions. Thus, we concluded that the soil - although very poor with a low content of micronutrients - was not lacking in the tested nutrients and the low availability of micronutrients in the soil was already sufficient for an optimal growth. The determination of micronutrient contents showed that ions and micnobits were taken up by both roots (Soil treatments) and by leaves (Foliar application). However, the amounts of micronutrients found in the leaves appeared to be higher than those described in literature for plant shoots with adequate growth. The contents of the micronutrients other than Fe varied between the treatments in both leaves and roots, suggesting excessive uptake that could have inhibited biomass production in these treatments. Foliar application with ions resulted in a higher micronutrient content than foliar application with micnobits. The fact that all treatments, whether applied to the leaves or to the soil or via priming, resulted in an accumulation of micronutrients in both shoots and roots, proved that the micronutrients had been transferred through the plants from the shoot to the roots (Foliar

iv Blom-Zandstra et al., VFRC Report 2016/x.
application) and from the roots to the shoot (Soil application). However, it could not be determined in which form, i.e. whether as ions, micnobits or metabolically processed, the micronutrients were transported through the plant. The presence of micnobits could only be detected for Fe2O3, CuO and MnO3. However, due to a high noise level in the ICP-MS sample analyses, it was not possible to quantify the content of the elements properly. Vitamin C content in leaves was highest in plants from the Control treatment, but not significant different from other treatments. No clear distinction could be made between the Soil and Foliar application, nor between treatments with ions or with micnobits. LCMS profiles of the lettuce leaves showed a relative intensity of 257 compounds present in the leaves. In the Soil and Foliar application, 80 out of the 237 metabolites (25%) had been changed significantly, although not annotated, from which 66 of them revealed a more than 2-fold difference. We conclude that this study with composite nanoparticles could not endorse the hypothesis that micnobits will be taken up more efficiently than ions, or that they will enhance growth in lettuce as reported in the literature for other crops. Furthermore, this study also clearly demonstrates the need for plant tissue testing as an important yardstick for supporting soil-based nutrient testing, prior to fertilizer recommendations.
v Blom-Zandstra et al., VFRC Report 2016/x.
Contents
Summary ...................................................................................................................................................................... iii
List of acronyms and abbreviations ........................................................................................................................... viii
1 Introduction ............................................................................................................................................................ 1
1.1 Background .................................................................................................................................................. 1
1.2 Objectives .................................................................................................................................................... 3
2 Materials and Methods .......................................................................................................................................... 4
2.1 Soil characteristics ....................................................................................................................................... 4
2.2 Plant Growth ................................................................................................................................................ 4
2.3 Fertilizer treatments ..................................................................................................................................... 4
2.3.1 Soil fertilization ........................................................................................................................................ 5
2.3.2 Foliar application ..................................................................................................................................... 6
2.3.3 Seed priming ........................................................................................................................................... 6
2.4 Plant data ..................................................................................................................................................... 6
2.4.1 Analysis of total element content of metal oxides by ICP-MS in Lettuce .............................................. 7
2.4.2 Determination of the presence of nanoparticles in lettuce leaves by spICP-MS .................................. 8
2.4.3 Chlorophyll content determination .......................................................................................................... 8
2.4.4 Metabolomics .......................................................................................................................................... 9
2.5 Data analyses .............................................................................................................................................. 9
3 Results .................................................................................................................................................................11
3.1 Growth ........................................................................................................................................................11
3.2 Uptake of micronutrients............................................................................................................................16
3.3 SPAD measurements ................................................................................................................................18
3.4 Vitamin C ...................................................................................................................................................19
3.5 LCMS profiles ............................................................................................................................................19
4 Discussion ............................................................................................................................................................22
Acknowledgements ............................................................................................................................................25
5 References ...........................................................................................................................................................26
6 Annexes ...............................................................................................................................................................30
6.1 Annex I. BLGG analysis report on the composition of the soil from Fa Grondbalans B.V., Heerhugowaard ..................................................................................................................................................30
6.2 Annex II. Application of macro- and micronutrients ..................................................................................31
6.3 Annex III. Tests ..........................................................................................................................................32
vi Blom-Zandstra et al., VFRC Report 2016/x.
6.3.1 Stability aqueous suspensions of micnobits .........................................................................................32
6.3.2 Determination field capacity pots ..........................................................................................................32
6.3.3 Micnobit residues after foliar application ..............................................................................................33
6.4 Annex IV. Plant growth ..............................................................................................................................34
6.4.1 Fresh weight production with time – Different treatments at Zn1-concentration .................................34
6.4.2 Fresh weight production with time - Different Zn concentrations .........................................................35
6.4.3 Dry weight production with time – Different treatments at Zn1-concentration .....................................36
6.4.4 Dry weight production with time - Different Zn concentrations ............................................................37
6.4.5 Root weight – Total plant weight ratio for different treatments based on fresh weight at Zn1 concentration. ......................................................................................................................................................38
6.4.6 Root weight – Total plant weight Ratio for different Zn-concentrations based on fresh weight ..........39
6.4.7 Root weight – Total plant weight Ratio for different treatments based on Dry Weight at Zn1 concentration. ......................................................................................................................................................40
6.4.8 Root weight – Total plant weight Ratio for different Zn-concentrations based on Dry Weight ...........41
vii Blom-Zandstra et al., VFRC Report 2016/x.
List of Tables
Table 2-1 Overview treatments 5 Table 3-1 Means of total shoot and root fresh and dry weight production of lettuce grown at
different treatments after log-transformation. Means followed by different letters are significantly different at p < 0.001.
15
Table 3-2 Mean contents of the different microelements in shoot and root of lettuce calculated over all harvests. Means followed by different letters are significantly different at p < 0.001.
17
Table 3-3 Mean contents of different microelements in shoot and root of lettuce calculated over all harvests. Means followed by different letters are significantly different at p < 0.001.
17
Table 3-4 Means of values from SPAD measurements at different treatments. Means followed by different letters are significantly different at p < 0.001.
18
Table 3-5 Means contents (µl/l) of chlorophyll a, b and c of the lettuce leaves at different treatments
18
List of Figures
Figure 1-1 Schematic diagram of nanoparticle transport inside watermelon plants (Wang et al., 2013c)
1
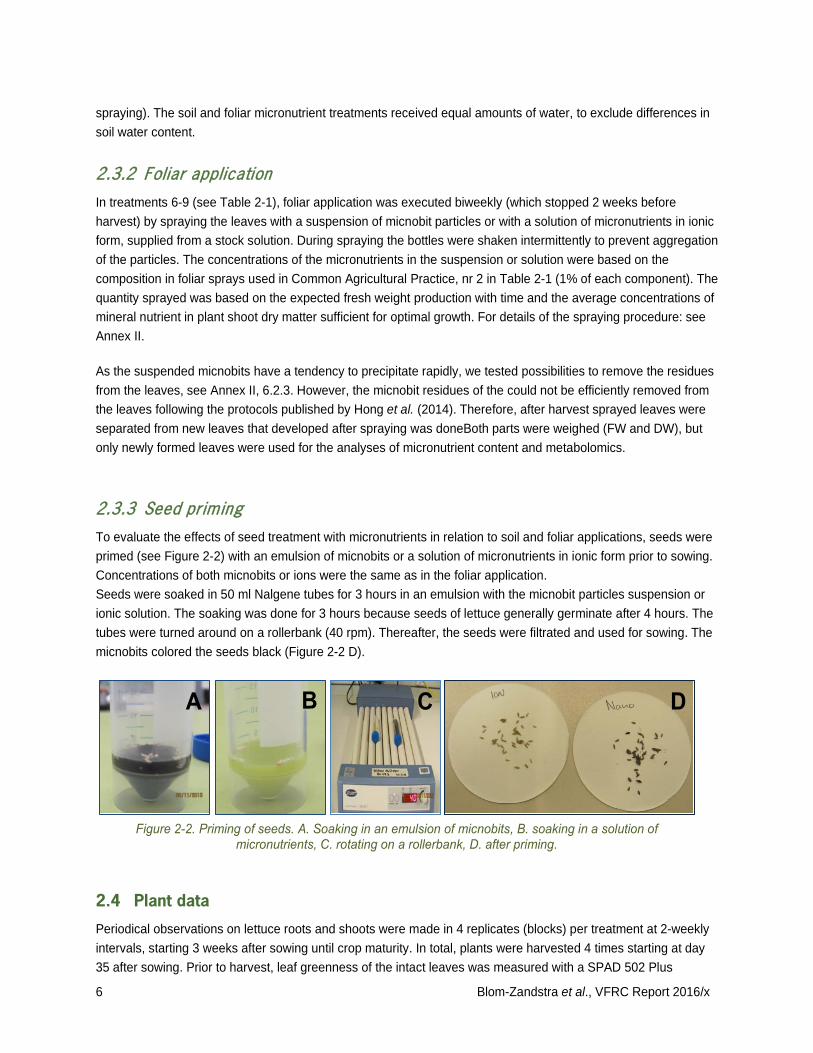
Figure 2-1 Treatments were executed per pot individually 5 Figure 2-2 Priming of seeds. A. Soaking in an emulsion of micnobits, B. soaking in a solution of
micronutrients, C. rotating on a rollerbank, D. after priming. 6
Figure 2-3 SPAD measurement 7 Figure 2-4 Leaf punches for chlorophyll determination. A. Cut from the leaves and B. stored in liquid
nitrogen. 7
Figure 2-5 Cross section of potted soil showing lettuce roots 7 Figure 3-1 Growth of lettuce plants in the greenhouse. A. 4 days after sowing, B. 31 days after
sowing; C. 35 days after sowing (ion-soil treatment); D. 36 days after sowing (nano-spray treatment); E. 49 days after sowing (nano-soil treatment); F. 63 days after sowing (nano-soil treatment); G. 63 days after sowing (ion-soil treatment) H. 70 days after sowing (ion-seed priming treatment); I. 50 days after sowing (nano-spray treatment).
11
Figure 3-2 Shoot and root fresh weight production (g) of lettuce with time. Control treatment. 12 Figure 3-3 Calculated maximum yield (Max) and time to reach 95% of this maximum at different
treatments, based on fresh weight production over time 13
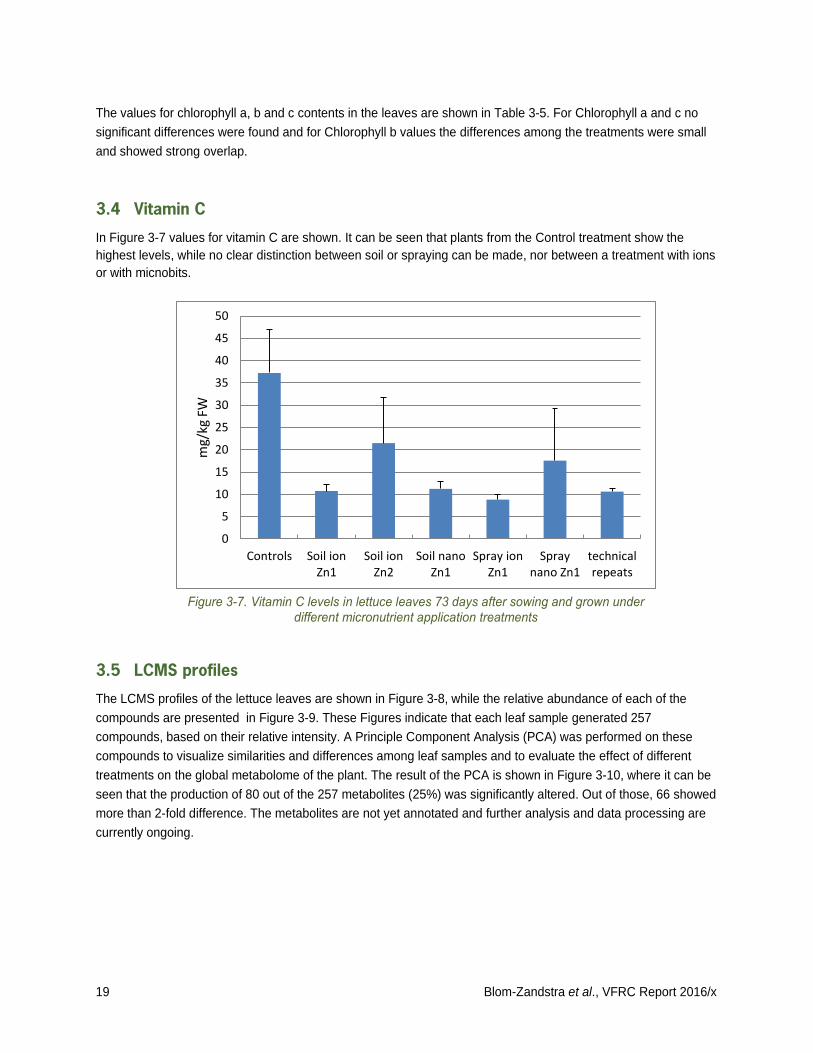
Figure 3-4 Shoot and root dry weight production (g) of lettuce with time. Control treatment. 13 Figure 3-5 Root-Total plant weight Ratio (RWR) on FW basis. Control treatment. 14 Figure 3-6 Root-Total plant weight Ratio based on DW. Control treatment. 15 Figure 3-7 Vitamin C levels in lettuce leaves 73 days after sowing and grown under different
micronutrient application treatments 19
Figure 3-8 LCMS profiles in lettuce leaves spray with micronutrients as micnobits and control 20 Figure 3-9 Unbiased LCMS profiles in lettuce leaves, original raw data and after analyses of the
number of compounds 20
Figure 3-10 Principle Component Analysis on the 257 compounds identified in lettuce leaves in relation to the different treatments during growth. P<0.05; n=4
21
Figure 6-1 Aqueous solutions of micronutrients. A. In ionic form, B. suspension of micnobits just after shaking, C. suspension of micnobits after precipitation, D. suspension of micnobits during ultra-sonication and E. taking samples from micnobit suspension just after sonication
32
Figure 6-2 Determination field capacity the pots (see text for explanation) 32 Figure 6-3 Assessing the removal of micnobit spray. A) Rinsing of an old and a freshly sprayed leaf
with KOH and B) Rinsing as a function of time 33

viii Blom-Zandstra et al., VFRC Report 2016/x.
List of acronyms and abbreviations
B boron B2O3 boron oxide B.V. Besloten Vennootschap (Dutch), meaning: Private company C carbon Ca calcium Ca(NO3)2 calcium nitrate Cl chloride Cu copper CuO copper oxide CuSO4 copper sulfate DM Dry Matter EDTA Ethylenediaminetetraacetic acid H3BO3 boric acid ICP-MS Inductively Couple Plasma Mass Spectroscopy Fe iron FeNa-EDTA EDTA ferric sodium salt Fe3O4 iron oxide G gram GC Growth Cycle K potassium Kg kilogram KH2PO4 monopotassium phosphate KNO3 potassium nitrate L litre LCMS Liquid chromatography – mass spectrometry N nitrogen Mg magnesium MgSO4 magnesium sulfate mg milligram µg microgram mmol millimol Mn manganese MnO manganese oxide MnSO4 manganese sulfate Mo molybdenum Na sodium Na2MoO4 sodium molybdate nm nanometer P phosphorus P2O5 phosphorus oxide S sulfur SPAD Soil Plant Analysis Development

ix Blom-Zandstra et al., VFRC Report 2016/x.
T Temperature VFRC Virtual Fertilizer Research Center Zn zinc ZnO zinc oxide ZnSO4 zinc sulfate
1 Blom-Zandstra et al., VFRC Report 2016/x
1 Introduction
1.1 Background
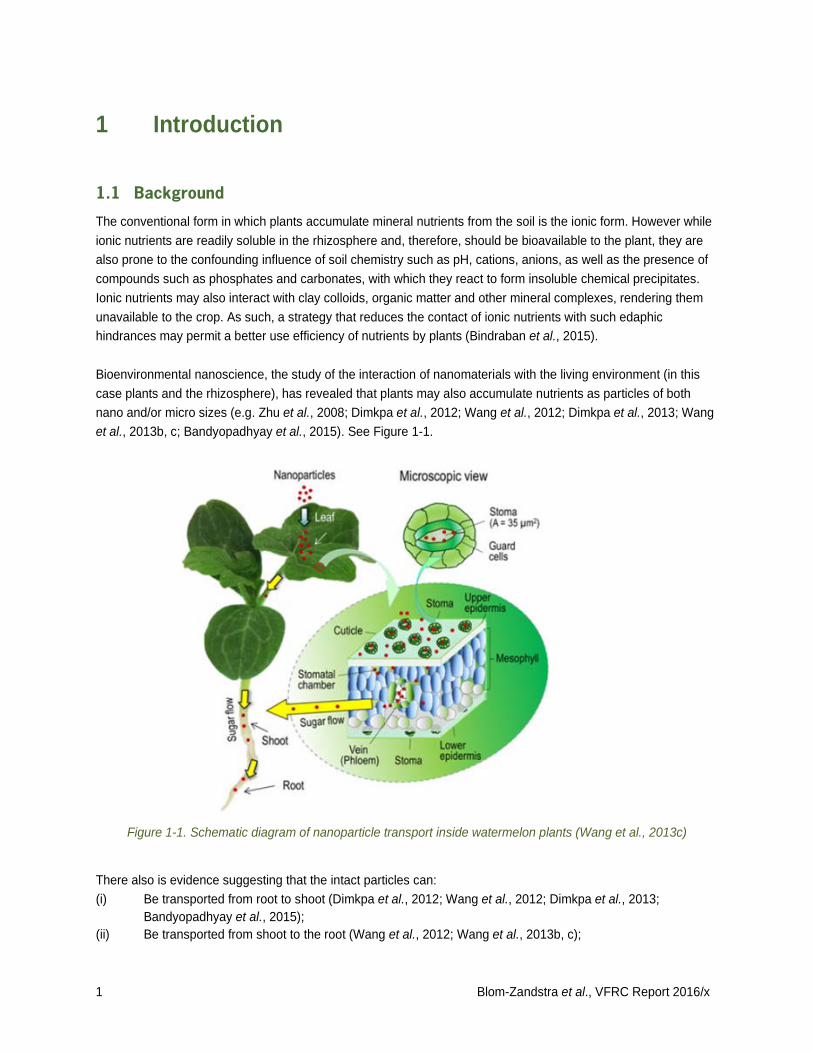
The conventional form in which plants accumulate mineral nutrients from the soil is the ionic form. However while ionic nutrients are readily soluble in the rhizosphere and, therefore, should be bioavailable to the plant, they are also prone to the confounding influence of soil chemistry such as pH, cations, anions, as well as the presence of compounds such as phosphates and carbonates, with which they react to form insoluble chemical precipitates. Ionic nutrients may also interact with clay colloids, organic matter and other mineral complexes, rendering them unavailable to the crop. As such, a strategy that reduces the contact of ionic nutrients with such edaphic hindrances may permit a better use efficiency of nutrients by plants (Bindraban et al., 2015). Bioenvironmental nanoscience, the study of the interaction of nanomaterials with the living environment (in this case plants and the rhizosphere), has revealed that plants may also accumulate nutrients as particles of both nano and/or micro sizes (e.g. Zhu et al., 2008; Dimkpa et al., 2012; Wang et al., 2012; Dimkpa et al., 2013; Wang et al., 2013b, c; Bandyopadhyay et al., 2015). See Figure 1-1.
Figure 1-1. Schematic diagram of nanoparticle transport inside watermelon plants (Wang et al., 2013c)
There also is evidence suggesting that the intact particles can: (i) Be transported from root to shoot (Dimkpa et al., 2012; Wang et al., 2012; Dimkpa et al., 2013;
Bandyopadhyay et al., 2015); (ii) Be transported from shoot to the root (Wang et al., 2012; Wang et al., 2013b, c);

2 Blom-Zandstra et al., VFRC Report 2016/x
(iii) Liberate ions in the rhizosphere, and possibly, inside the plant (Wang et al., 2012; Lv et al., 2014); and that
(iv) the released ions can form complexes with metabolic constituents of the plant ( Dimkpa et al. 2013; Wang et al., 2013 b,c; Lv et al., 2014; Bandyopadhyay et al., 2015).
As recently reviewed by Bindraban et al. (2015), different kinds of nanomaterials, including nanoforms of micronutrients such as Zn, Fe and Mn, have been demonstrated as being able to improve crop growth and/or content of these elements (Wang et al., 2013a, b, c; Siddique and Al-Whaibi 2014; Servin et al., 2015; Subbaiah 2016). In some cases, the positive effects of nanoparticles (NPs) on crop growth occur to a greater extent than the effect of the equivalent dose of the same mineral nutrient presented in ionic (salt) or bulk form (Alidoust and Isoda 2013; Pradhan et al,. 2013; Zhao et al., 2013; Kim et al., 2014; Subbaiah 2016); and when applied at the same concentration at relatively high doses, the toxicity threshold is lower with ions than with NPs (Dimkpa et al,. 2012; Pradhan et al., 2013; Kim et al., 2014). Hence, a new nomenclature, ‘micnobits’, was proposed by Dimkpa and Bindraban (2016), to describe tiny (micro and nano sized) particulate micronutrient fertilizer formulations capable of being taken up intact by plants through various avenues, including pores or via endocytosis, for the release of the active ingredients in planta. Recently, a composite of micnobits of ZnO, CuO AND B2O3 NPs was shown to mitigate drought stress in soybean via promoting growth, yield and uptake of several nutrients under drought stress that inhibited these parameters (Dimkpa et al. in press). To evaluate the effects of micnobit-type fertilizers on a vegetable plant growth and development, the current work evaluated different application techniques (seed priming, soil fertilization and foliar application) of micnobits micronutrient fertilizers were compared with traditional (ionic) micronutrient fertilizers. Additionally, in order to evaluate whether the accumulation of Zn in plants can provide adequate Zn to potentially alleviate Zn deficiency problems in some human diets, we studied the effects of a higher Zn application rate on the nutritional content of the crop produce. For this purpose, we used lettuce, a vegetable crop with a relatively short growth cycle and a direct yield component. Lettuce is eaten in most parts of the world, being the most important species of the group of leafy vegetables generally with a dry matter (DM) content of 5-6%, a harvest index (HI) of 0.90 and growth cycle (GC) of 65-75 days (Sosa et al., 2012). In addition, lettuce is known to have a low nutrient use efficiency (Greenwood et al., 1986) and nutrient recovery depends, among other agronomy factors, on the form in which it is supplied to the plant (Abu-Rayyan et al., 2004). Furthermore, dependent on form and dose, trace elements may modulate nutrition related metabolic products in the plant (e.g., Zhao et al., 2014). Accordingly, metabolomics was used to study possible effects of the micnobits on lettuce metabolic quality (Mannina et al., 2012: Pereira et al., 2014). As with soil and foliar application methods, on-farm seed priming with water is an often-used agricultural practice (Harris et al., 1999), especially in semi-arid zones. This technique has been proven to be a low cost and low risk intervention that results in direct benefits including faster emergence, more vigorous plants, earlier harvest, better yields and better drought tolerance. In the case of Zn deficiency, priming of wheat seeds with 0.3% Zn has been reported to increase mean shoot dry mass of wheat significantly and increased mean grain yield of wheat with 14% (Harris et al., 2008).In addition to increasing grain yield, priming also significantly increased grain zinc concentration by 12% (Harris et al., 2008). For the current studies, we hypothesized that: 1) Nutrients supplied as micnobit particles will be more efficiently taken up by a vegetable crop compared to
nutrients supplied as traditional ionic fertilizers, and that

3 Blom-Zandstra et al., VFRC Report 2016/x
2) Growth, development and quality of a vegetable crop would not be negatively affected, but rather be enhanced, if nutrients are provided as micnobit fertilizers at doses relevant for crop nutrition.
1.2 Objectives
In this project, we studied the uptake of intact micnobit fertilizers by plants, and the form in which they are present in planta. To this end, we compared composites of micnobits of ZnO, CuO, Fe3O4, MnO, and B2O3 in water suspension, with a solution of their ionic equivalents derived from salts of Zn, Cu, Fe, Mn and boric acid, at levels optimal for growth, yield, metabolism and nutritional quality attributes in food crops (Vijayan, 2014). In the case of Zn, we also studied the effect of a double dose than in the conventional fertilizer, to evaluate the possibility of increasing Zn levels in lettuce. The concentrations of the nutrients supplied to the lettuce crops as ions or micnobits are used at rates that will provide the amounts in the shoot as determined for lettuce (Hartz and Johnstone, 2007; US Department of Agriculture, 2015) and are relevant to their nutritional requirements.

4 Blom-Zandstra et al., VFRC Report 2016/x
2 Materials and Methods
A greenhouse pot experiment with lettuce was conducted using a nutrient-poor, calcium-rich sandy soil (pH 7.1), with very low organic matter and micronutrients contents, especially of Zn. To this end, the micronutrients were applied as follows: A. Two different forms: ionic (salts)or micnobit particles; B. The application techniques: seed treatment, soil fertilization, or foliar application; C. Two levels of Zn: Zn1 (to accumulate 50 mg/kg dry matter as natural value in lettuce (Hartz and Johnstone
(2007) and Zn2 as double dose (for calculations: see Annex II)
2.1 Soil characteristics
Soil used for the study was obtained from the Netherlands. As most soils in the Netherlands are rich in micronutrients (especially with Zn) we looked for nutrient poor sandy soils from the coastal region of the country and obtained 3 m3 from Fa Grondbalans B.V., Heerhugowaard. The soil information indicated a calcium rich soil (pH 7.1), with very low content of organic matter and micronutrients contents (see BLGG-analysis report, see Annex I).
2.2 Plant Growth
Seeds of lettuce (Lactuca sativa L cv Hilde II) were directly sown in pots for germination and placed in a greenhouse (GH) with supplemental lightning conforming with common horticultural practice in wintertime in the Netherlands. Artificial light (Philips SON-T lamps, 100 μmol m−2 s−1) was switched on when outside radiation was below 250 W m−2 during the 16 h preceding sunset. The lamps switch off when the radiation exceeded 400 W m−2. The relative humidity inside the GH was controlled by a high-pressure fogging system with a set point of 85% in order to keep humidity above 85%.
2.3 Fertilizer treatments
All chemicals were sourced commercially, from Sigma-Aldrich, Zwijndrecht, the Netherlands. The nutrients were added at rates that are assumed to provide the amounts in the shoots as determined for lettuce by Hartz and Johnstone (2007) and also included in the National Nutrient Database for Standard Reference (US Department of Agriculture, 2015). These values for nutrient levels on dry weight (DW) basis are: N 50 mg.g-1, P 6 mg.g-1, K 46 mg.g-1, Ca 6 mg.g-1, Mg 3 mg.g-1, S 3 mg.g-1, Na 1 mg.g-1 and in a lower range B 35 mg.kg-1, Zn 50 mg.kg-1, Mn 50 mg.kg-1, Fe 160 mg.kg-1, Cu 10 mg.kg-1 . Used stock solutions and application procedure for macro and micronutrients are described in Annex II. Aqueous solutions with micronutrients in ionic form are transparent and homogeneous, but aqueous suspensions of nanoparticles are emulsions, for which the stability had to be tested. For determination of the stability of suspensions of micnobits, see Annex II, 6.2.1. For administration of the micronutrients, plants were exposed to 11 different treatments as shown in shown in

5 Blom-Zandstra et al., VFRC Report 2016/x
Table 2-1 and Figure 2-2, with 4 replicates per treatment. Plants were positioned in randomized blocks from which one single plant was harvested at any time per treatment per block. Periodically, water was supplied to compensate for the transpiration of the plants. Therefore, all pots were individually weighed and water was replenished to the required weight (i.e. 80% of field capacity). For determination field capacity, see Annex II, 6.3.2. Table 2-1. Overview treatments
Nr Applied to Application form micronutrients Zn-level 1 - No micronutrients (Control) 2 Soil Ionic form (Common Agricultural Practice) Zn1 3 Soil Ionic form Zn2 4 Soil Micnobits Zn1 5 Soil Micnobits Zn2 6 Foliar Micnobits Zn1 7 Foliar Micnobits Zn2 8 Foliar Ionic form Zn1 9 Foliar Ionic form Zn2 10 Seed Priming with micnobits Zn1 11 Seed Priming with ionic form Zn1
2.3.1 Soil fertilization
In the treatments 2-5 (see Table 2-1), suspensions with micronutrients were prepared individually, and then physically mixed to form the composite ‘ionic fertilizer’ or ‘micnobit fertilizer’. The treatments were applied in the form of suspensions of micnobit particles or solutions of ionic micronutrients, supplied to the soil in two portions and times. The first portion was supplied in diluted form (1:15, i.e. 13.5 ml Stock solution + 186.5 ml demineralized water) at 3 weeks after sowing (at the same time with the first foliar spraying – see below), while the second portion was supplied in diluted form (1:15) at 5 weeks after sowing (at the same time with the second
6 Blom-Zandstra et al., VFRC Report 2016/x
spraying). The soil and foliar micronutrient treatments received equal amounts of water, to exclude differences in soil water content.
2.3.2 Foliar application
In treatments 6-9 (see Table 2-1), foliar application was executed biweekly (which stopped 2 weeks before harvest) by spraying the leaves with a suspension of micnobit particles or with a solution of micronutrients in ionic form, supplied from a stock solution. During spraying the bottles were shaken intermittently to prevent aggregation of the particles. The concentrations of the micronutrients in the suspension or solution were based on the composition in foliar sprays used in Common Agricultural Practice, nr 2 in Table 2-1 (1% of each component). The quantity sprayed was based on the expected fresh weight production with time and the average concentrations of mineral nutrient in plant shoot dry matter sufficient for optimal growth. For details of the spraying procedure: see Annex II.
As the suspended micnobits have a tendency to precipitate rapidly, we tested possibilities to remove the residues from the leaves, see Annex II, 6.2.3. However, the micnobit residues of the could not be efficiently removed from the leaves following the protocols published by Hong et al. (2014). Therefore, after harvest sprayed leaves were separated from new leaves that developed after spraying was doneBoth parts were weighed (FW and DW), but only newly formed leaves were used for the analyses of micronutrient content and metabolomics.
2.3.3 Seed priming
To evaluate the effects of seed treatment with micronutrients in relation to soil and foliar applications, seeds were primed (see Figure 2-2) with an emulsion of micnobits or a solution of micronutrients in ionic form prior to sowing. Concentrations of both micnobits or ions were the same as in the foliar application. Seeds were soaked in 50 ml Nalgene tubes for 3 hours in an emulsion with the micnobit particles suspension or ionic solution. The soaking was done for 3 hours because seeds of lettuce generally germinate after 4 hours. The tubes were turned around on a rollerbank (40 rpm). Thereafter, the seeds were filtrated and used for sowing. The micnobits colored the seeds black (Figure 2-2 D).
2.4 Plant data
Periodical observations on lettuce roots and shoots were made in 4 replicates (blocks) per treatment at 2-weekly intervals, starting 3 weeks after sowing until crop maturity. In total, plants were harvested 4 times starting at day 35 after sowing. Prior to harvest, leaf greenness of the intact leaves was measured with a SPAD 502 Plus
7 Blom-Zandstra et al., VFRC Report 2016/x
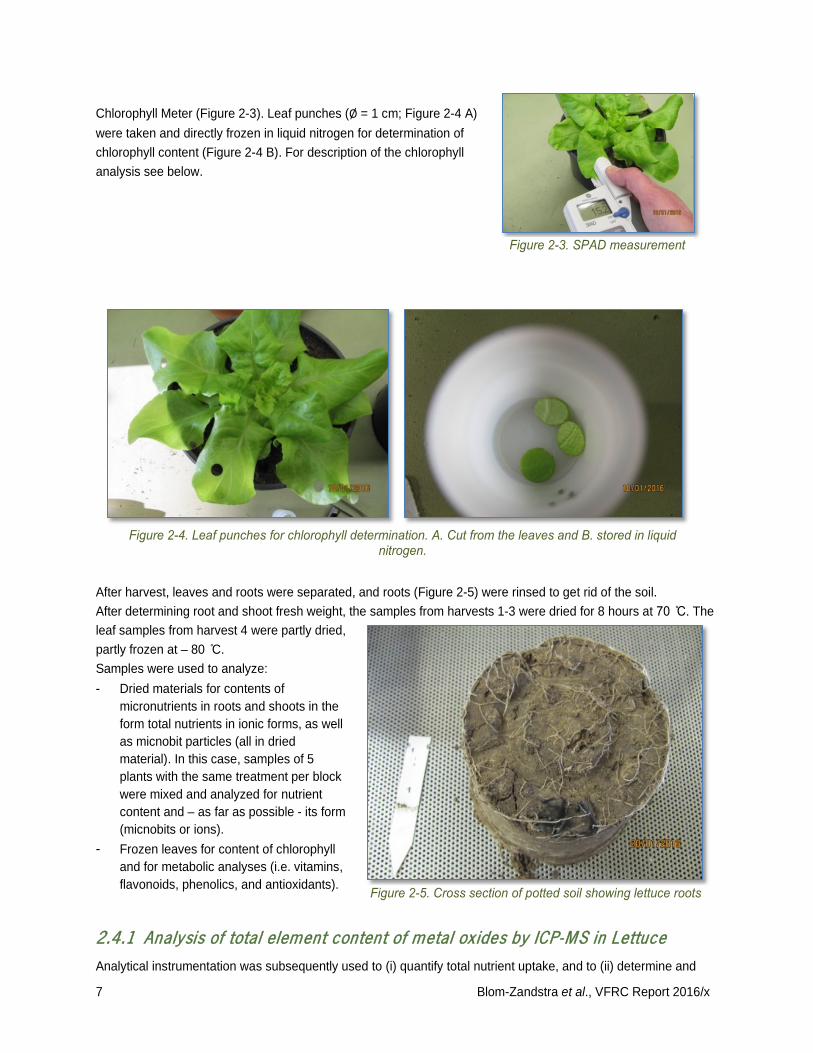
Chlorophyll Meter (Figure 2-3). Leaf punches (Ø = 1 cm; Figure 2-4 A) were taken and directly frozen in liquid nitrogen for determination of chlorophyll content (Figure 2-4 B). For description of the chlorophyll analysis see below.
After harvest, leaves and roots were separated, and roots (Figure 2-5) were rinsed to get rid of the soil. After determining root and shoot fresh weight, the samples from harvests 1-3 were dried for 8 hours at 70 ̊C. The leaf samples from harvest 4 were partly dried, partly frozen at – 80 ̊C. Samples were used to analyze: - Dried materials for contents of
micronutrients in roots and shoots in the form total nutrients in ionic forms, as well as micnobit particles (all in dried material). In this case, samples of 5 plants with the same treatment per block were mixed and analyzed for nutrient content and – as far as possible - its form (micnobits or ions).
- Frozen leaves for content of chlorophyll and for metabolic analyses (i.e. vitamins, flavonoids, phenolics, and antioxidants).
2.4.1 Analysis of total element content of metal oxides by ICP-MS in Lettuce
Analytical instrumentation was subsequently used to (i) quantify total nutrient uptake, and to (ii) determine and

8 Blom-Zandstra et al., VFRC Report 2016/x
quantify the form of the nutrients from the micnobits that are present in the shoot and roots, where possible. For both quantifications, inductively couple plasma mass spectroscopy (ICP-MS) was used. First, the total amount of individual elements was quantified, and then the presence of the micnobits was determined and quantified using single particle ICP-MS. To this end, sample preparation and measurement were performed according to the modified Standard Operating Procedures, A1057 (Rikilt; procedure accredited) and A1120 (A1057: Microwave destruction sample preparation for elemental analysis; A1120: Analysis of elements using ICP-MS). Briefly, dried lettuce leaves and roots were transferred to 50ml centrifuge tubes and cut into small pieces with a pair of ceramic scissors. For each sample 300mg of dry leaf/root material was weight into a 50ml centrifuge tube. Acid leaching was performed with 10 ml of 70% HNO3, followed by microwave destruction. Prior to analysis, samples were diluted 1000, 200 and 5 times in MQ. Calibration lines were prepared in MQ and acid through dilutions steps of the ICP-MS multi-element ionic standards (BIO SCIENCE) and single element standards for B, Zn and Fe in higher concentrations (Merck). As internal standard Rh was used. Samples, as well as standards were measured on Perkin Elmer Nexion 350D ICP-MS instrument in a KED mode and expressed in mg/kg dry material. Recorded m/z 11, 55, 56, 65, 66, 98 for B, Mn, Fe, Cu, Zn and Mo, respectively, were measured as a single event. Samples were processed using in-house Excel VBA Macro “Data file processor SOP-A-1120 Nexion_v1” to check the quality assurance parameters in the measurements.
2.4.2 Determination of the presence of nanoparticles in lettuce leaves by spICP-MS
Lettuce leaves, and in case of foliar application, the newly developed leaves after spraying, were transferred to 50ml centrifuge tubes and cut into small pieces with a pair of ceramic scissors. Approximately 100mg of dry leaf material was weight into 10 ml centrifuge tube. Nanoparticles were released from leaf material by adding 4 ml 20% TMAH (tetramethylammonium hydroxide, Sigma-Aldrich) according to the modified Perkin Elmer Application Note “Analysis of Nanoparticles in Biological Tissues using spICP-MS” 1. The mixture was vortexed and ultrasonicated for 15 min, 4 ml of H2O (total volume 8 ml) was added, and the mixture was further vortexed and ultrasonicated for 15 min. Prior to analysis, samples were diluted in MQ, 25 times for Zn, B and Mo oxides, 125 times for Mn and Cu oxides, and 125 and 250 times for Fe oxides. Matrix matched calibration standards were prepared through dilution steps of the spICP-MS ionic standards (MERCK) separately for each element. Samples as well as standards were measured on Nexion 350D ICP-MS instrument. Data was acquired for 60 sec with the dwell time set up to 3 ms in a KED mode. Recorded m/z 11, 55, 56, 65, 66, 98 for B, Mn, Fe, Cu, Zn and Mo respectively measured as separate events. Transport efficiency of particles in the nebulizer was determined based on the measurement of 60nm 50ngL AuNPs (NIST certificated standard). Samples were processed using RIKILT single particle calculation tool version 2.
2.4.3 Chlorophyll content determination
Chlorophyll was extracted in dimethylformamide (DMF) in the dark at -20˚C. The absorbance of the extract was measured in the range 400–750 nm using a Cary 4000 spectrophotometer (Varian Instruments, Walnut Creek, CA, USA), and the chlorophyll a, b and c contents were calculated using the equations provided by Wellburn (1994).
1 https://www.perkinelmer.com/lab-solutions/resources/docs/APP_NexION-350Q-Silver-Nanoparticles-in-Bio-Tissues-011803_01.pdf

9 Blom-Zandstra et al., VFRC Report 2016/x
2.4.4 Metabolomics
For nutritional quality attributes at maturity we analyzed growth data to select a subset for LCMS metabolomics analysis to quantify micronutrients effects on the profile of biomolecules, including vitamins, flavonoids, phenolics, and antioxidants (De Vos et al., 2007; Wahyuni et al., 2013).
2.4.4.1 Vitamin C Vitamin C (total ascorbate) was analyzed by HPLC with a photodiode array (PDA) detector, as described previously (Helsper et al., 2003). Briefly,, 300 mg FW leaf was mixed with 1.2 ml 5% metaphosphoric acid containing 1 mM DTPA. The slurry was sonicated for 15 min, centrifuged, filtered and 10 µl of the clear supernatant was injected. Vitamin C was detected at 262 nm, and its level in the samples calculated using a calibration series with the authentic standard.
2.4.4.2 LCMS profiling Metabolite analysis was performed as described in De Vos et al. (2007). After harvest, leaves were snap frozen in liquid nitrogen and ground to a fine powder. Subsequently, 300 mg (+/–2 mg) of powder was extracted with 1.2 mL of methanol containing 0.1% formic acid. Extracts were sonicated for 15 min, centrifuged at 12500×g for 10 min, and then filtered through 0.45 μm filters (Minisart SRP4, Biotech GmbH, Germany). An Acquity High Pressure Liquid Chromatography system with a photo diode array (HPLC-PDA; Waters) coupled to an LTQ Ion Trap-Orbitrap Fourier Transformed Mass Spectrometer (FTMS; Thermo) hybrid system was used to detect, identify and quantify compounds (van der Hooft et al., 2012). A LUNA 3 μ C18 (2) 150 × 2.00 mm column (Phenomenex, USA) was used to separate the extracted metabolites, with 0.1% formic acid (A) and acetonitrile with 0.1% formic acid (B) in MQ water as solvents. A linear gradient from 5 to 95% B at a flow rate of 0.19 ml/min was used. The FTMS was set at a mass resolution of 60,000 HWHM and a mass range of m/z85-1200, using electro spray ionization in negative mode. Identification of detected compounds was based on retention time, accurate masses of both the parent and fragment ions, in combination with any PDA absorbance spectra (recorded at 240–600nm). The following replicated treatments were analyzed (total 24 samples): - Control - Soil: ion Zn1, ion Zn2 and nano Zn1 - Spray: ion Zn1 and nano Zn1
2.5 Data analyses
Plant growth and plant tissue nutrient content data were statistically analyzed to determine significant differences among the treatments by a GENSTAT analysis (VSN International (2015). Genstat for Windows 18th Edition (VSN International, Hemel Hempstead, UK. Web page: Genstat.co.uk). Analysis of Variance was carried out on the following data: shoot and root FW and DW, SPAD measurements, contents of micronutrients in shoots and roots and contents of chlorophyll in leaves. To obtain approximate normality the data were log10 transformed. A mixed model was used that comprised nested random effects for replication, days and units. The fixed effects were main effects and interactions for days and treatments. The treatment factor had 11 levels that were specific combinations of ion, nano in two concentrations, and three delivery mechanisms (soil, leaf and seed). Measurements were collected at four harvests with time intervals of 14 days, according to a randomized complete block design with four replications. Means were compared pairwise with Fisher’s protected LSD method.

10 Blom-Zandstra et al., VFRC Report 2016/x
The LCMS profiles were statistically evaluated by a Multivariate Analysis (PCA; Worley and Powers, 2016) to visualize similarities and differences between samples. Principal Component Analysis (PCA) and Orthogonal Projections to Latent Structures Discriminant Analysis (OPLS-DA) are powerful statistical modeling tools that provide insights into separations between experimental groups based on high-dimensional spectral measurements from NMR, MS or other analytical instrumentation. In this study a Monte Carlo analysis of PCA group separations and OPLS-DA cross-validation metrics was performed on NMR datasets with statistically significant separations in scores-space. A linearly increasing amount of Gaussian noise was added to each data matrix followed by the construction and validation of PCA and OPLS-DA models.

11 Blom-Zandstra et al., VFRC Report 2016/x
3 Results
3.1 Growth
By visual observation, the lettuce plants showed normal growth pattern under all treatments (see overview in Table 2-1) and started to head at about 40 days after sowing. Figure 3-1 provides an impression of different time points during growth of the plants. The ionic and micnobits spraying treatments caused necrosis at the leaf edges in the long run. In addition, spraying with micnobits caused deposition of dark spots on the leaves that could not be removed (Figure 3-1 I). In contrast, no such dark spots were found on the leaves of soil-treated or seed-primed plants.
Plants were harvested four times during the growth period. Shoot and root growth over time are shown in Figure 3-2 for the Control treatment (growth curves for all treatments are shown in Annex IV for shoots and roots, respectively). The figures show that shoot growth with time followed the normal S-shaped curves for all treatments, although the growth of plants treated with Ion Spraying and Ion Addition to the Soil showed a
G
F
H I

12 Blom-Zandstra et al., VFRC Report 2016/x
decrease of plant production at the fourth harvest, probably due to leaf drying at the end of the growth period. This suggests that these treatments show an earlier onset of senescence than other treatments. However, this did not result in an earlier initiation of growth in these treatments (see Annex IV).
To further evaluate the effect of the treatments on shoot growth, S-shaped trend lines for Yield vs time were fitted through the growth data for each treatment, using following equation:
Y = Ymax / (1 + exp (- α * time + β)
In which: Y = yield time = day at growth curve α = slope parameter β = time parameter
From these trend analyses describing growth, values were derived for Ymax and for the time needed to reach 95% of Ymax, shown in Figure 3-3. The plants in the treatments Control, Priming (both ion and nano) and Ion Spray with high Zn-concentration showed the best growth, while plants treated with Ion spray exhibited lowest final weight. The time needed to reach 95% of Ymax was for almost all treatments between 55 – 60 days, except for Ion Spray with high Zn-concentration, where the growth rate was slower. Root growth data is also presented in Figure 3-2 for the Control treatment and for the other treatments in Annex IV, showing growth increase until the third harvest. At the fourth harvest, fresh weight values appeared to be lower for the treatments Control, Priming and Foliar application, possibly due to senescence of old root material. However, in all soil treatments root growth continued until the end of the experiment.
0
20
40
60
80
100
120
140
0 20 40 60 80
FW (g
)
days
Fresh weight production of lettuce with time Control
Shoot (g)
Root (g)

13 Blom-Zandstra et al., VFRC Report 2016/x
0
10
20
30
40
50
60
70
80
0.00
20.00
40.00
60.00
80.00
100.00
120.00
140.00
Control Ionpriming
(Zn1)
Nanopriming
(Zn1)
Ionspray(Zn1)
Nanospray(Zn1)
Ionspray(Zn2)
Nanospray(Zn2)
Ion soil(Zn1)
Nanobodem(Zn1)
Ion soil(Zn2)
Nanosoil
(Zn2)
Max
imum
gro
wth
cur
ve
Slop
e gr
owth
cur
ve
MaxTime (95% Max)
Figure 3-3. Calculated maximum yield (Max) and time to reach 95% of this maximum at different treatments, based on fresh weight production over time
-2
0
2
4
6
8
10
12
14
0 20 40 60 80
DW (g
)
days
Dry weight production with time Control
Shoot (g)
Root (g)
14 Blom-Zandstra et al., VFRC Report 2016/x
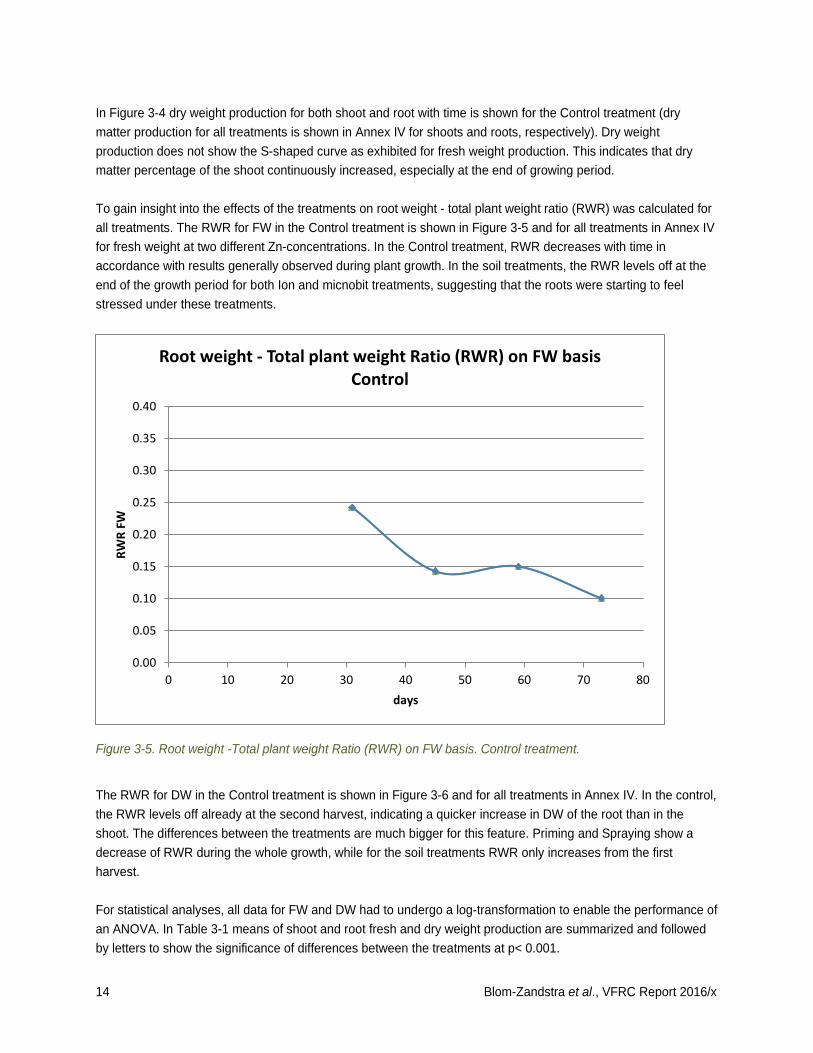
In Figure 3-4 dry weight production for both shoot and root with time is shown for the Control treatment (dry matter production for all treatments is shown in Annex IV for shoots and roots, respectively). Dry weight production does not show the S-shaped curve as exhibited for fresh weight production. This indicates that dry matter percentage of the shoot continuously increased, especially at the end of growing period. To gain insight into the effects of the treatments on root weight - total plant weight ratio (RWR) was calculated for all treatments. The RWR for FW in the Control treatment is shown in Figure 3-5 and for all treatments in Annex IV for fresh weight at two different Zn-concentrations. In the Control treatment, RWR decreases with time in accordance with results generally observed during plant growth. In the soil treatments, the RWR levels off at the end of the growth period for both Ion and micnobit treatments, suggesting that the roots were starting to feel stressed under these treatments.
Figure 3-5. Root weight -Total plant weight Ratio (RWR) on FW basis. Control treatment.
The RWR for DW in the Control treatment is shown in Figure 3-6 and for all treatments in Annex IV. In the control, the RWR levels off already at the second harvest, indicating a quicker increase in DW of the root than in the shoot. The differences between the treatments are much bigger for this feature. Priming and Spraying show a decrease of RWR during the whole growth, while for the soil treatments RWR only increases from the first harvest. For statistical analyses, all data for FW and DW had to undergo a log-transformation to enable the performance of an ANOVA. In Table 3-1 means of shoot and root fresh and dry weight production are summarized and followed by letters to show the significance of differences between the treatments at p< 0.001.
0.00
0.05
0.10
0.15
0.20
0.25
0.30
0.35
0.40
0 10 20 30 40 50 60 70 80
RWR
FW
days
Root weight - Total plant weight Ratio (RWR) on FW basis Control

15 Blom-Zandstra et al., VFRC Report 2016/x
Figure 3-6. Root-Total plant weight Ratio based on DW. Control treatment.
Table 3-1. Means of total shoot and root fresh and dry weight production of lettuce grown at different treatments
after log-transformation. Means followed by different letters are significantly different at p < 0.001.
Treatment FW (g) DW (g)
Shoot Root Shoot Root
Control 66.07 e 11.72 f 5.65 e 0.59 e Ion soil Zn1 46.88 cd 7.40 bcd 3.52 abc 0.35 c Nano soil Zn1 47.42 cd 8.04 cd 3.56 abc 0.35 c Ion priming Zn1 59.98 de 10.76 ef 4.39 cde 0.49 de
Nano priming Zn1 59.70 de 10.91 ef 4.74 de 0.55 de Ion spray Zn1 35.40 ab 5.36 a 3.11 ab 0.21 a Nano spray Zn1 44.98 bc 9.40 def 3.56 abc 0.41 cd Ion soil Zn2 38.11 abc 6.14 ab 2.79 a 0.31 bc
Nano soil Zn2 40.64 abc 6.58 abc 2.85 a 0.32 bc Ion spray Zn2 33.96 a 6.12 ab 3.16 ab 0.25 ab Nano spray Zn2 48.31 cd 8.61 de 4.00 bcd 0.36 c Significance treatment <0.001 <0.001 <0.001 <0.001 Interaction effect
n.s. <0.001 n.s <0.001 (day*treatment)
In the case of fresh weight production, it can be seen from Table 3-1 that Control performed best. Priming achieved second best and not significantly different from the Control. The other treatments did significantly differ from the Control. There was no significant difference between the Spraying and Soil treatment. The roots showed
0.00
0.05
0.10
0.15
0.20
0.25
0 10 20 30 40 50 60 70 80
RWR
DW
days
Root weight - Total plant weight Ratio (RWR) on DW basis Control

16 Blom-Zandstra et al., VFRC Report 2016/x
the same pattern. Dry weight production exhibited more or less similar trend as fresh weight production. Here, high Zn-concentrations resulted in low dry weight production, especially when added in the soil. For both shoot FW and DW, no significant interaction effects were shown. However, the results did show interaction effects for the roots, but the interaction between time (different harvests) and different treatment was marginal.
3.2 Uptake of micronutrients
The levels of micronutrients (B, Mn, Fe, Cu, Zn and Mo) in the plants are shown in Tables 3-2 and 3-3. For statistical analyses the values were log-transformed and listed in the tables as mean values of the micronutrients, accumulated in the shoots and roots of the lettuce plants grown under the different treatments. The values are followed by letters indicating the significance of the differences among the treatments at p< 0.001. For comparison, values determined by Hartz and Johnstone (2007) are also listed. Remarkably, the shoots and roots of plants in the Control treatment showed accumulation of micronutrients, whereas no micronutrients had been applied, and the analysis report on the composition of the soil (see Annex I) suggested low values, for at least Mn, Fe, Cu, Zn and Mo. Also, both leaves and roots of the priming treatment contained micronutrients with levels similar to those in the control treatment. For B and Zn, the levels in the shoots turned out to be even higher than the values considered to accumulate under natural circumstances, as published by Hartz and Johnstone (2007). Compared to the control treatment, the micronutrient levels in the shoots increased significantly by the soil treatment and foliar application for B, but only by the foliar application for B in the roots and for Mn, Cu, Zn and Mo for both shoots and roots. For Fe no treatment significantly differed from the control. For B, the levels of the micronutrients in the shoots were approximately two times higher than in the roots for all treatments, while the levels in shoots and roots did not differ much for Mn and Zn (except for Foliar application). For Fe and Cu, however, the levels of the micronutrients were much higher in the roots than in the shoots for all treatments. For Mo, the levels were higher in the roots than in the shoots in the soil treatment and in the foliar application. When the applications with ions were compared with those with micnobits (indicated as ‘Nano’ in the tables), no significant differences were found for B, Fe and Mo in the shoots, for all treatments. However, the levels differed between ion and micnobit application for Mn in shoots in the foliar application for both Zn-concentrations; for Cu in the shoots in soil treatment (Zn1); foliar application with ions for both Zn-concentrations; and for Zn levels in the shoots in foliar application for both Zn-concentrations. For the roots, no differences were seen for levels of B and Fe between Priming, Soil treatments (both Zn1 and Zn2) and Foliar application at Zn1. Also, for Mn, Cu, Zn and Mo, the levels did not significantly differ between the treatments, except for the foliar ion application. Remarkably, the roots contained much higher amounts of Mn, Cu, Zn and Mo in the Spray treatment than in the soil treatment. Based on sp ICP-MS, the presence of micnobit particles could only be detected for Fe2O3, CuO and MnO3 in the shoots. However, due to a high noise level in the ICP-MS analyses in the leaves from both the Soil and Foliar application (newly developed leaves), as well as from the priming of seeds, it was not possible to quantify the content of the elements properly.

17 Blom-Zandstra et al., VFRC Report 2016/x
Table 3-2. Mean contents of the different microelements in shoot and root of lettuce calculated over all harvests. Means followed by different letters are significantly different at p < 0.001.
Treatment B (mg kg-1) Mn (mg kg-1) Fe (mg kg-1)
Shoot Root Shoot Root Shoot Root Values determined by Hartz and Johnstone (2007)
35 50 160
Control 48.08 a 29.92 bc 13.00 a 11.09 ab 126.18 - 475.34 - Ion soil Zn1 64.12 bc 28.18 ab 12.08 a 16.22 de 138.36 - 498.88 - Nano soil Zn1 60.95 b 30.90 bc 12.68 a 15.85 de 146.89 - 567.54 - Ion priming Zn1 47.75 a 29.72 abc 11.19 a 10.26 a 125.31 - 423.64 - Nano priming Zn1 46.99 a 26.92 a 10.47 a 12.33 abc 128.82 - 445.66 - Ion spray Zn1 71.94 c 41.30 fg 48.64 c 17.06 e 133.97 - 545.76 - Nano spray Zn1 67.14 bc 37.84 ef 31.05 b 13.52 bcd 137.40 - 473.15 - Ion soil Zn2 65.31 bc 28.84 ab 12.82 a 14.45 cde 146.89 - 505.82 - Nano soil Zn2 64.86 bc 32.36 cd 13.24 a 11.75 abc 137.72 - 400.87 - Ion spray Zn2 70.79 c 42.36 g 48.64 c 17.50 e 149.97 - 539.51 - Nano spray Zn2 71.78 c 35.56 de 32.14 b 13.21 bcd 142.23 - 505.82 - Significance treatment <0.001 <0.001 <0.001 <0.001 n.s. n.s. Interaction effect
<0.001 n.s <0.001 <0.001 <0.001 <0.001 (day*treatment)
Table 3-3. Mean contents of different microelements in shoot and root of lettuce calculated over all harvests. Means followed by different letters are significantly different at p < 0.001.
Treatment Cu (mg kg-1) Zn (mg kg-1) Mo (mg kg-1)
Shoot Root Shoot Root Shoot Root Values determined by Hartz and Johnstone (2007)
10 50 Not reported
Control 8.26 ab 26.30 cd 69.34 a 73.28 ab 3.34 a 1.26 a Ion soil Zn1 8.89 b 20.75 ab 59.98 a 66.68 a 2.67 a 8.81 b Nano soil Zn1 6.21 a 23.39 bcd 58.48 a 66.37 a 2.44 a 8.95 b
Ion priming Zn1 7.01 ab 21.63 bc 61.38 a 70.96 ab 2.67 a 1.34 a Nano priming Zn1 6.90 ab 20.89 b 62.52 a 69.50 a 2.44 a 1.34 a Ion spray Zn1 39.90 e 49.20 e 129.12 cd 89.54 c 23.12 c 60.12 de Nano spray Zn1 26.92 cd 27.86 d 92.90 b 93.54 c 23.07 c 45.81 d
Ion soil Zn2 7.13 ab 22.34 bcd 66.68 a 78.34 b 2.55 a 7.52 b Nano soil Zn2 6.75 ab 16.60 a 66.99 a 73.28 ab 2.92 a 9.86 b Ion spray Zn2 32.81 de 57.54 e 149.28 d 122.18 d 18.84 bc 78.52 e Nano spray Zn2 22.49 c 25.12 bcd 108.89 bc 91.62 c 15.00 b 27.42 c
Significance treatment <0.001 <0.001 <0.001 <0.001 <0.001 <0.001 Interaction effect
<0.001 <0.001 <0.001 <0.05 <0.001 <0.05 (day*treatment)

18 Blom-Zandstra et al., VFRC Report 2016/x
3.3 SPAD measurements
SPAD measurements were performed in 3 well developed leaves per plant at harvest. For all treatments, SPAD values showed a slight increase with time up to 59 days (data not shown). Data for SPAD are presented in Table 3-4 for the different treatments, where it can be seen, that the differences among the treatments were not very distinct, but the control treatment was significantly better than ion soil treatment and the foliar ion and micnobit application (in this case for both Zn1 and Zn2). Among the fertilizer treatments themselves the effects were less distinct. Table 3-4. Means of values from SPAD measurements at different treatments. Means followed by different letters
are significantly different at p < 0.001.
Treatment Means the SPAD values
Control 21.68 ef Ion soil Zn1 19.68 bcd Nano soil Zn1 21.23 def Ion priming Zn1 20.65 cdef Nano priming Zn1 21.98 f Ion spray Zn1 18.16 a Nano spray Zn1 19.59 abc Ion soil Zn2 20.28 bcde Nano soil Zn2 20.09 bcde Ion spray Zn2 20.32 bcde Nano spray Zn2 19.10 ab Significance treatment <0.001
Table 3-5. Means contents (µl/l) of chlorophyll a, b and c of the lettuce leaves at different treatments
Chl a Chl b Chl c
Control 6.333 - 1.560 abc 1.702 -
Ion soil Zn1 6.628 - 1.632 cd 1.764 -
Nano soil Zn1 6.212 - 1.567 abc 1.752 -
Ion priming Zn1 6.209 - 1.537 abc 1.664 -
Nano priming Zn1 6.956 - 1.784 d 1.827 -
Ion spray Zn1 6.098 - 1.400 a 1.599 -
Nano spray Zn1 6.253 - 1.544 abc 1.715 -
Ion soil Zn2 6.382 - 1.510 abc 1.683 -
Nano soil Zn2 6.086 - 1.587 bcd 1.695 -
Ion spray Zn2 6.305 - 1.419 ab 1.64 -
Nano spray Zn2 6.03 - 1.484 de 1.612 -
Significance treatment n.s. <0.011 n.s.
19 Blom-Zandstra et al., VFRC Report 2016/x
The values for chlorophyll a, b and c contents in the leaves are shown in Table 3-5. For Chlorophyll a and c no significant differences were found and for Chlorophyll b values the differences among the treatments were small and showed strong overlap.
3.4 Vitamin C
In Figure 3-7 values for vitamin C are shown. It can be seen that plants from the Control treatment show the highest levels, while no clear distinction between soil or spraying can be made, nor between a treatment with ions or with micnobits.
3.5 LCMS profiles
The LCMS profiles of the lettuce leaves are shown in Figure 3-8, while the relative abundance of each of the compounds are presented in Figure 3-9. These Figures indicate that each leaf sample generated 257 compounds, based on their relative intensity. A Principle Component Analysis (PCA) was performed on these compounds to visualize similarities and differences among leaf samples and to evaluate the effect of different treatments on the global metabolome of the plant. The result of the PCA is shown in Figure 3-10, where it can be seen that the production of 80 out of the 257 metabolites (25%) was significantly altered. Out of those, 66 showed more than 2-fold difference. The metabolites are not yet annotated and further analysis and data processing are currently ongoing.
0
5
10
15
20
25
30
35
40
45
50
Controls Soil ionZn1
Soil ionZn2
Soil nanoZn1
Spray ionZn1
Spraynano Zn1
technicalrepeats
mg/
kg F
W

20 Blom-Zandstra et al., VFRC Report 2016/x
RT: 0.00 - 45.89
0 5 10 15 20 25 30 35 40 45Time (min)
0
20
40
60
80
100
0
20
40
60
80
100R
elat
ive
Abu
ndan
ce
14.17473.075162.15
133.014988.36
353.08960 14.77515.12262
25.79481.11676
38.67559.31598
14.21473.075262.15
133.014952.92
191.02065 25.82481.11685
16.96596.18073 38.67
559.31567
NL:1.00E7Base Peak F: FTMS - c ESI Full ms [95.00-1400.00] MS f018727
NL:1.00E7Base Peak F: FTMS - c ESI Full ms [95.00-1400.00] MS F018725
Control
Spray Nano Zn1
RT: 0.00 - 45.89
0 5 10 15 20 25 30 35 40 45Time (min)
0
20
40
60
80
100
0
20
40
60
80
100
Rel
ativ
e Ab
unda
nce
14.21473.075262.15
133.01495
2.44133.01492
7.37311.04245 25.82
481.1168516.96596.18073 38.67
559.3156733.33
423.07776
14.21473.07495
2.16133.01723
7.35311.04233 25.82
481.1165816.96596.18060 38.67
559.3153733.31
423.07782
NL:5.64E6Base Peak F: Full ms MS F018725
NL:5.20E6Base Peak MS f018725
Original raw data
>250 compounds extracted

21 Blom-Zandstra et al., VFRC Report 2016/x

22 Blom-Zandstra et al., VFRC Report 2016/x
4 Discussion
All lettuce plants showed normal S-shaped growth curves and had similar extent of leaf greenness, indicating that micronutrients can be supplied both as micnobit particles and traditional (ionic) fertilizers, allowing for the use of different nutrient forms, as suggested by Bindraban et al. (2015). However, the results on fresh and dry weight production clearly showed that the lettuce plants grew best in the Control treatment. Addition of micronutrients to soil or leaves, applied as ions or as micnobits actually decreased fresh weight and dry weight production of lettuce. Moreover, the shoots and roots of plants in the Control treatment also showed accumulation of micronutrients, while no micronutrients had been applied. Thus, the question arises whether at all the plants of the Control treatment suffered from micronutrient deficiency. Although for this experiment a nutrient-poor sandy soil from the coastal region in the Netherlands with a low content of micronutrients (except for B) and organic matter had specifically been used, the plants still appeared to be able to take up micronutrients, even from very low soil contents. In fact, plants are known to be capable of coping with micronutrient deficiencies in their environment, using different mechanisms. For example, Hernandez-Apaolaza (2014) discusses in her overview that silicon - which is sufficiently available in our soil (see Annex I) - can protect plants against the effects of micronutrient deficiency. The same author mentions that for Fe, deficiency stress is especially a problem in calcareous soils (high bicarbonate content;, pH 7,5 – 8,5) and the lower Fe threshold concentration for optimal plant growth is 10-8 M. In our soil the pH is lower than 7.5, and the threshold level given by Hernandez-Apaolaza (2014) is below the content in the soil. Petrazzini et al. (2014) discusses that deficiency stress in lettuce is mainly shown for B and less for Zn. In our soil B was sufficiently available. In the case of Mn deficiency,, plant species and cultivars differ considerably in their susceptibility to Mn deficiency. Oat, wheat, soybean or peaches are very susceptible, whereas maize and rye are much less susceptible. For lettuce, no threshold concentrations are reported. For Zn, Hernandez-Apaolaza (2014) discusses that deficiency stress is not related with a low Zn content in the soil, but rather with the soil characteristics (like high pH, presence of CaCO3 and organic matter) that control the plant availability of this element. Only at shoot Zn levels of 15-20 mg/kg dry weight do plants start to show deficiency symptoms. In our study, the shoots and roots in the Control treatment contained at least 60 mg/kg Zn, significantly more than the limit value. Apparently, the soil was not lacking in the tested nutrients, based on their reported soil critical levels (Dimkpa et al., 2016), and thus the low availability of micronutrients in the soil was already sufficient for optimal growth. The priming of seeds slightly enhanced growth rate and productivity, although not differing significantly from the Control treatment. Stimulation of growth in wheat, a 14% increase in grain yield, and a 12% increase in grain Zn concentration by seed priming with Zn was reported by Harris et al. (2008). They used the same priming procedure as we did in this study, although the soaking of the wheat seeds lasted longer (8 hours) than was permitted for the lettuce seeds, based on its germination time of 4 hours. The effect of priming will probably not be explained by a substantial increase of the micronutrient level within the seed, as that will not cover the demand for total growth. Nautiyal and Shukla (2012) showed that seed priming with Zn has an enhancing effect on the uptake rate rather than increasing the Zn content of the seed. Priming of seeds in chickpea has been shown to effectively improve the Zn status of seedlings and their establishment in Zn deficient conditions by increasing dry mass, seed Zn, Zn uptake and translocation at low Zn relative to hydro-primed seeds at normal Zn (Nautiyal and Shukla, 2012). This is also shown for mung bean by Shah et al (2012). As the availability of micronutrients might have been sufficient already in the experimental soil (as discussed above), the priming of seeds only slightly enhanced growth rate.
23 Blom-Zandstra et al., VFRC Report 2016/x
The levels of micronutrients found in leaves and roots, show that both ions and micnobits were taken up by the roots from soil, and by the leaves from foliar spray. For B and Zn, the levels in the shoots even exceeded the values considered as adequate for optimal growth (Hartz and Johnstone, 2007). This finding, together with the observed decrease in in biomass production upon supply of micronutrients by the Soil and Foliar treatments, raises the question of whether the concentrations of micronutrients may (temporally) have exceeded toxic levels, causing periods of stress with reduction of growth as a result. Tripathi et al (2015) reported in their overview on micronutrients the following toxicity threshold levels for micronutrients accumulated in vascular plants: B > 80 mg/kg, Mn > 200 mg/kg, Zn > 120 mg/kg, Cu > 25 mg/kg and Fe > 2000 mg/kg. For Mo no threshold levels have been reported. In our study, most levels of micronutrients both in leaves and roots did not exceed the toxic threshold levels. The only levels that exceeded the thresholds were for Cu in leaves and roots in the foliar application (both Nano and ion); for Zn in the leaves and roots in foliar ion application for Zn1 and Zn2, and for roots in foliar ion application for Zn2. When evaluating the efectiveness of the different forms in which the micronutrients were applied, we did not find significant differences between applications with ions and those with micnobits. In addition, different Zn concentrations did not show clear differences in growth characteristics either. Due to the unfavorable characteristics of the soil and adequate growth of plants in the Control treatment, we did not obtain clear insights to support prior reports on the increase in the effectiveness of micronutrients when applied as micnobits than as ions (Dimkpa et al,. 2012; Pradhan et al., 2013; Kim et al., 2014). Nevertheless, a recent study with composite formulations of micnobits or ions comprising of ZnO, CuO and B2O3 or their salt equivalents when applied as foliar treatments also did not indicate clear differences in affecting crop (soybean) productivity, although both types of formulation performed significantly better than the control (Dimkpa et al, in press). In accordance with the observations of different authors (Dimkpa et al., 2012; Wang et al., 2012; Dimkpa et al., 2013; Bandyopadhyay et al., 2015; Wang et al., 2012; Wang et al., 2013b, c), this study confirms that when micnobits were applied, micronutrients (either in the form of micnobits or as ions) are transferred from root to shoot (elements are found in leaves in the Soil treatments) and from the shoot to the root (elements are found in the roots in the Spray treatments). It was also shown that the roots contained much higher amounts of Mn, Cu, Zn and Mo in the Spray treatment than in the soil treatment, which indicated that either translocation of these ions from the leaves is more efficient, or the micronutrients are faced with more competition at the root surface. Translocation of micronutrients from leaf to root, either in the form of ions or as micnobits, is evidence that they travel by the phloem transport mechanism. This is in accordance with findings for maize by Wang et al. (2012), and for watermelon by Raliya et al. (2016), the latter who showed that gold nanoparticles were transported both by apoplast and by symplast. Unfortunately, we cannot conclude on the form in which the micronutrients are taken up and/or transferred in this study, as the quantity of micnobits could not be determined properly due to the high noise level in the in the ICP-MS analyses. This needs further research and better detection methods such as Xray absorption spectroscopy among others. Remarkably, in the foliar application the contents of Cu and Mo differ dramatically from those in the soil and seed priming treatments. This phenomenon may indicate a competition for uptake of both micronutrients at the root surface, a phenomenon which may play a lesser rolewhen the micronutrients are sprayed at the leaves. Antagonism has been described by Bailey and Nelson (2014) between Fe (high soil level) and Mn and Zn (low plant level) or Mn (high soil level) and Zn and Fe (low plant level) or between Cu (high soil level) and Zn (low plant level) and Zn (high soil level) and Cu (low plant level). If competition for uptake is involved in our study, it is even more remarkable that no differences have been found between the contents of ions and those of micnobits. Either

24 Blom-Zandstra et al., VFRC Report 2016/x
the uptake transporters of ions resemble the ones of micnobits, or micnobits are decomposed already when they enter the root, as can occur at neutral pH (between 7.4 – 7.6) as described by Bian et al. (2011). In contrast to previous nano studies (Dimkpa et al., 2015,a,b; Taran et al., 2014), there appears not to be the same kind of significant negative interactions between the nutrients for uptake via the soil. Competition between Cu and Mo at the root surface in the Soil treatment was shown, but the soil application of Zn at high levels (Zn2) did not diminish root and shoot levels of B, Cu, Mn, Fe and Mo relative to the control treatment. Similarly supplying the Zn at the high dose via the leaves did not inhibit nutrient uptake from the root, compared to the control. Thus, the notion of nutrient ratio imbalance playing a role in nutrient antagonism (Bindraban et al., 2015) had a different outcome for lettuce, in this study. The SPAD measurements as indication of greenness from the chlorophyll in the leaves showed the highest values for the Control treatment, indicating that the plants performed best under this treatment. However, when comparing the differences in the chlorophyll contents, the effects of the treatments were not significant for chlorophyll a and c. However, the results from the vitamin C analyses distinctly showed the highest levels in the Control treatment. The reduction in the Vitamin C levels of the plants treated with ionic or micnobit micronutrients from the root or leaves could suggest a trade-off between different produce quality criteria (in this case mineral nutrients versus nutrition-related metabolites). In previous work, Zhao et al. (2014) reported a significant increase in cucumber starch content, with a trend towards increases in globulin, albumin and prolamin contents by ZnO micnobits at high Zn uptake. It is unclear what the nature of the seeming antagonistic interaction between biomolecules and mineral nutrients is, but it represents significant ramifications for the overall nutritional quality of edible crop produce, especially given that the nutrient elements were not present in the plant leaf biomass at toxic levels as indicated by their levels in the control versus soil treatments. Similar to vitamin C modulation, the effect of the nutrient treatments could also been seen with other metabolites. Although these compounds have yet to be annotated, their up or down regulation by the nutrients likely reflects a response to stress induced possibly by the deposition of the minerals on the leaf surface that could reduce the photosynthetically active leaf area – seemingly evident in the SPAD readings, but unclear with the actual chlorophyll measurement - or other stress-related outcomes of metal-plant interactions on biomolecules (Schutzendubel and Polle, 2002; Mustafa and Komatsu, 2016). Unfortunately, the scope of the study does not permit the disentangling of the effects from individual nutrients in the fertilizer composite, in light of the fact that not all of them (e.g., boron) were metallic in nature. Differences in the LCMS profiles among the different treatments indicate that the treatments do differ in their impact on plant metabolism, but due to a lack of detailed information on the annotation of the metabolites, we could not at this point generate any additional insights into the changes of plant quality. Thus, the full extent of discussion for this report is difficult to be wrapped up at this point, with a number of key findings still very preliminary. The LCMS metabolites are still unknown, coupled with the fact that the spICP-MS analysis did not clearly determine/quantify whether the nutrients found in the shoot and roots existed in forms that included micnobits. In our analyses, Fe2O3, CuO and MnO3 were detected as micnobits in the shoots, but necessary information on the presence of these elements in the roots and on the other applied micnobits, important to conclude about mechanisms and to make clearer distinctions among the different treatments are still lacking, and need further research. Innovative in this study is the use of composite (mixed) nanoparticles (micnobits), in contrast to individual ones to investigate the effect of nanoparticles in a leafy vegetable crop. To date, such studies with leafy vegetables are not reported. The rationale for using mixed micnobits was in the context of balanced fertilization regimes as

25 Blom-Zandstra et al., VFRC Report 2016/x
practiced in conventional agriculture, where more than NPK are used to fertilize crops. In addition, the use of different nanoparticles in very many industrial processes means that there will be the simultaneous presence in the environment of different nanoparticles, either as co-contaminants or co-additives. However, unlike the known and anticipated reactions in the environment of individual micnobits with specific chemistry (aggregation, dissolution or stabilization), little is known about the chemical reactions that may occur among the micnobits applied in a mixture. Such complex interactions may aggravate aggregation of the micnobits on the surface, lowering their dissolution. Where they do dissolve, however, the resultant ions may form insoluble metal-metal complexes. These unknown outcomes might explain the very noticeable deposition of micnobits on the leaf surface of the foliar applications to the extent that has not been reported or noted to be of major concern in previous micnobit foliar studies involving single micnobits (Hong et al., 2016; Torabian et al. 2016; Dimkpa et al, in press), and that could not be removed by published washing procedures (Hong et al, 2014). Our data taken together, we conclude that this study, as reported, could not confirm the hypothesis that nutrients provided as micnobits will be taken up more efficiently than when provided as traditional ionic fertilizers, nor that they enhance growth, development and quality of a vegetable crop as mentioned in literature for individual micnobits (Alidoust and Isoda 2013; Pradhan et al,. 2013; Zhao et al., 2013; Kim et al., 2014). It should be emphasized that the spray of the nanoparticles could not be removed properly from the leaves, making it still not suitable for practical use in leafy vegetables.
Acknowledgements
The authors want to thank following colleagues for their useful contribution to this study: Drs. L.C.P. Keizer (Biometris) for his statistical analyses, Dr. R.J.B. Peters, Ing. M.E.M. van Bemmel and A.K. Undas MSc (Rikilt) for their contribution to the analsyses of micronutrients.
26 Blom-Zandstra et al., VFRC Report 2016/x
5 References
Abu-Rayyan, A., B.H. Kharawish and K. Al-Ismail, 2004. Nitrate content in lettuce (lactuca sativa l) heads in relation to plant spacing, nitrogen form and irrigation level J Sci Food and Agric, 84: 931-936.
Alidoust D. and A. Isoda, 2013. Effect of gamma Fe2O3 nanoparticles on photosynthetic characteristic of soybean (Glycine max L. Merr.): foliar spray versus soil amendment. Acta Physiol Planta 35: 3365–3375.
Bailey, D.A. and P.V. Nelson, 2014. Managing micronutrients in the greenhouse. Horticulture Information Leaflet 553, revised 8/98. Distribute in furtherance of the Acts of Congress of May 8 and June 30, 2014 North Carolina A&T State University.
Bandyopadhyay, S., G. Plascencia-Villa, A. Mukherjee, C.M. Rico, M. José-Yacamán, J.R. Peralta-Videa and J.L. Gardea-Torresdey, 2015.
Comparative phytotoxicity of ZnO nps, bulk ZnO, and ionic zinc onto the alfalfa plants symbiotically associated with sinorhizobium meliloti in soil. Sci Total Environ, 515: 60-69
Bian, S-W., I.A. Mudunkotuwa, T. Rupasinghe and V.H. Grassian, 2011. Aggregation and dissolution of 4 nm ZnO nanoparticles in aqueous environments: influence of pH, ionic strength, and adsorption of humic acid, Langmuir 27, 6059-6068.
Bindraban, P.S., C.O. Dimkpa, L. Nagarajan, A. Roy and R. Rabbinge, 2015. Revisiting fertilisers and fertilization strategies for improved nutrient uptake by plants. Biology and Fertility of Soils 51: 897-911.
De Vos, R.C.H., S. Moco, A. Lommen, et al., 2007. Untargeted large-scale plant metabolomics using liquid chromatography coupled to mass spectrometry. Nature protocols, 2 (4): 778-791.
Dimkpa C., Bindraban P., Fugice J., Agyin-Birikorang S., Singh U., Hellums D (in press).
Composite micronutrient nanoparticles and salts decrease drought stress in soybean. Agronomy for Sustainable Development. DOI: 10.1007/s13593-016-0412-8.
Dimkpa, C., and P.S. Bindraban, 2016. Micronutrients fortification for efficient agronomic production. Agronomy for Sustainable Development (2016) 36: 1-26.
Dimkpa, C.O., P.S. Bindraban, J.E. McLean, L. Gatere, U. Singh and D. Hellums, 2016. Applications for rapid testing of plant and soil nutrients. Sustainable Agriculture Reviews (accepted).
Dimkpa, C.O., J.E. McLean, D.E. Latta, E. Manangón, D.W. Britt, W.P. Johnson, M.I. Boyanov and A.J. Anderson, 2012.
CuO and ZnO nanoparticles: Phytotoxicity, metal speciation and induction of oxidative stress in sand-grown wheat. J Nanopart Res, 14: 1125.
Dimkpa, C.O., D.E. Latta, J.E. McLean, D.W. Britt, M.I. Boyanov and A.J. Anderson, 2013. Fate of CuO and ZnO nano and micro particles in the plant environment. Environ Sci Technol, 47: 4734-4742.
Dimkpa C.O., T. Hansen, J. Stewart, J.E. McLean, D.W. Britt and A.J. Anderson, 2015a. ZnO nanoparticles and root colonization by a beneficial pseudomonad influence metal responses in bean (Phaseolus vulgaris). Nanotoxicology 9: 271-278.
Dimkpa C.O., J.E. McLean, D.W. Britt and A.J. Anderson, 2015b.

27 Blom-Zandstra et al., VFRC Report 2016/x
Nano-CuO and interaction with nano-ZnO or soil bacterium provide evidence for the interference of nanoparticles in metal nutrition of plants. Ecotoxicology 24: 119-129
Greenwood, D.J., J.J. Neeteson and A. Draycott, 1986. Quantitative relationship for the dependenceof growth rate of arable crops on their nitrogen content, dry weight, and aerial environment. Plant and Soil, 91: 81–301.
Harris, D., A. Joshi, P. A., Khan, P Gothkar and P.S. Sodhi, 1999. On-farm seed priming in semi-arid agriculture: development and evaluation in Maize, Rice and Chickpea in India using participatory methods. Expl. Agric. 35, 15–29
Harris, D., A. Rashid, G. Miraj, M. Arif and M. Yunas, 2008. ‘On-farm’ seed priming with zinc in chickpea and wheat in Pakistan. Plant Soil 306, 3–10
Hartz, T.K. and P.R. Johnstone, 2007. Establishing lettuce leaf nutrient optimum ranges through dris analysis. Hort Sci, 42(1): 143–146.
Hernandez-Apaolaza, L. (2014). Can silicon partially alleviate micronutrient deficiency in plants? A review. Planta 240: 447-458.
Hong, J., J.R. Peralta-Videa, C Rico, et al., 2014. Evidence of Translocation and Physiological Impacts of Foliar Applied CeO2 Nanoparticles on Cucumber (Cucumis sativus) Plants. Environmental Science & Technology 48 (8): 4376-4385.
Hong, J., L.N. Wang, Y.P. Sun, L.J. Zhao, G.H. Niu, W.J. Tan, C.M. Rico, J.R. Peralta-Videa and J.L. Gardea-Torresdey, 2016.
Foliar applied nanoscale and microscale CeO2 and CuO alter cucumber (Cucumis sativus) fruit quality. Science of the Total Environment 563: 904-911.
Kim, J.H., Y. Lee, E.J. Kim, S. Gu, E.J. Sohn, Y.S. Seo, H.J. An and Y.S Chang, 2014. Exposure of iron nanoparticles to Arabidopsis thaliana enhances root elongation by triggering cell wall loosening. Environ Sci Technol 48: 3477–3485.
Lv, J., S. Zhang, L. Luo, J. Zhang, K. Yang and P. Christie, 2014. Accumulation, speciation, and uptake pathway of ZnO nanoparticles in maize. Environ Sci: nano, 2: 68-77.
Mannina, L., A.P. Sobolev and D. Capitani, 2012. Applications of NMR metabolomics to the study of foodstuffs: Truffle, kiwifruit, lettuce, and sea bass. Electrophoresis 33 (15): 2290-2313
Mustafa, G. and S. Komatsu, 2016. Toxicity of heavy metals and metal-containing nanoparticles on plants. Biochimica et Biophysica Acta-Proteins and Proteomics 1864: 932-944
Nautiyal, N. and K. Shukla, 2012. Evaluation of seed priming Zinc treatments in chickpea for seedling establishment under Zinc deficient conditions, Journal of Plant Nutrition 36: 251-258.
Pradhan, S., P. Patra, S. Das, S. Chandra, S. Mitra, S., K.K. Dey, S. Akbar., P. Palit and A. Goswami, 2013. Photochemical modulation of biosafe manganese nanoparticles on Vigna radiata: a detailed molecular, biochemical, and biophysical study. Environ Sci Technol 47: 13122–13131.
Pereira, S.I., P.I. Figueiredo, A.S. Barros, et al., 2014. Changes in the metabolome of lettuce leaves due to exposure to mancozeb pesticide. Food Chemistry 154: 291-298.
Petrazzini, L.L., G.A. Souza, C.L. Rodas, E.B. Emrich, J.G. Carvalho, R.J. Souza, 2014. Nutritional deficiency in crisphead lettuce grown in hydroponics. Horticultura Brasileira 32: 310-313
Pugnaire, F.I., 2001. Variability of inorganic nutrient concentrations in leaves. New Phytologist, 150: 506-507.

28 Blom-Zandstra et al., VFRC Report 2016/x
Raliya, R., C. Franke, S. Chavalmane, R. Nair, N. Reed and P. Biswas, 2016. Quantitative understanding of nanoparticle uptake in watermelon plants. Frontiers in Plant Science 7: 1-10.
Schutzendubel, A. and A. Polle, 2002. Plant responses to abiotic stresses: heavy metal-induced oxidative stress and protection by mycorrhization. Journal of Experimental Botany 53: 1351-1365
Servin, A., W. Elmer, A. Mukherjee, R. De La Torre-Roche, H. Hamdi, J.C. White, P.S. Bindraban and C.O. Dimkpa, 2015.
A review of the use of engineered nanomaterials to suppress plant disease and enhance crop yield. J Nanopart Res 17: 92.
Shah, H., T. Jalwat, M. Arif and G. Miraj, 2012. Seed priming improves early seedling growth and nutrient uptake in mungbean. Journal of Plant Nutrition 35: 805-816.
Siddique, M.H. and M.H. Al-Whaibi, 2014. Role of nano-SiO2 in germination of tomato (Lycopersicum esculentum seeds Mill). Saudi J Biol Sci 21: 13–17.
Sosa, A., J. Padilla, J. Ortiz and J.D. Etchevers, 2012. Biomass accumulation and its relationship with the demand and concentration of nitrogen, phosphorus, and potassium in lettuce. Communications in Soil Science and Plant Analysis, 43(1-2): 121-133. Available from DOI 10.1080/00103624.2012.634695.
Subbaiah,L.V., T.N.V.K.V. Prasad, T.G. Krishna, P. Sudhakar, B.R. Reddy, , T. Pradeep, (2016) Novel effects of nanoparticulate delivery of zinc on growth, productivity, and zinc biofortification in maize (Zea mays L.). J. Agric. Food Chem. 64:3778−3788.
Taran, N., L. Batsmanova, Y. Konotop and A. Okanenko, 2014. Redistribution of elements of metals in plant tissues under treatment by non-ionic colloidal solution of biogenic metal nanoparticles. Nanoscale Res Lett. 9: 354.
Torabian, S., M. Zahedi and Khoshgoftarmanesh, 2016. Effect of foliar spray of zinc oxide on some antioxidant enzymes activity of sunflower under salt stress. Journal of Agricultural Science and Technology 18:1013-1025
Tripathi, D.K., S. Singh, S. Singh, S. Mishra, D.K. Chauhan and N.K. Dubey, 2015. Micronutrients and their diverse role in agricultural crops: advances and future prospective. Acta Physiol. Plant 37: 139.
US Department of Agriculture, A.R.S., Nutrient Data Laboratory, 2015. Usda national nutrient database for standard reference release 27 (revised) may 2015. https://ndb.nal.usda.gov/ndb/foods/show/3000?manu=&fgcd=&ds=
Vijayan, G.M.S., 2014. Impact of sub-optimal macro and micronutrients on Romaine lettuce (Lactuca sativa L.) and supra-optimal on coffee (Coffea Arabica L.). Thesis. In: Graduate Research Studies. Tennessee State University: 169 pages.(http://gateway.proquest.com/openurl?url_ver=Z39.88-2004&res_dat=xri:pqdiss&rft_val_fmt=info:ofi/fmt:kev:mtx:dissertation&rft_dat=xri:pqdiss:1564711)
Wahyuni, Y., A. Ballester, Y. Tikunov, R.C.H. de Vos, K.T.B. Pelgrom, A. Maharijaya, E. Sudarmonowati, R.J. Bino and A.G. Bovy, 2013.
Metabolomics and molecular marker analysis to explore pepper (Capsicum sp.) biodiversity. Metabolomics 9:130–144.
Wang, Z., X. Xie, J. Zhao, X. Liu, W. Feng, J.C. White and B. Xing, 2012. Xylem- and phloem-based transport of cuo nanoparticles in maize (Zea mays L.). Environ Sci Technol, 46: 4434-4441.

29 Blom-Zandstra et al., VFRC Report 2016/x
Wang, J., Y. Koo, A. Alexander, Y. Yang, S. Westerhof, Q.B. Zhang, J.L. Schnoor, V.L Colvin, J. Braam and P. J.J. Alvarez, 2013a.
Phytostimulation of poplars and Arabidopsis exposed to silver nanoparticles and Ag+ at sublethal concentrations. Environ Sci Technol 47: 5442–5449.
Wang, P., N.W. Menzies, E. Lombi, B.A. McKenna, B. Johannessen, C.J. Glover, P. Kappen and P.M. Kopittke, 2013b.
Fate of ZnO nanoparticles in soils and cowpea (Vigna unguiculata). Environ Sci Technol, 47: 13822–13830. Wang, W.N., J.C. Tarafdar and P. Biswas, 2013c.
Nanoparticle synthesis and delivery by an aerosol route for watermelon plant foliar uptake. J Nanopart Res, 15: 1417.
Wellburn, A.R., 1994. The spectral determination of Chlorophyll-a and Chlorophyll-b, as well as total carotenoids, using various solvents with spectrophotometers of different resolution. Journal of Plant Physiology 144, 307-313.
Worley, B. and R. Powers, 2016. PCA as a practical indicator of OPLS-DA model reliability. Current metabolomics 4 (2): 97-103.
Zhao., L., Y. Sun, J.A. Hernandez-Viezcas, A.D. Servin, J. Hong, G.H Niu, J.R. Peralta-Videa, M. Duarte-Gardea and J.L. Gardea-Torresdey, 2013.
Influence of CeO2 and ZnO nanoparticles on cucumber physiological markers and bioaccumulation of Ce and Zn: a life cycle study. J Agric Food Chem 61: 11945–11951.
Zhao, L., J.R. Peralta-Videa, C.M. Rico, J.A. Hernandez-Viezcas, Y. Sun, G. Niu, A. Servin, J.E. Nunez, M.D. Duarte-Gardea and J.L. Gardea-Torresdey, 2014.
CeO2 and ZnO nanoparticles change the nutritional qualities of cucumber (Cucumis sativus). J. Agric. Food Chem. 62: 2752−2759
Zhu, H., J. Han, J.Q. Xiao and Y. Jin, 2008. Uptake, translocation, and accumulation of manufactured iron oxide nanoparticles by pumpkin plants. J Environ Monitor, 10: 713-717.

30 Blom-Zandstra et al., VFRC Report 2016/x
6 Annexes
6.1 Annex I. BLGG analysis report on the composition of the soil from Fa Grondbalans B.V., Heerhugowaard
In this analysis report, provided by BLGG on August 5th 2015 and based on samples taken at July 21th 2015, soil contents are shown of macro-elements (in Dutch: ‘hoofdelement’), microelements (in Dutch: ‘sporenelement’), physical properties (in Dutsch: ‘fysisch’) and biological actrivity (‘biologisch’). Titles of the columns: Unity (in Dutch: ‘eenheid’), Value (in Dutch: ‘resultaat’), Mean (in Dutch: ‘Gem’), Target path (in Dutch: ‘streeftraject’), Low (in Dutch: ‘laag’), rather low (in Dutch: ‘vrij laag’), Acceptable (in Dutch: ‘good’), rather high (in Dutch: ‘vrij hoog’), High (in Dutch: ‘high’). At the physical properties percentages are provided for Clay conteny (in Dutch: ‘klei’), Silt and Sand content (in Dutch: ‘zand’).

31 Blom-Zandstra et al., VFRC Report 2016/x
6.2 Annex II. Application of macro- and micronutrients
For the calculations of the amounts to be supplied to the plants, following assumptions were made: 1. Plants will reach a maximal final fresh weight of 400 gram 2. Final DW% = 12% Thus, maximal final dry weight is 50 gram 3. When dividing the growth period in 6 intervals of 2 weeks, fresh weight production per interval is as follows:
Interval 1 2 3 4 5 6 % Growth 5% 15% 30% 30% 15% 5%
N.B. The experiment has lasted until the fourth harvest. Then the expereiment had been stopped as plants had reached their final weight and symptoms of senescence became visible.
4. Nutrients will accumulate to values as values reported by Hartz and Johnstone (2007).
Macronutrients are individually supplied as follows:
Element Expected demand mg /plant
g/l (stock
solution) ml applied per interval (from Stock solution)
1 2 3 4 5 6
N 2500 25.0 5.00 15.00 30.00 30.00 15.00 5.00 P 300 3.0 5.00 15.00 30.00 30.00 15.00 5.00 K 2300 23.0 5.00 15.00 30.00 30.00 15.00 5.00 Ca 300 3.0 5.00 15.00 30.00 30.00 15.00 5.00 Mg 150 1.5 5.00 15.00 30.00 30.00 15.00 5.00
Micronutrients are prepared in a mixture stock solutions as follows :
Elements Expected demand mg /plant
Stock solutions (mmol/l)
For foliar application
For soil treatment
Zn1 3.00 15.29 1.74 Zn2 (6.00) 30.59 3.48 Mo Not reported 10.422 0.522 Mn 3.00 18.20 11.83 Cu 0.45 15.74 0.31 B 1.50 92.51 43.67 Fe 8.75 17.91 20.00
From stock solution following amounts (ml) were used (and diluted) for spraying:
ml applied from stock solution per interval 1 2 3 4 5 6
Foliar application 1.50 4.50 9.00 9.00 4.50 1.50 Soil treatment 1.32 3.96 7.92 7.92 3.96 1.32
2 Based on concentration used in a usual Hoagland nutrient solution.

32 Blom-Zandstra et al., VFRC Report 2016/x
6.3 Annex III. Tests
6.3.1 Stability aqueous suspensions of micnobits
Generally, aqueous solutions with micronutrients in ionic form are transparent and homogeneous, but aqueous suspensions of micnobits are emulsions, which will precipitate quickly (Figure 6-1). To be sure that we use the correct concentrations during handling (i.e. taking samples, dilution of stock solutions, foliar application, etc.), we needed to have insight in the stability of emulsions with time. To study the stability with time, we ultra-sonicated the emulsion with micnobits after preparation for 3 hours in a table top Sonicor (Figure 6-1 D). Immediately after ultra-sonication, we took samples of the emulsion at 3 different heights (Figure 6-1 E). Differences in colour between the samples demonstrated that sonication only was not sufficient to get a homogenous emulsion. Herewith we concluded, that shaking of the suspensions before every handling is necessary.
6.3.2 Determination field capacity pots
During growth, periodically water need to be supplied to compensate for the transpiration of the plants and to keep the soil at field capacity. To determine the field capacity, all pots were saturated with water and gravity drained for 2 days under a plastic sheet (Figure 6-2). Thereafter, all pots were weighed individually to determine total weight of the pots with soil and water content at field capacity. During the growth period all pots will be weighed individually and water will be supplied to the required weight (i.e. 80% of field capacity).
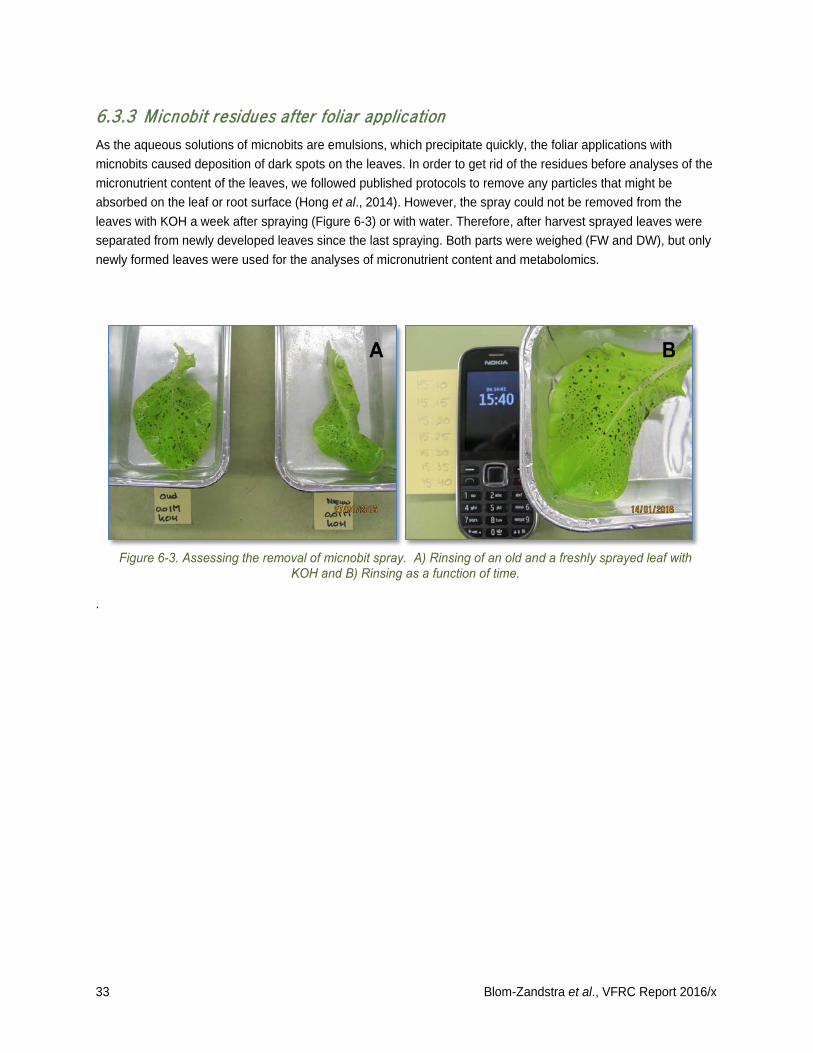
33 Blom-Zandstra et al., VFRC Report 2016/x
6.3.3 Micnobit residues after foliar application
As the aqueous solutions of micnobits are emulsions, which precipitate quickly, the foliar applications with micnobits caused deposition of dark spots on the leaves. In order to get rid of the residues before analyses of the micronutrient content of the leaves, we followed published protocols to remove any particles that might be absorbed on the leaf or root surface (Hong et al., 2014). However, the spray could not be removed from the leaves with KOH a week after spraying (Figure 6-3) or with water. Therefore, after harvest sprayed leaves were separated from newly developed leaves since the last spraying. Both parts were weighed (FW and DW), but only newly formed leaves were used for the analyses of micronutrient content and metabolomics. .

34 Blom-Zandstra et al., VFRC Report 2016/x
6.4 Annex IV. Plant growth
6.4.1 Fresh weight production with time – Different treatments at Zn1- concentration

35 Blom-Zandstra et al., VFRC Report 2016/x
6.4.2 Fresh weight production with time - Different Zn concentrations

36 Blom-Zandstra et al., VFRC Report 2016/x
6.4.3 Dry weight production with time – Different treatments at Zn1- concentration

37 Blom-Zandstra et al., VFRC Report 2016/x
6.4.4 Dry weight production with time - Different Zn concentrations

38 Blom-Zandstra et al., VFRC Report 2016/x
6.4.5 Root weight – Total plant weight ratio for different treatments based on fresh weight at Zn1 concentration.

39 Blom-Zandstra et al., VFRC Report 2016/x
6.4.6 Root weight – Total plant weight Ratio for different Zn- concentrations based on fresh weight

40 Blom-Zandstra et al., VFRC Report 2016/x
6.4.7 Root weight – Total plant weight Ratio for different treatments based on Dry Weight at Zn1 concentration.

41 Blom-Zandstra et al., VFRC Report 2016/x
6.4.8 Root weight – Total plant weight Ratio for different Zn- concentrations based on Dry Weight

1 Blom-Zandstra et al., VFRC Report 2016/x
More information: www.vfrc.org Virtual Fertilizer Research Center 1331 H Street, NW 11th Floor Washington, D.C. 20005 USA E-mail: [email protected]