Embed Size (px)
Citation preview

Effects of Microstructure and
Strain Ageing on
Toughness of Nuclear PWR Reactor Weld
Metals.
By
Victoria Jane Farron.
Volume I
A thesis submitted to the Faculty of Engineering of the University of Birmingham for the
degree of Doctor of Philosophy.
School of Metallurgy and Materials.
The University of Birmingham.
Edgbaston,
Birmingham.
B15 2TT.
2009.

University of Birmingham Research Archive
e-theses repository This unpublished thesis/dissertation is copyright of the author and/or third parties. The intellectual property rights of the author or third parties in respect of this work are as defined by The Copyright Designs and Patents Act 1988 or as modified by any successor legislation. Any use made of information contained in this thesis/dissertation must be in accordance with that legislation and must be properly acknowledged. Further distribution or reproduction in any format is prohibited without the permission of the copyright holder.

Genius is one per cent inspiration;
ninety-nine perspiration.
Thomas A. Edison
(1847-1931)

Acknowledgements.
Firstly, I would like to thank the EPSRC in conjunction with the Nuclear Installations
Inspectorate Health and Safety Executive (NII HSE) for sponsorship and the University of
Birmingham for granting me the great opportunity to pursue my Ph.D. education in the
Department of Metallurgy and Materials.
I would like to thank Professor P. Bowen, for his interest and encouragement throughout this
project. I am grateful to the late Dr R. D. Nicholson from the NII HSE for his input and
continued interest in this thesis and subject area. I would like to thank all academic and
technical support staff for their guidance and support in using the departmental facilities.
Technical assistance and useful advice from Dr M. Novovic are gratefully acknowledged.
Additionally, special thanks are due to the members of the Fatigue and Fracture Group for
their support and great friendship over the past 5 years.
Finally and most importantly, I would like to thank my parents for their unending support
(mostly financial), encouragement and inspiration. Without them I would not be who I am.
Also to my husband to be, Lee who has put up with the saying “When I have finished I could
do…….” And who I love.

Synopsis.
The effects of microstructure and prestraining and ageing on ductile-to-brittle transition
temperature, fracture toughness and cleavage fracture resistance of a multi-pass low-alloy
ferritic steel weld metal have been investigated. The weld metal simulated submerged arc
welds used in the fabrication of Sizewell B power station reactor pressure vessel. The study
aimed to investigate differences in mechanical properties of a single microstructure; as-
deposited and reheated microstructures and subjected to various mechanical tests.
Additionally, to simulate the effects of irradiation embrittlement a number of specimens were
prestrained and then statically strain aged. Charpy impact transition curves had obvious
trends depending upon microstructure and condition, with microstructure having a significant
influence on the transition region and upper-shelf impact energy level. Prestraining and
ageing the specimens promoted an increase in the ductile-to-brittle transition temperature and
reduction the upper shelf energy level for both microstructures. The extremes of behaviour
were defined by the reheated as-received and as-deposited prestrained and aged conditions,
being the “best” and “worst conditions” respectively. This trend was repeated with the crack-
tip opening displacement tests. A combination of factors decreases toughness for the as-
deposited prestrained and aged condition, which exhibited the highest yield stress, and lowest
work hardening exponent and the best cleavage fracture resistance. Such factors result in
marked upwards shifts in Charpy impact transition curves and decease in the crack growth
resistance curves.

P a g e | I
Contents
Acknowledgements. ................................................................................................................... 3
Synopsis. ..................................................................................................................................... 4
Contents ....................................................................................................................................... I
Chapter 1 - Introduction. ......................................................................................................... 1 Chapter 2 - Literature Review. ................................................................................................ 6
2.1 Pressurized Water Reactor.......................................................................................... 6 2.2 Neutron Embrittlement of Reactor Pressure Vessel (RPV Materials) ....................... 9
2.2.1 Safety concerns about the introduction of PWR’s in the UK. ............................ 11
2.2.2 Further Safety Concerns: The Loss of Coolant Accident (LOCA) .................... 12 2.2.3 Micromechanics of Irradiation Embrittlement ................................................... 13
2.2.4 Radiation Damage Dislocations in Ferritic/ Martensitic Steels ......................... 14
2.2.5 Interactions Between Dislocations and Irradiation-Induced Defects ................. 15
2.2.6 Forces of Dislocations ........................................................................................ 16 2.3 Material Requirements ............................................................................................. 17 2.4 Cold Deformation ..................................................................................................... 18 2.5 Other Embrittlement Mechanisms ............................................................................ 20
2.5.1 Interactions Between Solute Atoms and Dislocations ........................................ 25
2.6 Carbon-Manganese Welds ........................................................................................ 25 2.6.1 Fusion Welding .................................................................................................. 25 2.6.2 Submerged Arc Welding (SAW) ........................................................................ 26
2.6.3 Effects of welding process variables on C-Mn metal microstructures. .............. 29
2.6.4 Non-Metallic Inclusion Formation ..................................................................... 32
2.6.5 Weld Pool Solidification .................................................................................... 34 2.6.6 Transformations and Microstructural Development........................................... 36
2.6.7 Weld Microstructures and Nomenclature and Development ............................. 39
2.6.8 Multi-pass Welds and Reheated Microstructure ................................................ 47
2.6.9 Previous work on the toughness of C-Mn weld metal ....................................... 49
Chapter 3 - Fracture Mechanics............................................................................................. 53 3.1 Linear Elastic Fracture Mechanics ........................................................................... 53
3.1.1 The Griffith Theory ............................................................................................ 53 3.1.2 The Stress Intensity Factor Approach ................................................................ 56
3.1.3 Critical Tensile Fracture Stress, *fσ .................................................................. 61
3.1.4 Linear Elastic Fracture Mechanics (LEFM) ....................................................... 63
3.1.5 Elastic Plastic Fracture Mechanics (EPFM) ....................................................... 67
3.2 Microscopic Models For Cleavage Fracture ............................................................ 71
3.2.1 Stroh’s Theory .................................................................................................... 71 3.2.2 Cottrell’s Theory ................................................................................................ 73 3.2.3 Smith’s Theory ................................................................................................... 75 3.2.4 Measurement of the Microscopic Cleavage Fracture Stress .............................. 76
3.3 Fracture Criteria for Precracked Specimens ............................................................. 77

P a g e | II
3.3.1 Microstructural Effects on Cleavage Fracture .................................................... 77
3.3.2 The Ritchie-Knott-Rice Model ........................................................................... 80
3.3.3 Statistical Approach (RKR) model ..................................................................... 81
3.3.4 The relationship between microscope cleavage fracture stress (σ* f) and macroscopic toughness parameter KIC ............................................................................. 82
3.4 Ductile Fracture ........................................................................................................ 83 3.5 Ductile-to-Brittle Transition Region (DBTT) .......................................................... 85
3.6 Intergranular Failure ................................................................................................. 87 Chapter 4 - Experimental. ...................................................................................................... 89
4.1 Introduction .............................................................................................................. 89 4.2 Experimental ............................................................................................................. 90
4.2.1 Material ............................................................................................................... 90 4.2.2 Materials Plan ..................................................................................................... 90
4.3 Thermo-Mechanical Heat Treatments ...................................................................... 91
4.3.1 Cold Deformation Procedure .............................................................................. 91
4.3.2 Static Strain Aged Condition .............................................................................. 92 4.4 Material Characterisation ......................................................................................... 92
4.4.1 Microstructural Analysis .................................................................................... 92 4.4.2 Inclusion Analysis .............................................................................................. 93 4.4.3 Glow Discharge Spectrometry (GDS) ................................................................ 95
4.5 Hardness Tests .......................................................................................................... 95 4.5.1 Macrohardness .................................................................................................... 95 4.5.2 Microhardness .................................................................................................... 96
4.6 Tensile Tests ............................................................................................................. 96 4.6.1 5% Plastically Deformed and Strain aged at 300oC ........................................... 98
4.7 Charpy Tests. ............................................................................................................ 99 4.8 Slow Blunt Notch Bend Tests ................................................................................ 102 4.9 Crack Tip Opening Displacement (CTOD) ............................................................ 104
4.9.1 Test Specimens ................................................................................................. 105 4.9.2 Fatigue Precracking .......................................................................................... 105 4.9.3 Potential Difference Technique ........................................................................ 106
4.9.4 Testing .............................................................................................................. 107 4.10 Fractography ........................................................................................................... 109
Chapter 5 - Results - Materials Characterisation. ................................................................ 111
5.1 Introduction ............................................................................................................ 111 5.2 Results .................................................................................................................... 112
5.2.1 Microstructure .................................................................................................. 112 5.2.2 Inclusion Analysis ............................................................................................ 113 5.2.3 Glow Discharge Spectrometry (GDS) .............................................................. 115
5.2.4 Macrohardness .................................................................................................. 115 5.2.5 Microhardness .................................................................................................. 117
5.3 Discussion ............................................................................................................... 118 5.3.1 Microstructure .................................................................................................. 118 5.3.2 Hardness Tests .................................................................................................. 119
5.4 Conclusions ............................................................................................................ 123 Chapter 6 - Results - Tensile and Charpy Tests. ................................................................. 125
6.1 Introduction ............................................................................................................ 125 6.2 Results .................................................................................................................... 125

P a g e | III
6.2.1 Tensile Testing ................................................................................................. 125 6.2.2 Analysis of Charpy Tests .................................................................................. 130
6.3 Fractography ........................................................................................................... 133 6.3.1 Tensile Tests ..................................................................................................... 133 6.3.2 Charpy Tests ..................................................................................................... 134
6.4 Discussion ............................................................................................................... 136 6.4.1 Tensile Testing ................................................................................................. 136 6.4.2 Charpy Tests ..................................................................................................... 141
6.5 Conclusions ............................................................................................................ 147 Chapter 7 - Results – Slow Notched Bend Tests. ................................................................ 149
7.1 Introduction ............................................................................................................ 149 7.1.1 Results .............................................................................................................. 150
7.2 Fractography ........................................................................................................... 153 7.3 Discussion ............................................................................................................... 155
7.3.1 Blunt Notch Tests ............................................................................................. 155 7.3.2 Previous proposed model for cleavage fracture in C-Mn weld metal. ............. 155
7.3.3 Static strain ageing effect on cleavage fracture. ............................................... 156
7.3.4 Plastic deformation and strain ageing in low alloy ferritic steel weld metal. ... 157
7.3.5 Relative position between maximum principal tensile stress (σyymax) and the cleavage initiation site. ................................................................................................... 159 7.3.6 Relationship between inclusion size and local cleavage fracture stress, σX0. .. 161
7.4 Conclusions ............................................................................................................ 162 Chapter 8 - Results - Crack Tip Opening Displacement (CTOD) Tests. ............................ 164
8.1 Introduction ............................................................................................................ 164 8.2 Results .................................................................................................................... 164
8.2.1 Fatigue pre-cracking. ........................................................................................ 164 8.2.2 CTOD Results for Weld No1. ........................................................................... 165
8.2.3 CTOD Results for Weld No2. ........................................................................... 167
8.3 Fractography ........................................................................................................... 169 8.4 Discussion ............................................................................................................... 171
8.4.1 CTOD values. ................................................................................................... 171 8.4.2 Modelling Cleavage Fracture. .......................................................................... 173
8.4.3 δ-R Data Validity .............................................................................................. 174 8.4.4 Fractography. .................................................................................................... 176
8.5 Conclusions ............................................................................................................ 178 Chapter 9 - General Discussion. .......................................................................................... 179
9.1 Introduction ............................................................................................................ 179 9.2 Comparison of impact transition curves and CTOD values. .................................. 179
9.3 Trends between Weld No1 and Weld No2 .............................................................. 182 Chapter 10 - Conclusions and Suggestions for future work. ............................................. 185
10.1 General Conclusions ............................................................................................... 185 10.2 Suggestions for Future Research ............................................................................ 188
Chapter 11 - References ..................................................................................................... 190

P a g e | 1
Chapter 1 - Introduction.
The nuclear power industry has been developing and improving designs for reactor pressure
vessel (RPV) technology for over 50 years. In the past 30-40 years the importance of the
design against brittle failure has been emphasised, as failure of this nature is catastrophic.
Structural integrity of engineering structures is of fundamental importance for safe operation,
as in-service failures may result in widespread damage and fatalities. Considerable effort is
made to ensure that components can resist failure under every condition and operation, e.g.
start-up, normal, loss of coolant (LOCA) and shutdown [1-6]. Around the world, 31 countries
have a combined total of 440 commercial nuclear reactors. About 22% of the electricity
produced in the UK today comes from nuclear power stations, with a quarter of these being
Magnox reactors. The expected service life of these reactors was originally 20 to 25 years,
however all but one of these plants has exceeded its projected life. The continued operation
and the future of nuclear power plants depends on many issues arising from day to day
operation and maintenance to plant ageing, with the most important factor being the continued
safe operation of the nuclear plants. The main mechanisms affecting the ageing of the lifetime
operation of the nuclear reactor is neutron embrittlement [7, 8].
The nuclear industry has been improving technology from the first commercial concept,
Calder Hall in 1956 which had prototype reactors called “Magnox Gas Cooled Reactors” and
following successful operation nine full scale Magnox power stations were built in the UK, as
well as one each in Italy and Japan. Out of these eleven, three have now been
decommissioned. From the original Magnox concept, there have been new designs and
developments of light water technology. Pressurized water reactors (PWR) and advanced
boiler water reactors (ABWR) have been built in the USA and Japan. A large proportion of
contemporary nuclear power is supplied by light water reactors whose cores are contained
within RPVs, and which must safely operate at temperature of ≈290oC [6, 9-11] and pressures
of ≈7MPa in a BWR and ≈14MPa in a PWR. Other nuclear technologies are CANDU
(Canada Deuterium Uranium) based on natural uranium moderated and cooled by heavy

P a g e | 2
water, experimental pebble bed modular reactor (PBMR) and advanced gas cooled reactors
(AGR), of which there are seven in the UK. Some of these technologies are already active
and producing electricity, bringing advantages of low capital investment, modular
construction, reduced construction time and increased efficiency.
Over the last 40 years research has been carried out worldwide in to the modelling of neutron
irradiation and more recently emphasis has been placed on the understanding the mechanisms
that cause embrittlement. The assessments of nuclear power plant standards are monitored by
the UK regulatory regime, whose main objective is to continually assess and monitor the
effects of neutron irradiation on the mechanical and fracture properties of materials within the
plant.
Surveillance programmes monitor the effects on mechanical and fracture properties of neutron
irradiation of the pressure vessel steel (RPV). Neutron irradiation causes an embrittlement
process, which consequently results in an increase in the ductile-to-brittle transition
temperature (DBTT) and decease in fracture toughness properties, e.g. ductility. Surveillance
programmes highlighted with some concern that submerged-arc welds were the most severely
affected areas of a vessel, and have resulted in the adjustment of operational parameters of
some plants to offset the effects of embrittlement.
The efficiency of a nuclear power plant is governed by the maximum temperatures and
pressures that can be safely maintained. Safe operation of a reactor pressure vessel is
governed by maintaining the temperature and pressure within set margins relative to their
maximum values. In the UK, these parameters are established by considering both resistance
to plastic collapse and brittle fracture using the R6 failure assessment diagram (BS 7910) [12].
The assessment uses information on the size of defects assumed to be present in the vessel,
operating stresses, tensile properties of the pressure vessel steel and temperature dependence
of fracture toughness of the particular steel. Tensile properties can be ascertained from
surveillance programmes of the irradiated material; however the temperature dependency of

P a g e | 3
fracture toughness for irradiated material has to be derived from comparing start-of-life
material to irradiated materials removed during the surveillance programme. However, such
programs are limited by the amount of materials that can be removed, due to the difficulty
involved in the acquisition of the specimens as well as the high costs involved. Due to this
lack of relevant data large uncertainties can occur as these are an important factor in achieving
accurate embrittlement trend equations.
This thesis attempts to address some of these issues in the structural integrity assessment of a
Pressurised Water Reactor (PWR) vessel. The particular weld metal investigated closely
matches the start-of-life properties of the “Sizewell B” pressurised water reactor,
commissioned by the Nuclear Installations Inspectorate (NII HSE) and produced by ESAB
Group UK. The effects of irradiation were simulated by a prestraining treatment; this process
permitted unlimited use of large numbers of sample pieces tested under various conditions to
assess the changes in flow and toughness properties. The programme was set up to investigate
the effects of material microstructure, prestraining and static strain ageing of mechanical
properties of the weld metal. This series of experiments follow on from previous programmes
which had studied the effects of microstructure and prestraining on the mechanical properties
of carbon-Manganese steel (C-Mn steel) weld metal, similar to that used in Magnox type
reactors. The preceding tests were carried out in work by Novovic [13] and also work carried
out by both Wenman [14], using a simulated Mn-Mo-Ni weld metal produced by the TWI,
and do Patrocinio [15], who used a similar A533B weld. These studies were commissioned by
the NII and all the studies revealed a difference in the toughness of the weld metal, between
the as-deposited and reheated microstructural regions.
Mechanisms of neutron embrittlement in low alloy ferrite steels such as MnMoNi weld metal
are reviewed in Chapter 2. Also presented are other known embrittlement mechanisms, such
as dynamic and static strain ageing. They are compared to rationalise the use of cold
deformation to simulate irradiation embrittlement. The submerged-arc welding process is
reviewed in this chapter, as well as the weld pool solidification process and solid phase
P a g e | 4
transformations that lead to the final microstructural constituents of the weld pool. The effects
of alloying elements on the final weld microstructure are also considered.
Chapter 3 outlines the Linear Elastic Fracture Mechanics (LEFM) and Elastic Plastic Fracture
Mechanics (EPFM), whilst presenting the concept proposed by Griffith and the extension of
this theory by Orowan-Irwin. Also reviewed are the microscopic models for cleavage failure
proposed by Cottrell, Smith, Stroh and Ritchie-Knott-Rice (RKR) model for fracture criteria.
Chapter 4 describes the different experimental procedures and techniques which were
preformed throughout this thesis, including the cold deformation and thermal ageing
procedures employed as well as Charpy Impact testing, Crack-Tip Opening Displacement,
CTOD, tensile testing and Blunt notch testing.
Chapter 5 describes the material characterisation of the different weld metal samples
presented within this thesis. Discussing the results obtained from Energy Dispersive X-ray
analysis (EDX), Glow discharge spectrometry (GDS), both macro and micro hardness testing
and inclusion analysis.
The effects of the strain hardening and thermal ageing of the weld metal are compared with
the as-received weld metal with respect to various microstructures as well as the flow
properties of the material and the Charpy energy absorbed are presented in Chapter 6.
Chapter 7 reports the effects of the prestraining and ageing treatment on the fracture
resistance by calculating the intrinsic local cleavage fracture stress.

P a g e | 5
Chapter 8 examines the effects of prestraining and ageing on the fracture toughness of the
weld metal, assessed in terms of CTOD) across a wide temperature range, -196oC to room
temperature, Assessing the fracture toughness for both the microstructures and in both
conditions; As-deposited As-received: ADAR, Reheated As-Received: RHAR, As-deposited
5% strain and statically aged: AD5%SA and Reheated 5% strain and statically aged:
RH5%SA.
A general discussion of the effects of prestraining and static strain ageing on the mechanical
properties of the weld metal are presented in Chapter 9. Chapter 10 summaries the main
conclusions found in this work.

P a g e | 6
Chapter 2 - Literature Review.
2.1 Pressurized Water Reactor
The pressurized water reactor (PWR) is a generation II nuclear power reactor that uses
ordinary water under high pressures as a coolant and neutron moderator, with the primary
coolant loop kept pressurized to prevent the water from boiling. PWRs are the most common
type of commercial reactor in the world, and were originally designed by Bettis Atomic
Power Laboratory in the USA for naval use, especially submarine propulsion. The first
nuclear submarine of this type was the Nautilus, launched in 1945 and the vessel remained in
service until 1983. More than 60% of the world’s commercial reactors are PWRs, with the
rest being gas-cooled or heavy-water reactors. The world’s first fully operational reactor was
demonstrated at Oak Ridge, USA. The X-10 graphite pile was designed and built within ten
months and went into operation in November 1943. The pile was built to irradiate natural
uranium to produce plutonium which could be recovered and purified. This plutonium was
used to produce the second Atomic Bomb developed, which was dropped onto the city of
Nagasaki, Japan on August 9 1945. In 1953, the world’s first commercial nuclear power
station, Calder Hall was under construction in the UK and connected to the grid in 1956 [16].
Calder Hall was the prototype for reactors called “Magnox Gas Cooled Reactors” and
following the success of Calder Hall nine full scale power stations were built in the UK, as
well as one in Italy and Japan. These stations use natural uranium metal, encased in non-
oxidising magnesium alloy (hence the MagNOX acronym) as fuel and carbon dioxide as the
gaseous coolant.
In 2005, world-wide nuclear generation capacity was approximately 381 Gigawatt days,
which corresponds to approximately 16% of the world’s electricity generation. As of October
2005 there were 441 nuclear reactors currently known to be operating in 34 countries, with a
further 30 planned in 11 countries, notably in China, South Korea and Russia. The UK

P a g e | 7
currently has a total of 23 reactors on 12 sites providing approximately 20% of the UKs
electricity supply. A map showing the current locations around the world is shown in Fig. 2.1
A nuclear reactor works by allowing fissile materials in the nuclear fuel to become engaged in
a chain reaction in the reactor pressure vessel; energy is released continuously by a fission
process maintained within the reactor core. Large amounts of heat are released; this heat
energy is transferred from the core via a circuit of normal light water which acts as a both the
moderator and coolant through the reactor. This primary coolant loop is pressurised so that
the water does not boil. The water within the reactor core reaches temperatures of
approximately 325oC, remaining liquid under approximately 150 times atmospheric pressure
(≈150 bar). The more modern reactors use uranium dioxide (UO2) enriched to 3.2%. This
allows higher “burn up” (energy release) from the fuel and the ceramic UO2 pellets are
contained within Zircaloy (zirconium alloy) tubes. Within the reactor core, the primary
cooling circuit is a neutron moderator, so if any of the water turned to steam the fission
reaction would slow down; this negative feedback effect is called a negative void coefficient,
and is one of the main inbuilt safety features of a PWR. Many PWRs have a secondary
shutdown system which involves injecting a strong neutron absorber such as boron, into the
primary circuit, as shown in Fig. 2.2 and 2.3. Boron is also routinely added into the primary
coolant water during normal operation as this allows more enriched fuel to be used, increasing
the potential “burn up” for the fuel in the reactor. However, a drawback to this is it makes the
cooling water corrosive. The heat raised in the reactor is passed from the primary to a
secondary coolant circuit via heat exchangers, where the energy is converted to steam at
approximately 70 bar and 280oC. The high-pressure steam then drives the turbine to produce
electricity, the steam than condenses back into water and returns to the heat exchangers by the
primary coolant loop. The thermal efficiency is approximately 32% and with the design is
also inherently safer than those of boiling water reactors (BWR).
Sizewell B is located in Leiston, Suffolk and is the only commercial pressurized water
reactor, PWR, within the UK. Construction of Sizewell B started in 1987 and the power
station was finished in 1994, when it was connected to the main electric grid, originally

P a g e | 8
designed for a commercial life of 40 years; around 2035, although similar stations elsewhere
in the world have been granted extensions to a total of 60 years. The site is owned and
maintained by British Energy, who also own mainly nuclear sites in the UK; including
Hinkley Point B and Hunterston B. Sizewell B can produce a maximum of 1200 MW and
works continuously throughout the year generating electricity for more than 1.5 million
people and supplies 3% of the UK’s total energy needs.
An aerial view of Sizewell B is shown in Fig. 2.4 and the reactor is contained within a
concrete biological shield and that is contained within further secondary containment. The
casing acts a radiation shield and is designed to prevent the release of radioactivity into the
environment. The design is very compact compared to earlier reactors as water is a more
effective moderator than graphite. Thermal energy produced by the reactor system is carried
away by pressurised water; the thermal energy is used to create steam in the secondary water
circuit and passed through two turbines. Each turbine comprises of one high-pressure
cylinder and three low-pressure cylinders, driving a 62.5 MW generator, operating at 23.5 kV,
which is then raised to 400 kV, to be supplied to the national grid. As with many other
PWRs, Sizewell B was intended to be operated on an 18 month operating cycle, at around
100% continuously for around 17 months and followed by a month’s shutdown for
maintenance and refuelling. PWR vessels have a cylindrical shell design; ranging from 3.0-
5.0 metres in diameter and range from 12-15 meters in height. The thickness of the reactor
pressure vessel is around 0.25 meters and is subjected to multi-axial loading. It is designed to
withstand hostile environments, accidents and changes in transient conditions by decreasing
temperatures or pressure. The reactor pressure vessel is made from nuclear grade steel
forgings. These forgings are welded together using a submerged-arc process.

P a g e | 9
2.2 Neutron Embrittlement of Reactor Pressure
Vessel (RPV Materials)
The reactor efficiency is governed by the high internal temperature of fluid, which is also at
relatively high internal pressures. The vessel material must not only be resistant to this hostile
environment, it must also be resistant to the constant bombardment of high-energy neutrons
radiating from the enriched uranium-235 enriched fuel, as well as the alpha α, beta β and
gamma γ radiation of uranium isotopes and fission products. When the high-energy neutrons
pass through the weld belt-line, plate and forgings of the pressure vessel; they cause very
intense but local damage, which may cause the steel atoms to be displaced from their normal
position. When the first Magnox power stations were build the effect and mechanisms of
irradiation embrittlement on welds were not well understood. At the normal operating
temperature of the reactor pressure vessel (RPV) these displaced atoms can quickly return to
their position, however there is a small change in the atomic structure of the remaining steel.
Thus over the operating life of the RPV, which can be many years, even decades these small
changes can accumulate to result in significant changes in mechanical properties, as a
consequence of embrittlement of the steel. Despite this effect there are very few models
physically based explaining or clarifying the underlying mechanisms of neutron
embrittlement in RPV steels. It is well understood that the material’s strength usually
increases under these conditions, which by itself is not necessarily a deleterious effect,
however the increase in strength also causes a loss in the material’s toughness, Fig. 2.5.
Neutron irradiation effects the material by raising the ductile-to-brittle transition temperature
and reducing the toughness. Clearly this increasing brittleness will change the safe
operational limits of the materials according to the R6 procedure [12, 17].
The changes in the properties of the RPV can be monitored through surveillance programmes
which measure the shifts in ductile-to-brittle transition temperatures (DBTT) and the upper
shelf energy (USE) level reduction using Charpy impact tests. Thus start of life properties
need to be accurately defined in terms of Charpy impact transition curves, transition
temperatures are compared at 40 or 41J. These values originate from the nil ductility

P a g e | 10
temperature of Pellini drop weight test used on ship steel plate from the World War II Liberty
ships where 28J occurs at the nil ductility temperature, Fig. 2.6 [18]. This is the equivalent
value of 30 ft. lb (40.7J) [19] therefore has found favour within the nuclear industry for the
same reason, i.e. it occurred at the nil ductility temperature of commonly used higher strength
steels for nuclear RPV’s. The nuclear industry found acceptance in the relationship between
the transition temperature at 40J (∆T40J) showing an equal temperature shift at 100 MPam½
for fracture toughness tests [19].
The RPV can tolerate modest reductions in toughness without any loss of integrity, due to the
conservative design codes, however large changes must be avoided. The materials and the
weld metals which go into constructing the RPV are selected to minimise the effects of
neutron embrittlement and today most weld metals used in the fabrication of the RPV have
better toughness then the steel plates they weld together. Early weld metals contained trace
amounts of copper in their composition, which made the weld more sensitive to the effects of
neutron irradiation then the steel plates. Shown in Fig. 2.7 displays the change in toughness
in a submerged arc weld metal with 0.23% copper content, due to the neutron embrittlement
as an example, the sample was tested by workers at the Oak Ridge National Laboratory [20].
The figure shows the copper contribution remains unchanged after the development of the
maximum value, it can also be seen that the position of the plateau increased with a
corresponding increase in copper content. This example demonstrates that for materials with
a high copper content, a higher shift in Charpy Impact toughness from neutron irradiation is to
be expected. As the weld metal strength increases, the impact toughness transition region
shifts to higher temperatures by nearly 100oC and the upper shelf impact toughness is reduced
by 1/3. There are several different regulations that limit the upper shelf energy and transition
temperatures; if either of these limits is projected to be exceeded then additional analysis may
be required. In some cases the continued operation of the power plant can not be justified due
to the levels of embrittlement, without reducing the embrittlement by thermal annealing.

P a g e | 11
2.2.1 Safety concerns about the introduction of PWR’s in the UK.
The British government during the 1970’s considered nuclear power as a clean method for
providing the future power requirements in the UK. The Central Electricity Generating Board
(CEGB) favoured introducing a PWR, as of the type used in the USA and marketed by the
Westinghouse Electric Corporation; however there was a debate in the UK over the safety of
such reactors. Two particular issues were raised:
1. In the event of a major rupture of the primary cooling circuit, would the emergency
core-cooling water system (ECCS) be able to prevent the nuclear fuel elements
overheating, melting and releasing their fission products?
2. Could the pressure vessel, which contains the nuclear core fail catastrophically?
The Nuclear Health and Safety Executive Nuclear Installations Inspectorate (HSE NII) were
asked to investigate these concerns by the government. The Marshall Report [21] states that
failures of such a structure can occur by two distinct mechanisms; non-ductile failure and
ductile failure.
2.2.1.1 Non-Ductile Fracture
The first of these mechanisms is termed non-ductile fracture and used to describe mechanisms
in which plastic collapse through the section thickness does not occur before the structure
fails.

P a g e | 12
2.2.1.2 Ductile Fracture
This second mechanism occurs when a section of a structure is stressed to a level beyond the
ultimate stress of the material, thus the material is yielding plastically and permanently
deforming. The material begins to deform more and more, resulting in the load bearing area
being reduced further and eventually to the material breaking.
Non-ductile fracture formed part of a research programme, which is still in progress today.
The issues were raised by Sir Alan Cottrell, the then Government Chief Scientist, and he
recognised that the likely failure of a pressure vessel of the Westinghouse type of PWR was
“rapid fracture” or non-ductile. The term rapid fracture implies failure extending from a
crack, which is smaller than the wall thickness of the vessel, and growing in an unstable
manner within the pressure vessel wall. This can occur in sections that are thick enough to
produce plain strain conditions, which is possibly within the Westinghouse design. As a
result of this, the “leak-before-break” scenario, a safety feature of the vessel leaking before
catastrophic failure occurs, is not available. This means the critical size of defect e.g. another
flaw or crack, of sufficient size to propagate in an unstable manner, for a given wall thickness
of the pressure vessel must be determined, and a method found to allow detection by non-
destructive testing methods.
2.2.2 Further Safety Concerns: The Loss of Coolant Accident
(LOCA)
Attention was paid to accidents which could possibly occur during the operation of the RPV
and could question the integrity of the vessel. One such accident is LOCA-loss of coolant
accident, the most severe form is accompanied with rupture of the primary coolant pipe, such
that the pressure within the primary cooling system falls instantly to atmospheric and the
coolant temperature drops from 291oC within the next 45 seconds. This sudden
depressurisation is accompanied by a sharp thermal gradient, which is of significant

P a g e | 13
importance as the possibility of RPV material decreasing in temperature from the upper shelf
to a transition region temperature could allow for unstable brittle fracture of a pre-existing
flaw; the driving process is thermal shock of the vessel. Mechanisms of fracture become
more important because the reactor pressure vessel is ageing in service and the temperature at
which brittle fracture can occur increase with the increasing irradiation dose. A loss of
coolant incident has a more significant effect by allowing the core to become uncovered (i.e.
no heat removal from the fuel modules), thus leading to possible melt down of the reactor.
2.2.3 Micromechanics of Irradiation Embrittlement
Research carried out into irradiated steels of the type used for making reactor pressure vessels
has identified three main micromechanisms of irradiation embrittlement [1, 9, 11, 22-31]
1. Precipitation damage through the formation of copper-rich precipitates, direct
evidence of copper-rich precipitates; leading to the formation of precipitates or
clusters, which are enhanced with Cu, Mn, Ni and Si, have been obtained using
various microstructural techniques (transmission electron microscopy (TEM),
scanning transmission electron microscopy and small angle neutron scattering, etc.) [1,
4, 5, 23, 32-36].
2. Formation of point defect clusters (cluster of vacancies and interstitials) and
dislocation loops (due to fine scale of this matrix damage, the direct evidence is
hindered; the effect is inferred through changes in mechanical properties). The effect
of matrix damage is reflected in an increase in the athermal part of lattice friction
stress component of yield stress [30, 37, 38].
3. Irradiation induced/ enhanced segregation of impurity elements (such as phosphorus)
to grain boundaries [5, 26, 27, 30, 39].
The first two mechanisms harden the material; therefore there is an increase in the yield
strength, while the third mechanism decreases the fracture strength. The last two effects are

P a g e | 14
also a consequence of the first, meaning that in unirradiated steel both phosphorus segregation
and copper precipitation occur at high temperatures, around 500oC, compared to the operating
temperature of a reactor pressure vessel. Therefore, the increased concentration of vacancies
caused by high-energy neutrons increases the diffusion of copper and phosphorus and as a
result the phenomenon can occur at lower temperatures.
Reactor pressure vessel (RPV) steels, operating at temperature 280oC are exposed to low-dose
neutron irradiation which is known to result in hardening and embrittlement and which
contributes to the production of radiation damage defects. Although there have been
numerous investigations, the matrix component of damage has not been identified, it is
currently thought that it consists of sub-microscopic vacancy-impurity complexes or impurity
stabilized microvoids.
2.2.4 Radiation Damage Dislocations in Ferritic/ Martensitic
Steels
The type of steel being used in this study is affected by irradiation at temperatures below
400oC as a consequence both hardening and embrittlement are effected. Irradiation damage
accumulation in steels is much slower than in some other metals and this damage takes the
form of defect clusters of interstitials, vacancies, and dislocation loops, which appear as small
black or white dots when using TEM, dependant upon the imageing conditions. Dislocation
loops or second phase particles are generally greater than 5nm in length, smaller dislocation
loops have Burgers vectors of 111
2
1=b, for larger loops these have a Burgers vector of
100=b . These loops are interstitial in nature. Voids or bubbles may be resolved at higher
doses, while vacancy clusters do not resolve at lower doses.

P a g e | 15
2.2.5 Interactions Between Dislocations and Irradiation-Induced
Defects
Dislocations move producing slip when sufficient external force is applied to the material.
Within a bcc lattice, slip occurs in the 111 close-packed direction the corresponding
Burgers vector is [ ]111
20
a
, this is a common direction in any of the following plane: (110),
(112) and (123). Slip has been found to occur on (110), (112) and (113) planes in iron. While
the slip plane is generally (110), there are three (110) type planes that intersect the [111]
direction. Within the body-centred cubic lattice (111) planes are close-packed and intercept
more atoms than any other. Screw dislocations with Burgers vectors of [ ]111
20
a
may move
at random onto one of the (111) planes with a high resolved shear stress. This phenomenon is
the source of a poorly defined slip plane in iron [40].
Cottrell [41, 42] proposed a dislocation reaction in a bcc lattice, which appears to lead to the
formation of immobile dislocations; this reaction has been shown to be a mechanism for
producing a crack nuclei that may lead to brittle fracture. Shown in Fig. 2.8, dislocation A
with Burgers vector [ ]111
20
a
is moving on the plane (101), whilst intersecting with B with
a Burgers vector of [ ]111
20
a
and gliding on an intersecting plane of( )110 . The two
dislocations come together and react to lower the strain energy by providing a pure edge
dislocation which lays on the (001) plane.
[ ] [ ] [ ]0011112
1112 0
00 aaa
=+ . . .(2.1)

P a g e | 16
The dislocation is immobile since the (001) plane is not a close-packed slip plane in the bcc
lattice. The (001) plane is the cleavage plane along which brittle fracture occurs [40]. There
has been extensive research into dislocation interactions, using various methods such as
atomistic modelling and in-situ TEM, this has mostly been carried out on fcc metals. This
research has concluded that screw dislocations are more effective than edge dislocations at
removing defects; however the defect is not destroyed by the interaction with just one
dislocation. The stress required for a dislocation to break free from a defect can be
determined from its curvature prior to breaking away. A range of strengths may be presented
dependant on the obstacle’s interface/ interaction with the matrix, this is reflected by different
interactions geometries and interactions with different defect types. In contrast very few
studies have been carried out in ferritic materials, which present more of a problem from an
experimental point of view (difficulty in observing ferromagnetic materials using an electron
microscope) and theoretically (difficulty of developing a reliable potential for atoms with
magnetic moments). However, TEM observations by Nogiwa [43] of movement of edge
dislocations through ultrafine obstacles (believed to be small Cu precipitates) in a Fe-Cu
alloy, and made estimates of obstacle strength.
2.2.6 Forces of Dislocations
A slip line forms when a dislocation moves when there is a force acting on it (shear stress τ),
this moves the dislocation in the direction of its Burgers vector, shown in Fig. 2.9. An
element of the dislocation line ds is moved in the direction of slip normal to ds by an amount
dl [40]. The area swept by the element is dl ds. The crystal is displaced by (ds dl/A)b, which
is a comparison of the amount about the slip plane relative to the amount below, where A is
the area of the slip plane. Thus the work done by the applied force creating the applied stress
τA, when increment of slip occurs

P a g e | 17
bA
dsdlAdW
= τ . . .(2.2)
and
bdsdl
dWF τ==
. . .(2.3)
where F is the force per unit length of dislocation line.
The dislocation line is perpendicular to the force and it is constant at any point selected along
the line, if τ is constant, then the Burgers vector is constant along a curve dislocation line,
resulting in the force on a dislocation not necessarily in the same direction at the applied
stress.
2.3 Material Requirements
The environmental and operating conditions to which reactor pressure vessel (RPV) materials
are subjected to during the operational lifetime are very severe. The specification of the
material is such that it cannot fail by either ductile or plastic collapse mechanism, by a brittle
catastrophic failure mechanism. For this to be achieved standards for the material are set by
nuclear regulatory guidelines [33, 44] and design codes (e.g. ASME Boiler and Pressure
Vessel Code) [45, 46] must be followed during the design and operation of the components.
Hence, within these guidelines fracture toughness is an essential material property and
therefore carefully considered in the selection of material. It is not feasible to discuss design
codes without first defining the yield stress and the fracture toughness. The yield stress is the

P a g e | 18
point at which a material stops behaving in an elastic manner according to Hooke’s Law and
begins to deform plastically, i.e. it no longer returns to its originally shape. Fracture
toughness is simply a measure of the material’s resistance to fracture in the presence of a
sharp pre-crack. This is explained and examined in further detail in Chapter 3. For fracture to
occur under linear elastic conditions, which is essentially the brittle type of fracture, then the
stress intensity factor, K, of the material must not exceed the fracture toughness values or
critical values, KIC. KIC corresponds to the stress at the crack tip needed to cause failure or
fracture on Mode I opening (pure tension) whilst under plane strain (triaxial stress state)
conditions. As a consequence, the material for the RPV needs to operate within defined
maximum and minimum levels for both operating temperatures and pressures. These values
are defined by the design codes and guidelines (e.g. ASME codes) [45, 46], in order to avoid
either plastic collapse or rapid failure. Some of the materials chosen for RPV are known as
A508 and A533B steel for plate and forging materials, these alloys are chosen as they are
relatively low cost ferritic steels with yield and tensile strengths not high enough to promote
catastrophic brittle failure but strong enough that plastic collapse is avoided. The steel’s
chemical composition is closely controlled, keeping levels of certain elements low, such as
Ni, P and Cu, due to their embrittling effects during irradiation. Following neutron irradiation
exposure, possible mechanical changes are monitored through surveillance programs
throughout the operational life of the reactor pressure vessel using Charpy impact test on
specimens removed from the base, weld and heat-affected zones of the material.
2.4 Cold Deformation
Irradiation embrittlement can be characterised by one embrittling mechanism (segregation of
impurity elements at grain boundaries) and two hardening mechanisms (matrix damage and
copper precipitation). Designing a simulation treatment that would produce similar
mechanical behaviour to that of irradiated material is both complex and difficult due to these
micromechanisms [13, 14].
P a g e | 19
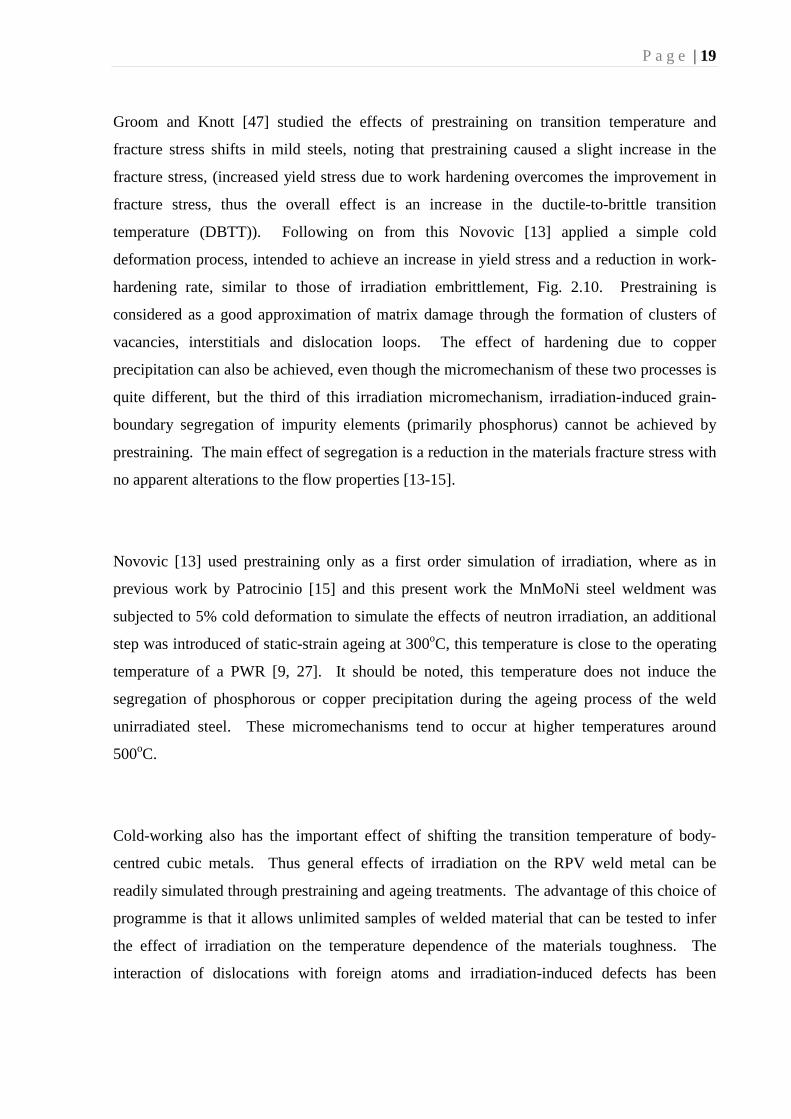
Groom and Knott [47] studied the effects of prestraining on transition temperature and
fracture stress shifts in mild steels, noting that prestraining caused a slight increase in the
fracture stress, (increased yield stress due to work hardening overcomes the improvement in
fracture stress, thus the overall effect is an increase in the ductile-to-brittle transition
temperature (DBTT)). Following on from this Novovic [13] applied a simple cold
deformation process, intended to achieve an increase in yield stress and a reduction in work-
hardening rate, similar to those of irradiation embrittlement, Fig. 2.10. Prestraining is
considered as a good approximation of matrix damage through the formation of clusters of
vacancies, interstitials and dislocation loops. The effect of hardening due to copper
precipitation can also be achieved, even though the micromechanism of these two processes is
quite different, but the third of this irradiation micromechanism, irradiation-induced grain-
boundary segregation of impurity elements (primarily phosphorus) cannot be achieved by
prestraining. The main effect of segregation is a reduction in the materials fracture stress with
no apparent alterations to the flow properties [13-15].
Novovic [13] used prestraining only as a first order simulation of irradiation, where as in
previous work by Patrocinio [15] and this present work the MnMoNi steel weldment was
subjected to 5% cold deformation to simulate the effects of neutron irradiation, an additional
step was introduced of static-strain ageing at 300oC, this temperature is close to the operating
temperature of a PWR [9, 27]. It should be noted, this temperature does not induce the
segregation of phosphorous or copper precipitation during the ageing process of the weld
unirradiated steel. These micromechanisms tend to occur at higher temperatures around
500oC.
Cold-working also has the important effect of shifting the transition temperature of body-
centred cubic metals. Thus general effects of irradiation on the RPV weld metal can be
readily simulated through prestraining and ageing treatments. The advantage of this choice of
programme is that it allows unlimited samples of welded material that can be tested to infer
the effect of irradiation on the temperature dependence of the materials toughness. The
interaction of dislocations with foreign atoms and irradiation-induced defects has been
P a g e | 20
discussed and several studies carried out [3, 30, 33, 48-50]. Dislocation theory has been used
to give a qualitative picture of solid-solution hardening (C and N mechanisms in irradiated
RPV steel) and explaining strain ageing mechanisms and yield point behaviour. However the
neutron irradiation atmosphere causes point defect clusters to form (clusters of vacancies and
interstitials) as previously discussed.
Forming operations can have an influence on the materials responses and influenced by the
strain rate at which it is being deformed. For practical purposes the rate of strain can be
considered to have little effect because for cold working a change in strain of several orders of
magnitude would results in only a 20% increase in the flow curve. There is a well established
phenomenon known as the Bauschinger effect [40, 51] which is common in polycrystalline
metals which have been deformed plastically, e.g. cold-worked. It states that a lower stress
(σbys) was needed to reverse the slip direction on a certain plane than to continue slip in the
original direction (σcys), shown in Fig. 2.11.
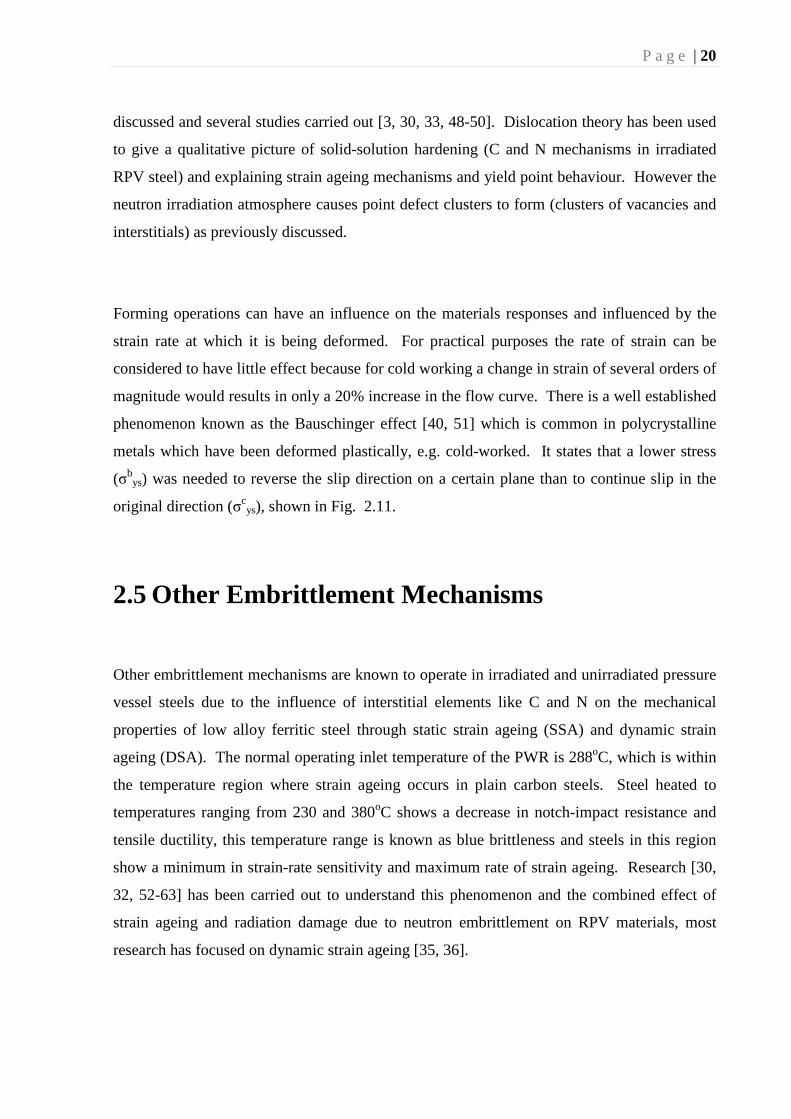
2.5 Other Embrittlement Mechanisms
Other embrittlement mechanisms are known to operate in irradiated and unirradiated pressure
vessel steels due to the influence of interstitial elements like C and N on the mechanical
properties of low alloy ferritic steel through static strain ageing (SSA) and dynamic strain
ageing (DSA). The normal operating inlet temperature of the PWR is 288oC, which is within
the temperature region where strain ageing occurs in plain carbon steels. Steel heated to
temperatures ranging from 230 and 380oC shows a decrease in notch-impact resistance and
tensile ductility, this temperature range is known as blue brittleness and steels in this region
show a minimum in strain-rate sensitivity and maximum rate of strain ageing. Research [30,
32, 52-63] has been carried out to understand this phenomenon and the combined effect of
strain ageing and radiation damage due to neutron embrittlement on RPV materials, most
research has focused on dynamic strain ageing [35, 36].

P a g e | 21
Strain ageing is associated with yield-point phenomenon; the metal exhibits an increase in
strength as well as a decrease in ductility on heating at relatively low temperatures preceding
cold working. Strain ageing is a fairly common phenomenon in body centred cubic metals.
Strain ageing also produces a low value of strain-rate sensitivity as well as increasing the
yield stress and seeing the appearance of the yield point. This can be subdivided into dynamic
strain ageing (DSA) and static strain ageing (SSA).
Within the plastic zone ahead of the crack tip strain ageing may occur. This can be static
strain ageing, as the material has already been plastically deformed and then aged. It can also
have a dynamic component as ageing occurs when the plastic zone is exposed to creep
deformation. BCC metals are prone to strain ageing when interstitial atoms such as N and C,
are present in sufficient quantities. Strain ageing is caused by elastic interaction between
dislocations and interstitial atoms. BCC metals and alloys can exhibit extreme sensitivity to
small additions of interstitial atoms. Solute atoms collect around dislocations and pin them in
one place. In order to free the pinned dislocation an increase in stress is required. This
increase in stress is greater than normally required to move the dislocation due to having to
overcome increased pinning by solute atoms and the stress increases with plastic strain. With
the continuation of plastic deformation the density of mobile dislocations increases. Also
there is an increase in interactions between solute atoms and mobile dislocation.
Both static and dynamic strain ageing in steels are a result of interactions between dislocation
and interstitial solute atoms, predominantly nitrogen and carbon. Low-carbon steels are
susceptible to strain ageing, this involves a gradual change in certain properties over time (e.g.
strength and hardness) after plastic straining. Both the static and dynamic strain ageing
mechanisms affect the plastic deformation or work hardening behaviour, as well as increasing
yield stress and decreasing ductility. Ageing is aided by temperature; at room temperature
ageing occurs slowly, while changes occur more rapidly at elevated temperatures, due to
increased diffusion rates. Strain ageing results in the reappearance of the upper yield point
and yield point elongation in the samples. Chakravartty [54, 55] carried out a study into the
kinetics of strain ageing, the result of which suggested that the strain ageing phenomenon is

P a g e | 22
controlled by an interstitial in solution, probably nitrogen. The microstructure did not appear
to have any influence on the changes in mechanical properties observed due to strain ageing.
A study of ASTM A533B Class 1 type of steels which had received a post weld heat
treatment, and exposed to ageing temperatures of 300 to 550oC was carried out. Charpy
impact testing indicated an increase in the ductile-to-brittle transition temperature (DBTT);
this was dependent on the original material, the heat treatment applied and the ageing time,
but had relatively little influence on the upper shelf energy, Fig. 2.12. It was also shown that
the primary cause of embrittlement upon ageing was segregation of phosphorus to the prior
austenite grain boundary over the ageing temperature range.
The dynamic strain ageing mechanism is rapid and occurs during the straining process,
whereas static strain ageing occurs slowly. Strain ageing is aided by elastic interactions
between interstitials and dislocations within steels, resulting in strong dislocation pinning.
Dynamic strain ageing occurs when the magnitude of strain is such that interstitials can
diffuse and then pin mobile dislocations. Segregations occur due to a rapid generation of new
dislocations and the stress increases, but once the dislocations are released the stress decreases
to sustain movement until interstitials diffuse and repin these dislocations. Due to the rapid
generation of dislocations this leads to inhomogeneous deformation. This is characterized by
serrated flow called Portevin-Le Chatelier effect (PLC). This effect can be characterised by a
decrease in the toughness resistance and may occur at room temperature or on heating at 230
to 380oC. The strain ageing phenomenon is related to the diffusion of free carbons and
nitrogen atoms to dislocations during the ageing process and these form new atmospheres of
interstitials anchoring the dislocations. These new interstitials are too small to be examined
by energy-dispersive X-ray (EDX) methods, so TEM is more suitable. It has been found that
the activation energy for the return of the yield point on ageing is similar to that for diffusion
of nitrogen and carbon in alpha iron [5, 54, 55, 64, 65].
It is widely accepted that this leads to discontinuous plastic flow in solution hardened alloys.
Yoon [66] noted that dynamic strain ageing occurs at certain test temperatures and strain
rates; this combined condition revealed serrated flow within the uniaxial stress-strain curve.

P a g e | 23
Under these specific conditions an increase of strength and a decrease of ductility can be
easily detected. Fig. 2.13 shows the temperature effect on flow curves of A533B steel at a
constant rate, revealing the existence of dynamic strain ageing. Other studies have
investigated the strain ageing process in low alloy ferritic steels, such as MnMoNi steels,
including A533B plate and A508B forging types, it has been reported that there is an
appreciable loss of fracture toughness of A533B RPV steel at elevated temperatures, this is a
result of strain ageing.
Dynamic strain ageing occurs within metals containing interstitial solute atoms, (e.g.
nitrogen). Such atoms interact with dislocations, increase work hardening rates, flow stress
and ultimate tensile strength (UTS). There is also an increase in the ductile-to-brittle
transition (DBTT), ductility decreases in terms of elongation, there are reductions in area,
fracture toughness, strain rate sensitivity coefficient and upper shelf energy. Research into C-
Mn steels carried out by Kim and Wagner [61-63, 67, 68] both observed that carbon and
nitrogen were the main interstitial species. It was also noted that the nitrogen content had a
greater influence than carbon on strain ageing of the material. The addition of interstitial
impurities, such as carbon and nitrogen, lead to the yield-point phenomenon in ferritic steels.
In turn serrated stress-strain curves (dynamic strain ageing, DSA) are observed. Sachdev [53]
studied DSA in various steels, concluding that high strength low-alloy and dual phase steels
show a smaller decrease in uniform elongation compared to plain carbon steels. Researchers
also observed the critical temperature for the appearance and disappearance of serrate flow
was dependant on the strain rate applied. The temperature and strain rate at which serration
occurs depends on the concentration of carbon and nitrogen. Kim [67-69] used SA508-Class
3 material and noted that there was a decrease in the fracture toughness in the upper shelf
region. This was due to the interaction between the carbon and nitrogen impurities with
dislocations being generated in the well-developed plastic zone ahead of the crack front.
Nitrogen is more important than carbon in the role of strain ageing, because its of higher
solubility and diffusion coefficient as well as producing less complete precipitation on slow
cooling. Nitrogen also associated with fine precipitates, ~10nm or clustering located at
dislocations within the ferrite grains. This known link between strain-ageing and nitrogen
suggests the particles are nitrides or carbonitrides. These effect the Charpy-V impact

P a g e | 24
transition temperature by 50oC. Both cold working and strain ageing will increase the
transition temperature, although strain ageing has a greater influence and increases it by 20 to
35oC. Patel [70] investigated the fracture behaviour of A533B using Charpy specimens
across a range of temperatures and deformation rates using three-point bend tests, Fig. 2.14
shows the effect of dynamic strain ageing, resulting in large “raises and falls” in fracture
energy at the upper shelf.
Little [32] at AERE (UK) researched strain ageing combined with the effects of temperature
(277oC) neutron irradiation (∼3 x 10²³ neutrons/m2) on the properties measured using Charpy
impact values on commercial RPV steels (of the type A533B). It was observed that neutron
irradiation suppressed ductile-to-brittle transition shifts associated with nitrogen strain ageing,
demonstrating that the effects of radiation need not to be cumulative. Similar conclusions
were reached by Murty, Little and Harries and Jung and Murty [30, 34, 48, 49]. At
temperatures below 300oC the effects of the interstitial elements are dominant, being
dependant on deformation conditions, (e.g. loading and strain rate). These forces can be
significant during pressurised thermal shock, as interactions of impurities such as copper
become important at operating conditions for the reactor. Little [49] also investigated the
radiation hardening processes that occur in phosphorus and copper doped A533B alloys.
Using small angle neutron scattering technique (SANS), the presence of copper was found
and gave rise to the creation of scattering centres <1nm in diameter, the volume increasing
with increased levels of copper, with the addition of nickel further enhancing these
precipitates. Chakravarthy [55] researched dynamic strain ageing in A203D steel, noting that
the DSA led to serrate stress-strain curves for both martensite and ferrite-pearlite structures,
both the characteristics and activation energy for the onset of serrations were identical in both
microstructures. It was also commented on that the microstructure has negligible effect on
DSA when the effect of irradiation is taken into account, thus control of the chemistry may be
the only way to reduce the effects of DSA on the mechanical properties and behaviour.

P a g e | 25
2.5.1 Interactions Between Solute Atoms and Dislocations
Interstitial solid solutions commonly comprise of the elements carbon and nitrogen, although
interstitials containing one or more of oxygen, nitrogen and boron are known to exist. These
interstitials are also commonly associated with the formation of yield-point, thus it is
important to discuss the interaction between solute atoms and dislocations. Solute atoms can
interact with dislocation via the following mechanisms [40]; modulus interaction; elastic
interaction; short-range order interaction and stacking faults interaction. A modulus
interaction occurs if a solute atom locally changes the modulus of the crystal. Elastic
interaction between solute atoms and dislocations arise from the mutual inaction of elastic
stress fields surrounding the core edge of the dislocation and misfitting solute atoms.
Stacking-fault interactions happen because solute atoms preferentially segregate to stacking
faults contained in extended dislocations. Short-range order interactions arise because the
solute atoms tend to arrange themselves so that they have more than the equilibrium number
of dissimilar neighbours.
2.6 Carbon-Manganese Welds
2.6.1 Fusion Welding
The history of joining metals stretches back over several thousands of years. Some of the
earliest examples come from the Bronze Age and are small gold circular boxes which were
made by pressure welding lap joints together. It was during the Middle Ages that the
Egyptians learnt to weld pieces of iron together [71]. It was throughout this time the art of
blacksmithing was developed in the west and many items of iron were produced which were
welded together by hammering the joints together to form a bond and this is considered a
solid-phase process. Forge and hammer welding was used on a limited scale up until the
1930’s for the manufacture or aluminium and steel vessels from plate up until the 1930’s,
however this process was costly and required great skill.
P a g e | 26
To overcome this problem, fusion welding was applied, in which a heat source intense enough
to melt the edges of the material is traversed along the joint. At the end of the 19th century
intense heat sources became available on an industrial scale, where arc welding, gas welding
and resistance processes all made their appearance [71]. The most important fusion process is
arc welding with a fusible electrode, which is a complex process and consequently slower to
develop than the relatively simple gas welding process. Initially, the end results of welding
were very brittle due to high nitrogen content. To avoid this embrittlement mechanism
electrodes were wrapped with different substances, such as paper or asbestos, more recently,
however, with the development of modern arc welding electrodes, these are coated with a
mixture of ferro-alloys, minerals and in some cases organic materials, bonded with sodium or
potassium silicate.
In modern times the use of fusion welding has increased rapidly and is widely used for many
applications from ship building, petroleum, chemical and steam power plants, e.g. reactor
pressure vessels, as well as for bonding of structural steel work. Welding has become
widespread and replaced riveting for the majority of fabrication processes [71, 72]. As a
consequence there is an incentive to develop alloys, electrodes, and other consumers, that
retain desirable characteristics and are also readily weldable. Examples of alloys that have
been developed for improved weldability are low alloy steel, titanium-stabilised austenitic
stainless steel and phosphorous-deoxidised copper. Welding has come to influence not only
fabrication but metals technology as a whole.
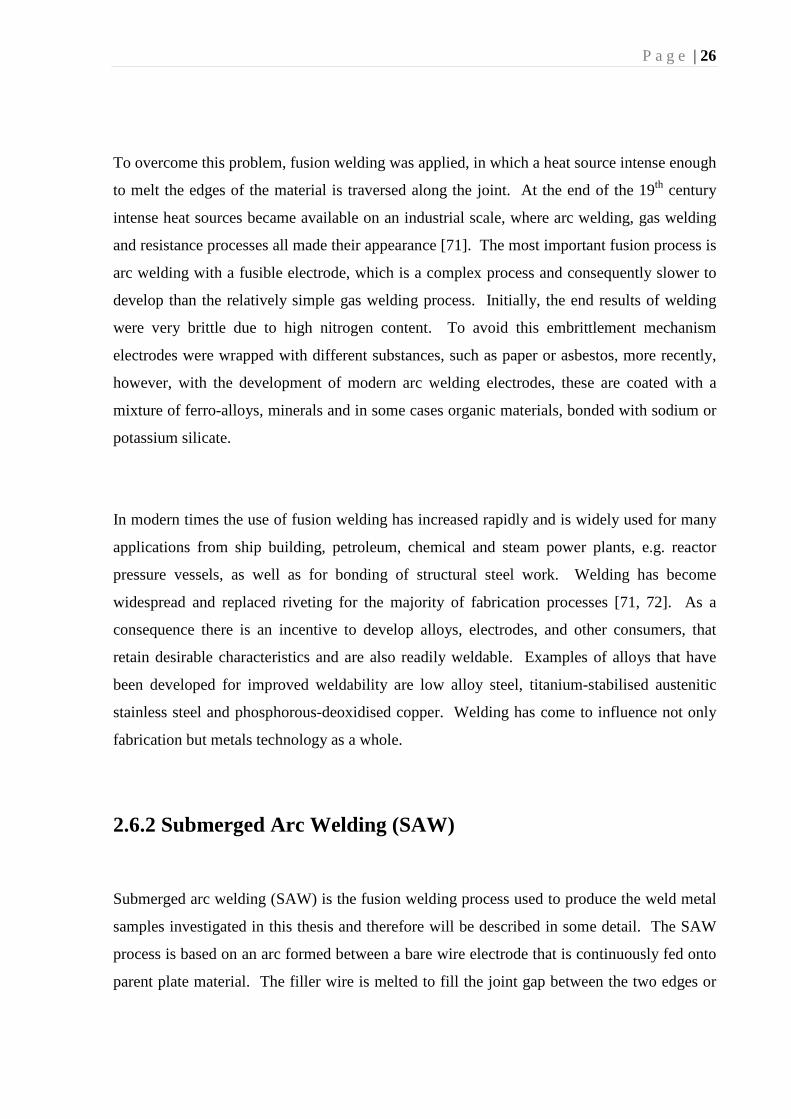
2.6.2 Submerged Arc Welding (SAW)
Submerged arc welding (SAW) is the fusion welding process used to produce the weld metal
samples investigated in this thesis and therefore will be described in some detail. The SAW
process is based on an arc formed between a bare wire electrode that is continuously fed onto
parent plate material. The filler wire is melted to fill the joint gap between the two edges or
P a g e | 27
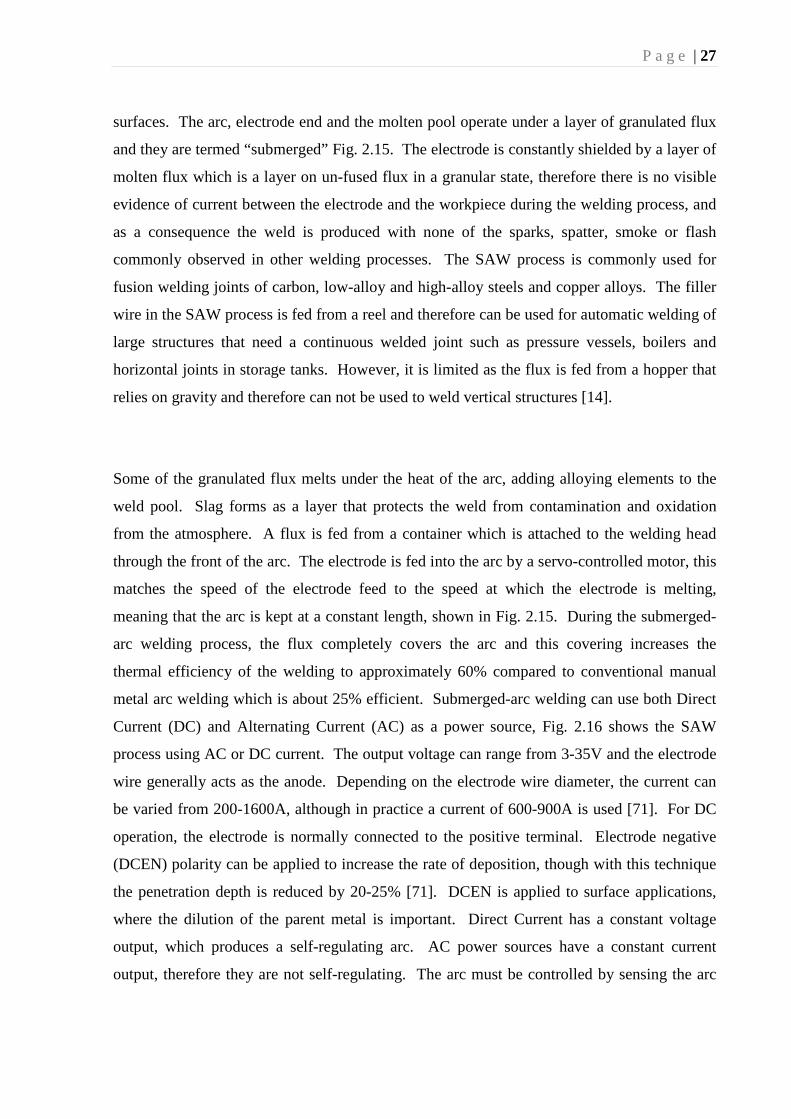
surfaces. The arc, electrode end and the molten pool operate under a layer of granulated flux
and they are termed “submerged” Fig. 2.15. The electrode is constantly shielded by a layer of
molten flux which is a layer on un-fused flux in a granular state, therefore there is no visible
evidence of current between the electrode and the workpiece during the welding process, and
as a consequence the weld is produced with none of the sparks, spatter, smoke or flash
commonly observed in other welding processes. The SAW process is commonly used for
fusion welding joints of carbon, low-alloy and high-alloy steels and copper alloys. The filler
wire in the SAW process is fed from a reel and therefore can be used for automatic welding of
large structures that need a continuous welded joint such as pressure vessels, boilers and
horizontal joints in storage tanks. However, it is limited as the flux is fed from a hopper that
relies on gravity and therefore can not be used to weld vertical structures [14].
Some of the granulated flux melts under the heat of the arc, adding alloying elements to the
weld pool. Slag forms as a layer that protects the weld from contamination and oxidation
from the atmosphere. A flux is fed from a container which is attached to the welding head
through the front of the arc. The electrode is fed into the arc by a servo-controlled motor, this
matches the speed of the electrode feed to the speed at which the electrode is melting,
meaning that the arc is kept at a constant length, shown in Fig. 2.15. During the submerged-
arc welding process, the flux completely covers the arc and this covering increases the
thermal efficiency of the welding to approximately 60% compared to conventional manual
metal arc welding which is about 25% efficient. Submerged-arc welding can use both Direct
Current (DC) and Alternating Current (AC) as a power source, Fig. 2.16 shows the SAW
process using AC or DC current. The output voltage can range from 3-35V and the electrode
wire generally acts as the anode. Depending on the electrode wire diameter, the current can
be varied from 200-1600A, although in practice a current of 600-900A is used [71]. For DC
operation, the electrode is normally connected to the positive terminal. Electrode negative
(DCEN) polarity can be applied to increase the rate of deposition, though with this technique
the penetration depth is reduced by 20-25% [71]. DCEN is applied to surface applications,
where the dilution of the parent metal is important. Direct Current has a constant voltage
output, which produces a self-regulating arc. AC power sources have a constant current
output, therefore they are not self-regulating. The arc must be controlled by sensing the arc

P a g e | 28
voltage and using a signal to control the speed of the wire feed. The SAW process can be
applied by two techniques; manual and mechanised. Due to the high rate of deposition,
mechanised submerged-arc welding is generally applied in most cases. A number of methods
are used to move the welding head at a controlled speed along the length of the weld line,
these include; an electrically-driven tractor unit, a motorised drive that transverse along the
horizontal beam and a hand operated trolley. In the case of circumferential joints, the welding
head is fixed and the work piece is rotated beneath it.
Submerged-arc welding uses relatively high welding currents. Hence, there are high rates of
deposition and therefore high productivity can be obtained. SAW is versatile and especially
appropriate for longitudinal and circumferential welded joints. There are virtually no
restrictions to the thickness of materials that it can be applied to as multi-passes can be used.
Another advantage with the SAW process is that it can be applied to the most materials
including; C-Mn steels, low-alloy steels and stainless steels, with typical applications in
pressure vessels, ships, bridges and large structures [73, 74].
Generally, a single wire is used for the SAW process for either DC or AC current. Twin or
triple wire variants can be applied to increase the deposition rate of weld metal and/ or travel
speeds. There is a large variety of wire with varying compositions and a range in diameters
from 0.8-6 mm. The wire electrode tends to be copper coated: this ensures a good electrical
contact between the work piece and the power source [71]. Fig. 2.17 shows the larger the
wire diameter and the higher the welding current, more weld metal that can be deposited. The
main role of the flux in the SAW process is to protect the weld pool and the arc from the
atmosphere. It also cleans the surface of the pool and can influence the surface profile of the
weld. Fluxes used in the SAW process are made up of granular minerals, which contain
oxides of manganese, titanium, calcium, silicon and aluminium. The fluxes are in two
classifications, according to the manufacturing process, agglomerated (bonded) and fused.
Agglomerated fluxes are manufactured by bonding the dried ingredients with low-melting
components, for example sodium silicate. Fused fluxes are manufactured by mixing and
melting the ingredients, then casting them to form solid glassy particles. These are then
P a g e | 29
ground to the required particle size [75]. Fused fluxes produce a stable arc and easily
removable slag, whereas agglomerated flues produce slag which is difficult to remove, and
the welded surface is not as smooth as it is with fused fluxes. Agglomerated fluxes are both
alloying and deoxidising. The constituents are not affected in the melting process, as this
generally takes place at lower temperature. Fused fluxes formed at higher temperatures have
difficulty in retaining the deoxidising and alloying elements [71].
The choice of welding parameters, such as current, heat input, travel speed, pre and post-heat
inputs along with flux and filler wire will all affect the weld pool solidification. This in turn
will affect the weld geometry, the weld microstructure, the size of the weld beads, the number
of passes necessary to fulfil the joint gap and finally the heat affected zone (HAZ) of the
weld. The HAZ is the region surrounding the weld pool whose temperature is not sufficient
to cause melting; however some solid state transformations may occur, such as, precipitate
dissolution; coarsening grain growth; and alpha to gamma (α→γ) phase transformation.
2.6.3 Effects of welding process variables on C-Mn metal
microstructures.
Weld metal microstructure is primarily controlled by two factors; the weld metal composition
and cooling rate. The heat input controls the cooling rate and the rate weld pool heat
liberation which is a function of base plate thickness, extent of preheat and weld joint
geometry. Other influencing factors are interpass temperature, flux and heat input rate [75].
2.6.3.1 Heat Input Rate
One of the most important variables in fusion welding is the heat input rate, as this influences
cooling rates, heating rates and weld pool size. As a general rule, the higher the heat input
rate the slower the cooling rate and larger weld pool. It also controls the grain size in the AD
P a g e | 30
and the HAZ of the weld metal. Previous research [71, 73, 74] has shown that there is an
inverse relationship between the cooling rate and the size of weld pool. This is an important
relationship in the welding of steel since increased cooling rates increases the risk of
hydrogen-induced cracking [76].
Previous research has shown that a high input rate process like SAW has less HAZ cracking
in the welding of alloy steel, than manual metal arc welding, where the heat inputs are lower
(n.b. there might be other variables that contribute to the difference in behaviour). As a result
this leads to coarsening of the prior austenitic grain size and also a general coarsening of the
as-deposited (AD) microstructure of the weld [14, 15], as well as a decrease in the degree of
acicularity was observed. Slower cooling rates produce a decrease in such constituents as
acicular ferrite as well as an increase in the volume fracture of the allotriomorphic ferrite at
the expense of the acicular ferrite. Acicular ferrite volume fraction might be improved by an
increase in the inclusion population density. Thus, as a result the weld pool remains molten
for longer allowing manganese and silicon (key constituents for the formation of inclusions)
to evaporate and allowing formed inclusions to diffuse into the slag. Also the way in which
the heat input is introduced is important, if it is increased by raising the arc current, the width/
depth ratio of the weld pool decreases, thus giving a shorter cooling time, even though the
heat input is increasing.
2.6.3.2 Flux
Flux is a coarse granular powder, made of minerals, that is dispensed onto the workpiece
immediately ahead of the arc; the main role of the flux in the SAW process is to protect the
weld pool and the arc from the atmosphere. As well as cleaning the surface of the weld pool
it can also influence the surface profile of the weld. The granular flux can be chemically
basic, natural or acid. Fluxes generally basically fall into two classifications, according to
how they manufactured by bonding the dried ingredients with low-melting components, for
example MnO with SiO2, or CaO with SiO2 [72]. Fused fluxes are manufactured by mixing
and melting the ingredients, then casting them to form solid glassy particles, and then ground

P a g e | 31
to the required practicle size. Fused fluxes produce a stage arc and easily removable slag
layer, whereas agglomerated fluxes produce slag, which is difficult to remove, and the welded
surface is not as smooth, as it is with fused fluxes. Agglomerated fluxes are both alloying and
deoxidising, the constituents are not affected in the melting process, as this generally takes
place at lower temperature. Fused fluxes formed at higher temperatures have difficulty in
retaining the deoxidising and alloying elements.
As the flux melts around the arc it forms a pool, which solidifies and reforms periodically,
dependant on the movement of the welding torch. Metal may be transferred directly across
the slag cavity so formed or occasionally around the edge of molten flux. The gases
generated during the SAW process by vaporisation and chemical reaction at the electrode tip
are also protective along with the flux, of the molten metal. The slag which is formed during
the welding process protects the weld from the atmosphere and in particular from the
absorption of moisture. Other compounds added in small quantities control the viscosity and
help the flow of liquid filler metal into the weld pool.
2.6.3.3 Interpass Temperature
Whilst keeping other welding parameters constant, an increase in the interpass temperature
will reduce the cooling rate. Evans [77] observed the following effects of increasing the
interpass temperature; slight reduction in the amount of manganese and silicon; increased
width of the recrystallised zones; coarsening of the AD weld metal region and a reduction of
the volume fraction of the acicular ferrite phase.
2.6.3.4 Postweld Heat Treatment (PWHT)
Postweld heat treatment (PWHT) within the subcritical range has the influence of reducing
both the hardness and strength of an alloy-steel weld deposit. In thickness over
P a g e | 32
approximately 30 mm, PWHT increases both the ductility and the fracture toughness of the
welded joint, as a whole. It has been noted, in some cases, for Charpy impact and crack tip
opening displacement (CTOD) values for the weld metals increase by PWHT, although there
are certain circumstances were they might be reduced. To accurately determine the effect of
PWHT, welding procedure testpieces must be subjected to the same thermal conditioning as
that used in production.
2.6.4 Non-Metallic Inclusion Formation
Inclusion formation is the first development to occur on cooling of the liquid weld metal, this
development will affect the final microstructure of the weld metal. Inclusions commonly
arise from two sources: by entrapment of welding slag (exogenous); or by indigenous
inclusions as a result of oxidation reactions (oxides) or solid state precipitation reactions
(carbides, nitrides and sulphides) Fig. 2.18. Oxides normally begin to form at around 2026oC
(2300K) while the weld pool is still molten. Oxides will influence the final weld
microstructure in terms of their composition, size, spatial distribution and volume fraction, as
well as influence other phases such as acicular ferrite, which is known to be nucleate by
inclusions. The former group is usually observed to be heterogeneous in nature, with respect
to shape (angular or spherical), chemistry (multiphase particles) and crystallographic
properties resulting from the complex alloying systems that are involved, with the exception
of C-Mn and low-alloy steel welds, as the oxide inclusions are predominately spherical,
glassy, and manganese silicates, a survey of important weld metal inclusion characteristics is
shown in Table 2.1 [78, 79].
Inclusion formation comprises of various distinct stages such as nucleation, coarsening and
coalescence (as well as elimination from the weld to slag). Diffusion-controlled deoxidation
is a characteristic of arc welding and complete within a fraction of a second in small volume,
in which temperature gradients in the order of 1000oCmm-1 [80] with cooling rates for
1000oCs-1, for nuclei in the order of 107mm3 or higher. In the weld pool the main source of
oxygen is caused by the flux, the weld pool also contains reduced oxides like silica, iron oxide
P a g e | 33
and manganese oxide. Oxygen in the weld pool may be removed by deoxidizing elements
through chemical reactions, thus inclusions are formed. In low-alloy steel weld metals,
oxygen combines with various trace elements to form stable oxides in the order: Al2O3, Ti2O,
SiO2, MnO, TiN and MnS, Fig. 2.19, as proposed by Bailey and Pargeter [81], although work
by Hseith [82] has suggested the exact sequence is dependent on the weld composition. The
growth of the inclusion is influence by this sequence of stability and thus inclusions are found
to have a core and a layered structure, Fig. 2.19, it has been observed in most weld metal
inclusions that the core of the inclusions is an oxide such as Al2O3 and or TiO. The outer
layer has acted as a nucleation point for microstructure formation around the inclusion,
generally this is TiN and/ MnS. TiO is considered the most important for the nucleation of
acicular ferrite. However, it should be noted that the free energy for formation of oxides
depends on concentrations of deoxidising elements and oxygen, also the sequence of
oxidation is different for welding conditions and different chemistry [83].
Oxidation reactions rapidly proceed by growth of nuclei larger than the critical size. The
growth of these nuclei occurs by diffusion of the relevant reactants in the melt, and it can also
by enhanced by collision and coalescence of inclusions. Coalescence is considered to be
important for small nano-sized inclusions as the process takes place in a fraction of a second.
Deoxidation products are trapped in the weld metal by the advancing solid and form what is
termed as the oxide population. However not all the oxides formed are trapped inside the
solid as the liquid cools, as some inclusions densities are lower than that of liquid iron. Work
by Sudgen and Bhadshia [84] showed that inclusions are not randomly distributed but larger
inclusions caught in the growing of the solid-liquid interface and pushed along by the
“Margangani effect” (repulsive effect of interfacial tension between the inclusion interface
and the liquid). Hence large inclusions are commonly preferentially distributed on the grain
boundaries of δ ferrite, which is often the first phase to form. It should be emphasised that
inclusions are not aligned with prior austenite grain boundaries [85]. Smaller inclusions are
relatively unaffected by the solid interface and become trapped within the delta grains.
Research by Nakonishi [86] showed that a reduction in the average inclusion size and the
number of large inclusions influenced the Charpy toughness at low temperatures.

P a g e | 34
2.6.5 Weld Pool Solidification
Solidification behaviour of the weld pool distinctly differs from that of ingot solidification
due to the presence of partially melted base metal grains at the fusion boundary.
Heterogeneous nucleation of new grains occurs and grows into the weld pool, in the direction
of maximum thermal gradient (the heat flow direction). This process is known as epitaxial
solidification and shown in Fig. 2.20. Davis and Garland [87] summarized a number of basic
differences:
• Weld solidification is orders of magnitude greater than that found in ingot
solidification, thus leading to steep thermal gradients within the weld pool;
• in weld-metals the microscopic shape of the liquid/ solid interface remains constant
over large portions of the weld length, whilst changes are progressive within an ingot;
• to initiate weld pool solidification no nucleation event is necessary, since the
solidification interface is already present;
• electromagnetic stirring by an electric arc and the characteristics of the fusion welding
process causes greater motion of the molten metal within the weld pool, compared to
the molten metal experienced within a solidifying ingot.
Grain growth is of a cellular nature producing columnar grains which are similar in size to the
base material from which they are originating. Fig. 2.21 shows cellular substructure which is
characteristic of columnar grains [88, 89]. During the welding procedure dilution of the base
material is inevitable. The initial size of the weld columnar grains is directly related to the
grain growth zone adjacent to the fusion boundary, whereas the solidification microstructure
depends on the grain coarsening behaviour of the base material. In high energy welding
process such as submerged arc welding and gas shielded welding, this is considered a
problem as grain growth from the base material can be considerable, thus columnar grains at
the fusion boundary may be correspondingly coarse [89]. In practice though these problems
can be overcome and eliminated by additions of inoculants from the filler wire, which helps to

P a g e | 35
assist the refinement of columnar grain structure through the heterogeneous nucleation of new
(equiaxed) grains ahead of the advancing interface [78].
Within metals these grains have preferred directions of growth, known as “easy growth
directions”. In cubic metals these are in the <100> direction [13, 14]. This is believed to be
the preferential growth direction as it is the least close packed alloy and therefore has a faster
growing rate than in other directions (close packed) during the crystallization process from the
random atomic arrangement in the liquid. The speed of welding and the shape of the weld
pool also influence the shape and size of the columnar grains. Faster welding leads to a tear
shaped weld pool, with maximum thermal gradient relatively invariant from the fusion line to
the centreline of the bead, and consequently a different columnar grain morphology, Fig. 2.22.
Weld pool geometry can be characterised by dimensionless operating parameter, n3:
( )02
03 4 HHa
qn
m −=
πν
. . .(2.4)
where q0 is the arc power;
ν is welding speed;
a is thermal diffusivity of base plate
(Hm-H0) is heat content per unit volume at melting point.
However it should be pointed out that thermal properties of the base material (e.g. a and (Hm-
H0)) are important when defining the weld pool shape. As a result tear-shaped weld pools are
normally observed in weldments with a low thermal conductivity (e.g. austenitic stainless
steel), whereas spherical or elliptical weld pool is more likely to form during aluminium
welding, because of the base material having a higher thermal conductivity. The weld pool is

P a g e | 36
also affected by convectional heat transfer due to the presence of buoyancy, surface or
electromagnetic tension gradient forces [78].
Weld microstructures are affected by the initial solidification phase rather that austenite or δ-
ferrite for the two following reasons [13]:
• austenite and δ-ferrite has different solute partition coefficients. Also the diffusivity
of elements δ-ferrite is greater than that of austenite. Diffusivity of the solute in the
solid decreases, redistribution becomes more restricted, thus increasing the degree of
segregation [90, 91].
• non-metallic inclusions tend to segregate to grain boundaries of the phase which is the
first to solidify [84]. If δ-ferrite is the first, the inclusions will, after the δ→γ
transformation be found in γ grains where they contribute to acicular ferrite formation.
If austenite is the primary solidification phase, there would be a non-uniform
distribution of large inclusions at the austenite grain boundaries (e.g. in
allotriomorphic ferrite after the γ→α transformation), thus reducing the amount of
beneficial acicular ferrite phases, also serving as a potential site for initiation of
cleavage [13, 14, 28, 29].
2.6.6 Transformations and Microstructural Development
Carbon and low alloy steels transform to austenite at a temperature not far from the
solidification point and finally to ferrite regardless of the first phase to form within the
microstructure. The equilibrium structure of iron-carbon alloys is shown in Fig. 2.23(a) and
Fig. 2.23(b) shows a detailed region of the Fe-Fe3C system [92]. Steel is austenitic when the
temperature falls within the region of γ. Under slow cooling the austenite phase starts to
transform when the temperature falls to a point on the lower boundary of this region relating
to the amount of carbon in the steel-the upper critical temperature. Ferrite containing ba small

P a g e | 37
amount of carbon in solid solution is precipitated, leaving austenite grains that become
smaller and are progressively enriched in carbon as the temperature falls. At 723oC, the lower
critical temperature, residual austenite, containing approximately 0.8% carbon transforms in
pearlite-a laminated eutectoid mixture consisting of both ferrite and cementite (Fe3C). The
structure is obtained by slow cooling and consists of intermingled grains of ferrite and
pearlite. Cementite can decompose to iron and graphite if held for long periods at elevated
temperatures. The Fe-Fe3C phase diagram is shown in Fig. 2.23a is considered metastable
[71].
The temperature is depressed upon rapid cooling, this affects the γ to α change, and when this
takes place. The distance carbon atoms can diffuse is reduced as the transformation
temperature falls; there is a tendency to form structures involving progressively shorter
movements of the atoms. However on slow cooling carbon segregates into individual
austenite grains, with further rapid cooling carbides precipitate within and around ferrite, now
with the appearance of fine needles or plates rather than just equiaxed grains. This structure is
known as bainite, Fig. 2.24 [93]. Upon further and more rapid cooling, the temperature is
further depressed and martensite is formed. Martensite is a product produced by shear
movement of the austenite lattice; carbon is retained in solid solution in a distorted body-
centred lattice. In general this transformation product is more hard and more brittle the lower
the transformation temperature, and the higher the carbon content, especially in the case of
martensite [71].
As previously discussed, as the shear rate decreases the cooling rate in the fusion welding
increases thus the speed of welding also increases. It is higher for multi-pass welding in
thicker plate than for single pass welding in thin plate, with other parameters being equal, it is
reduced by increasing the preheat temperature. The weld metal and the associated HAZ form
under continuous cooling conditions.

P a g e | 38
Continuous cooling transformation (CCT) diagrams can be used to analyse the effect of
cooling rates of microstructure on steel weld deposits. CCT diagrams for weld metals have
been presented by several authors, with an increase in cooling rates leading to a progressive
decrease in the transformation-start temperature. As a consequence products forming at
higher temperatures will be suppressed for those forming at a lower temperature.
Experimental CCT diagrams were determined by Ito [94, 95] for welds at different oxygen
contents, showing a shift to the left for higher oxygen content. It was also noted that the
temperature at which ferrite forms was higher for a high oxygen weld content, this would
increase the difference between the start temperatures for acicular and allotriomorphic ferrite,
allowing more time for the growth of allotriomorphic ferrite and thus increasing the volume
fraction of the weld. The apparent decrease in hardenability with increased oxygen content is
explained with respect to the γ→α transition temperature. Although Farrar and Watson [96]
offered an alternative solution for the decrease in the hardenability with increased oxygen, it
was suggested that oxygen combines with alloying elements present within the weld to form
inclusions, and this depletes the weld of alloying elements, e.g. manganese and silicon and
these reduce the weld hardenability.
An example of a continuous cooling transformation diagram, CCT, is shown in Fig. 2.25.
Increasing the cooling rate leads to a decrease in the transformation-start temperature. As a
result these products, which form at a higher temperature (such as allotriomorphic or primary
ferrite) will be surpassed while those that form at a lower temperature (such as bainite and
martensite) will be promoted. However other features that can be observed in the
microstructure of a weld are discussed below [97].

P a g e | 39
2.6.7 Weld Microstructures and Nomenclature and Development
2.6.7.1 δ-Ferrite to Austenite Transformation
During solidification low-alloy steels undergo numerous multi-phase transformations and
subsequent cooling. Dependant on the cooling rate, carbon or substitutional alloy content, the
primary solidification product will be either austenite, γ, delta ferrite, δ or a mixture of both.
Delta ferrite will be the first phase to form when a low-alloy steel weld metal is cooled slowly
to below the crystallisation temperature [85]. As previously discussed in Chapter 2.6.3.4
delta ferrite grains reveal a anisotropic columnar morphology, with major axis in the direction
of the steepest temperature gradient within the weld pool, generally with large inclusions
delineating the grain boundaries [85]. As shown in Fig. 2.26, cooling below the peritectic
temperature, austenite nucleates epitaxially at the primary delta ferrite grain boundaries, as
these sites provide the lowest energy barrier for heterogeneous nucleation. At elevated
temperatures, once nucleated γ grains grow quickly by diffusion of carbon into the austenite,
and this has been well documented for γ-Widmänstatten sideplates growth within duplex
stainless steels, Fig. 2.27. If we consider the primary precipitation of δ ferrite, austenite
cannot grow across primary delta ferrite solidification boundaries, because austenite is bound
by an orientation relationship with delta ferrite, Fig. 2.28 and Fig. 2.29 [87-89, 98-102].
Nevertheless, in certain low-alloy steel weld metals, austenite grain boundaries will cross the
original delta ferrite solidification boundaries due to the shift in the mechanism of the
peritectic transformation, shown in Fig. 2.26 and Fig. 2.30 it can be seen there is no matching
between the two types of boundaries in this case [84, 87, 89, 103-105]. It was observed that
the shift in mechanisms of peritectic transformation can be linked to heterogeneous nucleation
of austenite at inclusions (e.g. Al2O3), this is more energetically favourable than nucleation at
δ /δ grain boundaries [78], it can be suggested that there is more than one nucleation event pre
δ-ferrite grain size and the nucleation rate is high. It has also been shown that the columnar
structure of γ grain boundaries do not match with the original δ-ferrite boundaries [106]. It

P a g e | 40
can be seen under these conditions that the austenite is not bound by orientation with the delta
ferrite and can grow freely across the original delta ferrite columnar grain boundaries shown
in Fig. 2.31, therefore austenite grains will adopt a morphology different from columnar
grains [105, 107].
2.6.7.2 Austenite Decomposition
Microstructural changes take place during the welding process, both within the fusion
boundary region and the HAZ, in turn this affects the mechanical integrity of the weldment.
Microstructural solid state transformations of steel weld deposits are characterised by the
volume fraction of non-metallic inclusions, which are considerably higher than those in
normal cast steel products and strong non-isothermal localised behaviour. For instance in the
HAZ, carbides and nitrides coarsen and dissolve, growth occurs to an extent that depends on
the distance from the fusion boundary and the exposure time defined in the welding
procedure. Hence, this may have a significant affect on the subsequent microstructure and
properties of the weld region by the CCT curve being displaced by longer times, thereby
producing more Widmänstatten ferrite, or increasing the possibility of martensitic and bainitic
transformations on cooling [71, 73, 74]. As a consequence of these by-products the toughness
of the weld may be reduced and there may also be an increased risk of hydrogen cracking
[71].
Upon final solidification, the microstructure of the weld alloys usually consists of columnar
delta ferrite grains with larger inclusions delineating the gain boundaries. This is occurring at
approximately 1500oC, as cooling continues to 1300oC the delta ferrite transforms into
austenite, otherwise known as γ delta ferrite. It has been shown that prior δ grain boundaries
did not correspond with the new formed γ grain boundaries as a result of this transformation,
also more than one γ grain could nucleate per delta ferrite grain. Following nucleation rapid
grain growth by diffusion along the prior delta grain boundaries occurs until the whole
microstructure is γ grains. Austenite goes through further decomposition as a result of further
cooling, starting at ~1000-750oC Fig. 2.28 and 2.29.

P a g e | 41
As the transformation between austenite to ferrite occurs, there are a large number of
microstructures that can develop, by a mixture of displacive and diffusion mechanisms,
shown in Fig. 2.28. These depending on the weld chemical composition and the cooling rate
of the steel weld. The microstructure normally forming within a single austenite grain after
transformation will be a complex mixture of two or more of the following, arranged in
decreasing transformation temperatures [78]:
I. Grain boundary (allotriomorphic) ferrite (αall);
II. Polygonal (equiaxed) ferrite (PF);
III. Widmänstatten ferrite (αW);
IV. Acicular ferrite (αC);
V. Upper bainite (αub);
VI. Lower bainite (αlb);
VII. Martensite (α’);
VIII. M-A-C Martensite-austenite-carbide microphases retained on cooling from the γ
phase.
Grain boundary α is the first phase to form during decomposition of the austenite. Various
authors have reported different temperatures ranging from 1000-600oC for the start of this
reaction, the reason for this discrepancy could be the effect of composition of the weld metal,
e.g., alloying elements such as manganese, which will lower the temperature at which the
transition takes places, as this is an austenite stabiliser. Grain boundary α nucleates and
grows along the prior γ grain boundaries via a reconstructive diffusional process (iron atoms
diffuse to minimise lattice strain) [108]. Growth is occurring by the progression of planar
incoherent γ/α interface. Growth of αall continues until all the grain boundaries are consumed
and growth perpendicular to the grain boundary must occur. Due to the diffusion of iron
atoms as well as carbon, the mechanism of α growth, as a result of undercooling becomes
kinetically unfavourable. At temperatures below 650-600oC the diffusion of iron becomes
slow and Widmänstatten ferrite (αW) begins to grow, the morphology of this is of parallel
P a g e | 42
plates which have nucleated on either the prior γ grain boundaries or on the αall ferrite. These
plates have grown via a displacive process whereby iron atoms no longer diffuse [109, 110].
The wedge shaped plate allow for a more efficient method for carbon rejection into austenite
retained between the plates due to multi-directional diffusion compared to the planar diffusion
of αall. The side plate edge consists of small low energy ledges with a Kudjimov-Sachs
orientation relationship [111]:
{ } { } 111//110110//111 FEFEFEFE and αγαγ . . .(2.5)
Carbon is rejected at the interface of α/γ and leads to regions enriched by γ phase, these can
be retained at room temperature forming a M-A-C constituent or it can be partially
transformed to martensite. Eventually undercooling is such that αW becomes kinetically
unfavourable and the remaining austenite phase is transformed into the acicular ferrite,
bainite, or in extreme cases of undercooling; martensite. Research is still being carried out
into the formation of acicular ferrite, and arguments remain over the formation and exact
nature of this phase [112]. There is however general agreement that it is a fine form of
Widmänstatten ferrite or a form of bainite, it is also agreed that in both cases it forms
intergranularly on inclusions. The morphologies of bainite and acicular ferrite and similar
occur via a displacive reaction with carbon diffusion as is the case with αW whilst martensite
is purely a displacive transformation. αC, αW and α’ form at a rapid rate, such that the final
transformation occurs in less than a second. Therefore they are thought of as isothermal
transformations, Fig. 2.27 [111]. Acicular ferrite is associated with the optimum welding
mechanical properties [71, 79, 113], both in terms of strength and toughness, this is a result of
the “basket-weave” morphology, characterised by high dislocation density and very small
laths. Numerous studies [78, 103, 114-121] have been carried out in recent years, in low-
alloy steel welds metals the acicular ferrite transformation is still subject to considerable
controversy. It is widely accepted however that acicular ferrite is a very fine form of
Widmänstatten ferrite or a form of bainite. It is also well established that acicular ferrite
nucleates in the transformation temperature range between Widmänstatten and lower bainite.
The bainite and acicular ferrite morphologies are very similar and occur via a displacive

P a g e | 43
mechanism with carbon diffusion as for Widmänstatten [78, 122]. Several researchers [111,
114, 123-125] have suggested that the growth of acicular ferrite happens by pure shear
transformation or a ledge mechanism similar to upper bainite in steel.
Microstructure quantification in steel welds is most commonly carried out by using an optical
microscope. Numerous systems [71] have been introduced for the classification of the
various constituents of the microstructure; each of the systems reflects the investigators views
and discretion in relations to the mechanisms of transformations rather than just the
morphologies [13]. Abson and Dolby [121, 126] originally proposed a scheme for the
classification and quantification of the weld microstructure, based on this the International
Institute of Welding (IIW) [104] have developed guidelines to aid this process. The IIW
scheme involves a simplified classification procedure for the distinction between acicular
ferrite and the different sideplate structures, based on features such as relative lath size, aspect
ratio and number of parallel lathes. Difficulty has been noted in optically determining the
difference between upper bainite and Widmänstatten ferrite, therefore the Welding Institute
introduced a terminology which would encompass both phases, αFS (ferrite with aligned
second phase).
2.6.7.3 Microphases
As described and shown in Fig. 2.29, all ferrite transformations are accompanied by carbon
diffusion thorough the remaining austenite (γ decomposition to αall, αC and αW). Hence,
carbon enriched austenite regions occur at the junction of equiaxed allotriomorphic ferrite
grain, between acicular ferrite and Widmänstatten ferrite planes. For the duration of cooling
these regions of enriched austenite may transform to bainite, carbides, martensite or remain as
austenite [22, 106, 108, 109, 118, 119]. Without the use of TEM it is difficult to define these
phases, thus they are generally known as “microphases”. Formation of microphases may be
associated with disproportionate hardenability in alloys which have insufficient time to form
ferrite phases, resulting in bainite and/ or martensite formation. With large amounts of γ
phase stabilisers added, austenite can then be retained at room temperature. Low heat input
P a g e | 44
during the welding process can also assist the development of microphases, consequently this
results in fast rates of cooling, leading to the formation of bainite and/ or martensite [122,
127]. Also if the inclusion size and distribution are insufficient, and/ or of an incorrect type,
the nucleation of ferrite becomes much more difficult and this means more γ phase is
available for transformation to bainite and or martensite. Measuring the microphase fraction
accurately is difficult, thus it tends to be included in the volume fraction of acicular and
Widmänstatten ferrite.
2.6.7.4 Effect of Alloying Elements on Weld Microstructures
The microstructures of the weld deposits are influenced by additional alloying elements
increasing hardenability by inhibiting the transformation of allotriomorphic ferrite, and by
controlling the oxygen content. This affects composition and distribution of non-metallic
inclusions. For notch impact toughness specimens both coarse grain ferrite and lamellar
structures are undesirable, whereas high levels of acicular ferrite are associated with good
notch ductility of the fuse zone in low-alloy steel welds. Hence, there has been a considerable
amount of research and work investigating the optimum chemical composition levels and
welding parameters to promote the formation of a beneficial factor. Due to multiple
interacting factors involved during the cooling process, it is difficult to address this
influencing element directly [22].
The effect of alloying combinations on toughness and strength of weld deposits has been
studied in great detail. It is widely known that the addition of large amounts of carbon can
strongly effect the hardenability of steel, [84, 98, 99, 114, 128, 129] thus the levels of carbon
are kept low and within a narrow range, usually 0.05-0.12wt%. This level of carbon produces
the best combination for fracture toughness and cracking resistance. Increasing the carbon
content of the weld metal increases strength and hardness, it may also reduce the upper-shelf
energy level. For the AD microstructure carbon influences the microstructure by increasing
amount of acicular ferrite at the expense of allotriomorphic ferrite. Within the RH regions

P a g e | 45
carbon causes grain refinement and increases the amount of second phase particles within the
fine grained reheated regions [130-135].
Manganese is probably the most important element after carbon that is commonly used to
increase hardness and the strength of the steel and therefore they complement each other.
Manganese also reduces the solubility of sulphur in austenite and particularly at high cooling
rates; manganese promotes the formation of spherical rather than angular intergranular
precipitates. An added benefit is the ability of manganese to reduce embrittlement due to
overheating. Manganese is also known to lower the transformation temperature of austenite
to ferrite; this inhibits the formation of allotriomorphic ferrite, thus leading to an increase in
the proportions of acicular ferrite, in addition to refining both fine-grained and coarse-grained
ferrite in the reheated region. Evans [132, 136] found the optimum impact toughness
properties were achieved with alloying combinations of 0.07wt%C and 1.4wt%Mn, the reason
for the decrease toughness of high alloy content welds was associated with an increase in
yield strength. However, research carried out by Svensson and Gretoft [129] disagreed with
Evans findings, and remarked that increasing yield strength in high alloy steel metals does not
decrease impact toughness of the material, because the increase can be related to fineness of
the grains, which may actually improve the impact toughness. The positive effects of grain
refinement by increasing alloying content can be offset by the formation of segregated bands
of brittle microphases (bainite and / or martensite).
The flux used during the welding process transfers silicon into the weld pool, due to the large
amounts of silicates and SiO2 used as flux constituents. With increasing Si content the
oxygen in the weld metal decreases while the amount of acicular ferrite increases. Evans
[131] noted that for low Mn weld metals (0.6%wt.) increased Si content promotes acicular
ferrite at the expense of both Widmänstatten and allotriomorphic ferrite. At high contents of
Mn (1.4%wt), the volume fraction of acicular ferrite remains constant. Manganese, nickel
and copper austenite stabilisers and believed to have similar effects on steel transformation
behaviour, they also increase hardenability [105, 133]. Nickel, provides powerful solid
solution hardening and high levels in the weld bead can result in changes of morphology
P a g e | 46
within microphases and acicular ferrite. Evans showed that increasing nickel content reduces
the proportion of allotriomorphic ferrite and increases the amount within the AD regions.
With manganese at high levels, nickel can also promote the transformation to martensite at the
expense of acicular ferrite [78, 137].
In C-Mn weld metals molybdenum and chromium have similar effects. Within the AD
region, increasing amounts of Mo initially increases the acicularity and reduces the volume
fraction of the allotriomorphic ferrite. The volume ferrite of acicular ferrite was found to
reach a maximum and the amount of the remaining microstructure, “ferrite aligned with
second phase” increased both the molybdenum and chromium concentrations, this is a result
of a decrease in the Widmänstatten ferrite as there is increasing Mo additions, and bainite
replacing acicular ferrite. Kayali [138], noted that increasing Mo content from 0.24 to 0.48
wt.% generally increased the toughness of a submerged arc weld metal tested at low
temperatures. This improvement was a result of a decrease in the fraction of M-A plus
carbides, and an increase in the fraction of acicular ferrite. As previously discussed there is
evidence, although circumstantial that titanium oxide (TiO and TiO2) assist the formation of
acicular ferrite, although the specific role of titanium has yet to be made clear. Research
carried out by Evans [134, 139] found that 20ppm of Ti was enough to modify the
microstructure from 80% Widmänstatten ferrite to almost 70% acicular ferrite, using the same
welding conditions and parameters. Also with increasing Ti content refinement of ferrite
grains and changes in the morphology of microphase was noted in the RH weld metal regions.
Evans [131, 133] found the best values for Ti was 30 ppm, as toughness values are directly
linked to the amount of acicular ferrite. Titanium has also been found to decrease the amount
of soluble N content, it has been suggested that TiN particles insoluble in austenite provide
intergranular nucleation sites during the austenite-ferrite formation [140]. Evans found that
TiO may assist in the intragranular nucleation of ferrite by improving the size and distribution
of inclusions. With TiN, TiO this has lower formation free energy than MnO and SiO2. If
there was no titanium present within the weld pool, the inclusion composition would mainly
be formed from manganese silicate, which form at low temperatures (≈1350oC) thus leading
to the formation of small inclusions with reduced nucleating potential. Nevertheless small
amounts of Ti are added into the weld, TiO will form at much higher temperatures in the
P a g e | 47
liquid metal (≈1800oC) and provide nucleation sites for other inclusion phases. This leads to
the formation of precipitation and subsequence coalescence. Hence the capacity for acicular
ferrite nucleation would be increased due to the formation of larger inclusions [78, 116, 117,
137, 139, 141].
To protect the weld metal from boron oxidation during transfer across the arc titanium is
added, it also helps with the prevention of boron nitride formations. Boron is only effective in
improving hardenability of the metal if it remains in solid solution in austenite and is known
to be detrimental to toughness [22]. If it combines with nitrogen or carbon and forms nitrides
or carbides in austenite grains, then a reduction in the hardenability occurs, as these particles
induce the nucleation of ferrite. Aluminium may have the same effect as silicon and titanium
on the inclusion population. Evans [134, 135] found that when adding aluminium and
titanium together, the aluminium serves mainly to modify the role of titanium. A
disadvantage of excessive aluminium is that it can tie up available oxygen and thus prevent
titanium from forming oxides. Grong [142] showed the nucleation of acicular ferrite at
titanium oxides and nitrides is more efficient that aluminium oxides (Al2O3 and MnAl2O3),
this is due to the lower energy levels to nucleation of the former inclusion constituent phases.
As a result there is a general reduction in the nucleation capacity of inclusions and a decrease
in the oxide number density is associated with the precipitation of Al2O3 at high weld metal
aluminium levels. Al2O3 has more affinity to oxygen that Ti2O3, thus the optimum content of
aluminium should be a function of the weld metal concentrations of silicon, titanium and
oxygen [98].
2.6.8 Multi-pass Welds and Reheated Microstructure
Welding is a process that generates a surface heat source and produces a weld pool with a
semicircular cross section. The size of the weld pool can be controlled in theory simply by
changing the heat input rate. However, it may become more difficult to control the
microstructure, i.e. the grain size may become larger than desirable and properties of the fused
weld region as it becomes larger. Therefore in practice it is customary to reduce the size of
P a g e | 48
penetration of the weld bead size to approximately less than 20 mm and as a result of this
larger joints have to be completed by multi-pass or a multi-run technique, where layers of
weld passes are built up from the bottom to the top of the joint, Fig. 2.32 [71]. As subsequent
layers are deposited, part of the previously deposited weld metal and HAZ will be reheated to
temperature high enough to promote solid sate transformations to austenite and then different
microstructures upon cooling, whilst other regions may become slightly tempered. The weld
metal will consist of two bead microstructures as-deposited (AD) and reheated (RH), Fig.
2.32(b).
Multi-run welding helps to increase notch ductility and decrease hardness, therefore proving
beneficial. The tempered bead technique may take advantage of this, where the final capping
run is made and then ground off, hence avoiding the problem of leaving the final run in the as-
welding condition. The larger the number of weld beads, the greater the volume fraction RH
weld metal that is produced. An advantageous benefit of this technique is annealing out of
residual stresses caused by the previous runs, this provides certain preheat and tends to extend
cooling times. Total heat input into the weld metal is decreased and this reduces grain
coarsening [71].
Both peak temperature and cooling rate decrease the greater the distance away from the weld
centreline, as a result the grain refined region may have distinctive microstructures, this
depends on the maximum temperature level to which it has been subjected too. The RH
region has three regions: intercritical, subcritical and supercritical regions.
The intercritical region is relatively narrow and partial transformation may take place, Fig.
2.32(c). Prior to welding carbon steels, which have a ferrite-pearlite microstructure, the
eutectoid pearlite islands may transform to austenite on heating, and then on cooling to bainite
or martensite. In the “as-welded” condition, this region may consist of hard grains which are
embedded in an untransformed, relatively soft ferrite matrix. The subcritical region does not
experience any observable microstructural changes, but strain-ageing is a possibility, this is
P a g e | 49
where the material has been strained and heated to a temperature range of 100 to 300oC, this
is known as dynamic strain ageing.
The supercritical region has been reheated to a temperature such that full austenite
transformation occurs; and this can then be subdivided into coarse and fine grained regions
depending on temperature to which the reheating occurred. The fine grained region
experience temperatures just above the α→γ transition, thus resulting in small equiaxed ferrite
grains, with restricted amounts of microphases inbetween, compared with the coarse grained
ferrite which is located close to the fusion boundary where the peak temperature is sufficient
to promote grain coarsening (grain recrystallisation and growth). It should be noted that large
areas on austenite grain boundary (small prior austenite grains) mean that grain boundary
ferrite easily nucleates and grows rapidly to consume the grains. This, in turn depresses the
formation of the other constituents that normally occur at lower temperatures. Lath-like
microstructures (e.g. high hardenability) and low transformation α→γ temperature, during
heating, results in a final RH microstructure which is more homogeneous, and similar to the
AD microstructure, due partly to the fact that high hardenability allows enough time for the
transformation of the re-austenitised region into a microstructure similar to the AD region.
Several authors and previous research has noted that the RH region has higher toughness
values than that of the AD microstructure in C-Mn and low-alloy ferritic steel welds; it is
therefore desirable to increase the area of RH region at the expense of the AD area.
2.6.9 Previous work on the toughness of C-Mn weld metal
2.6.9.1 Introduction
Researchers have been interested in the toughness of C-Mn weld metal for many years, due to
the widespread application of such welds in engineering structures. Frequently, the welds
come under scrutiny, as they are often the regions of engineering structures where failure
occurs or initiates.

P a g e | 50
2.6.9.2 Micromechanisms of cleavage fracture in C-Mn weld metals
The fracture micromechanism of C-Mn welds was investigated by Tweed and Knott [143],
and found brittle fracture initiated from inclusions, unlike brittle fracture in wrought iron
which generally initiates from carbides. Cleavage fracture initiation sites were located by
tracing the river lines associated with the brittle fracture back across the fracture surface to
their source. Research carried out by McRobie and Knott [52], Bose [22], Novovic [13] and
do Patrocinio [15] have identified inclusions to be the cause of cleavage fracture with C-Mn
welds. Investigations have been carried out to investigate if a crack inclusion, from which a
sharp crack can propagate into the surrounding ferrite matrix was more detrimental to fracture
toughness than a decohered inclusion from which the crack has blunted. Although after
numerous results and analysis from both fracture toughness and blunt notched bend
specimens no obvious difference were observed.
Tweed and Knott [7] carried out extensive hardness measurements of the constituents of αall,
αW and αC of the AD microstructure of a C-Mn, and found that αall was softer than the other
constituents of the weld. It was therefore hypothesized that an inclusion within the grain
boundary allotriomorphic ferrite initiated fracture, due to local plasticity being concentrated in
these softer regions. Also it was thought that the large size of these regions of grain boundary
allotriomorphic ferrite allowed for larger dislocation pile-up lengths to form against the
inclusion, thus making these sites more likely for cleavage fracture nuclei. Initiating cleavage
fracture inclusions were found to be in the top 1% of distribution of inclusion size, as
measured from the ductile fracture surface. However, the model did not take into account the
effect of the inclusion chemistry or residual stresses. An overview of fracture in C-Mn weld
metals was carried out by Tweed and Knott [143], which suggested that inclusions might
induce tessellated stresses as a result of the differential thermal contractions between the
matrix and the inclusion on cooling. These stresses are described by the following equation:
( )[ ]Tim ∆−Φ= αασ . . .(2.6)

P a g e | 51
where αm and αi are coefficient of thermal expansion for the matrix and inclusion respectively,
∆T is the positive temperature change and Φ is a function of the elastic properties of the
matrix and the inclusion and its size, shape and distribution.
1. If αm < αi a void will form between the inclusion and the matrix, if the bonding of the
interface between them is weak.
2. If αm > αi on cooling the inclusion will be subject to radial compressive and tensile
circumferential stresses which reduce as a function of the reciprocal radius cubed.
Values of αm and αi suggested that manganese silicate inclusions commonly found in welds
case (1), and that from manganese sulphide case (2) would both be true. Suggesting that not
only does inclusion chemistry affect the surrounding microstructure, but it also effects the
stress field surrounding the inclusion. The estimated maximum values of the circumferential
stress σcm is related to the matrix yield stress σmy by the following expression:
3my
cm
σσ =
. . .(2.7)
2.6.9.3 Microstructural differences in toughness of multipass welds.
Tweed and Knott [7] investigated differences in toughness of a multipass weld. Due to the
nature of multipass welding, two microstructures are created AD and RH within the weld
metal. The work simulated regions of the RH microstructure by radio-frequency induction
coil heating and water cooling; it was noted that the RH microstructural regions exhibited a
significant increase in toughness compared to the AD microstructure. Novovic [13]
confirmed this in a recent study, using C-Mn weld metal, and carefully positioning notches

P a g e | 52
(Charpy tests) and pre-cracks in fracture toughness testing in real AD and RH
microstructures, therefore sample one on microstructure. The results from the Charpy tests
showed the ductile-to-brittle transition was lower for the RH microstructure compared to the
AD microstructures within the same weld metal; a difference was also noted in the upper shelf
energies of the Charpy tests, with the RH microstructure showing lower upper shelf energies
than those of the AD microstructure. Similar differences were also noted in fracture
toughness experimental results.

P a g e | 53
Chapter 3 - Fracture Mechanics.
3.1 Linear Elastic Fracture Mechanics
3.1.1 The Griffith Theory
In order to explain the reasons for differences between the predicted and actual
experimentally obtained values of fracture strengths of glasses and crystals (i.e. two orders of
magnitude lower that the theoretical fracture strength of a solid, of the order of E/10), Griffith
[144] considered propagation of brittle cracks in glasses and postulated that a crack would
extend under the applied stress only if the total energy would be decreased. Thus comparing
the decrease in elastic strain potential energy with energy needed to create new crack surfaces.
Griffith [145] derived the fracture stress, σF, for an infinite plate of unit thickness, with a
through-thickness crack of length 2a, and the crack is lying normal to the direction of the
applied stress, σ, at infinity, Fig. 3.1, considering thermodynamic energy balance between
surface energy required and strain energy released for the crack to advance. The fracture
process was not focussed at the crack tip, fracture stress can be defined as:
2
1
2
=a
EF π
γσ . . .(3.1)
in the case of plane stress, where E is Young’s Modulus. The equivalent expression for plane
strain loading is:

P a g e | 54
( )2
1
1
2
−=
a
EF νπ
γσ . . .(3.2)
where ν is Poisson’s ratio (0.27-0.30).
The Griffith’s approach allowed for the consideration of the sample as a whole, therefore not
considering the highly strained region surrounding the crack tip and yet obtaining a useful
fracture stress expression.
Equation 3.1 can be rewritten as:
γπσ2
2
=E
a . . .(3.3)
The strain energy release rate, G, is defined by the left hand side of the equation and can be
considered that the potential energy release rate represents graphically the slope of change in
energy with respect to crack length (δU/δa). It also represents the surface energy increase and
may be designated as crack resistance, R, with fracture occurring when G exceeds the critical
value, Gc, and must be at least equal to R.
RGE
a
E
ac
c ===22 πσπσ
. . .(3.4)
Although the Griffith theory in its original forms exhibits poor agreement when there is
plastic deformation occurring ahead of the crack tip, this is the case for most ductile materials

P a g e | 55
when fracture is being considered. For example, assuming the crack size, a, and the surface
energy γ, the predicted fracture stress values though equations 3.1 and 3.2 were considerably
lower than those seen experimentally.
The general rule of defects with decreasing fracture strength consists of the inverse square
root relationship between the fracture stress and crack length. Irwin [146] and Orowan [147]
independently suggested the Griffith theory for ideally brittle materials could be modified and
applied to metals that exhibit some degree of plasticity if the work completed is close to the
crack tip and completed during plastic deformation is considered in calculations, Fig. 3.2.
( )( )
2
2
1
1
2
−+
=a
E peF νπ
γγσ . . .(3.5)
where γp represents the energy exhausted in the plastic work necessary to produce unstable
crack propagation, thus prior to the onset, for relatively ductile materials γp >>2γe becomes:
( )2
1
21
−=
a
E pF νπ
γσ . . .(3.6)
This equation although modified is still limited to defining conditions required for stability of
an ideally sharp crack, this presents problems for practical applications, as the linear elastic
approach relates fracture stress to crack length, even through crack-tip plastically was
preceding fracture.

P a g e | 56
3.1.2 The Stress Intensity Factor Approach
Following on from the solutions of Westergaard [148] and using linear elastic theory Irwin
[146] developed the stress intensity approach. He showed that the elastic stress field in the
region of a crack tip takes the form:
( ) ..2
+= θπ
σ ijijj fa
K . . .(3.7)
where σijj is the stress component;
f ij is a geometrical factor in the direction of ij;
K is the stress intensity factor;
θ and r are the cylindrical polar co-ordinate of a point with respect to the crack tip.
Equation 3.7 is only valid for a singular elastic stress field; any plasticity disturbs this stress
singularly.
Within the vicinity of a crack tip all stress systems may be derived from three simple modes
of loading, Fig. 3.3. For these cases, the stresses in the vicinity of the crack tip for a crack
length 2a, in a biaxially loaded infinite plate (Fig. 3.4) are given by:
Mode I

P a g e | 57
( )yxz
xy
y
x
va
a
a
a
a
a
σσσ
θθθππστ
θθθππσσ
θθθππσσ
+=
=
+=
−=
2
3cos
2cos
2sin
2
2
3sin
2sin1
2cos
2
2
3sin
2sin1
2cos
2
. . .(3.8)
Equation 3.8 shows that all the stresses tend towards infinity at the crack tip (e.g. a = 0), these
are the products of the geometrical position ( ) ( )θπ fa2
1
2−
and a factor of ( )2
1
aπσ . This factor
determines the magnitude of elastic stresses in the crack tip field, in the case of Mode I the
stress intensity factor KI is:
aK I πσ= . . .(3.9)
Mode II
( ) 0,
2
3sin
2sin1
2cos
2
2
3cos
2cos
2sin
2
2
3cos
2cos2
2sin
2
==+=
−=
=
+=
yzxzyxz
IIxy
IIy
IIx
va
K
a
K
a
K
ττσσσ
θθθπ
τ
θθθπ
σ
θθθπ
σ
. . .(3.10)
where for an infinite cracked plate with uniform plane shear τ at vicinity:

P a g e | 58
aK II πτ= . . .(3.11)
Finally for Mode III
0
2cos
2
2sin
2
====
=
=
xyzyx
IIIyz
IIIxz
a
Ka
K
τσσσ
θπ
τ
θπ
τ
. . .(3.12)
where
aKIII πτ= . . .(3.13)
The above equation shows the stress intensity factor, however it is not suitable for practical
applications as it’s obtained for an infinite plate. The expression has to be modified for
practical applications, with a finite size, by adding correction factors. Mode I loading (pure
tension) whilst under plane strain (triaxial stress state) conditions is most important to
consider in metals for practical cases, and thus analysis is focused on this mode. The general
form of the modified expression is:
=W
aafCK I πσ . . .(3.14)

P a g e | 59
where C and
W
af have been determined for each case by the stress analysis, and W is the
width of the specimen. For Charpy size specimens (10x10x55mm), KI is defined by the
following equation, considering all limits are satisfied [149]:
=W
af
BW
PSK I
2
3 . . .(3.15)
where
2
3
22
1
12
12
7.293.315.2199.13
−
+
+−
−
−
=
W
a
W
a
W
a
W
a
W
a
W
a
W
a
W
af . . .(3.16)
From the application of virtual work principle (e.g. calculating work by surface forces acting
across length δa when the crack increases in length from a to a+δa [146]) it can be seen that K
is associated to the strain (or potential) energy release rate, G in plane stress conditions by:
E
KG
21= . . .(3.17)
and in plane strain

P a g e | 60
( )221 1 ν−=
E
KG . . .(3.18)
where ν is Poisson’s ration, thus at fracture (plane strain):
( )22
1 ν−=E
KG IC
IC . . .(3.19)
Where the fracture toughness of the material, KIC is critical stress in Mode I loading subjected
to tensile stress. It can also be considered a materials parameter and represents the material’s
resistance to brittle fracture. Unstable crack propagation can be defined using both KIC and
GIC, although KIC is generally used to characterise the fracture resistance of the materials due
to the difficulties in calculating GIC. KIC is used in linear elastic fracture mechanics and can
be either numerically or mathematically determined by the technique of elastic stress analysis
for various kinds of geometries and stress systems. The method by which KIC is determined
has been standardised a British Standard BS 7448: Part 1: 1991 [149] using testpieces of
varying geometries and that have been fatigue pre-cracked.
Combining equation 3.9 for perfectly brittle (elastic failure) and rearranging with equation at
failure in Mode I loading and in plane strain conditions, gives:
( )aEGIC
F 21 νπσ
−= . . .(3.20)
Thus placing GIC = 2γp in to the above equation gives the original Griffith relationship. It
should be emphasised that values obtained experimentally from fracture stress tests of critical

P a g e | 61
strain energy release rate, GIC, and “effective surface energy”, γp are distinct parameters.
Using equation 3.6 for a given microcrack with size half-length 1µm and known cleavage
fracture values, usually ranging from 2-14 Jm-2, experimental values for γp can be obtained.
However, using typical values for ferritic steels at low temperature of E = 206MPa, ν = 0.33
and KIC ≈ 50MPam½ into equation 3.19, values of GIC are obtained in the order of 104Jm-2.
The reason for the difference in results is because σF and therefore γp are related to the local
tensile stress in the process zone of the crack tip and therefore only consider events at instant
infinitesimal crack extension (δa).
3.1.3 Critical Tensile Fracture Stress, *fσ
Using blunt-notched bend specimens Knott studied the local critical tensile stress,*fσ , for
transgranular cleavage fracture [150, 151]. It was established that this parameter depended
weakly upon the test temperature if cleavage was slip-induced. Many other researchers have
ascertained similar results for a selection of steels with different microstructural conditions
over a low temperature range, mainly quenched and tempered steels [9-11, 152, 153], weld
metals containing lath-microstructure [22], C-Mn weld metals [7, 13, 52], C-Mn bainitic
steels [154] and MnMoNi weld metals [14, 15]. These assumed that cleavage fracture stress
*fσ was inversely proportional to the square root of the corresponding initiating feature within
the microstructure, e.g. second phase particles and non-metallic inclusions. A modified
Griffith equation was used to predict values of the effective surface energy, γeff, as shown in
equation 3.6.
3.1.3.1 Effective Surface Energy, γeff
Cleavage fracture was analysed by Curry and Knott [155] in spheroidised plain carbon steels,
given that the statistical distribution of carbide particles for these steels is less complicated
than that of grain boundary carbide films in a ferritic matrix. The model was based on the
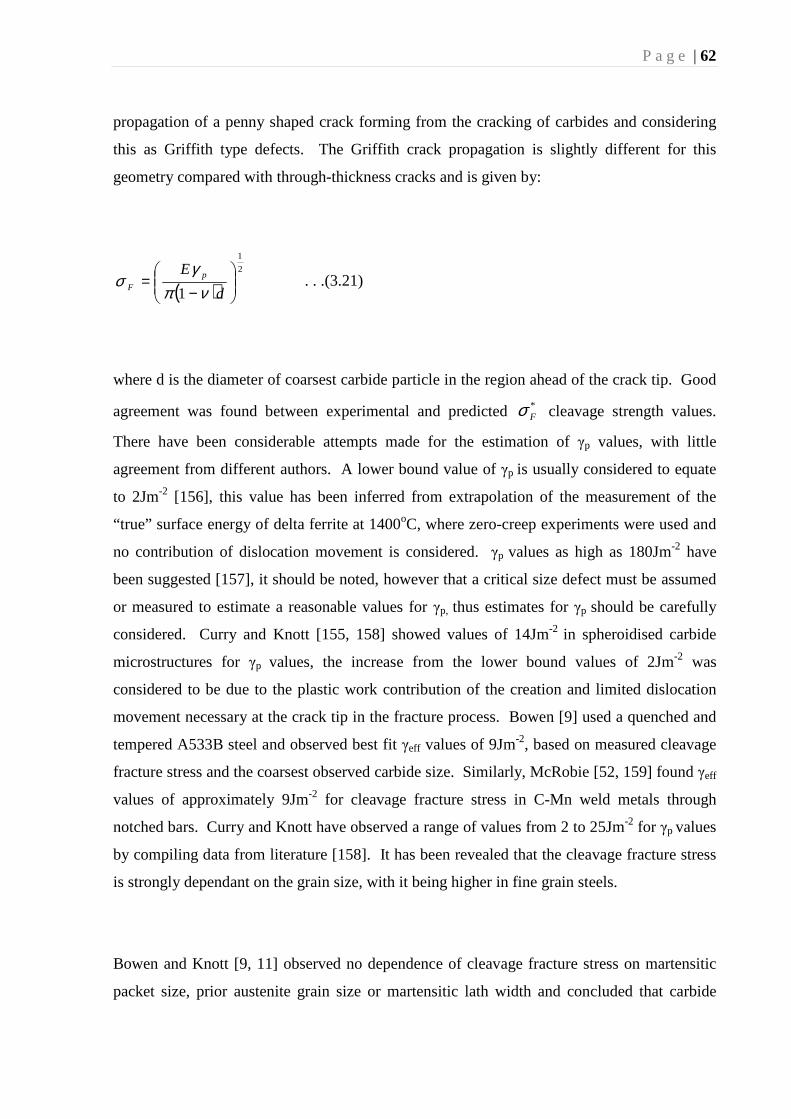
P a g e | 62
propagation of a penny shaped crack forming from the cracking of carbides and considering
this as Griffith type defects. The Griffith crack propagation is slightly different for this
geometry compared with through-thickness cracks and is given by:
( )2
1
1
−=
d
E pF νπ
γσ . . .(3.21)
where d is the diameter of coarsest carbide particle in the region ahead of the crack tip. Good
agreement was found between experimental and predicted *Fσ cleavage strength values.
There have been considerable attempts made for the estimation of γp values, with little
agreement from different authors. A lower bound value of γp is usually considered to equate
to 2Jm-2 [156], this value has been inferred from extrapolation of the measurement of the
“true” surface energy of delta ferrite at 1400oC, where zero-creep experiments were used and
no contribution of dislocation movement is considered. γp values as high as 180Jm-2 have
been suggested [157], it should be noted, however that a critical size defect must be assumed
or measured to estimate a reasonable values for γp, thus estimates for γp should be carefully
considered. Curry and Knott [155, 158] showed values of 14Jm-2 in spheroidised carbide
microstructures for γp values, the increase from the lower bound values of 2Jm-2 was
considered to be due to the plastic work contribution of the creation and limited dislocation
movement necessary at the crack tip in the fracture process. Bowen [9] used a quenched and
tempered A533B steel and observed best fit γeff values of 9Jm-2, based on measured cleavage
fracture stress and the coarsest observed carbide size. Similarly, McRobie [52, 159] found γeff
values of approximately 9Jm-2 for cleavage fracture stress in C-Mn weld metals through
notched bars. Curry and Knott have observed a range of values from 2 to 25Jm-2 for γp values
by compiling data from literature [158]. It has been revealed that the cleavage fracture stress
is strongly dependant on the grain size, with it being higher in fine grain steels.
Bowen and Knott [9, 11] observed no dependence of cleavage fracture stress on martensitic
packet size, prior austenite grain size or martensitic lath width and concluded that carbide

P a g e | 63
width was the only microstructural controlling feature. It was also suggested [7, 52] that non-
metallic inclusions are responsible for initiation of cleavage fracture in C-Mn weld metals
under certain circumstances. This theory which was supported by microstructural
information, gave rise to the proposal for the model for C-Mn weld metals, which was
developed by analogy from previous models in wrought mild stress for cleavage. The model
carefully considered that plasticity was confined to grain boundary ferrite. Encourageing the
inclusion to crack, which in turn would act as a cleavage initiation site, if a critical diameter
and tensile stress level were attained. Thus cleavage would then propagate though grain
boundary ferrite.
3.1.4 Linear Elastic Fracture Mechanics (LEFM)
3.1.4.1 Fracture Toughness Testing
Linear elastic fracture mechanics can be used to describe the condition of unstable crack
growth when the extent of the crack tip is limited plastically, even though structural materials
do not behave in a purely elastic manner during fracture. Plane strain fracture toughness, KIC,
can be considered a materials property that is dependent upon temperature and loading rate of
the test. According the standards ASTM E399-90 and BS5447:1977 two types of samples
can be used; the single edge notched bend testpiece (SEN) and compact tension testpiece
(CT), Fig. 3.5 and 3.6.
The specimen size required to give a valid KIC have to fulfil plane strain conditions, so triaxial
stress state is obtained and the stress intensity analysis is unaffected by the plastic zone size
and high constraints can occur around the crack tip. After extensive experimental work the
following empirical minimum size of specimen was derived:

P a g e | 64
B and a
2
5.2
≥
ys
ICK
σ . . .(3.22)
and
2
0.5
≥
ys
ICKW
σ . . .(3.23)
where a is the initial crack length of the specimen, B is the thickness of the specimen and σys
is the yield stress at test temperature. Low alloy ferritic steels normally have a low yield
strength ranging from 400 to 500MNm-2, consequently elevated toughness, meaning the size
of the test piece required to satisfy the valid KIC criteria in equation 3.22 would be very large
indeed.
Wessel [160] used compact tension specimens of different sizes, up to 300mm thick, shown in
Fig. 3.7, also shown are the results obtained for an A533B Grade B Class 1 steel (1.35%Mn,
0.5%Ni, 0.23%C, 0.5%Mo) heat treated to a yield stress of 500MNm-2 at room temperature.
For SEN specimens the stress intensity factor is given by the following equation:
=W
af
BW
PSK
2
31 . . .(3.24)
and for the CT specimen by the following equation:

P a g e | 65
=W
af
BW
PK
2
11 . . .(3.25)
For a valid test KIC it is first necessary to compute a tentative value of KQ based on a graphical
construction of a load-displacement test record. If KQ satisfies the condition of equation 3.22
then KQ=KIC. Most structural materials present considerable toughness, thus the size of the
testpiece is large for a valid KIC test and awkward to test with conventional equipment. It
should be considered that the amount of material necessary to obtain a virtually constant
toughness value is also a drawback, mainly when considering the testing of rector pressure
vessel steels. Thus the determination of KIC of structural materials is not always practical and
other testing methods need to be considered, as well as the effects of the plastic zone size of
the stress intensity approach which have to be limited to quantify the fracture toughness
properties of these materials, but plane strain fracture toughness represents the lower limiting
critical toughness of a material.
3.1.4.2 The Crack Growth Resistance Curves Concept (J-R and δ-R
Curves)
When both ductile and brittle fracture occurs in the same testpiece the R-curve concept can be
used to address this problem. This method is used to make quantitative estimates of the
increase in resistance to fracture as the crack is growing by “resistance curves” or “R-curves”
and can be defined as:
( )da
UdR γ= . . .(3.26)

P a g e | 66
where Uγ is change in elastic energy of the loaded uncracked plate, U0 is a result of the
formation of crack surfaces. Crack instability will occur when the elastic energy release rate
is greater that crack resistance:
RG ≥ . . .(3.27)
The crack resistance R is considered to independent of crack extension ∆a, if the plane strain
condition is satisfied (Irwin’s analysis). But a raising R-curve may develop as crack length
increases in plane stress or intermediate plane stress-strain conditions, thus on loading a thin
sample containing a crack, stable crack growth will occur up to the point of plastic collapse of
general yielding of the sample or before instability and fracture.
Various standards detail how to obtain crack extension resistance curves, for example the
British Standard BS7448-4:1997 [161] and GKSS 94/E/60 [162]. As there are two specimen
designs that can be used of the KIC test, choice will be dependent upon crack orientation and
quantity of available material. There are also two techniques available to determine crack
extension; multiple and single specimen methods. In the single specimen approach the crack
extension is monitored via an unloading compliance technique where loading slopes are
produced at specific intervals during the tests, these can be used to estimate the crack length at
each unloading interval. The multiple specimen method as regarded is the definitive approach
3.1.4.3 Slow Notched Bend Testing
Slow notched bend testing is mainly utilised to distinguish both mechanical and
microstructural effects on the micromechanisms of cleavage fracture. There is a large amount
of research relating to the behaviour in slow blunt notched test specimens, meaning there is
more known about the plastic-elastic stress distributions ahead of the notch in the process

P a g e | 67
zone of interest, than in pre-cracked specimens (Knott [144]). The elastic-plastic stress
distribution around a notch, as analysed by Griffith and Owen [163] using finite element
methods, predicted the variation of tensile stress, σ11, ahead of the notch as a function of the
applied load (general yield stress). The maximum tensile stress, at failure σ11(max), is defined
as the microscopic or local cleavage fracture stress, *Fσ , this was related to the size of the
microcrack through a modified Griffith equation of the form [164]:
d
E pF
)1(
42
*
νπγ
σ−
= . . .(3.28)
Where d is the size of defect and γp is the “effective surface energy”.
Curry and Knott [155] studied cleavage fracture in a spheroidised plain carbon steel relating
*Fσ to the size of a microcrack through a modified Griffith equation for a penny-shaped crack
Equation 3.21. Both of these equations can be used to estimate the value for γp from the
linear relationship between the reciprocal square root of the microcrack sizes (crack initiation)
and the measured values for *Fσ . It should be noted that γp values are an estimate, as the
intrinsic cleavage fracture stress is inconsistent and depends on local characteristics of the
material.
3.1.5 Elastic Plastic Fracture Mechanics (EPFM)
As discussed the Linear Elastic Fracture Mechanics approach (LEFM) is useful when used to
analyse a material with intrinsic brittle behaviour, where plane strain conditions can be
satisfied. LEFM can be applied to modifications to materials that exhibit limited crack
plasticity. However, structural materials are usually too ductile, because of their high
toughness to be dealt with using such principles; hence the Elastic-Plastic Fracture Mechanics

P a g e | 68
(EPFM) approach extends the description on fracture behaviour beyond the elastic regime.
Two approaches can be used to predict the crack initiation behaviour of the material; Crack
Tip Opening Displacement (CTOD) [165, 166] principally developed in the UK, and the J-
integral [165-167] energy balance developed in the USA.
3.1.5.1 Crack-Tip Opening Displacement (CTOD)
The concept of CTOD was introduced by Wells [166-168] as an alternative idea to Irwin
[146]. Wells assumed that crack opening displacement (COD) was directly proportional to
tensile strain after general yielding had been achieved, Fig. 3.8. Under general yielding
conditions, plastic flow is not constrained: the plastic zone spreads over the entire cracked
section. The crack was expected to propagate when the plastic strain at the tip exceeded a
critical value. The measure of strain is COD and the fracture criterion is critical COD.
Wells attempted to explain why small scale test specimens, which had been removed from a
large section ship-plate, fracture after generally yield with fibrous fracture appearance
compared to the ship-plate which had fractured before general yielding. In the latten case the
fracture surface showed a crystalline appearance of more than 90%, when tested at the same
temperature. Wells evaluated COD by using Irwin’s estimate of the plastic zone size and
employing an elastic solution for the displacement of a centred crack in an infinite body, Fig.
3.9.
( ) YS
I
E
kaR
ECTOD
RaECOD
σπσ 24
244 ===>
+= . . .(3.29)
It can be seen from the above equation that CTOD is equivalent to KIC when linear elastic
fracture mechanics criteria are applied. As a result, small scale tests could be performed to
overcome the dimensional limitations imposed by the KIC test from measuring fracture
toughness of ductile materials.

P a g e | 69
Measurement of this distance ∆ or COD can be referred to as δc, the critical CTOD at the
point of fracture, this is expressed as:
2
1
22
222
16
4
+−=∆= δ
σσ E
xaE
COD . . .(3.30)
Alternative models for CTOD were developed by Burdekin and Stone [169], which were
based on the Dugdale model, shown in Fig. 3.10. This model described the crack-tip opening
displacement for a crack of length 2a, in an infinite thin plate which is subjected to uniform
tension (σ) in a material, where plastic deformation occurs at the crack tip, this is given by
[40]:
=
ys
yst E
a
σπσ
πσ
δ2
secln8
. . .(3.31)
Equation 3.31 was obtained for tensile loading allowing for the measurement of critical COD,
δC for small scale testpiece which fractures after general yielding. This can be used to predict
fracture stress σ, of a large scale structure fracturing before general yield. Crack tip opening
displacement, CTOD can be applied to the assessment of the integrity of structures, under
linear elastic fracture mechanics, δt and can be directly related to KI:
ys
It E
K
σδ
2
= . . .(3.32)
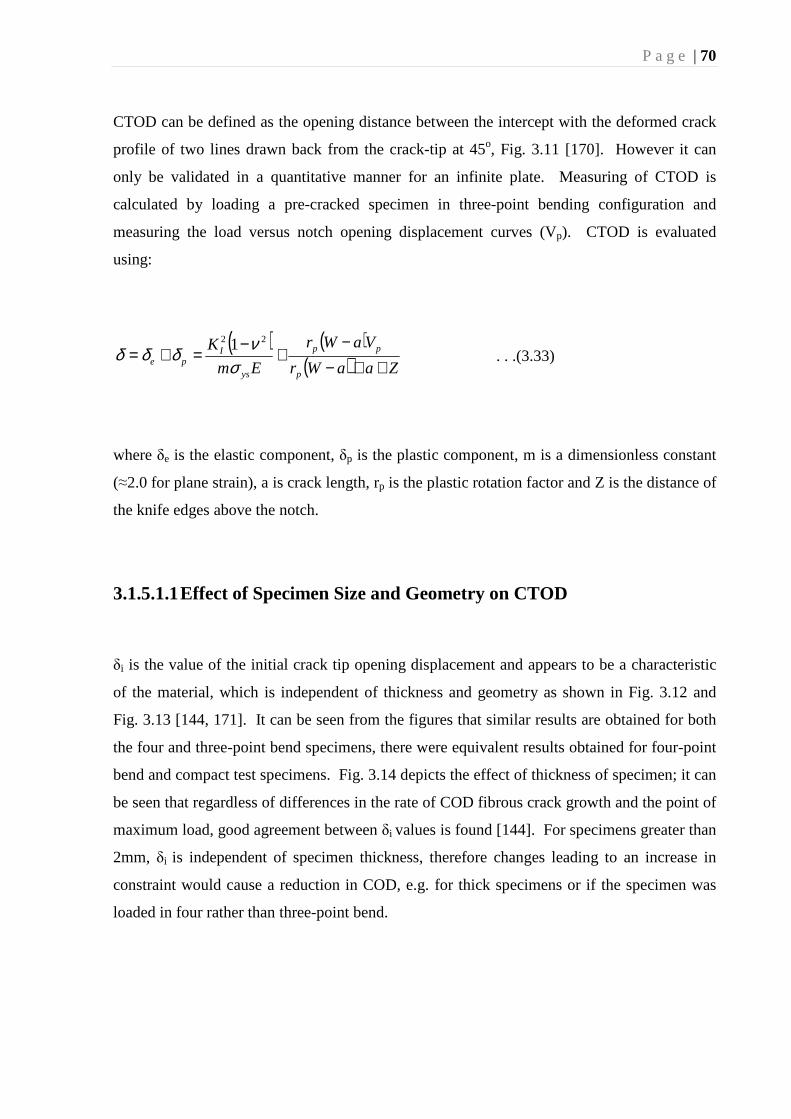
P a g e | 70
CTOD can be defined as the opening distance between the intercept with the deformed crack
profile of two lines drawn back from the crack-tip at 45o, Fig. 3.11 [170]. However it can
only be validated in a quantitative manner for an infinite plate. Measuring of CTOD is
calculated by loading a pre-cracked specimen in three-point bending configuration and
measuring the load versus notch opening displacement curves (Vp). CTOD is evaluated
using:
( ) ( )( ) ZaaWr
VaWr
Em
K
p
pp
ys
Ipe ++−
−+
−=+=
σνδδδ
22 1 . . .(3.33)
where δe is the elastic component, δp is the plastic component, m is a dimensionless constant
(≈2.0 for plane strain), a is crack length, rp is the plastic rotation factor and Z is the distance of
the knife edges above the notch.
3.1.5.1.1 Effect of Specimen Size and Geometry on CTOD
δi is the value of the initial crack tip opening displacement and appears to be a characteristic
of the material, which is independent of thickness and geometry as shown in Fig. 3.12 and
Fig. 3.13 [144, 171]. It can be seen from the figures that similar results are obtained for both
the four and three-point bend specimens, there were equivalent results obtained for four-point
bend and compact test specimens. Fig. 3.14 depicts the effect of thickness of specimen; it can
be seen that regardless of differences in the rate of COD fibrous crack growth and the point of
maximum load, good agreement between δi values is found [144]. For specimens greater than
2mm, δi is independent of specimen thickness, therefore changes leading to an increase in
constraint would cause a reduction in COD, e.g. for thick specimens or if the specimen was
loaded in four rather than three-point bend.
P a g e | 71
Effects of constraint are more important in terms of cleavage fracture initiation, for example if
general yield is attained before the critical COD value at the crack tip (the piece is brittle) or if
the specimen is big enough that the δcrit is attained by general yielding (the piece is ductile)
[144, 172]. As a consequence cleavage fracture depends on the maximum attainable stress
ahead of the crack tip and hence on the test piece constraint, while the maximum load failure
depends upon plastic collapse of the ligament [173]. These such size effects on CTOD are
summarised in Fig. 3.14 [172], also it should be noted that using side-grooves to inhibit
through-thickness yield can increase the constraint.
3.2 Microscopic Models For Cleavage Fracture
Griffiths proposed a theory for brittle fracture considering the presence of sharp crack like
defects within the material. Except, materials always contain some microscopic flaws but not
all will be of sufficient size to produce catastrophic failure. It should be noted that cleavage
fracture initiation is always preceded by some local deformation or plastic yielding, as shown
by Low [174]. In this experiment, Low used iron tensile specimens, for a given grain size
fracture in tension and yield in compression were at the same stresses, as shown in Fig. 3.15.
It was also demonstrated by Knott [144], that cleavage fracture is preceded by local yielding
because twinning or slip is necessary to initiate a microcrack. Hence the following sections
consider cleavage fracture to be initiated by slip.
3.2.1 Stroh’s Theory
Zener [175] first discovered the concept that cracking initiates from a dislocation pile-up
against a barrier, it was proposed that a pile-up was a potential stress raiser and concentrated
tensile stress ahead of it might be high enough to initiate a crack. Stroh [176, 177] later used
Zener’s theory to analyse the conditions required to nucleate and propagate a crack in front of
a dislocation pile-up, shown in Fig. 3.16. Using a presumption similar to the Petch [178]

P a g e | 72
model for yielding, both models are based on the process by which mobile dislocations are
produced in the unyielding grain, a relationship was obtained between the materials grain size
and cleavage fracture stress:
2
1−+= dkFiF σσ . . .(3.34)
where kF refers to critical value of tensile stress required to fracture the second grain with a
diameter of d. This predicts in fine-grained materials the increase in cleavage fracture stress,
but gives no clear indication of the meaning of kF and does not explain why there is variation
of fracture stress in grain size from experimental results as shown in Fig. 3.17. Stroh [176,
177] investigated the meaning of kF. The calculated that the magnitude of the maximum local
tensile stress, ahead of a pile-up of dislocations, σθθ, where θ is equal to 70.5o to the direction
on the slip-band propagation, necessary to propagate a Griffith like microcrack nuclei, is
expressed as:
( )ir
d ττσ −
=2
1
5.70 23
2 . . .(3.35)
where r is the distance from the pile-up, d is the grain diameter, τ is the shear stress and τi is
the friction stress, thus substituting this stress into the Griffiths equation, the conditions
influencing the spread of the nucleus can be written as:
( )2
1
12
−≥−=
dieff νπµγτττ . . .(3.36)

P a g e | 73
where ν is Poisson’s ratio, d is the slip-band length (grain diameter), µ is the shear stress
modulus, γ is the surface energy, and τeff is the effective shear stress. If a crack nucleus can
form, there is a decrease in the total energy of the system with increasing nucleus length; this
is assuming that the total surface energy created by the growing crack is constant throughout
the fracture process. It also assumes that the cleavage is nucleation controlled, that the
number of dislocations present is enough to nucleate a crack and may be squeezed together at
the end of a slip band. The critical number is given by [144]:
bn
effτγπ
2
2
= . . .(3.37)
where b is the Burgers vector of the dislocation. It can clearly be seen from the above
equation that assuming there is constant effective shear stress, fewer dislocations, e.g. short
slip-band lengths, are required to nucleate a microcrack in a material which has a low surface
energy. If tensile stress is made the most important parameter, fracture should be growth-
controlled rather than nucleation controlled, as shown experimentally by Orowan [147, 179]
and Parker [180], Fig. 3.18. However equation 3.44 shows this is impossible, but Stroh’s
theory can be applied to the cleavage fracture of steels if some brittle second phase provides a
low surface energy region and the fracture is controlled by nucleation. However Cottrell [41,
42, 165] argued that crack propagation is the most difficult step rather than its nucleation [22,
181], therefore the process is growth controlled, as explained in the following section.
3.2.2 Cottrell’s Theory
An easy nucleation process was proposed by Cottrell [42], a different dislocation mechanism
for crack nucleation in cleavage fracture, allowing the growth to be the influencing factor.
This mechanism of cleavage is based on an energetically favourable dislocation reaction in
bcc materials as shown in Fig. 3.19. Consider a dislocations in bcc iron, with Burgers vectors
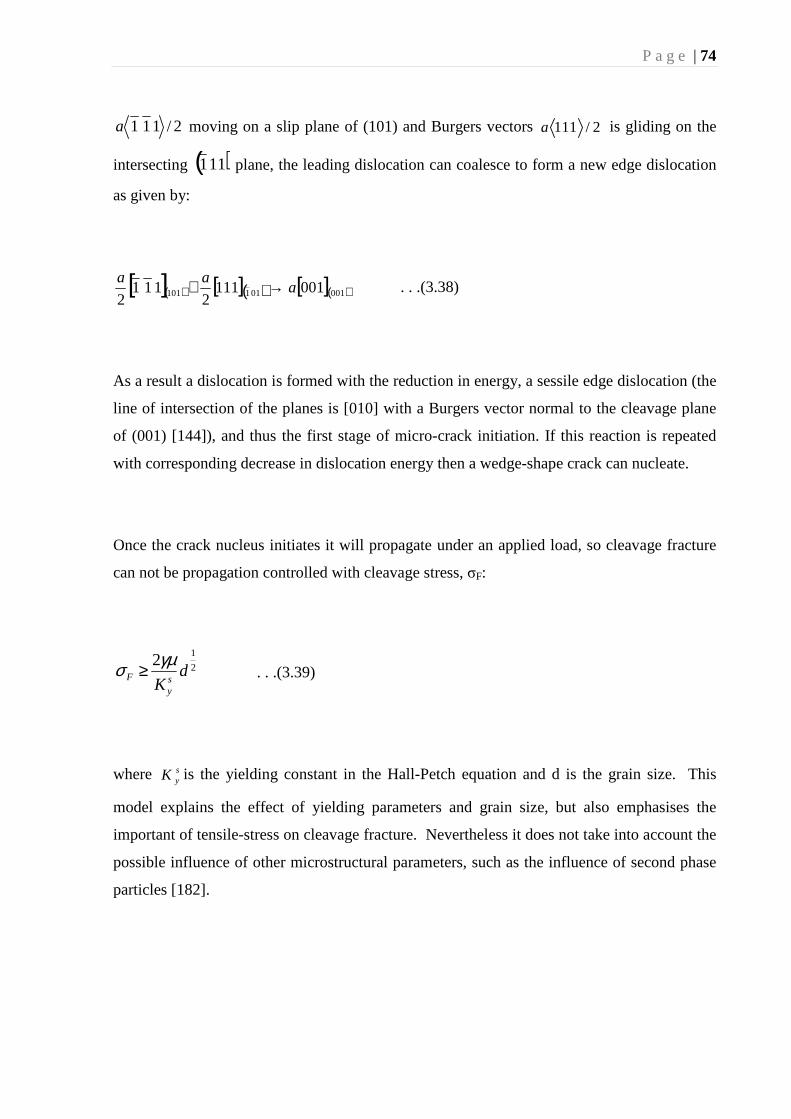
P a g e | 74
2/111a moving on a slip plane of (101) and Burgers vectors 2/111a is gliding on the
intersecting ( )111 plane, the leading dislocation can coalesce to form a new edge dislocation
as given by:
[ ]( ) [ ]( ) [ ]( )001011101 0011112
1112
aaa →+ . . .(3.38)
As a result a dislocation is formed with the reduction in energy, a sessile edge dislocation (the
line of intersection of the planes is [010] with a Burgers vector normal to the cleavage plane
of (001) [144]), and thus the first stage of micro-crack initiation. If this reaction is repeated
with corresponding decrease in dislocation energy then a wedge-shape crack can nucleate.
Once the crack nucleus initiates it will propagate under an applied load, so cleavage fracture
can not be propagation controlled with cleavage stress, σF:
2
12d
K sy
F
γµσ ≥ . . .(3.39)
where syK is the yielding constant in the Hall-Petch equation and d is the grain size. This
model explains the effect of yielding parameters and grain size, but also emphasises the
important of tensile-stress on cleavage fracture. Nevertheless it does not take into account the
possible influence of other microstructural parameters, such as the influence of second phase
particles [182].

P a g e | 75
3.2.3 Smith’s Theory
The initial model of complementary growth controlled cleavage fracture that incorporated the
effects of carbides was proposed by Cottrell [42, 165]. Latter research observed in tensile
specimens that grain boundary carbide and pearlite lamellae cracked prior to cleavage fracture
[183, 184], McMahon and Cohen [182] studied tensile specimens made from very low
carbon steels, over a low temperature range and observed the occurrence of cleavage micro-
cracking, the results showed that coarse carbides promoted cleavage, whilst fine carbides
allowed the material to behave in a ductile manner. On the basis of these experiments, Smith
[185] proposed a theoretical cleavage model for mild steel, this included the effect of the
stress field from the dislocation pile-up required to nucleate a microcrack, shown in Fig. 3.20.
Based on Stroh’s analysis for steel, the fracture stress σF required for a micro-crack to
propagate from a grain-boundary carbide of thickness C0 with a grain-size d is given by:
( )daE
d
C
d
C eff
eff
ieffF 2
2
2
1
0220
1
41
νπγ
ττ
πτσ
−≥
++
. . .(3.40)
where σF is the critical values of tensile stress to propagate the nucleus, τeff is the effective
shear stress (τapp, applied shear stress minus the lattice friction stress, τi), γeff is the effective
surface energy concerned in propagating the microcrack nucleus into the ferrite matrix. From
the above equation it can be seen that both the first term, known as a “Griffith’s term” and the
second term are related to the stresses that arise from dislocation pile up. For annealed mild
steel, researchers have approximated that the overall effect of stress arising from the
dislocation pile up on crack propagation is less than 10% [186, 187]. This is even smaller in
the case of spheroidal carbides, because the dislocation arrays are not in the form of grain-
diameter length pile-ups but as loops twisted around individual particles [187]. Thus, the
contribution of the dislocation pile-up can be discounted; the criterion reduces the Griffith
relationship for grain-boundary carbide microcrack of length C0:

P a g e | 76
( ) 021
4
C
E pF νπ
γσ
−> . . .(3.41)
Rewriting τeff as 2
1−dK S
y in terms of the Hall-Petch relation [178, 188, 189] (Equation 3.42),
means equation 3.40 can be re-written as:
( ) ( ) ( )2
2
2
1
0
220 1
441
v
E
KCKC eff
sy
isyF −
≥
++
πγτ
πσ . . .(3.42)
From this equation is can be seen that cleavage fracture stress is independent of grain size d.
However, as Curry and Knott [155] pointed out carbide thickness is often related to grain size,
thus from this theory it is easier to predicted that finer grain size may promote a higher
fracture resistance.
3.2.4 Measurement of the Microscopic Cleavage Fracture Stress
Tensile specimens were used to evaluate fracture stress as presented in previous research
[182-184]. Tensile testing has numerous disadvantages, with the main influence being the
testing machine, whether this is in displacement or load control. Also the temperature range
at which cleavage fracture occurs prior to necking, this is very limited or nil, in some cases
low alloy ferritic steels tested at liquid nitrogen temperature (-196oC) exhibited some degree
of yielding prior to catastrophic failure. Knott [150, 151] applied slip-file theory to notched
bend specimens to evaluate fracture stress when it was coincident with yielding, but this
method has limitations as the notch geometry needs to be varied to determine cleavage
fracture stress over a wide range of temperatures.

P a g e | 77
Griffiths and Owen [163] used a four-point bend testpiece to analyse the elastic-plastic stress
distribution around a blunt notch, using finite element analysis and calculated the maximum
principal stress, σyy, as a function of the distance below the notch, Fig. 3.21 and 3.22.
Maximum tensile stress is defined as microscopic cleavage fracture stress, which is located
within the plastic zone. At low loads distribution is similar to that predicted by slip-field
theory, whereas at high loads, in a strain-hardening material the maximum σyy occurs at a
great distance away from the plastic/ elastic interface. More recent research in to ferritic
steels and weld metals, Bowen [9-11, 152, 153] and McRobie and Knott [7, 52], established
that cleavage fracture is controlled by microscopic cleavage, furthermore microscopic
cleavage fracture stress is expected to be independent of notch geometry and test temperature.
3.3 Fracture Criteria for Precracked Specimens
3.3.1 Microstructural Effects on Cleavage Fracture
When designing engineering structures, great emphasis is placed on brittle fracture of metals,
where it is assumed that cleavage occurs when the stress intensity factor exceed a
“macroscopic” or “engineering” value of fracture toughness, KIC. Techniques have been
developed that collate metallurgical features to microscope applied fracture stress, such as the
size of any defect within the material. Many researchers have investigated if a crystal
cleavage event could be defined as an extension of cracked carbide, an inclusion, a M-A-C
constituent, or pearlitic carbides.
Fracture of mild steels is believed to occur when a microcrack occurs at brittle grain-boundary
carbide and propagates at the critical tensile stress into the ferrite matrix. Smith’s [190]
model predicts cleavage fracture stress is mainly affected by the carbide precipitates in
contrast to experimental results that demonstrate that σF is dependent on grain size. However
Curry and Knott showed [155, 191] that in normalized and annealed mild steels there is a

P a g e | 78
general relationship between grain size and the largest grain-boundary carbide width.
Confirming that lack of grain size dependence on Smiths model is overcome by an increase in
the carbide thickness with increase in grain size. Okumura [192] measured σF values of steel
where carbide and grain sizes variations are independent, thus concluded that regardless of
increasing fracture resistance for fine-grain sizes, the effects of grain-boundary carbide size
on cleavage fracture is the principal factor controlling the fracture stress.
Weld metals have different initiators for cleavage than those in wrought steels. A model was
proposed by Tweed and Knott [7] for cleavage fracture in the AD microstructure of C-Mn
weld metal after non-metallic inclusions were found to act as a cleavage microcrack initiator
within this microstructure. McRobie [52], Novovic [13], Wenman [14] and do Patrocinio
[15] showed that a large variety of inclusions are responsible for cleavage fracture initiation.
Research carried out on pearlitic steel [193-195] showed that the nuclei for cleavage fracture
could be a microcrack or small oxide inclusion, nucleating across numerous pearlitic carbides.
Also different variations in toughness within the weld metal are known to occur due to
inclusion population, which contains oxides formed during the deoxidation process. More
recent studies have shown that the most important factor influencing toughness [7, 10, 13-15,
52] is the microstructure. Within weld metals inclusions are associated with initiation which
is fibrous in nature through the coalescence of voids around them. Detailed examination of
these inclusions could not find any clear differences in the chemical composition of the “void-
initiating” and “crack-initiating” inclusions. Knott [113, 196] rationalised that there could be
subtle differences and these could be associated with a sulphide shell around the inclusion.
More recently, Miao [76] showed that C-Mn weld metal contained large “patches” of
sulphide, resulting from the application of different cooling rates, these generally seem to
have higher fracture toughness than the same material with fewer patches, it was also noted
that there were differences in the cleavage initiation modes, these may have arisen from
different inclusion surface features.
Weld metals are treated with warm prestressing (WPS), because after this operation the
distribution of cleavage fracture initiators changes. Reed and Knott [113, 197, 198] used
P a g e | 79
A508 weld metal and showed that after WPS treatments the low-temperature fracture
load/fracture toughness increase, this was primarily due to the compressive residual stress
distribution generated during the WPS, also it is associated with the change in nature of the
fracture initiation sites. When looking at specimens that were not treated with WPS, initiation
sites corresponded to the largest inclusion in a “well-behaved distribution”, whereas for WPS
specimens they are associated with inclusions with a size close to the mean of the size
distribution, large inclusions were observed to have voids around them. It was concluded that
during WPS treatments the inclusion matrix interface for large inclusions was decohered at
low levels of strain, thus they could not act as cleavage initiation sites following low
temperature fracture. Under these condition fracture need to be initiated by a smaller
inclusion without interface decohesion so that statistically determined critical distance X0 in
the Ritchie, Knott and Rice (RKR) [199] model is also changed in comparison to the non
WPS specimens.
As shown in Fig. 3.23 if cleavage fracture occurs after ductile crack growth, the inclusions in
the weld material may not be the cleavage initiator. This is due to the fact that local
conditions under which cleavage fracture begins, ahead of a blunted crack tip are not the same
as those ahead of a sharp crack at low temperature because the plastic strain distribution ahead
of the crack-tip is different in both cases. In the former case the plastic strain over a large
distance is very high so that any likely inclusion microcrack nucleus produced near the yield-
point strain would be blunted to become a non-virulent crack nucleus for cleavage fracture,
see Fig. 3.23(c) and 3.23(d). Knott [113] therefore suggested that any microcrack nucleus
would have to be newly formed in a conceptually different set of particles. Zhang and Knott
[200-202] also demonstrated that ahead of a fibrous growing crack, voids formed around
inclusions and cleavage is nucleated between inclusions, probably on MAC products.

P a g e | 80
3.3.2 The Ritchie-Knott-Rice Model
Ritchie-Knott-Rice (RKR) [203] used experimental data from blunt notched four-point bend
specimens for values of σF and combined these with crack tip stress fields obtained from a
finite element solution (i.e. stress-strain distribution ahead of a sharp crack [204] or blunt
notch [163]). The objective was to incorporate micro-scale fracture properties, e.g. cleavage
fracture stress σF and the characteristic distance X0, into the prediction of fracture toughness
parameters (J, CTOD and KIC) has been made as cleavage fracture is stress controlled.
Measurements were obtained for KIC for high-nitrogen mild steel, using conventional fracture
toughness methods. Consistency among the results was obtained for a characteristic distance,
equal to two grain-diameter, Fig. 3.24. The RKR fracture criteria model can be combined
with fracture mechanics analyses to derive a general expression for cleavage fracture
toughness, KIC:
( )( )
( )
= +
+
+−
2
1
2
1
2
1
02
1
n
ys
n
F
n
IC XK
σ
σβ . . .(3.43)
where β is the amplitude of the RKR stress singularity
σys is the yield stress
n is the strain hardening exponent.
Therefore from the knowledge of microscopic parameters, X0, n, σF and σy and considering
these are temperature independent, the microstructural, temperature and strain rate
dependence of the fracture toughness in steels can be estimated. X0 should be empirically
determined.

P a g e | 81
3.3.3 Statistical Approach (RKR) model
Curry and Knott [158, 191] investigated the grain size dependence of the characteristic
distance X0. There was no simple relationship of significance found between the two
parameters, as shown in Fig. 3.25, it can also be seen that the characteristic distance is about
four times the grain size, this applies to grain diameters greater than 40µm. Based on carbide
size, Curry and Knott proposed a probabilistic model to predict fracture toughness, KIC, this
followed on from their modification on the RKR model:
YrK ysIC2
1
σ= . . .(3.44)
where r is the mean particle radius and Y is dimensionless number derived from carbide
particle and crack - tip stress distribution. Curry and Knott’s [158, 191] modification and the
RKR model are of the same form.
In order to find a particle larger than the critical size that will nucleate cleavage the
characteristic distance is used as a measure of the material volume. In a testpiece containing a
sharp crack, the critical size of the cracked carbide varies with the distance from the crack-tip
due to the stress gradient ahead of the sharp crack, in other words larger particles will need
lower stresses to nucleate cleavage and vice versa. Thus fracture is controlled by a statistical
competition among crack nuclei of varying frequencies and sizes. It has been suggested for
blunt notched testpieces, the largest cracked carbide particles will define the microscopic
fracture stress because of the absence of a microstructurally significant stress gradient and
large sampling volume. From the carbide size distribution and the relationship with carbide
size and the microscopic cleavage fracture stress, they predicted fracture toughness values

P a g e | 82
which displayed good agreement with the experimental results obtained for quenched and
tempered steel.
As a consequence of the work carried out by Curry and Knott into the effects of carbide size
distribution on temperature dependence of fracture toughness many researchers have looked
into the influence of cleavage crack initiators, which have found non-metallic inclusions or
carbides to be the source, there has been a lot of research carried out into weld metals. Bowen
used an A533B pressure vessel steel to examine the dependence of cleavage fracture stress, σF
and fracture toughness KIC for a wide range of microstructural conditions, it was noted that
the experimental values obtained for the KIC model were in poor agreement with those
predicted for the RKR model.
3.3.4 The relationship between microscope cleavage fracture
stress (σ* f) and macroscopic toughness parameter KIC
Ritchie, Knott and Rice [203] first discovered the relationship between the microscopic
parameter of cleavage fracture stress (σ*f) and fracture mechanics methodology. Rice and
Johnson [204] had published a paper similar to Griffith and Owen concerning finite element
analysis of a stress field ahead of a blunting crack, where as Griffiths and Owen [163] had
used a blunt notch. It was postulated that unstable fracture happened when the stress
intensification at the crack tip increased the value of the maximum principal tensile stress
(σyymax) to above that of microscopic cleavage fracture, σF. Also it was noted that the distance
had to be included for the model to be dimensionally correct. “Characteristic” distance was
thought to be microstructurally dependant and determined approximately by two grain
diameters. The RKR model suggest both the fracture stress and the critical distance were
independent of test temperature and thus temperature dependence of KIC could be calculated
from the materials variation of yield stress and working hardening rate in relation to test
temperature.

P a g e | 83
3.4 Ductile Fracture
Ductile fracture has not been investigated as much as brittle fracture, as brittle fracture is
generally regarded more potentially dangerous in engineering practice. The mechanism for
ductile fracture is characterised by a rough fracture surface, showing cup-like depressions
which are called microvoids, these are characterised by equiaxed, parabolic or elliptical in
shape [40]. The mechanism of fracture is whereby the microvoids form and grow which then
proceeds by localized internal necking of the material between the microvoids Fig. 3.26 [205].
As the load increases, necking continues and allows the ligaments between voids to fail
linking up the microvoids (coalescence) such, the remaining ligament of material cannot
support the applied load and thus final failure occurs [206-208]. Microvoids nucleate
heterogeneously on hard second phase particles or at the grain boundary triple points in high
purity metals. Generally, voids occur around particles which have very weak interfacial
bonds, this occurs at strains close to zero, although well bonded particles may crack, thus
forming void nuclei. Numerous authors have defined critical void nucleation stress (σc) as the
sum of the mean local stress (σloc) and hydrostatic stress (σm) due to strain hardening in the
vicinity of a second phase particle.
locmc σσσ += . . .(3.45)
this can be expressed as an average strain for void nucleation of εN
( )mcN H σσε −=2
1
. . .(3.46)
where H is a constant

P a g e | 84
Conversely, it was concluded that the average nucleation strain, εN, did not describe
accurately the real nucleation events, it was Iricibar [206] whom suggested that nucleation
could be more accurately modelled by the knowledge of particle size and spatial distribution
rather than an average strain level.
The mechanism of ductile failure combines both nucleation and growth of voids. Numerous
researchers [205, 209, 210] have modelled the growth of voids during ductile failure, but it is
the model by Rice and Tracey [211], which is mostly widely accepted and used. Their
research modelled a single isolated void growing under the action of a triaxial stress state.
The effects of work hardening on void growth by the replacement of yield stress by effective
stress were included in the model. This model for void growth has been used and modified by
many authors, except it does not describe failure where voids interact and coalesce. Ductile
failures occur when plastic instability initiates localised bands of deformation between voids,
these tend to be regions of high strain. A model for ductile failure was developed by
Thomason [212], in which it was assumed that fracture occurs when the net section between
the two voids reaches a critical stress level σn(c).
Ductile crack is stable if:
1)( σσ >+ bd
dcn . . .(3.47)
thus fracture occurs if
( ) 1σσ =+ bd
dcn . . .(3.48)

P a g e | 85
where 2d is the distance between voids
2b is size of void in the direction of the stress,
σ1 maximum principal stress
3.5 Ductile-to-Brittle Transition Region (DBTT)
The ductile-to-brittle transition region is of major importance when selecting materials for
engineering use. The philosophy of design is to select a material which exhibits sufficient
notch toughness when subjected to rigorous service conditions so that the load-carrying
ability of the structural member can be calculated by standard strength of materials criterion
without considering the fracture properties of the material or stress concentration effects of
cracks or flaws [40]. In the case of low and medium-strength BCC materials the transition
region is very important, as notch toughness is strongly dependant on temperature. BCC
metals show a strong temperature dependence of yield and shear stresses and this is reflected
in ductile-to-brittle temperature.
Specimen geometry and hence stress also influence the DBTT greatly. For instance, a
reduction of the specimen dimension significantly reduces the transition temperature due to
the absence of a triaxial stress state. Conversely, the addition of a stress raiser (notch)
significantly increases the transition temperature as the root of the notch introduces triaxial
stress state.
In the previous section it is has been extensively discussed that a critical value of principal
tensile stress σF must be achieved at the critical distance ahead of the advancing stable crack
for cleavage then to occur. Thus, if the stress level is not attained in the process zone the
testpiece fails by plastic collapse or general yielding.

P a g e | 86
For Charpy impact tests, the transition region is characterised by “ductile thumbnail”, the
initial growth of stable fibrous crack growth, before cleavage fracture occurs. The cleavage
brittle to fibrous ductile transition behaviour in BCC metals can be explained by numerous
reasons [113, 144, 213]:
1. Increase in the strain rate caused as a consequence of increasing the rate of ductile
crack growth would be sufficient to increase the local tensile stress ahead of the crack
tip above the critical cleavage fracture stress and hence cleavage fracture proceeds.
2. In the situation of heterogeneous materials such as weld metals, the ductile crack
grows across different microstructures within the weld material. Therefore the process
zone ahead of the crack samples regions with different toughness, therefore a region of
low toughness is within the process zone. Thus the critical tensile stress for cleavage
failure may then be exceed for this brittle region and a crack could appear. Although,
if the tougher material surrounding the crack is not able to arrest, then catastrophic
failure will ensue. The brittle region within the weld could be characterised by a
region of large grains, coarser hard cracked particles or any discontinuity, making
cleavage fracture in heterogeneous materials a statistical process.
3. If we consider a testpiece with a stress-raising defect in it, or a notch, under applied
tensile stress, the notch beings to open and ductile tearing begins at the root. This
region just below the notch can form a crack, and therefore sharpen the crack, thus
increasing the levels of stress in the specimens. The sharpening of the notch root
depends strongly on the strain hardening coefficient of the material, n. Low values of
n result if a sharpened fibrous tip, where as high values of n lead to a blunted ductile
crack tip. Cleavage fracture of a catastrophic nature is more likely to occur and be
aided by the first situation.

P a g e | 87
3.6 Intergranular Failure
When considering the transition region it is important not to ignore fracture that occurs by
intergranular micromechanisms. Both brittle fracture and fibrous microvoid coalescence can
occur intergranularly in a manner similar to transgranular crack growth. Intergranular failure
is associated with alloy element segregation to grain boundaries, thus reducing the cohesive
strength of the material. In high-strength forging steels intergranular fast fracture has been
know to occur down the prior austenite grain boundaries due to their embrittlement by minor
impurity elements such as phosphorus and sulphur, this segregation mechanism can lead to a
low energy crack path for fracture to follow [214, 215].
Transition to intergranular fracture from transgranular fracture has been observed and often
accompanied by a significant reduction in fracture stress. A modified Griffith equation can be
used to explain the transgranular fracture as for transgranular cleavage fracture stress if γp is
replace by γ’:
pBs γγγγ +−= 2' . . .(3.49)
where γp and γs are the same for cleavage fracture and γB is the negative term associated with
separation of grain boundaries. Impurity segregation reduces both fracture stress and γ’
values. The process of brittle intergranular fracture must include bond breaking, work
hardening, dislocation motion and a description of how individual impurity elements reduce
the strength of bonds, a greater understanding of this has been achieved through various
models. It is possible for intergranular fracture to occur in a fibrous manner by the linking of
voids around second phase particles, for this to occur the alloy must exhibit high density of
weakly bonded second phase grain boundary particles, and show few particles intergranularly.
Intergranular microvoid coalescence (MVC) is generally rare when operating at low
temperatures, as MVC is a lower energy crack path that transgranular cleavage is not often

P a g e | 88
found. However occurrence of these failures can occur in “overheating” of low alloy steels,
where a fine array of sulphide particles are distributed on the austenite grain boundaries
leading to only local grain boundary plasticity, therefore low energy linkage of voids and
particles.

P a g e | 89
Chapter 4 - Experimental.
4.1 Introduction
The Welding Institute (TWI) during the 1980’s carried out an experimental programme for
the Nuclear Installations Inspectorate (NII) to investigate the effects of several welding
parameters: weld consumables (NiMo and NiCrMo), post weld heat treatments (both
American and European practices) and the extremes of heat inputs of those envisaged in
practice (lowest 2.6 kJ/mm and the highest 5 kJ/mm) [216]. Fracture toughness and Charpy
impact tests were carried out using full thickness and small-scale COD specimens followed
by metallographic examination. During the experimental procedure microstructural
evaluation was only considered in notched COD specimens in the weld metal and HAZ
regions. Recently extensive work has been carried out on C-Mn weld metal steel showing the
microstructural effect on Charpy impact toughness in both an as-received and pre-strained
condition [13]. Following on from this Wenmen [14] studied this effect on an as-received
condition of an A533B weld and Patriocinio [15] studied the microstructural effect on Charpy
impact properties of A533B Class 1 weld metal in the as-received, pre-strained, pre-strained
and static strain aged conditions. As a result of these studies a programme was started to
study the fracture toughness properties of MnMoNi weld metal, with similar composition to
those use in the fabrication of Sizewell B, in the as-received and pre-strained and static strain
aged conditions.

P a g e | 90
4.2 Experimental
4.2.1 Material
The material used in the study of this work was a MnMoNi weld metal produced by ESAB
Group Plc and was commissioned by the Nuclear Installations Inspectorate Health and Safety
Executive (NII HSE) in 2000. The weld was designed (i.e. base metal, welding process
parameters and consumables where chosen) to produce a weld of similar characteristics to the
start-of-life of the Sizewell B reactor pressure vessel (RPV). The composition of the weld
material is presented in Table 4.1; however there are slight variations in composition, mainly
in the copper content, due to the use of copper coated electrodes in the welding process and
the welding parameters from the guiding procedures used during the construction of Sizewell
B. The weld was accordingly deposited by a multipass submerged arc welding technique
(SAW), using C-Mn parent plates. The welding parameters and post weld heat treatment are
given in Table 4.2 and 4.3. The weld was supplied in the form of C-Mn plates, approximately
25mm thick and 150mm wide, in 500mm lengths. The weld preparation was “V” shaped with
a 25mm base and a 60o bevel supported with a backing plate 12.5mm thick and 50mm wide.
A digital camera image and a schematic diagram of an as-received (AR) weld metal piece are
shown in Fig. 4.1. The macrostructure of the weld showing the welding sequence and size of
the as-deposited beads and reheated regions are shown in Fig. 4.2 (Weld No1) and 4.3 (Weld
No2). The macrostructure was revealed by taking transverse cross-sections which were
ground sequentially on SiC papers to P1200 grade, polished on diamond wheels to 1µm and
etched in a solution of 5% nitric acid and 95% ethanol. The weld microstructural regions
after PWHT procedure are labelled AR here, Fig. 4.4.
4.2.2 Materials Plan
At the beginning of the project material was acquired from a previous experimental
programme [15], therefore was limited in supply, and used for the initial assessment of crack-
tip opening displacement (CTOD) values. An additional 10 meters of weld (20 pieces) were

P a g e | 91
fabricated (as the experimental programme expanded) to the same specifications as the initial
weld metal. The batches were labelled as Weld No1 (for the original weld) and Weld No2 (for
the New Weld). For the first weld batch, no attention was paid to individual weld piece
labelling and therefore no record for individual specimen history exists. For the second weld
batch, however individual pieces were coded and are referred to as Weld No2-I, …., Weld
No2-XX. Therefore the history of all specimens machined from this batch is known.
4.3 Thermo-Mechanical Heat Treatments
Mechanical and fracture toughness properties of the low alloy ferritic steel weld metal have
been evaluated for both microstructures: as-deposited (AD) and reheated (RH) in two
conditions, namely: as-received (AR) and 5% cold deformed and static strain aged at 300oC
for 2h (5%SA). The thermo-mechanical heat treatments utilised in this study are described
below.
4.3.1 Cold Deformation Procedure
Slices were removed from the as-received main weld run, and then subjected to a 5% nominal
strain. These slices measured approximately 12mm in thickness. The cold deformation
procedure was completed using a calibrated 3000 kN Dension Press, direction of the
prestraining was perpendicular to that of the welding direction. The amount of plastic
deformation was determined by measuring the thickness of the specimen both before and after
the prestraining procedure at 3 different points. The samples are placed, one by one in
between two anvils (extremely hard flat dies) with the top and lower surfaces lubricated with
oil to reduce the frictional resistance between the surfaces which are in contact. The mean
and standard deviation values were than calculated for each specimen, thus an average
thickness measurement is quoted. The amount of plastic deformation was shown to be within

P a g e | 92
a constant range of 5±0.6%. A schematic diagram of the cold deformation procedure is
shown in Fig. 4.5.
This prestraining treatment was used on the weld metal to simulate potential effects of
irradiation. It should be noted that the cold deformation process was applied to the weld
blocks they and were subsequently machined into Charpy, crack-tip opening displacement
and blunt notch test specimens works in compression. To avoid the Bauschinger effect [40,
41] the tensile specimens, were electro-discharge machined (EDM) from the weld blocks in
the AR condition and plastically deformed in tension, then statically strain aged, before being
tested at the desired temperature.
4.3.2 Static Strain Aged Condition
The pre-strained specimens from both the AD and RH microstructures were then thermally
treated for 2 hours at 300±15oC using a Lenton vacuum tube furnace to protect the specimen
surface from oxidation. The temperature of the heat treatment is similar to that of the normal
operating inlet temperature of a PWR, which is approximately 290oC [6, 9]. The operating
pressure of the Lenton vacuum furnace chamber during the treatment is 1.33 10-4 Pa. These
specimens are labelled as (5%SA).
4.4 Material Characterisation
4.4.1 Microstructural Analysis
The microstructure of the weld metal was examined by taking transverse cross-sections from
the bulk material, Fig. 4.6. These were prepared according to a standard metallographic
preparation route. Plane grinding of the samples was completed to remove damaged or
deformed surfaces of the weld metal were plane ground on SiC papers to 1200 grit, fine
P a g e | 93
ground on 9µm diamond paste and then finally polished on 3 and 1µm diamond paste and
etched in 2% Nital to reveal the microstructure of the weld. The microstructures were then
photographed using a Carl Zeiss Axiolab optical microscope with digital image capture.
Some of the micrographs taken were then used for grain size analysis by the linear intercept
method, as well as using the KS-400 image analysis software to analyse phase area percentage
[40, 217].
4.4.2 Inclusion Analysis
Inclusion analysis was carried out on both Weld No1 and Weld No2 for samples from each of
the weld metal regions; AD and RH microstructures in the as-received (AR) and 5% strain
aged (5%SA) conditions. The samples were mounted in resin, ground and polished. The
unetched sections were observed and photographed using a Philips XL-30 scanning electron
microscope (SEM) in the secondary electron mode using high contrast. Nine fields were
sampled randomly without overlap for each sample; the pictures were analysed using KS-400
image analysis software. The inclusions appear as dark areas on a light grey background
allowing the size and number to be measured for each photograph. An off-set inclusion
diameter was used of 0.2mm; therefore inclusions under this size were not recorded. The
spatial distribution of the inclusions were calculated using the following relationships [218]:
2
π=a
v
d
d . . .(4.1)
vva dNN = . . .(4.2)
( )3
6
v
vv
d
VN
π= . . .(4.3)

P a g e | 94
( )2
vvv dNS π= . . .(4.4)
3
1
1554.0
=
vv N
λ . . .(4.5)
Where vd is the arithmetic mean 3-D diameter
ad is the arithmetic mean 2-D diameter
Na is the number of inclusions per unit of area
Nν is the number of inclusions per unit of volume
Vν is volume fraction
λv is the mean inclusion centre to centre volume spacing
Sv is the inclusion surface area per unit volume
Energy dispersive X-ray (EDX) was used to analyse the chemical composition of the
inclusions, which was carried out using the Philips XL-30 SEM, using broken halves of the
Charpy and CTOD specimens. During the qualitative chemical analysis, the electron beam
was positioned at the centre of the inclusion. Working conditions were kept constant, i.e.
accelerating voltage of 15 kV, 0o tilt and a working distance of 10mm.

P a g e | 95
4.4.3 Glow Discharge Spectrometry (GDS)
A LECO GDS-750 QDP Glow Discharge Spectrometer was used for GDS analysis. The
machine, working a quantitative surface depth profile (QSDPA) programme, enables a rapid
determination of the chemical composition profiles, i.e. composition in wt or at % vs. depth
from the surface. The GDS machine has a depth limitation of approximately 100µm.
4.5 Hardness Tests
Both macro and microhardness testing were carried out to examine the effects of pre-straining
and thermal ageing treatments (5%SA) compared with the as-received (AR) condition of both
the AD and RH microstructures. Hardness measurement locations were chosen to correspond
with the region of the weld sampled by Charpy, slow blunt notch tests and CTOD fracture
toughness and tensile test specimens.
4.5.1 Macrohardness
An Indentec Hardness Testing machine was used for measuring macrohardness with an
applied load of 20kg and a 10 second dwell time. Macrohardness profiles were taken to
evaluate the effects of thermal cycles, from the multipass welding procedure. Three profiles
were taken from both the AR and 5%SA conditions, starting from the parent plate material,
crossed the heat affected zone (HAZ), as-deposited (AD) weld bead and reheated (RH)
regions, shown in Fig. 4.7, the profiles were located according to where specimens are located
in relation to the weld macrostructure. Hardness measurements were taken at intervals of
1mm and carried out on polished samples measuring 80x20x4mm, removed from the bulk
material.

P a g e | 96
4.5.2 Microhardness
Microhardness measurements were performed using a Mututoyo MVK-H1 Microhardness
testing machine, using an applied load of 50g and a dwell time of 10 seconds. Measurements
were taken at 0.1mm intervals in the middle of the top weld bead in the AD microstructure,
Fig. 4.8. A second trace was located close to the root of the weld within the RH
microstructure. Microhardness measurements were taken in both the AR and 5%SA
conditions.
4.6 Tensile Tests
Tensile testing was completed using a Zwick 1484 Screw Driven Machine with a 200 kN load
cell, at a cross displacement speed of 0.5mm/min. Low temperature testing (-196 to -20oC)
was completed using an insulted low temperature bath. Liquid nitrogen was used to achieve a
temperature of -196oC. Temperatures -160 to -20oC were obtained by allowing liquid
nitrogen to boil off. Specimens were “submerged” in the required medium or vapour until the
necessary temperatures were reached and stabilised within ±3oC. Test temperatures were
monitored by attaching a thermocouple in the vicinity of the specimen gauge length. Except
for the room temperature tests (where an extensometer was used), the elongation of the
specimens was calculated from the cross-head displacement.
Load versus displacement curves were converted into engineering stress-strain curves and
plotted for individual tests. An extensometer was attached to specimens tested at room
temperature to achieve calculations of 0.2% yield stress, σy0.2% and Young’s Modulus of
elasticity (E). Following testing these values were obtained through expressions of the type;
A
Ps = . . .(4.7)

P a g e | 97
and,
,oL
Le
∆= of LLL −=∆ . . .(4.8)
where s is the engineering stress.
P is the applied load.
A is the area under fracture.
e is the engineering strain.
∆L is the increase in gauge length.
where σTS and σy0.2% can be obtained using maximum load and load at 0.2% strain
respectively. True stress-strain values were achieved using the following relationships
( )1+= esσ . . .(4.9)
and
( )1ln += eε . . .(4.10)
where the work hardening exponent (n) values can be obtained using the simple power curves
relationship (Holloman’s equation) for strains up to the tensile strength [41];

P a g e | 98
nKεσ = . . .(4.11)
where σ is true stress.
ε is true strain.
K is strength coefficient.
n is the work hardening exponent.
Due to the extent of the tensile testing programme a test matrix was required, this detailed
orientation, microstructure geometry and test temperatures, shown in Table 4.4. Fig. 4.9
details the tensile test specimen geometry and Fig. 4.10 illustrates where specimens were
removed from in relation to the microstructure. It should be noted that different tensile
specimen geometry were used due to the size of the weld metal being sampled for Weld No1
and Weld No2 for the mixed microstructure condition only, Fig. 4.11 shows the specimens
unbroken. Even so, the location of a tensile gauge length uniquely into a single
microstructure is difficult.
4.6.1 5% Plastically Deformed and Strain aged at 300oC
For the 5% plastically deformed and strain aged tensile specimens, these were deformed in
tension at room temperature up to a nominal plastic deformation of 5% and then unloaded.
The elongation of 5% was measured using an extensometer attached to the tensile specimen.
The specimens were then placed in the vacuum furnace at 300±15oC, the specimens were
tested within one week to avoid the possible effects of natural ageing on the flow properties,
previous research showed this could be an effect [15]. Also it should be noted that the new
gauge length and area after the 5% plastic deformation procedure were used to determine the
engineering stress-strain curves. These tensile specimens samples individual microstructures
(AD and RH), were tested across the temperature range of -160 to -40oC.

P a g e | 99
4.7 Charpy Tests.
Ductile-to-brittle transition temperature (DBTT) curves have been established over a
temperature range of -196 to 200oC in order to determine the ductile to brittle transition
temperatures of the materials investigated based on two criteria; (i) the T0, transition
temperature, which is a location parameter defined by fitting the obtained DBTT curve with a
Tanh curve, and (ii) the transition temperature, T1, in relation to the onset of upper shelf
(100% microvoid coalescence). The causes of failure have also been examined over the test
temperature range.
Charpy impact testing was performed according to British Standard BS 131: Part 7: 1989
[219] using Charpy specimen with the dimension of 10x10x55mm3. A Charpy V notch
inclusive angle of 45o a depth of 2mm and a root radius of 0.25mm was machined at the
centre of the specimen, as shown in Fig. 4.12.
Charpy impact testing was completed using a 300 J Instron PW30 Charpy Machine calibrated
accordingly to BS 131: Part 7: 1989 [219], at temperatures in the range of -196 to 200oC. The
specimen was located on the anvil and impacted by a hammer where the difference in the
potential energy before and after fracture was recorded as the energy absorbed, see Fig. 4.13.
Different test procedures were employed for Charpy tests below room temperature and at
elevated temperatures. Test temperature were achieved using mediums of liquid nitrogen (-
196oC), and a mixture of methanol and liquid nitrogen (-100 to -20oC) ice water (0oC). These
temperatures were measured using a thermocouple attached to the specimens so that the
temperature could be monitored within ±2oC, which was attached closely to the notch root of
the specimen. Specimens were submerged in the medium for 15 minutes to ensure
temperature stabilization throughout the whole section before testing, which was then carried
out within 5 seconds of the specimen being removed from the medium. For tests carried out
at elevated temperatures, a BLT (B. S. 2648) furnace with a Eurotherm temperatures

P a g e | 100
controller was used; transfer was carried out with 5 seconds in line with the standard
procedure [219].
After fracture, the broken specimen halves were washed in acetone and later removed for
fractographic examination. Fracture surfaces were measured and photographed using a Lecia
VMZ 50 light microscope with attached measuring stage. In addition to the impact energy
absorbed by fracture the specimens and several other properties were measured on the fracture
surface, Fig. 4.14; including cleavage area (percentage of crystallinity) CA, lateral expansion
on the compression side of the specimen, LE, ductile thumbnail size, DT and shear lip, SL:
• Ductile thumbnail size is defined as depth of ductile fracture area below the notch
root;
• Cleavage area is defined as a total area of crystalline portions on the fracture surface,
expressed as a percentage of the original cross-section area of the specimen below the
notch (80mm2);
• Lateral expansion is defined as a difference between the increased thickness (defined
as the height in standard [117] -the vertical dimension of the specimen when placed in
the testing position) due to distortion at the position of impact by the pendulum
hammer and the original specimen thickness (10mm);
• Shear lip size is defined as the maximum dimension of the shear lip in the thickness
direction. The average shear lip is the average measured for the two shear lips on the
fracture surface.
Sigmaplot was used to plot the absorbed energy (J) values against the corresponding
temperature (oC). Hyperbolic tangent curves (Tanh) were weight fitted to these data using
non-linear regression analysis. Values of ductile-to-brittle transition temperature (DBTT) for
each of the microstructure and as-received and strain aged conditions were compared, hence
temperature shifts were obtained. Hyperbolic tangent curves fitted to each set of data using
an expression of the type:

P a g e | 101
−+=
C
TTBAE 0tanh . . .(4.12)
where A,B are constants, (A+B equals the upper shelf energy and A-B equals the
lower shelf energy)
T is dependant variable of test temperature
T0 is a location parameter defining the curve on the temperature axis
C is a constant defining the shape of the curve in the transition region.
The main stages in the regression model are as follows:
• fitting Charpy impact energy data for specific combination of material (weld);
• determination of the temperature T40J , for the as-received and strain-aged conditions
(from individual fitted curves) and calculation of ∆T40J for a particular combination of
conditions.
Two potential drawbacks were identified with the above approach, one in relation to the
methodology and the other to the choice of curve itself. The DBTT was then defined at the
40J energy levels in the evaluation procedure using the data obtained from the Charpy Impact
tests.
Ductile thumbnail extensions (DT) in the DBTT can be estimated at the 40J energy level for
the weld microstructural conditions in the AR and 5%SA conditions through the curve fitting

P a g e | 102
procedure of the ductile thumbnail versus absorbed energy data using linear regression of the
general form:
)(0)40( DTayC JV += . . .(4.13)
thus
a
yCDT Jv 0)40( −
= . . .(4.14)
where y0 and a are constants and CV(40J) is the absorbed energy value at the 40J level.
4.8 Slow Blunt Notch Bend Tests
The approach utilized here uses the FEM elastic-plastic stress analysis of Griffiths and Owen
[163] for the finite element (FEM) calculations of the stress and strain fields surrounding a
blunt notch. This analysis estimates the maximum principal tensile stress (σyymax) ahead of
the notch root essential to promote cleavage fracture in steels. Specimen of two sizes were
tested; Charpy size specimens (10x10x55mm3) dimension with a notch geometry of one third
of the specimen width (3.33mm depth) and 0.25mm root radius and specimens matching the
original sample size of (12.7x12.7x75mm3), with a notch depth of 4.33mm and a root radius
of 0.25mm are detailed in Fig. 4.15 [220]. The notch is one third of the specimen width
ensuring general yield plastic deformation occurs across the minimum section; the notches
were EDM machined precisely to prevent any plastic deformation prior to testing. Testing
was performed in four-point bending as illustrated in Fig. 4.16 and in an insulted low
temperature bath. The tests were carried out at -196oC to allow the specimen to fail prior to
general yielding. Desired test temperatures were achieved using liquid nitrogen -196oC.
Temperature was monitored by attaching a thermocouple into a drilled hole, which was

P a g e | 103
located mid-section of the specimen, 3mm from the notch root to allow for metal-metal
contact. The specimen was held at required temperature for at least 15 minutes and controlled
within ±3oC, prior to loading at a cross-head displacement rate of 1 mm/min. Tests were
carried out using a screw-driven Denison Mayes machine with a 50 kN load cell. The
nominal stress, σnom, was obtained from the tests as described below [163].
( )2
6
aWB
Mnom −
=σ and 2
PLM = . . .(4.15)
Where M is the bending moment calculated in three or four point bending
L is the difference between the inner and outer rollers
P is the fracture load
B is the specimen thickness
W is the specimen width
a is the notch depth
y
nom
σσ
ratio obtained at -196oC from yield strength values allows the appropriate ratio of the
largest values of the maximum principal stress (σyymax) to the yield stress, from the results of
the FEM analysis the stress intensification factor R can be determined from Fig. 3.22, thus the
maximum principal stress, σyymax, can be calculated by:
y
yyRσ
σ max= . . .(4.16)
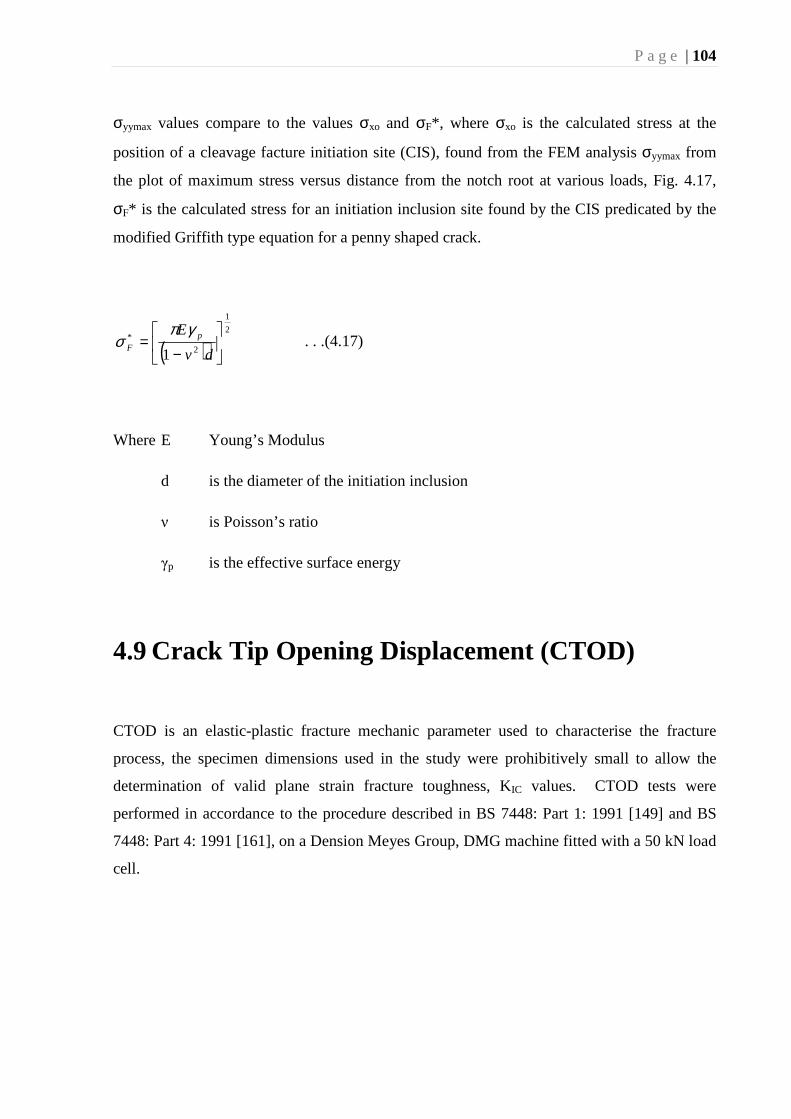
P a g e | 104
σyymax values compare to the values σxo and σF*, where σxo is the calculated stress at the
position of a cleavage facture initiation site (CIS), found from the FEM analysis σyymax from
the plot of maximum stress versus distance from the notch root at various loads, Fig. 4.17,
σF* is the calculated stress for an initiation inclusion site found by the CIS predicated by the
modified Griffith type equation for a penny shaped crack.
( )2
1
2
*
1
−=
dv
E pF
γπσ . . .(4.17)
Where E Young’s Modulus
d is the diameter of the initiation inclusion
ν is Poisson’s ratio
γp is the effective surface energy
4.9 Crack Tip Opening Displacement (CTOD)
CTOD is an elastic-plastic fracture mechanic parameter used to characterise the fracture
process, the specimen dimensions used in the study were prohibitively small to allow the
determination of valid plane strain fracture toughness, KIC values. CTOD tests were
performed in accordance to the procedure described in BS 7448: Part 1: 1991 [149] and BS
7448: Part 4: 1991 [161], on a Dension Meyes Group, DMG machine fitted with a 50 kN load
cell.

P a g e | 105
4.9.1 Test Specimens
Specimens measuring 13x25x80mm3 were cut and machined from the bulk material; the
specimen size was reduced to square cross-sectional bend specimens of nominal dimensions
of 10x10x55mm3 (pre-cracked Charpy specimens) Fig. 4.17. After cutting (similarly to the
Charpy impact test specimen with the transverse notch orientation) the full transverse cross-
sections had to be etched to reveal the macrostructure before the specimen location could be
marked at the desired position and the specimen then machined to it final dimensions. Two
specimen locations relative to the weld were selected in such a way that the fatigue precrack
tip sampled either the AD or RH region. A notch was machined at the centre of the specimen,
for the AD region, the notch was located within the largest weld bead at the centre of the
specimen. Notch orientation relative to the weld and schematic representation of the
specimen sampling AD and RH microstructure, is shown in Fig. 4.18.
4.9.2 Fatigue Precracking
Fatigue precracking was carried out on specimens at room temperature using an Amsler
Vibrophore machine with a 20kN capacity. The maximum fatigue precracking force (Ff)
during precracking extension was lower than 4.2kN, with the maximum stress intensity factor
(KQ) not exceeding 20MPa√m. KQ was calculated using the following equations [149, 161,
221];
=W
af
BW
PSKQ
05.1
. . .(4.18)
and

P a g e | 106
5.1
00
2
20000
5.0
0
0
12
12
7.293.315.2199.13
−
+
+−
−
−
=
W
a
W
a
W
a
W
a
W
a
W
a
W
a
W
af . . .(4.19)
Where
W
af 0 is a compliance coefficient for a three-point bend specimen
P is a relevant load used in the fatigue precracking procedure
S is the span between out loading points
B and W are the specimen thickness and width respectively.
The load ratio used was:
1.0max
min ==P
PR . . .(4.20)
where Pmin and Pmax are the minimum and maximum loads applied over the fatigue load cycle
respectively.
4.9.3 Potential Difference Technique
The potential difference technique was used to measure the status of the fatigue precrack.
Wires were spot welded either side of the notch [222]. The fatigue precrack was initiated and
extended from the notch and grown to a corresponding length of 55.045.00 −=W
a. Current
was applied through crocodile clips which were attached to either end of the specimen,

P a g e | 107
providing an initial voltage of 100µV. Variation in voltage was then used as an indication of
the extension of the fatigue crack, using the following polynomial curve fitting equation
0374.03567.01365.00212.00
2
0
3
00
−
+
−
=
=
V
V
V
V
V
V
V
Vf
W
a iiiii . . .(4.21)
relating to the decreasing notch cross-section due to the crack extension as a consequence of
increasing voltage. The equation was obtained through using replicas on both sides of
randomly selected specimens to measure the crack extension relative to a specific voltage
across the notch, during the fatigue precracking.
4.9.4 Testing
CTOD testing was performed on the fatigue precracked sample on a DMG machine fitted
with a 50kN load cell and testing was carried out in accordance with BS 7448 Part 1: 1991
[149]. Samples were tested using a three-point bend configuration with a 40mm span, the
cross head displacement was 1mm/min, with the clip gauge seated on external knife edges,
shown in Fig. 4.19. Tests were carried out over a range of temperatures from -196 to 20oC, to
achieve low temperature the testing configuration was placed in an insulted bath and filled
with liquid nitrogen, and cooled in the vapour from the boiling liquid nitrogen. The
temperatures were monitored using a thermocouple placed in contact with the specimen
surface within 2mm of the fatigue precrack tip and controlled to within an accuracy of ± 2oC.
After the specimens have fractured, the fracture surfaces were examined to determine the
fatigue pre-crack length and the amount of stable crack growth preceding brittle fracture. The
fatigue pre-crack original crack length, a0, was measured at nine equally spaced positions

P a g e | 108
along the pre-crack front. This is obtained by averageing the two outer points’ measurements
and then averageing the seven inner points, Fig. 4.20, [149, 161, 221].
CTOD values were calculated using the following expression [149, 161]:
( ) ( )ZaW
VaW
EW
af
WB
SP p
YS ++−
+−
=0
022
005.1
1
6.04.0
4.0
2
1.
.
..3
σνδ . . .(4.22)
where P load
B thickness of specimen
W width of specimen
S1 loading span
ν Poisson’s ration
σYS 0.2% proof stress temperature of the fracture toughness test
E Young’s modulus
a0 original notch length
Z distance of clip-gauge location above the surface of specimen
Vp plastic component of the clip gauge opening displacement
W
af 0
0 Walker and May compliance function

P a g e | 109
For three point bending using an overall span to specimen width ratio S(=2S1)W of 4:1. The
stress intensity factor
=W
af 0
0 is defined as:
5.4
0
5.3
0
5.2
0
5.1
0
5.0
000 80.2511.2553.1407.393.1
−
+
−
=
W
a
W
a
W
a
W
a
W
a
W
af . . .(4.23)
Depending on the load versus clip gauge displacement and the amount of stable crack growth,
∆a, prior to brittle fracture, the following notations are used for CTOD, and defined in BS
7448 Part 1: 1991 [149]:
• δc - critical CTOD at the onset of brittle crack extension when ∆a is less than 0.2 mm;
• δu - critical CTOD at the onset of brittle crack extension when ∆a is equal to or greater
than 0.2 mm;
• δm - value of CTOD at the first attainment of a maximum force plateau for fully plastic
behaviour.
4.10 Fractography
Charpy impact specimens fractography was performed on one broken half of the selected
specimen which were tested in the lower and upper shelf energy regions, as well as in the
transition region. Selected halves of tensile, fracture toughness specimens were also analysed,
whilst both halves of the blunt notch specimens were examined. Fractography was carried out
using an Philips XL-30 SEM, Jeol 6060 SEM and an Hitachi-4000S FEG SEM at an
accelerating voltage of 20 kV and 0o tilt.

P a g e | 110
When utilizing energy dispersive x-ray microanalysis (EDX) an accelerating voltage of 15 kV
was used to improve the clarity of the inclusion analysis. Specimens exhibiting brittle
fracture were examined for cleavage initiation sites (CIS), these were located by tracing the
macro and microscopic river lines characterising the fracture surface. Once a site was located
measurements were taken of the distance from the pre-crack (CTOD) or blunt notch root
(where relevant) together with the sizes of the group of the cleavage facets were made for an
estimation of σX0 values.
Groups of cleavage facets were defined subjectively, as individual facets were not precisely
measured because it can be difficult to determine the facet boundary clearly. Facets were
delineated by “eye” and the facet size was measured using Zeiss KS3000 3.0 imagine analysis
software, calculating the minimum and maximum dimension of the facet, as well as its area.
From the area information an equivalent diameter (Feret’s diameter) was calculated by
considering the facet to be circular in shape.
P a g e | 111
Chapter 5 - Results - Materials
Characterisation.
5.1 Introduction
Chapter 5 presents the results for material characterisation, glow discharge spectrometry
(GDS) and hardness testing of the weld metals were obtained for the different
microstructures; AD and RH microstructures and for the as-received and strain aged
conditions: AR and 5%SA.
Characterisation of the microstructural features, i.e. percentage phases, grain sizes and
inclusion distribution/composition of the weld were accomplished through metallographic
examination of the AD and RH regions for the weld metals and conditions above. It should
be noted that measurement of microstructural phases in the AD microstructure was difficult
due to the mixture and the characteristic nature of different forms of ferrite (allotriomorphic,
Widmänstatten and acicular).
Glow discharge spectrometry was utilised to assess the chemical (weight %) composition of
both the supplied welds. Hardness variations were assessed in the microstructure and thermo
mechanical treatments of both welds, as well as profile variations relating to sample locations.

P a g e | 112
5.2 Results
5.2.1 Microstructure
An example of the macrostructure of the multipass submerged arc weld for Weld No1 and
Weld No2 are shown in Fig. 4.2 and 4.3 respectively. Both weld metal materials consist of
two distinctive microstructure: as-deposited, AD and reheated, RH, as well as the parent plate
microstructure, PP. Shown in Fig. 5.1-5.4 are micrographs and SEM images for the PP (Fig.
5.1), AD (Fig. 5.2) and RH (Fig. 5.3 and 5.4) microstructures for Weld No1. Micrographs and
SEM images are shown in Fig. 5.5-5.8, for the PP (Fig. 5.5), AD (Fig. 5.6) and RH (Fig. 5.7-
5.8) microstructures.
Twenty beads were deposited in order to fill the joint and the grain structure clearly indicates
the solidification direction. The joints were filled with variable degrees of overlapping beads,
which result in variable welding geometry and different degrees of refinement. In all the weld
pieces for both weld metals, three beads dominate the top layer, the AD microstructure, which
are elongated ferrite grains formed at different staged of cooling, consisting of a mixture of
allotriomorphic ferrite αall, acicular ferrite αac and Widmänstatten ferrite αW, as well as small
quantities of microphase microconstituents, M-A-C, Fig. 5.9. The RH microstructure consists
fully of equiaxed ferrite grains which originate from the annealing process that occurs during
the multipass submerged arc welding procedure (SAW).
The mean grain size measurement for Weld No2 was 20µm with the actual grain size varying
between 8.4µm and 45.3µm for the RH microstructure and no significant difference in these
grain sizes were noted after 5% plastic deformation and static strain ageing. It should be
noted that the RH microstructure for Weld No1 was measured as part of a previous study and
research programme [15], the mean grain size was 11.1µm, with a minimum and maximum
values of 9.4 and 12.8µm. Also the grain size measurements for the RH microstructure were
performed in the ‘sampling area’ for the different specimens used throughout this work,

P a g e | 113
corresponding to the weld region at the bottom of the weld cross-section. Due to the nature of
the AD microstructure the grain sizes cannot be measured or analysed by the linear intercept
method. The parent plate, coarse RH and fine RH regions of the weld metal (Weld No2) were
analysed using KS 3000 software measuring the ferrite min and max, as well as the D circle
and area of the grains. The parent plate area ranged from 210 to 289µm2 compared with 65 to
153µm2 and 23 to 93µm2 for coarse RH and fine RH respectively.
The elongated ferrite grain structure in the AD weld metal ranged in size from 130 to 220µm
for both Weld No1 and Weld No2, this was distinguishable by the naked eye on the fracture
surfaces. The results of the measured area percentage of the different morphologies within
the AD microstructure for both Weld No1 and Weld No2 lie within the range 46 to 58%
acicular ferrite, 3 to 20% Widmänstatten and 33 to 42% for grain boundary ferrite. Similar
results were exhibited by the corresponding strain and aged condition samples.
5.2.2 Inclusion Analysis
Polished samples of weld metal (Weld No2) were used to obtain a typical distribution of
inclusions. Samples were observed from both microstructures (AD and RH) and in both
conditions (AR and 5%SA), as shown in Fig. 5.10. From the observations and measurements
carried out the results showed that the AD and RH microstructures presented similar 2-D
modal diameter values of 0.53 and 0.48µm, respectively, and overall mean volume fraction
and diameter values of 1.76% and 0.5µm, respectively, as shown in Table 5.1 and Fig. 5.11.
Hence, no clear difference has been noted in the size of distribution of non-metallic inclusions
between the two weld metals. The AD5%SA had a diameter of 0.59µm, a slight increase
compared to the AR condition, whilst the RH5%SA condition observed a slight decrease,
0.45µm. Results within the microstructural conditions are fairly consistent (Table 5.2),
implying the size distribution is relatively unaffected by the multipass SAW welding
procedure and strain ageing.

P a g e | 114
Inclusion diameters carrying from 0.8 to 1.2µm may be considered as the upper end of this
distribution, hence if these are considered as a reliable representation of the overall inclusion
size distribution within the bulk weld metal then inclusions greater than these will represent
less than 1%. From the experimental data it would indicate that the 95th percentile of
measured inclusion diameters is 0.8 to 1.2µm, which is lower than previous data obtained for
Weld No1 of 1.0 to 1.5µm (part of a pervious experimental programme [15] and lower than
2.0 to 2.25µm found by Knott [113, 223] and Curry and Knott [155] for C-Mn weld metals of
a similar confidence level. Those inclusions are produced as a result of deoxidation processes
that occur within the weld pool and it is reasonable to assume a smooth, well behaved
inclusion size distribution.
5.2.2.1 Inclusion Chemical Analysis
X-ray spectra analysis is only a qualitative approach since the relative size of the peaks may
vary between inclusions as well as from point to point within an inclusion. Energy dispersive
x-ray (EDX) analysis was carried out on all four microstructural conditions; ADAR, RHAR,
AD5%SA and RH5%SA, shown in Table 5.3 and Fig. 5.12-Fig. 5.15, respectively. Results
indicated there was no significant difference in the inclusion chemical composition for the
microstructures, although ‘large’ inclusions (≥3µm) and ‘small’ inclusions (≤1µm) show
differences in chemical composition. The highest peaks for the majority of the
EDX spectrums indicate Fe, Cr, Co and Mn constituents. The lower (background) peaks
indicated Al, Ti, C, N, N, and Cu constituents. EDX detected oxygen within some of the
inclusions, therefore it can be inferred these inclusions are a mixture of oxides and/ or
silicates, iron aluminium and carbon are also traced within the inclusions. Inclusions also
contain iron and aluminium and traces or carbon and sulphur. Sulphur may be present as a
coating of the manganese sulphide surrounding the central oxide/ silicate core [224].
The elements were divided into major and minor constituents, based on their peak height to
facilitate comparison, after Tweed and Knott [7]. A dividing line at approximately 30% of the
maximum peak was chosen. The principal difference between large and small inclusions is

P a g e | 115
the presence of Cobalt and a reduction in manganese in inclusions less than 3µm. Cobalt is
not present in the chemical composition Table 4.1, although from the GDS results carried out
on this material; traces were found within the parent plate and HAZ with a reduction in the
weld metal, Table 5.5-5.6.
5.2.3 Glow Discharge Spectrometry (GDS)
Glow discharge spectrometry was applied to both Weld No1 and Weld No2 to compare the
chemical composition to that supplied from ESAB. Table 5.4 lists the chemical composition
supplied for Weld No1, the chemical elements of greatest interest for the GDS analysis are
indicated in yellow. The results from the analysis are shown in Tables 5.5-5.6 and plotted in
Fig. 5.16-5.17 for Weld No1 and Weld No2 respectively. It should be noted that individual
microstructures could not be assessed due to the nature of GDS so it was applied to the parent
plate and the weld material. Measurements are taken to a depth of 100 micrometers, with a
resolution of <0.025nm.
Mo, Mn, C, Ni, Si were all found to be in the range of the weight % as quoted by ESAB.
Both Weld No1 and Weld No2 were found to have virtually no Al present compared with
ESAB’s values of 0.021%. The most significant difference in the observed results was for
Cu, ESAB quoted 0.29% weight, compared with significantly lower levels, Weld No1
exhibited Cu levels of 0.1% and 0.07% for Weld No 2.
5.2.4 Macrohardness
Macrohardness profiles were taken for both Weld No 1 and Weld No 2 in both the AR and the
5%SA weld metal conditions are summarised in Tables 5.7-5.8, and plotted in Fig. 5.18-5.20.
P a g e | 116
Three profiles were taken for both welds and in both the AR and the 5%SA conditions.
Profile Line 1 is in the location where the AD samples were removed. Profile Line 2 refers to
where the RH samples are located and Profile 3 is at the root of the weld. Table 5.7
summaries the results showing lower, mean and upper values of hardness, clearly showing
that for both Weld No1 and Weld No2 in the AR condition Profile Line 1 has a high mean
hardness value compared with that of Profile Line 3. Average hardness values of 188.5Hv
(Profile Line 1) and 161.1Hv (Profile Line 3) for Weld No1 compared with 205.6Hv (Profile
Line 1) compared with 193.7Hv (Profile Line 3) for Weld No2. Similarly for the 5%SA
condition for both welds showed an increase in the average hardness values when compared
with the AR weld metal condition. Average hardness values of 227.4Hv for Profile Line 1 for
Weld 1 5%SA condition compared with 228.3Hv for Weld No2 5%SA comparing these with
the values for Profile Line 3; 200Hv and 197.6Hv for Weld No1 5%SA and Weld No2 5%SA
respectively.
The data collocated from profile data was split into the individual microstructures; parent
plate, RH and AD for both weld metals and for both the AR and 5% conditions, as shown in
Table 5.8 and Fig. 5.21. For Weld No1 for the AR condition the hardness profile in the C-Mn
parent plate had an approximate value of 131 to 160Hv, there was a notable increase in the
AD range from 191 to 220Hv. The RH microstructure exhibited a slight decrease in hardness
ranging from 163 to 191Hv. The hardness profile fluctuates as the profile crosses the AD and
RH microstructure. Increased hardness values were observed in the parent plate, RH and AD
microstructure for the 5%SA condition. The RH microstructure had hardness values of 201 to
221Hv, the AD microstructure had average values of 222 to 257Hv, whilst the parent plate
observed hardness values of 175 to 198Hv.
Weld No2 observed similar trends as Weld No1 for both the AR and 5%SA conditions. For
the AR condition the parent plate exhibiting the lowest average hardness values of 158 to
188Hv, compared with 192 to 215Hv and 216 to 234Hv for the RH and AD. Similarly for the
5%SA condition the parent plate the average values ranged from 172 to 199Hv, whilst the RH
microstructure ranged from 200 to 223Hv and 225 to 253Hv for the AD microstructure.

P a g e | 117
Generally Weld No2 exhibited higher hardness values for both the AR and the 5%SA
conditions compared with Weld No1. Macrohardness indents, shown in Fig. 5.22 indicate that
the AD microstructure has smaller indents than the RH microstructure.
5.2.5 Microhardness
Microhardness profiles for RH and AD microstructures in both the AR and 5%SA conditions
for both Weld No1 and Weld No2 are shown in Table 5.9, and illustrated in Fig. 5.23-5.24.
For Weld No1 the reheated as-received profile (RHAR) ranged from 175 to 234Hv, compared
with the as-deposited as-received profile (ADAR) which ranged from 222 to 277Hv. The
microhardness values for Weld No2 ranged from 202 to 257Hv and 240 to 280Hv for the
RHAR and ADAR microstructural conditions respectively.
Strain-aged material showed variability in microhardness values, with a slight increase being
observed in both of the weld metals. RH5%SA and AD5%SA microhardness values ranged
from 200 to 236Hv and 230 to 287Hv respectively, for Weld No1 compared with 220 to 265Hv
for RH5%SA and 253 to 290Hv for AD5%SA for Weld No2.
It should be noted microhardness measurements for individual microstructural phases within
the AD microstructure could not be assessed due to the fine nature of the weld materials
(indents could not sample individual grains). However it is clear from Fig. 5.25 that the AD
weld metal region exhibits smaller indentation marks than the RH microstructure for all
equivalent conditions.

P a g e | 118
5.3 Discussion
5.3.1 Microstructure
It has been shown within the weld material that the microstructural features of the AD and RH
microstructures are significantly different. The weld is produced from a multi-pass
submerged-arc welding process; the AD microstructure is produced by deposition and
solidification of the weld bead, and dominates the top layer of the weld, there are three large
deposited weld beads. The RH microstructure is produced from the next pass raising the
temperature, on cooling this region is grain refined.
The microstructure of the weld is complex, it is formed by a mixture of carbide and ferrite as
well as a distribution of non-metallic inclusions such as oxides and silicates formed from
deoxidation precipitation mechanisms in the molten weld pool. The typical AD
microstructure as stated in Chapter 5.2.1, consists of three phases, allotriomorphic or grain
boundary ferrite, αall, acicular ferrite, αac and Widmänstatten ferrite, αw, shown in Fig. 5.9.
Acicular ferrite has a fine scale morphology, this increasing the strength of the material due to
its small grain size making it a desirable feature whereas coarse grain boundary ferrite and
lamellar structure (αw) are undesirable from this view point. Acicular ferrite nucleates within
prior austenite grains, at the interface between the non-metallic inclusions and the matrix.
Acicular ferrite is often found on a fine-scale, this increases the strength of the material due to
the small effective grain size (Hall-Petch relationship [178, 189], see 5.3.3) and also has good
notch ductility because it is difficult for microcracks to propagate through acicular ferrite
boundaries (high grain boundary density). Cleavage initiation sites on fracture surfaces of
tensile, Charpy, CTOD and Blunt notch specimens often found in allotriomorphic ferrite
areas.
Widmänstatten ferrite has a side plate, lamellar morphology nucleated at the austenite grain
boundaries. It can also be classified as ferrite with aligned martensite retained austenite and

P a g e | 119
carbides, (MAC) and is akin to upper bainite or feathery bainite. Allotriomorphic ferrite is
formed by a reconstructive mechanism, where all the atoms diffuse and grow across austenite
grain boundaries.
The RH microstructure contained mainly equiaxed grains which exhibited coarser grain sizes
nearer to the AD interface. The region with the coarser grains had a mixture of equiaxed
ferrite and allotriomorphic ferrite grains. Due to the multi-pass welding procedure reheating
into the intercritical region (α→γ) leads recovery, recrystallisation and grain growth, with an
‘annealing’ of the previous AD weld microstructure, therefore creating the RH weld
microstructure.
5.3.2 Hardness Tests
Hardness tests revealed that the weld cross-section exhibited different hardness values from
the top of the weld to the bottom, with the hardest regions being the top weld beads (located
in the AD microstructural region, Profile Line 1) with the lowest hardness being found at the
bottom of the weld, mainly the RH microstructural region (Profile Line 3). This is mainly due
to the fine morphology of the AD microstructure, which is due in part to the annealing
process that occurs from subsequent weld passes, Fig. 5.18-5.20.
If the weld is subjected to a postweld heat treatment (Table 4.3) the AD microstructure
remains harder than the RH microstructure along the cross section of the weld (Fig. 5.21).
AD values ranged from 191 to 220Hv and 221 to 257Hv in the AR and SA conditions
respectively compared with 162 to 191Hv for RHAR and 201 to 2201Hv for RH5%SA
microstructural conditions for Weld No1. For Weld No2 the hardness values ranged from 216
to 224Hv and 225 to 253Hv for ADAR and AD5%SA microstructural condition, respectively,
compared with values for 192 to 215Hv the RHAR microstructural condition and 200 to
223Hv for RH5%SA condition.

P a g e | 120
The higher AD hardness values were noted mainly in Profile Line 1 whilst the higher RH
values were located in Profile Line 2. As a consequence specimens sampling the AD
microstructure were located in at the top of the weld and the RH were located at the bottom of
the weld cross section, so the limits of the hardness distribution in the weld cross-section for
each condition would be sampled (Fig. 5.18-5.19). The weld metal also permitted a specimen
arrangement of two Charpy sized samples (10x10x55 mm) from a single block, Fig. 4.12.
Therefore it can be inferred from the mean hardness values (Table 5.7 and 5.8) obtained for
both microstructures in the AR and the 5%SA conditions for both weld metals (No1 and No2)
that the strength of the weld increases at the expense of a decrease in ductility of the material
after the prestraining and ageing process. The difference in hardness between the AD and RH
microstructure in the AR condition was 23Hv compared with 21Hv for the equivalent
microstructure in the strain and aged condition for Weld No1. Weld No2 exhibited differences
in hardness of 20Hv between the ADAR and RHAR conditions, compared with 26Hv for the
AD5%SA and RH5%SA conditions.
Considering the two weld microstructures in both weld metals, the AD region in Weld No1
exhibited the largest increase of 31Hv between the AR and 5%SA conditions compared with
12Hv for Weld No2 for the equivalent conditions. Thus it can be predicted from these higher
hardness values within the AD microstructure for both welds and weld metal conditions, that
this region exhibits a greater strength, hence a lower ductility compared with the RH
microstructure, which exhibited a difference in hardness between the AR and 5%SA of 33Hv
for Weld No1 and 5Hv for Weld No2. Using equation 5.1 and a mean hard hardening
exponent value at room temperature approximately equated to disparities in the yield stress
between AR and 5%SA of about 71MPa for the microstructure of Weld No1 and 23MPa for
Weld No2, with differences between the AD and RH microstructure, in yield predicated yield
stress of 72MPa and 11MPa for Weld No1 and Weld No2, respectively. The predicted
disparities in yield stress are in agreement with the characteristic inhomogeneous nature of
submerged arc weld. Also showing that a particular yield stress value should not be used as a
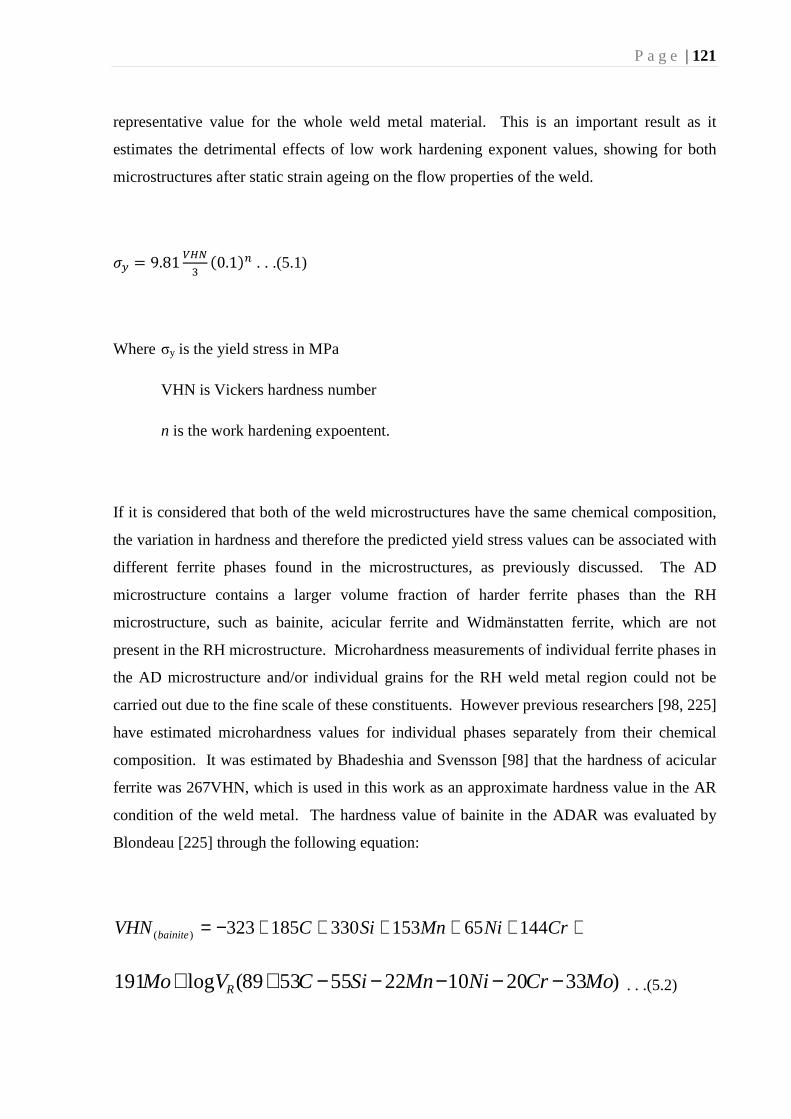
P a g e | 121
representative value for the whole weld metal material. This is an important result as it
estimates the detrimental effects of low work hardening exponent values, showing for both
microstructures after static strain ageing on the flow properties of the weld.
�� = 9.81�
��0.1�� . . .(5.1)
Where σy is the yield stress in MPa
VHN is Vickers hardness number
n is the work hardening expoentent.
If it is considered that both of the weld microstructures have the same chemical composition,
the variation in hardness and therefore the predicted yield stress values can be associated with
different ferrite phases found in the microstructures, as previously discussed. The AD
microstructure contains a larger volume fraction of harder ferrite phases than the RH
microstructure, such as bainite, acicular ferrite and Widmänstatten ferrite, which are not
present in the RH microstructure. Microhardness measurements of individual ferrite phases in
the AD microstructure and/or individual grains for the RH weld metal region could not be
carried out due to the fine scale of these constituents. However previous researchers [98, 225]
have estimated microhardness values for individual phases separately from their chemical
composition. It was estimated by Bhadeshia and Svensson [98] that the hardness of acicular
ferrite was 267VHN, which is used in this work as an approximate hardness value in the AR
condition of the weld metal. The hardness value of bainite in the ADAR was evaluated by
Blondeau [225] through the following equation:
++++++−= CrNiMnSiCVHN bainite 14465153330185323)(
)33201022555389(log191 MoCrNiMnSiCVMo R −−−−−++ . . .(5.2)

P a g e | 122
where each element is used in wt.% and the cooling rate VR, in oC/h. Harrison [226]
estimated the mean cooling rate for the SAW process varied between 4.8x10³ and 10.8x10³
deg/hr. If the above equation was used to evaluate the approximate hardness values for
bainite in the weld metals used in this work, it is expected Weld No1 would have a minimum
value of 219HVN compared a minimum to 235VHN for Weld No2. Comparing the values of
hardness Table 5.7 and 5.8, it is clear that the RH microstructure present lower values than
those predicted for bainite and acicular ferrite phases, since this microstructure only contains
equiaxed ferrite. The hardness value of acicular ferrite alone predicted by Bhadeshia and
Svensson [98, 114] is greater than measured for the AD microstructure in the AR condition.
This is consistent since not all austenite transformed to acicular ferrite during cooling to room
temperature.
Another factor that should be considered is the higher dislocation density and internal
enginery of the AD microstructure compared to the RH microstructure. The reduction of the
dislocation density of the RH microstructure is considered to occur due to the annealing out of
dislocation by the reheating effect of subsequent weld passes. Also the RH microstructure
plasticity should also more uniformly distributed than in the AD microstructure. These
comments help to explain the evaluated hardness values presented by both microstructures
after static strain ageing and especially in the AD microstructure. Strain ageing behaviour is
directly associated with density of dislocations formed after cold-working, the deleterious
effect of strain ageing is more evident in the AD weld metal region due to the number of
dislocations compared with the RH microstructure. The copper (0.29 wt%) adds solid
solution strengthening to the weld through interstitial solid solution mechanism. However,
this should affect both microstructures equally, since both weld metal regions contain the
same chemical composition.
P a g e | 123
5.4 Conclusions
1. The microconstituents of the AD microstructure of the low alloy ferritic steel weld
metal (Weld No1 and Weld No2) used as part of this research programme are; acicular
ferrite, located in the interior of the austenite grain structure, Widmänstatten ferrite
which nucleate at the austenite grain boundaries forming lamellar structure, and finally
allotriomorphic ferrite or grain boundary ferrite, often delineating the columnar
structure from the prior delta ferrite grains. The RH microstructure of the two welds
contained mainly equiaxed ferrite grains and showed some coarsening of the RH grain
size near the AD/RH boundary. Weld No1 generally exhibited slightly large weld
beads in the AD region, as well as the weld width (gap filled) being slightly larger.
2. Inclusions were found to be similar for the two weld metals and for AD and RH
microstructures, no differences were apparent between the AR and SA conditions.
The inclusions were found to consist mainly of silicon, oxygen, manganese and iron
with traces carbon and aluminium. Distribution of inclusions for Weld No2 showed
that the 2-D modal inclusion diameter was approximately 0.53 and 0.48µm for the AD
and RH microstructures, respectively. There were no notable statistical differences
between either of the two microstructures, with the 95th percentile level lying in the
order of 0.8 to 1.2µm. Larger inclusions can be found at the tail end of the distribution
size.
3. GDS results confirmed the chemical compositions of both the weld metals as
compared with the data supplied by ESAB. There were no significant differences in
weight percent as quoted by ESAB compared to those acquired through GDS, apart
from that the copper levels were lower.

P a g e | 124
4. A difference in macrohardness was found between the AD and RH microstructures for
equivalent weld metal conditions in both Weld No1 and Weld No2. The AD
microstructure is harder than the RH microstructure, while straining (cold working)
and ageing the weld metal produced an increase in hardness values.
5. Weld No1 in the AR condition hardness values ranged from 191 to 204Hv and 162 to
191Hv for the AD and RH microstructures respectively, compared with 216 to 234HV
and 192 to 215Hv for the AD and RH microstructure for Weld No2. After straining
and ageing a notable increase in hardness was observed for both weld metals. The
hardness values of AD and RH in Weld No1 values ranged from 221 to 257Hv and 201
to 221Hv respectively compared with values for Weld No2 225 to 253 Hv and 200 to
223Hv for AD and RH respectively.
6. The weld metals also showed a variation of hardness across the cross-section of the
weld and in respect to the sampling location. Profile Line 1 exhibited the highest
hardness value, (AD weld beads) top of the weld compared with the RH
microstructures, Profile Line 3, at the bottom of the weld, exhibited the lowest
hardness values.
7. Microhardness values also exhibited an increase after prestraining and ageing of the
weld metal had occurred. For Weld No1 values for the ADAR and RHAR conditions
ranged from 222 to 227Hv and 175 to 234Hv, respectively, compared with 230 to
287Hv and 200 to 236Hv for AD5%SA and RH5%SA microstructural conditions.
Weld No2 showed increases of 240 to 280 Hv for the ADAR condition compared to
253 to 290 Hv for the AD5%SA condition. The RHAR condition had hardness values
ranging from 202 to 257Hv compared to 220 to 265Hv for RH5%SA condition.

P a g e | 125
Chapter 6 - Results - Tensile and
Charpy Tests.
6.1 Introduction
Chapter 6 presents the results observed for the tensile and Charpy Impact testing of both weld
metals, Weld No1 and Weld No2, in both microstructures AD and RH, for both conditions,
AR and 5%SA. Flow property changes and variations in strength were assessed through
tensile testing and analysis of the yield stress, tensile strength, work hardening exponent and
elongation to failure, for both weld metals in various conditions and orientations. Absorbed
energy transition curves were obtained through Charpy Impact testing to understand the effect
of microstructure and thermo mechanical treatments of the weld metals.
6.2 Results
6.2.1 Tensile Testing
6.2.1.1 Weld No 1
Engineering stress-strain and the equivalent true stress-true strain curves for the AR, mixed
and transverse microstructural conditions are shown in Fig. 6.1-6.4 respectively and a
summary of the flow properties are tabulated in Tables 6.1-6.4. A total of 18 ADAR and 18
RHAR specimens were tested for the single microstructure conditions, 15 mixed
microstructure specimens and 18 mixed transverse specimens were tested across the
temperature range. The flow properties, yield stress, ultimate tensile strength (UTS), total
strain and work hardening exponent are also plotted in Fig. 6.5-6.6. It should be noted from
the test curves that not all specimens exhibited a discontinuous yield point and therefore a

P a g e | 126
0.2% proof stress has been quoted for these specimens. The yield stress of the weld increases
from 471 to 892MPa and 409 to 771MPa, over the temperature range from +20 to -196oC for
the AD and the RH microstructure respectively, and 420 to 719MPa and 469 to 794MPa for
the mixed and transverse microstructures. The tensile strength increased from 543 to
909MPa, 510 to 790MPa, 525 to 815MPa and 568 to 832MPa for the AD, RH, Mixed and
transverse microstructures respectively across the same temperature range as the yield stress
values (+20 to -196oC).
It can be seen from Fig. 6.5(a) and 6.5(b) that little variation between the AD, RH and mixed
microstructure with a combined yield stress and ultimate tensile strength of 420 to 893MPa
and 510 to 909MPa respectively. The yield stress drop between the upper (UYS) and lower
(LYS) values was also evaluated from the data for the AD, RH, mixed and transverse
conditions and microstructure across the temperature range. The results show that the as-
deposited microstructure had the lowest yield drop compared with the other three conditions,
with the mixed microstructure exhibiting the highest. The transverse results shown in Fig.
6.6(a) and 6.6(b) were consistently higher than both the AD and RH microstructures for both
yield stress and ultimate tensile stress.
Values for total strain are plotted in Fig. 6.5(c) for the mixed and transverse Fig. 6.6(c)
condition compared with both the AR microstructural conditions. Total strain values ranged
from 25 to 38% for RHAR microstructure, 7 to 27% for the ADAR microstructure, 13 to 32%
for the mixed microstructure and 21 to 33% for the transverse microstructural conditions over
the temperature range of -196 to +20oC, relative to the length of the tensile specimen. In
general the RH microstructure exhibited larger total strain than the ADAR, Mixed and
transverse microstructural conditions. All specimens except those tested at -196oC exhibited
localised necking before failure.
The mixed microstructural testpieces exhibit slightly higher tensile strength over the
temperature range of -120 to -40oC, Fig. 6.5(b), as well as higher work hardening exponent

P a g e | 127
values across the temperature range, Fig. 6.5(d). The values of the work hardening exponent
are slightly higher 0.14 to 0.21 for the mixed microstructural condition when compared to the
0.01 to 0.19 (ADAR) and 0.08 to 0.20 (RHAR) microstructures. The transverse
microstructure exhibits both higher yield stress and tensile strength values of approximately
100MPa across the test temperature range, Fig 6.6(a) and 6.6(b). The total strain values of the
transverse microstructure were in the same range as the ADAR condition, with the RHAR
condition exhibiting the greatest amount of total strain. Work hardening values were slightly
higher (0.08 to 0.24) for the transverse microstructure when compared to both the AR
conditions, Fig. 6.6(d).
6.2.1.2 Weld No2
Tensile testing for Weld No2 was carried out for the AR; 18 specimens for the ADAR and 18
specimens for the RHAR, 17 mixed specimens and 18 transverse microstructural specimens,
the flow properties for each of the conditions are tabulated in Tables 6.5-6.8 and Fig. 6.7-6.10
show the Engineering stress-strain and the equivalent true stress-true strain curves. As seen
with Weld No1 not all specimens exhibited discontinuous yielding and so a 0.2% proof stress
is quoted. The ADAR condition exhibited yield stress values ranging from 430 to 583MPa
compared with the RHAR condition from 456 to 886MPa and tensile strength increases
ranging from 468 to 883MPa and 545 to 965MPa for the ADAR and RHAR conditions
respectively. Yield stress and tensile strength values ranging from 444 to 842MPa and 576 to
873MPa were exhibited for the mixed microstructural condition, compared with and
transverse conditions respectively, while the transverse condition exhibited tensile strength
values ranging from 439 to 928MPa and yield stress values of 561 to 948MPa, Fig. 6.11-6.12.
The ADAR and RHAR, mixed microstructure and transverse microstructure condition total
strain values are plotted in Fig. 6.11(c) and 6.12(c). Total strain values for the ADAR
condition ranged from 5 to 31% compared with 15 to 31% for the RHAR condition, whilst the
mixed and transverse microstructural conditions ranged from 5 to 28% and 8 to 33%
respectively. Work hardening values are shown in Fig. 6.11(d) and Fig. 6.12(d) it can be seen
P a g e | 128
that there is little difference or no distinctive trend between the four sets of data. Work
hardening values ranged from 0.09 to 0.23 (ADAR), 0.10 to 0.23 (RHAR), 0.07 to 0.21
(Mixed microstructural condition) and 0.08 to 0.25 (Transverse condition). As seen for Weld
No1 the transverse condition for Weld No2 exhibited slightly higher work hardening exponent
values compared to the as-received condition. The work hardening exponents for both the as-
received conditions are very similar, with the transverse being slightly higher.
6.2.1.3 Weld No2 Strain and Aged Condition (5%SA)
The tensile specimens were nominally strained by 5% plastic deformation, loaded and
unloaded at room temperature. The samples were then placed in a Lenton vacuum furnace at
300oC for 2hrs, following the procedures for Charpy, CTOD and Blunt notch tests, described
in Chapter 4.3. A total of 36 specimens were tested in the 5%SA condition, 18 for both the
AD and RH microstructure.
The corresponding engineering and true stress-true strain curves for the AD and RH
microstructure weld metal regions are shown in Fig. 6.13-Fig. 6.14 respectively. As
previously discussed in section 4.6, a reduction in the cross-section diameter is considered in
the determination of the engineering stress-strain curves. The specimens presented a mean
reduction in gauge cross section diameter from 2.99±0.001 mm to 2.91±0.001 mm.
Values of yield stress, tensile strength, elastic strain and total strain are presented in Table 6.9.
In general the AD microstructure specimens were plastically deformed by 4.96±0.08%
compared with the RH specimens by 4.97±0.09%. The AD microstructure exhibited no
discontinuous yielding, with yield stress values ranging from 415 to 600MPa. The RH
microstructure had yield stress values ranging from 446 to459MPa and 354 to 490MPa for
0.2% proof stress. Ultimate tensile strength values ranged from 536 to 601MPa and 475 to
546MPa for the AD and RH microstructures respectively.
P a g e | 129
Once the specimens had been aged, (applying 300oC for 2hrs) they were tested across the
temperature range of -196 to 20oC. A summary of the flow properties including work
hardening exponent for both weld metal regions is shown in Table 6.10 and displayed
graphically in Fig. 6.17, corresponding engineering and true stress-true strain curves are
shown in Fig. 6.15-6.16.
All but two of the specimens tested exhibited discontinuous yielding, AD18 tested at -160oC
with a 0.2% proof stress of 705MPa and RH8 tested at -100oC with a 0.2% proof stress of
690MPa. The yield stress values ranged from 500-881MPa for the AD5%SA microstructure
compared with 581-930MPa for the RH5%SA microstructure. The results presented in Fig.
6.17(a) demonstrate the yield stress values are very similar for both of the microstructures and
are constantly higher than those for the AR condition, values ranging from 585 to 885MPa
and 581 to 987MPa were observed for the AD5%SA and RH5%SA conditions, respectively.
Ultimate tensile strength values varied little between either of the microstructures and/ or
conditions. The AD5%SA microstructure exhibited UTS values of 613 to 855MPa compared
with 588 to 921MPa for the ADAR condition. Whilst UTS values ranged from 544 to
965MPa and 602 to 987MPa for the AR and 5%SA condition respectively for the RH
microstructure, Fig 6.17(b). The RH microstructure in the 5%SA condition exhibited both
higher values for the yield stress and UTS compared with AD5%SA condition.
Shown in Fig 6.17(c) the total strain values for the 5%SA condition are similar to the AR
values, the AD5%SA microstructure exhibits total strain of 11 to 26% and the RH5%SA
condition exhibits values of 18 to 27% compared with 4 to 29% and 14 to 33% for the ADAR
and RHAR respectively, although the 5%SA values are lower than those of the AR condition.
There is little difference between the work hardening exponent values for the microstructural
conditions, with values ranging from 0.07 to 0.12 for the AD5%SA and 0.08 to 0.13 for the
RH5%SA, Fig 6.17(d). Work hardening exponent values for the 5%SA condition are much
lower than those exhibited for the AR condition, 0.09 to 0.23 for the ADAR and 0.10 to 0.23
for the RHAR condition. Across the test temperature range of -120oC to 20oC the AR

P a g e | 130
condition has a mean work hardening exponent value of 0.19, compared to a slight decrease to
0.11 for the 5%SA condition.
6.2.2 Analysis of Charpy Tests
Both an extensive temperature range and number of specimens were used in the Charpy
impact tests to allow for a good estimation of ductile-to-brittle transition temperature (DBTT)
to be made for Weld No2 for both the AD and RH microstructures in both the AR and 5%SA
weld metal conditions. A total of 28 AD and 28RH test specimens for the as-received
condition, and 20 AD and 26 RH test specimens for the 5%SA condition. These experiments
were already carried out for Weld No1 as part of an earlier research programme [15]. The
results of the impact tests are presented in Tables 6.11-Table 6.14 for both weld metal regions
and in both conditions. For each of the weld metal conditions the absorbed energy data has
been plotted against temperature and is shown in Fig. 6.18-Fig. 6.26. The overall collected
data is shown in Fig. 6.18, for all four weld metal conditions, whilst Fig. 6.19 and Fig. 6.20
show the separate data for the AR and 5%SA weld metal conditions, respectively. The data
also plots AD and RH microstructural regions Fig. 6.21 and Fig. 6.22, respectively. The
ADAR microstructural condition absorbed energy values ranged from 3J to 143J across the
test temperature range of -196 to 200oC. The RHAR microstructural condition, across the
same temperature range, exhibited absorbed energy values ranging from 4 to 167J. Compared
with 2 to 105J and 2 to 140J for the AD5%SA and RH5%SA microstructural conditions,
respectively.
Tanh curves were fitted to the data, using the basic weighting function and used for
comparing the different data sets for aiding the determination of the impact toughness
properties of the weld metal exposed to different thermo mechanical treatments and
temperatures, Fig. 6.23. For this work the DBTT has been defined at 40 J level from the Tanh
curve. It can be seen that the ADAR and RH5%SA conditions exhibited similar Tanh curves,
with the RHAR and AD5%SA conditions exhibiting extremes in conditions.
P a g e | 131
Values of DBTT (40 Joules), absorbed energy at the transition temperature of 40oC, and the
upper-shelf energy level (USE) are shown in Tables 6.15 and Fig 6.24. It can be seen from
the tables that the RHAR microstructure has a lower DBTT of -50oC compared with the -10oC
for the ADAR microstructure, as defined at the 40J energy level. After strain ageing both
microstructures exhibited an increase in the DBTT at 40J levels, with a temperature of -30oC
for the RH5%SA microstructure and -10oC for the AD5%SA microstructure. The difference
between the DBTT values at 40J energy levels for the RHAR and RH5%SA microstructures
was 25oC compared with 20oC for the AD microstructure in equivalent weld metal conditions.
The overall difference in the DBTT at 40J was 65oC, comparing the two extremes in
conditions RHAR to AD5%SA.
Using the data to compare energy levels at a given temperature (in this work defined at 40oC)
it can be seen from Fig. 6.26 and Table 6.15 that the AD5%SA exhibits the lowest absorbed
energy level of 70J compared with the ADAR microstructure condition of 105J, a difference
of 35J. A similar trend is noted in the RH microstructure with a difference of 27J from the
RH5%SA (110J) to RHAR (137J) microstructural conditions. Upper shelf energy values
decreased slightly from 158J for the RHAR microstructural condition to 140J for RH5%SA a
difference of 35J, with a further decrease noted for both the ADAR and AD5%SA
microstructural conditions of 138J and 105J, repetitively, a difference of 20J. The USE
ranging 53J between the two extremes in weld metal conditions, RHAR and AD5%SA. The
AD microstructure seems to be more sensitive to the strain and ageing process compared to
the RH microstructure. The absorbed energy values have shown more scatted in the transition
region, but it can be inferred from the data that the RHAR and the AD5%SA, respectively are
the best and worst microstructural conditions.
The surfaces of the broken halves of the Charpy impact specimens are shown in Table 6.16-
6.19 for all microstructural conditions. Fig 6.25-6.29 show the corresponding plots, for
absorbed energy levels and temperature versus ductile thumbnail, crystalline area and lateral
expansion. Tables 6.16-6.19 detail ductile thumbnail (DT), lateral expansion (LE) and
P a g e | 132
crystalline area % (CA) measurements. Ductile thumbnail ranged from 0 to 2.365mm across
the test temperature range of -196 to 40oC for the ADAR condition, compared with 0 to
3.568mm for the RHAR condition across the temperature range of -196 to 20oC. Both the
5%SA conditions exhibited less ductile thumbnail that the AR condition with the AD5%SA
condition ranging from 0 to 1.315mm for -196 to 60oC and 0 to 2.199mm for -196 to 40oC for
the RH5%SA condition. The lateral expansion ranges from 0 to 2.115mm for -196 to 100oC
for ADAR compared with 0.245 to 2.510mm for -60 to 140oC for RHAR. 5%SA conditions
again, exhibited a similar trend with the RH5%SA condition exhibiting values of 0 to
1.930mm for -196 to 40oC and 0 to 2.373mm for -196 to 60oC for AD5%SA. Crystalline area
% ranged from 100 to 0% for -196 to 100oC for ADAR compared with 100 to 0% for -196 to
40oC for RHAR. Values ranged from 100 to 0% for -196 to 60oC and 100 to 16% for -196 to
40oC for AD5%SA and RH5%SA conditions, respectively.
The plots in Fig 6.25-6.29 show the basic trend, that at the same temperature, for equivalent
conditions that the RH microstructure will exhibit larger amounts of ductile thumbnail and
lateral expansion and small amounts of crystalline area % than those measured for the AD
microstructure. Plots presenting the linear regression for the ductile thumbnails versus
absorbed energy show that the RH microstructure exhibits slightly larger absorbed energy per
unit of ductile thumbnail extension then the AD microstructure for both conditions, Fig
6.25(a), 6.26(a) and 6.27(a). This trend is even more evident after the strain ageing treatment
has been applied Fig 6.27 and 6.30. There is no clear difference between equivalent
microstructural conditions in the correlation between absorbed energy and lateral expansion.
However, ductile thumbnail, lateral expansion and crystalline are % all show linear
relationships with impact energy. There is clear separation in the data for crystalline area %,
Fig 6.26(b) with the RHAR condition exhibiting higher values, except this trend is not quite
so evident after straining and ageing, Fig 6.27(b). Again it is clear that the AD5%SA and the
RHAR microstructural conditions are the extremes in behaviour.
P a g e | 133
6.3 Fractography
Extensive fractography has been carried out on the fracture surfaces of the tensile and Charpy
specimens. The specimens were tested over a temperature range of -196 to 200oC to analyse
the fracture micromechanism taking place and to gain an insight into the nature of
microstructure features and influence of microstructure. Fracture surfaces were generally
examined from the extremes in temperature range, with some selected from the transition
region.
6.3.1 Tensile Tests
The AD microstructure in both Weld No1 and Weld No2 exhibited larger areas of cleavage
fracture than the RH microstructural condition at a given temperature for all the conditions
studied. Fig. 6.30 and Fig. 6.31 show typical fracture surface of a tensile specimen tested at -
196oC and it can be seen that the specimen exhibits fully brittle transgranular cleavage
behaviour, with no visible necking on the specimen. For both of these specimen cleavage
fracture was initiated by an inclusion, these are generally located within large allotriomorphic
ferrite grains. From the observations of the fracture surfaces it can be inferred that the AD
microstructure has larger cleavage facets, these are defined by the cleavage steps indicated by
an arrow in Fig. 6.30 and river lines (principal features of cleavage fracture), indicated with
an arrow on Fig. 6.31.
The RH specimens tested at -196oC exhibited a mixed mode of fracture, with characteristics
of both cleavage and ductile fracture. Fig. 6.32 shows a typical fracture surface, it can be seen
there has been some localised plastic deformation in the form of microvoid coalescence, as
there has been slight necking of the specimen diameter and areas of cleavage fracture are
visible, indicated by flat facets on the fracture surface and shown with an arrow. Both
microstructures when tested at 20oC exhibited extensive necking of specimen diameter,

P a g e | 134
failing in a fully ductile manner. Fig. 6.33-6.34 show two typical fracture surfaces from both
microstructural conditions, there is general microvoid coalescence across the whole fracture
surface, with inclusions being responsible for the initiation of microvoids.
Fig. 6.35 shows an AD specimen tested at -120oC. The fracture surface shows a mixture of
two principal fracture mechanisms, necking of the specimen can clearly be seen, as well as
microvoid coalescence, both ductile mechanisms. While large areas of cleavage are visible,
as well as secondary cracking, cleavage steps and macroscopic river lines, all indicative of
brittle fracture. While a RH specimen tested at -160oC, Fig. 6.36, exhibited general necking
of the specimen and localised plastic deformation characterised by microvoid coalescence. In
general terms it was noted that for the AR and 5%SA conditions the fracture surfaces were
either characterised by either fully brittle fracture or fully ductile fracture, very few exhibited
the mixed mode failure. Whereas for the mixed and transverse conditions the fracture
surfaces went through the transition of fully brittle, mixed mode with more brittle fracture
dominating, mixed mode with more ductile dominating (creating “star” fracture surface) to
fully ductile fracture, corresponding from temperature increasing from -196 to 20oC, Fig.
6.37. Typical fracture surfaces for the transverse microstructure are shown in Fig. 6.37
ranging from -196 to 20oC, all these specimens exhibiting varying amounts of plastic
deformation. It can be seen that the specimen tested at -196oC, Fig. 6.38(a) and 6.38(b),
exhibited quasi - cleavage fracture, with the surface having both microvoids and large flat
cleavage facets. The specimens tested at -40 and 20oC both failed in a fully ductile mode,
with inclusions found for the initiation of microvoids.
6.3.2 Charpy Tests
The fracture surfaces of the Charpy specimens are shown in Fig. 6.39-Fig. 6.44 for all four
microstructural conditions. It can clearly be seen, using the naked eye without magnification
the different modes of failure; ductile, brittle or a mixture of both. Fig. 6.43 shows the
fracture appearance changes from 100% cleavage fracture to 100% fibrous or ductile fracture
as the temperature increases. It can be seen that lateral expansion and ductile thumbnail size

P a g e | 135
all increase in both microstructures and across all conditions with increasing temperature,
conversely a decrease in crystallinity is observed with temperature increases. The AD
microstructure in the AR condition exhibited fully ductile fracture at 100oC, where as the
RHAR microstructural condition is fully ductile at 40oC, this transition is the same for the
5%SA condition. Examination of some of the Charpy fracture surfaces showed bands of both
AD and RH microstructures, with metallographic examination confirming that ductile bands
lay in the RH microstructure, also these were only found on the fracture surfaces of the AD
specimens. It should also be noted these ductile bands were far more prominent in the AR
condition when compared with the 5%SA condition, this is could be due to the relatively low
DBTT of the weld in the AR microstructure, thus permitting the appearance of the RH ductile
bands within the transition region.
Fractographic examination of specimens revealed that all specimens which had failed by
fracture instability were a result of brittle transgranular cleavage fracture for both the AR and
the 5%SA microstructural conditions. Fig. 6.44 shows a comparison between the cleavage
facets for the AD and the RH microstructures for both conditions, the fracture surfaces for the
AD microstructure exhibited a wide range of cleavage facets and sizes, with a characteristic
“rough appearance”. For this type of weld metal it has been widely reported that large
cleavage facets related to allotriomorphic grains, whereas smaller facets correspond to regions
of acicular ferrite. Brittle fracture in the RH microstructure was characterised by a more
uniform distribution of cleavage facets, both in appearance and size. This corresponds to
fracture through equiaxed ferrite grains, hence giving a finer appearance on the fracture
surface. Despite the high strain rates generated by Charpy impact tests, ranging from 102 to
104 s-1, transgranular cleavage initiation sites could be found on the fracture surface, Fig.
6.44-Fig. 6.49. It was found that initiation was caused by an inclusion in both the AD and RH
microstructures, it can also be seen that cleavage initiated quite close to the notch root, for
specimens tested from the AD microstructure, Fig. 6.45-6.47 and RH Fig. 6.50. Other
features that have been labelled are cleavage steps and secondary cracks; Fig. 6.48 shows a
secondary crack running though the site of initiation, secondary cracking is not as common
for the RH microstructure due to its morphology, shown in Fig. 6.49 and Fig. 6.50.

P a g e | 136
Examination of specimens which showed some purely ductile failure, e.g. specimens tested in
the transition and upper - shelf regions or exhibited some ductile thumbnail extension before
the onset of catastrophic failure, revealed that due to the levels of shear stress this resulted in
internal necking and coalescence of microvoids initiating from non - metallic inclusions, this
is a result of decohesion of the matrix/ inclusion interface. Fig. 6.51-6.54 show the general
appearance of ductile fracture mechanism for both microstructures and in both of the weld
metal conditions. Size and shape of the dimples has been found to be dependent on their
location on the fracture surface, with their direction being highly orientated if located close to
the borders and the notch root of the Charpy specimen and non - equiaxial due to the tensile
testing stress state acting in those regions. The shape and size of the dimples appears to be the
same for both the AD and RH microstructures, although specimens tested in the 5%SA
condition appeared visually to have exhibited shallower voids, hence the strain and ageing has
affected both the plastic deformation and work hardening properties.
6.4 Discussion
6.4.1 Tensile Testing
6.4.1.1 Microstructural Effects
Tensile test results showed little difference in the yield stress and tensile strength of the two
microstructures. However, the strength across the weld cross - section from top to bottom and
within a microstructural condition can vary considerably in terms of the hardness from
corresponding microstructures. This is possibly due to the amount of annealing the weld
beads received from the subsequent weld passes. If it is considered that both the
microstructures are subjected to the same amounts of annealing the AD microstructure would
still present both yield stresses and higher hardness than the RH microstructure due to the
constituents of the weld metal. Tensile test results thus show closely similar yield stress and
tensile strength of the two microstructures in their AR and 5%SA conditions. The AD
microstructure did present lower ductility than the RH microstructure.

P a g e | 137
The RH microstructure also exhibited longer uniform and total deformation before specimen
failure for equivalent conditions. Therefore, quoting or using a singular yield stress value
would not be representative for the whole weld metal. The differences exhibited in yield
stress values are in agreement with the characteristic inhomogeneous nature of a submerged
arc weld metal. Novovic [13] prestrained a carbon - manganese weld metal by 9% using cold
deformation, this material presented similar shifts for impact toughness tests. If this level of
prestraining was considered as a “saturation level”, as both microstructures present similar
properties, then the AD and the RH microstructure would still present some differences in
flow properties after cold deformation by just 5%, this is in agreement with the hardness and
tensile test results presented in this current work.
6.4.1.2 Grain size
The AD microstructure presented both higher yield stress and tensile strength values,
compared to those in the RH microstructure; this cannot be attributed to the effects of grain
size. From the Hall-Petch relation (equation 6.1) [178, 189], for materials which are similar
but exhibit different grain size, the one with the small grains should be stronger. Hence, on
this basis, the RH microstructure would be stronger than the AD microstructure due to it
having smaller equiaxed grains. The strength of the AD microstructure can be reasonably
attributed to its increased dislocation density, as discussed 5.3.1 and larger surface area of the
harder ferrite phases. Reduction in strength due to large grain size AD microstructure does
not overcome the opposite effects suggested due to the two reasons stated above. Reduction
in the dislocation density of the RH microstructure is considered to occur due to annealing, as
a result of the multi - pass welding process, this is evident by the hardness results obtained.
The strength reduction due to large grain size of the AD microstructure does not overcome the
opposite effect possibly caused by the dislocation density and larger surface area of harder
ferrite

P a g e | 138
2
1
0
−+= kDiσσ . . . 6.1
Where σ0 is the yield stress, σi is the “friction stress”, k is the “locating parameter”,
measuring the relating hardening contribution of the grain boundaries and D is the grain
diameter.
6.4.1.3 Strain Ageing
Strain hardening and then subsequent ageing of the weld metal resulted in an increase in
strength and hardness values, and a decrease in ductility, these effects are similar to those
caused by neutron embrittlement. It can be inferred from the engineering stress - strain curves
and from the flow properties observed for the AR compared to those for the 5%SA condition
that the cold deformation process influences and causes a reduction in the microstructural
effects on the flow properties of the different microstructures. Thus it can be inferred that
applying a more severe cold deformation process would result in both microstructures
exhibiting similar flow properties. Due to the RH microstructure being annealed because of
the heat input from the multi - pass welding procedure, it has a smaller dislocation density and
therefore could have a shorter dislocation length per unit volume than the AD microstructure.
This is supported by slightly higher values of work hardening exponent, n and larger total
plastic strain for the RHAR condition compared with the RH5%SA condition, compared with
the AD microstructure in both conditions.
It would seem that the AD microstructure is more sensitive to the strain - ageing process than
the RH microstructure, the effect of strain - ageing on the ductility of the AD microstructure is
more evident compared with the RH microstructure. After strain - ageing the AD
microstructure has a more accentuated yield point drop when compared with the RH
microstructure. After plastic deformation the AD microstructure only exhibited 2% proof
stress values, whereas after strain - ageing, all specimens exhibited discontinuous yielding.

P a g e | 139
An explanation for this apparent susceptibility of the AD microstructure to static strain ageing
is the higher dislocation density, also both microstructures have higher yield stress values
after the strain - ageing process compared with the AR condition, it can be inferred from this
results that part of the C and N atoms remain in solid solution even after PWHT. These
elements could be responsible for the ageing process through their interaction with
dislocations.
The AD microstructure is more sensitive to the strain ageing process compared to the RH
microstructure, with a further effect being seen on the ductility of the weld metal, with the AD
microstructure being greater effected than the RH microstructure. The AD microstructure
also presents an increase in yield stress and tensile strength higher than the RH
microstructure. One apparent explanation for this pronounced susceptibility of the AD
microstructure to the static strain ageing is the different ferrite phases; fractography revealed
that cleavage initiation sites (CIS) were located within large allotriomorphic ferrite grains;
these contain dislocation pile - ups which are long, which could be more susceptible to strain
ageing through dislocation pinning by atoms in solid solution compared to the RH
microstructure which contain smaller and equiaxed ferrite grains. The RH5%SA condition
tested at -196oC, -160oC and -120oC had fracture surfaces which revealed a mixture of both
ductile and brittle fracture modes, exhibiting both plastic deformation linked with the
characteristics of cleavage fracture with no distinctive cleavage initiation sites. The fracture
surfaces from the tensile tests revealed that the percentage of brittle areas, e.g. cleavage facets
become larger from the AR condition to the 5%SA condition. Cleavage cracks are also noted
in the fracture surfaces of the RH specimens.
6.4.1.4 Natural ageing
Both the weld materials used in this research received a post weld heat treatment as shown in
Table 4.3. The PWHT is applied to relieve and reduce any residual stress that may have
occurred during the weld procedure. Another benefit of this procedure is to promote the
precipitation of carbides, thus avoiding the presence of elements in solid solution, mainly N

P a g e | 140
and C. Therefore it is not expected for the material to have aged naturally at room
temperature. However, the tensile strength for the data gathered for the 5%SA conditions are
slightly higher than those in the AR condition. This maybe an indication that the material
might have aged naturally before testing was conducted. During the prestraining process
none of the AD microstructure exhibited a yield point, whilst the majority of the RH
microstructure specimens did exhibit a yield point.
6.4.1.5 Work - Hardening Exponents
It is evident from the results obtained and the discussions thus far there has been a reduction
in the work hardening exponent, n for both microstructures after cold deformation and static
strain ageing. Over the test temperature range of -120oC to 20oC the AR condition exhibited
mean work hardening exponent values of 0.19 compared to 0.11 for the 5%SA condition. It
should be noted that the difference between the work hardening exponents between
microstructures is small, any interpretation is made more challenging because it is difficult to
locate the entire gauge length within a single microstructure.
The attainment of work hardening exponent values from the true stress-true strain curves is
easier for the AR, mixed and transverse conditions because as load increases, the work
hardening is more evident in these conditions. The estimation of n values becomes difficult
as the interpretation of the 5%SA curves exhibit flattened behaviour in the plastic region of
the curve. Nevertheless, both the AD and RH microstructures exhibit constantly lower work
hardening values when there are subjected to the straining and ageing process compared to
those in the AR condition.
Therefore, it can be inferred from the low n values that the work hardening capacity of the
microstructures is affected. Values of work-hardening exponent, n, for both welds exhibited
no effect of temperature within the temperature range (-196 to 20oC) used in the current work.
However, in general the ADAR microstructure exhibits similar n values (0.09 to 0.23)

P a g e | 141
compared to RHAR microstructure (0.10 to 0.23), whilst the AD5%SA condition exhibited
similar but reduced work hardening exponent values ranging from 0.07 to 0.12 and 0.08 to
0.13 for the RH5%SA condition. The AD5%SA and RHAR microstructural conditions
respectively, lowest (mean value of 0.11) and highest (mean value of 0.19) n values at
equivalent temperatures (shown in Fig. 6.17(d)), therefore the work hardening capacity of the
AD microstructure is more affected static strain ageing than the RH microstructure. It should
be emphasised that n values were obtained in region of uniform plastic deformation up to
maximum load.
6.4.2 Charpy Tests
6.4.2.1 Effects of Notch Plane Orientation
It has been discussed in Chapter 4.7 that the Charpy specimens were machined with the notch
plane orientation defined that the notch root would sample only a single microstructure, the
notched face of the specimen is parallel to the direction of the weld. The root of the notch
was fixed to a specific location with respect to the microstructure. The main advantage of the
surface notch orientation was to allow for the assessment of impact properties for a single
weld metal region, either AD or RH. However the geometry of the multipass weld and the
size of the last deposited weld bead would not allow the cross-section of the Charpy impact
specimens to sample only one microstructure. This is because although the notch root is
placed within the AD microstructure, specimen halves examined from the lower shelf and
transition region usually consisted of both microstructures. This study should be
differentiated from those of Novovic and Wenmen [13, 14] both of which had Charpy notch
faces perpendicular to the welding direction. In-particular Novovic worked with a C-Mn
weld metal which contained a lower number of weld passes than the weld metal used in this
programme of work, and consequently larger weld beads, this permitted the sampling of only
one microstructure.

P a g e | 142
6.4.2.2 Upper and lower shelf behaviour
The upper shelf energy levels of both microstructures are very distinctive for the AR and the
5%SA conditions, with the RHAR and the AD5%SA presenting the extremes, with the
AD5%SA condition consistently exhibiting lower values. On the lower shelf the energy
levels are indistinguishable whereas on the upper shelf they are different values. This
behaviour is also noted in the plots for the ductile thumbnail, lateral expansion and percentage
of crystallinity versus both temperature and energy absorbed. Comparisons of impact
transition curves for the AD and RH microstructure revealed the RH microstructure was not
as affected when strained and aged compared with the AD microstructure. The RH
microstructure saw a decrease in the USE of 27J compared with 35J for the AD
microstructure, this may be related to the higher work hardening exponent values for the RH
weld microstructure for both the AR and 5%SA conditions, also the reduction in the upper
shelf energy could be a consequence of the reduced work - hardening capacity of the strain
aged materials, as there is an appreciable reduction on both microstructure following strain
and ageing.
It has been shown that the micromechanism of fracture at the upper shelf energy level for the
weld metal in all microstructural conditions is microvoid coalescence. Absorbed energy
results and fractography showed the AD microstructure exhibits higher temperature values
corresponding to 0% crystallinity than the RH microstructure for all conditions. The onset of
the upper shelf temperature region is not strongly affected by prestraining, both Novovic [13]
and Patrocinio [15] obtained the same conclusion. Specimen tests at lower temperatures
essentially failed by brittle cleavage fracture. The impact energies in this lower shelf region
are so small that any variations caused by microstructure in all conditions are not
differentiated.
Microvoid coalescence and the amount of energy absorbed are expected to depend strongly on
the work hardening exponent, second phase particles and their distribution. Noting that the
2D distribution of inclusions is closely similar in both microstructures, then the influence of

P a g e | 143
the work-hardening exponent would be expected to dominate. Attempts have been made,
Figs. 6.25-6.29, to analyse the amount of ductile thumbnail in each Charpy testpiece and to
relate this to the impact. Any comparison between different microstructure and condition is
complicated by the fact that a similar amount of ductile crack growth for each condition, at
will occur at different test temperatures.
Similar trends and correlations are also seen for the shear lip size and the lateral expansion
both plotted against impact energy. These show little separation of the microstructures, with
results more scattered than the data set for the ductile thumbnail plotted against impact
energy. However, when plotted (Fig. 6.26) against temperature there is still a separation of
microstructures, in general the AD microstructure, for both conditions exhibits small lateral
expansion, ductile thumbnail sizes and shear lip sizes when compared to the RH
microstructure in both conditions when compared at the same temperature.
6.4.2.3 Transition region behaviour
Notched - bar impact tests are often subject to considerable scatter within the transition
temperature region [1, 13-15, 24, 27, 40, 219, 227, 228]. Charpy impact test results for
multipass submerged - arc welds have shown a large amount of scatter even when located
within a single microstructure as studied as part of this programme. This behaviour can be
attributed to several factors; variations in local properties within the weld metal in specimens
machined from the same microstructure, and variability in the testing procedure. Also the
intervention of cleavage after varying amounts of ductile thumbnail extension is an important
factor. However, there are clear differences in the impact transition curves for both the AD
and RH microstructures, which strongly suggest these weld metal regions exhibit distinctive
impact toughness for all conditions studied. Straining and ageing the materials shifted the
DBTT at 40J by 65oC between the two extremes in microstructural conditions, RHAR and
AD5%SA. The DBTT shifts at 40J by 45oC between the two AR conditions compared with
40oC between the two strain aged conditions. The differences in the DBTT can be related to
microstructure since both the weld metal regions will have similar compositions.

P a g e | 144
The Charpy results clearly show that even within the fine beaded welds, as used during this
experimental programme, differences can clearly be seen in the transition temperatures for
both the weld microstructures AD and RH, and these become accentuated after strain and
ageing has occurred. The AD microstructure exhibits higher DBTT than the RH
microstructure for both conditions. Within the results there is a large amount of scatter within
the transition region and even within a single microstructure. This is attributed to the varying
amounts of ductile crack growth, and then the intervention of cleavage fracture. There is
however a very clear separation between the two microstructures and even between the
conditions, thus suggesting a difference in the resistance of the two microstructures to
cleavage fracture. Both of the conditions for the RH microstructure exhibited an increased
gradient of slope in the transition region compared to the same conditions for the AD
microstructure, shown in Fig. 6.23; this could be a result of the difference exhibited in the
work hardening of the material. The DBTT also decreases as the work hardening exponent, n,
increases, Fig. 6.24 and Tables 6.15-6.16. For the extremes in condition the RHAR
microstructural condition exhibits the lower DBTT of -43oC and a mean n value of 0.19
compared with the AD5%SA microstructural condition which exhibits the highest DBTT of
15oC and a mean n value of 0.11.
When considering a value of ductile thumbnail extension in the transition region, (e.g. -20oC)
the amount of absorbed energy is higher for the AR condition compared with the 5%SA
condition, shown in Fig. 6.27, where the two AR conditions have values of absorbed energy
and ductile thumbnail of 33J and 1.37mm and 65J and 2.59mm for the ADAR and RHAR
conditions respectively, compared with 19J and 0.61mm and 49J and 1.30mm for the
AD5%SA and RH5%SA conditions respectively. It can be seen from these results that the
ductile thumbnail is reduced after the strain ageing process has been applied.
Within the transition region there is competition between fibrous (microvoid coalescence) and
transgranular (cleavage) fracture. Microvoid coalescence involves high absorption of energy
and this is related to the amount of deformation during the process. On the other hand,

P a g e | 145
transgranular cleavage has a very small contribution to the overall energy absorbed process,
thus the size of thumbnail extension is essential to promote high impact energy values. Work
- hardening exponent also plays a fundamental role in microvoid coalescence since this
parameter is directly related to the amount of energy absorbed per unit of ductile thumbnail
extension.
The results observed from the fracture surfaces measure the percentage crystallinity versus
temperature followed a similar trend to the impact energy versus temperature. Lower shelf
results show 100% cleavage fracture whereas upper shelf temperatures show 100% ductile
fracture. Higher hardness of the strain aged condition could help promote cleavage fracture at
higher temperatures. Also there is a difference in the hardness of both the microstructures and
the conditions which might promote cleavage fracture at higher temperatures. Also Weld No2
had higher hardness values than Weld No1 thus lower upper shelf values were exhibited, also
higher DBTT temperatures, as well as smaller amounts of ductile thumbnail and lateral
expansion and a higher percentage of crystalline area for corresponding temperatures.
In summary, the extremes of microstructural conditions, the RHAR exhibited the largest
ductile thumbnail extension and a higher amount of energy absorbed per unit of ductile
thumbnail extension compared with the AD5%SA condition. On this basis it is possible to
suggest why the RH microstructure exhibited smaller ∆DBTT and ∆USE shifts after strain -
ageing than the AD microstructure. Within the transition range there is the occurrence of both
ductile thumbnail extension and then the occurrence of cleavage fracture, thus cleavage
fracture directly controls the amount of absorbed energy at a given temperature. It has been
shown that the RH microstructure has longer ductile thumbnail extension compared with the
AD microstructure. Hence the cleavage fracture mechanism intervenes earlier in the AD weld
metal region and especially for the AD5%SA condition.
P a g e | 146
6.4.2.3.1 Forms of the Ductile-to-Brittle Transition (DBT)
Other authors [14, 15] claim there is a close correlation between the forms of DBT (steady or
abrupt) and the density and distribution of the dislocations and dislocation sources in the
material. Here the AD microstructure exhibits more steady impact transitions and higher
ductile-to-brittle transition temperatures than the RH microstructure for all the equivalent
weld metal conditions, as shown in Fig. 6.18-6.20. Even after static strain ageing the RH
microstructures exhibits lower DBTT (-68oC) than the AD microstructure (-17oC) in the as-
received condition. Thus the latter microstructure supposedly contains higher dislocation
density and also dislocation sources than the RH microstructure.
The trend of ductile-to-brittle transition can also be correlated with the fracture toughness, KIC
(δcrit), of the material. Soft transitions are related to a steady increase of the KIC (δcrit) with
temperature. Therefore the KIC (δcrit) fracture of the RH microstructure would be expected to
rise less steadily with temperature than the AD microstructure. The different trends in the
variation of crack tip opening displacement (CTOD) with increasing temperature, for both the
AD and RH microstructures was obtained in earlier work by Farron [229] over the
temperature range of -120 to -60oC, using the same material and was further explored during
this current work. Both studies showed that the AD5%SA condition and the RHAR condition
were the extremes of behaviour, with these exhibiting the worst and best CTOD values
respectively.
6.4.2.3.2 Effects of prestraining and static strain ageing on Charpy impact
energy in the transition region
Within the transition region, there is competition between fibrous fracture (microvoid
coalescence), involving relatively high absorption of energy since it is related with high levels
of deformation during the coalescence process and transgranular (cleavage) fracture, has a
very small contribution to the overall energy absorbed in the process. Thus the size of the

P a g e | 147
thumbnail extension is essential to promote high absorption of impact energy (i.e. high impact
or notch toughness). Moreover, the work-hardening exponent also plays a fundamental role
in the fibrous crack extension process since this parameter can be directly related to the
amount of energy absorbed per unit of extension. So, for the same amount of ductile
thumbnail extension values, the energy absorbed by the as-received material is expected to be
greater than the 5%SA condition. As shown in Tables 6.16-6.19 at 100J absorbed energy the
corresponding values of ductile thumbnail extension are 2.37mm and 3.14mm for the ADAR
and RHAR microstructures, respectively, and 1.95mm for the RH5%SA condition.
Therefore, the material which exhibits lower n values would need to present a longer ductile
thumbnail extension at the same energy level, in turn, increasing the chances of a cleavage
intervention through sampling.
6.5 Conclusions
1. Significant differences in yield stress and tensile strength were, however, noted after
straining and ageing for both the AR conditions. Little effect of microstructure on
yield stress and tensile strength has been seen in this study. The ADAR
microstructure did exhibit reduced ductility of the RHAR microstructure.
2. Both of the microstructures and across all conditions; AR, mixed, transverse and
5%SA exhibited a strong dependence of yield stress and tensile strength in relation to
temperature, with the strength increasing as the temperature decreases. Any trend in
work hardening exponent with microstructure were unclear. However over the
temperature region of -120oC to 20oC, the mean work hardening exponent for the AR
condition was 0.19 (ranging from 0.15 to 0.23), compared to the strain aged condition,
which exhibited a reduction to 0.11 (ranging from 0.08 to 0.13).
3. The AD microstructures exhibited increased ductile-to-brittle transition temperatures
(DBTT) and reduced upper - shelf energy levels compared with the RH microstructure

P a g e | 148
in both the AR condition and the 5%SA condition. Measuring the DBTT at 40 J the
Charpy impact transition curves show a clear difference between all microstructures
and conditions. The RH microstructure has higher upper-shelf energy levels for.
Lower shelf energies were relatively indistinguishable amongst the different
microstructural conditions.
4. The extremes in conditions the RHAR and the AD5%SA exhibited differences in
DBTT and USE values of 65oC and 53J respectively. The ADAR condition exhibited
∆DBTT40J and USE shift values of -10oC and 138J compared with the AD5%SA
condition of 10oC and 105J, compared with -55oC and 158J for the RHAR and -30oC
and 140J for the RH5%SA conditions. The differences between the AD and RH
microstructural region transition temperature at 40 J for the AR and 5%SA conditions
were 45oC and 40oC respectively.
5. A strong linear relationship was obtained between the absorbed energy and increased
ductile thumbnail extension values, lateral expansion and decreased crystalline area.
A similar trend was also observed for temperature versus increased ductile thumbnail,
lateral expansion and decreased crystalline area.
P a g e | 149
Chapter 7 - Results – Slow Notched
Bend Tests.
7.1 Introduction
Slow blunt notch bend tests were performed at -196oC on Weld No2 only, to assess the effects
of both microstructures and in both the AR and the 5%SA conditions on the cleavage fracture
stress, which is the measure of resistance to cleavage. Slow blunt notch bend tests are used to
obtain the intrinsic cleavage fracture stress of a material, and in this case have been applied to
the AD and RH microstructure to analyse the effect on weld metal regions of the local brittle
fracture stress of the AR and 5%SA conditions. The results from the Charpy impact results
showed very little difference in the lower shelf regions of the impact transition curves
between the different microstructural conditions; hence these tests have been applied to gain a
greater understanding of the mechanisms of the cleavage fracture behaviour in both the AD
and RH microstructures.
Four point bending was used for the testing specimen arrangement, all the specimens tested at
-196oC failed before the general yield limit as predicted by Griffiths and Owen [163]. Results
from the slow blunt notch bend tests are a good assistance for explaining the temperature
transition behaviour of both the weld metal regions in the 5%SA conditions. Groom and
Knott [47] found that prestraining causes small increases in fracture stress in mild steel. An
increase in the transition temperature was the result of the increase in yield stress due to work
hardening to overcome this problem and the net effect was an increase in the transition
temperature. It is therefore important to find if this is valid for the weld metal used in this
work, also investigated is slow blunt notch bend tests were performed for both weld
microstructures in the 5%SA condition to indirectly measure any possible embrittling effect

P a g e | 150
of copper precipitation and/ or grain-boundary segregation of impurity elements that might
have occurred during ageing at 300oC on the intrinsic cleavage fracture stress.
7.1.1 Results
A photograph of a slow blunt notch testpiece is shown in Fig. 7.1, the specimen measures 10
x 10 x 55mm with a notch located at the centre of the specimen. The specimens were EDM
machined (wire eroded), Fig. 7.2 shows three photomacrographs of the notch from the
ADAR, RHAR, AD5%SA and the RH5%SA conditions, it can be seen how accurately the
notches have been produced, which is critical for this experiment. Load displacement data
was obtained for Weld No2 for both the AD and RH microstructures in both the AR and
5%SA conditions. The data was recorded using a chart recorder and noting the fracture loads,
Pmax, for tests conducted at -196oC, these traces are not included in this work, these
experiments were carried out on Dension Meyes machine fitted with a 50kN load cell. It can
be seen that in general the AD microstructure exhibited lower fracture loads, than the
equivalent RH microstructure. Fig. 3.22 shows Griffiths and Owen [163] analysis calculated
through FEM to find the variation in stress intensification ratio (R= σyymax/σy) below the notch
root for different loads, Fig. 3.21 shows the variation in stress intensification with applied
load. These figures have been used to calculate from the experimental results the local
cleavage fracture stress σX0, as well as values of X0 distance being obtained from
fractography, these are presented in Table 7.1 and summarised in Table 7.4 for both weld
metal microstructures and both conditions.
Fig. 7.3 illustrates local cleavage fracture stress, σX0, it can be seen that the AR weld metal
microstructures are higher than those observed for the 5%SA materials. Local cleavage
fracture stress, σX0, range from 1514 to 1940MPa for the ADAR condition compared with
2003 to 2221MPa from the RHAR condition, this is in contrast to 1629 to 1786MPa and 1739
to 1869MPa for the AD5%SA and the RH5%SA microstructural condition respectively. One
specimen, ADAR1 failed extremely early at 11.70 kN, upon further analysis and fractography
it was found to have an extremely large slag inclusion, close to the notch root.

P a g e | 151
For the AD microstructure the mean values for the local cleavage fracture stress, σX0,
calculated using the cleavage fracture initiation site (CIS), decreased from 1910MPa at -
196oC in the AR condition to 1710MPa in the 5%SA condition. Similarly for the RH
microstructure there was also a decrease in the mean values for local cleavage fracture stress,
σX0, from 1808MPa for the RH 5%SA condition compared with 2078MPa for the RHAR
condition. In general the AD microstructure exhibited lower σX0 values than the RH
microstructural region for equivalent conditions. No significant difference in the mean σX0
values are found for either the RH or AD microstructures after prestraining and ageing.
Using Griffith and Owen [163] FEM analysis and equation 4.16 the maximum principal
tensile stress, σyymax, was calculated for the two microstructures; AD and RH, in both
conditions, AR and 5%SA are presented in Table 7.2 and 7.3, for the AR and 5%SA
conditions respectively, these tests were carried out at -196oC. All results are summarized in
Table 7.4 and plotted in Fig. 7.4, the σyymax data for the ADAR microstructural condition
ranged from 1600 to 2196MPa compared with 1747 to 1858MPa for the AD 5%SA condition.
Both the RHAR and the RH 5%SA conditions exhibited an increase in the σyymax values
ranging from 2118 to 2291MPa and 1866 to 2258MPa for the RHAR and the RH 5%SA
conditions respectively. It can be seen that the AD microstructure exhibits lower maximum
principal tensile stress values then the RH microstructure for similar conditions. For the AD
microstructure, the mean principal tensile stress values σyymax decrease slightly from 1989 to
1795MPa for the AR condition compared to the 5%SA condition. However from the RH
microstructure there is a slight increase in the mean maximum principal tensile stress from
2212MPa in the AR condition to 1994MPa for the 5%SA condition. Again the AD
microstructures from equivalent conditions exhibited lower σyymax maximum principal tensile
stress values compared to the RH microstructure.
Plotted in Fig. 7.5 is the relationship between local cleavage fracture stress, σX0, and the
maximum principal tensile stress, σyymax. Ideally, there would be a perfect correlation
between these values, if σX0 occurred at the exact position of the maximum principal tensile
P a g e | 152
stress. Clearly from this figure they are close proximity, but not exact. Fig. 7.6 illustrates the
location of relevant cleavage fracture initiation sites plotted against the FEM analysis of the
stress intensification factor R versus X0, the distance below the notch, at various loads, with a
notch root radii of 200µm. It can clearly be seen for equivalent microstructural conditions
that the AD microstructural specimens fail at lower values of R than the RH microstructural
conditions. The AD5%SA weld metal condition and the RHAR are the worst and best
conditions respectively, with the AD5%SA condition exhibiting the lowest values of R and
the shortest X0 distances, compared to the RHAR weld metal condition which exhibited the
larger values of R with longer X0 distances. In Fig. 7.6, it can now be seen that sites occur
closer to the notch than the position of maximum tensile stress.
From the FEM analyses, the values of stress intensification ratio, R (σyymax/σy) were
calculated, and are presented in Fig. 7.7. The R value range for the ADAR microstructural
condition was 1.84 to 2.52 and this decreases after 5%SA to 1.77 to 1.88 (AD5%SA).
Mirroring this, the RHAR has a R value range of 2.42 to 2.63 compared to 2.01 to 2.42 for the
RH5%SA microstructural condition. Thus the AD microstructure exhibits lower stress
intensification values and therefore has less resistance to cleavage initiation and fracture than
the RH microstructure for all conditions studied. It can also be inferred from the diagram
there is a significant reduction in the mean R from the AR condition compared to the 5%SA
condition, for both microstructures, also explaining why 5%SA condition has lower resistance
to cleavage fracture. For the purpose of interpreting the data, R values above 2.62 have been
discounted, (RHAR5).
The X0 distance for the all weld meal conditions is shown in Fig. 7.8, it can clearly be seen
that both the AD microstructural conditions exhibited small X0 values compared with the
respective RH microstructural conditions. The X0 values for the ADAR microstructure
ranged from 187 to 245µm compared to 236 to 320µm for the RHAR microstructure, these
both decrease to 189 to 212µm for the AD5%SA condition and 201 to 244µm for the
RH5%SA condition. Using the FEM analysis obtained by Griffiths and Owen, as shown in
Fig. 7.9, illustrates the spread of plasticity, x, below the notch root at various loads. Using

P a g e | 153
this graph it is possible to estimate the size of the plastic zone region underneath the notch
root for the various microstructural conditions, these results are plotted in Fig. 7.10. The
RHAR microstructural condition exhibits both the higher x values and the largest amount of
plastic spread, compared with the AD5%SA weld metal condition which exhibits the smallest
plastic region ahead of the blunt notch and the lowest x values. Straining and ageing the weld
material appears to effect to the spread of plasticity. It is clear that a single cleavage initiation
site is more distant from the blunt notch root (higher X0 valves) for larger spread of plasticity.
The RH microstructure in the AR condition exhibited the largest spread of plasticity and
therefore the AD5%SA microstructural condition exhibits the smallest plastic region.
7.2 Fractography
Extensive fractography has been carried out on the blunt notch specimens, on both halves of
the fracture surfaces. Examination of the blunt notch facture surfaces involved location the
site of cleavage initiation (CIS) and the measure of initiation features (non-metallic
inclusions) from the notch root (X0).
The broken halves of two fracture surfaces are shown in Fig. 7.11 these specimens were tested
at -196oC and sampled the AD and the RH microstructure. In general there was 100%
coverage for the RH microstructure samples, compared with the AD microstructure, which
dependant upon the notch location in relationship to the sample had approximately 45%
coverage. The area of coverage for the AD microstructure is consistent for both the Charpy
specimens and CTOD specimens which were tested within the lower shelf where brittle
fracture is more predominant. It should be noted that the notch region and the plastic zone,
formed during loading ahead of the notch only sampled a single microstructural condition
either AD or RH.

P a g e | 154
All the specimens from both the AR and 5%SA conditions for both microstructures were
examined. Overall it was more difficult to locate the cleavage initiation sites in the RH weld
metal region compared to those in the AD weld metal region because of to the finer
microstructural nature of the RH microstructure. Although not measured carefully as part of
this study, it was clear that the AD microstructure exhibited larger cleavage facets than those
observed in the RH microstructure.
Fig. 7.12 through to 7.21 show examples of fractography taken during the analysis of the
blunt notch samples. Fig. 7.12 shows the fracture surface of RHAR4, the overall fracture
surfaces is shown with the distinctive river lines to the cleavage initiation site. At the centre
of the cleavage initiation site is a void Fig. 7.12(d) also labelled is some secondary cracking
Fig. 7.12(c). Fig. 7.13 shows an ADAR fracture surface, again there are the distinctive river
lines indicting the cleavage initiation site. A distinctive fracture surface feature of the AD
microstructure are cleavage steps, Fig. 7.13(c). Also shown is a decohered inclusion on the
fracture surface Fig. 7.13(d). An example of the overall fracture surface of an AD5%SA
microstructural condition is shown in Fig. 7.14(a), the cleavage initiation site is clearly seen
with an inclusion located at the centre of the CIS Fig. 7.14(c). Fig. 7.15 shows an example of
a RH5%SA microstructure fracture surface, the cleavage initiation site is shown in Fig.
7.15(c) and 7.15(d), however this sample seems to have two initiation sites close together,
therefore it would be hard to establish which initiated cleavage fracture in the specimen.
Fig. 7.15 to 7.21 exhibit more examples of cleavage initiation and fracture surfaces for a
range of samples. The cleavage initiation sites are generally characterised by macro and
micro-river lines, cleavage steps generally observed in the AD microstructure, secondary
cracking and decohered inclusions. X0 distance values for both microstructures in the AR and
5%SA conditions are plotted in Fig. 7.8. Generally the RH microstructure exhibits higher X0
values than the AD microstructure for equivalent conditions. It should therefore be noted that
all slow blunt notch bend tests were carried out at -196oC and changes in X0 are hence related
to only to the different microstructural conditions.

P a g e | 155
7.3 Discussion
7.3.1 Blunt Notch Tests
Slow blunt notch tests, carried out at liquid nitrogen temperature -196oC, in four point
bending allow the effects of different microstructural conditions on the resistance to cleavage
of the weld metal. The discussion will focus on local cleavage fracture stress, σX0, depending
on microstructure; this is as a result of differences being found between the AD and RH
microstructures, for both the AR and 5%SA condition. Events are to be considered on a
microstructural scale. The relation of fracture toughness to local cleavage fracture stress
relies on the identification of “critical distance” [203] when dealing with the difference
microstructures and the two different conditions. Despite the relatively small quantity of
specimens tested in each microstructure, the fine grained RH microstructure presented
considerably higher cleavage fracture resistance than the AD microstructure.
The discussion is based on the evaluation of some of the microstructural features of both
microstructures; e.g. non-metallic inclusion sizes (2D distribution) as well as measured facet
sizes from the cleavage initiation sites with the “local” Griffith criterion equation approach.
Changes in flow properties of both weld metal regions after prestraining and static strain
ageing are used to explain lower localised cleavage fracture stress of the AD microstructure.
Also considered, is the statistical nature of sampling potent inclusions of radius sufficiently
large enough to propagate a micro-crack (penny shaped) through the matrix.
7.3.2 Previous proposed model for cleavage fracture in C-Mn weld
metal.
Tweed and Knott [143] proposed a model for cleavage fracture in C-Mn weld metal; based on
results from their limited investigation. Their experimental results also indicated the same

P a g e | 156
basic concept can operate in both AD and fine-grain RH weld metal microstructures.
Previous research has also reached similar conclusions for C-Mn and low-alloy ferritic steel
weld metals [13-15]. Essentially the model requires prior plasticity to crack an inclusion,
followed by catastrophic failure from such unique initiation sites.
The effects of prestrain and strain ageing on cleavage fracture in mild steel [47] and C-Mn
[230] steels assessed using single-edge-notched specimens in slow bending established that
temperature at which fracture is coincident with general yield increases as a consequence of
these treatments. This implied that prestrain and strain ageing treatments promote brittle
fracture to higher temperatures. In the current work, unique initiation sites at inclusions have
been established in many cases. This allows the local cleavage fracture stress, σX0, to be
predicated accurately from the Griffiths and Owen stress analysis [163], see Fig. 7.3 and Fig
3.22. Here, there is no increase in cleavage fracture stress as a consequence of strain ageing.
Indeed, based on the mean values obtained for σX0, Table 7.1, there appears to be a decrease
in σX0 after strain ageing. Table 7.1, also suggests that the RHAR microstructure, has
increased σX0 than the ADAR microstructure. The RHAR microstructure in both conditions
exhibits increase σX0 compared to the AD microstructure.
7.3.3 Static strain ageing effect on cleavage fracture.
Cleavage fracture in low-alloy ferritic steel weld metals is controlled by the development of
tensile stress ahead of a stress concentrator. When load is applied to a testpiece, the elastic/
plastic strain ahead of the stress concentrator within the process region increases shown in
Fig. 3.22 [163], thus nucleating a microcrack in brittle non-metallic inclusion or second phase
particle, this propagates on the attainment of the critical tensile stress. This cleavage stress is
considered to be temperature independent [7, 9-11, 52, 152, 153]. The materials flow
properties control the cleavage fracture resistance within the material, other influencing
factors are the distribution of non-metallic inclusions and microstructural parameters, such as
grain size and microstructural constituents, found within the highly stressed zone ahead of the
blunt notch. Both the as-deposited and reheated microstructures possess similar inclusion

P a g e | 157
distributions, with static strain ageing not effecting or modifying the 2D inclusion size
distribution, as shown in Table 5.2 and Fig. 5.11 and discussed in Chapter 5.2.2. As a result it
can be inferred that there are two factors which could be controlling/ influencing cleavage
fracture resistance of the weld microstructure: (i) the microstructural parameters (e.g. grain
size, inclusion size distribution, microconstituents) within the process zone ahead of the crack
tip and (ii) plastic behaviour e.g. yield stress σy and work hardening exponent n.
7.3.4 Plastic deformation and strain ageing in low alloy ferritic
steel weld metal.
During this current work it has again been shown that plasticity is required, but is not a
sufficient condition for the onset of cleavage fracture, as the fracture stress in tension at -
196oC is greater than the yield stress for all weld metal conditions. Mean σyymax values at -
196oC were 1989MPa and 2212MPa for the ADAR and the RHAR conditions, compared to
yield stress values of 863 MPA and 901MPa for the same conditions respectively. This trend
was the same for the 5%SA condition, with the AD and RH microstructures exhibiting yield
stress values of 885MPa and 987MPa at -196oC, corresponding σyymax values were 1795MPa
and 1994MPa, shown in Fig. 6.11 and 6.17, Tables 7.2 and 7.3. This underlines the
observation in Chapter 5.3.2 that yield stress and σX0 and σyymax are not representative of the
weld metal as a whole due to the inhomogeneous nature of the material.
It would be reasonable to deduce that plasticity preceded cleavage fracture in the weld metal,
this was also inferred by Tweed and Knott [7, 143] for C-Mn weld metals. This is also
confirmed by the fact that local cleavage fracture stress values are localised within the plastic
process zone ahead of the blunt notch root. Also, in the same study, Tweed and Knott [7,
143] observed that if total strain in the material is relatively low, roughly smaller than 7%,
then strain is perhaps more easily accommodated by deformation of grain boundary ferrite,
which is a relatively soft constituent. It has also been suggested that the cleavage initiation
micromechanism at lower strains could be associated with plastic deformation solely in the

P a g e | 158
grain boundary ferrite constituent [7]. Previous authors and research [7, 13, 14, 52, 71, 113]
has highlighted the deleterious effect on fracture toughness of C-Mn steels and weld metals
and also in Mn-Mo-Ni steel weld metals [14, 15] due to the occurrence of grain boundary or
allotriomorphic ferrite constituents in the materials microstructure. More recent research [14,
15] has also concluded that initiating inclusions were located within large allotriomorphic
grains in a C-Mn weld metal within the AD microstructure. This is in agreement with the
results from previous research [15] and observed during this current work, however these
were not measured as this would be outside the current scope. The fractography presented
here revealed that initiating inclusions are located within larger allotriomorphic ferrite grains
in the AD microstructure and this is in good agreement with previous authors [14, 15].
However it should be noted that both microstructures presented similar inclusion size
distributions, Chapter 5.2.2. In the RH microstructure the initiating inclusions were still
located within larger cleavage facets; however these were smaller than the corresponding
allotriomorphic ferrite grains in the AD microstructure. It should also be noted that a similar
trend was also identified during fractorgraphic examination of tensile, Charpy and CTOD
fracture surface samples and examining cleavage initiation sites of both microstructures.
Assuming that inclusions crack under the influence of a dislocation pile-up and the stress
magnitude depends on the length of the dislocation pile-up, then a large allotriomorphic
ferrite (generally found in the AD) would be more detrimental to cleavage fracture resistance
than the small equiaxed grains (generally found in the RH microstructure), since the
allotriomorphic constituent would contain longer dislocation pile-up lengths. If global
prestraining procedure is uniform, than the total stress applied during the cold deformation
should be more equally distributed in the RH microstructure (due to its equiaxed ferrite
grains) compared to the AD microstructure where total strains may be more accommodated
by deformation of grain boundary ferrite than of other constituents such as acicular ferrite.
Hence, large allotriomorphic ferrite grains and long dislocation pile-up lengths may explain
why the AD microstructure is more sensitive to static-strain ageing than the RH
microstructure and therefore presenting a lower cleavage fracture resistance.

P a g e | 159
The importance of the facet size parameter in reducing the cleavage fracture resistance of the
weld metal is in agreement with early dislocation models for cleavage fracture of a
polycrystal, where cleavage fracture stress is related to the materials grain size through the
Petch [178] model for yielding. However, the influence of facet size in allowing the easier
propagation of a microcrack from grain to grain ensures that this debate will run for many
decades to come.
7.3.5 Relative position between maximum principal tensile stress
(σyymax) and the cleavage initiation site.
Maximum tensile stress, σyymax, is shown (Fig. 3.22) below the notch root [163]. From the
analysis is it possible to see that the peak σyymax is always located behind the elastic/ plastic
interface and moves further as the load is applied from the notch root, and plastically spreads.
The results of this current work have shown that most of the cleavage initiation sites are
located in close proximity to, but closer to the notch then, the peak tensile stress, as predicted
from the finite element analysis, as shown in Fig. 7.6. Specimens sampling the AD
microstructure exhibit lower stress intensification values than those sampling the RH
microstructure for both the AR and 5%SA conditions. This is due to the higher yield stress
values and the lower values of σX0 exhibited for the AD microstructure compared to that of
the RH for a similar conditions Fig.7.7. The consequence is that less stress intensification, R,
is needed to attain the critical fracture stress. In addition, all the catastrophic cleavage events
are located above the 85% σyymax level for both of the weld metal microstructures and for all
conditions studies in this current experimental programme. This demonstrates that cleavage
fracture starts reasonably close to the maximum local tensile stress and within the area
covered by 85% of σyymax, this tends to support the critical stress controlled criteria for
cleavage fracture initiation from non-metallic inclusions.
All the specimens tested at -196oC failed within the plastic zone, this is essential as the strain
and ageing procedure affects the deformation properties of the weld metal conditions, as

P a g e | 160
previously discussed in Chapter 6.4. This result offers good support from the different
response of mean X0 distances exhibited from the AR condition and the 5%SA condition for
both microstructures. The distance X0, which is between the blunt notch root and the
cleavage initiation site (CIS), depends on the microstructural condition of the weld metal.
The AD microstructure generally exhibits shorter X0 distance than the RH microstructure for
equivalent conditions. It also exhibited smaller X0 shifts in both the AR and 5%SA condition
than the RH microstructure Fig. 7.6. In short these results reinforce the fact that the RH
microstructure exhibited a greater local cleavage fracture stress, σX0 than the AD condition for
similar microstructural conditions. Thus it is crucial that the stress intensification ratio is
increased to higher levels in order to reach the required local cleavage fracture stress. As a
consequence the size of the plastic zone becomes larger and the cleavage initiation sites (CIS),
the distance X0 shifts further away from the root of the blunt notch (for the RH
microstructures).
The tensile stress criterion predicts that catastrophic cleavage fracture occurs in slow blunt
notch bend testing when the stress intensifies. Thus the principal local tensile stress
overcomes the intrinsic cleavage fracture stress at a potent initiation site, for example a non-
metallic inclusion, which is located ahead of the blunt notch in the plastic process zone. The
variations in the experimental results for X0 for all the microstructural conditions could be
explained by the possibility of sampling a inclusion of a given size (≤3.5µm) in the high stress
region.
In conclusion the AD weld metal microstructure exhibits lower local cleavage fracture stress
values, σX0 compared to the RH microstructure. This is deduced to be due to the RH
microstructure having small facet sizes at the cleavage initiation sites, for similar inclusion
size distribution between the weld metal regions. Also any small changes in local cleavage
fracture stress, σX0, are observed for both microstructures after the static strain ageing
procedure, shown in Fig. 7.3, with an increase in the yield stress. This contributes to early
onset of catastrophic cleavage fracture in both weld microstructures and conditions and this
supports shifts in DBTT after static strain ageing.

P a g e | 161
Therefore, despite cleavage fracture stress remaining practically the same after the strain and
ageing procedure, the cleavage fracture resistance of both microstructures, (mainly in the
AD5%SA microstructural condition) is expected to be reduced due to an increase in yield
stress. Chapter 8 explores in more detail the relationship between local cleavage fracture
stress σX0 and yield stress σy with the cleavage fracture resistance of the weld metal in the
presence of a sharp crack, together with the transition shifts obtained from the Charpy impact
tests.
7.3.6 Relationship between inclusion size and local cleavage
fracture stress, σX0.
By applying a modified Griffith relation, Curry and Knott [158, 191, 231], have inferred the
fracture stress of spheriodised carbides by treating microcrack propagation from
microstructural constituents as propagation of a penny shaped crack. Using the modified
Griffith equation, presented in Section 4.2.9, to estimate the fracture stress for non-metallic
inclusions and evaluate cleavage fracture resistance of weld metal. Inclusion sizes and
corresponding facet sizes were not evaluated in detail as part of this current work. However
using Griffiths and Owen [163] to evaluate local cleavage fracture stress σX0 values, these can
be plotted against the reciprocal square root of the inclusion size located at these cleavage
fracture initiation sites see Fig. 7.6, for each microstructural condition. From this figure an
effective surface energy, γp, can be estimated by using equation 4.17.
Previous research [14, 15] using Weld No1 has shown that effective surface energies for both
the AR and 5%SA conditions in the AD microstructure was 7.6Jm-2 and 8.0Jm-2 for the RH
microstructure. Wenman [14], using a similar composition of material also noted a
comparable mean value γp of 7 Jm-2 in the AR weld metal condition, with previous authors for
a value of γp in “classical weld” metal microstructures 9Jm-2 [22] and numerous types of plate
materials containing carbides 14Jm-2 (Curry and Knott [155, 158, 231]) and 4.3 to 6Jm-2

P a g e | 162
(Bowen [10, 11]). The relationship between the reciprocal square root of the inclusion
diameter and local cleavage fracture stress, here, very weak. Thus for the onset of cleavage
fracture to occur the size of the inclusion is a necessary constituent but not fundamental, as
the majority of non-metallic inclusions vary in size from 1.1 to 4.5µm, as shown in Fig. 5.21.
Nevertheless fractography did show that the facet sizes at the cleavage initiation site were
visibly larger in the AD microstructure than those observed in the RH microstructure. Thus
cleavage initiation sites with larger facet sizes, as exhibited in the AD microstructure are
deduced to be explainable for the poor cleavage fracture resistance of this microstructure,
compared to the fine equaixed RH microstructure.
7.4 Conclusions
1. The AD microstructure exhibited slightly lower local cleavage fracture stress, σX0,
values than the RH microstructure for similar conditions. Mean values of σX0 were
1910MPa and 2078MPa for the ADAR and RHAR conditions respectively. After
strain ageing, mean values of σX0 were 1710MPa and 1808MPa for the AD5%SA and
RH5%SA conditions, respectively. Thus local cleavage fracture stresses for both weld
metal microstructures were slightly reduced after prestraining and statically strain
ageing.
2. Locations of cleavage initiation sites for all microstructural condition were located
within the plastic zone ahead of the blunt notch and close to the predicated position of
maximum principal tensile stress in the specimen.
3. Non - metallic inclusions were found to the primary cleavage initiation factors for
cleavage fracture to occur. These were from the upper tail of the inclusion size

P a g e | 163
distribution and were of similar sizes in both microstructures. It was also observed in
the weld metal, that the RH microstructure visually exhibited considerably smaller
cleavage facets sizes compared to those of the AD microstructure at cleavage initiation
sites.

P a g e | 164
Chapter 8 - Results - Crack Tip
Opening Displacement (CTOD)
Tests.
8.1 Introduction
This chapter explores the effect of static strain ageing on the CTOD behaviour of small - scale
specimens, for both weld metal microstructures across a test temperature range of -196oC to
20oC to compare their resistance to stable crack growth extension and brittle fracture.
Examination of the effect of initial pre-crack length on the type of fracture obtained are
investigated in some detail. Fractography was carried out on the fracture surfaces of the
specimens to confirm that the fatigue precrack tip was properly located within the desired
microstructure; checks were also made to ensure that the corresponding physical crack
extension had propagated within the same microstructure. In Chapter 9, results are compared
to Charpy, tensile and slow blunt notch tests.
8.2 Results
8.2.1 Fatigue pre-cracking.
Upon completion of the CTOD tests, the fatigue pre-crack length was measured at nine
equally spaced positions along the crack front, as described in section 4.9. The average pre-
crack length, a0, is used to calculate the CTOD value, shown in Tables 8.1 to 8.18. Also
P a g e | 165
shown are W
a0 values, where W is the width of the specimen, which is also used to calculate
CTOD values. British standard BS7448: Part 4, 1991 requires that the crack length, a0 should
be within the range of 0.45 to 0.55W
a0 . Due to the weld microstructure and the weld bead
height measuring between 0.45 to 0.55mm for Weld No1 and 0.33 to 0.45mm for Weld No2 it
was not possible to meet the requirements of the British Standard. This is due to the need the
fatigue precrack and any stable crack growth to be within the designated microstructure, as
previously discussed in section 4.9.
8.2.2 CTOD Results for Weld No1.
CTOD test results for Weld No1 are shown in Tables 8.1 to 8.4 and have been assigned the
correct δc, δu and δm designations where:
• δc - critical CTOD at the onset of brittle crack extension when ∆a is less than 0.2 mm;
• δu - critical CTOD at the onset of brittle crack extension when ∆a is equal to or greater
than 0.2 mm;
• δm - value of CTOD at the first attainment of a maximum force plateau for fully plastic
behaviour.
A total of 42 AR specimens were tested, 20 ADAR specimens and 22 RHAR specimens and
32 specimens in the 5%SA conditions, consisting of 15AD5%SA specimens and 17 RH5%SA
specimens. These results are presented in Fig. 8.5 to 8.7. Load versus clip gauge
displacement curves are illustrated in Fig. 8.1 to 8.4 for all specimens, for all four
microstructural conditions.

P a g e | 166
ADAR microstructure CTOD values ranged from 0.005 to 0.368mm across the temperature
range of -196 to 20oC. Across this same temperature range the RHAR microstructure
exhibited CTOD values of 0.003 to 0.582mm. As with previous experiments carried out
during this programme the 5%SA condition exhibited lower CTOD values when compared to
the AR conditions. CTOD values ranged from 0.022 to 0.058mm and 0.007 to 0.263mm for
the AD5%SA and the RH5%SA microstructural conditions respectively, across the
temperature range of -120 to 20oC.
As illustrated in Fig. 8.5 to 8.6, the ADAR microstructural condition exhibited δc values
ranging from 0.005 to 0.060mm across the temperature range of -196 to -100oC. One
specimen, ADAR specimen 1, exhibited a δc value of 0.128mm tested at room temperature.
This specimen failed extremely early, the reason for the cause of failure was unknown, so was
investigated further on the SEM. δu values ranged from 0.070 to 0.280mm across the
temperature range of -80 to -40oC, whilst the δm values across the temperature range of -60 to
20oC ranged from 0.150 to 0.368mm. In comparison, the majority of the RHAR samples
were δm values; these ranged from 0.289 to 0.594mm for -80 to 20oC, only 4 samples
exhibited δu values across the temperature range of -100 to -40oC, these ranged from 0.091 to
0.408mm. There were only three δc specimens with CTOD values ranging from 0.003 to
0.064mm across the temperature range of -196 to -120oC, shown in Fig. 8.5 and 8.6.
The AD5%SA microstructural condition only exhibited two δm values, both at 20oC, of 0.119
and 0.100mm, δc values ranged from 0.004 to 0.027mm from -120 to -60oC and there were 5
specimens that exhibited δu values ranging from 0.050 to 0.084mm for the temperature range
of -40 to 20oC, shown in Fig. 8.5 and 8.7. Finally the RH5%SA microstructural condition
exhibited 4 specimens with δc values at -120 to -60oC, exhibited CTOD values of 0.005 to
0.085mm compared with δu values ranging from 0.099 to 0.193mm across the temperature
range of -60 to -40oC, with δm CTOD values ranging from 0.204 to 0.276mm for -40 to 20oC,
as shown in Fig. 8.5 and Fig. 8.7. It should be noted that the δm value is sensitive to the
remaining ligament size and specimens with similar values of original crack length should be
compared to establish any trends within these results. Also the amount of stable crack growth

P a g e | 167
length, ∆a was not measured here given that testpieces were past general yield (plastic
collapse).
Fig. 8.8 shows the amount of stable crack growth (where measured) plotted against the CTOD
value, (values for the amount of stable crack growth are shown in Tables 8.1 to 8.4). The
stable crack growth ranged from 0 to 0.545mm for the ADAR microstructural condition,
compared with 0 to 0.426mm for the RHAR microstructural condition. Stable crack growth
for the 5%SA condition ranged from 0 to 0.410mm and 0 to 0.268mm for the AD5%SA and
RH5%SA microstructures respectively. Fig. 8.9 illustrates that the increasing temperature
corresponds with an increase in the amount of stable crack growth. It can be seen that at -
80oC that the AD5%SA and RH5%SA microstructural conditions both exhibited δc values,
with both of the AR microstructural conditions exhibiting δu values. It can be seen that at
lower temperatures all four of the conditions exhibited δc values. As the temperature
increases a mixture of δc and δu values are exhibited in the transition region. There was
mixture of δu and δm values on the upper shelf region, δm values are not plotted on this graph
as stable crack growth was not measured for these samples (since taken past general yielding).
8.2.3 CTOD Results for Weld No2.
The test results for Weld No2 are shown in Tables 8.5 to 8.8, have been summarised and
assigned the correct CTOD designations. 42 AR specimens, 20 AD and 22 RH specimens
were tested and 25 specimens in the 5%SA condition, 12 AD and 13 RH specimens. Figures
8.10 to 8.13 exhibit the load versus clip gauge displacement graphs for the four
microstructural conditions while Fig. 8.14 to 8.16 exhibits the CTOD values plotted against
temperature. It is clear from the Figures presented here and for Weld No1 that AD5%SA
microstructural condition exhibits lower work-hardening exponent and a higher maximum
load plateau compared to the AR condition. This behaviour is a result of higher yield stress
levels and low ductility exhibited by the 5%SA condition.

P a g e | 168
CTOD values ranged from 0.027 to 0.538mm for the ADAR microstructural condition across
the temperature range of -140 to 20oC, across the same temperature range the RHAR
microstructure exhibited CTOD values of 0.086 to 0.811mm. The 5%SA condition again
exhibited the lower CTOD values when compared with the AR condition. For the AD5%SA
condition the CTOD values ranged from 0.026 to 0.455mm and 0.034 to 0.561mm for the
RH5%SA condition as the same temperature range as the AR condition. The ADAR
microstructural condition across the temperature range of -120 to -80oC, δc exhibited values
ranging from 0.027 to 0.072mm. Values for δu ranged from 0.066 to 0.246mm across the test
temperature range of -80 to -40oC, whilst δm values ranged from 0.303 to 0.538mm for the
temperature range of -40 to 20oC. As with the results in Weld No1, the majority of specimens
for the RHAR microstructural condition for Weld No2 exhibited δm values, these ranged from
0.510 to 0.811mm, across the temperature range of -60 to 20oC. Only six specimens
exhibited δu values and these ranged from 0.248 to 0.509mm for the temperatures -80 to -
60oC. Across the temperature range of -120 to -100oC there were seven RHAR specimens
with δc values noted and these ranged from 0.086 to 0.292mm.
Again for Weld No2 the 5%SA condition exhibited the lowest CTOD values, the AD5%SA
condition exhibited two δm values ranging from 0.402 to 0.455mm, both at room temperature.
Three δu values were observed from -60 to -20oC which exhibited CTOD values of 0.230 to
0.321mm. The majority of the specimens exhibited δc ranging from 0.026 to 0.151mm across
the temperature range of -120 to -60oC. The RH5%SA microstructural condition exhibited
two δm values at room temperature ranging from 0.499 to 0.561mm. δu values range from
0.173 to 0.381mm across the temperature range of -60 to -20oC and δc values from 0.034 to
0.170mm across the temperature range of -120 to -60oC.
The amount of stable crack growth is plotted against CTOD values, as shown in Fig.8.17 and
Tables 8.5 to 8.8. The stable crack growth ranged from 0 to 0.317mm for the ADAR
microstructural condition compared with 0 to 0.299mm for the RHAR microstructural
condition. For the 5%SA microstructural condition the stable crack growth ranged from 0 to
0.325mm and 0 to 0.363mm for the AD5%SA and RH5%SA microstructures respectively.

P a g e | 169
Fig. 8.18 illustrates the stable crack growth plotted against temperature, following the same
trend as Weld No1; the amount of stable crack growth increases with increasing temperature.
δc values are exhibited on the lower shelf, as the temperature rises up through the transition
region there is a mixture of all three CTOD designations with δm values defining the upper
shelf.
8.3 Fractography
Fractography was carried out on selected specimens for the RH and AD microstructural
conditions in both the AR and 5%SA conditions. Some fractography was carried out on both
weld metals, but attention is given to Weld No2 and particularly to testpieces which presented
some areas of cleavage fracture. It was also essential to check the fatigue pre-crack tip in
relation to the weld microstructure and the position of the corresponding physical crack
extension. Fig. 8.19 and Fig. 8.20 show typical fracture surfaces for both the AD and RH
microstructures, clearly illustrating that the fatigue pre-cracks were properly located within
the desired location and microstructures (AD or RH). A number of specimens exhibited
irregular stable crack extension prior to the onset of transgranular cleavage fracture. In the
case of the RH microstructure the fatigue precrack tip and corresponding stable crack
extension are always located within this microstructure. This is mainly a result of notch
positioning with respect to weld cross-section, which only samples this microstructure.
Fractography for some of the specimens are presented in Fig. 8.21 - Fig. 8.34. As previously
discussed for the tensile and Charpy specimens, the fracture surfaces are characterised with
many of the same features. Fig. 8.23 shows fractography carried out on Sample 31, ADAR
Weld No1, where both sides of the fracture surface were examined, secondary cracking was
noted close to the cleavage initiation site (CIS). Fig. 8.25 exhibited a large amount of ductile
tearing as well as cleavage steps. Sample 5, RH5%SA, Weld No2 exhibited a large secondary
crack, initiating from the CIS. Some samples presented stable crack growth followed by
transgranular cleavage, mainly for the AD microstructure. The remaining specimens

P a g e | 170
exhibited stable crack growth, with no cleavage fracture mechanism both the specimen
reached the maximum load plateau. On some specimens it was possible to trace back river
lines on large grain boundary ferrite cleavage facets to a distinct initiation site, Fig. 8.21 and
Fig. 8.23.
The micromechanism of fracture in the stable crack growth regions of all the microstructures
and conditions was microvoid coalescence formed around non-metallic inclusions, as shown
in Fig. 8.22, Fig. 8.26, Fig. 8.31 and Fig.8.33. Examination by fractography of these
testpieces which had failed by fracture instability showed that this was a result of the onset of
brittle fracture by transgranular cleavage. The AD specimens for both the AR and 5%SA
conditions displayed a wide distribution of cleavage facet sizes.
The AD microstructural fracture surfaces are characterised by a “rough” appearance resulting
in shallower voids, this is due to the morphology of the microstructure. Within the RH
microstructural condition the cleavage facets were more uniform in appearance; this resulted
in a “finer” surface appearance for the cleavage fracture surface. These small facets crack
propagation more difficult as the crack must change direction more often, shown in Fig. 8.22
and 8.26 for the RHAR and ADAR conditions respectively. Previous [15] research carried
out on the same weld metal also noted that there were visually shallower voids for the RH
microstructure compared to those of the AD microstructure. Theory also suggests that
dislocation pile-up causes the inclusion to crack and nucleate a microcrack, limiting the pile-
up length is the grain size (equivalent to the facet size). Cleavage initiation sites were
identified by tracing back diverging river lines. The majority of these testpieces showed that
cleavage initiation occurred in non-metallic inclusions located within large cleavage facets,
these are shown in Fig. 8.21 and Fig. 8.27.
The McMeeking [232] analysis of the stress distribution ahead of the blunted crack-tip shows
that the peak tensile stress occurs at a distance of 1.9δ, where δ is CTOD. Fractography was
carried out on the fracture surfaces to measure the distance of the initiation site ahead of the

P a g e | 171
ductile crack-tip. The results are shown in Tables 8.9 to 8.13 for both weld metals in all four
conditions, good correlation was found between the predicted site from the McMeeking [232]
analysis and the actual measured site. Fig. 8.35 and Fig. 8.36 illustrate the results plotted
against temperature for Weld No1 and Weld No2 respectively. Generally, the actual sites were
located slightly ahead of the position of peak tensile stress predicted by the McMeeking
analysis.
8.4 Discussion
8.4.1 CTOD values.
The effects of plastically deforming and statically strain ageing the A533B Class 1 weld
microstructures has been assessed through CTOD tests. The tests were carried out on weld
metals for both microstructures; AD and RH and both microstructural conditions; AR and
5%SA. The tests were carried out over the temperature range of -196 to 20oC on Charpy
sized specimens (10 x 10 x 55mm) to assess the resistance to stable crack extension. The
results clearly showed a significant effect of static strain ageing on the fracture toughness for
the AD microstructure. Pre-cracked Charpy sized specimens were chosen because they are
used in surveillance schemes for the nuclear industry [14, 15, 233]. However, smaller
specimens tend to fracture under a mix of plane strain and plane stress conditions, reducing
the plastic constraint near the crack tip [15, 234]. Due to the fine scale of the weld metal care
was taken for the specimen preparation, leading to the attainment of an initial ligament size,
permitting enough microstructure to be sampled ahead of the fatigue pre-crack within the
process zone. Sampling plays a critical role, at higher temperatures yield stress is lower,
therefore the maximum tensile stress available to drive cleavage is also lower, therefore a
more potent site to initiate cleavage is needed. Due to specimen size the maximum tensile
stress position may not sample a potent site for cleavage, hence, cleavage fracture does not
occur, instead the crack front moves forward via the stable crack growth mechanism.
Through this mechanism the position of the maximum tensile stress is pushed forward,
material is sampled until a potent cleavage initiation site is sampled and catastrophic failure

P a g e | 172
occurs. It should be noted that CTOD values are calculated from the measurement of physical
crack length. In some cases, δm, values the ductile crack extension continues after the
attainment of the maximum load, where the net specimen section plastically collapses.
However, some samples, still fail by cleavage. In Fig. 8.8 and 8.17 for Welds No1 and No2,
respectively, the effect of the amount of stable ductile crack growth and increase in CTOD
values is shown. Clearly, the value of CTOD increases as the value of ductile crack growth,
∆a increases, therefore, it is noted that an effect of microstructural condition is seen clearly
only for the RHAR condition. In Fig. 8.9 and 8.18, the influence of test temperature on the
amount of ductile crack growth is shown. In general, the amount of ductile crack growth
increases with increasing temperature, although the trend for Weld No1 is highly scattered at a
given temperature.
Such an analysis indicates the importance of precursor ductile crack growth in determining
CTOD toughness values. Such ductile crack growth is interrupted by catastrophic cleavage
fracture (for δc and δu values) and occurs close to the predicted position of the maximum
tensile stress (1.9δ), Fig. 8.35 and 8.36. For both welds, the RHAR microstructure exhibits
the best CTOD toughness with temperature; see Fig. 8.5 and 8.14 for Weld No1 and No2,
respectively. For this RHAR microstructure a given amount of ductile crack growth (∆a),
Fig. 8.8 and 8.17, the CTOD is increased, consistent with more energy absorption with crack
advancement.
After strain ageing, the amount of ductile crack growth prior to cleavage at a given
temperature, see Fig. 8.18 for Weld No2, in particular is reduced from those compared with
AR condition. Now it is likely that the resistance to cleavage fracture has been reduced. The
load versus displacement curves presented in Fig. 8.1 - 8.4 for Weld No1 and 8.10 - 8.13 for
Weld No2, clearly show that the AD microstructure had a lower CTOD toughness than the RH
microstructural condition in both the AR and 5%SA conditions in both welds. In addition, a
reduction in work hardening exponent could lead to a lower value of CTOD, δ, per unit of
stable crack extension, ∆a. This is a similar trend to that seen in Charpy specimens tested in
P a g e | 173
the transition region, where the amount of absorbed energy per unit of ductile thumbnail
extension shown to be lower for the 5%SA condition compared with the AR condition.
8.4.2 Modelling Cleavage Fracture.
Cleavage fracture mechanism in low alloy ferritic steel weld metal occurs under tensile stress
controlled fracture mode, where stress develops ahead of a concentrator such as the crack tip.
Load is applied to a testpiece, the plastic strain in the process region ahead of a stress
concentration increases, thus nucleates a microcrack in a non-metallic inclusion (brittle
second phase particle). The microcrack propagates into the surrounding ferrite matrix under
the influence of the applied stress, the maximum tensile stress is considered to be temperature
independent. The materials toughness and cleavage fracture resistance is controlled by the
materials flow properties and the distribution and size of non-metallic inclusions and
microstructural parameters of the weld (e.g. grain size and microstructural constituents)
within the process zone and crack-tip (region of high stress).
The materials plastic behaviour for example, yield stress and the materials microstructural
parameters, distribution of inclusions and grain size, are two main factors which appear to
control the weld metals cleavage fracture resistance. Previous studies into the effect of strain
ageing on cleavage fracture in C-Mn steels [9, 10, 155, 158, 191, 213] and A533B steels [14,
15] demonstrated that initiation inclusions were located within large allotriomorphic ferrite
grains. This is in agreement with the results from fractography examination carried out on
cleavage initiation sites on the fracture surfaces of the CTOD specimens, which revealed that
within the AD microstructure initiating inclusions were located within large allotriomorphic
ferrite grains, presented in change Fig. 8.23 and Fig. 8.29. Patriocinio [15] noted in a recent
study of A533B that both the AD and RH microstructures presented similar inclusions size
distributions. Fractography revealed that within the RH weld metal region initiating
inclusions were located within large cleavage facets, although these cleavage initiation sites
are smaller than those observed in the AD microstructural region. It can be assumed that
inclusions crack under the influence of dislocation pile-up; hence, large allotriomorphic ferrite

P a g e | 174
grains would have more influence on cleavage fracture resistance than smaller equiaxed
ferrite grains (both before and after microcrack initiation).
CTOD curves clearly show that the toughness of the RHAR microstructure is greater than that
of the AD weld metals for both the AR and 5%SA conditions. McRobie and Knott [52]
proposed that C-Mn weld metal in a strain aged condition would have a reduced toughness
and therefore catastrophically fracture by cleavage at a lower value of CTOD, compared to
the AR weld metal, thus increasing the severity of strain ageing which result in smaller values
of CTOD.
If global prestrain is uniformly distributed, then the total strain applied should be equally
distributed in the equiaxed ferrite of the RH microstructure compared to the AD
microstructure, where strain is more easily accommodated by deformation of grain boundary
ferrite grains. The morphology of the AD microstructure, e.g. large allotriomorphic ferrite
grains and long dislocation pile-up lengths may explain why the AD microstructure is more
susceptible to strain ageing and therefore presenting lower cleavage fracture resistance
compared to the RH microstructure.
8.4.3 δ-R Data Validity
During this programme of work, pre-cracked Charpy-sized specimens (10x10x55 mm) were
chosen mainly because they are often used in surveillance schemes carried out within the
nuclear industry. However, there is a general concern with size effects of the specimen and
little fracture toughness data has been obtained for small sized specimens. These specimens
tend to fracture under a mixture of plane stress and plane strain conditions that reduce the
plastic constraint near the crack tip and can raise the CTOD value. The pre-cracked ligament
size is only 5mm and the amount of microstructure sampled ahead of the fatigue pre-crack tip
in the process zone is small to the extent that even fine weld beads as seen by Weld No2 can

P a g e | 175
sample a single microstructural region by the crack tip. However due to the fine nature of the
weld beads, this become more problematic.
Some of the specimens from both weld metals tested above -80oC exhibited catastrophic
brittle failure after the attainment of the maximum force plateau. However it is well
documented [14, 15, 234, 235] that the maximum load attainable depends on yield stress of
the material and on the ligament size. After the attainment of the maximum load the net
specimen which collapse plastically, however a number of specimens still failed by cleavage
fracture. At higher temperatures, the yield stress is lower and therefore the maximum tensile
stress available for cleavage fracture is lower, so sampling plays an increasingly important
role. The maximum tensile stress position may not sample such a potent site and therefore
cleavage did not intervene and so the crack front moves forward via a ductile crack growth
mechanism. As this is happening the position of the maximum tensile stress also moves
forward with sampling more material until a potent site for cleavage fracture is sampled and
catastrophic fracture results. Within these small samples it appears possible that the crack
front can grow to a point where the maximum load occurs without cleavage initiation site
being observed and the net section collapse of the specimen starts to occur. The crack is still
growing and sampling of more material continues and therefore eventually cleavage fracture
intervenes presumably because a potent site has been found. Thus it is plausible that in larger
specimens that cleavage fracture might have intervened before the maximum load. On the
USE level there is a lot of scatter even after allowing for different initial crack lengths
(ligament size). Thus, despite the stable ductile crack tip was located within the top weld
bead, the process zone could reach the second weld bead where cleavage fracture occurred, as
schematically shown in Fig. 8.37.
In small specimens the USE is determined largely by the maximum load attained before
plastic collapse and this is dependent on the load sustaining ligament and therefore its size.
This must also affect the amount of stable growth crack that can occur before plastic collapse.
For specimens with initial long crack length only a small amount of stable crack growth can
occur before the ligament can no longer sustain the load, thus a “m” value is recorded. If the
P a g e | 176
ligament had been larger the ductile crack growth could have been longer and therefore
sampled a potent cleavage fracture initiation site, this could lead to a “u” value being
recorded, so care must be employed when interpreting results for small scale testpieces.
8.4.4 Fractography.
The effect of plastically deforming and statically strain ageing the AD microstructure led to a
reduction in the value of CTOD at fracture, compared to the RHAR and ADAR weld metal.
Major cleavage initiation sites on the crack-tip opening displacement surfaces were often
visually observed to be within allotriomorphic areas. In fact, Novovic [13] concluded that
initiating inclusions in the AD microstructure of the C-Mn weld metal were located within
allotriomorphic ferrite grains. Patrocinio [15] also observed cleavage initiation sites (CIS)
within allotriomorphic ferrite grains for tensile, Charpy impact and blunt notch test specimens
in A533B Class 1 steels.
The fracture mechanism in the CTOD testpieces was stable crack growth (microvoid
coalescence) followed by cleavage fracture. It was observed that a number of testpieces
reached the maximum load plateau, either failing by cleavage fracture, or the test being
stopped. Some of the specimens failed under plastic collapse after attaining the maximum
load plateau. Microvoid coalescence (MVC) occurs by the internal necking mechanism
through the formation of voids around non-metallic inclusions and secondary phase particles
by decohesion of the matrix/ inclusion interface. The growth of these voids is aided by plastic
deformation, leading to ultimate coalescence and the formation of the final fracture surface.
During the stable crack growth, the amount of energy absorbed depends on the weld
characteristics, as void nucleation and void growth are influence by local plastic deformation.
The appearance of the cleavage fracture surface differed between the AD and RH
microstructures, the microstructure clearly showed coarser facets when compared to the very

P a g e | 177
fine facets of the RH microstructure, Fig. 8.22 and Fig. 8.26, for the RH and AD
microstructures, respectively.
Cleavage fracture initiation sites have been traced to non-metallic inclusions within large
cleavage facets which appear to be larger than the average grain size. Hence, the dislocation
pile-up length is increased in large grains, meaning higher stress build up against the
inclusions within the grain and makes inclusions more liable to crack than those in other
grains.
Novovic [13] observed in 9% prestrained C-Mn weld metal a “fast shear” mechanism
occurred along shear band of localised plastic strain during ductile fracture instead of internal
necking process. Hence overall the strain and fracture toughness associated with microvoid
coalescence is significantly smaller in 5%SA condition compared to those in the AR material
condition.
It is proposed that the RH microstructure is tougher than the AD microstructure due to their
greater resistance to cleavage fracture, as shown by the larger CTOD values observed for the
RH microstructure. Critical tensile stress must be exceeded some distance ahead of the crack-
tip for cleavage to occur. The local cleavage fracture stress is considered to be temperature
independent. The materials toughness and cleavage fracture resistance is controlled by the
materials flow properties and the distribution and size of non-metallic inclusions and
microstructural parameters of the weld (e.g. grain-size and microstructural constituents)
within the process zone and crack-tip (region of high stress). However, as the temperature
decreases and the yield stress increases it becomes easier for local tensile stresses to attain the
local cleavage fracture stress and hence for cleavage to occur. Also, the AD5%SA
microstructural condition exhibited high yield stress compared with both the AR conditions,
thus tending to promote cleavage fracture if this model of behaviour is accepted.

P a g e | 178
The toughness of the RH microstructure is higher than that of the AD microstructure;
therefore the crack may have to advance further in a ductile fracture mode until a potent
inclusion site is sampled within the RH microstructural region. The McMeeking [232]
analysis of the stress distribution ahead of a blunted crack-tip shows the peak tensile stress
occurs at a distance of 1.9δ, this distance was calculated from earlier studies by Rice and
Johnson [204] and corresponds to fullest extent of logarithmic spiral. Fractography was
carried out on all the fracture surfaces, and showed good correlation between the initiation site
and its distance (1.9δ) ahead of the stable ductile crack growth.
8.5 Conclusions
1. Fractography has located major cleavage initiation sites, and these are located close to
the positions of maximum tensile stress ahead of the ductile crack growth (as
predicated through the McMeeking finite element analysis). This supports a
micromechanism of failure, where stable ductile crack growth is interrupted by
cleavage fracture at a location of peak local tensile stress.
2. Good correlation has been seen between CTOD valves and the amount of precursor
ductile crack growth. For Weld No1 and Weld No2, one particular microstructure
RHAR, it can be suggested that the ductile crack growth resistance is increased
relatively to the other conditions, because a similar amount of ductile crack growth,
results in increased CTOD values.
3. The result of strain-ageing appears to be consistent with a reduction in cleavage
fracture resistance, because at a given temperature (when cleavage occurs) the amount
of ductile crack growth is reduced. This results in lower CTOD valves and is seen
here, for Weld No1 in particular.

P a g e | 179
Chapter 9 - General Discussion.
9.1 Introduction
Throughout this current body of work a large amount of research and data has been
undertaken to analyse a low-alloy ferritic steel weld metal and establish relationships between
the microstructure (AD and RH) and its properties in both the as-received and strain aged
conditions. The microstructure of the weld has two distinctive regions with very different
microstructural constituents; the aim of the study was also to investigate the AD and RH
microstructures independently to identify any clear difference in strength and toughness. This
chapter brings together the main observations from tensile, Charpy, slow notch bend (fracture
stress) and CTOD tests to produce a consistent picture of the factors that control the
toughness of such welds. Opportunity is also taken to compare trends between data collected
for Weld No1, Charpy impact values and fracture stress data, collected as part of a previous
programme of work [15], and Weld No2, collected as part of this current body of work and
analysed collectively.
9.2 Comparison of impact transition curves and
CTOD values.
Trends for both such “toughness” tests are similar for the range of microstructural conditions
investigated, see Fig. 6.18 and Fig. 8.14. Extremes of behaviour are seen for the RHAR and
the AD5%SA conditions in terms of impact energy values and CTOD toughness values with
temperature. The importance of precursor crack growth prior to cleavage in controlling
impact toughness and CTOD values has been demonstrated, see Fig. 6.25(a) and Fig. 8.17.
The observation of unique cleavage fracture initiation sites in blunt notch and CTOD tests has

P a g e | 180
also confirmed, in general, the importance of maximum local tensile stress in controlling
cleavage fracture, see Fig. 7.6 and 8.36.
Impact experimental results have shown that failure at upper shelf energy test temperatures
was one of microvoid coalescence, typical of low alloy ferritic steels. The fracture mode is
driven by void nucleation on non-metallic inclusions by decohesion of the matrix / inclusions
interface and their subsequent growth and final coalescence to form a fracture surface.
Extensive fractography of the Charpy, CTOD and tensile specimens tested in both the
transition region and the upper shelf region show that non-metallic inclusions act as void
initiators after prestraining and static strain ageing. Thus the fundamental ductile failure
mechanism is unchanged by this thermomechanical treatment. Another consideration relating
to the Charpy and CTOD experimental results is the response at the transition and upper shelf
test temperatures, the fracture surface appearance characterised by microvoids is very similar
for all conditions. This is a consequence of the virtually identical distribution of non-metallic
inclusions for both weld metal regions. Ductile crack growth is dependent mainly on the
deformation characteristics of the material, and thus the amount of absorbed energy, in view
of the fact that both the void growth and nucleation are processes of local plastic deformation
the energy absorbed in the impact test is a reflection of energy spent in the deformation
process. Therefore at the upper-shelf and transition temperature range the deformation
characteristics of the materials play a key role in the overall impact response. Applying the
cold deformation and static strain ageing treatment greatly affects the deformation
characteristics of both weld metal regions.
Typically over the temperature range from -120 to 20oC, the yield stress increases by some
100MPa after straining and ageing, Fig. 6.17(a), while the tensile strength is essentially
unaffected, Fig. 6.17(b). Naturally, a reduction in work hardening exponent is thus observed
from a mean value of 0.19 to 0.11 as a result of strain ageing over this same temperature
range, Fig. 6.17(d). The slope of the load-displacement curves post yielding and lower CTOD
values observed for the AD5%SA condition confirm that the microvoid coalescence
mechanism is affected considerably compared to the AR condition. Thus, for example, the

P a g e | 181
same amount of stable crack extension the RHAR condition gave higher δ values than for the
AD5%SA condition, see Fig. 8.17. In addition to the deformation characteristics of the weld
metals the cleavage fracture resistance can also be important for controlling the physical
amount of ductile thumbnail extension in the transition region if cleavage results in
catastrophic failure.
Local cleavage fracture stress was assessed for both the as-deposited and reheated
microstructures, for both conditions, AR and 5%SA. The RH microstructure presented
slightly higher cleavage fracture resistance (2078MPa) than the AD microstructure
(1910MPa), Table 7.1 Fig. 7.3. After straining and ageing the RH microstructure continues to
exhibit higher cleavage fracture resistance (1808MPa) than the AD microstructure
(1710MPa); however these values are slightly reduced compared to the AR condition.
Previous studies have demonstrated that the temperature at which fracture is coincident with
the general yield of the specimen increases with as a result of prestrain and strain ageing on
cleavage fracture [47, 230].
These values of σX0 in combination with the yield stress and work hardening exponents
measured for each condition, allows the cleavage fracture resistance of each microstructure to
be quantified. To a close approximation, both AD and RH microstructures exhibit similar
values of yield stress (Fig. 6.17a), work hardening exponents (Fig 6.17(d)) and hence their
cleavage fracture resistance will depend directly on the values of σX0 appropriate to each
microstructure, Fig 7.3. These values are also closely similar leading to the suggestion that
the transition from ductile crack growth to cleavage fracture would occur under near identical
conditions. Thus transition temperature energy absorption in Charpy impact test and δc, δu
values obtained in CTOD test might be expected to occur at very similar temperatures. As
can be seen in Fig. 6.18 and Fig 8.14 for Charpy and CTOD behaviour respectively, some
small difference are still observed. This appears to be as a result (at least in the CTOD test) of
a greater value of CTOD resulting from similar level of ductile crack extension, ∆a, see Fig.
8.17. This would not have been predicted from the tensile properties evaluated in this current

P a g e | 182
work, and perhaps suggests the importance of further study to evaluate CTOD resistance
curves more carefully.
Such analysis can also be used to compare the performance of the AD and RH microstructures
after strain ageing. Now, the cleavage fracture resistance is reduced slightly, see Fig 7.3, but
significantly the yield stress is also increased after strain ageing Fig. 6.17. If the mechanism
of cleavage fracture is driven by achieving a local tensile stress above σX0, then less stress
intensification of this (higher) yield stress is required, and cleavage fracture should result
more easily for such strain age conditions. Indeed this is reflected in both impact and CTOD
values, see Fig. 6.18 and Fig. 8.14 respectively. This is also consistent with reduced ductile
thumbnail (Fig. 6.25) and reduced ∆a, (Fig 8.17) observed in impact and CTOD tests
respectively at a given test temperature.
9.3 Trends between Weld No1 and Weld No2
As mentioned, some preliminary work was carried out on Weld No1 as part of a previous
body of work [15], assessed Charpy impact values and blunt notch tests. These experiments
were revisited as part of the current programme of work, as well as tensile and CTOD tests.
Charpy impact values for both Weld No1 and Weld No2 have been plotted in Fig. 9.1. The
ADAR condition absorbed energy values ranged from 3 to 140J for Weld No1 and 3 to 143J
Weld No2. The RHAR condition ranged from 3 to 153J for Weld No1 and 4 to 167J Weld
No2. After 5%SA the AD microstructure absorbed energy values ranged from 5 to 146J for
Weld No1 and 2 to 105J for Weld No2 and for the RH microstructure 5 to 154J and 2 to 140J.
Initially it can be seen that the RHAR microstructural condition exhibits the best impact
properties when compared to the AD5%SA condition, which exhibited the worst for both
weld metals. The upper shelf energy levels for both weld metals are broadly similar, however
the 5% condition for Weld No2 are slightly lower than those for Weld No1. Both weld
materials exhibited a 50J shift in USE between the RHAR and AD5%SA condition. After

P a g e | 183
straining and ageing, for both weld metals there was an increase in the transition temperature
and a decrease in the USE.
Examining the two extremes in condition, at DBTT of 40J, the RHAR condition for Weld No1
is -80oC compared with -50oC Weld No2, the AD5%SA condition exhibited temperatures of
20oC for Weld No1 and -10oC for Weld No2. The overall difference in DBTT at 40J was
100oC for Weld No1 and 65oC Weld No2. The Charpy impact values for both RH
microstructural conditions are higher for Weld No1 compared with Weld No2. The ADAR
microstructural condition for Weld No1 exhibits similar Charpy values for RHAR condition
for Weld No2, it can also be seen that Weld No2 exhibits similar values for ADAR and
RH5%SA microstructural conditions. There is good agreement in the Charpy values for both
weld materials for AD5%SA microstructural conditions. Both weld materials within the
transition region exhibited scatter, however the RH microstructure exhibited more compared
with the AD microstructure. One explanation for this is the placement of the notch location,
which is relatively difficult for the RH microstructure, whereas the AD microstructure is
easier to place due to the geometry of the AD weld bead. For both weld metals and all
conditions there is very little scatter on the lower shelf energy levels. For both Charpy and
CTOD test data for Weld No1 there is clear separation in the data between AR and 5%SA
conditions, however this is not as prominent for Weld No2, where the ADAR condition
exhibited similar as the RH5%SA condition.
Considering both the weld metals as one data set, as plotted in Fig. 9.2, it can be seen there is
considerable scatter in the data, especially in the transition region -40 to 0oC, this is more
prominent in the RH microstructure compared with the AD microstructure, there is little
scatter observed for the AD5%SA condition. The trend remains the same, with the RHAR
condition exhibiting lower DBTT and higher USE, compared with the ADAR condition.
These are further decreased after straining and ageing, with the AD5%SA condition
exhibiting the highest DBTT and lowest USE. At 40J the RHAR condition has a temperature
of -70oC compared with -20oC for the ADAR condition, a shift of 50oC. The RH5%SA
condition observed a temperature of -40oC compared with 10oC for the AD5%SA condition, a

P a g e | 184
shift of 50oC. Comparing the best (RHAR) and worst (AD5%SA) conditions, there is a shift
of 80oC. Examining USE levels, the RHAR condition exhibited the highest at 158J compared
with the worst case of AD5%SA condition of 110J, a decrease of 48J, with the RH5%SA and
ADAR having a similar USE level of approximately 135J. There is very little scatter of data
of lower shelf energy levels.
Local cleavage fracture stress, σX0, for both microstructures and both conditions for both weld
metals are plotted separately in Fig. 9.3 and together as one set in Fig. 9.4. It can be seen that
the local cleavage fracture stress values for both microstructures for Weld No2 are slightly
higher than those for Weld No1, for the AR condition. However after strain and ageing, the
local cleavage fracture stress values are now slightly higher for Weld No1 compared to Weld
No2 for both the AD and RH microstructures. The RH microstructure for both conditions also
exhibits slightly higher local cleavage fracture stress values compared with AD
microstructure. If average values of local cleavage fracture stress σX0 are quoted for each
condition for Weld No1, then these average values are 1660MPa and 1948MPa for RHAR.
After strain ageing the average σX0 values are 1852MPa and 2027MParespectively. Average
σX0 values for Weld No2 are previously discussed in Chapter 9.2 and shown in Table 7.1 and
Fig. 7.3. However as Fig. 9.3 and 9.4 demonstrate the difference are slight between Weld No1
and Weld No2.
In summary, the two weld metals can be treated as one data set, however there will be a lot of
scatter in the transition region for both the Charpy and CTOD results. The results across all
the experiments completed as part of previous programmes of work and this current
programme are essentially the same. There are slight differences in upper shelf energy levels,
DBTT, hardness values and yield stress values. However, the trends remain that strain and
ageing the material reduces upper shelf energy levels and CTOD, slightly reduces cleavage
fracture stress and ductile crack resistance and increases DBTT, hardness and yield stress.
Given that the scale of the weld beads, with Weld No1 having larger beads and few passes
compared with Weld No2, this close agreement in behaviour gives confidence that underlying
micromechanism of crack growth resistance are closely similar for both welds.
P a g e | A185
Chapter 10 - Conclusions and
Suggestions for future work.
10.1 General Conclusions
Tensile and fracture properties of two microstructures (as-deposited (AD) and reheated (RH))
and the possible detrimental effects through prestraining and static strain ageing treatments
were assessed for two (simulated) reactor pressure vessel steel weldments. Materials
characteristics were assessed through hardness profiles, microstructure and inclusion analysis
and GDS. Weld metal toughness was assessed in terms of Charpy impact and tensile tests,
and crack-tip opening displacement tests. The cleavage fracture resistance of the two weld
metals was measured through slow blunt notch bending tests carried out at -196oC. These
tests were carried out for four microstructural conditions ADAR, RHAR, AD5%SA and
RH5%SA.
1. Tanh curves were fitted to the impact transition data for both the AD and RH
microstructures in both conditions, AR and 5%SA to compare the data in terms of
ductile-to-brittle transition temperature (DBTT) at 40J energy level. Strain ageing had
the effect both to shift in the transition curve towards higher temperatures for the AR
condition and reduce the lower shelf energy level, which is more prominent for the
5%SA condition, the extent of these effects depends on the weld metal microstructure,
either AD or RH. Extremes in behaviour were noted between the RHAR and
AD5%SA weld metal conditions with a shift of 65oC (at the 40J value). For these
extremes of condition a reduction in upper shelf energy level of approximately 53J.
Thus these two conditions can be considered as the ‘best’ (RHAR) and the ‘poorest’
(AD5%SA) conditions.

P a g e | A186
2. The upward shift in the ductile-to-brittle transition temperature of both the RH and the
AD weld metal microstructures, implies that the 5%SA condition indirectly promoted
brittle fracture of these types of weld metals. Strain ageing reduces the upper-shelf
energy level and shift the DBTT curves for the AR condition towards higher
temperatures.
3. Impact energy values obtained from the Charpy tests for both the AD and RH
microstructures in both the AR and 5%SA conditions were found to be subjected to
significant variation in the transition region, characteristic of this type of test. Lower
shelf impact energy values are much less scattered and are insensitive to both
microstructure and treatments. However, at all other temperatures there is a clear
trend for specimens with the notch root location in the RH microstructure having
greater impact toughness than specimens with a notch located in AD microstructure.
Scatter was more prominent in the RH microstructure and this is deduced to be the
notch being more difficult to locate in the critical region of the microstructure, due to
the fine scale of the weld beads
4. Performing cold deformation and static strain ageing treatments proved to have similar
trends in terms of impact energy transition curves as irradiation, hence reducing the
upper-shelf energy levels and shifting the transition curve towards higher
temperatures. The magnitude of these effects can be related to weld metal
microstructure, with the AD microstructure being slightly more sensitive than the RH
microstructure.
5. The microstructure is also found to have a marked influence on the slope of the load-
displacement curves for the CTOD results, in both the AR and the 5%SA conditions.
The RH microstructure showed higher CTOD values compared to the AD
P a g e | A187
microstructure, in both weld metal conditions, for similar stable crack growth
extensions. The extreme effect of static strain ageing on the fracture toughness of the
AD microstructure has been confirmed with these CTOD tests. This result strongly
supports the idea that the straining and ageing treatment considerably affects the
deformation characteristics of the weld metal material.
6. Static strain ageing on the notch toughness of the Charpy specimens affected the AD
weld microstructure more compared with the RH microstructure; therefore attention
was paid towards the cleavage fracture resistance of the weld metal for different
conditions. In terms of local cleavage fracture stress results showed that the AD
microstructure had slightly lower cleavage fracture resistance than the RH
microstructure, however both of these weld metal microstructures after straining and
ageing had similar values of local cleavage fracture stress but with increased values of
yield stress. Thus, either cleavage fracture resistance is deduced to be reduced
compared with the as-received microstructures. This is consistent with the easier
transition from ductile crack extension to cleavage fracture at a given temperature in
both impact and CTOD tests, and is the single most important factor in reducing
toughness in strain aged material (when such local mechanisms of fracture are in
competition).
7. Cleavage fracture initiates from individual non-metallic inclusions at positions close to
that of the maximum local tensile stress present ahead of a stress concentration. These
are observed to be located in relatively large allotriomorphic ferrite grains for the AD
microstructure and equiaxed ferrite grains for the RH microstructure. It was also
noted that the distance to the critical initiation site (X0) is dependent on microstructure
as the AD exhibited lower values compared with the RH microstructure in both the
AR and 5%SA conditions.
P a g e | A188
10.2 Suggestions for Future Research
Throughout this thesis numerous topics have been discussed and it is clear that many of the
ideas and thoughts have not been fully exhausted. At this current time a complete “simulation
procedure” of neutron embrittlement and its effects has yet to be developed. Cold
deformation (prestraining) and static strain ageing at 300oC have been used throughout the
work in this thesis to suggest the effects of neutron irradiation on this weld metal. Reduction
of cleavage fracture stress though grain boundary segregation and the corresponding
intergranular fracture mode that may be caused by neutron irradiation, cannot be assessed.
Other areas of interest would be:
I. To determine cleavage fracture, this is defined by a “microstructural unit” meaning the
position, facet/ grain and inclusion size, are analysed. It has also been shown using
fractography that cleavage fracture was initiated in large allotriomorphic ferrite grains,
this was associated with long dislocation pile up lengths. However this was not
measured as part of this current work, therefore the measurement of the density of
dislocations and length would be of great interest, experiments could be carried out on
both the AR and 5%SA conditions using transmission electron microscopy (TEM) to
confirm this theory.
II. CTOD tests were preformed on Charpy - size specimens which had been precracked,
the tests were carried out with limited effectiveness for obtaining valid fracture
toughness parameters. Larger specimens would need to be employed for future
experiments although care over the crack tip would need to be employed to ensure that
the desired microstructure/ region of weld metal was being sampled.

P a g e | A189
III. More work should be carried out on the modelling of the transition data for the Charpy
results. The data collected during this work was analysed using a Tanh fit model,
which is strongly influenced by the upper and lower shelf data. Todinov [236, 237]
and Novovic [13] have proposed using the Avanmi fit, which model the transition
region separately from the upper and lower shelves, this may provide a better fit for
the data presented in this thesis.

P a g e | A190
Chapter 11 - References 1 J. F. Knott and C. A. English, Views of TAGSI on the principles underlying the
assessment of the mechanical properties of irradiated ferritic steel Reactor Pressure Vessels, International Journal of Pressure vessels and Piping, Volume 76, Pages 891-908(1999).
2 P. Pareige and M. K. Miller, Characterization of neutron - induced copper - enriched clusters in pressure vessel steel weld: an APFIM study, Applied Surface Science, Volume 94/95, Pages 370-377(1996).
3 P. Pareige, K. F. Russell, R. E. Stoller and M. K. Miller, Influence of long - term thermal aging on the microstructural evolution of nuclear reactor pressure vessel materials: an atom probe study, Journal of Nuclear Materials, Volume 250, Pages 176-183(1997).
4 J. A. Spitznagel and F. J. Venskytis, The annealing of copper-vacancy aggregates in neutron-irradiated ferritic pressure vessel steels, Transactions of the American Nuclear Society, Volume 12, Page 161(1975).
5 G. R. Odette, On the dominant mechanism of irradiation embrittlement of reactor pressure vessel steels, Scripta Metallurgica. Volume 17, Pages 1183-1188(1983).
6 G. R. Odette and G. E. Lucas, Embrittlement of nuclear reactor pressure vessels, Journal of Materials, Volume 53-7, Pages 18-22(2001).
7 J. H. Tweed and J. F. Knott, Micromechanisms of failure in C-Mn weld metals, Acta Metallurgica, Volume 35-7, Pages 1401-1414(1987).
8 G. R. Odette, On the ductile to brittle transition in martensitic stainless steels - Mechanisms, models and structural implications, Journal of Nuclear Materials, Volume 212-215, Pages 45-51(1994).
9 P. Bowen, Effects of microstructure on toughness in pressure vessel steel, PhD, Churchill College, University of Cambridge, Cambridge (1984).
10 P. Bowen, S. G. Druce and J. F. Knott, Effects of microstructure on cleavage fracture in pressure vessel steel, Acta Metallurgia, Volume 63, Pages 339-345(1986).
11 P. Bowen and J. F. Knott, Cleavage fracture of A533B pressure vessel steel in martensitic condition, Metal Science, Volume 18, Pages 225-235(1984).
12 B. Standard, Guide on methods for assessing the acceptility of flaws in fusion welded structures.(BS 7910:1999).
13 M. Novovic, Effects of microstructure and pre-straining on ductile to brittle transition in carbon-manganese weld metals, PhD, Department of Metallurgy and Materials, University of Birmingham, Birmingham (2002 ).
14 M. R. Wenman, Micromechanisms of fracture in the ductile to brittle transition region of a MoMnNi steel weld metal and a resistant beta titanium ally, PhD, Department of Metallurgy and Materials, University of Birmingham, Birmingham (2003).
15 A. B. do Patrocinio, Effect of Prestraining and strain ageing on fracture toughness of MnMoNi steel weld metal, PhD, Department of Metallurgy and Materials, University of Birmingham, Birmingham (2003).
P a g e | A191
16 B. J. Alloway and D. C. Ayres, Chemical principles of environmental pollution, UK: Blackie, Oxford (1993).
17 Great Britains Advisory Committee on the Safety of Nuclear Installations, An Examination of the CBGB's R6 Procedure for the Assessment of the Integrity of Structures Containing Defects, Report of the ACSNII Study Group on the R6 methodology, H.M.S.O London(1989).
18 W. S. Pellini, Guidelines for Fracture-Safe and Fatigue-Reliable Design of Steel Structures. The Welding Institute, Abingdon.(1983).
19 I. J. O'Donnell and R. Crombie, On the deltaT41 Criterion for Irradiation Shift., International Journal of Pressure vessels and Piping, Volume 299-306(1996).
20 T. J. Williams, P. R. Burch and C. A. English, Proceedings on environmental degradation of materials in nuclear power systems - water reactors, Transverse City: The Metallurgical Society(1987).
21 W. Marshall, An assessment of the integrity of PWR pressure vessels, UKAEA, LWR Study Group Report, United Kingdom Atomic Energy Authority (1982).
22 W. W. Bose, Micromechanisms of brittle fracture in high strength low alloy steel weld metals, PhD, Department of Metallurgy and Materials, University of Birmingham, Birmingham (1995).
23 K. Dohi, T. Onchi, F. Kano, K. Fukuya, M. Narui and H. Kayano, Effect of neutron flux on low temperature irradiation remember of reactor pressure vessel steel, Journal of Nuclear Materials, Volume 265, Pages 78-90(1999).
24 L. E. Schubert, A. S. Kumar, S. T. Rosinski and M. L. Hamilton, Effect of specimen size on the impact properties of neutron irradiated A533B steel, Journal of Nuclear Materials, Volume 225, Pages 231-237(1995).
25 S. R. Ortner, C. E. Lane and C. A. Hippsley, The effect of flow stress and segregation on the ductile to brittle transition., AEA Technology, AEA - T0319, Materials Performance Department, Materials and Chemistry Group, AEA Technology, Didcot, Oxon, OX11 - 0RA.(1996).
26 B. A. Gurovich, E. A. Kulehova, Y. I. Shtrombakh, O. O. Zabusov and E. A. Krasikov, Intergranular and intragranular phosphorus segregation in Russian pressure steels due to neutron irradiation, Journal of Nuclear Materials, Volume 279, Pages 259-272(2000).
27 B. A. Gurovich, E. A. Kuleshova and O. V. Lavrenchuk, Comparative study of fracture in pressure vessel steels A533B and A508, Journal of Nuclear Materials, Volume 228, Pages 330-337(1996).
28 R. G. Carter, N. Soneda, K. Dohi, J. M. Hyde, C. A. English and W. L. Server, Microstructural characterization of irradiation-induced Cu-enriched clusters in reactor pressure vessel steels, Journal of Nuclear Materials, Volume 298, Pages 211-224(2001).
29 M. J. Makin and F. J. Minter, Irradiation hardening in Copper and Nickel, Acta Metallurgica, Volume 8-October, Pages 691-699(1960).
30 Y. H. M. Jung, K. L., Effect of interstitial impurities on fracture characteristics of A533-B Class 1 pressure vessel steel, Influence of Radiation on material properties: 13th International symposium, American Society for Testing and Materials, Pages 395-407(1987).
31 F. M. Burdekin, J. F. Knott, J. D. G. Sumpter and A. H. Sherry, TAGSI views on aspects of crack arrest philosophies for pressure vessels with thickness up to 100 mm,

P a g e | A192
International Journal of Pressure vessels and Piping, Volume 76, Pages 879-883(1999).
32 E. A. Little, Strain-aging and neutron scattering studies in irradiated PWR pressure vessel steels, ASTM: Twelfth International Symposium of the Effects of Radiation on Materials(1984).
33 K. L. Murty, Interstitial - impurity radiation - defect interactions in ferritic steels, Journal of Metals, Research Summary, Pages 34-39(1985).
34 K. L. Murty, Role and significance of source hardening in radiation embrittlement of iron and ferritic steels, Journal of Nuclear Materials, Volume 270, Pages 115-128(1999).
35 K. L. Murty, Interaction of interstitial impurities with radiation-induced defects leading to improved elevated temperature technical properties of mild steel, Nuclear Technology, Volume 67-October, Pages 124-131(1984).
36 K. L. Murty, Beneficial (!) effect of neutron irradiation on mechanical properties of mild steel in blue brittle range, Scripta Metallurgica, Volume 18, Pages 87-89(1984).
37 K. L. Murty and J. O. Dirk, Friction and source hardening in irradiated mild steel, Scripta Materialia, Volume 17, Pages 317-320(1983).
38 M. Weller and J. Diehl, Internal friction studies on reactions of carbon and nitrogen with lattice defects in neutron irradiated iron, Scripta Metallurgica, Volume 10, Pages 101-105(1976).
39 R. E. Stoller, B. D. Wirth and G. R. Odette, Primary damage formation in bcc iron, Journal of Nuclear Materials, Volume 251, Pages 49-60(1997).
40 G. E. Dieter and D. Bacon, Mechanical Metallurgy, McGraw-Hill Book Company, London (1988).
41 A. Cottrell, An introduction to metallurgy, Edward Arnold Ltd: Jesus College, Cambridge (1975).
42 A. H. Cottrell, Trans Metall Soc AIME, Volume 212, Pages 192-203(1958). 43 K. Nogiwa, Journal of Nuclear Materials, Volume 946, Pages 307-311(2002). 44 L. E. Steele, Review and analysis of reactor vessel surveillance programs, in Statues
of USA Nuclear Reactor Pressure Vessel Surveillance for Radiation Effects., ASTM STP 784, Philadelphia: American Society for Testing and Materials, Pages 227(1983).
45 ASME, Boiler and Pressure Vessel Code: Section II(1995). 46 ASME, Boiler and Pressure Vessel Code: Section III, Appendix G: Protection Against
Non-Ductile Failure (1995). 47 J. D. G. Groom and J. F. Knott, Cleavage fracture in Prestrained Mild Steel, Metal
Science, Volume 9, Pages 390-400(1975). 48 E. A. Little and D. R. Harries, The correlation of radiation-hardening with interstitial
nitrogen content in mild steels., Met Sci, Volume 4, Pages 195-200(1970). 49 E. A. Little and D. R. Harries, Radiation-hardening and recovery in mild steel and the
effects of interstitial Nitrogen., Metal Science Journal, Volume 4, Pages 188-199(1970).
50 J. D. Baird and A. Jamieson, Effect of manganese and nitrogen on the tensile properties of iron in the range of 20-600oC., Journal of the Iron and Steel Institute, Volume August, Pages 793-803(1966).
51 T. Kishi and T. Tanabe, The Bauschinger effect and its role in mechanical anisotropy., Journal of Mechanical and Physics Solids, Volume 21, Pages 303-315(1973).

P a g e | A193
52 D. E. McRobie and J. F. Knott, Effects of strain and strain aging on fracture toughness of C-Mn weld metal., Materials Science and Technology, Volume 1-May, Pages 357-365(1985).
53 A. K. Sachdev, Dynamic strain aging of various steels., Metallurgical Transactions A, Volume 13A October, Pages 1793-1797(1982).
54 J. K. Chakravartty, A. Haq, T. K. Sinha and M. K. Asundi, Static strain ageing of ASTM A203D nuclear structural steel, Transactions of The Indian Institute of Metals, Volume 37-5, Pages 501-507(1984).
55 J. K. Chakravartty, S. L. Wadekar, T. K. Sinha and M. K. Asundi, Dynamic strain-ageing of A203D nuclear structural steel, Journal of Nuclear Materials, Volume 119, Pages 51-58(1983).
56 S. T. Mandziej, The effect of nitrogen and strain-aging of C-Mn steel welds. Scripta Metallurgica et Materialia, Volume 27-7, Pages 793-798(1992).
57 S. G. Druce, G. Gage and G. Jordan, Effect of ageing on properties of pressure vessel steels. Acta Metallurgica, Volume 34-4, Pages 641-652(1986).
58 K. C. Kim, J. T. Kim, J. I. Suk, U. H. Sung and H. K. Kwon, Influences of the dynamic strain aging on the J-R fracture characteristics of the ferritic steels for reactor coolant piping system., Nuclear Engineering and Design, Volume 228, Pages 151-159(2004).
59 C. S. Seok and K. L. Murty, Effect of dynamic strain aging on mechanical and fracture properties of A516Gr70 steel., International Journal of Pressure vessels and Piping, Volume 76, Pages 945-953(1999).
60 S. S. Kang and I. S. Kim, Dynamic strain aging sensitivity of heat affect zones in C-Mn steels, Journal of Nuclear Materials, Volume 252, Pages 123-129(1995).
61 D. Wagner, J. C. Moreno and C. Prioul, Dynamic strain aging sensitivity of heat affected zones in C-Mn steels. Journal of Nuclear Materials, Volume 252, Pages 257-265(1998).
62 D. Wagner, J. C. Moreno, C. Prioul, J. M. Frund and B. Houssin, Influence of dynamic strain aging on the ductile tearing of C-Mn steels: modelling by a local approach method. Journal of Nuclear Materials, Volume 300, Pages 178-191(2002).
63 D. Wagner, C. Prioul and D. Francois, Sensitivity to dynamic strain aging in C-Mn steels., Journal of Alloys and Compounds, Volume 211-212, Pages 132-135(1994).
64 B. Ostensson, The fracture toughness of pressure vessel steel at elevated temperatures.(1978).
65 J. S. Blakemore and E. O. Hall, Blue-brittle behaviour of mild steel., Journal of the Iron and Steel Institute, Volume August, Pages 817-820(1966).
66 J. H. Yoon, B. S. Lee, Y. J. Oh and J. H. Hong, Effects of loading rate and temperature on J-R fracture resistance of an SA516-Gr.70 steel for nuclear piping., International Journal of Pressure vessels and Piping, Volume 76, Pages 663-670(1999).
67 I. S. Kim, Dynamic strain - ageing effect on fracture toughness of vessel steels., IAEA Technical Committee Meeting on Materials for Advanced Water - Cooled Reactors. Plzen, Volume 76, Plzen. (1991).
68 I.-S. Kim and S. S. Kang, Dynamic strain aging in SA508-class 3 pressure vessel steel., International Journal of Pressure vessels and Piping, Volume 62, Pages 123-129(1995).

P a g e | A194
69 J.-W. Kim and I.-S. Kim, Effect of dynamic strain aging on the leak - before - break analysis in SA106 Gr.C piping steel., Nuclear Engineering and Design, Volume 174, Pages 59-67(1997).
70 V. Patel, Effect of dynamic strain ageing on fracture toughness of A533B pressure vessel steel, N.C. State University: Master of Nuclear Engineering Project Report (1985).
71 J. F. Lancester, Metallurgy of Welding, Allen & Unwin, London (1987). 72 K. Easterling, Introduction to the physical metallurgy of welding, Butterworths(1983). 73 A. C. Davies, The Science and Practice of Welding: The Practice of Welding. Volume
2, The Cambridge University Press (1989). 74 A. C. Davies, The Science and Practice of Welding: Welding Science and Technology:
Volume 1, The Cambridge University Press(1989). 75 L. M. Gourd, Principles of Welding Technology, Edward Arnold (1995). 76 P. Miao, Effects of inclusions on fracture and hydrogen assisted cracking in ferritic
welds, PhD, Department of Metallurgy and Materials, University of Birmingham, Birmingham (2003).
77 G. M. Evans, Effect of interpass temperature on the microstructure and properties of C-Mn all-weld metal deposits, International Institute of Welding (IIW), II-A-490-78(1978).
78 O. Grong, Metallurgical Modelling of Welding. Cambridge: The Institute of Materials(1997).
79 O. Grong and N. Christensen, Factors controlling MIG weld metal chemistry, Scand. J. Metall, Volume 12, Pages 155-165(1983).
80 E. T. Turkdogan, Proceeding International Conference on Chemical Metallurgy of Iron and Steel, Sheffield: The Iron and Steel Institute (UK)(1971).
81 N. Bailey and R. J. Pargeter, The influence of Flux type on the strength and toughness of the submerged arc weld. The Welding Institute, Abingdon. (1988).
82 C. Hseith, S. S. Babu, J. M. Vitek and S. A. David, Calculation of inclusion formation in low alloyed steel welds, Material Science and Technology, Volume A215, Pages 84-91(1996).
83 J. M. Grreg and H. K. D. H. Bhadeshia, Titanium rich mineral phases and the nucleation of bainite, Metall Trans A, Volume 25A, Pages 1063-1611(1994).
84 A. A. Sudgen and H. K. D. H. Bhadeshia, The non-uniform distribution of inclusions in low-alloy steel weld deposits., Metall Tran A, Volume 19A, Pages 669-674(1988).
85 N. S. Pottore, C. I. Garcia and A. J. DeArdo, Interrupted and isothermal solidification studies of low and medium carbon steels. Metall Trans A, Volume 22A, Pages 1871-1880(1991).
86 M. Nakonishi, Doc IX-1281-83, IIW(1983). 87 G. J. Davies and J. G. Garland, Solidification structures and properties of fusion
welds, Inter Metall Reviews, Volume 20, Pages 83-106(1975). 88 W. F. Savage and G. H. Aronson, Preferred orientation in the weld fusion zone., Weld
J, Volume 45, Pages S85-S89(1966). 89 A. O. Kluken, O. Grong and J. Hjelen, The origin of transformation textures in steel
weld metals containing acicular ferrite., Metall Tran A, Volume 22A, Pages 657-663(1991).
90 T. H. Edvardson, H. Fredrikksson and I. Svensson, Met Sci, Volume 10, Pages 298-306(1976).
91 H. Fredrikksson, Metall Trans, Volume 3, Page 2989(1972).

P a g e | A195
92 M. Hansen and K. Anderko, Constitution of binary alloys, McGraw-Hill, New-York (1958).
93 E. C. Rollason, Metallurgy for engineers, Edward Arnold, London (1961). 94 Y. Ito and M. Nakanishi, Journal of Japan Weld Soc, Volume 44, Pages 815-
821(1975). 95 Y. Ito and M. Nakanishi, Sumitono Search, Volume 15, Pages 42-62(1976). 96 R. A. Farrar and M. N. Watson, Metal Construction, Volume 17, Series Volume
374R(1985). 97 R. E. Dolby, Metals Technology, Volume 10, Pages 349-362(1983). 98 H. K. D. H. Bhadeshia and L.-E. Svensson, The microstructure of submerged arc -
weld deposits for high - strength steels, Journal of Materials Science, Volume 24, Pages 3180-3188(1989).
99 N. T. Suutala, T. Taklo and T. Moisio, Metall Tran A, Volume 19A, Pages 1183-1190(1979).
100 S. A. David, Weld J, Volume 60, Pages S63-S71(1981). 101 Davies, Editorial. International Journal of Pressure vessels and Piping, Volume 77,
Pages iii-iv(2000). 102 D. R. Davies, A. C. Roberts and D. Ness, A review of the design and construction of
the Sizewell B pressurized water reactor building containment structures., Nuclear Engineering and Design, Volume 156, Pages 259-268(1995).
103 R. C. Cochrane, World in the World (1983). 104 R. C. Cochrane, Doc. IXJ-102-85, International Institute of Welding (IIW)(1985). 105 J. G. Garland and P. R. Kirkwood, Towards improved submerged arc weld metal.,
Metal Construction, Volume 5, Pages 275-283(1975). 106 D. J. Widery, PhD, University of Cambridge, Cambridge (1974). 107 J. G. Garland and P. R. Kirkwood, Proceeding Inter Symp on Welding of Line Pipe
Steels., St. Louis (USA), Welding Research Council (New York)(1977). 108 P. L. Harrison and R. A. Farrar, Influence of oxygen-rich inclusions on the gamma-
alpha phase transformation in high-strength low-alloy (HSLA) steel weld metals., Journal Mater Sci, Volume 16, Pages 2218-2226(1981).
109 R. A. Ricks, G. S. Barritte and P. R. Howell, Solid-State phase transformation. Metallurigcal Society of AIME, Pittsburg, Pages 463-468(1981).
110 R. A. Ricks, G. S. Barritte and P. R. Howell, The nature of acicular ferrite in HSLA steel weld metals, Journal of Materials Science, Volume 17, Pages 732-740(1982).
111 R. W. K. Honeycombe, Steels - Microstructure and Properties, Edward Arnold Ltd, London (1980).
112 C. A. Dube, H. I. Aaronson and R. F. Mehl, Rev Met, Volume 55, Pages 201 210(1958).
113 J. F. Knott, Recent advances in the micro-modelling of cleavage fracture in steel. George R. Irwin Symposium on Cleavage Fracture, The Minerals, Metals & Materials Society, Pages 171-182(1997).
114 H. K. D. H. Bhadeshia, B. Gretoft and S. L. E., The austenite grain structure of low-alloyed steel deposits, Journal Mater Sci, Volume 21, Pages 3947-3951(1986).
115 H. K. D. H. Bhadeshia, L. E. Svensson and B. Gretoft, Acta Metallurgia, Volume 33, Pages 1271-1283(1985).
116 J. M. Dowling, J. M. Corbett and H. W. Kerr, Inclusions phases and the nucleation of acicular ferrite in submerged-arc welds in high-strength low-alloy steels., Metall Trans A, Volume 17A, Pages 1611-1623(1986).

P a g e | A196
117 A. R. Mills, G. Thewlis and J. A. Whiteman, Nature of inclusions in steel weld metals and their influence on formation of acicular ferrite., Material Science and Technology, Volume 3, Pages 1051-1062(1987).
118 C. Liu and S. D. Bhole, Fracture behaviour in a pressure vessel steel weld. Materials & Design, Volume 23, Pages 371-376(2002).
119 S. Liu and D. L. Olson, The role inclusions in controlling HSLA steel weld microstructures,, Weld Journal, Volume 65, Pages 139s-150s(1986).
120 N. A. Fleck, Weld J, Volume 65, Pages 113S-150S(1986). 121 D. J. Abson and R. E. Dolby, A scheme for the quantitative description of ferritic weld
metal microstructure, Welding Institute Research Bulletin, Volume 21, Pages 100-103(1980).
122 M. Strangwood, PhD, The University of Cambridge(1987). 123 D. A. Porter and K. E. Easterling, Phase transformation in metals and alloys, Working
(England): Van Norstrand Reinhold(1981). 124 J. D. Verhoeven, Fundamentals of physical metallurgy, John Wiley & Son, New York
(1975). 125 H. K. D. H. Bhadeshia and J. W. Christian, Bainite in steel, Metall Trans, Volume
21A, Pages 767-797(1990). 126 R. E. Dolby, Factors controlling weld toughness-The present position. Part 2 weld
metals, Welding Institute Research Bulletin, Report R/RB/M93/76 (1976). 127 M. Strangwood and H. K. D. H. Bhadeshia, Proce Int Confe on Advances in Welding
Science and Technology, ASM: International Metals Park, OH(1986). 128 H. K. D. H. Bhadeshia, L. E. Svensson, H. Cerjack and K. E. Easterling, In
mathematical modelling of weld phenomena, The Minerals, Metals and Materials Society(1993).
129 L. E. Svensson and B. Gretoft, Microstructure and impact of C-Mn all-weld metals deposits. Weld J, Volume 69-12, Pages 454s-461s(1990).
130 G. M. Evans, The effect of carbon on the microstructure and impact toughness of C-Mn all-weld metal deposits, Weld J, Volume 62-11, Pages 313S-320S(1983).
131 G. M. Evans, The effect of silicon on the microstructure and properties of C-Mn all-weld metal deposits, Metal Construction, Volume 18, Pages 438R-444R(1986).
132 G. M. Evans, The effect of chromium on the microstructure and properties of C-Mn all-weld deposits, Weld Metal and Fabrication, Volume 57, Pages 346S-358S(1989).
133 G. M. Evans, The effect of nickel on the microstructure and properties of C-Mn all-weld metal deposits, OERLINKON-ScweiBmitt, Volume 48, Pages 18-35(1990).
134 G. M. Evans, The influence of aluminium on the microstructure and properties of all-weld metal deposits, Weld J, Volume 70, Pages 32s-39s(1991).
135 G. M. Evans, The effect of niobium in manganese containing MMA weld deposits., OERLINKON-ScweiBmitt, Volume 49, Pages 24-39(1991).
136 G. M. Evans, Effect of manganese on the microstructure and properties of all-weld metal deposits, IIW, II-A-432-77(1977).
137 O. Grong and D. K. Matlock, Microstructural development in mild and low-alloyed steel weld metals, Int. Met. Rev, Volume 31, Pages 27-48(1983).
138 E. S. Kayali, A. J. Pacey and H. W. Kerr, The effects on Mo, Zr and To on submerged arc weld metal: II Toughness. , Can. Metal Quarterly, Volume 23, Pages 227-236(1984).
139 G. M. Evans, The effect of titanium in SMA C-Mn steel multipass deposits, Weld J, Volume 71-2, Pages 447S-454S(1992).
P a g e | A197
140 A. H. Koukabi, T. H. North and B. H. B., Properties of submerged arc deposits-effects of zirconium, vanadium and titanium/ boron., Metal Construction, Volume 12, Pages 639-642(1979).
141 M. Es-Souni, P. A. Beaven and G. M. Evans, Material Science Engineering, Volume A130, Pages 173-184(1990).
142 O. Grong, Catalyst effects in heterogeneous nucleation of acicular ferrite. Metall Mater Trans, Volume 26A-3, Pages 525-534(1995).
143 J. H. Tweed and J. F. Knott, Effects of reheating on microstructure and toughness of C-Mn weld metal., Metal Science, Volume 17 February, Pages 45-54(1983).
144 J. F. Knott, Fundamentals of fracture mechanics, Butterworth & Co Ltd, London (1973).
145 A. A. Griffith, Phil. R. Soc, Volume 221, Pages 163(1920). 146 G. R. Irwin, Analysis of stresses and strain near the end of crack traversing a plate.,
Journal of Applied Mechanics, Volume 24, Pages 361-364(1957). 147 E. Orowan, Trans. Engrs Shipbuilders Scotland, Volume 89, Pages 165(1945). 148 H. M. Westergaard, Journal of Applied Mechanics, Volume A39, Pages 60(1939). 149 British Standard - Fracture mechanics toughness tests - Part 1: Method for
determination of KIC, critical CTOD and critical J values of metallic materials.(BS 7448-1:1991).
150 J. F. Knott, Some effects of hydrostatic tension on the fracture behaviour of mild steel, J. I. S. I, Volume 204, Pages 104-111(1966).
151 J. F. Knott, Journal of Mechanical and Physics Solids, Volume 15, Pages 97-103(1967).
152 P. Bowen, S. G. Druce and J. F. Knott, Acta Metallurgia, Volume 35, Pages 1735-1746(1987).
153 P. Bowen and J. F. Knott, Metallurgical Transactions A, Volume 17A, Pages 231-241(1986).
154 C. Yan, Metallurgical Transactions A, Volume 24A, Pages 1381(1992). 155 D. A. Curry and J. F. Knott, The effects of microstructure on the cleavage fracture
stress in steels, Metal Science, Pages 511-514(1978). 156 A. T. Price, H. A. Holl and A. P. Greenough, Acta Materialia, Volume 12, Pages
49(1964). 157 G. T. Hahn, Fracture, Wiley, New York (1959). 158 D. A. Curry and J. F. Knott, The relationship between fracture toughness and
microstructure in the cleavage fracture of mild steel., Metal Science, Volume January, Pages 1-6(1976).
159 D. E. McRobie, PhD, University of Cambridge, Cambridge (1985). 160 E. T. Wessel, Practical fracture mechanics for structural steel, UKAEA, Chapman
and Hall, Volume H(1969). 161 British Standard - Fracture mechanics toughness tests - Part 4: Method for
determination of fracture resistance curves and initiation values for stable crack extension in metallic materials.(BS 7448-4:1991).
162 Geesthacht, GKSS_94/E/60, The GKSS test procedure for determining the fracture behaviour of materials: EFAM GTP 94, GKSS - Forschungszentum Geesthacht GmbH(1994).
163 J. R. Griffiths and D. R. J. Owen, An elastic-plastic stress analysis for a notched bar in plane strain bending., Journal of Mechanical and Physics Solids, Volume 19, Pages 419-431(1971).
P a g e | A198
164 P. Bowen, C. A. Hippsley and J. F. Knott, Applications of electron microscopy to micromechanisms of brittle failure in Electron microscopy plasticity and fracture research of materials. International Symposium, Holzhau(1989).
165 A. Cottrell, Iron and Steel Institute Spec Rep, Volume 69, Pages 281(1961). 166 A. A. Wells, Unstable crack propagation in metals: Damage and fast fracture, Proc.
Syp Crack Propagation, Cranfield (1962). 167 A. A. Wells, Application of fracture mechanics at and beyond general yielding,
B.W.R.A Report, British Welding Research Association, Volume 23, Pages 563-570(1963).
168 A. A. Wells, Unstable crack propagation in metals: Cleavage and fast fracture 169 F. M. Burdekin and D. E. W. Stone, The crack opening displacement approach to
fracture mechanics in yielding materials, Journal of Strain Analysis, Volume 1-2, Pages 145-153(1966).
170 B. Wang and K.-C. Hwang, Structural integrity assessment in elastic-plastic fracture. Engineering Fracture Mechanics, Volume 54-4, Pages 471-478(1996).
171 C. G. Chipperfield, J. F. Knott and R. F. Smith, Third International Congress on Fracture, Volume April, Munich (1973).
172 D. R. Harries, The "state of the art" in crack tip opening displacement (CTOD) testing and analysis, Metal Construction, Volume 12, Pages 415-605(1980).
173 R. R. Barr, The measurement of COD and its application to defect significance., Metal Construction, Volume 7, Pages 604-610(1975).
174 J. R. Low, Symposium on relation of properties to microstructure. American Society for Testing and Materials, Pages 153(1954).
175 C. Zener, Fracture of Metals, ASM, Cleveland, OH (1948). 176 A. N. Stroh, Proc R. Soc, Volume A(223), Pages 404(1954). 177 A. N. Stroh, Adv Physics, Volume 6, Pages 418(1957). 178 N. J. Petch, The cleavage strength of polycrystals, Journal of the Iron and Steel
Institute, Volume 174, Pages 25-28, London (1953). 179 E. Orowan, Reports Prog Phys, Volume 12, Pages 185(1949). 180 E. R. Parker, Brittle behaviour of Engineering Structures, Wiley, New York (1957). 181 G. G. Chell and D. A. Curry, Developments in fracture mechanics, Applied Publishes,
Pages 101(1981). 182 C. J. McMahon and M. Cohen, Acta Metallurgia, Volume 13, Pages 591-604(1965). 183 W. H. Brucker, Journal of Welding, Volume 29, Pages 467(1950). 184 J. P. Allen, W. P. Hopkins and H. R. Tripler, Tripler, Tensile and impact properties of
high-purity iron-carbon-manganese alloys of low carbon content, J.I.S.I., Volume 174, Pages 103-120(1953).
185 E. Smith, Physical Basis of Yield and Fracture, Inst. Phsics. Soc, Pages 36, Oxford (1966).
186 J. F. Knott, Atomistic of Fracture., NATO Advanced Research Institute on Atomistic of Fracture, Corsica, France, Pages 209-240(1983).
187 J. F. Knott, Fracture, Plastic Flow and Structure Integrity, IOM Communications, Pages 21-43(2000).
188 N. J. Petch, Iron and Steel Institute Spec Rep, Volume 173, Pages 25, London (1953). 189 E. O. Hall, The deformation and aging of mild steel: iii discussion of results,
Proceedings of the Physical Society of London, Volume B64, Pages 747-753 London (1951).

P a g e | A199
190 E. Smith, The stress distribution near the tip of an array of screw dislocations piled - up against an inclusion, Journal of Mechanical and Physics Solids, Volume 20, Pages 307-312(1972).
191 D. A. Curry and J. F. Knott, Effects of microstructure on cleavage fracture stress in steel. Metal Science, Volume November, Pages 511-514(1978).
192 N. Okumura, Cleavage fracture of low carbon ferritic steels with fine grain size. Metal Science, Volume 17 December, Pages 581-589(1983).
193 J. J. Lewandowski and A. W. Thompson, In Fracture, ICF 6 ED, Volume 2, Pages 1515-1524(1984).
194 J. J. Lewandowski and A. W. Thompson, Microstructural effects on the cleavage fracture - stress of fully pearlitic eutectoid steel, Metall Trans, Volume 17A, Pages 1769-1786(1986).
195 D. J. Alexander and I. M. Bernstein, Cleavage fracture in pearlitic eutectoid steel, Metall Trans, Volume 20A, Pages 2321-2335(1989).
196 J. F. Knott, Reliability and structural integrity of advanced materials, A.S.a.D.R.i. S Sedmak, Volume 2, Pages 1375-1400(1992).
197 P. A. S. Reed and J. F. Knott, Fatigue and Fatigue, Engineering Mater Struct, Volume 15, Pages 1251-1270(1992).
198 P. A. S. Reed and J. F. Knott, Fatigue and Fracture Engng, Materials Struct, Volume 19, Pages 485-500(1996).
199 R. O. Ritchie, W. L. Server and R. A. Wullaert, Critical fracture stress and fracture strain models for the predication of lower and upper shelf toughness in nuclear pressure vessel steels., Metallurgical Transactions A, Volume 10A October, Pages 1557-1570(1979).
200 X. Z. Zhang, PhD, Department Metallurgy and Materials, University of Birmingham, Birmingham (1996).
201 X. Z. Zhang, A study on crack growth in ductile materials., International Journal of Pressure vessels and Piping, Volume 76, Pages 583-590(1999).
202 X. Z. Zhang and J. F. Knott, Cleavage fracture in bainitic and martensitic microstructures. Acta Metallurgica, Volume 47-12, Pages 3483-3495(1999).
203 R. O. Ritchie, J. F. Knott and J. R. Rice, On the relationship between critical tensile stress and fracture toughness in mild steel., Journal of Mechanical and Physics Solids, Volume 21, Pages 395-410(1973).
204 J. R. Rice and M. A. Johnson, Inelastic behaviour of Solids, McGraw - Hill, New York (1970).
205 J. F. Knott, Fracture, Canada, Waterloo(1977). 206 R. Iricibar, G. leRoy and J. D. Embury, Relationship of strain hardening and damage
in ductile failure., Metal Science, Volume 14, Pages 337-343(1980). 207 A. S. Argon, J. Im and R. Safoglu, Cavity formation from inclusions in ductile fracture
of A508 steel, Metallurgical Transactions A, Volume 6A, Pages 825-837(1975). 208 L. M. Brown and W. M. Stobbs, The work-hardening of copper-silica v. equilibrium
plastic relaxation by secondary dislocations., Philosophical Magazine, Volume 34, Pages 351-372(1976).
209 S. Flooreen and H. W. Hayden, Scripta Materialia, Volume 4, Pages 87-94(1970). 210 T. B. Cox and J. R. Low, Metall Trans, Volume 5A, Pages 1457-1470(1974). 211 J. R. Rice and D. M. Tracey, On the ductile enlargements of voids in triaxial stress
fields., Journal of Mechanical and Physics Solids, Volume 201-217(1969). 212 P. F. Thomason, Ductile fracture of metals. Pergamon Press, Oxford (1990).

P a g e | A200
213 J. F. Knott, Characteristic microstructural features of different types of fracture. 2nd Griffith Conference Institute of Materials, Pages A1-A12(1995).
214 C. Naudin, J. M. Frund and A. Pineau, Intergranular fracture stress and phosphorous grain boundary segregation of a Mn-Ni-Mo Steel., Scripta Materialia, Volume 40-9, Pages 1013-1019(1999).
215 M. A. Islam, Intergranular fracture in 2.25Cr-1Mo Steel at low temperature., PhD, Metallurgy and Materials, University of Birmingham, Birmingham (2001).
216 P. L. Threadgill and S. J. Garwood, Final Contract Report - The assessment of weldments in SA 533B Class 1 steel plate, Contract A72b-1327, for: Nuclear Installations Inspectorate, The Welding Institute.(1980).
217 ASTM, Standard test methods for determining average grain size using semiautomatic and automatic image analysis, ASTM, West Conshohocken (1997).
218 E. E. Underwood, Quantitative sterology, Addison - Wesley Publishing Co., London (1970).
219 Notched Bar Tests: Method for Precision Determinations of Charpy V-Notch Impact Energies for Metals(BS 131 - Part 7: 1989).
220 D. J. F. Ewing, Calculations on the bending of rigid / plastic stress analysis for a notched bar in plane strain bending, Journal Mechanical and Physical Solids, Volume 19, Pages 419-431(1968).
221 British Standard - Fracture mechanics toughness tests - Part 2: Method for determination of KIC, critical CTOD and critical J values of welds in metallic materials.(BS 7448-2:1991).
222 R. O. Ritchie and K. J. Bathe, On the calibration of the electrical potential technique for monitoring crack growth using finite element methods, International Journal of Fracture, Volume 15, Number 1, Pages 47-55(1979).
223 J. F. Knott, The transition from fibrous fracture to cleavage fracture., International Journal of Pressure vessels and Piping, Volume 64, Pages 225-234(1995).
224 G. S. Barritte, R. A. Ricks and P. R. Howell, Proc. conf. quantitative microanalysis with high spatial resolution. London: Metals Soc.(1981).
225 R. Blondeau, Mathematical model for the calculation of Mechanical Properties of Low-Alloy Steel Metallurgical Products: a few examples of its applications., Heat Treatment, London Metal Society (1976).
226 P. L. Harrison, M. N. Watson and R. A. Farrar, How Niobium Influences SA Mild Steel Weld Metals. Part 2: Continuous Cooling Transformation (CCT) Diagrams, Weld Metal and Fabrication, Volume 49, Pages 161-169(1981).
227 M. Lambrigger, Ductile-to-brittle transition of low activation ferritic-martensitic steels with respect to critical cracks promoting final brittle fracture., Engineering Fracture Mechanics, Volume 71, Pages 633-646(2004).
228 K. Shiba and A. Hishinuma, Low-temperature irradiation effects on tensile and Charpy properties of low-activation ferritic steels., Journal of Nuclear Materials, Volume 283-287, Pages 474-477(2000).
229 V. J. Farron, Effects of microstructure on fracture toughness in A533B submerged-arc welds. Master Thesis, Metallurgy and Materials, University of Birmingham.(2004).
230 R. Sandstrom, G. Engberg and Y. Bergstrom, Metal Science, Volume 15, Page 409-412.(1981).
231 D. A. Curry and J. F. Knott, Effect of microstructure on cleavage fracture toughness of quenched and tempered steels. Metal Science, Volume June, Pages 341-345(1979).

P a g e | A201
232 R. M. McMeeking, Finite deformation analysis of crack-tip opening inelastic-plastic materials and implications for fracture., Journal of Mechanical and Physics Solids, Volume 25, Pages 357-381(1977).
233 R. Nicholson, Private Conversation with Principal inspector of HSE NII(2007). 234 M. El - Shennawy, F. Minami, M. Toyoda and K. Kajimoto, Crack - tip plastic
constraint activators and the application to plane - strain fracture toughness test: Proposal on small - size fracture toughness specimens. Engineering Fracture Mechanics, Volume 63, Pages 447-479(1999).
235 S. Jitsukawa, A. Naito and J. Segawa, Effect of size and configuration of 3-point bend bar specimens on J-R curves. Journal of Nuclear Materials, Volume 271&272, Pages 87-91(1999).
236 M. T. Todinov, J. F. Knott and M. Strangwood, An assessment of the influence of complex stress states on martensite start temperature., Acta Metallurgica, Volume 44-12, Pages 4909-4915(1996).
237 M. T. Todinov, M. Novovic, P. Bowen and J. F. Knott, Modelling the impact energy in the ductile/brittle transition region of C-Mn multi-run welds., Materials Science and Engineering, Volume A287, Pages 116-124(2000).
238 Incontiguous Brick, http://incontiguousbrick.wordpress.com Incontiguous Brick, Map showing location of nuclear reactors, Internet source(2008).
239 British Energy, http://www.british-energy-com British Energy, Various, Internet Source(2008).
240 Weld Reality, http://weldreality.com/ship-broke-in-two.gif Weld Reality, Liberty Ship, Internet Source(2008).
241 The Welding Institute TWI, http://www.twi.co.uk The Welding Institute TWI, Submerged arc welding, Internet Source(2008).
242 S. Kou, Welding Metallurgy, Wiley, 2002, 2nd Edition(2002). 243 NDT Resource Centre, http://www.ndt-ed.org/index-flash.htm NDT Resource Centre,
Loading modes, Internet source(2008). 244 A. Neimitz, Dugdale model modification due to the geometry induced plastic
constraints, Engineering Fracture Mechanics, Volume 67, Pages 251-261(2000). 245 B. Wang and K.-C. Hwang, An engineering approach to safety assessment for non-J-
controlled crack controlled. Engineering Fracture Mechanics, Volume 57-6, Pages 689-699(1997).


![Effect of microstructure and mechanical properties on ...volinsky/Ren Jiangzhuo-China Fundry.pdfcombustion engine, etc., due to its high strength and toughness [3]. CGI is characterized](https://img.pdfslide.net/doc/110x75/60cd837bd7b33d01814d5297/effect-of-microstructure-and-mechanical-properties-on-volinskyren-jiangzhuo-china.jpg)