Embed Size (px)
Citation preview
1
Effects of organic composition on mesophilic anaerobic digestion of food
waste
Yangyang Lia,b, Yiying Jina,b,*,1 Aiduan Borrionc, Hailong Lid, Jinhui Lia,b
a, School of Environment, Tsinghua University, Beijing 100084, China
b, Key Laboratory for Solid Waste Management and Environment Safety (Tsinghua University),
Ministry of Education of China, Tsinghua University, Beijing 100084, China
c, Dept of Civil, Environ &Geomatic Eng, University College London, London WC1E 6BT, UK
d, Mälardalen University, School of Business, Society and Engineering, SE-721 23 Västerås,
Sweden
Abstract
Anaerobic digestion of food waste (FW) has been widely investigated, however, little
is known about the influence of organic composition on the FW digestion process. This
study aims to identify the optimum composition ratios of carbohydrate (CA), protein
(CP) and lipid (EE) for maintaining high methane yield and process stability. The
results show that the CA–CP–EE ratio was significantly correlated with performance
and degradability parameters. Controlling the CA–CP–EE ratio higher than 1.89 (CA
higher than 8.3%, CP lower than 5.0%, and EE lower than 5.6%) could be an effective
way to maintain stable digestion and achieve higher methane production (385–627
mL/gVS) and shorter digestion retention (196–409 h). The CA-CP-EE ratio could be
used as an important indicator for digestion performance. To effectively evaluate
organic reduction, the concentration and removal efficiency of organic compositions in
both solid phases and total FW should be considered.
Keywords: Food waste; Anaerobic digestion; Organic composition; Methane
1* Corresponding author. Address: School of Environment, Tsinghua University, Beijing, China.
Tel.: +86 10 62794352; Fax: +86 10 62797618.
E-mail address: [email protected] (Y. Jin).
2
1. Introduction
Anaerobic digestion (AD) has been widely used for treating food waste (FW), and
the digestion performance (e.g. biogas production, organic reduction, inhibition
characteristics and process stability) is highly dependent on the feedstock’s
characteristics (Wagner et al., 2013). FW consists of three principal organic
components: carbohydrates, proteins and lipids, and the volatile solid to total solid
(VS/TS) ratios typically range from 80 to 97% (Jin et al., 2015; Zhang et al., 2014;
Zhang et al., 2007). Therefore, significant variations in digestion performance could
occur during biological conversion processes.
U Kun Kiran et al. (2014) conducted a literature review on the methane production
capacities of FW, and reported a production range of 220–546 mL/g VS, with VS
reduction between 70–95%. A study by Cho et al. (1995) on different types of
feedstock (i.e. cooked meat, boiled rice, fresh cabbage and mixed FW) reported
methane production between 294–482 mL/g VS. Studies have shown that
carbohydrate-rich feedstock yields more hydrogen than protein- and lipid-rich
substrates (De Gioannis et al., 2013), while lipid-rich feedstock has higher biochemical
methane potential (BMP) than carbohydrate-rich and protein-rich feedstocks
(Angelidaki and Sanders, 2004). In contrast, studies have also shown that protein-rich
substrates yield higher levels of ammonia, which inhibits methanogens, while
carbohydrate-rich substrates result in undesirable C/N ratios due to nutrient limitations
and rapid acidification (Paritosh et al., 2017). Lipid-rich feedstock strongly inhibits
3
methanogenic activity (Alves et al., 2009; Cirne et al., 2007; Sun et al., 2014; Yuan
and Zhu, 2016; Zhang et al., 2014), which is due to the formation of long chain fatty
acids (LCFAs) during lipid degradation, such as the 18-C LCFA (Wan et al., 2011).
Strong inhibition was reported by Cirne et al. (2007) when lipid content amounted to
31% (w/w, COD basis). In addition to the individual effects of three compositions on
the digestion process, interactions between carbohydrates and proteins during the
digestion process have also been reported by Breure et al.(1986).
A considerable amount of research has been devoted to the influence of organic
composition on the digestion performance of FW (including mono- and co-digestion),
however, studies were confined to using synthetic FW (Alibardi and Cossu, 2016),
collected FW with limited composition ranges (Li et al., 2016; Rajagopal et al., 2013;
Wang et al., 2014; Yin et al., 2014; Zhang et al., 2005) and co-digestion with other
organic waste (e.g., sewage (Koch et al., 2015), cattle manure (Zhang et al., 2013),
piggery wastewater (Zhang et al., 2011) and yard waste (Brown and Li, 2013)), or
simplified to focus on optimising C/N ratios (with optimum reported values within
20–60) (Astals et al., 2014; Mata-Alvarez et al., 2014). The organic compositions of
FW often vary with factors such as food availability, seasonal variation and
consumption patterns (Kobayashi et al., 2012). For a given FW C/N ratio, the
carbohydrate, protein and lipid content can differ. Due to differences in substrate
characteristics, inoculums and digestion parameters (e.g., temperature, retention time
and digester type) (Rajagopal et al., 2013; Xie et al., 2016; Yuan and Zhu, 2016), there
4
is little information that evaluates the influence of organic composition on the FW
mono-digestion process, or suggests appropriate composition blending ratios. It would
be interesting to compare the effects of the C/N ratio and the organic composition
blending ratio, and then suggest a more appropriate indicator for digestion
performance.
This study aimed to evaluate the effects of organic composition on the digestion
process stability, methane production performance and organic degradation properties
at different retention times (RT) under a mesophilic temperature. Kinetic studies were
then carried out to describe the methane production process. Additionally, statistical
analyses (e.g., ANOVA, Pearson correlation analysis, Principal component analysis
and Cluster analysis) were used to determine the correlations between the parameters
(e.g., digestion performance, process kinetics and biodegradability) and the three
components, discuss possible mechanisms, and provide comprehensive and
comparative conclusions on FW AD. Finally, conclusions were drawn for which
factors could potentially increase methane yields during FW digestion and determine
the optimum proportion of the three organic components. The results obtained in this
study could enhance understanding of how the variability of organic components
affects methane yields from FW. Detailed information on performance and
degradability characterisation could help to predict and optimise operating parameters
by adjusting the compositions of organic components, as well as identify potential
economic benefits of the FW digestion process.
5
2. Materials and Methods
2.1. FW and inoculum
The FW was collected from different canteens. Impurities in the collected FW (e.g.,
big bones, plastics and metals) were manually removed before the FW was macerated
into 1-2 mm particles by a macerator. The samples were stored at 4 °C prior to use. The
ranges of variation of FW compositions were obtained from a literature review and
measurements of samples from 5 typical Chinese cities (e.g. Beijing in North China;
Jiaxing in Zhejiang province, East China; Xining in Qinghai province, Northwest
China; Qingdao in Shandong province, coastal East China and Guiyang in Guizhou
province, South China).
Seed sludge was obtained as an inoculum from a steady-operation digester (37 °C)
in a FW treatment plant in Beijing, China. After a two-day gravity sedimentation
period, the supernatant was discarded and the rest was passed through a 2-mm sieve to
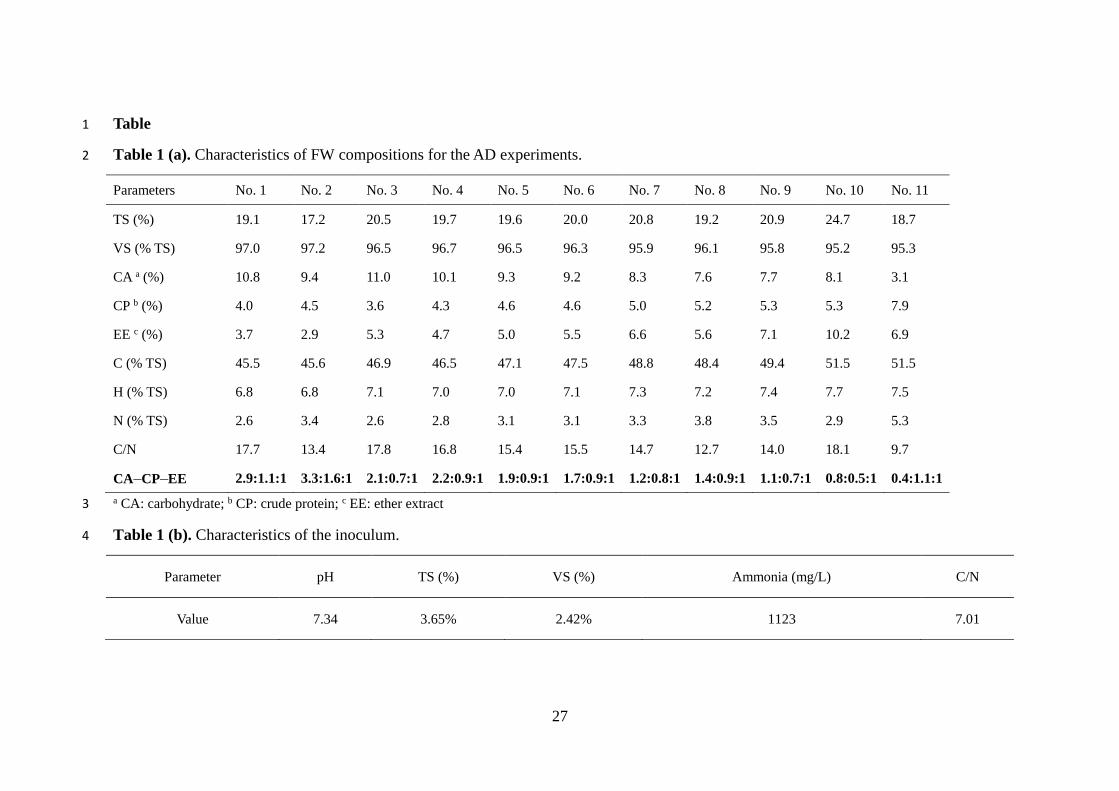
remove large particles/grit. Characteristics of FW and inoculum were shown in Table 1.
Table 1 (a). Table 1 (b).
2.2. Batch digestion experiment
The BMP assay has been proven to be a relatively simple and reliable method for
determining the extent and rate of converting organic matter to methane. Batch tests
were conducted at 37 °C using an Automatic Methane Potential Test System II
(AMPTS II), supplied by Bioprocess Control (Lund, Sweden). All the reactors were
started at the same time, and agitation was synchronous, with the same speed and
6
intervals between all reactors. Thus, evaluating the biodegradability and decomposition
rate of organic materials was more accurate than other batch assays.
The AMPTS II system contained 500 mL (total volume) glass bottles (A), and was
used to measure the real-time methane productivity and kinetics, while the system with
2 L (total volume) glass bottles (B) was used for collecting samples and detecting
indicators. All the bottles in both systems were fed with the same samples that had the
same inoculation ratios (FW/inoculum = 0.5, VS basis). To achieve accurate results, it
is important to collect samples at the correct times (e.g. inhibition stage, recovery stage
and the final stage). Digestion system A was started two days before system B to
understand how sample collection time affected the methane yield patterns.
2.3. Kinetic study
A transference function was used to determine the methane production potential, the
maximum methane production rate and lag time for AD, which has been used in
previous studies (Donoso-Bravo et al., 2010; Li et al., 2012; Pagliaccia et al., 2016).
This model, used mainly for control purposes, considers that any process could be
analysed as a system receiving inputs and generating outputs, and was evaluated (Eq.
(1)) (Donoso-Bravo et al., 2010). The apparent hydrolysis rate coefficient (k) was
obtained using the first-order equation, which was assumed for the hydrolysis of
particulate organic matter (Eq. (2)) (Veeken and Hamelers, 1999).
B = B0 × {1 – exp [-μm × (t - λ) / B0]} (1)
B = B0 × [1 – exp (-k t)] (2)
7
where B is the cumulative methane production at digestion time t, B0 is the methane
production potential (mL/g VS), μm is the maximum methane production rate (mL/g
VS h), λ is the lag time (h), k is the first-order hydrolysis rate constant (d−1) and t is
time (h).
2.4. Analytical methods
TS and VS were determined according to the standard methods of the American
Public Health Association (APHA, 1915). pH was measured using a pH meter (FE20,
Mettler, Switzerland). The concentrations of protein and lipid (expressed as EE) were
determined following the Kjeldahl method and by using a Soxhlet device, respectively
(Jones Jr, 1991; Langrish). Concentrations of total ammonia nitrogen (TAN) and free
ammonia nitrogen (FAN) were determined as previously reported (Siles et al., 2010).
VFA and ethanol were measured by Agilent Gas Chromatograph (Agilent GC-7890A,
California, USA) equipped with a flame ionization detector.
2.5. Statistical analysis
Statistically significant differences in the results (changes in organic reduction and
process parameters) were identified by ANOVA analysis (p<0.05) using R software
3.3.2. Pearson correlation (p<0.05) was also determined to discuss significant
relationships between the above parameters, using IBM SPSS Statistics 20. Principal
component analysis (PCA) was conducted on the data, and leave-one-out cross
validation was used, and conducted by IBM SPSS Statistics 20. The data in this study
were subjected to cluster analysis, which can help to simplify and organise datasets and

8
generate useful generalisations that can garner meaningful insight. Cluster analysis was
carried out to classify different cases based on the principle of the nearest neighbour.
Between-group linkage was chosen as the cluster method and measured using squared
Euclidean distance by IBM SPSS Statistics 20.
3. Results and Discussion
3.1. Performance of operation parameters
3.1.1. pH
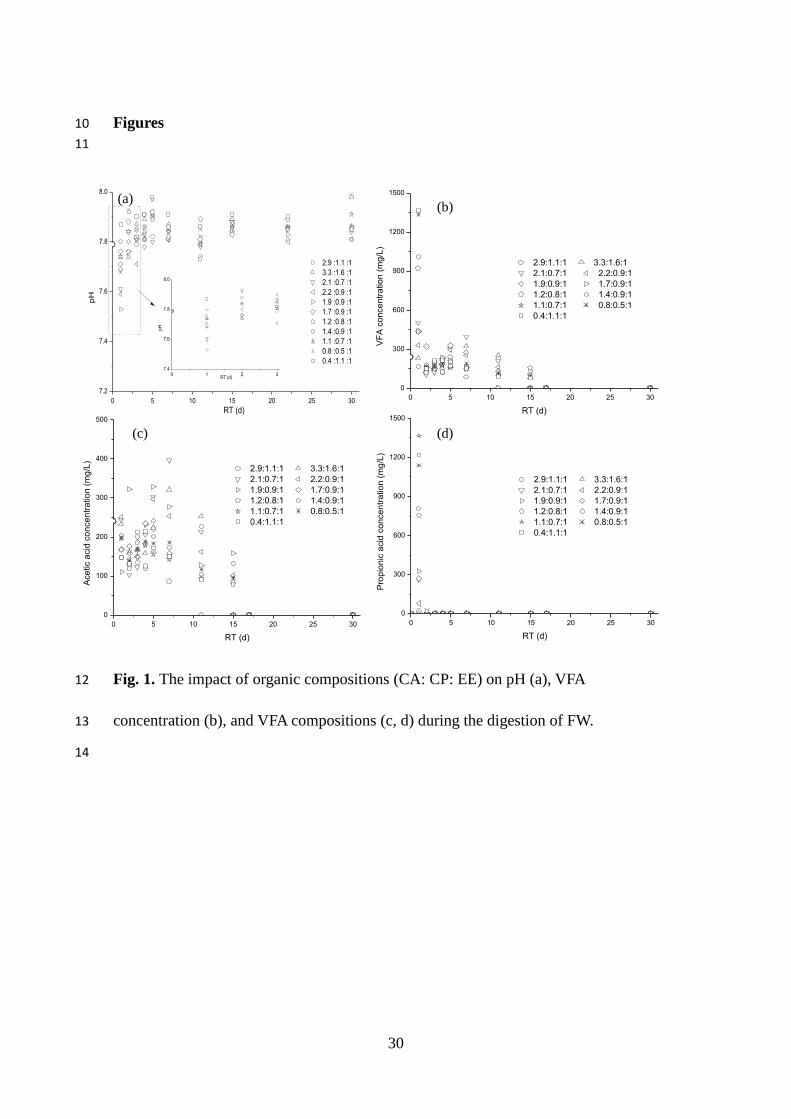
The pH declined to its lowest values (pHmin) on day 1, varying from 7.45 to 7.74.
After 30 days, the final pH was between 7.79–7.99 (Fig. 1a). The pH values for all of
the digesters were within an ideal range for AD, i.e. 4.0–8.5 for fermentative bacteria
and 6.5–7.2 for methanogens (Zhang et al., 2014), and the alkaline microenvironment
showed no VFA accumulation during digestion.
The maximum pH (pHmax) was significantly influenced by the compositions of FW.
Higher protein and lipid content resulted in higher pHmax values, but higher
carbohydrate contents resulted in lower pHmax values. This could be explained by
carbohydrate having a higher hydrolysis rate than lipids and proteins during the AD
process, leading to a more rapid VFA production, while protein provides necessary
buffering capacity. Fig. 1.
Additionally, pH is largely influenced by a number of chemical balances within a
medium. Owing to a delay in reaction time, pH should be recorded with other
parameters (e.g., VFA concentration, ammonia concentration and biogas composition).
9
3.1.2. VFA
(1) VFA concentration
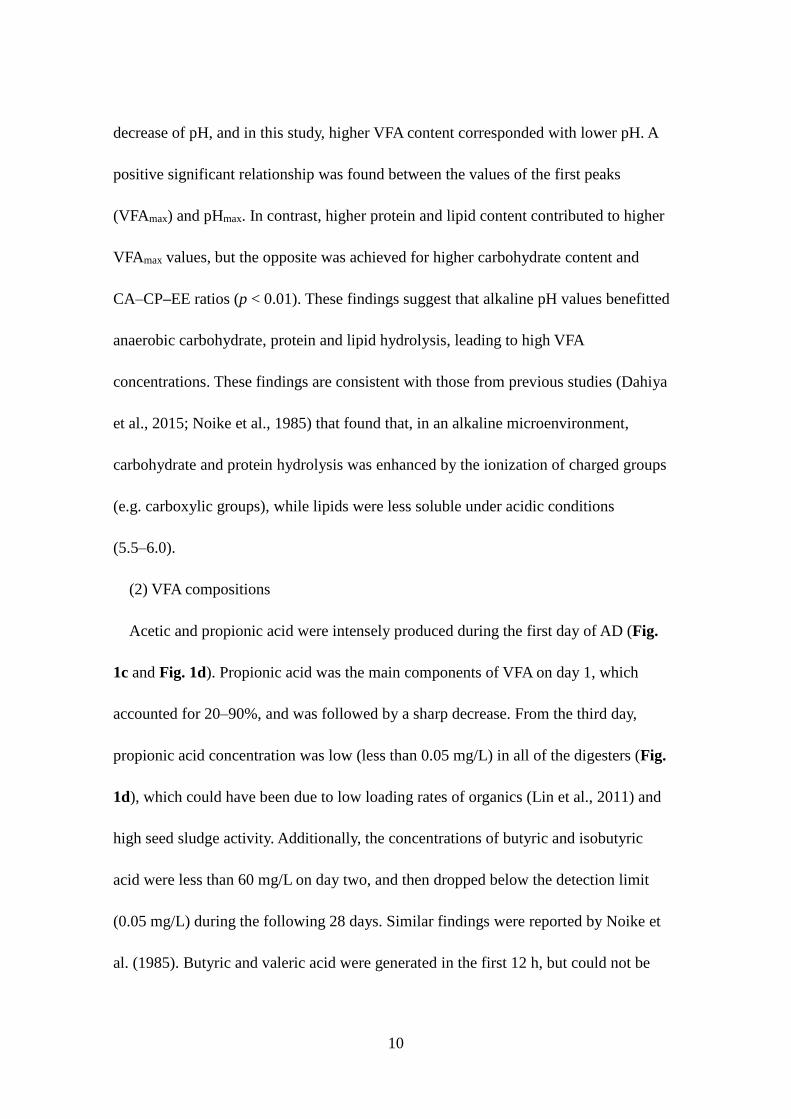
VFA concentration increased rapidly to its peak values (VFAmax) within the first 24 h
(104–1624 mg/L), and remained steady from the 20th day onwards (0-34 mg/L),
indicating longer retention times for complete degradation with increasing CA–CP–EE
ratios (Fig. 1b). Two VFA generation peaks were identified for FW with CA–CP–EE
ratios higher than 1.89. The first peak indicated intense VFA production within a short
duration, and higher peak values than the second peak. This was likely to be due to the
high carbohydrate concentration (9.3 – 11.0%, wet basis), which was biodegraded
more rapidly than proteins and lipids, and then contributed to the first peak. The
second peak, varying from 114 to 238 mg/L between days 4–11, could be due to the
subsequent degradation of proteins and lipids. The second peak could also result from
the further stepwise degradation of some soluble organics, such as carbohydrates,
because a rapid decrease in carbohydrate concentration during the initial 1-3 days is
often followed by slower degradation (Yang et al., 2015). When the CA–CP–EE ratios
were lower than 1.89, however, a single peak was observed. As the degradation of
carbohydrates was more rapid than that of proteins and lipids, a possible reason for the
single peak from samples with lower CA–CP–EE ratios could be LCFA accumulation
with the hydrolysis of lipids, thus inhibition of LCFA occurred. This could delay the
degradation of carbohydrate and integrated it with the other organics.
The degradation of organic compounds in FW led to VFA production, resulting in a
10
decrease of pH, and in this study, higher VFA content corresponded with lower pH. A
positive significant relationship was found between the values of the first peaks
(VFAmax) and pHmax. In contrast, higher protein and lipid content contributed to higher
VFAmax values, but the opposite was achieved for higher carbohydrate content and
CA–CP–EE ratios (p < 0.01). These findings suggest that alkaline pH values benefitted
anaerobic carbohydrate, protein and lipid hydrolysis, leading to high VFA
concentrations. These findings are consistent with those from previous studies (Dahiya
et al., 2015; Noike et al., 1985) that found that, in an alkaline microenvironment,
carbohydrate and protein hydrolysis was enhanced by the ionization of charged groups
(e.g. carboxylic groups), while lipids were less soluble under acidic conditions
(5.5–6.0).
(2) VFA compositions
Acetic and propionic acid were intensely produced during the first day of AD (Fig.
1c and Fig. 1d). Propionic acid was the main components of VFA on day 1, which
accounted for 20–90%, and was followed by a sharp decrease. From the third day,
propionic acid concentration was low (less than 0.05 mg/L) in all of the digesters (Fig.
1d), which could have been due to low loading rates of organics (Lin et al., 2011) and
high seed sludge activity. Additionally, the concentrations of butyric and isobutyric
acid were less than 60 mg/L on day two, and then dropped below the detection limit
(0.05 mg/L) during the following 28 days. Similar findings were reported by Noike et
al. (1985). Butyric and valeric acid were generated in the first 12 h, but could not be
11
detected after 48 h, indicating that it was completely consumed during the digestion
process. It can be concluded that acetic acid was the primary acid released during
acidification (Fig. 1c).
The concentrations of proteins and lipids were positively correlated with the
maximum propionic acid concentration, while maximum propionic acid concentration
was negatively correlated with carbohydrate concentration. Lipid content was the main
factor that influenced the maximum n-valeric acid concentration (p < 0.05), while
iso-valeric acid concentration was positively correlated with protein content (p < 0.01)
and negatively correlated with carbohydrate content (p < 0.01). Additionally, the final
VFA distribution indicated that the final propionic acid concentration ranged from 6 to
61 mg/L when the CA–CP–EE ratios were lower than 1.89 (carbohydrate: 3.1–8.3%,
protein: 5.0–7.9%, and lipid: 5.6–10.2%), while it was completely degraded in the
other assays. The accumulation of propionic acid, which is difficult to degrade,
suggested that the methanogenesis step failed. These results indicate that controlling
CA–CP–EE ratios to levels higher than 1.89 (with carbohydrate concentrations higher
than 8.3%, proteins lower than 5.0% and lipids lower than 5.6%) could be an effective
way for maintaining a stable digestion process with higher methane production and
shorter digestion retention (Table 2).
3.1.3. Ethanol
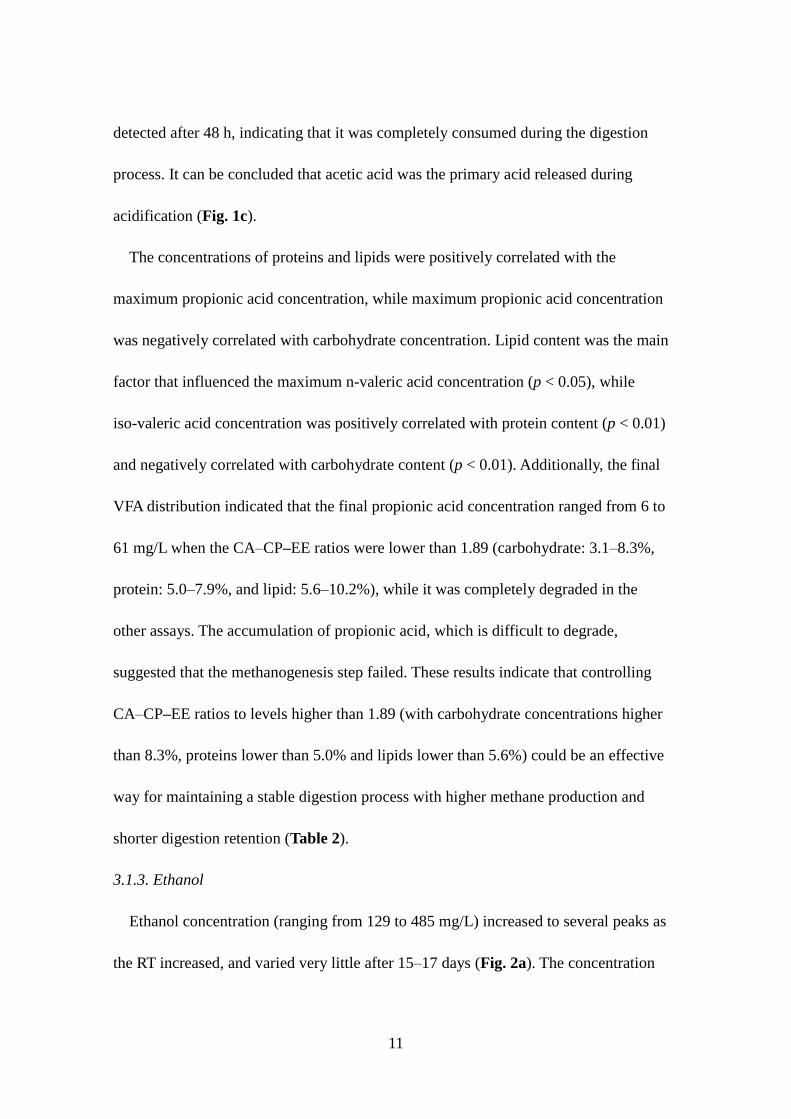
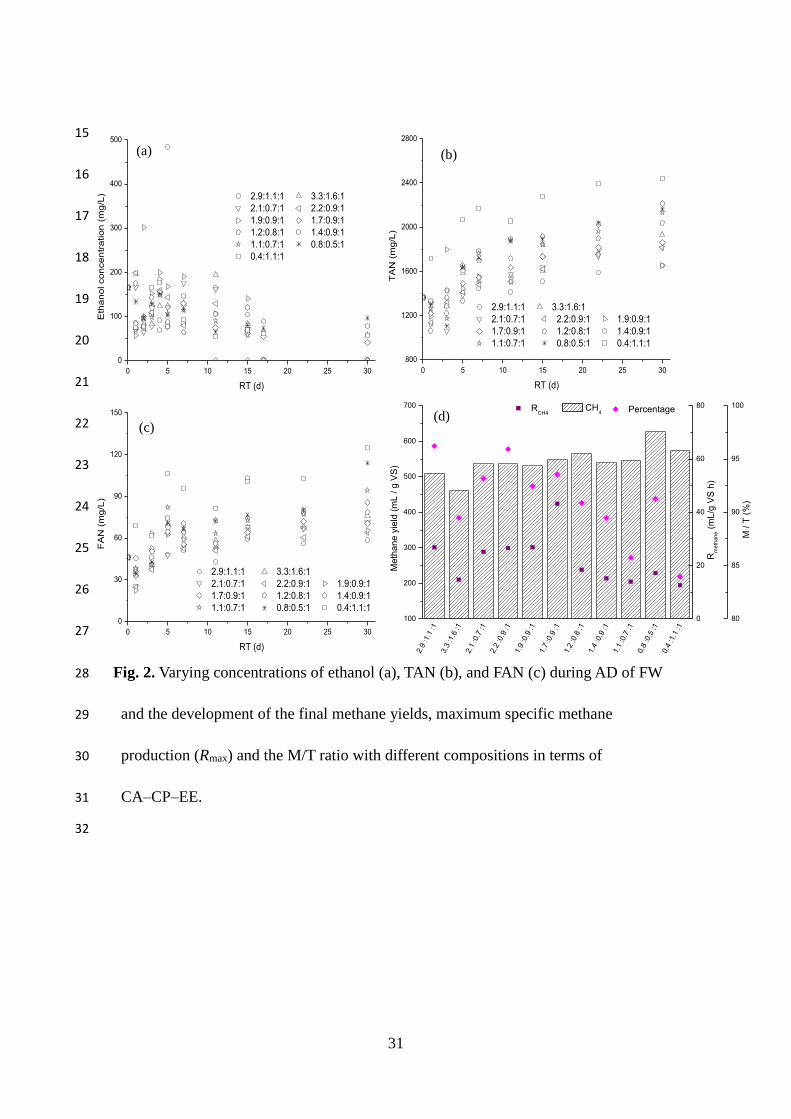
Ethanol concentration (ranging from 129 to 485 mg/L) increased to several peaks as
the RT increased, and varied very little after 15–17 days (Fig. 2a). The concentration
12
was lower than those of VFA and acetic acid, which is consistent with results from
other researchers (Tang et al., 2008). Lipid content was positively correlated (p < 0.05)
with the final ethanol concentration, while carbohydrate and protein content had no
significant effect (p > 0.05).
An alkaline environment can promote the hydrolysis process (Dahiya et al., 2015)
and contribute to ethanol production, thus a positive correlation between ethanol
concentration and pHmax (p < 0.01) was found. As ethanol can inhibit hydrolytic
enzymes (Wyman, 1996), lower VFA concentrations corresponded with higher ethanol
content. The occurrence time of the ethanol concentration peak was 1 to 6 days later
than that of VFA (Fig. 1b). Additionally, higher acetic acid concentration inhibits
propionic acid degradation (Mawson et al., 1991), and ethanol content was positively
correlated with propionic acid concentration (p < 0.05). Fig. 2.
3.1.4. TAN and FAN
The concentration of TAN (1654–2441 mg/L) and FAN (58–125 mg/L) initially
decreased on day one, but recovered and continuously increased on days 3–5 (Fig. 2b
and 2c). These were little to no increases in TAN and FAN concentrations after day
seven, indicating that protein biodegradation had completed, or a balance was achieved
between protein production and consumption.
NH4+ / NH3 were released into the liquid phase during protein degradation, and their
concentrations depended on the protein content of the feedstock, therefore, TAN and
FAN content were positively correlated with protein content (p < 0.01). pH and
13
alkalinity also increased during the degradation of amino acids due to the consumption
of protons, and both TAN and FAN were positively correlated with lipid content and
negatively correlated with carbohydrate content.
pHmax and VFAmax were significantly, positively correlated with TAN and FAN (p <
0.01). High ammonia levels can cause inhibition, characterised by low methane yield
and high VFA concentration in effluents. As shown in Fig. 2b, it took less time for FW
with higher protein content to reach inhibition concentrations of TAN (over 1500 mg/L
(Rajagopal et al., 2013)). In contrast, FAN was not inhibited through the entire
digestion process (Fig. 2c). Though all the assays in this study yielded a TAN
concentration higher than 1500 mg/L, the final VFA concentrations were low,
indicating high biomethane conversion efficiency, while the final pH was within an
appropriate range. These findings suggest that the conditions causing instability in one
reactor do not necessarily cause problems in another, and, therefore, defining TAN
levels as an indicator of the state of an anaerobic process would not be possible,
because feedstocks have specific TAN that can be considered stable for the reactor.
3.2. Methane yields and kinetic analysis
3.2.1. Methane production
The methane yield ranged from 385 to 627 mL/gVS after 30 days of digestion (Fig.
2d). The highest yield was achieved from FW with a CA–CP–EE ratio of 1.60, which
consist of 6.9% lipid, 7.9% protein and 3.1% carbohydrate. Lipid was the main factor
that influenced methane yield, exhibiting a significant positive correlation (p < 0.01)
14
due to its higher BMP than carbohydrates and proteins. The specific methane yield
varied between 12.69 and 43.16 mL/(gVS h), and the maximum value (Rmax) was
obtained from FW with a CA–CP–EE ratio of 1.89 (5.5% lipid, 4.6% protein and 9.2%
carbohydrate).
To evaluate the extent of biomethane conversion from organics, the ratios of the
measured values to theoretical methane yields (M/T) were calculated, and the latter
was calculated according to a method reported by Angelidaki and Sanders (2004). M/T
ratios ranged from 86% to 96% (Fig. 2d), and showed strong positive correlations with
C/N ratios (p < 0.01). Over 90% of the theoretical methane yields were achieved when
the C/N ratio fell between 17–18. As the M/T ratios decreased with increasing
propionic acid concentrations (p < 0.01), pHmax (p < 0.05), VFAmax (p < 0.01), FAN (p
< 0.01) and TAN (p < 0.01), an appropriate degree of hydrolysis and sufficient
buffering capacity could contribute to high methane conversion efficiency. Although
the M/T ratios were negatively correlated with protein (p < 0.01), this does not suggest
that continuously decreasing protein content could increase methane yield, because
buffering from ammonia and ammonium during the breakdown of proteins would be
required. The methane yield, however, had no significant relationship with pHmax and
TAN, but it had a significant positive relationship with VFAmax and FAN. This suggests
that enhancing the solubilisation and hydrolysis of organics could be an effective way
of maintaining high methane production. The above findings indicate that methane
yield and kinetics were greatly influenced by FW compositions.
15
3.2.2. Kinetic study of methane production
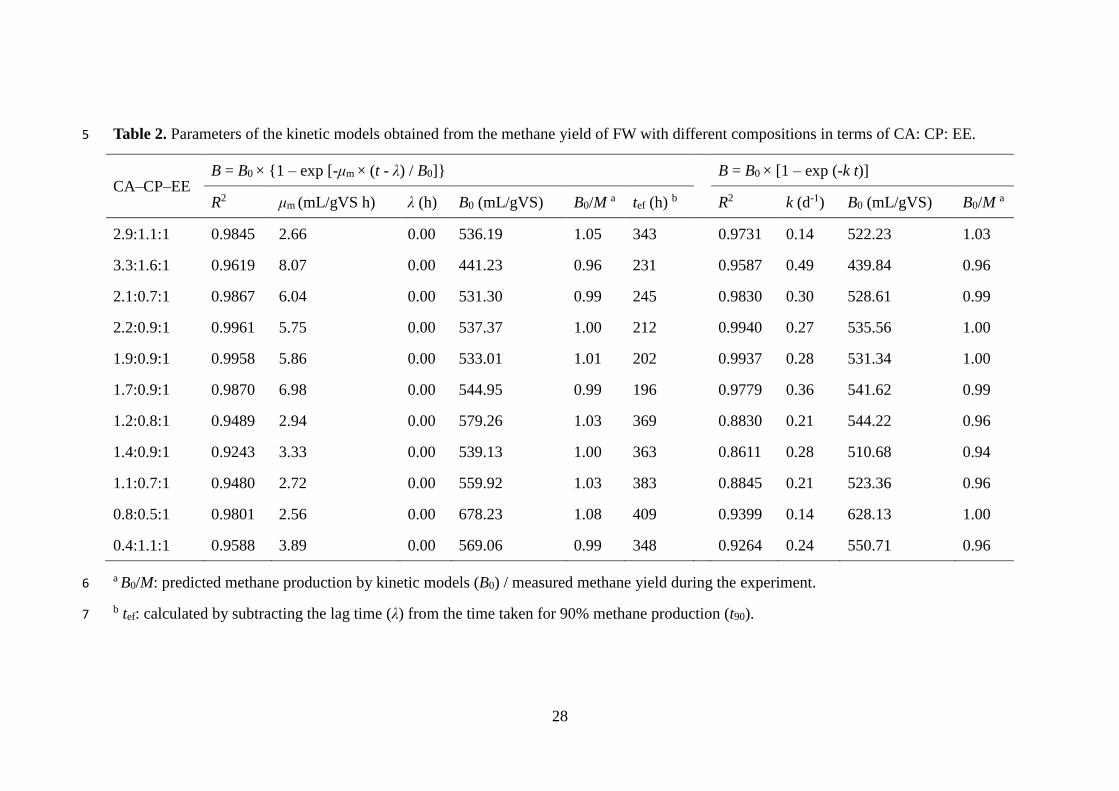
The results of the parameters estimated from two models are presented in Table 2,
with higher correlation coefficients (R2) indicating better fitting.
Maximum methane production rate (μm) varied significantly (2.56–8.07 mL/(gVS h))
due to differences in FW compositions. Higher μm values were achieved for FW with
higher carbohydrate content due to its rapid degradation rate, and the highest μm values
were achieved from FW with CA–CP–EE ratios ranging from 1.89 to 2.06. The lag
phase usually occurs for microorganisms to acclimatise to a new environment in batch
digestion experiments (Kafle and Kim, 2013; Koch et al., 2015; Noike et al., 1985). In
this study, the lag time (λ) was negligible for all the samples (Table 2), indicating
immediate methane production after the AD process began. This was likely to be due
to inoculum with high methanogenic activity that was collected from a stable, working
FW treatment plant, and the high inoculum-to-feed ratio (especially for the
inoculum-to-lipid ratio) for feedstock used in this study. Therefore, the source of an
inoculum could also affect digestion characteristics (e.g. degradation rate, biogas
production rate and digestion duration). High lipid concentrations could cause some
operational challenges (such as mass transfer limitations, inhibition of methanogenic
archaea, sludge floating) (Alves et al., 2009), therefore, higher lipid content
corresponded to a longer effective biogas production period (tef), varying from 196 to
409 h (p < 0.05).
The highest value (0.49 d-1) of the hydrolysis constant (k) was obtained from FW
16
with a CA–CP–EE ratio of 2.06. There was little change in the k values for FW with
the same percentage of CP/EE ratios of 0.9: 1 (0.27–0.28 h-1) and methane yields
(530-541 mL/gVS), such as a CA–CP–EE ratio of 2.2: 0.9: 1, 1.9: 0.9: 1 and 1.4: 0.9: 1.
There was no statistically significant relationship between the three organic
compounds and k, but was positively correlated with μm (p < 0.01). These correlations
were accurately described by a linear model (k = 0.050 μm + 0.034 (R2 = 0.9930)).
Overall, the samples with lower lipid content resulted in a kinetic improvement (e.g.,
μm and k), which could be a consequence of inhibition attenuation, resulting in lower
concentration and less inhibitory effects by LCFA. These results also suggest that
increasing either carbohydrate or protein content in FW could relieve inhibition by
LCFA and stimulate degradation efficiency. Previous studies found that methane
production could be recover by adding glucose and/or cysteine to digesters completely
inhibited by Oleate (Kuang et al., 2006) and concluded that a combination of glucose
and cysteine had a greater effect on this recovery than adding either glucose and
cysteine alone. In this study, none of the digesters were completely or slightly inhibited,
therefore, increasing carbohydrate content could be the most effective way of assisting
kinetic performance.
k was significantly, negatively correlated with tef (p < 0.05) and methane production
(p < 0.05), therefore, higher methane yields were achieved at longer tef but lower μm
and k values. In addition, maintaining an appropriate range of lipid content in FW
(4.7–5.5%) resulted in a moderate hydrolysis rate (0.27–0.36 d-1) and methane yield

17
rates (5.57–6.98 mL/(g VS h)), higher lipid reduction (about 78%) and higher methane
yield (530–548 mL/gVS). Under these conditions, the lowest digestion duration was
achieved (196–212 h), which was 15–48% less than the other assays in this study, and
more economical benefits could be achieved. Table 2.
3.3. Digestate characteristics
3.3.1. TS and VS concentration and reduction
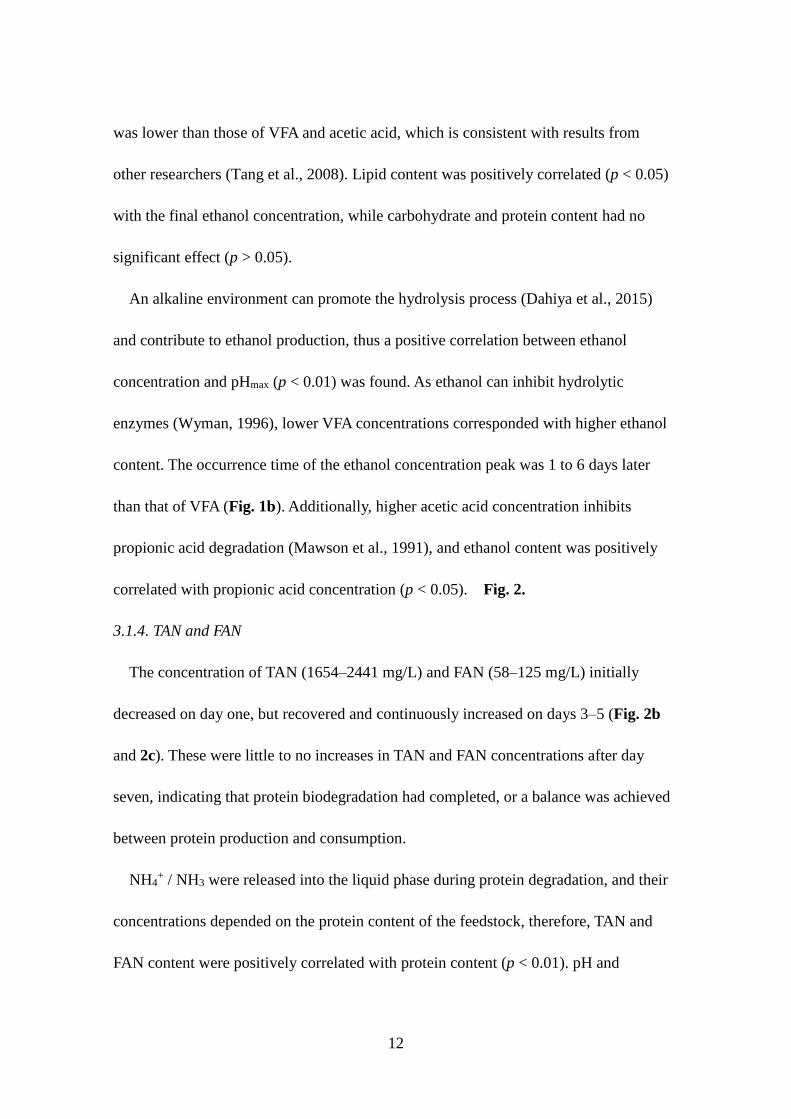
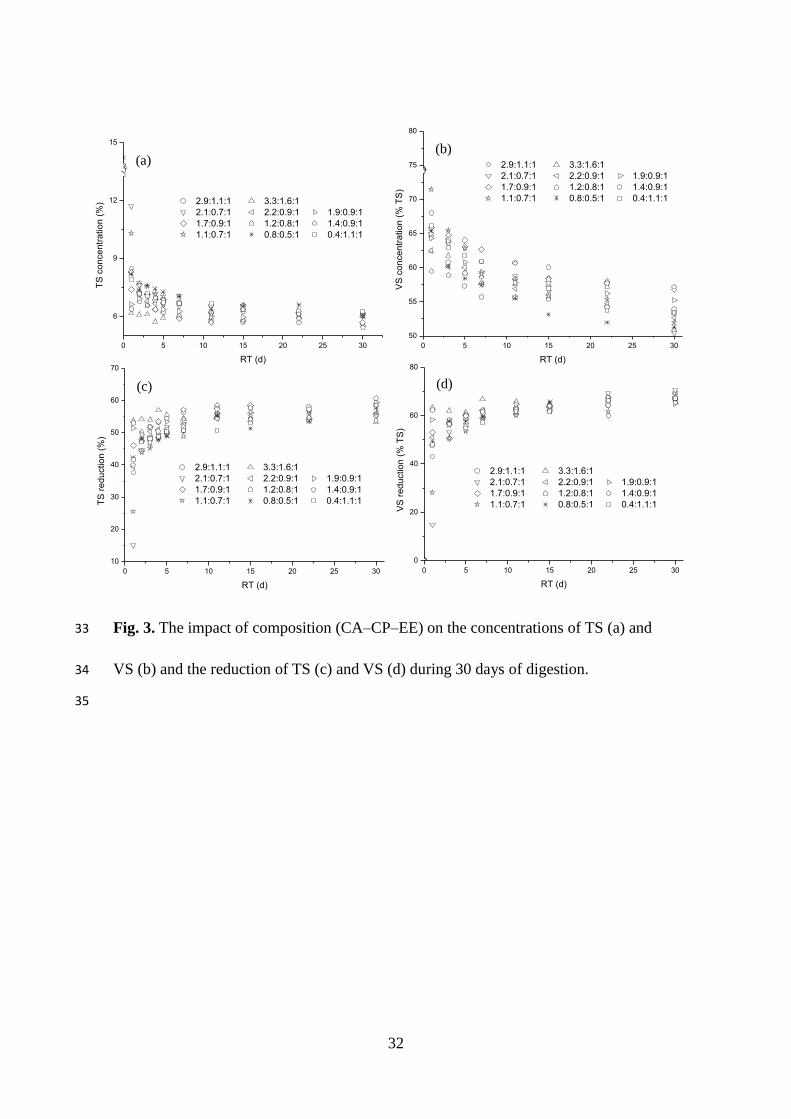
The final TS content ranged from 5.4% to 6.3%, while the final VS content was
50.9–56.8% (TS %) (Fig. 3). Decomposition of organic compounds dominantly
occurred during the first 2–3 days of the digestion, and reduction ranges of 55–61%
and 65–70% were achieved for TS and VS, respectively. These findings can be verified
by the intense release of VFA during the initial period of digestion (Fig. 1b). FW with
lower CA–CP–EE and C/N ratios had lower final concentrations and reductions of TS
and VS. Fig. 3.
3.3.2. Lipid concentration and reduction
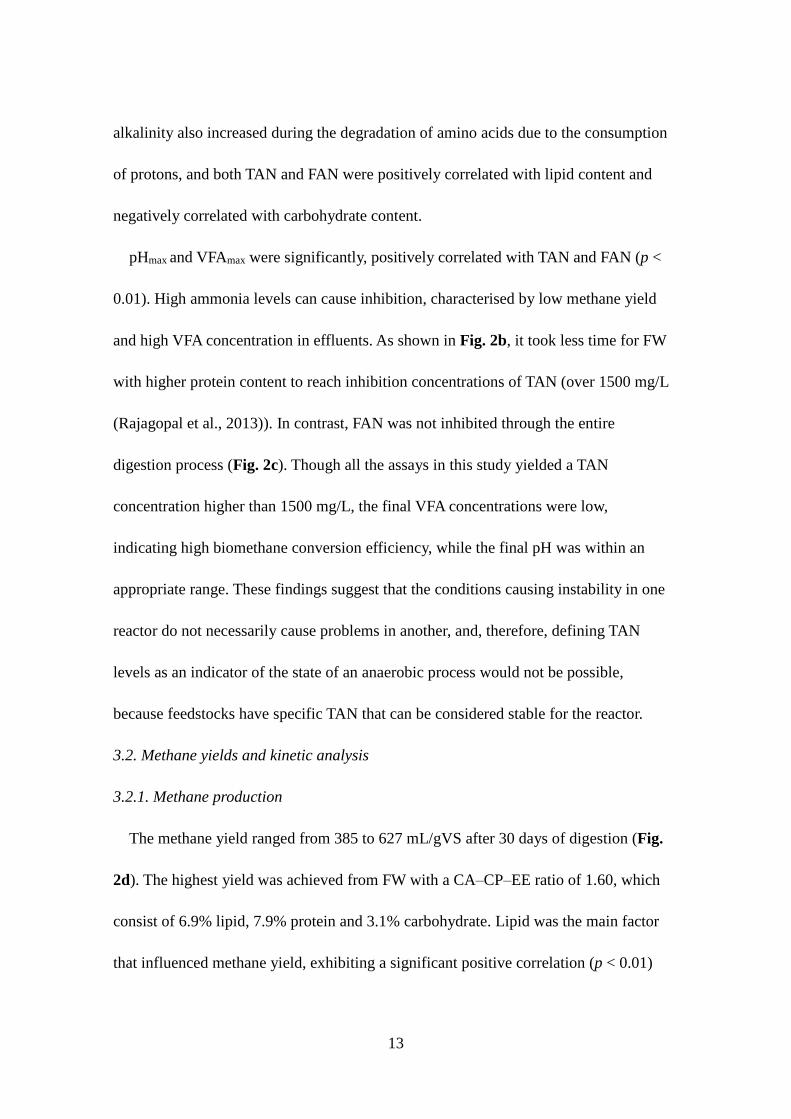
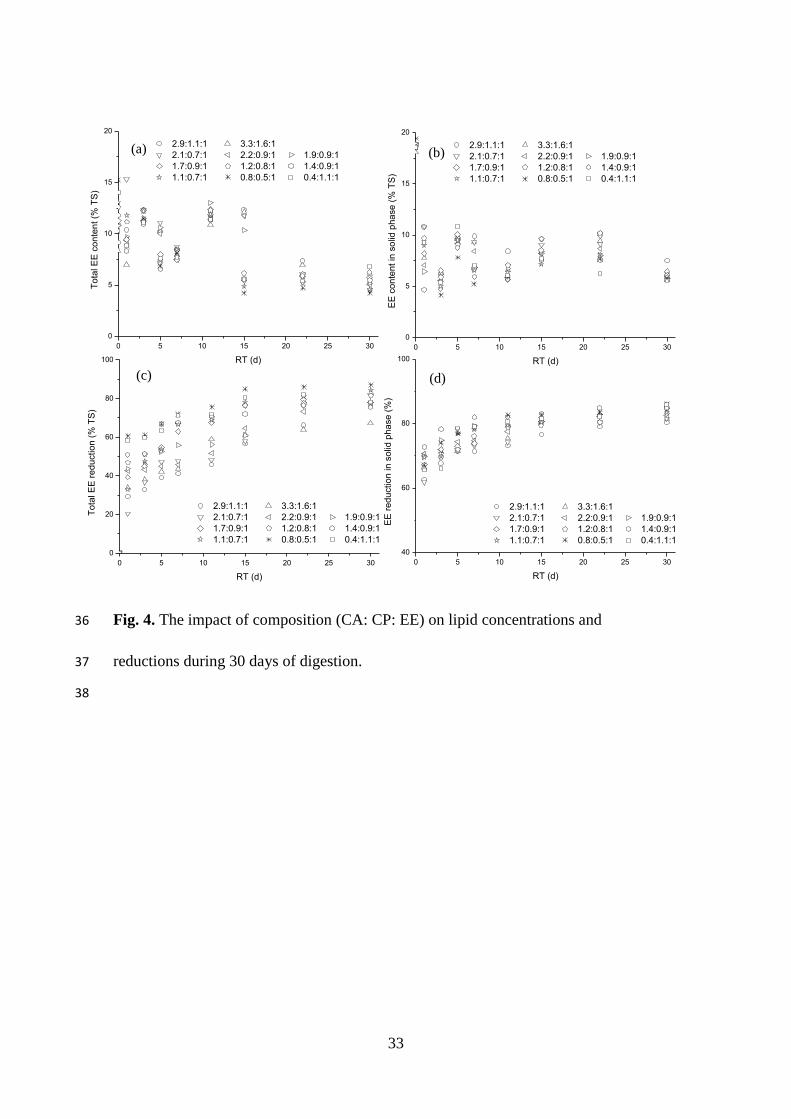
As presented in Fig. 4a, the total concentrations of lipids in FW (EET) showed little
variation (5-7%, % TS) during the initial three days, followed by a sharp decrease to its
lowest values on day 5 for FW with a CA–CP–EE ratio of 1.89–3.0 (Group A), or day
7 for FW with a CA–CP–EE ratio of 0.36–1.6 (Group B). The lipid concentrations for
Group A increased to a peak on the 15th day, and were maintained at a steady
concentration from day 22 of the process. For Group B, the second peak occurred on
day 11, before reaching steady concentrations from day 15. These findings could
18
explain the phenomenon of the two VFA peaks for feedstock with CA–CP–EE ratios
lower than 1.89 during this period. The final lipid concentrations in the solid phase of
FW (EES) ranged from 5.5% to 6.4% (% TS), indicating that lower lipid concentrations
of FW occur with higher CA/EE ratios (Fig. 4b).
The final reductions of EET and EES were within 67–87 % and 80–86% respectively
(Fig. 4 c and Fig. 4 d). Of the three organic components, only lipids were found to be
the main factor that positively influenced EET reduction (p < 0.01). Significant positive
correlations were found between EES reduction and protein (p < 0.01) and lipid content
(p < 0.05), while a negative relationship was observed with carbohydrate (p < 0.01),
for example, for FW with lipid content of 26.57–43.28% (TS basis). EES reduction had
a significant, positive relationship with TAN (p < 0.05) and FAN (p < 0.01). These
relationships could confirm that solubilisation and bioconversion efficiency of lipids is
higher under alkaline conditions. Significant, positive correlations were obtained
between the maximum VFA concentrations and its compositions. This could be
because, under alkaline conditions (e.g. high TAN or FAN), fatty acids in an ionic form
can not pass through the lipid bilayer, thus leading to the accumulation of VFA outside
the cell. Interestingly, no such relationship was observed for the reduction of EET,
which could have been due to the calculation methods: a certain amount of fatty acids
hydrolysed from the solid phase of FW had not been converted to biogas, resulting in a
delay in the reduction of EET. These findings suggest that only considering the
reduction of organics does not effectively reflect the extent of their degradation
19
efficiency in FW, therefore, their final concentration and removal efficiency in both the
solid phase and total FW should be investigated. Fig. 4.
3.3.3. Protein concentration and reduction
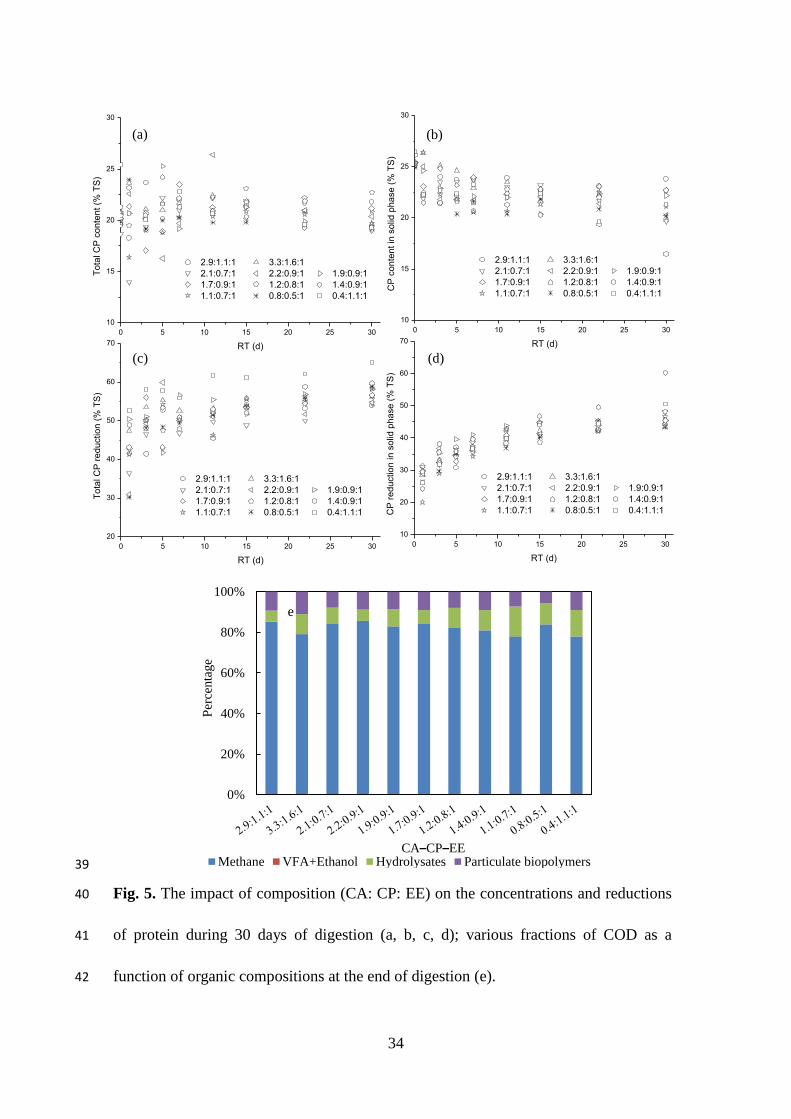
As shown in Fig. 5, final protein content (dry basis) varied from 16% to 23% in the
solid phase of FW (CPS), and for the total FW (CPT). Protein initially degraded rapidly
in the first 3–5 days of the process, and reductions of 41.7–59.9% and 13.1–27.2%
were achieved for CPT and CPS, respectively. A slower degradation process then
followed, suggesting rapid reduction of easily-degradable proteins and lower
hydrolysis at a low pH and high lipid content. Similar results were reported in other
studies (Shao et al., 2013). After 30 days of digestion, reductions of 53–60% and
44–60% were achieved for CPT and CPS, respectively.
As high protein content correlated with high TAN concentration (p < 0.01), more
proteins needed to be solubilised and degraded to achieve higher TAN concentrations,
showing higher protein reduction (p < 0.01). Glucose, the main hydrate of
carbohydrates, could repress the formation of protease, which is responsible for
decomposing protein to amino acids (Breure et al., 1986), so carbohydrate had a
negative relationship with total protein reduction in FW (p < 0.01). Additionally,
methane yield was positively correlated with lipid reduction (p < 0.01), while protein
did not have any significant effect on it. Fig. 5.
Previous studies reported that lipid hydrolysis only occurred under methanogenic
conditions (Miron et al., 2000) and was slower than protein and carbohydrate

20
hydrolysis (Pavlostathis and Giraldo Gomez, 1991). Considering that lipids have high
solubility under an alkaline environment (Dahiya et al., 2015), it could be concluded
higher reduction of CPT correlated with a higher reduction of EES (p < 0.01).
Additionally, previous studies (McInerney, 1988) reported that iso/n-Valeric acid was
the main product of protein degradation. In this study, higher lipid reduction of solid
phases was associated with higher concentrations of n-Valeric and iso-Valeric acid,
while total protein reduction was achieved with higher levels of iso-Valeric acid.
3.3.4. Various COD distributions
After 30 days of digestion, chemical oxygen demand (COD) in the digester could be
split into four parts based on different existential states: a) some remaining particulate
biopolymers, including carbohydrates, proteins and lipids; b) hydrolysates, including
small molecular materials and soluble organic substrates (e.g., LCFA, amino acids and
simple sugars; c) VFA and ethanol, which could be converted to methane; and d)
organics, which had already been used for methane production.
As shown in Fig. 5e, 78–86% of the COD present in FW were converted to methane
by the end of the digestion process. In the influent, 6–15% of the hydrolysates COD
and 6–11% of the particulate biopolymer COD were present. There were very small
percentages of VFA and ethanol COD present (0.01–0.04%). The bioconversion
efficiency of COD to methane had a significant, positive correlation with carbohydrate
content (p < 0.05) and a negative correlation with protein content (p < 0.01) in
feedstock. A significant, positive relationship was found between hydrolysates COD
21
and protein content (p < 0.05), while carbohydrate had a significant negative
relationship (p < 0.01). Lipid had a significant negative correlation with particulate
biopolymer COD, while the other two organics had no effect. All three organics had no
correlation with VFA and ethanol COD (p > 0.05).
The final accumulation of VFA and LCFA was related to the final equilibrium of the
digestion system, which suggested that the methanogenesis step had failed, and
provided more specific information about the process’ behaviour. Based on the
findings of this study, controlling the CA–CP–EE ratios to be higher than 1.89 (with
carbohydrate content higher than 8.3%, protein lower than 5.0%, and lipid lower than
5.6%) could be an effective way to maintain high methane yields and process stability.
3.4. Relationships among digestion performance parameters
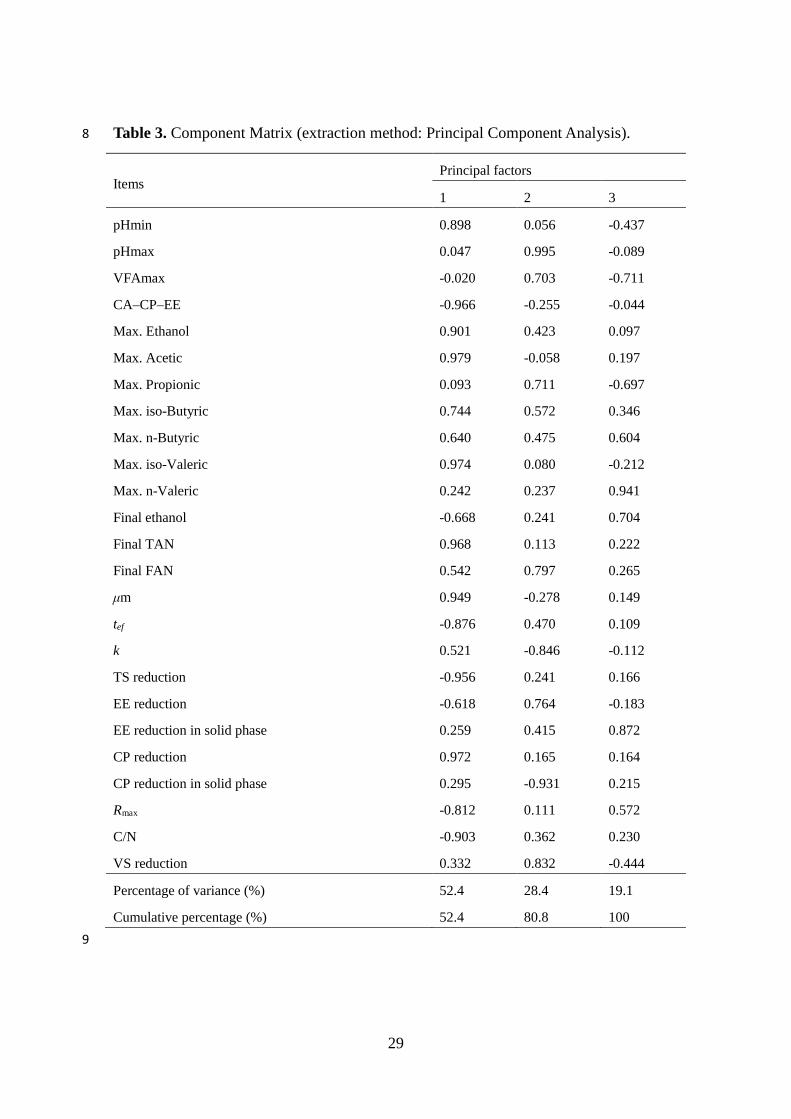
A PCA was carried out on different chemical components and performance
parameters that could affect the biodegradation and biomethane yield of FW. The PCA
results for all the FW samples indicated that three significant components were
extracted, explaining 100% of the total variance in the matrix (Table 3). The first
factor (accounting for 52.4% of the total variance) was characterised by very high
loadings of CA–CP–EE, maximum concentrations of acetic and iso-Valeric acid, final
TAN concentration and the reduction of TS and proteins, contributing to steady
digestion and high methane yield. The second factor (accounting for 28.4% of the total
variance) was mainly associated with very high loadings of maximum pH values and
protein reduction in the solid phase of FW, and with moderate loadings of the

22
hydrolysis constant and VS reduction. This factor accounts for the increased alkalinity
of the digestion microenvironment in the digestion system. Factor 3 was characterized
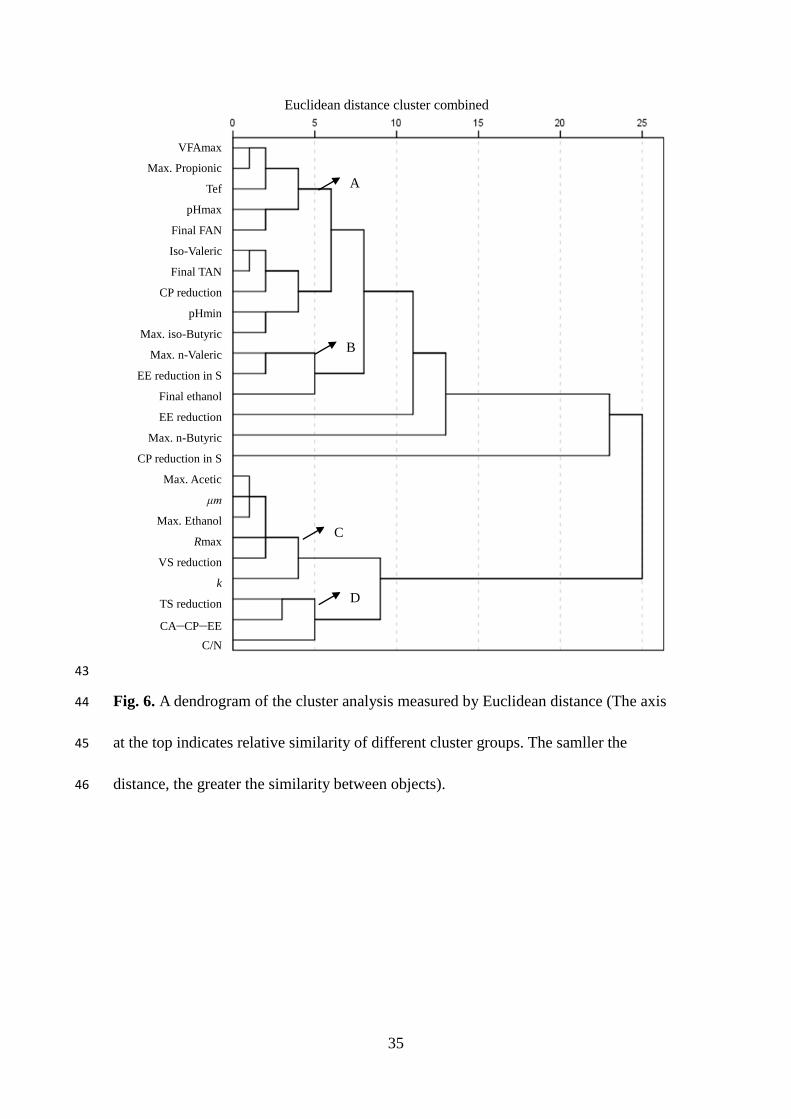
by the dominance of only one variable (maximum n-Valeric concentration). Cluster
analysis grouped the variables into four major distinct clusters; cluster A, B, C, and D
(Fig. 6). Clusters A and D, B, and C, correspond to factors 1, 2, and 3, of the PCA,
respectively (Table 3). The similarity of cluster analysis to PCA confirms the
interpretations drawn from the PCA.
Based on the Pearson correlation analysis and PCA, the maximum concentrations of
propionic acid and total VFA were closer and more correlated with the other variables
grouped in the Cluster A. For FW, high hydrolysis rates (k) correspond with high μm,
low tef and low methane yield, thus, appropriate organics hydrolysis could lead to high
methane production. The maximum concentrations of VFA and propionic acid were
significantly, positively correlated with the variables, and had a moderate correlation
with the maximum iso-Butyric acid concentration in Cluster A. Thus, higher VFA and
propionic acid concentrations indicate higher buffering capacity, protein reduction and
methane production, however, high concentrations of VFA or propionic acid do not
necessarily indicate that the AD process is balanced, due to positive correlations with
FAN and longer digestion durations when VFA and propionic acid concentrations were
lower than 1560 and 1172 mg/L, respectively. Table 3. Fig. 6.
In addition, further correlations were achieved between the CA-CP-EE ratio and
parameters that included digestion performance, process kinetics, and biodegradability,

23
compared to those with the C/N ratio. No significant correlation was found between
the C/N ratios and the maximum values of pH, VFA and propionic acid, final FAN, and
EE reduction in the solid phase; however, these process parameters, which had major
influences on digestion performance and were monitored frequently, had a significant
relationship with the CA-CP-EE ratio. A significant correlation was found between
these two ratios, and greater similarity was exhibited based on the cluster analysis due
to lower Euclidean distance (Fig. 6). Furthermore, chemically speaking, the C/N ratio
is the ratio of the mass of carbon to the mass of nitrogen in a substance, however, only
proteins contain nitrogen, while both carbohydrates and lipids contain carbon. In this
case, the CA-CP-EE ratio would be more appropriate when being considered as an
indicator affecting digestion performance (e.g., biomethane production). In this study,
FW with a CA-CP-EE ratio higher than 1.89 (CA higher than 8.3%, CP lower than
5.0%, and EE lower than 5.6%) achieved better digestion performance.
4. Conclusions
The CA-CP-EE ratio was a critical parameter, correlating with performance
parameters, thus affecting methane yield and final reduction of organics. Controlling
the CA-CP-EE ratio higher than 1.89 (CA higher than 8.3%, CP lower than 5.0%, and
EE lower than 5.6%) maintained stable digestion with higher methane production
(385–627 mL/gVS), shorter digestion retention (196–409 h), and a methane
bioconversion efficiency of COD (78–86%). The CA-CP-EE ratio could be used as an
important indicator for digestion performance. To effectively evaluate organic
24
reduction, the removal efficiency of organics in both the solid phase and the total FW
should be considered.
E-supplementary data for this work can be found in e-version of this paper online.
Acknowledgements
This work was supported by the China Scholarship Council (CSC No. 201606210435).
References
1. Alibardi, L., Cossu, R., 2016. Effects of carbohydrate, protein and lipid content of organic waste on
hydrogen production and fermentation products. Waste Management, 47, 69-77.
2. Alves, M.M., Pereira, M.A., Sousa, D.Z., Cavaleiro, A.J., Picavet, M., Smidt, H., Stams, A.J., 2009.
Waste lipids to energy: how to optimize methane production from long‐chain fatty acids (LCFA).
Microbial Biotechnology, 2, 538-550.
3. American, P.H.A., American, W.W.A., Water, P.C.F., Water, E.F., 1915. Standard methods for the
examination of water and wastewater. American Public Health Association.
4. Angelidaki, I., Sanders, W., 2004. Assessment of the anaerobic biodegradability of macropollutants.
Reviews in Environmental Science and Biotechnology, 3, 117-129.
5. Astals, S., Batstone, D.J., Mata-Alvarez, J., Jensen, P.D., 2014. Identification of synergistic impacts
during anaerobic co-digestion of organic wastes. Bioresource Technology, 169, 421-427.
6. Breure, A.M., Mooijman, K.A., Van Andel, J.G., 1986. Protein degradation in anaerobic digestion:
influence of volatile fatty acids and carbohydrates on hydrolysis and acidogenic fermentation of gelatin.
Applied Microbiology and Biotechnology, 24, 426-431.
7. Brown, D., Li, Y., 2013. Solid state anaerobic co-digestion of yard waste and food waste for biogas
production. Bioresource Technology, 127, 275-280.
8. Cho, J.K., Park, S.C., Chang, H.N., 1995. Biochemical methane potential and solid state anaerobic
digestion of Korean food wastes. Bioresource Technology, 52, 245-253.
9. Cirne, D.G., Paloumet, X., Bj Rnsson, L., Alves, M.M., Mattiasson, B., 2007. Anaerobic digestion of
lipid-rich waste—Effects of lipid concentration. Renewable Energy, 32, 965-975.
10. Dahiya, S., Sarkar, O., Swamy, Y.V., Mohan, S.V., 2015. Acidogenic fermentation of food waste for
volatile fatty acid production with co-generation of biohydrogen. Bioresource Technology, 182, 103-113.
11. De Gioannis, G., Muntoni, A., Polettini, A., Pomi, R., 2013. A review of dark fermentative hydrogen
production from biodegradable municipal waste fractions. Waste Management, 33, 1345-1361.
12. Donoso-Bravo, A., Pérez-Elvira, S.I., Fdz-Polanco, F., 2010. Application of simplified models for
anaerobic biodegradability tests. Evaluation of pre-treatment processes. Chemical Engineering Journal,
160, 607-614.
13. Jin, Y., Chen, T., Chen, X., Yu, Z., 2015. Life-cycle assessment of energy consumption and
environmental impact of an integrated food waste-based biogas plant. Applied Energy, 151, 227-236.
14. Jones Jr, J.B., 1991. Kjeldahl method for nitrogen determination. Kjeldahl method for nitrogen
determination.
15. Kafle, G.K., Kim, S.H., 2013. Anaerobic treatment of apple waste with swine manure for biogas
production: Batch and continuous operation. Applied Energy, 103, 61-72.
16. Kobayashi, T., Xu, K., Li, Y., Inamori, Y., 2012. Evaluation of hydrogen and methane production
from municipal solid wastes with different compositions of fat, protein, cellulosic materials and the other

25
carbohydrates. International Journal of Hydrogen Energy, 37, 15711-15718.
17. Koch, K., Helmreich, B., Drewes, J.R.E., 2015. Co-digestion of food waste in municipal wastewater
treatment plants: Effect of different mixtures on methane yield and hydrolysis rate constant. Applied
Energy, 137, 250-255.
18. Kuang, Y., Pullammanappallil, P., Lepesteur, M., Ho, G.E., 2006. Recovery of oleate‐inhibited
anaerobic digestion by addition of simple substrates. Journal of Chemical Technology and Biotechnology,
81, 1057-1063.
19. Langrish, T.A., Handbook of Nutraceuticals Volume II Scale-Up, Processing and Automation.
20. Li, L., Kong, X., Yang, F., Li, D., Yuan, Z., Sun, Y., 2012. Biogas production potential and kinetics
of microwave and conventional thermal pretreatment of grass. Applied Biochemistry and Biotechnology,
166, 1183-1191.
21. Li, Y., Jin, Y., Li, J., Li, H., Yu, Z., 2016. Effects of pungency degree on mesophilic anaerobic
digestion of kitchen waste. Applied Energy, 181, 171-178.
22. Lin, J., Zuo, J., Gan, L., Li, P., Liu, F., Wang, K., Chen, L., Gan, H., 2011. Effects of mixture ratio on
anaerobic co-digestion with fruit and vegetable waste and food waste of China. JOURNAL OF
ENVIRONMENTAL SCIENCES, 23, 1403-1408.
23. Mata-Alvarez, J., Dosta, J., Romero-Güiza, M.S., Fonoll, X., Peces, M., Astals, S., 2014. A critical
review on anaerobic co-digestion achievements between 2010 and 2013. Renewable and Sustainable
Energy Reviews, 36, 412-427.
24. Mawson, A.J., Earle, R.L., Larsen, V.F., 1991. Degradation of acetic and propionic acids in the
methane fermentation. Water Research, 25, 1549-1554.
25. McInerney, M.J., 1988. Anaerobic hydrolysis and fermentation of fats and proteins. Biology of
anaerobic microorganisms, 38, 373-415.
26. Miron, Y., Zeeman, G., Van Lier, J.B., Lettinga, G., 2000. The role of sludge retention time in the
hydrolysis and acidification of lipids, carbohydrates and proteins during digestion of primary sludge in
CSTR systems. Water Research, 34, 1705-1713.
27. Noike, T., Endo, G., Chang, J.E., Yaguchi, J.I., Matsumoto, J.I., 1985. Characteristics of carbohydrate
degradation and the rate‐limiting step in anaerobic digestion. Biotechnology and Bioengineering, 27,
1482-1489.
28. Pagliaccia, P., Gallipoli, A., Gianico, A., Montecchio, D., Braguglia, C.M., 2016. Single stage
anaerobic bioconversion of food waste in mono and co-digestion with olive husks: Impact of thermal
pretreatment on hydrogen and methane production. International Journal of Hydrogen Energy, 41,
905-915.
29. Paritosh, K., Kushwaha, S.K., Yadav, M., Pareek, N., Chawade, A., Vivekanand, V., 2017. Food
Waste to Energy: An Overview of Sustainable Approaches for Food Waste Management and Nutrient
Recycling. Biomed Research International, 2017.
30. Pavlostathis, S.G., Giraldo Gomez, E., 1991. Kinetics of anaerobic treatment: a critical review.
Critical Reviews in Environmental Science and Technology, 21, 411-490.
31. Rajagopal, R., Massé, D.I., Singh, G., 2013. A critical review on inhibition of anaerobic digestion
process by excess ammonia. Bioresource Technology, 143, 632-641.
32. Shao, L., Wang, T., Li, T., Lü, F., He, P., 2013. Comparison of sludge digestion under aerobic and
anaerobic conditions with a focus on the degradation of proteins at mesophilic temperature. Bioresource
Technology, 140, 131-137.

26
33. Siles, J.A., Brekelmans, J., Martin, M.A., Chica, A.F., Martin, A., 2010. Impact of ammonia and
sulphate concentration on thermophilic anaerobic digestion. Bioresource Technology, 101, 9040-9048.
34. Sun, Y., Wang, D., Yan, J., Qiao, W., Wang, W., Zhu, T., 2014. Effects of lipid concentration on
anaerobic co-digestion of municipal biomass wastes. Waste Management, 34, 1025-1034.
35. Tang, Y., Koike, Y., Liu, K., An, M., Morimura, S., Wu, X., Kida, K., 2008. Ethanol production from
kitchen waste using the flocculating yeast Saccharomyces cerevisiae strain KF-7. Biomass and Bioenergy,
32, 1037-1045.
36. Wagner, A.O., Lins, P., Malin, C., Reitschuler, C., Illmer, P., 2013. Impact of protein-, lipid-and
cellulose-containing complex substrates on biogas production and microbial communities in batch
experiments. Science of the Total Environment, 458, 256-266.
37. Wan, C., Zhou, Q., Fu, G., Li, Y., 2011. Semi-continuous anaerobic co-digestion of thickened waste
activated sludge and fat, oil and grease. Waste Management, 31, 1752-1758.
38. Wang, K., Yin, J., Shen, D., Li, N., 2014. Anaerobic digestion of food waste for volatile fatty acids
(VFAs) production with different types of inoculum: effect of pH. Bioresource Technology, 161,
395-401.
39. Wyman, C., 1996. Handbook on bioethanol: production and utilization. CRC press.
40. Xie, S., Hai, F.I., Zhan, X., Guo, W., Ngo, H.H., Price, W.E., Nghiem, L.D., 2016. Anaerobic
co-digestion: A critical review of mathematical modelling for performance optimization. Bioresource
Technology, 222, 498-512.
41. Yang, G., Zhang, P., Zhang, G., Wang, Y., Yang, A., 2015. Degradation properties of protein and
carbohydrate during sludge anaerobic digestion. Bioresource Technology, 192, 126-130.
42. Yin, J., Wang, K., Yang, Y., Shen, D., Wang, M., Mo, H., 2014. Improving production of volatile
fatty acids from food waste fermentation by hydrothermal pretreatment. Bioresource Technology, 171,
323-329.
43. Yuan, H., Zhu, N., 2016. Progress in inhibition mechanisms and process control of intermediates and
by-products in sewage sludge anaerobic digestion. Renewable and Sustainable Energy Reviews, 58,
429-438.
44. Zhang, B., Zhang, L.L., Zhang, S.C., Shi, H.Z., Cai, W.M., 2005. The influence of pH on hydrolysis
and acidogenesis of kitchen wastes in two-phase anaerobic digestion. Environmental Technology, 26,
329-340.
45. Zhang, C., Su, H., Baeyens, J., Tan, T., 2014. Reviewing the anaerobic digestion of food waste for
biogas production. Renewable and Sustainable Energy Reviews, 38, 383-392.
46. Zhang, C., Xiao, G., Peng, L., Su, H., Tan, T., 2013. The anaerobic co-digestion of food waste and
cattle manure. Bioresource Technology, 129, 170-176.
47. Zhang, L., Lee, Y., Jahng, D., 2011. Anaerobic co-digestion of food waste and piggery wastewater:
focusing on the role of trace elements. Bioresource Technology, 102, 5048-5059.
48. Zhang, R., El-Mashad, H.M., Hartman, K., Wang, F., Liu, G., Choate, C., Gamble, P., 2007.
Characterization of food waste as feedstock for anaerobic digestion. Bioresource Technology, 98,
929-935.
27
Table 1
Table 1 (a). Characteristics of FW compositions for the AD experiments. 2
Parameters No. 1 No. 2 No. 3 No. 4 No. 5 No. 6 No. 7 No. 8 No. 9 No. 10 No. 11
TS (%) 19.1 17.2 20.5 19.7 19.6 20.0 20.8 19.2 20.9 24.7 18.7
VS (% TS) 97.0 97.2 96.5 96.7 96.5 96.3 95.9 96.1 95.8 95.2 95.3
CA a (%) 10.8 9.4 11.0 10.1 9.3 9.2 8.3 7.6 7.7 8.1 3.1
CP b (%) 4.0 4.5 3.6 4.3 4.6 4.6 5.0 5.2 5.3 5.3 7.9
EE c (%) 3.7 2.9 5.3 4.7 5.0 5.5 6.6 5.6 7.1 10.2 6.9
C (% TS) 45.5 45.6 46.9 46.5 47.1 47.5 48.8 48.4 49.4 51.5 51.5
H (% TS) 6.8 6.8 7.1 7.0 7.0 7.1 7.3 7.2 7.4 7.7 7.5
N (% TS) 2.6 3.4 2.6 2.8 3.1 3.1 3.3 3.8 3.5 2.9 5.3
C/N 17.7 13.4 17.8 16.8 15.4 15.5 14.7 12.7 14.0 18.1 9.7
CA–CP–EE 2.9:1.1:1 3.3:1.6:1 2.1:0.7:1 2.2:0.9:1 1.9:0.9:1 1.7:0.9:1 1.2:0.8:1 1.4:0.9:1 1.1:0.7:1 0.8:0.5:1 0.4:1.1:1
a CA: carbohydrate; b CP: crude protein; c EE: ether extract 3
Table 1 (b). Characteristics of the inoculum. 4
Parameter pH TS (%) VS (%) Ammonia (mg/L) C/N
Value 7.34 3.65% 2.42% 1123 7.01
28
Table 2. Parameters of the kinetic models obtained from the methane yield of FW with different compositions in terms of CA: CP: EE. 5
CA–CP–EE B = B0 × {1 – exp [-μm × (t - λ) / B0]} B = B0 × [1 – exp (-k t)]
R2 μm (mL/gVS h) λ (h) B0 (mL/gVS) B0/M a tef (h) b R2 k (d-1) B0 (mL/gVS) B0/M a
2.9:1.1:1 0.9845 2.66 0.00 536.19 1.05 343 0.9731 0.14 522.23 1.03
3.3:1.6:1 0.9619 8.07 0.00 441.23 0.96 231 0.9587 0.49 439.84 0.96
2.1:0.7:1 0.9867 6.04 0.00 531.30 0.99 245 0.9830 0.30 528.61 0.99
2.2:0.9:1 0.9961 5.75 0.00 537.37 1.00 212 0.9940 0.27 535.56 1.00
1.9:0.9:1 0.9958 5.86 0.00 533.01 1.01 202 0.9937 0.28 531.34 1.00
1.7:0.9:1 0.9870 6.98 0.00 544.95 0.99 196 0.9779 0.36 541.62 0.99
1.2:0.8:1 0.9489 2.94 0.00 579.26 1.03 369 0.8830 0.21 544.22 0.96
1.4:0.9:1 0.9243 3.33 0.00 539.13 1.00 363 0.8611 0.28 510.68 0.94
1.1:0.7:1 0.9480 2.72 0.00 559.92 1.03 383 0.8845 0.21 523.36 0.96
0.8:0.5:1 0.9801 2.56 0.00 678.23 1.08 409 0.9399 0.14 628.13 1.00
0.4:1.1:1 0.9588 3.89 0.00 569.06 0.99 348 0.9264 0.24 550.71 0.96
a B0/M: predicted methane production by kinetic models (B0) / measured methane yield during the experiment. 6
b tef: calculated by subtracting the lag time (λ) from the time taken for 90% methane production (t90). 7
29
Table 3. Component Matrix (extraction method: Principal Component Analysis). 8
Items Principal factors
1 2 3
pHmin 0.898 0.056 -0.437
pHmax 0.047 0.995 -0.089
VFAmax -0.020 0.703 -0.711
CA–CP–EE -0.966 -0.255 -0.044
Max. Ethanol 0.901 0.423 0.097
Max. Acetic 0.979 -0.058 0.197
Max. Propionic 0.093 0.711 -0.697
Max. iso-Butyric 0.744 0.572 0.346
Max. n-Butyric 0.640 0.475 0.604
Max. iso-Valeric 0.974 0.080 -0.212
Max. n-Valeric 0.242 0.237 0.941
Final ethanol -0.668 0.241 0.704
Final TAN 0.968 0.113 0.222
Final FAN 0.542 0.797 0.265
μm 0.949 -0.278 0.149
tef -0.876 0.470 0.109
k 0.521 -0.846 -0.112
TS reduction -0.956 0.241 0.166
EE reduction -0.618 0.764 -0.183
EE reduction in solid phase 0.259 0.415 0.872
CP reduction 0.972 0.165 0.164
CP reduction in solid phase 0.295 -0.931 0.215
Rmax -0.812 0.111 0.572
C/N -0.903 0.362 0.230
VS reduction 0.332 0.832 -0.444
Percentage of variance (%) 52.4 28.4 19.1
Cumulative percentage (%) 52.4 80.8 100
9
30
0 5 10 15 20 25 30
7.2
7.4
7.6
7.8
8.0
pH
RT (d)
2.9 :1.1 :1
3.3 :1.6 :1
2.1 :0.7 :1
2.2 :0.9 :1
1.9 :0.9 :1
1.7 :0.9 :1
1.2 :0.8 :1
1.4 :0.9 :1
1.1 :0.7 :1
0.8 :0.5 :1
0.4 :1.1 :1
0 1 2 37.4
7.6
7.8
8.0
pH
RT (d)
0 5 10 15 20 25 30
0
300
600
900
1200
1500
2.9:1.1:1 3.3:1.6:1
2.1:0.7:1 2.2:0.9:1
1.9:0.9:1 1.7:0.9:1
1.2:0.8:1 1.4:0.9:1
1.1:0.7:1 0.8:0.5:1
0.4:1.1:1
VF
A c
on
ce
ntr
atio
n (
mg
/L)
RT (d)
0 5 10 15 20 25 30
0
100
200
300
400
500
2.9:1.1:1 3.3:1.6:1
2.1:0.7:1 2.2:0.9:1
1.9:0.9:1 1.7:0.9:1
1.2:0.8:1 1.4:0.9:1
1.1:0.7:1 0.8:0.5:1
0.4:1.1:1
Ace
tic a
cid
co
nce
ntr
atio
n (
mg
/L)
RT (d)
0 5 10 15 20 25 30
0
300
600
900
1200
1500
2.9:1.1:1 3.3:1.6:1
2.1:0.7:1 2.2:0.9:1
1.9:0.9:1 1.7:0.9:1
1.2:0.8:1 1.4:0.9:1
1.1:0.7:1 0.8:0.5:1
0.4:1.1:1
Pro
pio
nic
acid
co
nce
ntr
atio
n (
mg
/L)
RT (d)
(a) (b)
(c) (d)
Figures 10
11
Fig. 1. The impact of organic compositions (CA: CP: EE) on pH (a), VFA 12
concentration (b), and VFA compositions (c, d) during the digestion of FW. 13
14
31
15
16
17
18
19
20
21
22
23
24
25
26
27
Fig. 2. Varying concentrations of ethanol (a), TAN (b), and FAN (c) during AD of FW 28
and the development of the final methane yields, maximum specific methane 29
production (Rmax) and the M/T ratio with different compositions in terms of 30
CA–CP–EE. 31
32
(c)
0 5 10 15 20 25 30
0
30
60
90
120
150
2.9:1.1:1 3.3:1.6:1
2.1:0.7:1 2.2:0.9:1 1.9:0.9:1
1.7:0.9:1 1.2:0.8:1 1.4:0.9:1
1.1:0.7:1 0.8:0.5:1 0.4:1.1:1
FA
N (
mg
/L)
RT (d)
(b)
0 5 10 15 20 25 30
800
1200
1600
2000
2400
2800
2.9:1.1:1 3.3:1.6:1
2.1:0.7:1 2.2:0.9:1 1.9:0.9:1
1.7:0.9:1 1.2:0.8:1 1.4:0.9:1
1.1:0.7:1 0.8:0.5:1 0.4:1.1:1
TA
N (
mg
/L)
RT (d)
0 5 10 15 20 25 30
0
100
200
300
400
500
2.9:1.1:1 3.3:1.6:1
2.1:0.7:1 2.2:0.9:1
1.9:0.9:1 1.7:0.9:1
1.2:0.8:1 1.4:0.9:1
1.1:0.7:1 0.8:0.5:1
0.4:1.1:1
Eth
an
ol co
nce
ntr
atio
n (
mg
/L)
RT (d)
(a)
(d) 2.9
:1.1
:1
3.3
:1.6
:1
2.1
:0.7
:1
2.2
:0.9
:1
1.9
:0.9
:1
1.7
:0.9
:1
1.2
:0.8
:1
1.4
:0.9
:1
1.1
:0.7
:1
0.8
:0.5
:1
0.4
:1.1
:1
100
200
300
400
500
600
700
Me
tha
ne
yie
ld (
mL
/ g
VS
)
CH4
0
20
40
60
80
Rm
eth
an
e (
mL
/g V
S h
)
RCH4
80
85
90
95
100
M / T
(%
)
Percentage
32
Fig. 3. The impact of composition (CA–CP–EE) on the concentrations of TS (a) and 33
VS (b) and the reduction of TS (c) and VS (d) during 30 days of digestion. 34
35
0 5 10 15 20 25 30
6
9
12
15
TS
co
nce
ntr
atio
n (
%)
RT (d)
2.9:1.1:1 3.3:1.6:1
2.1:0.7:1 2.2:0.9:1 1.9:0.9:1
1.7:0.9:1 1.2:0.8:1 1.4:0.9:1
1.1:0.7:1 0.8:0.5:1 0.4:1.1:1
(a)
0 5 10 15 20 25 30
50
55
60
65
70
75
80
2.9:1.1:1 3.3:1.6:1
2.1:0.7:1 2.2:0.9:1 1.9:0.9:1
1.7:0.9:1 1.2:0.8:1 1.4:0.9:1
1.1:0.7:1 0.8:0.5:1 0.4:1.1:1
VS
co
nce
ntr
atio
n (
% T
S)
RT (d)
(b)
0 5 10 15 20 25 30
10
20
30
40
50
60
70
2.9:1.1:1 3.3:1.6:1
2.1:0.7:1 2.2:0.9:1 1.9:0.9:1
1.7:0.9:1 1.2:0.8:1 1.4:0.9:1
1.1:0.7:1 0.8:0.5:1 0.4:1.1:1TS
re
du
ctio
n (
%)
RT (d)
(c)
0 5 10 15 20 25 30
0
20
40
60
80
2.9:1.1:1 3.3:1.6:1
2.1:0.7:1 2.2:0.9:1 1.9:0.9:1
1.7:0.9:1 1.2:0.8:1 1.4:0.9:1
1.1:0.7:1 0.8:0.5:1 0.4:1.1:1VS
re
du
ctio
n (
% T
S)
RT (d)
(d)
33
Fig. 4. The impact of composition (CA: CP: EE) on lipid concentrations and 36
reductions during 30 days of digestion. 37
38
(b)
0 5 10 15 20 25 30
0
5
10
15
20
2.9:1.1:1 3.3:1.6:1
2.1:0.7:1 2.2:0.9:1 1.9:0.9:1
1.7:0.9:1 1.2:0.8:1 1.4:0.9:1
1.1:0.7:1 0.8:0.5:1 0.4:1.1:1
EE
co
nte
nt in
so
lid p
ha
se
(%
TS
)
RT (d)
0 5 10 15 20 25 30
0
20
40
60
80
100
2.9:1.1:1 3.3:1.6:1
2.1:0.7:1 2.2:0.9:1 1.9:0.9:1
1.7:0.9:1 1.2:0.8:1 1.4:0.9:1
1.1:0.7:1 0.8:0.5:1 0.4:1.1:1
To
tal E
E r
ed
uctio
n (
% T
S)
RT (d)
(c)
0 5 10 15 20 25 30
40
60
80
100
2.9:1.1:1 3.3:1.6:1
2.1:0.7:1 2.2:0.9:1 1.9:0.9:1
1.7:0.9:1 1.2:0.8:1 1.4:0.9:1
1.1:0.7:1 0.8:0.5:1 0.4:1.1:1
EE
re
du
ctio
n in
so
lid p
ha
se
(%
)
RT (d)
(d)
(a)
0 5 10 15 20 25 30
0
5
10
15
20
2.9:1.1:1 3.3:1.6:1
2.1:0.7:1 2.2:0.9:1 1.9:0.9:1
1.7:0.9:1 1.2:0.8:1 1.4:0.9:1
1.1:0.7:1 0.8:0.5:1 0.4:1.1:1
To
tal E
E c
on
ten
t (%
TS
)
RT (d)
34
39
Fig. 5. The impact of composition (CA: CP: EE) on the concentrations and reductions 40
of protein during 30 days of digestion (a, b, c, d); various fractions of COD as a 41
function of organic compositions at the end of digestion (e). 42
0%
20%
40%
60%
80%
100%
Per
centa
ge
CA–CP–EEMethane VFA+Ethanol Hydrolysates Particulate biopolymers
0 5 10 15 20 25 30
10
15
20
25
30
2.9:1.1:1 3.3:1.6:1
2.1:0.7:1 2.2:0.9:1 1.9:0.9:1
1.7:0.9:1 1.2:0.8:1 1.4:0.9:1
1.1:0.7:1 0.8:0.5:1 0.4:1.1:1
To
tal C
P c
on
ten
t (%
TS
)
RT (d)
(a)
0 5 10 15 20 25 30
20
30
40
50
60
70
2.9:1.1:1 3.3:1.6:1
2.1:0.7:1 2.2:0.9:1 1.9:0.9:1
1.7:0.9:1 1.2:0.8:1 1.4:0.9:1
1.1:0.7:1 0.8:0.5:1 0.4:1.1:1
To
tal C
P r
ed
uctio
n (
% T
S)
RT (d)
(c)
0 5 10 15 20 25 30
10
20
30
40
50
60
70
2.9:1.1:1 3.3:1.6:1
2.1:0.7:1 2.2:0.9:1 1.9:0.9:1
1.7:0.9:1 1.2:0.8:1 1.4:0.9:1
1.1:0.7:1 0.8:0.5:1 0.4:1.1:1CP
re
du
ctio
n in
so
lid p
ha
se
(%
TS
)
RT (d)
(d)
0 5 10 15 20 25 30
10
15
20
25
30
2.9:1.1:1 3.3:1.6:1
2.1:0.7:1 2.2:0.9:1 1.9:0.9:1
1.7:0.9:1 1.2:0.8:1 1.4:0.9:1
1.1:0.7:1 0.8:0.5:1 0.4:1.1:1
CP
co
nte
nt in
so
lid p
ha
se
(%
TS
)
RT (d)
(b)
e
35
43
Fig. 6. A dendrogram of the cluster analysis measured by Euclidean distance (The axis 44
at the top indicates relative similarity of different cluster groups. The samller the 45
distance, the greater the similarity between objects). 46
VFAmax
Max. Propionic
Tef
pHmax
Final FAN
Iso-Valeric
Final TAN
CP reduction
pHmin
Max. iso-Butyric
Max. n-Valeric
EE reduction in S
Final ethanol
EE reduction
Max. n-Butyric
CP reduction in S
Max. Acetic
μm
Max. Ethanol
Rmax
VS reduction
k
TS reduction
CA–CP–EE
C/N
Euclidean distance cluster combined
A
B
C
D