Embed Size (px)
Citation preview

EFFECTS OF PLANT DENSITY AND PHOSPHATE LEVELS ON
GROWTH, YIELD AND YIELD COMPONENTS OF FIELD BEANS
PHASEOLUS VULGARIS L. f /
by
GRACE WANGARI MBUGUA
ctr* o*
A thesis presented to the Faculty of Agriculture
in the University of Nairobi in partial fulfilment of
the requirements for the degree of MASTER OF SCIENCE IN AGRONOMY.
DEPARTMENT OF CROP SCIENCE
NAIROBI, KENYA.
1983
(ii)
D E C L A R A T I O N
This is my original work and has not been
presented for a degree in any other University.
SignedGrace Wangari^Mbugua
Date
This thesis has been submitted for
examination with my approval as a University
Supervisor.
SignedDr. D.R. Basiime
Date A(>. n s z
(ii)
D E C L A R A T I O N
This is my original work and has not been
presented for a degree in any other University.
Signed * C UGrace WangarivMbuguaX
Date ^ _lSI.5.This thesis has been submitted for
examination with my approval as a University
Supervisor.
SignedDr. D.R. Basiime
Aj nszDate

(iii)
D E D I C A T I O N/
To Mrs Leah N. Ngini, my teacher and
friend, whose assistance, encouragement and
inspiration during my High School days enabled
me to pursue education up to the University.
(iv)
A C K N O W L E D G E M E N T S
I am very grateful to the Ministry of Agriculture
(Kenya) for providing the scholarship, and to the University of Nairobi for providing the facilities
which enabled this work to be carried out.
I express my sincere gratitude to Dr. David
R. Basiime of Crop Science Department, University of
Nairobi under whose supervision this work was carried
out. Hi$ patience, untiring guidance, helpful
suggestions and constructive criticisms are greatly
appreciated.
Thanks also go to the staff of Crop Science
Department for both their technical and general
assistance, and to the staff of Meteorological
Department, Dagoretti for providing the rainfall and
temperature data. Special thanks go to my son Moses
for his patience during long hours of my absence
throughout the study. Last but not least the work
of Mrs Jane N. Mbugua who typed this thesis is very
much appreciated.

(V)
A B S T R A C T
Field bean (Phaseolus vulgaris) crown mainly for its protein rich dry bean seeds, is the most important
legume and the second most important crop in Kenya.
Bean yields have been shown to be increased by
phosphate fertilizers particularly in areas which
are low in available phosphorus which is the case
in most farming areas of Kenya. Increasing bean
plant populations under optimal growth conditions
has resulted in increase in bean yields mainly due
to the increase in number of pods per unit area.
The objective of this study was to investigate the
effects of phosphate fertilizer, plant population
density, and population density x fertilizer
interaction on growth and yield of Phaseolus vulgaris.
Two experiments were conducted at the
University of Nairobi, Kabete in 1979 and 1980.
Kabete has an annual average rainfall of 950 mm and
mean maximum and minimum temperatures of 23°C and
13°C respectively. The soils are deep red friable
loams.
Bean seeds (cultivar Rose Coco) were planted
at 25 x 25 cm, 20 x 20 cm, 15 x 15 cm and 10 x 10 cm
to give population densities of 160,000, 250,000,
(vi)
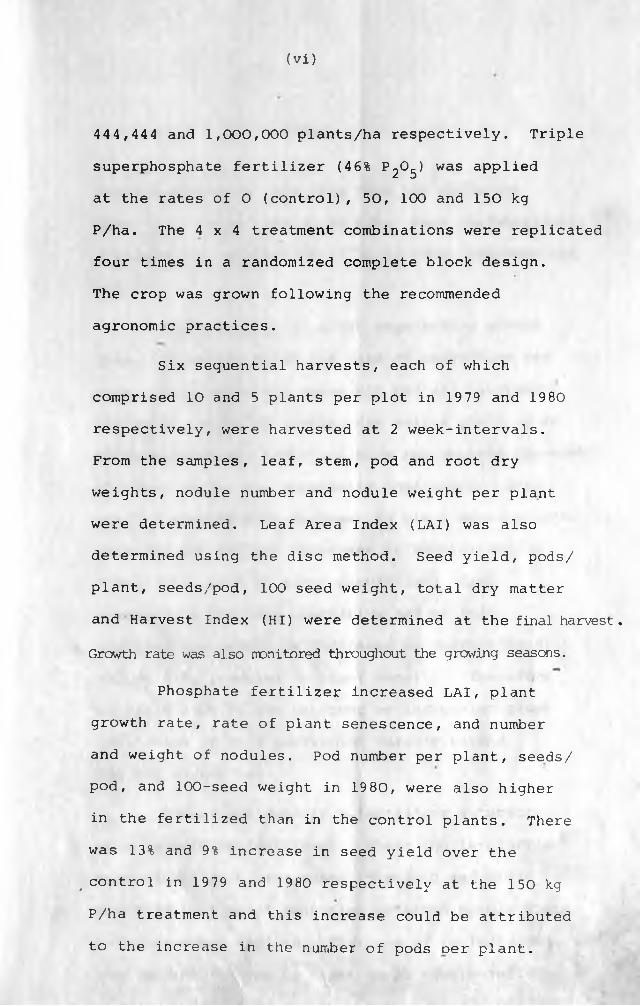
444,444 and 1,000,000 plants/ha respectively. Triple
superphosphate fertilizer (46% p2°5 ̂ was aPPlie<3 at the rates of 0 (control), 50, 100 and 150 kg
P/ha. The 4 x 4 treatment combinations were replicated
four times in a randomized complete block design.
The crop was grown following the recommended
agronomic practices.
Six sequential harvests, each of which
comprised 10 and 5 plants per plot in 1979 and 1980
respectively, were harvested at 2 week-intervals.
From the samples, leaf, stem, pod and root dry
weights, nodule number and nodule weight per plant
were determined. Leaf Area Index (LAI) was also
determined using the disc method. Seed yield, pods/
plant, seeds/pod, 100 seed weight, total dry matter
and Harvest Index (HI) were determined at the final harvest*
Growth rate was also monitored throughout the growing seasons.
Phosphate fertilizer increased LAI, plant
growth rate, rate of plant senescence, and number
and weight of nodules. Pod number per plant, seeds/
pod, and 100-seed weight in 1980, were also higher
in the fertilized than in the control plants. There
was 13% and 9% increase in seed yield over the
, control in 1979 and 1980 respectively at the 150 kg
P/ha treatment and this increase could be attributed
to the increase in the number of pods T3er plant.

(vii)
Yield differences resulting from the different
fertilizer rates (50-150 kg P/ha) were insignificant,
consequently application of 50 kg P/ha appeared the
best.
With increase in plant population, growth
rate, dry matter yield and rate of senescence per
plant, pods/plant and seeds per pod all decreased,
while LAI, rates of growth, dry matter yield, rate
of senescence and number of pods per hectare increased.
100-seed weight was apparently unaffected. Seed
yield decreased with increase in plant density hence
this did not reflect increases in vegetative dry
matter with rise in plant population. High
populations favoured vegetative rather than
reproductive growth as indicated by decreasing HI
values with increase in plant density. Therefore
no yield benefit was obtained by increasing plant
population of this particular variety beyond
160,000 plants/ha.
Population density x fertilizer interactions
were largely insignificant. Where the interactions
were significant, responses in growth and yield to
the different plant densities occurred mainly where
fertilizer was applied. This seemed to indicate
that phosphorus can be limiting in Kabete soils.
C O N T E N T S
Page
DECLARATION................................ ii
DEDICATION................................. 1 1 1
ACKNOWLEDGEMENT........................... iv
ABSTRACT................................... V '
LIST OF FIGURES........................... xv
LIST OF TABLES............................ xvii
LIST OF APPENDIX TABLES................... xxi
1. CHAPTER ONE: INTRODUCTION................ 1
1.1 Importance of Legumes in Kenya............ 1i
$L.2 Effect of phosphate fertilizer on yieldoof field beans............................
1.3 Effect of Plant Population Density on Yieldoof Field Beans.............................
1.4 Popoulation Density x FertilizerInteraction................................ ^
2. CHAPTER TWO: LITERATURE REVIEW.......... 6
2.1 Effect of Plant Density on Bean Yield.... ®
2.2 Effect of Plant Arrangement on Yield....
2.3 Effect of Plant Density on YieldComponents................................ ®
2.4 Some Problems Encountered with HighPlant Densities......................... ^
2.5 Effect of Phosphate Fertilizer on Yield.. ^2.6. Effect of Phosphate Fertilizer on Yield
Components................................ .14
2.7. Effect of Phosphate Fertilizer on Modulation..2.8- Population Density-Fertilizer Interaction..... 15
(viii)
Page
3. CHAPTER THREE:MATERIALS AND METHODS... 1 7
1 7‘3.1. The Experimental Site..................
3.2. Soils..................................
3.3. The Bean Variety Used in theExperiment.............................
3.4. Planting Methods...................... ^9
3.5. Sampling Techniques................... 242 83.6. Statistical Analysis.................. k
4. CHAPTER FOUR: RESULTS................ 29
294.1. Seasonal Differences..................
4.2. Effect of Phosphate Fertilizer onGrowth Rate............................
4.2.1. Leaf growth rate....................... 24
4.2.2. Stem growth rate....................... 35
4.2.3. Pod growth rate....................... 39
4.2.4. Root growth rate...................... 39
4.2.5. Rate of total dry matter increase.... 39
4.3. Effect of Phosphate Fertilizer onLeaf Area Index...................... 46
4.4. Effect of Phosphate Fertilizer on DryMatter................................ 4 /
4.4.1. Leaf dry matter....................... 47
4.4.2. Stem dry matter....................... 51
4.4.3. Pod dry matter....................... 54
4.4.4. Root dry matter...................... 54
(ix)
62
62
62
66
66
66
68
68
68
72
73
73
76
7880
82
(x)
4.4.5.
4.4.6.
4.5.
4.5.1.
4.5.2.
4.5.3.
4.6.
4.7.
4.8.
4.8.1.
4.8.2.
4.9.
4.9.1.
4.9.2.
4.9.3.
4.9.4.
4.9.5.
4.10.
Total dry matter....................
Total dry matter at harvest........
Effect of Phosphate Fertilizer on Yield Components....................
Number of pods per plant...........
Number of seeds per pod.............
100-Seed weight.....................
Effect of Phosphate Fertilizer on Seed Yield..........................
Effect of Phosphate Fertilizer on Harvest Index.......................Effect of Phosphate Fertilizer on Number and Weight of Nodules.......
Number of nodules per plant........
Nodule weight.......................
Plant Population Effects on the Rate of Growth......................
Leaf growth rate....................
Stem growth rate....................
Pod growth rate.....................
Root growth rate....................
Rate of total dry matter increase...
Effect of Plant Population on Leaf Area Index.........................

(xi) Page
4.11.
4.11.1.
4.11.2.
4.11.3.
4.11.4.
4.11.5.
4.11.6 .
Effect of Plant Population onDry Matter ........................
Leaf dry matter....................
Stem dry matter....................
Pod dry matter.....................
Root dry matter....................
Total dry matter...................
Total dry matter at • .
86
86
91
91
93-
93
98
4.12.
4.12.1.
4.12.2.
4.12.3.
Effect of Plant Population on Yield Components.........................
Number of pods.................. . . .
Number of seeds per pod............
100-Seed weight....................
98
98
102
102
4.13.
4.14.
4.15
4. 15.1.
Effect of Plant Population on Seed Yield.............................. 104
Effect of Plant Population on Harvest Index...............................
Interaction between Plant Population Density and Fertilizer..............
Stem growth rate: 15th week of growth: 1980................................ 104
4.15.2.
4.15.3.
4.15.4.
Leaf growth rate: 15th week ofgrowth: 19 80..................
Pod growth rate: 11th week ofgrowth: 19 79..................
106
106
Pod growth rate: 13th week of growth:1980................................. 108
(xii)
Pa2g
4.15.5. Pod growth rate: 15th week ofgrowth: 1980.... 108
4.15.6. Leaf Area Index: 1 1 th week ofgrowth: 1980... 108
4.15.7. Stem dry matter: 13th week ofgrowth: 1980... 110
4.15.8. Leaf dry growth:
matter: 1980...
13th week of1 1 0
4.15.9. Leaf dry growth:
matter: 1980...
15th week of1 1 2
4.15.10. Root dry growth:
matter: 1980 ..
13th week of112
4.15.11. Pod dry growth :
matter: 1980...
9th week of112
4.15.12. Pod dry matter: 13th week ofgrowth: 1980___ 114
4.15.13. Total dry matter growth : 19 80...
: 13th week of 114
4.15.14. No. of pods per of growth: 1980
plant: 13th week 117
■>__4.15.15. Nodule weight: 1980............
4th week of growth: 117
v
5.
5.1.
5.2.
5.2.1.
120CHAPTER FIVE: DISCUSSION...........
Seasonal Differences................ 120 \
Phosphate Fertilizer Effects.....
Effect of phosphate fertilizer on rate of growth and accumulated dry dry matter........................
121

(xiii)
Page
5.2.2. Effect of phosphate fertilizer on 126Leaf Area Index.....................
5.2.3. Effect of phosphate fertilizer on pod dry matter and number of pods
12 6per plant..........................
5.2.4. Effect of phosphate fertilizer on number of seeds per pod and 100-seed
1 29weight............................... 1 *
5.2.5. Effect of phosphate fertilizer onseed yield.......................... 1 ̂
5.2.6. Effect of phosphate fertilizer on Harvest Index......................
3̂ . 2.7. Effect of phosphate fertilizer on1 -54
number and weight of nodules......
5.2.8. Possible reasons for lack of significant phosphate fertilizer
1 37effects on growth and yield........
5.3. Plant Population Effects..........5.3.1. Effect of plant population on qrowth
rate................................. 142
5.3.2. Effect of plant population on Leaf Area Index..........................
5.3.3. Effect of plant population on dry matter............................... 14 8
5.3.4. Effect of plant population on total dry matter at harvest...............
5.3.5. Effect of plant population on yield1 37components..........................

(xiii)
5.2.2.
5.2.3.
5.2.4.
5.2.5.
5.2.6.
.2.7.
5.2 .8.
5.3.
5.3.1.
5.3.2.
5.3.3.
5.3.4.
5.3.5.
Effect of phosphate fertilizer on Leaf Area Index.....................
Effect of phosphate fertilizer on pod dry matter and number of pods per plant..........................
Effect of phosphate fertilizer on number of seeds per pod and 100-seed weight..............................
Effect of phosphate fertilizer on seed yield..........................
Effect of phosphate fertilizer on Harvest Index......................
Effect of phosphate fertilizer on number and weight of nodules......
Possible reasons for lack ofsignificant phosphate fertilizer effects on growth and yield........
Plant Population Effects...........
Effect of plant population on qrowth rate.................................
Effect of plant population on Leaf Area Index..........................
Effect of plant population on dry matter..............................
Effect of plant population on total dry matter at harvest...............
Effect of plant population on yield components..........................
P ^ e
126
126
129
131
132
134
137
142
142
146
14 8
151
152
(xiv)
Page
5.3.5.1. Number of pods................... 152
5.3.5.2. Number of seeds per pod.......... 154
5.3.5.3. 100-Seed weight.................. 155
5.3.6. Effect of plant population on seed
yield.............................. 156
5.3.7. Effect of plant population on
Harvest Index...................... 15 7
5.4 Plant Population Density x
Fertilizer Interaction............. 158
6 . CHAPTER SIX: CONCLUSION........... 160
LITERATURE CITED................... 16 3
APPENDIX TABLES.................... 174
(xv)
Fig. Fig.
Fig.
Fig.
Fig.
Fig.
Fig.
Fig.
Fig.
Fig.
LIST OF FIGURES
1 Plot layout..........................
2a Effect of phosphate fertilizer onLeaf Area Index: second rains 1979..
2b. Effect of phosphate fertilizer onLeaf Area Index: first rains 1980..
3a. Effect of phosphate fertilizeron Leaf Dry Matter per plant: second rains 19 79 ....................
3b. Effect of phosphate fertilizer on Leaf Dry Matter per plant: firstrains 19 80...........................
4a. Effect of phosphate fertilizer onTotal Dry Matter per plant: second rains 1979 .........................
4b. Effect of phosphate fertilizer onTotal Dry Matter per plant: firstrains 1980...........................
5a. Effect of plant population density on Leaf Dry Matter per plant: second rains 1979 ..................
5b Effect of plant population densityon Leaf Dry Matter per plant: first rains 1980..................
6a. Effect of plant population density on Total Dry Matter per plant:Second rains 1979 ..................
21
44
45
49
50
57
58
88
89
Page
96
(xvi)
Effect of plant population density on Total Dry Matter per plant: First rains, 19 80.....
(xvii)
LIST OF TABLES
1 .
Table
2 .3.
4.
5.
6.
7.
8.
9 .
1 0.
11.
12.
13.
14.
Nutrient content of soils smapled from18fields 14 and 19..........................30Change in dry matter (gm/plant) with time..
Growth rate: gms/plant/week................
Effect of phosphate fertilizer on leaf33growth rate plant/week.....................
Effect of phosphate fertilizer on stem growth36rate: gms/plant/week..........................
Effect of phosphate fertilizer on pod3 8growth rate: gms/plant/week.................
Effect of phosphate fertilizer on root growth rate: gms/plant/week................. 40
Effect of phosphate fertilizer on the rate on total dry matter increase: gms/plant/week.41
Effect of phosphate fertilizer on LeafArea Index.................................. 4^
Effect of phosphate fertilizer on leaf dry* 4 8matter: gms/plant........................
Effect of phosphate fertilizer on stem dry52matter: gms/plant........................
Effect of phosphate fertilizer on pod dry5 3matter: gms/plant.......................
Effect of phosphate fertilizer on root5 5dry matter: gms/plant...................
Effect of phosphate fertilizer on total dry matter: gms/plant..................
Page
59
(xviii)
Table Page
15.
16.
17.
18.
19.
2 0 .
21.
22.
23.
24.
25.
26.
27.
Effect of phosphate fertilizer on total61dry matter at harvest: kg/ha.............
Effect of phosphate fertilizer on the64number of pods per plant.................
Effect of phosphate fertilizer on the6 5number of seeds/pod and 1 0 0-seed weight(gms).
Effect of phosphate fertilizer on:- Total dry matter at harvest, seed yield,
6 7Harvest Index...............................Effect of phosphate fertilizer on number
69of nodules per plant......................
Effect of phosphate fertilizer on the71weight of nodules: mgs/plant.............
Plant population effects on leaf growth rate74of leaf growth.............................
Effect of plant population on stem growth rate......................................... 77
Effect of plant population on pod growth rate..................................... 79
Effect of plant population on root growth rate...................................... 81
Effect of plant population on stem growth rate of total dry matter increase.......
Effect of plant population on Leaf Area Index...................................
Effect of plant population on leaf dry matter..............................
85
87
(xix)
28. Effect of plant population on stem drymatter....................................
29. Effect of plant population on pod drymatter....................................
30. Effect of plant population on root drymatter....................................
31. Effect of plant population on totaldry matter................................
32. Effect of plant population on totaldry matter at final harvest: kg/ha......
33. Effect of plant population on numberof pods...................................
34. Effect of plant population on number ofseeds per pod and 1 0 0-seed weight.......
35. Effect of plant population on: Total drymatter at harvest,seed yield, harvest index.....................................
36. Interaction between plant population and fertilizer on stem and leafgrowth rate...............................
37. Interaction between plant populationand fertilizer on pod growth rate.......
38. Interaction between plant populationand fertilizer on Leaf Area Index.......
39. Interaction between plant populationand fertilizer on leaf, stem and root dry matter....................................
Table
90
92
94
95
99
100
101
103
105
107
109
Page
111

(xx)
Table Pa9e.
40. Interaction between plant population and fertilizer on pod dry matter....
41. Interaction between plant populationand fertilizer total dry matter....
42. Interaction between plant population and fertilizer on no. pods/plant....
43. Interaction between plant populationand fertilizer on nodule weight....
113
115
116
118
(xxi)
LIST OF APPENDIX TABLES
Appendix Page
1. Rainfall and Temperature Data: Kabete.. 174
II Analysis of variance table showing
mean squares for the studied ........ 175
variables...........................181III. Coefficient of variation................

1
C H A P T E R O N E
INTRODUCTION
1.1. Importance of Legumes in Kenya
In developing countries such as Kenya,
where animal protein is in short supply and
therefore expensive for the low income groups,
beans and other pulses containing considerable
amount of protein of high nutritional quality
assume an emminent role as a potential source
of low cost readily obtainable protein. The
importance of legumes mainly lies in their actual
and potential value as a source of plant protein
for human consumption.
Phaseolus vulgaris is by far the most
important legume in Kenya, and is second only to
maize as a major food crop. Beans are grown in all
agricultural areas except at the Coast, in an area
of about 320,000 hectares. Most of this area is in
the medium potential region of Central and Eastern
Provinces with a bimodal rainfall pattern of 700 to
900 millimeters, (Schonher and Mbugua, 1976).
The hectarage under beans in Uganda and Tanzania is

2
about 270,000 and 120,000 hectares respectively
(Acland, 1971).
1.2. Effect of Phosphate Fertilizer on Yield of
Field Beans
Phosphatic fertilizers have been shown to
raise dry bean yields and dry matter production
particularly in areas where soils are low in
available phosphorus. Most soils in the farming
areas of Kenya have very low phosphate reserves,
hence responses to phosphate fertilizers are often
obtained.
1.3. Effect of Plant Population Density on Yield
of Field Beans
Many population density studies with field
beans^1, (P. vulgaris) , have resulted in higher
plant densities producing higher yields, as shown
by, among others, Almeida (1965), Mascarenhas (1966),
Enyi (1975), Edje and Mughogho (1975), and
Westermann and Crothers (1977). At closer spacing,
Leaf Area Index (LAI) is increased which results
in more complete ground cover with consequent
increase in interception of photosynthetically
3
active radiation and increased carbon dioxide
fixation per unit area (Enyi, 1975) Immer et al.,
1977). Increased yields with increase in plant
population was positively correlated with LAI
(Mosley, 1972).
In P. vulgaris, higher yields obtained from
higher plant densities have been shown to be
mainly due to the increase in the number of pods
per unit area (Mosley, 1972, Leakey, 1972, Rojas
et al., 1975, Immer et al., 1977). The number of
pods produced per plant decreases as plant
population density is raised due to interplant
competition, but the decrease is more than
compensated for by the increase in the number of
plants per unit area.
Additional advantage of high plant densities
is the uniform maturation of the crop. If a crop
of even maturity is desired in mechanical harvesting
for example, this may be achieved by increasing
plant population and restricting the duration of the
fruiting season (Smartt, 1976). At high plant
densities of snap beans (P. vulgaris), the range
of pod maturity appeared to be smaller and
duration of flowering shorter than at low plant
4
densities (Mosley, 1972).
1.4. Population Density-fertilizer Interaction
At higher levels of nutrient supply, more
plants per unit area are required to exploit fully
the higher soil fertility potential^and thereby
produce maximum yields. Conversely, as plant
density increases up to a certain limit, the crop
will continue to respond to added nutrients
(Arnon, 1972). Leakey (1972) reported that bean
yield response to plant population and increased
fertilizer levels appeared to be additive in
effect. Chagas et al. (1975) did not find any
interaction between P. vulgaris population density
and fertilizer.
The objective of this study was therefore to:
1 ) determine the effect of population
density of field beans on:
i) the rate of growth
ii) grain yield and yield components
2) examine the effect of different phosphate
fertilizer levels on the above (i) and
(ii)
5
3) investigate the interaction between
plant population density and phosphate
fertilizer on yield and yield components
of P. vulgaris
4) determine the effect of phosphate
fertilizer on nodulation of P. vulgaris.
6
C H A P T E R T W O
LITERATURE REVIEW
2.1. Effect of Plant Density on Bean Yield
Many population density studies with field
beans P. vulgaris have shown that higher plant
densities produce higher yields. Mascarenhas
et al. (1966) compared an early maturing dry
bean variety at all combinations of between row
spacings of 40, 30 and 20 cm and within row
spacings of 30, 20 and 10 cm. Yields per unit
area were still rising at the highest population
of 500,000 plants per hectare (given by the
closest spacing of 20 x 10 cm). Yields varied
from 870 kg/ha at 40 x 30 cm to 1650 kg/ha at
20 x 10 cm at one site^ and from 1010 to 1360
kg/ha at another site averaged over two seasons.
Almeida (1965) had similarly found increases in
yield of 'Rico-23' an erect bean variety, by
progressively decreasing distances between rows
from 60 to 30 cm and within rows from 30 to 10 cm.
Grain yield per hectare was increased by 27, 50
and 48% when P. vulgaris plant population was
increased from 74,000 to 111,000, 222,000 and
444,000 plants per hectare respectivelyf
(Enyi, 1975). Edje et al̂ . (1975) in Malawi
obtained yield increases of 19 and 13% on
7
increasing plant population from 1 1 1 , 0 0 0 to
222,000 and from 222,000 to 444,000 plants per
hectare respectively. Goulden 0 9 75) working with ̂
navy beans, obtained 57% increase in yield by
raising plant population from 250,000 to 1,040,000
plants per hectare.
2.2. Effect of Plant Arrangement on Yield
Square planting is the theoretical optimum
arrangement for crops as suggested by Donald (1963).
It would be reasonable to expect that square
arrangement would be more efficient in the
utilisation of light, water and nutrients available
to the individual plant than would be a rectangular
arrangement, as the former arrangement would reduce
to a minimum the competitive effects of
neighbouring plants to one another (Arnon, 1972).
When field beans were planted at a spacing of
25 x 25 cm and 76 x 8 cm, both spacings, giving
the same population density, plants spaced at
25 x 25 cm yielded 13^ more than those spaced at
76 x 8 cm,’ plants spaced at 20 x 20 cm yielded
12% more than those spaced at 76 x 5 cm
(Kuenemann et al., 1979). Plant arrangement
experiments at Kakamega in Kenya resulted in
8
i
square arrangement outyielding rectangular
arrangement by 23%, though in four other sites at
Katumani, Embu, Thika and Kisii, plant
arrangement did not significantly affect yield
(Grain Legume Project, 1975-6) .
2.3. Effect of Plant Density on Yield Components
The yield component most sensitive to
changes in plant population density is the number
of pods per plant, followed by seeds per pod and
weight per seed. This order of stress
responsiveness has been observed in dry beans by,
among others Mathews (1933), Adams (1967),
Appadural et al. (1967), Camacho et al. (1968),
and Wiley and Osiru (1972).
Mosley (1972) reported that increased
yield with increase in plant density from 2.62 to
9.6 plants per foot square (29.11 to 106.6 plants 2per m ) was due to the increase in the number of
pods per unit area. Leakey (1972) and Rojas et al.
(1975) found that the number of pods per plant
decreased, but the number of pods per unit area
increased with increase in plant population. Yield

9
was determined to the extent of 85.7 and 8 6.1 % by
the product of pods per plant and plants surviving
to harvest (Leakey, 1972). Plant density and
thinning experiments showed that pod number per
plant was sensitive to interplant competition
between 36 and 78 days after sowing, while number
of seeds per pod and seed weight were not
sensitive (Immer et al., 1977).
Among the components of pods per plant,
i.e. pods per raceme, racemes per node, nodes per
branch and branches per plant, analysed by Bennet,
Adams and Burga (1977), only racemes per node and
branches per plant were significantly reduced by
higher planting densities and this accounted for
the observed decrease in pods per plant.
Though no regular changes in the number
of seeds per pod with changes in plant population
were observed, the lowest numbers were obtained
at the highest plant densities and vice versa
in P. vulgaris (Leakey, 1972). Edje et al. (1975)
Immer et _al. (19 75), and Goulden (1975) did not
obtain any significant effect of spacing on the
number of seeds per pod in P. vulgaris.
10
Among the highly plastic components of
plant yield, the weight of the individual seed is
only rarely influenced by changes in plant density
(Arnon, 1972). Carvalho (1974), Rojas et al.
(1975) and Goulden (1975) did not obtain any
significant effect of spacing on seed weight.
2.4. Some Problems Encountered with High Plant
DensitiesI
High plant population densities may prevent
light penetration into the canopy and may also
result in creation of humid microclimate that
favours growth of plant pathogens. Beans planted
at the higher plant densities, for example, were
more severely attacked by white mould (Whetzelinia
sclerotiorum) than those planted at lower densities
(Nichols, 1973). In two experiments conducted with
P- vulgaris, it was found that it was possible to
control white mould (reflected in yield increase)
by changing the distance between rows. At 95 cm the
bean variety yielded 1333 kg/ha as compared to 796
kg/ha when sown at 50 cm between rows (Agric. Teh.
Mex. , 1977). Cultivars with open canopies that
permit light penet:ration and exchange of gases
throughout the canopy are more suited for high
11
plant densities. Appropriate disease and pest
control measures should also be employed where
necessary.
Leakey (1972) observed a clear trend
towards increasing mortality of plants during
growth with increased density of stands. He
reports that highest densities although giving
the highest grain yield, are wasteful of seed in
that plants surviving to contribute yield are much
reduced. This may occur at very high densities
when competition among the plants may be so severe
and plant survival takes precedence over total
seed production per unit area (Donald, 1963) .t
Excessively high plant populations are
disadvantageous where water availability is low
at the period of final maturation, but if
supplementary irrigation is available, higher plant
populations may be used with advantage (Smartt,
1976).
2.5. Effect of Phosphatic Fertilizer on Yield
Various types of fertilizers, fertilizer
rates and methods of application have been studied
to determine their benefit to field bean

12
(P. vulgaris) production. Most of this work, however
has been done outside Eastern Africa.
Where soils are poor in available
phosphorus, phosphatic fertilizers have been shown
to increase dry bean yields and dry matter production.
Fertilizer work by Mitchel (1964) in Australia
resulted in the highest yields being obtained where
57 kg P and 80 kg N per hectare were given as basal
application at planting followed by 57 kg N per
hectare three weeks later. Average seed yields of
444 kg/ha without fertilizer were raised to 1307
kg/ha by application of 120 kg and 30 kg
N/ha (Miyasaka et al. , 1965). Application of 80
kg P2° 5 an^ 160 P2°5 Per hectare 9 ave 36.5% and3 5 .1 % increase in bean yield over no fertilizer
(Almeida, 1973). Edje et al. (1975) obtained 25%
and 10% bean yield increase on increasing NPK from
zero to 400 to 800 kg per hectare respectively.
In Uganda, P. vulgaris bean yields were
significantly increased by superphosphate,
agricultural lime and ammonium sulphate. Phosphate
was found to be the main requirement and it was
probable that the effect of lime was due in part

13
to its own P content (2% P2° 5 ) and to its action in making soil phosphate more available (Stephens,
1967). In further fertilizer work in Uganda by
Leakey (1972), 0, 5, 10, 20 cwt per acre (0, 254,
508 and 1016 kg/ha) of 2 :2 : 1 compound fertilizer
containing 46 N, 19 P, 46 K, 28 S and 70 Ca pounds
per acre (52.2 N, 21.6 P, 52.2 K, 31.8 S and 79.5
Ca kg per hectare) in every cwt (50.8 kg) was used
on beans. Higher fertilizer levels raised bean
yields. The largest yield increment was obtained
by using 5 cwt NPK per acre (254 kg per ha). There
was no apparent advantage in yield from increasing
fertilizer level from 10 to 20 cwt per acre (508
to 1016 kg per ha).
* Most soils in the farming areas of Kenya
have very low phosphate reserves, hence responses
to phosphatic fertilizers are commonly obtained.
In bean-growing areas of Central and Eastern
Provinces of Kenya, FAO work (1971-72) showed that
application of phosphorus and potassium resulted in
economical yield increases, where 40 kg per hectare
for both P and K proved to be highly effective.
In Muranga and Kiambu districts the yields were
raised from 952 and 878 kg/ha with no fertilizer
14
to 1536 and 1504 kg/ha respectively when 40 kg P
and 40 kg of K was given to the crop.
Grain Legume Project (GLP) work (1977) in
Katumani, Thika, Embu, Kisii and Kakamega showed
that bean yields were significantly increased by
Diammonium phosphate *, 200 kg/ha of the
fertilizer applied in furrows at planting time gave
the highest bean yield of 2276 kg/ha. Double
superphosphate did not give any response.
Kabete area represents soils with an acid
pH of about 6 , and a high capacity to fix
phosphorus, hence addition of this nutrient seems
important in the improvement of bean yields (Keya
and Mukunya, 1979). Yields of Canadian Wonder
beans (P. vulgaris) were progressively increased
by raising fertilizer rates from 0 to 30 to 60 kg
?20(- per hectare at Kabete (Mahatanya, 1976). More
recent work by Keya and Mukunya (1979) resulted in
phosphatic fertilizers increasing dry matter and
seed yield of Phaseolus vulgaris.
2.6. Effect of Phosphate Fertilizer on Yield
Components
Since phosphorus influences total yield it
15
would be expected to have an effect on the yield
components as well. Hiroce et al. (1970) found a
positive, linear and highly significant increases
in seed yield per plant by phosphorus application,
and the seed yield was positively and significantly
correlated with pod number. GLP (1979) work in Kenya
also showed that increased yields due to phosphate
fertilizer application was mainly due to the
increase in the number of pods per plant.
2.7. Effect of Phosphate Fertilizer on Nodulation
Several studies have shown that application
of phosphatic fertilizers to field beans can
improve nodulation and nitrogen fixation with
consequent increase in yield (Anderson, 1973^ Keya,
1977) Keya and Mukunya, 1979).
2.8. Population Density-fertilizer Interaction
At higher levels of nutrient supply, more
plants per unit area are required to exploit fully
the higher soil fertility potential and thereby
produce maximum yields. Conversely, as plant
density increases up to a certain limit, the crop
16
will continue to respond to higher levels of added
nutrients (Arnon, 1972).
In a study of maize concerning the
relationship between population density and different
levels of nitrogen supply, it was found that the
higher the level of nitrogen was, the greater would
be the plant population required for achieving
maximum yields (Lang et al., 1956). Different
populations of P. vulgaris can probably be expected
to respond to phosphate levels in a similar manner.
Leakey (1972) reported that bean yield response to
population and increased fertilizer levels appeared
to be additive in effect. Chagas et al. (1975) did
not find any interaction between P. vulgaris
population density and fertilizer.
17
C H A P T E R T H R E E
MATERIALS AND METHODS
3.1. The Experimental Site
Two experiments identical in design and layout
were established at the University of Nairobi
Field Station, Kabete. Kabete is situated at
latitude 1° 15' South and longitude 36° 44' East.
It has an altitude of 1820 meters with mean
maximum and minimum temperatures of 23°C and 13°C
respectively. The coolest months are May, June,
July and early August with the lowest temperatures
being recorded in July. December, January and
February are among the hottest months (see Appendix table I).
The area has a bimodal rainfall regime with
annual average rainfall of 950 mm. The first or
the long rains fall in the months of March, April,
May and the first part of June. 494 mm of rain,
about 52% of the annual average, falls in these
months. These rains are more reliable and heavier
than the second or the short rains which fall in
late October, November and December. Only about
269 mm, 28% of the annual average total, is

18
received in this season. Appendix I shows the
temperatures and the rainfall received in 1979
and 1980, the period during which the
experiments were carried out.
3.2. Soils
Kabete soils have been described as Kikuyu
friable loams (Keya and Mukunya, 1979). The
soils are deep-red clays with a stable
microstructure. Laboratory analysis of the soils
revealed the following nutrient content:
Table 1: Nutrient Content of Soils Sampled from
Fields 14 and 19.
Field 14______ Field 19pH in water and in 0.01 m calcium chloride,respectively 6 .1 ; 5.2 6; 5.
Total nitrogen 0.28% 0 . 28%
Available phosphorus,ppm 4.1 3.6-AExchangeable potassium me/ 1 0 0 g of soil 4.4 2.7Carbon/nitrogen ratio 12 : 1 1 0 : 1
Organic matter 6 . 0 4.8%
Analytical methods used in the Department of Soil
Science (Ahn, 1973 and 1975) were used in

19
determining the above, except for phosphorus
which was determined by Murphy and Riley Method
(1962).
Note; Response to phosphorus is expected if soil
phosphorus is less than 5 ppm.
5 - 1 0 ppm (P) - response to phosphorus is
probable.
>10 ppm (P) - response to phosphorus is
unlikely.
3.3. The Bean Variety Used in the Experiment
Phaseolus vulgaris cultivar Rosecoco which
resembles GLP x-98 was used in the experiment.
The cultivar is medium to late maturing, with an
indeterminate growth habit, and is quite popularL
in the medium rainfall areas of Kenya's Central
Province. It is also quite common in Western and
Eastern Provinces.
3.4. Planting methods
Rosecoco seeds were dressed with aldrin at
the rate of 5 grams per kilogram of seed to
control pests especially bean fly (Melanargromyza
20
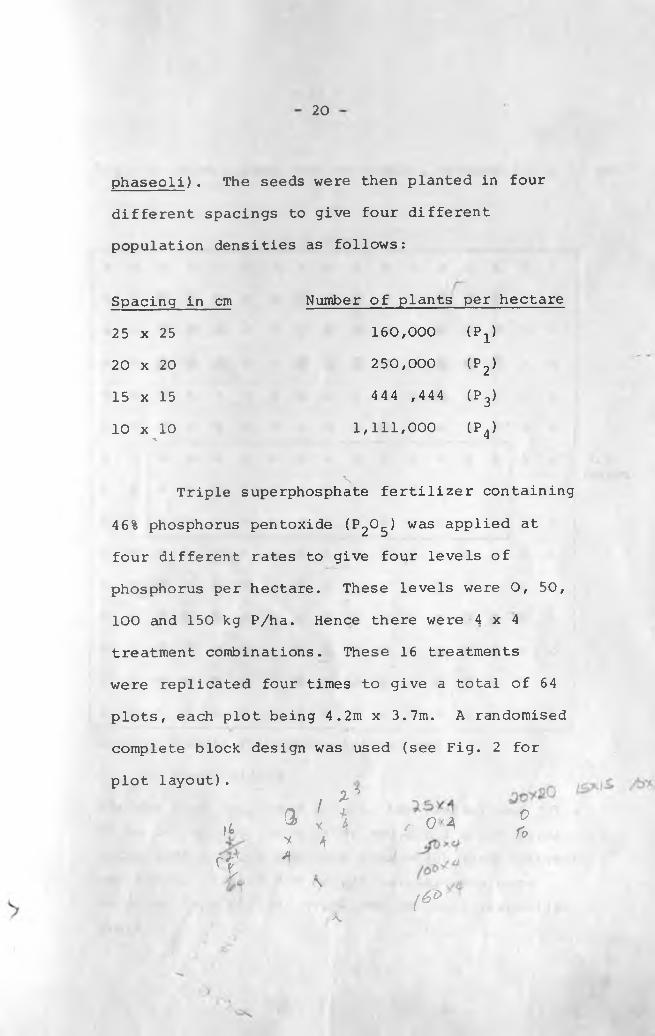
phaseoli). The seeds were then planted in four
different spacings to give four different
population densities as follows:
Spacing in cm
25 x 25
20 x 20
15 x 15
10 x 10A
Number of plants per hectare
160.000 (P1)
250.000 (P2)
444 ,444 (P3)
1 ,1 1 1 , 0 0 0 (p 4)
sTriple superphosphate fertilizer containing
46% phosphorus pentoxide (P2^ 5 ̂ was aPPlie<̂ at four different rates to give four levels of
phosphorus per hectare. These levels were 0, 50,
100 and 150 kg P/ha. Hence there were 4 x 4
treatment combinations. These 16 treatments
were replicated four times to give a total of 64
plots, each plot being 4.2m x 3.7m. A randomised
complete block design was used (see Fig. 2 for
plot layout).
It• a ' rY A /• 0 ’ A
r t
Y
AA
\
( 6 >>
V
fo
A .
21
Fig. 1. Plot Layout (not to scale), spacing:(25 x 25 cm)
4.2 metersx X X X X X X X X X ‘ X X X X X X X
X X © a X X 0 <25 © X X © © © X X
X X o © 0 X X 0 <8 <8 X X <3 0 © X X
X X 0 G © X X © © © X X 0 0 X X
X X « X X X X X X X X © X X X X
X X X X X X X X X X X X X X X X X
X X X X X X X X X X X X X X X X X
X X X X X X X X X X X X X X X X
xX X X X X X X X X X X X X X X X
1x iX X X X X X X X X X X X X X X X x
X X X X X X 0 X X X X © X X Xi
X i1
X X © © © X X © © © X X 0 0 © X X
X X © © X X a <8 © X X 0 0 X X 1X X © <3 X X © © © X X 0 © © X
IX
X X X X X X X X X X X X X X X X X i 1
Key: 0 Plants for sequential harvest
x Guard plants
The net plot (enclosed area in the centre) was 325 x 75 cm for second rains 1979, and 1- x 1 m for first rains 1980 for all spacings from which final harvest was taken. Plants for sequential harvests were obtained from similar positions in their respective plots.
22
Depending on the plot size and spacing, the
number of rows per plot were determined, then
the fertilizer amount required per row was weighed
out as indicated below:
Fertilizer rate, kg P per ha
TSP 46%, P205
kg per plotSpacingan
No. of TSP per row rows (grams)
0 0 25 x 25 15 0
20 x 20 18 0
15 x 15 24 0
10 x 10 35 0
50 o*mi_ 25 x 25 15 26.0720 x 20 18 21.7315 x 15 24 16.3010 x 10 35 11.17
100 0.7748 25 x 25 15 51.6520 x 20 18 43.0415 x 15 24 32.2810 x 10 35 22.14
150 1.1622 25 x 25 15 77.4820 x 20 18 64.5715 x 15 24 48.4310 x 10 35 33.21
(Conversion factors for P:% P = %P205 x 0.436
%P2°5 = %P x 2. 29) (Ahn, 1970)
The fertilizer was applied in furrows
at planting time and mixed with the soil. The
23
seeds were then placed singly in the furrows and
covered with the soil to a depth of about 2 to
3 cm.
The first experiment's crop was planted on
5 November 1979. The first weeding was carried
out on 22 November, three weeks after planting
when the plants had about 2 to 3 leaves. The
second weeding was done three weeks Iter, i.e.A.
six weeks after planting.
Soon after the first weeding calcium
ammonium nitrate (CAN: 26% N) was applied at the
rate of 13 kg N per hectare. The fertilizer was
top-dressed between the rows.
Due to the drought that persisted
throughout most of the season, the crop was
irrigated twice: in December 1979 and again inJanuary 1980.
The crop was sprayed twice, on 7 January,
1980 and again on 17 January 1980 with Dithane M 45
(40% emulsifiable oonaentrate) at the rate of 4 litres
in 600 litres of water/hectare using Knapsack sprayers.

24
3.5. Sampling Techniques
Sequential harvests were carried out on
4th, 6th, 3th, 9th, 11th and 13th week after
planting. At flowering and pod-forming stage,
changes in plant growth were expected to be rapid
and so only one week interval was allowed between
the 3rd and the 4th sequential harvests. Ten
plants were uprooted from a pre-determined area
in each plot (see Fig. 2) , making sure that most
of the tap root and main lateral roots and most
of the root nodules were recovered. The plant
samples were then put in plastic bags to
preserve their water content, then taken to the
laboratory for weighing and measurement.
Leaf area was determined using the disc
method and the cross-sectional area of the punch 2was 2.43 cm . Twenty whole discs were taken
to calculate the area/weight relationship of
the sample.
Total fresh weight of the plants, excluding
the roots, was taken. Then the plant was
separated into stem, leaves and pods and the fresh
weight of these parts was recorded. The number

25
of pods per plant was recorded at 4th, 5th and
6th harvests, i.e. 9, 11 and 13 weeks after
planting, respectively.
During the first, third and fourth harvests,
root nodules from each plant were counted. Nodule
weight from the ten plants per sample per harvest
was also recorded. During subsequent harvests
the nodules were shrivelled and very few, making
it difficult to separate them from the soil, to
count or to weigh them.
f The final harvest was taken on 5th March21980 from an area of 75 x 325 cm per plot
(see Fig. 2). The number of the harvested plants
differed with the varying plant population
densities and this was achieved by harvesting as
indicated below:
Spacing in cm Number of rows harvested per plot
25 x 25
20 x 20
15 x 15
1 0 x 10
3 centre rows, omitting two plants at each end of every row.4 centre rows, omitting two plants at each end of every row.6 centre rows, omitting three plants at each end of every row.8 centre rows, omitting four plants at each end of every row.
From the final harvest, the following data

26
were obtained.
seed yield in grams per plot
number of pods per plant
number of seeds per pod
- Weight of 100 seeds which were randomly
selected from each sample. The 100-seed
weight was taken after drying the seeds
in the oven at 100°C for 24 hours,
total dry matter
harvest index. This was the ratio of
seed yield to total dry matter:
Harvest index 100 x seed yield in kg/ha_______total dry matter in kg/ha
Field 14 was used for the second experiment.
The land was ploughed in early April 1980 then
harrowed twice to a fine tilth just before
planting. The crop was planted on 23rd April
1980, using the same procedure as in the first
experiment. The first weeding was done during
the third week after planting at two to three
leaf-stage. The second weeding was carried out
one month later.
The crop was top-dressed with CAN (26% N)
31days after planting, i.e. on 26 May 1980 at
27
the rate of 13 kg of nitrogen per hectare.
The rainfall received during the season was
satisfactory hence the plants were not irrigated.
Samples were taken on 4th, 6th, 9th, 11th,
13th and 15th week after planting. The third
sequential harvesting was done on the 9th rather
than the 8th week after planting due to unavailability
of workers during the latter period). The growing
season was expected to be longer and the crop to
remain green in the field for a longer time than
in the previous season hence the interval between
sequential harvests remained a constant two weeks.
Five plants per plot (and not ten as in the
previous season) were sampled in each harvest.
This was to ensure that sufficient number of plants
were left for final harvest since poor germination
due to the very heavy rain that fell two days after
planting resulted in fewer plants per plot than
expected. As in the first experiment, total leaf,
stem and pod fresh and dry weights were determined.
Root fresh and dry weights were also determined.
The number and weight of root nodules were recorded
\

28
in the first, second and third and fourth harvests.
Final harvest was carried out on 21st
and 22nd August 1980. Plants for final harvest
were taken from an area of 1 x 1 meter square.
Seed yield in grams per plot, number of pods per
plant, number of seeds per pod and harvest index
were determined as in the first experiment.
3.6. Statistical Analysis
Separation of means was done using Duncan's
y New Multiple Range Test.
£c i a - ^ 30 0 u ^ S i i
. . C O •"'>
29
C H A P T E R F O U R
RESULTS
4.1. Seasonal Differences
Tables 2 and 3 show the dry matter★accumulation and growth rate averaged over all the
fertilizer levels and all the plant populations.
In the 1979 crop total dry matter per plant
increased at an increasing rate up to the 9th week
after planting. The highest growth rate of 2.17
gm/plant per week was attained in the 9th week
when the average dry weight per plant was 7.2 gm.
After the 9th week, the rate of growth dropped
to 0.56 gm/plant/week.
The rate of dry matter accumulation in the
leaves increased from 0.70 gm/plant/week in the
6th week to 0.97 gm/plant/week in the 8th week.
During the two weeks that followed,the rate
dropped to 0.45 gm/plant/week, after which negative
growth rate set in. The leaves attained their
maximum dry matter in the 9th week.
In the 6th week stem dry matter
increased at the rate of 0.25 gm/plant/week.
refers to ^solute growth rate in the text
Table 2. Change in dry matter (qm/plant) with time:
Weeksafterplanting
Second rains 1979 First rains 19 80leaf stem pod * total Weeks
afterplanting
leaf stem root pod total
4 0 . 73 « 0.19 0.92 4 1.80 0.48 0. 36 2.646 2.14 0. 69 2.83 6 4.86 1.90 0.58 7.348 3.66 1.46 5.12 9 7.05 3.86 0 . 86 1.57 13.349 4.11 2.35 0 . 75 7.21 1 1 6.29 4.61 0.71 7.71 19.32
1 1 2.77 2.38 3. 30 8.45 13 4.58 4.50 0.63 16.22 25.9313 1.57 2.29 5.67 9.53 15 0.97 3.86 0.65 18.44 23.92
Table 3. Growth rate . grams/plant/week
leaf stem pod total leaf stem root pod totalWeeks Weeksafter afterplanting plantinq
6 0. 7 0. 25 0.95 6 1.53 0 . 71 0 . 1 1 2.368 0 . 76 0.39 1.15 9 0.73 0.65 0.09 2.809 0.45 0. 89 2.09 1 1 -0.38 0 . 38 -0 . 0 8 3.07 2.99
1 1 -0.67 +0 . 0 2 1.28 0.62 13 -0 . 86 -0.06 -0.04 4.26 3.3113 -0.60 -0.05 1.19 0.54 15 - 1 . 81 -0. 32 -0 . 0 1 . 1 . 1 1 - 1 . 0 1
(NB. In the text, Second rains, 1979 and First rains, 19 80 are referred to as 19 79 crop or 1979 ,and 1980crop or 1980 respectively).
31
The rate reached a peak of 0.90 gm/plant/week in
the 9th week when the total stem dry matter per
plant was 2.35 grams. After the 9th week,
negative stem growth rate commenced.
After pod initiation in the 7th week,
pod dry matter increased from 0.75 gm/plant in
the 9th week to 5.67 gm/plant in the 13th week.
The rate of increase dropped from 1.37 gm/plant/
week in the 1 1 th week to 1 . 1 1 gm/plant/week in
the 13th week.
In the 1980 crop, total dry matter per
plant increased from 2.64 grams in the 4th week
to a peak of 25.41 grams in the 13th week, after
which it dropped to 23.86 grams in the 15th week.
The rate of growth increased from 2.36 gm/plant/
week in the 6th week to 3.04 gm/plant/week in
the 13th week, after which negative growth rate
was observed.
Leaf dry matter increased from 1.8 gm/plant
in the 4th week to a peak of 7.05 gm/plant in
the 9th week after which negative growth rate
commenced. Highest leaf growth rate was recorded
in the 6th week.
The rate of dry matter increase in the stems
32
rose from 0.71 gm/plant/week in the 6th week to
0.91 gm/plant/week in the 9th week. After this,
the rate declined to 0.28 gm/plant/week in the
11th week. Maximum stem dry matter of 4.61
gm/plant was observed in the 1 1 th week.
The rate of dry matter increase in the roots
was 0 . 1 1 gm/plant/week in the 6th week at which
time root dry matter per plant was 0.58 gms. The
rate increased to 0.13 gm/plant/week in the 9th
week when the root dry matter attained a peak of
0.86 gms per plant. After the 9th week, negative
growth was observed.
Pod dry weight in the 9th week was 1.57
gm/plant. This increased at the rate of 2.26 gm/
plant/week up to the 11th week. The rate had
risen to 4.26 gm/plant/week in the 13th week when
the maximum pod dry matter of 8.51 gm/plant was
attained. After the 13th week, the rate of
pod growth declined to 1.04 gm/plant/week.

Table 4. Effect of phosphate fertilizer on leaf growth rate gms/plant/week
Fertilizer level:kg P/ha2nd rains 1979
Weeks after planting6 8 9 1 1 13
0 0.67a 0.96a 0. 30a -0.80ab -0.44a50 O. 72a 1.16a -1.16b -1.16c -0.56a
100 0.70a 0 . 82a 0.85a -0.58a “0 .68a150 0. 73a 0.94a 0.95a -0.96bc -0.56a
S .E . mean 0.06 0.19 0.35 0.09 0.15
1st rains 1980 6 9 1 1 13 150 1.42a 0. 89a -0.39a -0.50a -1.67b50 1.44a 0.77a 0 .20a -1.39a -1.54b
100 1.71a 0.95a -0.35a -0.69a -0.50a150 1.55a 1.47a -0.57a —0 .88a - 1 .68b
S.E. mean 0. 14 0.25 0.28 0.31 0.19
N.B. Figures with the same letter in each column do not differ significantly (Duncan's New Multiple Range test).

34
4.2. Effect of Phosphate Fertilizer on Growth Rate
4.2.1. Leaf Growth Rate
Table 4 shows the effect of phosphate
fertilizer on the rate of leaf dry matter increase
in the bean plant. The rate increased with increase
in fertilizer level in both seasons. In 1979,
the lowest leaf growth rate was obtained from
plants which had received 50 kg P/ha during the
9th week. Growth rate at this fertilizer level
had already negated in the 9th week, while at the
other treatments, growth was still positive. In
the 1 1 th week, negative growth rate had
commenced in all the treatments. Plants treated
with 100 kg P/ha had the least rate of dry
matter loss, while the highest rate of dry matter
decline was obtained from 50 kg/ P/ha treatment
plants, and the difference between this level
and the control was significant. Negative growth
rate at the highest fertilizer level was higher
but not significantly different from the control.
In the first rains of 1980, the highest
rate of leaf growth in the 6th week was
obtained where 100 kg P/ha was applied, and at
150 kg P/ha in the 9th week. Up to the 9th week,
35 ■L-UV' f .
the difference in leaf growth rate between the
four fertilizer treatments was not significant.
In the 11th week, negative growth had commenced
in all the treatments except at the 50 kg P/ha
treatment. The highest rate of leaf dry matter
loss was recorded at the highest fertilizer
level, though it was not significantly higher
than the control and the 100 kg P/ha fertilizer
level. In the 13th week, plants fertilized with
50 kg P/ha had the highest rate of leaf loss,
while the control plants had the least, but no
significant differences between the four
fertilizer treatments were observed. In the 15th
week, plants which had received 100 kg P/ha had
significantly lower rate of dry matter decline
than all the other treatments. Differences
within the other treatments were not significant.
4.2.2. Stem Growth Rate
No significant differences in rates of
stem dry matter increase were observed in the
1979 crop (Table 5), though in the 9th week of
growth, stem growth rate increased slightly with
increase in fertilizer level.

Table 5. Effect of phosphate fertilizer on stem growth rate gms/plant/week
Fertilier level: kg P/ha2nd rains 1979
Weeks after planting6 8 9 1 1 13
0 0.25a 0. 48a 0.74a -0.04a -0.07a50 0. 25a 0. 59a 0. 71a -0.05a 0 .00a
100 0. 25a 0. 40a 1 .1 0a 0.18a -0.13a150 0. 25a
i0. 49a 1.04a -0 .0 2a 0 . 0 2 a
S . E . me an 0.03 0.08 0.18 0 . 1 2 0 . 1 1
1st rains 1980 6 9 1 1 13 150 0 . 68b 0 .68b 0 .2 1a 0. 34a -0.42ab
50 0.62b 0. 84ab 0.49a -0.52b -0 .0 2a100 0 .88a 0. 9 5 ab 0.24a 0 .1 1 a -0.51b150 0 . 68b 1.19a 0.18a -0.16ab -0.23ab
S.E. mean 0.06 0.13 0.17 0 . 20 0.15>
N.B. Figures with the same letter in each column do not differ significantly.
37
In the 1980 crop,during the 6th week,
100 kg P/ha treatment plants had significantly
higher stem growth rate than the other treatments.
In the 9th week, 150 kg P/ha treatment plants
had significatly higher stem growth rate than
the control. The rate increased as the fertilizer
level was raised, but these increases were not
significant within the three fertilizer
treatments. In the 13th week, negative stem
growth had commenced at the 50 kg P/ha and 150
kg P/ha treatment plants but growth was still
positive at the other two treatments. Plants
which had received 50 kg P/ha had significantly
lower rate of stem dry matter loss than plants
at all the other treatments, these other
treatments were not significantly different from
each other. In the 15th week, negative growth
had already commenced at all the treatments. The
highest rate of stem dry matter decline occurred
at the 100 kg P/ha treatment plants, and this
was significantly different from that at the 50 kg
P/ha treatment plants, but it was not
significantly different from the other two
treatments.
38
Table 6: Effect of phosphate fertilizer on pod
growth rate (gms/plant/week)
Fertilizer levelkg P/ha2nd rains 1979
Weeks after planting
11 13 15
0 1. lib 0.93a50 1.31b 1.12a
100 1. 78a 1.01a150 1. 29b 1.36a
S.E. mean 0.14 0. 25
1st rains 1980 11 13 15
0 2.35a 4.94a 1.07a50 2.32a 3.56a 1.71a
100 2.35a 4.53a 0. 41a150 2.03a 4.00a 0.96a
S.E. mean 0.30 0. 56 0. 65
N.B. Figures with the same letter in each column
do not differ significantly.

39
4.2.3. Pod Growth Rate
In 1979 the rate of pod dry matter increase
tended to rise with increase in fertilizer level
(Table 6). In the 11th week, the rate of pod
growth increased as the fertilizer level was raised
from 0 to 100 kg P/ha, then dropped slightly at the
highest fertilizer level. However, the only significant
difference was between the 100 kg P/ha treatment and
all the other treatments. In the 13th week, pod
growth rate increased from 0.93 grams/fclant/teek at the
control, to 1.36 grams/plant/week at the highest
fertilizer level with a small depression at the 100
kg P/ha fertilizer level. Differences between the
four treatments were however not significant. In 19 80significant differences in pod growth rate were not obtained.4.2.4. Root Growth Rate
During the 6th and the 9th weeks, 150 kg
P/ha and 100 kg P/ha treatment plants respectively
had higher rates of root growth than the control.
In the 13th week, 50 and 100 kg P/ha treatment
plants had higher rates of dry matter decline than
the control. However, none of these differences
were significant (Table 7) .
4.2.5. Rate of Total Dry Matter Accumulation
In 1979, the different fertilizer treatments
did not result in significantly different rates of
Table 7. Effect of phosphate fertilizer on root growth rate gms/piant/week
Fertilizer level kg P/ha
Weeks after planting
2nd rains 1980 6 9 11 13 15
0 0.09 a 0.09a -0.06a -0.03a -0.01a50 0. 12a 0. 13a -0.04a -0.09a 0.04a
100 0.12a 0.17a - 0.06a -0.07a 0.00a150 0. 13a 0.13a -0.07a -0.02a -0.01a
S.E. mean 0.02 0.03 0.03 0.04 0.03
N.B. Figures with the same letter in each column do not differ significantly.

Table 8. Effect of phosphate fertilizer on the rate of total dry matter increase: gms/piant/week
Fertilizer level kg P/ha2nd rains 1979
Weeks after planting
6 8 9 11 130 0.92a 1.43a 1.71a 0.29a 0. 42a
50 0.97a 1.76a 1.14a 0. 59a 0. 60a100 0.95a 1.23a 2.68a 1.12a 0. 43a150 0.97a 1.43a 2.61a 0.37a 0. 83a
S .E . Mean 0.08 0.26 0. 54 0. 36 0. 33
2nd rains 1980 6 9 11 13 150 2.19a 2.19b 2.12a 4.32a -0.54a
50 2.18a 2.4 4 ab 2.97a 1. 56a 0.02a100 2.70a 2.9 4 ab 2.17a 3.34a -1.44a150 2.35a 3.63a 1.56a 2.94a -0.96aS.E. Mean 0.19 0. 40 0. 64 1.00 0.90 .
N.B. I-igures with the same letter in each column do not differ significantly
42
total dry matter increase (Table 8). Peak rates
of growth occurred in the 9th week, with the two
highest fertilizer levels having higher peaks
than the lower levels. From the 9th to the 11th
week, 100 kg P/ha treatment plants had the
highest rate of growth, and in the 13th week,
the rate was highest at the highest fertilizer level.
In 1980, during the 6th week, 100 kg P/ha
treatment plants had the highest rate of growth,
followed by the 150 kg P/ha treatment plants,
but the differences were not significant. During
the 9th week, growth rate increased progressively
as the fertilizer level was raised, with the
highest growth rate occurring at the highest
fertilizer level. Growth rate at the highest
fertilizer level was significantly higher than
the control. After the 9th week, growth rate was
not consistent with the fertilizer levels, though
in the 11th week, 50 kg P/ha treatment plants had
the highest rate of growth, followed by the 10 0
kg P/ha treatment plants. These differences were, however, not significant.

Table 9 . Effect of phosphate fertilizer on Leaf Area Index
Fertilizer level kg P/ha
Weeks after planting
2nd rains 1979 4 8 9 1 1 130 0 . 60a 2.52a 2.69a 1.54b 0.98a
50 0.61a 3.30a 2.73a 1.94a 1.16a100 0.64a 2.95a 2.58a 1.90ab 1.15a150 0.64a 3.07a 3.05a 1 . 8 6ab 1.19a
C.V. % 29 39 29 28 38.S . E . Me an 0.04 0.29 0 . 20 0. 13 0 . 1 1
1st rains 1980 4 6 9 1 1
0 2.08a 4.33b 5.47b 3.71c50 2.27a 4.87ab 5.9 8ab 5.48a
100 2.14a 5 . 2 2 ab 6.93a 4.22bc150 2.45a 5.71a 6.80a 4.72 ab
C.V. % 29 30 28 27S. E. Me an 0.16 0. 37 0.44 0.31N.B. Figures with the same letter in each column do not differ significantly.

(LA!)
f
Weeks After Plantingx Cf PborphaH Fertiliser On Lent Area ind*n (LAI) *. Second Rolns 1979 •i , ,
Of Pfcorvphcto Fertilizer On Leaf Arso Indox (LAlV. First Reins 1980*Fig 2b. Effect
46
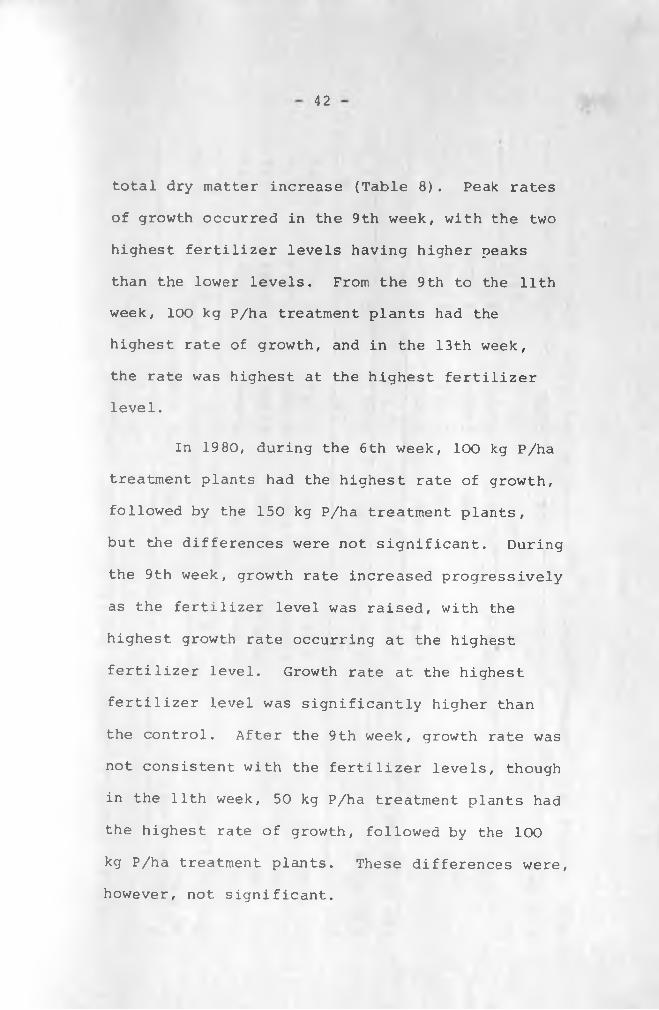
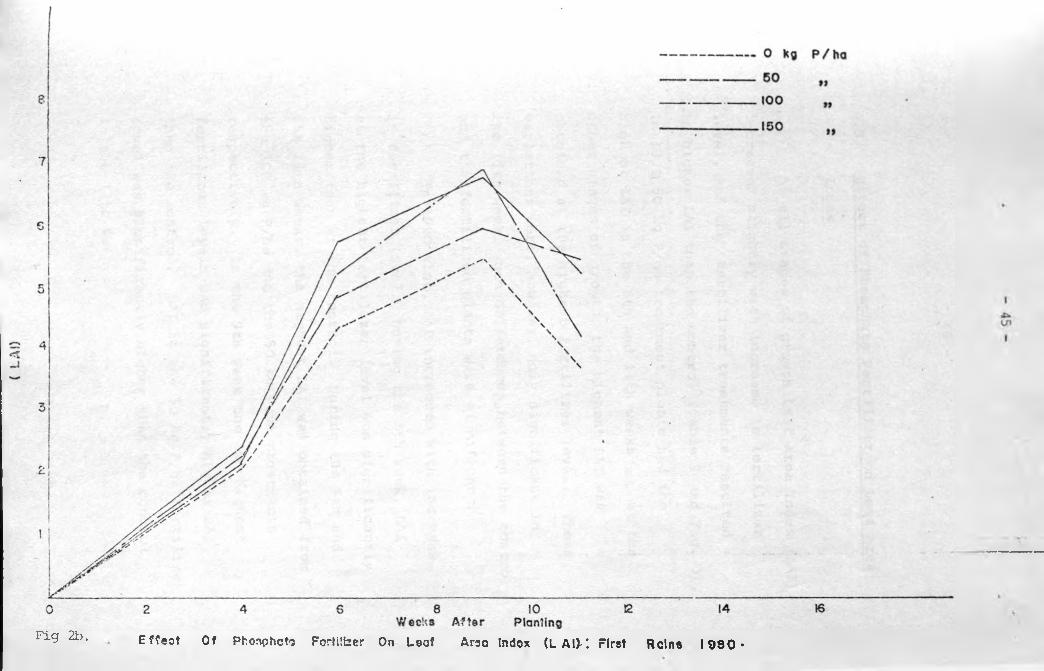
4.3. Effect of Phosphate Fertilizer on Leaf Area
Index
At all stages of growth Leaf Area Indek (LAI)
increased slightly with increase in fertilizer
level, and the fertilizer treatments resulted
in higher LAI than the control (Table 9 and Fig. 3).
In 1979 50 kg P/ha treatment plants had the
highest LAI in the 8th and 11th weeks but at the
other stages of growth, the highest LAI was
obtained at the highest fertilizer level. These
variations were, however, only significant in
the 1 1 th week, when differences between the control
and the fertilized plants were significant.
In 1980 also, LAI increased with increase
in fertilizer level. During the 6th week, LAI
at the highest fertilizer level was significantly
higher than at the control. During the 9th and
the 11th weeks, the highest LAI was obtained from
the 100 kg P/ha and the 50 kg P/ha treatments
respectively. In the 9th week the two highest
fertilizer levels had significantly higher LAI
than the control. LAI at the 50 kg P/ha fertilizer
level was significantly higher than the control
in the 1 1 th week.

47
4.4. Effect of Phosphate Fertilizer on Dry Matter
4.4.1. Leaf Dry Matter
Leaf dry matter increased with increase
in fertilizer level (Table 10 and Fig. 4). In
the 1979 crop, up to the 6th week, these dry
matter increases were consistently higher at the
highest fertilizer level but the variations
among the treatments were not significant.
Significant differences were obtained in the 8th
and 11th weeks. In the 8th week 50 kg P/ha
treatment plants had significantly higher dry
matter than the control, but not significantly
different from the other fertilizer treatments.
In the 9th week, the highest fertilizer level
had the highest leaf dry matter. In the 11th week,
100 kg P/ha treatment plants had the highest leaf
dry matter. Difference in dry matter between this
level and the control was significant. During
the 6th, 11th and 13th weeks, leaf dry matter tended
to decline at the highest fertilizer level.
In 1980, the trend of increasing leaf
dry matter with rise in fertilizer level was

Table 10: Effect of Phosphate fertilizer on leaf dry matter: gms/plant
Fertilizer level: kg P/ha2nd rains 1979
Weeks after planting
4 6 8 9 1 1 130 0. 69a 2 .0 2a 3.03a 3.83a 2.34a 1. 39a50 0.71a 2.15a 3.9 8b 3.82a 2 . 6 8 ab 1. 47a
100 0. 75a 2.14a 3.4 3 ab 4.28a 3.20b 1.74a150 0.78a 2.23a 3.71 ab 4.66a 2 .8 7 ab 1 .68aC. V. % 19 23 32 28 27 43S . E . me an 0.04 0 . 1 2 0 . 29 0 . 30 0.19 0.17
1st rains 1980 4 6 9 1 1 13 150 1.67a 4.51a 6.42a 5.35a 4.36a 0. 79a50 1.74a 4.64a 6.28a 6.82a 4.05a 0. 76a
100 1.87a 5.29a 7.3 3 ab 6. 38a 5.04a 1.07b150 1.91a 5.01a 8.17b 6.61a 4.85a 1.24b
C . V . % 22 27 33 35 39 35S . E . Me an 0 . 1 0 0.33 0.58 0. 55 0.49 0.09
N.B. Figures with the same letter in each column do not differ significantly

Dry
iia
Vitf
Iqro
/Pla
nt
8 O Kg p/ha!!
7j
6}
50
100
M>»
— 160 »»
i
5;
IJkVO
I
i ^n
/Pfc
nt
Fig 3d . Effect Of Phosphcie Fatilizar On Loot Dry Matter Por Plant I First Rains 1980 •
51
observed, with significant differences occurring
in the 9th and 15th weeks. In the 9th week, 150
kg P/ha treatment plants had significantly
higher leaf dry matter than both the control and
the 50 kg P/ha treatment plants. In the 15th
week, the two highest fertilizer levels had
significantly higher leaf dry matter than the
control and the 50 kg P/ha treatment. 150 kg
P/ha treatment plants had non-significantly
higher dry matter than that at the 100 kg P/ha
treatment.
4.4.2. Stem Dry Matter
The trend of increasing amounts of stem
dry matter with rise in fertilizer level was
quite clear (Table 11), though significant
differences occurred only at some stages of
growth. In 1979, significant differences were
obtained in the 13th week of growth when dry
matter at the two highest fertilizer levels was
significantly higher than at the control. In
1980, the two highest fertilizer levels had
consistently higher stem dry matter than the
control. In the 6th and the 13th week, 100 kg
P/ha had significantly highest stem dry matter.

Table 11. Effect of phosphate fertilizer on stem dry matter gms/plant
Fertilizer level kg P/ha2nd rains 1979
Weeks after planting
4 6 8 9 1 1 130 0. 19a 0 .68a 1.43a 2.17a 2 .1 0a 1.95a50 0 . 18a 0 .68a 1.60a 2.31a 2 .2 1 a 2 .2 2ab
100 0 . 20a 0. 70a 1.33a 2.43a 2.76a 2.48b150 0 . 20a 0. 69a 1.46a 2.50a 2.46a 2.50b
C. V. % 17 25 32 31 33 28S . E . Mean 0 . 0 1 0.04 0 . 12 0.19 0.19 0.17
1st rains 1980 4 6 9 1 1 13_ 150 0.46a 1.81a 3.27a 3.84a 4.5 lab 3.61a50 0 . 45a 1 .68a 3.48ab 4.80a 3.76a 3.71a
10 0 0. 50a 2.25b 4.28b 4.92a 5.15b 4.04 a150 0.51a 1 .8 6ab 4.41b 4.89a 4.57 ab 4.08a
C. V. % 25 29 32 35 27 27 .S.E. Mean 0 . 03 0. 14 0 . 31 0.40 0.31 0.26
N.B. Figures with the same letter in each column do not differ significantly.
53
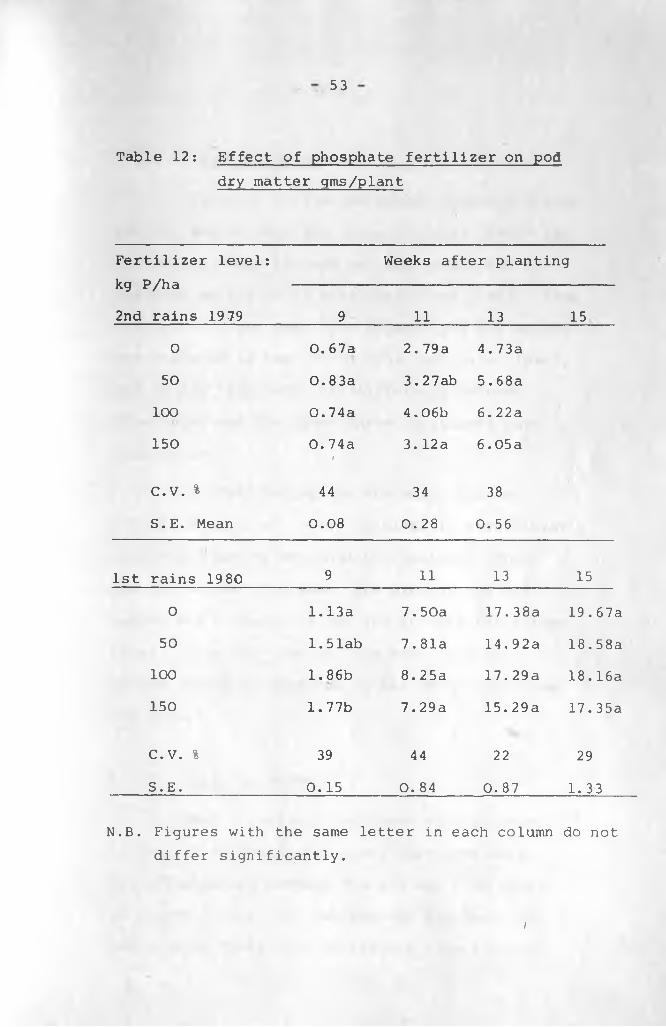
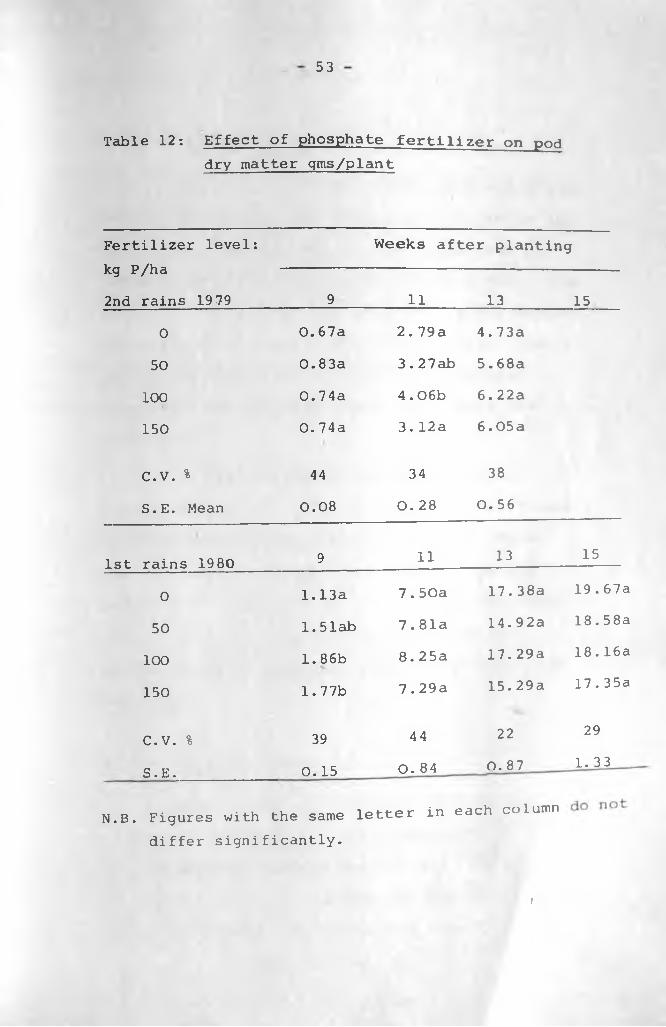
Table 12: Effect of phosphate fertilizer on poddry matter gms/plant
Fertilizer kg P/ha
2nd rains
■ level:
19 79
Weeks after planting
9 1 1 13 15
0 0.67a 2.79a 4.73a
50 0.83a 3.27ab 5.68a
100 0.74a 4.06b 6 .22a
150 0. 74ai
3.12a 6.05a
C.V. % 44 34 38
S.E. Mean 0.08 0.28 0. 56
1 st rains 1980 9 1 1 13 15
0 1.13a 7.50a 17.38a 19.67a50 1 .5lab 7.81a 14.92a 18.58a
100 1 .86b 8.25a 17.29a 18.16a150 1.77b 7.29a 15.29a 17.35a
C.V. % 39 44 22 29S.E. 0.15 0. 84 0 . 87 1. 33
N.B. Figures with the same letter in each column do not differ significantly.
i
53
Table 12: Effect of phosphate fertilizer on poddry matter gms/plant
Fertilizer level: kg P/ha
2nd rains 1979
Weeks after planting
9 1 1 13 15.
0 0.67a 2.79a 4.73a
50 0.83a 3.27ab 5.68a
100 0.74a 4.06b 6 .2 2a
150 0. 74a 3. 12a 6.05a
C.V. % 44 34 38
S.E. Mean 0.08 O. 28 0. 56
1st rains 1980 9 1 1 13 15
0 1.13a 7.50a 17.38a 19.67a
50 1 .Slab 7 .81a 14.92a 18.58a
100 1 .86b 8.25a 17.29a 18.16a
150 1.77b 7.29a 15.29a 17.35a
C.V. % 39 44 22 29
S.E.___________ 0.15 O. 84 O. 87 1. 33 .
N.B. Figures with the same letter in each column differ significantly.
i

54
4.4.3. Pod Dry Matter
In 1979, fertilized plants produced higher
pod dry matter than the control plants (Table 12).
In the 9th week, highest pod dry matter was
produced at the 50 kg P/ha fertilizer level. From
the 11th to 13th week, the highest nod dry matter
was produced at the 100 kg P/ha fertilizer level,
and in the 1 1 th week, the difference between
this level and the other three treatments was
significant.
In 1980 during the 9th week, the two
highest fertilizer levels resulted in significantly
higher pod dry matter than the control. From
the 9th to the 11th week, the highest pod dry
matter was produced at the 100 kg P/ha fertilizer
level. From the 13th to 15th week, pod dry
matter tended to decrease as the fertilizer level
was raised.
4.4.4. Root Dry Matter
Root dry matter increased with increase
in fertilizer level, but these increases were
only significant between the 9th and 11th weeks
of growth (Table 13). During the 9th week, the
two highest fertilizer levels had significantly
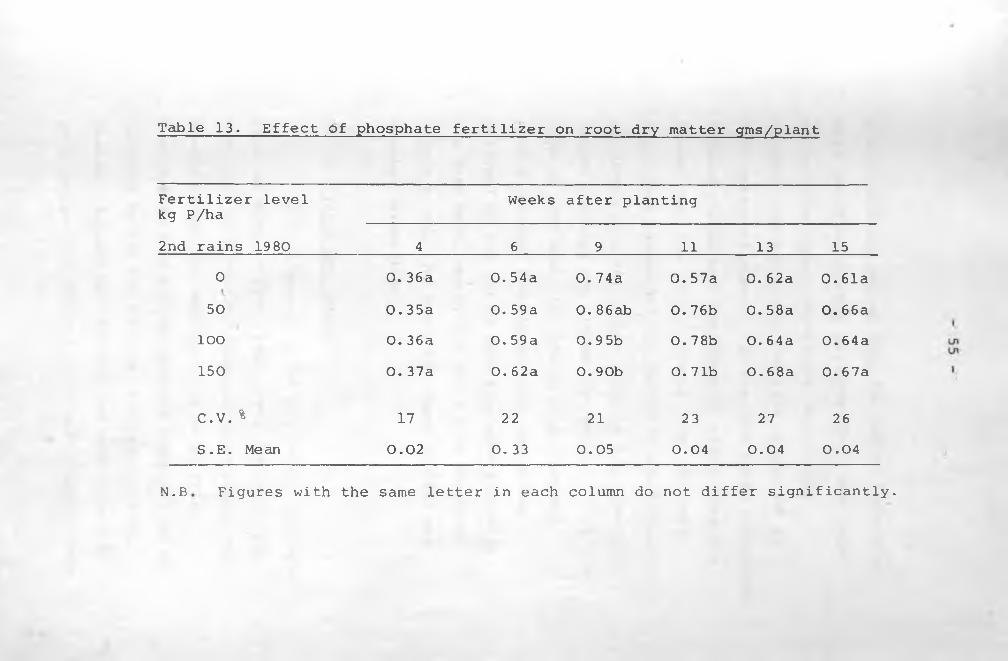
Table 13. Effect Of phosphate fertilizer on root dry matter gms/plant
Fertilizer level kg P/ha
Weeks after planting
2nd rains 1980 4 6 9 1 1 13 150 0. 36a 0.54a 0. 74a 0. 57a 0 . 62a 0.61a50 0.35a 0. 59a 0 .86ab 0. 76b 0. 58a 0 . 6 6a
lOO 0. 36a 0. 59a 0.9 5b 0. 78b 0. 64a 0.64a150 0. 37a 0.62a 0. 90b 0.71b 0 .68a 0. 67a
C.V. % 17 22 21 23 27 26S . E . Me an 0 . 0 2 0. 33 0.05 0.04 0.04 0.04
N.B Figures with the same letter in each column do not differ significantly.

56
higher root dry matter than the control, but they
were not significantly different from each other
or from the lowest fertilizer level. The
highest root dry matter occurred in the 100 kg
P/ha treatment plants. In the 11th week, fertilizer-
treated plants had significantly higher root dry
matter than the control plants, but the three
fertilizer levels did not result in significantly
different root dry matter. 100 kg P/ha treatment
plants produced the highest dry matter. From the
13th to 15th week, the 150 kg P/ha treatment
plants produced the highest root dry matter
followed by the 100 kg P/ha treatment plants in .
the 13th week, and by the 50 kg P/ha treatment
plants in the 15th week, but these differences
were not significant.
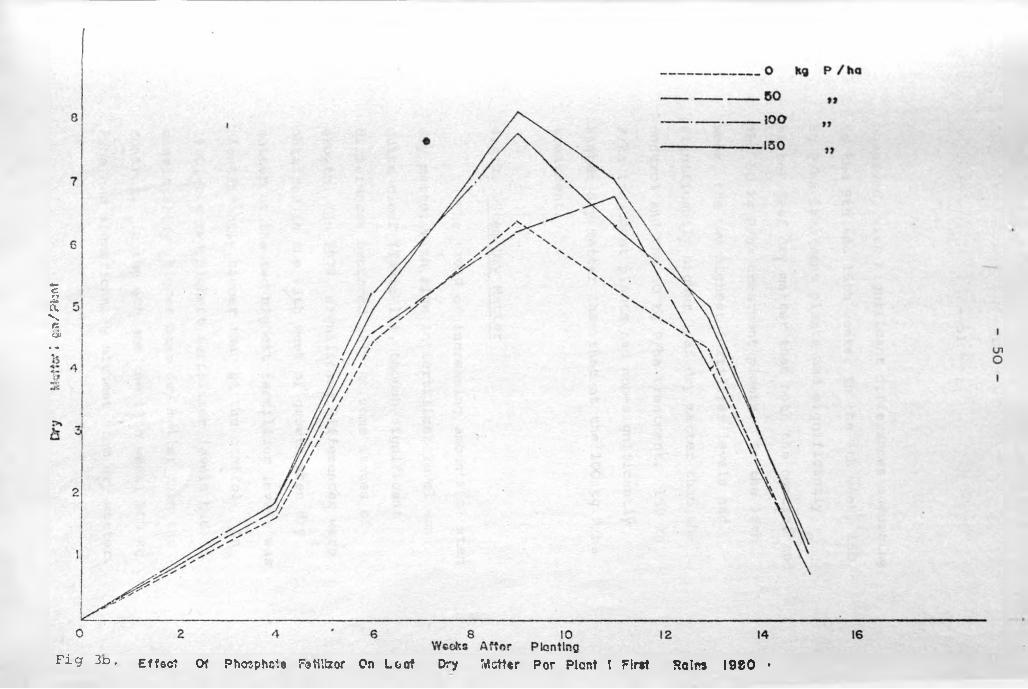
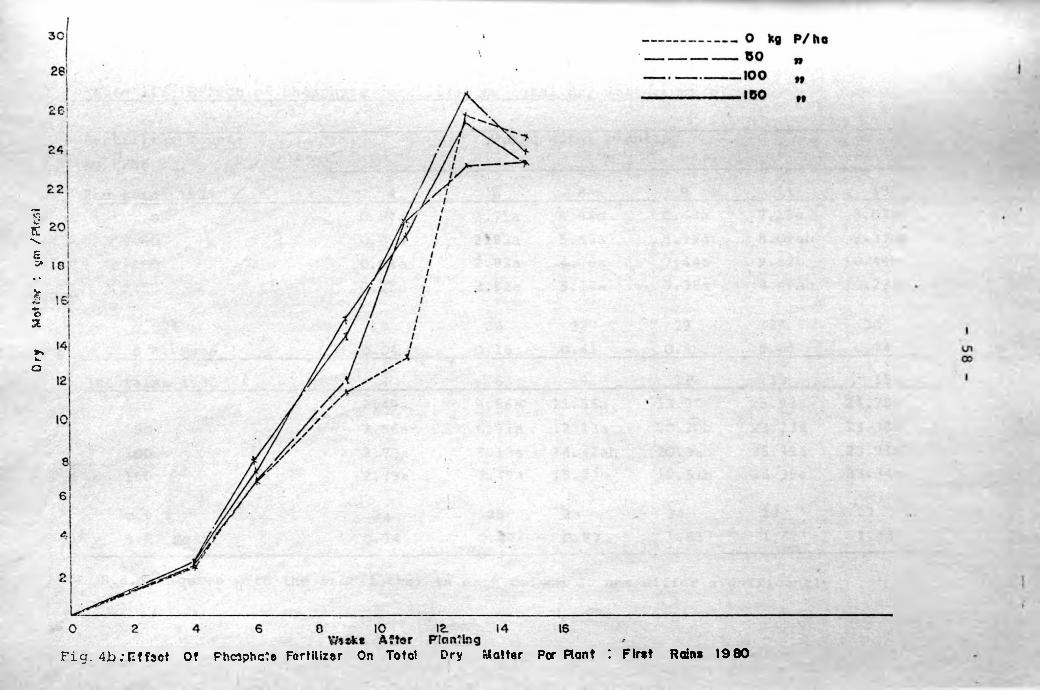
4.4.5. Total Dry Matter
In both seasons total dry matter increased
with increase in fertilizer level (Table 14 and
Fig. 5). In 1979, the increases were consistent
except in the 8th week when the 50 kg P/ha
treatment plants had the highest total dry matter
followed by the 150 kg P/ha, treatment plants.
However, significant differences were obtained
only in the 11th and the 13th week. During these

F i g . 4a. Of Ph03j>hoto Fertilizer On Tote! Dry Matter Par Plant Seoand Rain* 1079
---------------------- O kg P / ha— 50 M »»— ------- 100 » »>
150 n n
Ory
Motf&v *.
ym / Rr.nl
Fig. 4h:n?fact Of Phcrjphcte Fertilizer On Told Dry Matter For Rant *. First Rains 1980

Table 14. Effect of phosphate fertilizer on total dry matter; gms/plant
Fertilizer level: kg P/ha
2nd rains 1979
Weeks after planting
4 6 8 9 1 1 130 0.87a 2.71a 4.96a 6.69a 7.17a 8.07a50 0. 89a 2.83a 5.59a 6.99a 8.09 ab 9.37ab
10O 0.9 4a 2.83a 4.76a 7.44a 9.52b 10.44b150 0.98a 2.92a 5.17a 7.78a 8 .4 6 ab 10.23b
c. v . % 18 22 32 29 29 30S .E. Mean 0. 04 0.16 0. 41 0.55 0.61 0.74
1st rains 1980 4 6 9 1 1 13 150 2.49a 6 .8 6a 11.55a 13.30a 25.93a 24.78a50 2.56a 6.91a 12.13a 2 0.20b 23.23a 23.36a
100 2.73a 8.13a 14.4 2 ab 20.32b 26.99a 23.91a150 . 2.79a 7.49a 15.27b 19.51b 25.39a 23.34a
c. v . % 21 25 29 34 22 27S . E . Mean 0. 14 0.47 0.97 1.65 1.62 1.43
N.B. Figures with the same letter in each column do not differ significantly
60
last two weeks, lOO kg P/ha treatment plants had
the highest total dry matter. In the 11th week,
total dry matter at the 100 kg P/ha treatment
was significantly higher than at the control but
dry matter amounts at the three higher fertilizer
treatments were not significantly different
from each other. In the 13th week, both 100 kg
P/ha and 150 kg P/ha treatments had significantly
higher dry matter than the control, but not
significantly different from that at the 50 kg
P/ha treatment or from each other.
In 1980, total dry matter increased as
fertilizer level was raised up to the 9th week,
but during the 6th and 1 1 th weeks the highest
total dry matter occurred at the 100 kg P/ha
treatment, decreasing slightly at the highest
fertilizer level. These differences were, however,
not significant. In the 9th week, the highest
fertilizer level had significantly higher total
dry matter than the control and the 50 kg P/ha
fertilizer level. In the 11th week, fertilized plants
had significantly higher dry matter than the control,
but differences within the three fertilizer
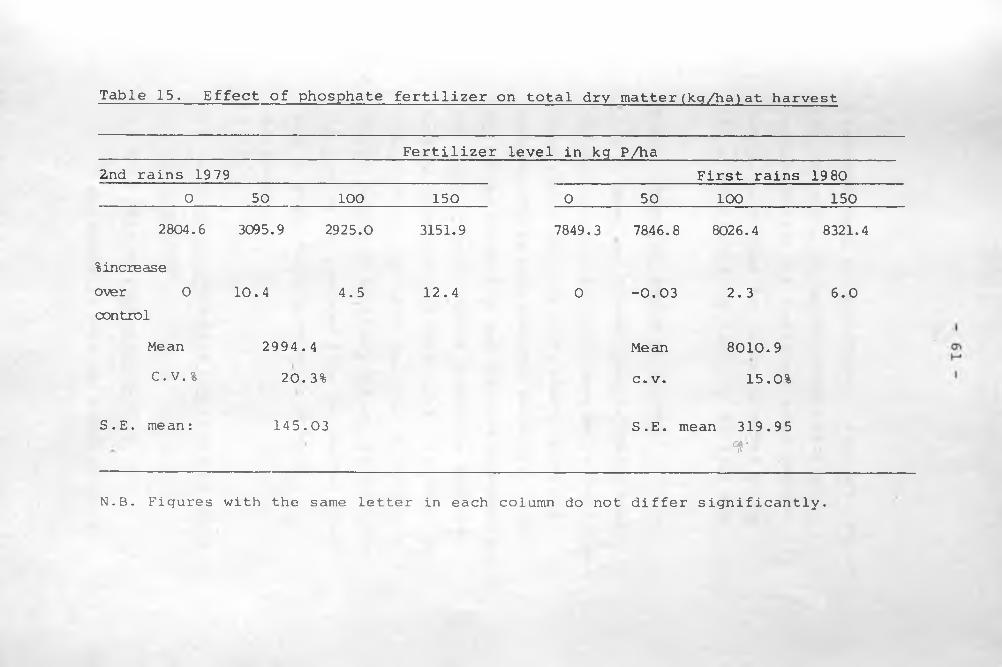
Table 15. Effect of phosphate fertilizer on total dry matter(kg/ha)at harvest
Fertilizer level in kg P/ha2nd rains 1979 First rains 19 80
0 50 100 150 0 50 100 1502804.6 3095.9 2925.0 3151.9 7849.3 7846.8 8026.4 8321.4
%increaseover 0 10.4 4.5 12.4 0 -0.03 2.3 6 . 0
control
Mean 2994.4 Mean 8010.9C. V. % 20. 3% c. V. 15.0%
S .E . mean: 145.03 S.E. mean 319.95T
N.B. Figures with the same letter in each column do not differ significantly.
62
treatments were not significant. From the 13th to
the 15th week, dry matter amounts were not
consistent with the fertilizer level changes,
though the highest dry matter occurred at the
100 kg P/ha fertilizer level in the 13th week.
4.4.6. Total Dry Matter at Harvest
There was a trend towards rising total
dry matter production with increase in fertilizer
level (Table 15). In 1979, plants which had
received 150 kg P/ha produced about 3152 kg of
dry matter per hectare and this was approximately
1 2% higher than dry matter production from the
control which was only 2805 kg/ha. In 1980, the
highest fertilizer level resulted in production
of 8321 kg /ha of total dry matter, 6% more than
the 7849 kg /ha produced from the control plants.
None of these differences were, however,
significant.
4.5. Effect of Phosphate Fertilizer on Yield
Components
4.5.1. Number of Pods per Plant
The number of pods per plant increased

63
with increase in fertilizer level except at the
final harvest in the 1980 crop when the number
decreased from about 1 1 in the control plants
to 9 at the highest fertilizer level (Table 16).
Significant differences were, however, obtained
in only a few stages of growth. In 1979 during
the 11th week, 100 kg P/ha treatment plants had
significantly higher number of pods per plant
than at any other treatment. At other stages of
growth and even at the final harvest, the highest
pod number per plant occurred at the 150 kg P/ha
treatment, though the difference between this
and the other treatments was not significant.
In the 1980 crop, during the 11th week,
plants at the 150 kg P/ha treatment had
significantly-higher number of pods per plant
than the control. This number was also higher
than at the two lower fertilizer levels but the
difference was not statistically significant. In
the 13th week 100 kg P/ha treatment plants had
the highest number of pods per plant, but the
number was not significantly higher than that at
the other treatments. In the 15th week, the
highest number of pods per plant was obtained
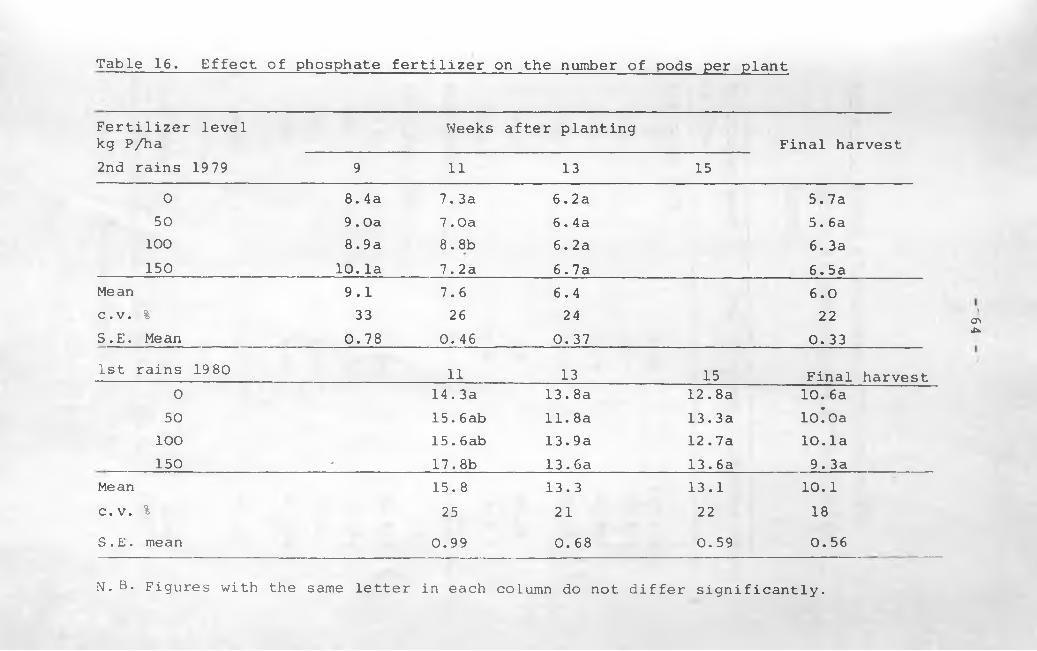
Table 16. Effect of phosphate fertilizer on the number of pods per plant
Fertilizer level kg P/ha
Weeks after plantingFinal harvest
2nd rains 1979 9 1 1 13 150 8. 4a 7.3a 6 .2a 5.7a50 9 . Oa 7 .Oa 6.4a 5.6a
100 8.9a 8 . 8 b 6 .2a 6 . 3a150 1 0 . la 7.2a 6.7a 6.5a
Mean 9.1 7.6 6.4 6 . 0c . v. % 33 26 24 22
S .E. Mean 0.78 0. 46 0. 37 0. 331st rains 1980 1 1 13 15 Final harvest
0 14. 3a 13.8a 1 2 .8a 1 0 . 6a50 15.6ab 1 1 .8a 13.3a lo! Oa
100 15.6ab 13.9a 12.7a 1 0 .1 a150 - 17.8b 13.6a 13.6a 9.3a
Mean 15.8 13.3 13.1 1 0 . 1
C . V . % 25 2 1 22 18S . E . m ean 0.99 0 . 68 0.59 0. 56
N. B. Figures with the same letter in each column do not differ significantly.
P9 -
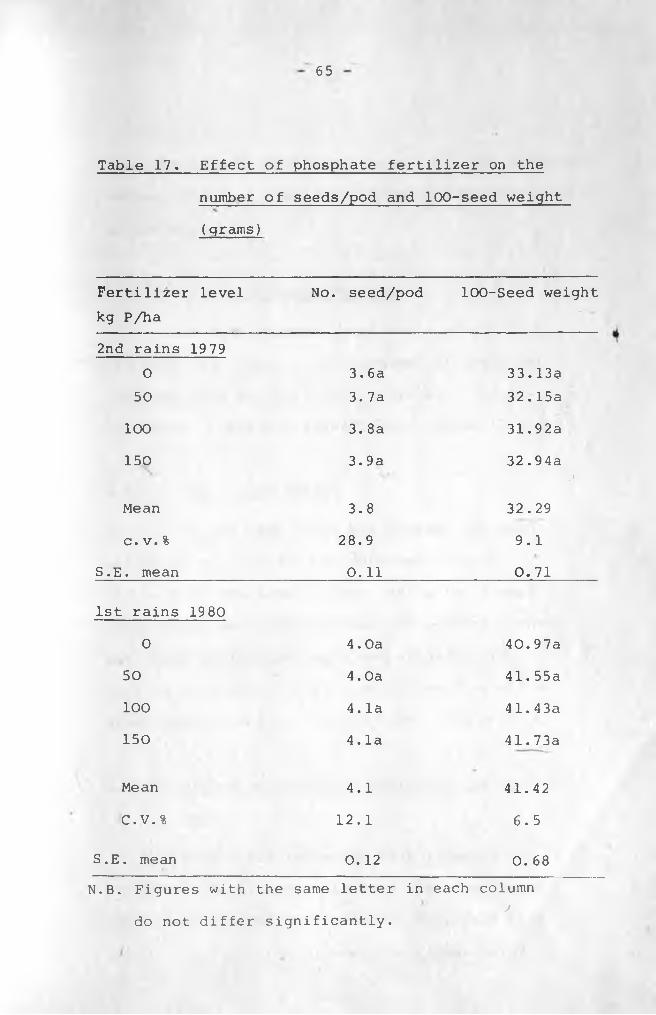
65
Table 17. Effect of phosphate fertilizer on the
number of seeds/pod and 10 0-seed weight
(grams)
Fertilizer level No. seed/pod 100-Seed weightkg P/ha
2nd rains 19790 3.6a 33.13$50 3.7a 32.15a
100 3. 8a 31.92a
150 3.9a 32.94a, 1
Mean 3.8 32.29
c. v. % 28.9 9.1
S.E. mean 0 . 1 1 0. 71
1 st rains 1980
0 4.0a 40.97a
50 4.0a 41.55a
100 4.1a 41.43a
150 4. la 41.73a
Mean 4.1 41.42
C. V. % 1 2 . 1 6.5
S.E. mean 0 . 12 0 . 68
N.B. Figures with the same letter in each columnj
do not differ significantly.
- 66
from the highest fertilizer level, but the difference
between this and the other treatments was not
significant.
4.5.2. Number of Seeds Per Pod
In both seasons there was a slight
increase in the number of seeds per
pod with rise in fertilizer level but these
increases were not significant, (Table 17).
4.5.3. 100 - Seed Weight
In the 1980 crop, the highest 100-seed
weight of 41.73 grams was obtained from the
150 kg P/ha treatment plants, while the lowest
seed weight was obtained from the control plants,
but these differences were not significant.
In 1979 fertilizer effects on 100-seed weight were inconsistent and insignificant (Table 17).
4.6. Effect of Phosphate Fertilizer on Seed
YieldI
Seed yield increased with increase ii(i ';
fertilizer level except in 1979 when the lowest
yield was obtained at the 100 kg P/ha fertilizer
level. In 1979, the highest fertilizer level
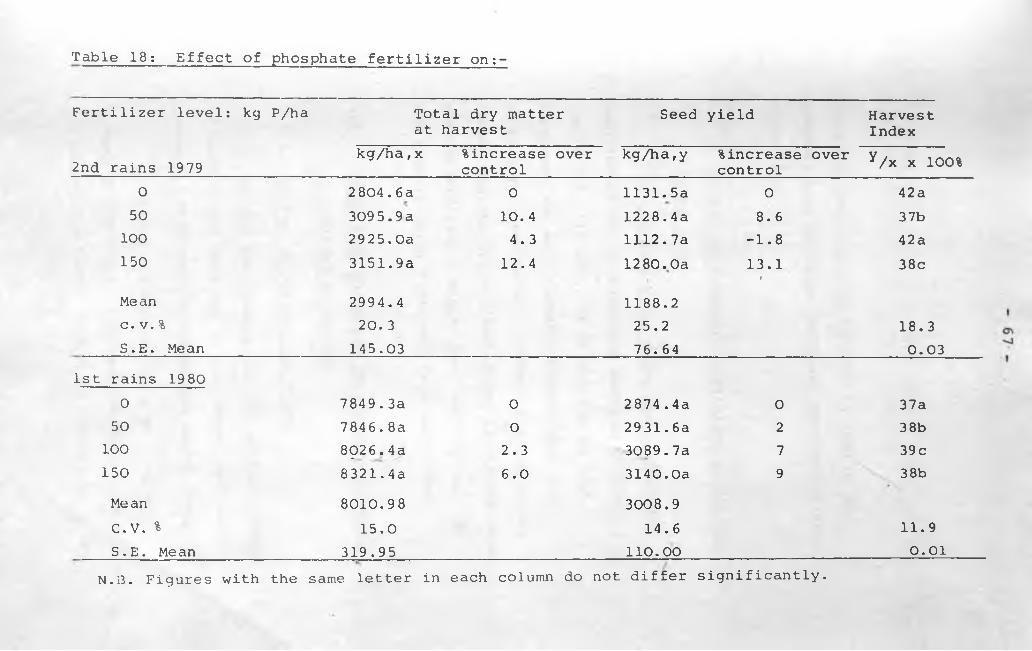
Table 18: Effect of phosphate fertilizer on:-
Fertilizer level: kg P/ha
2nd rains 1979
Total dry matter at harvest
Seed yield HarvestIndex
kg/ha,x ^increase over control
kg/ha,y %increase over control Y/x x 1 0 0%
0 2804.6a 0 1131.5a 0 42a50 3095.9a 10. 4 1228.4a 8 . 6 37b
100 2925.0a 4.3 1112.7a -1 . 8 42a150 3151.9a 12.4 1280.0a 13.1l 38c
Mean 2994.4 1188.2c. v. % 20. 3 25.2 18.3S.E. Mean 145.03 76.64 0.03
1st rains 19800 7849.3a 0 2874.4a 0 37a
50 7846.8a 0 2931.6a 2 3 8b100 8926.4a 2.3 3089.7a 7 39c150 8321.4a 6 . 0 3140.0a 9 38bMe an 8010.98 3008.9C.V. % 15.0 14.6 11.9S.E. Mean 319.95 1 1 0 . 0 0 0 . 0 1
N.B. Figures with the same letter in each column do not differ significantly.
- 68 -f > . _
increased seed yield by 13% and in 1980 by 9%.
However, none of these increases were significant
(Table 18).
4.7. Effect of Phosphate Fertilizer on Harvest
Index (HI)
In the 1979 crop, there was no definite
response of HI to increased fertilizer level
(Table 18). In 1980, HI at the 100 kg P/ha
treatment was significantly higher than the
other three treatments. Harvest indices at the
lowest and the highest fertilizer treatments were
also significantly higher than the control, but
not significantly different from each other.
4.8. Effect of Phosphate Fertilizer on Number
and Weight of Nodules
4.8.1. Number of Nodules per Plant
In all the treatments, the highest number
of nodules was obtained in the fourth week and
gradually decreased in subsequent weeks (Table 19).
In 1979 during the 8th week of growth,
plants at the 150 kg P/ha and 100 kg P/ha fertilizer
treatments had higher number of nodules per plant

Table 19. Effect of phosphate fertilizer on number of nodules per plant
Fertilizer level kg P/ha2nd rains 1979
Weeks after planting
4 8 9 1 1
0 18a 7a 4ab50 17a 7a 3a
100 15a 8a 4 ab150 14a 8a 5bc .v.% 43 47 54S . E . me an . 1^67 0 . 8 6 0. 55
1st rains 1980 4 6 9 1 1
0 28a 29a 16a 8a50 45b 4 lc 20c 1 2b
100 40ab 36b 18b 1 2b150 53b 48d 2 2d 13cC. V. % 43 40 46 46S.E. mean ^4.40 *0. 76 0. 44 0.25
N.B. Figures with the same letter in each column do not differ significantly.

70
than those at the control and the 50 kg P/ha
fertilizer treatment, but the differences were
not significant (Table 19). In the 9th week,
the number of nodules increased significantly
from 3 at the 50 kg P/ha fertilizer treatment to
5 at the 150 kg P/ha treatment. Nodule number
at the 100 kg P/ha treatment was not significantly
different from that at the control.
In 1980, there were h i g h l y significant phosphate fertilizer effects on the number of
nodules per plant. At all stages of growth, the
number increased significantly as the fertilizer
level was raised from 0 to 50 kg P/ha. At all
stages of growth, there was a drop in nodule
number as the fertilizer level increased from 50
kg P/ha to 100 kg P/ha, but the drop was significant
only in the 6th and 9th weeks. The nodule number
rose again significantly as the fertilizer level
was increased to 150 kg P/ha. Plants treated
with the higher fertilizer level had the largest nodule number. The d i f fe r e n c e s betw een tn e e f f e c t o f t h is
level: and th e e f f e c t o f a l l o th e r l e v e l s was s i g n i f i c a n t a t
P = 0.05. From the 9th to the 11th week, the
difference was significant also at the 1% level.
Table 20. Effect of phosphate fertilizer on the weight of nodules;mgs/plant
Fertilizer level kg P/ha Weeks after planting
2nd rains, 1979 4 8 9 110 175.6d 232.5a 144.4c50 133.8b ' 293.1b 82.5a
100 * 158.8c 335.0c 117.5b150 115.6a 328.8c 191.3dc. v. % 55 68 79S.E. mean 2.08 5.06 2.50
1st rains 1980 4 6 9 110 176.9a 205.0a 136.0a 47.6a50 325.8b • 335.5b 256.5ab 76.9ab
100 320.6b 2 9 0. 8 ab 332.0b 89.7bc150 410.8b 463.4c 377.0b 119.1cc. v. % 47 45 73 63S.E. mean 36.40 36*. 74 ?0.2 5 13.23
N.B. Figures with the same letter in each column do not differ significantly.
72
4.8.2. Nodule Weight
In 1979, up to the 4th week consistent
fertilizer effects were not obtained (Table 20).
During the 8th week, nodule weight increased
significantly with increase in fertilizer level,
with the highest weight occurring at the 100 kg
P/ha fertilizer level. During the 9th week,
nodule weight difference between 50 kg P/ha and
150 kg P/ha fertilizer levels was significant.
In 1980, nodule weight increased
significantly as the fertilizer level was raised
from 50 kg P/ha to 150 kg P/ha, with a small
depression at the 100 kg P/ha fertilizer level
from the 4th to the 6th weeks. In the 4th week,
nodule weight at each of the three fertilizer levels
was significantly higher than the control, but
the difference among the three levels were not
significant. In the 6th week, nodule weights at
the 150 kg P/ha treatment was significantly
higher than at the other treatments. Nodule weights at
the 50 kg P/ha and 100 kg P/ha treatments were higher than
the control but were not significantly different
from each other. In the 9th and 11th weeks the

73
two highest fertilizer levels had significantly
higher nodule weight than the contol, but were not
significantly different from each other.
4.9. Plant Population Effects on the Rate of
Growth
4.9.1. Leaf Growth Rate
Up to the 9th week of growth in the 1979
crop, leaf growth rate per plant decreased with
increase in plant population. Up to the 8th
week, the two highest plant populations had
significantly lower leaf growth rate than the
two lower populations, but differences within
P-̂ and P2, and within P2 and P^ were not
significant (Table 21). In the 9th week, negative
leaf growth had already commenced at the highest
population (P4). Negative leaf growth at all
the other populations commenced in the 1 1 th
week. Lower plant populations lost dry matter
(per plant) at a greater rate than the higher
populations. From the 11th to the 13th week,
the two higher populations had significantly
lower rates of leaf dry matter decline
per plant than P. , but these rates were not
significantly different from each other.
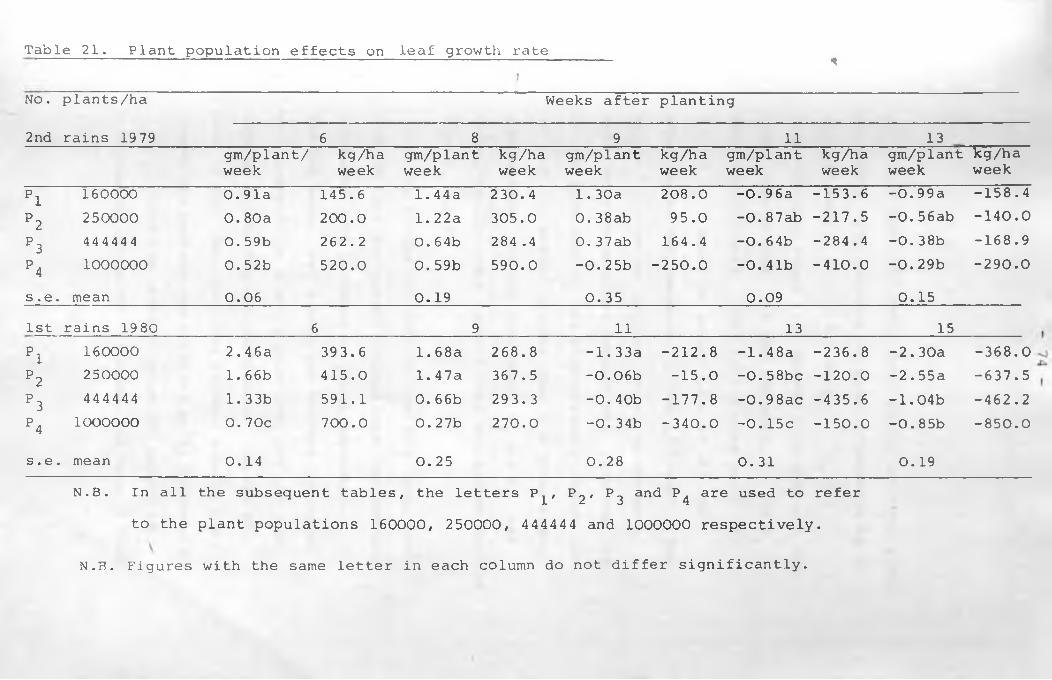
Table 21. Plant population effects on leaf growth rate5
1
No . plants/ha Weeks after planting
2nd rains 1979 6 8 9 1 1 13gm/plant/week
kg/haweek
gm/plantweek
kg/haweek
gm/plantweek
kg/haweek
gm/plantweek
kg/haweek
gm/plant kg/ha week week
pi 160000 0.91a 145.6 1.44a 230.4 1.30a 208.0 -0.96a -153.6 -0.99a -158.4
P 2 250000 0.80a 2 0 0 . 0 1 .2 2a 305.0 0.38ab 95.0 -0.87ab -217.5 -0.56ab -140.0
P3 444444 0. 59b 262.2 0.64b 284 .4 0. 3 7 ab 164.4 -0.64b -284.4 -0.38b -168.9
P4 1000000 0.52b 520.0 0.59b 590.0 -0.25b -250.0 -0.41b -410.0 -0.29b -290.0
s . e . mean 0.06 0.19 0. 35 0.09 0.151 st rains 1980 6 9 1 1 13 15pi 160000 2.46a 393.6 1 .68a 268.8 -1.33a -2 1 2 . 8 -1.48a -236.8 -2.30a -368.0P 2 250000 1 .66b 415.0 1.47a 367.5 -0.06b -15.0 -0.58bc -1 2 0 . 0 -2.55a -637.5P3 444444 1.33b 591.1 0 . 66b 293.3 -0.40b -177.8 -0.98ac -435.6 -1.04b -462.2P4 lOOOOOO 0 . 70c 700.0 0.27b 270.0 -0.34b -340.0 -0.15c -150.0 -0.85b -850.0
s. e . mean 0.14 0. 25 0 . 28 0.31 0.19N.B. In all the subsequent tables/ the letters P^, P ^ r P^ and P^ are used to refer
to the plant populations 160000, 250000, 444444 and 1000000 respectively.
N.B. Figures with the same letter in each column do not differ significantly.
75
In the 1980 crop, leaf growth rate -per plant
decreased with increase in plant population up to
the 9th week. In the 6th week, had
significantly lower leaf growth rate than all the
other populations. In the 9th week, and P^
had significnantly lower leaf growth rates than
P^ and Negative growth rate at all the
populations had commenced by the 11th week. The
rate of dry matter decline tended to decrease
with increase in plant population. From the 11th
to the 13th week P^ had significantly higher rate
of leaf dry matter decline than the three higher
populations. In the 15th week, P^ and P^ had
significantly lower rate of leaf dry matter decline
than P^ and P^•
Up to the 8th week in the 1979 crop, the
rate of leaf dry matter accumulation per hectare
increased with increase in plant population. In
the 9th week, leaf growth per hectare decreased
with increase in plant population, and had even
negated at the highest population. In the 9th
week of the 1980 crop, the highest rate of leaf
growth per hectare was obtained at P2 followed by
P^. With the onset of negative growth in
both seasons after the 9th week, the rate of leaf
76
dry matter decline per hectare tended to increase
with increase in plant population.
4.9.2. Stem Growth Rate
Stem growth rate per plant decreased with
increase in plant population up to the 9th week
in the 1979 crop (Table 22). Up to the 8th week,
and P2 had significantly higher stem growth
rates than and P^, but differences within P^
and P2/ and within P^ and P^ were not significant.
In the 9th week, P^ had lower growth rate than the
three lower populations. After the 9th week, stem
growth rates per plant did not appear to vary with
changes in plant population.
In the 1980 crop, P^ had significantly lower
stem growth rate per plant than the three lower
populations up to the 9th week. In the 6th week,
P2 and P^ had significantly lower stem growth rate
per plant than the control, but were not significantly
different from each other. In the 11th week, the
highest stem growth rate per plant occurred at
P2, then decreased with increase in plant population,
but differences within the four populations were
not significant.

Table 22 Effect of plant population on stem growth rate
Plant population density2nd rains 1979
Weeks after planting
6 8 9 1 1 13gm/plant kg/ha gm/plant kg/ha gm/pl&nt kg/ha gm/plant kg/ha gm/plant kg/haweek week week week week week week week week week
pi 0.33a 52.8 0 .68a 108.8 0 . 69ab 110.4 0.03a 4.8 -0.17a -27.2
P 2 0.29a 72.5 0.61a 152.5 0.91a 227.5 0 .0 1 a 2.5 0 .0 0a 0 . 0
P3 0 .2 0ab 88.9 0. 32b 142.2 0 .7 8 ab 346.7 -0.05a -2 2 . 2 0 .0 2a 8.9
P4 0.18b 180.0 0.34.b 340.0 0.27b 270.0 0.09 a 90.0 -0.03a -30.0
s .e. mean 0.03 0.08 0.18 0 . 1 2 0 . 1 1•
1 st rains 1980 6 9 1 1 13 15 i
pi 1.08a 172.8 1.26a 2 0 1 . 6 0. 4 la 65.6 0 .0 2a 3.2 -0 .35ab -56.0
P 2 0.71b 177.5 1.17a 292.5 0.49a 122.5 -0.08a -2 0 . 0 -0.67 -167.5
P3 0.67b 297.8 0.73b 324.4 0 . 20a 88.9 -0.23a -1 0 2 . 2 0.05b -2 2 . 2
P4 0.39c 390.0 0 . 49b 490.0 o . Ola 1 0 . 0 0.06a 60.0 -0 .1 2b -1 2 0 . 0
s. e . 0.06 0.13 0. 17 0 . 2 0 0.15
N.B. Figures with the same letter in each column do not differ significantly.
78
Stem growth rate per hectare increased
with increase in plant population up to the 8th
week in the 1979 crop, and up to the 9th week in
the 1980 crop. In the 9th week of the 1979 crop,
the rate of stem dry matter accumulation per hectare
.increased up to P3, then decreased at the highest
population. At later stages of growth, stem growth
rate per hectare did not appear to be influenced by
changes in plant population.
4.9.3. Pod Growth Rate
The rate of pod growth per plant increased
with decrease in plant population in both seasons
(Table 23). In the 1979 crop, and during the 11th
week of the 1980 crop, the rate of pod growth per
plant at P^ and P^ was significantly lower than at
the lower populations, but differences within P^ and
P4 were not significant. In the 13th week of the
1980 crop, pod growth rate per plant at P^ was
significantly lower than in P^ and P2» During the
15th week, pod growth rate at P3 was significantly
higher than at the three higher populations but
differences within the latter populations were not signi f icant.
In the 1979 crop, pod growth rate per
hectare increased with increase in plant population

Table 23. Effects of plant population on pod growth rate
Plant population density2nd rains 1979
Weeks after planting
1 1 13 15gm/plant/wk kg/ha/wk gm/plant/wk kq/ha/wk gm/plant/wk kg/ha/wk
pi 2.48a 396.8 1.26ab 2 0 1 . 6
P 2 1.4 3b 357.5 1.62a 405.0
P3 0.97c 431.1 0. 42c 186.7
P4 0 . 61c 610. 0 0.65bc 650.0
s.e. mean 0. 14 0.251st rains 1980
pi 3.86a 617.6 6 .1 2a 979.2 3.64a 582.4
P 2 3.13a 782.5 5.lOab 1275.0 0 . 22b 55.0
P3 1.34b 595.6 3.66bc 1626.7 0.19b 84.4
P4 0.72.b 720.0 2.15c 2150.0 0 .10b 1 0 0 . 0
s.e. mean 0. 30 0. 56 0.65
N.B. Figures with the same letter in each column do not differ significantly.
80
but there was a sharp drop at in the 13th week.
In the 1980 crop, pod growth rate per hectare
increased with increase in plant population up to
the 13th week. In the 11th week, the highest pod
growth rate per hectare occurred at In the
15th week pod growth rate per hectare was higher
at the lowest population than at the other three
populations.
4.9.4. Root Growth Rate
Up to the 9th week of the 1980 crop, the
rate of root dry matter accumulation per plant
increased with decrease in plant population
(Table 24). In the 6th week, and P^ had
significantly lower rates of root growth than the
lower populations, but differences within the two
populations were not significant. In the 9th week,
the highest rate of root growth occurred at P
After the 9th week, clear trend of root growth
changes with changes in plant population was not
observed.
Up to the 9th week, root dry matter increase
rate per hectare increased as plant population rose,
with a depression at P^. In the 11th week, the rate
80
but there was a sharp drop at in the 13th week.
In the 1980 crop, pod growth rate per hectare
increased with increase in plant population up to
the 13th week. In the 11th week, the highest pod
growth rate per hectare occurred at P^. In the
15th week pod growth rate per hectare was higher
at the lowest population than at the other three
populations.
4.9.4. Root Growth Rate
Up to the 9th week of the 1980 crop, the
rate of root dry matter accumulation per plant
increased with decrease in plant population
(Table 24). In the 6th week, P^ and P^ had
significantly lower rates of root growth than the
lower populations, but differences within the two
populations were not significant. In the 9th week,
the highest rate of root growth occurred at P^*
After the 9th week, clear trend of root growth
changes with changes in plant population was not
observed.
Up to the 9th week, root dry matter increase
rate per hectare increased as plant population rose,
with a depression at P^. In the 11th week, the rate
Table 24. Effect of plant population on root growth rate
Plant population densi ty
Weeks after planting
1st rains 1979 6 9 1 1 13 15gm/plant/wk
kg /ha wk
gm/plant/wk
kg/hawk
gm/plant/wk
kg/ha/wk
gm/plant/wk
kg/ha/wk
gm/plant/wk
kg/ha/wk
pi 0.23a 36.8 0. 13b 2 0. 8 0 .0 1 a 1 . 6 -0 .1 1 a -17.6 0.05a 8 . 0
P 2 0. 13b 32.5 O. 23a 57.5 -0 .10b -25.0 -0 .0 2a -5.0 -0.04a -1 0 . 0
P3 0. 05c 2 2 . 2 0 . lib 48.9 -0.07b -31.1 -0 .0 1 a -4.4 0 .0 1 a 4.4 t
P4 0.04c 40.0 0.06b 60.0 -0.06b -60.0 -0 .0 2a -2 0 . 0 0 .0 1 a 1 0 . 0
s.e. mean 0 . 02 0. 03 0.03 0.04 0.03
N.B. Figures with the same letter in each column do not differ significantly.
82
of root dry matter decline per hectare was highest
at the highest plant population, and decreased as
plant population was lowered. After the 11th week,
root dry matter changes with variations in plant
population were irregular.
4.9.5. Rate of Total Dry Matter Increase
As was the case with the individual plant
organs, the rate of total dry matter accumulation
per plant decreased with increase in plant
population (Table 25). In the 1979 crop, rates
of dry matter increase at and were
significantly lower than at P^ and up to the
8th week of growth, but growth rate differences
within the two populations were not significant.
In the 9th week plants at P had significantly
higher rate of growth, and those at P^ had
significantly lower rate of growth than at the other
populations. After the 9th week, significant
differences did not occur.
In the 6th week of the 1980 crop P^ had
significantly lower rate of growth per plant than
all the other populations. From the 9th to the
1 1 th week P^ and P^ had significantly lower rates of plant growth than the lower two populations,
83
but differences within P- and P. were not3 4significant. In the 13th week, growth rate per
plant decreased insignificantly with increase in
plant population. Plants at P^ continued to
accumulate dry matter up to the 15th week, but
negative growth at P2, P^ and P4 had already
commenced by the 15th week. The rate of dry matter
decline per plant decreased with increase in plant
population.
The rate of dry matter accumulation per
hectare increased with increase in plant population
up to the 8th week in the 1979 crop, and up to the
9th week in the 1980 crop. During the 9th week
of the 1979 crop, the highest growth rate per
hectare was obtained at P^. From the 11th to the
13th week, the highest growth rate per hectare
occurred at P^. During the 11th week of the 1980
crop the highest growth rate per hectare occurred
at ? 2 • then the rate dropped with increase in
plant population. During the 13th week, the rate
increased with increase in plant population. In
the 15th week, the highest rate of dry matter
decline per hectare occurred at P^.

Table 25: Effect of plant population on the rate of total dry matter increase
Plant population dens i ty
Weeks after planting6 8 9 1 1 13
2nd rains 1979qm/plant/wk
kg/ha/wk
gm/plant/wk
kg/hawk
gm/plant/wk
kg/ha/wk
gm/plant/wk
kg/plantwk
gm/plant/wk
kg/ha/wk
pi 1.24a 198.4 2.13a 340.8 4.24a 678.4 1.27a 203.2 0.35a 56.0P2 1.09a 272.5 1.83a 457.5 2.15ab 537.5 0.55a 137.5 1.07a 267.5
P3 0. 8Cb 355.6 0.95b 422.2 1.68bc 746.7 0.25a 1 1 1 . 1 0.56a 248.9P4 0.71b 710.0 0.93b 930.0 0.33c 330.0 0.27a 270.0 0.33a 330.0
s.e. mean 0.08 0.26 0.54 0.36 0.331st rains 1980 6 9 1 1 13 15
pi 3.76a 601.6 4.08a 652.8 3.96a 633.6 3.99a 638.4 1.40a 224.0P2 2.50b 625.0 3.57a 892.5 3.45a 862.5 3.83a 957.5 -2.67b -667.5P3 2.04b 906.7 2.27b 1008.9 1.08b 480.0 2.30a 1022.2 -0.77ab -342.2P4 1 .12c 1120.0 1.27b 1270.0 0. 34b 340.0 2.04a 2040.0 -0.87ab -870.0
s.e. 0.19 0.40 0.64 1.00 0.90
N.3. Figures with the same letter in each column do not differ significantly
Table 26: Effect of plant population on Leaf Area Index
Plant population density
Weeks after planting
2nd rains 1979 4 8 9 1 1 13pi 0. 29a 1 . 56a 1.95a 1.34a 0.63aP 2 0.41b 2 . 2 6 ab 2.24ab 1 .4 6 ab 0.90abP3 0 . 61c 2.89b 2.65b 1.75b 1 .1 2bP4 1.19d 5. 13c 4.20c 2.67c 1.83c
c.v.% 23 33 29 28 38s.e . mean 0.04 0.29 0 . 2 0 0 . 13 0 . 1 1
1st rains 1980 4 6 9 1 1
pi 0 . 88a 3. 15a 4.22a 3.37aP 2 1.19a 3. 34a 5.05a 4.52bP3 2.44b 5.41b 6.57b 4.42bP4 4.43c 8.24c i 9.34c 5.82c
C.V.% 29 30 28 27
s . e . me an 0 . 16 0 . 37 0. 44 0. 31N.B. Figures with the same letter in each column do not differ significantly.
86
4.10. Effect of Plant Population on Leaf Area Index
As plant population density was increased,
L.A.I. increased progressively and significantly
at all stages of growth and in both seasons
(Table 26). Peak leaf area indices at the three
higher populations were obtained in the 8th week,
and in the 9th week at the lowest population in
the 1979 crop. In the 1980 crop, peak leaf area
indices occurred in the 9th week at all the plant
populations.
4.11 Effect of Plant Population on Dry Matter
4.11.1 Leaf Dry Matter
In both seasons, leaf dry matter per plant
decreased significantly with increase in plant
population at all stages of growth (Table 27 and
Fig. 6). Leaf dry matter per hectare increased
consistently with increase in plant population at
all stages of growth in the 1979 crop, and up to
the 11th week in the 1980 crop. During the 13th
week, leaf dry matter per hectare was lower at P^
than at P^. In the 15th week, the lowest leaf dry
matter occurred at P2 , followed by that at P^.
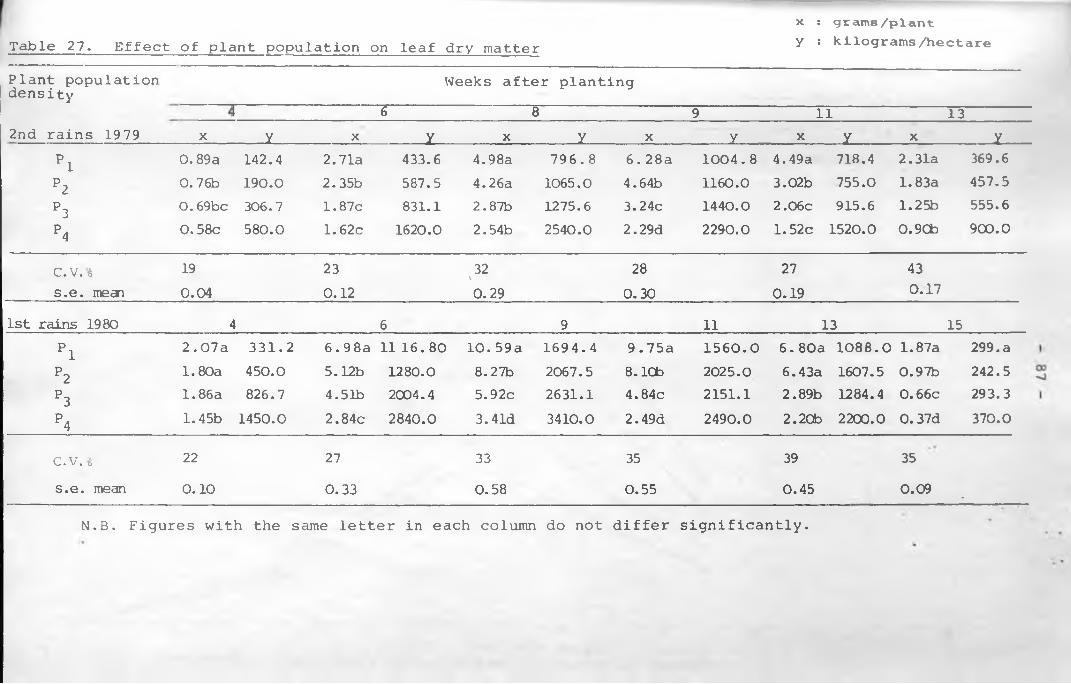
Table 27. Effect of plant population on leaf dry matterx : grams/planty : kilograms/hectare
Plant population density
2nd rains 1979
Weeks after plantingP 6 8^ 9 1 1 13
X _ Y X y X y X y X y X Yp i 0.89a 142.4 2.71a 433.6 4.98a 796.8 6.28a 1004.8 4.49a 718.4 2.31a 369.6
P2 0.76b 190.0 2.35b 587.5 4.26a 1065.0 4.64b 1160.0 3.02b 755.0 1.83a 457.5
P3 0.69bc 306.7 1.87c 831.1 2.87b 1275.6 3.24c 1440.0 2.06c 915.6 1.25b 555.6
P4 0.58c 580.0 1.62c 1620.0 2.54b 2540.0 2.29d 2290.0 1.52c 1520.0 0.90b 900.0
c.v.% 19 23 32V
28 27 43s.e. mean 0.04 0.12 0.29 0.30 0.19 0.17
1st rains 1980 i\ 6 9 11 13 15p i 2.07a 331.2 6.98a 11 16.80 10.59a 1694.4 9.75a 1560.0 6.80a 1088.C) 1.87a 299. a
P2 1.80a 450.0 5.12b 1280.0 8.27b 2067.5 8.10b 2025.0 6.43a 1607.5 0.97b 242.5P3 1 .86a 826.7 4.51b 2004.4 5.92c 2631.1 4.84c 2151.1 2.89b 1284.4 0.66c 293.3
P4 1.45b 1450.0 2.84c 2840.0 3.41d 3410.0 2.49d 2490.0 2.20b 2200.0 0.37d 370.0
C.V.% 22 27 33 35 39 35s.e. mean 0 .1 0 0.33 0.58 0.55 0.45 0.09
.
N.B. Figures with the same letter in each column do not differ significantly.

160,000 Plont»/ho
— ('
Fig. 5 a
-------------250,000 „
-------------444 ,444 n
........ - - I f 000,000 „
I
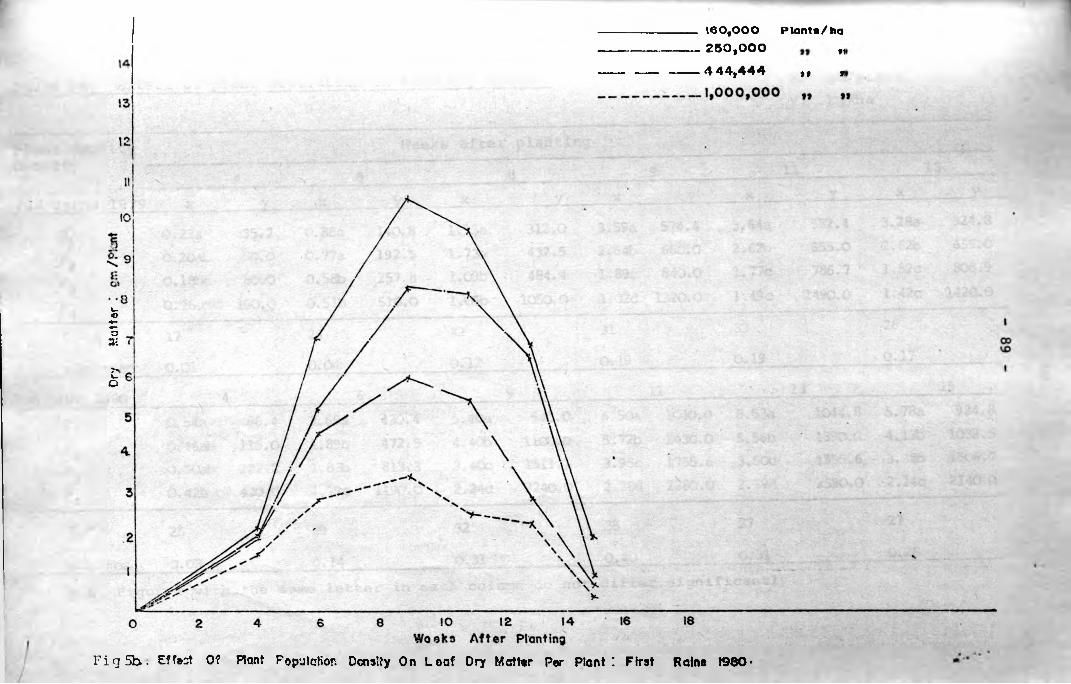
Dry
Mat
ter
-------- 160,000 Plants/ha— ■■. ■ — 250,000 fj
---- ----- 4 44,444 ,, r
F ig 5b. Eftet Of Rant Population Density On Loaf Dry Matter Per Plant’. First Rains 1980*

y: kg/haTable 28: Effect of plant population on stem dry matter x: gm/plant
Plant' densityHpn ci Weeks after plantingv.* x i O jl L> y
4 6 8 9 1 1 132nd rains 1979 X y X y X y X y X y X y
pi 0.22a 35.2 0. 88a 140.8 1.95a 312.0 3.59a 574.4 3.64a 582.4 3.28a 524.8P2 0.20ab 50.0 0.77a 192.5 1.73a 432.5 2.64b 660.0 2.62b 655.0 2.62b 655.0
P3 0.18bc 80.0 0.58b 257.8 1.09b 484.4 1.89c 840.0 1.77c 786.7 1.82c 808.9
P4 0.16c 160.0 0.51b 510.0 1.05b 1050.0 1.32d 1320.0 1.49c 1490.0 1.42c 1420.0C. V . % 17 25 32 31 33 28s.e. mean 0.01 0.04 0.12 0.19 0.19 0.17
1st rains 1980 4 6 9 11 13 15pi 0.54a 86.4 2.69a 430.4 5.40a 540.0 6.50a 1040.0 6.53a 1044.8 5.78a 924.8P2 0.46ab 115.0 1.89b 472.5 4.4Cb 1100.0 5.72b 1430.0 5.56b 1390.0 4.13b 1032.5P3 0.50ab 222.2 1.83b 813.3 3.40c 1511.1 3.95c 1755.6 3.50c 1555.6 3.39b 1506.7P4 0.42b 420.0 1.19c 1190.0 2.24d 2240.0 2.28d 2280.0 2.39d 2390.0 2.14c 2140.0
c.v.% 25 29 32 35%
27 27
s.e. mean 0.03 0.14 0.31 0.40 0.31 0.26N.B. Figures with the same letter in each column do not differ significantly.
- 91 -
4.11.2. Stem Dry Matter
Stem dry matter per plant decreased significantly
with increase in plant population in both seasons
(Table 28). From the 6th to the 8th week,
differences between and P2 were not significant.
Except in the 9th week in 1979 crop, significant
differences between P~ and P. were not obtained.3 4In 1980, significant differences in stem dry matter
per plant between P2 and P^ during the 4th, 6th
and 15th weeks were not obtained.
Stem dry matter per hectare increased with
increase in plant population in both seasons at
all stages of growth.
4.11.3. Pod Dry Matter
Pod dry matter per plant decreased
significantly with increase in plant populationI
at all stages of growth in both seasons (Table 29).
During the 13th week of the 1979 crop, P^ and P^
were not significantly different in their pod
dry matter. In 1980 P2 and P3 in the 9th week,
and P^ and P^ in the 1 1 th week, were also not
significantly different.
Pod dry matter per hectare increased
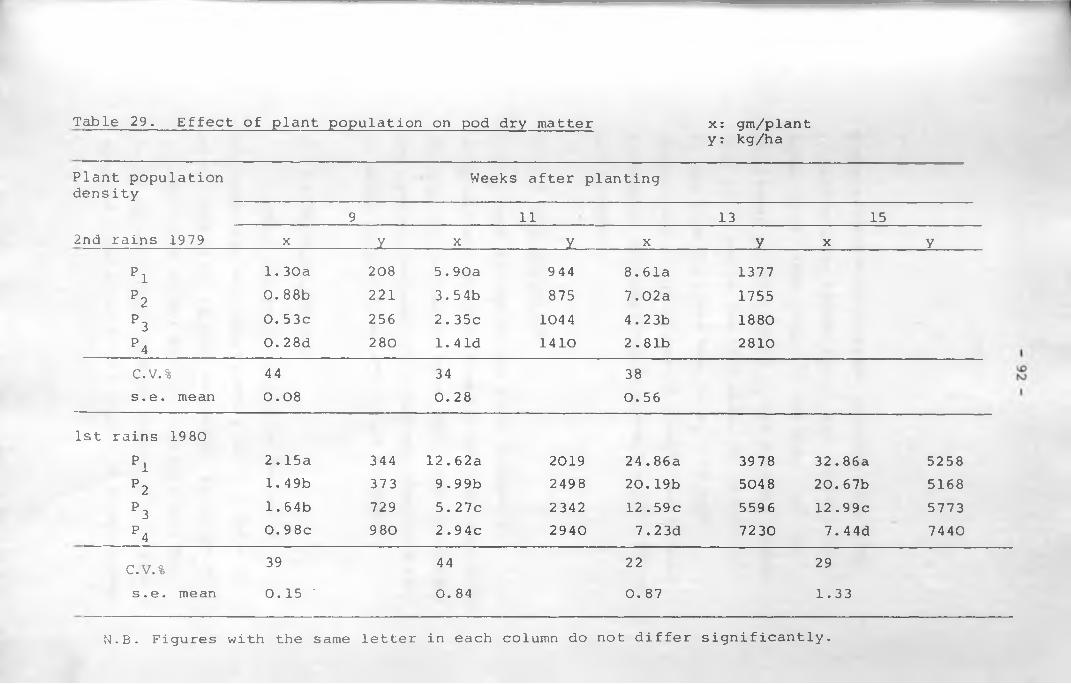
Table 29. Effect of plant population on pod dry matter x: gm/plant y : kg/ha
Plant population density
Weeks after planting
9 1 1 13 152nd rains 1979 X y X Y. X y X y
pi 1.30a 208 5.90a 944 8.61a 1377P 2 0 . 88b 2 2 1 3.54b 875 7.02a 1755P3 0. 53c 256 2.35c 104 4 4.23b 1880P4 0 . 28d 280 1. 41d 1410 2.81b 2810c.v.% 44 34 38s.e. mean 0.08 0.28 0.56
1 st rains 1980pi 2.15a 344 12.62a 2019 24.86a 3978 32.86a 5258P 2 1.49b 373 9.99b 2498 20.19b 504 8 20.67b 5168P 3 1.64b 729 5.27c 2342 12.59c 5596 12.99c 5773P4 0.98c 9 80 2.94c 2940 7.23d 7230 7.44d 7440
C.V.% 39 44 22 29s.e. mean 0.15 * 0. 84 0. 87 1.33
N.B. Figures with the same letter in each column do not differ significantly.
- 93 -
progressively with increase in plant population
in both seasons except during the 11th and 15th
weeks of the 1980 crop. In the 11th week, pod
dry matter per hectare at P2 was slightly higher
than at and in the 15th week, dry matter at
P^ was slightly lower than at P^. In both
seasons and at all stages of growth, the highest
population had consistently highest pod dry matter
per hectare.
4. 11.4 Root Dry Matter
Root dry matter per plant decreased
progressively and significantly as plant population
density was increased (Table 30). Root dry matter
per hectare increased progressively with increase
in plant population at all stages of growth.
4.11.5 Total Dry Matter
Total dry matter per plant decreased
progressively and significantly with increase in
plant population in both seasons at all stages of
growth (Table 31 and Fig. 7). In both seasons,
total dry matter per hectare increased with rise
in plant population at all stages of growth except

Table 30. Effect of plant population on root-dry matter x: grains/planty: kilograms/hectare
Plant population density
Weeks after planting
4 6 9 1 1 13 151 st rains 19 80 X y X y X y X y X y X y
pi 0 . 38a 60.0 0. 84a 134.0 1 .1 1 a 177.6 1.13a 180. 8 0.91a 145.6 1 . 0 2 a 163.2
P 2 0.36ab 90.0 0 . 61b 152.5 1 .1 0a 277.5 0 . 82b 205.0 0.79b 197.5 0. 70b 175.0
P3 0.41a 182.2 0 . 51c 226.7 0.74b 328.9 0.54c 240.0 0.52c 231.1 0. 54c 2 40.0
P4 0. 30b 300.0 0. 37d 370.0 0. 50c 500.0 0. 34d 340.0 0 . 30d 300.0 0.33d 330.0
c.v.% 17 22 21 23 27 26
s . e. mean 0 . 0 2 0.03 0.05 0.04 0.04 0.04
N.B. Figures with the same letter in each column do not differ significantly.
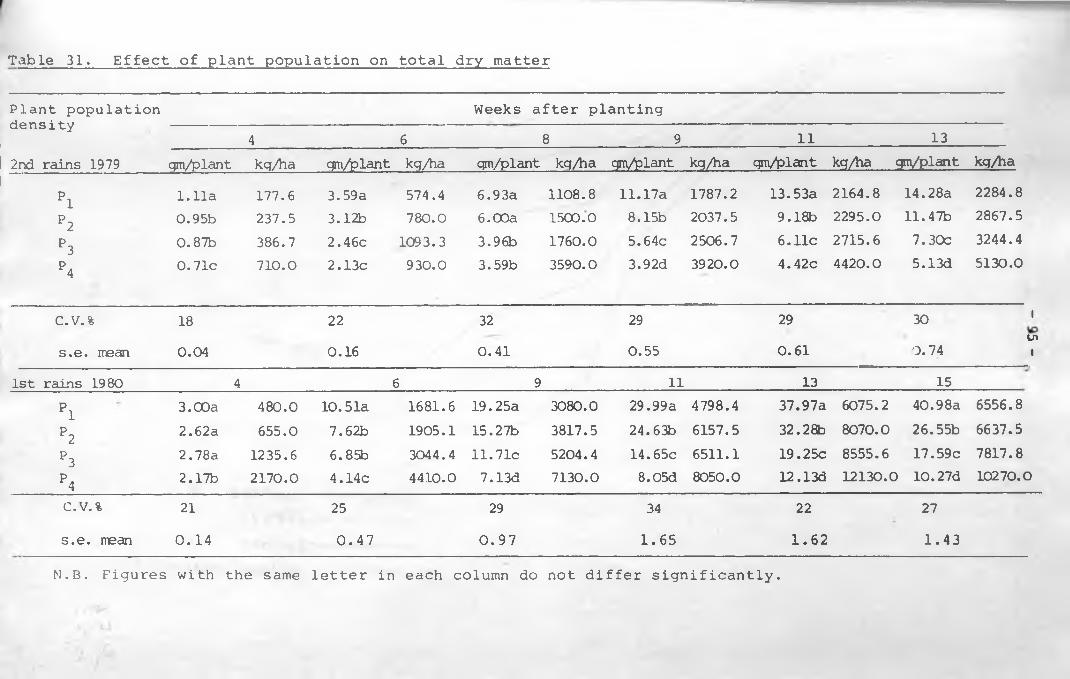
Table 31. Effect of plant population on total dry matter
Plant population density
Weeks after planting4 6 8 9 1 1 13
2nd rains 1979 gm/plant kq/ha qm/plant kg/ha qm/plant kq/ha qm/plant kq/ha qm/plant kq/ha gm/plant kq/ha
pi 1 .1 1a 177.6 3.59a 574.4 6.93a 1108.8 11.17a 1787.2 13.53a 2164.8 14.28a 2284.8
P2 0.95b 237.5 3.12b 780.0 6.00a 1500.0 8.15b 2037.5 9.18b 2295.0 11.47b 2867.5
P3 0.87b 386.7 2.46c 1093.3 3.96b 1760.0 5.64c 2506.7 6.1 1c 2715.6 7.30c 3244.4
P4 0.71c 710.0 2.13c 930.0 3.59b 3590.0 3.92d 3920.0 4.42c 4420.0 5.13d 5130.0
c.v.% 18 22 32 29 29 30 i
s.e. mean 0.04 0.16 0.41 0.55 0.61 0.74tn1
1st rains 1980 4 6 9 11 13 15
pi 3.00a 480.0 10.51a 1681.6 19.25a 3080.0 29.99a 4798.4 37.97a 6075.2 40.98a 6556.8
P2 2.62a 655.0 7.62b 1905.1 15.27b 3817.5 24.63b 6157.5 32.28b 8070.0 26.55b 6637.5
P3 2.78a 1235.6 6.85b 3044.4 11.71c 5204.4 14.65c 6511.1 19.25c 8555.6 17.59c 7817.8
P4 2.17b 2170.0 4.14c 4410.0 7.13d 7130.0 8.05d 8050.0 12.13d 12130.0 10.27d 10270.0C.V.% 21 25 29 34 22 27
s.e. mean 0.14 0.47 0.97 1.65 1.62 1.43
N.B. Figures with the same letter in each column do not differ significantly.

\<i / ua : jsti-1-;
IG
1C
_____ :__ 160,000 Plontt/ha
-----------250,000 „
------------ 4 4 4 , 4 4 4 „
------- 1,0 0 0 ,0 0 0 . r
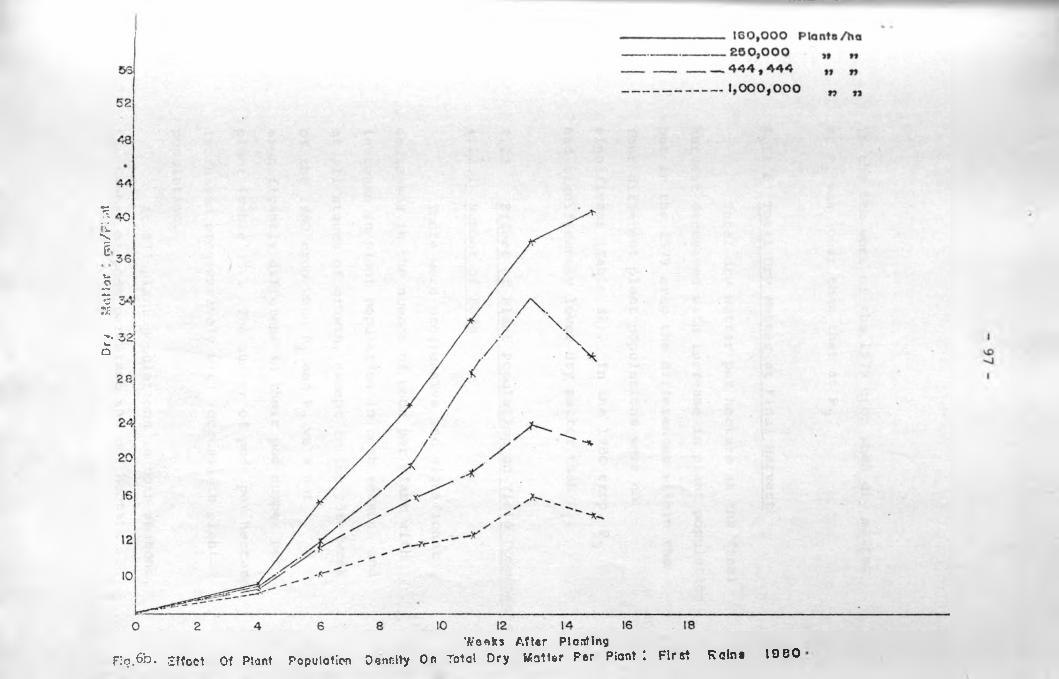
Dry
M
citt
or
om/r
l ;nt
'fe'oaks After PlowingFig.16b. Effect Of Plant Population Denfttty On Total Dry Rafter Per Plant *. First Kclne I9e0
- 98 -
in the 6th week of the 1979 crop when dry matter
at P„ was lower than that at P-,.4 3
4.11.6 Total Dry Matter at Final Harvest
Total dry matter per hectare at the final
harvest decreased with increase in plant population
but in the 1979 crop the differences within the
four different plant populations were not
significant (Table 32). In the 1980 crop, P^
had significantly lower dry matter than P^.
4.12 Effect of Plant Population on Yield Components
4.12.1 Number of Pods
There were progressive and significant
decreases in the number of pods per plant with
increase in plant population in both seasons and
at all stages of growth, except in the 13th week
of the 1980 crop when and P2 were not
significantly different in their pod number per
plant (Table 33) . The number of pods per hectare
increased progressively with increase in plant
population.
A t a l l p l a n t p o p u l a t i o n s i n b o t h s e a s o n s ,
t h e n u m b e r o f p o d s p e r p l a n t a n d p e r h e c t a r e
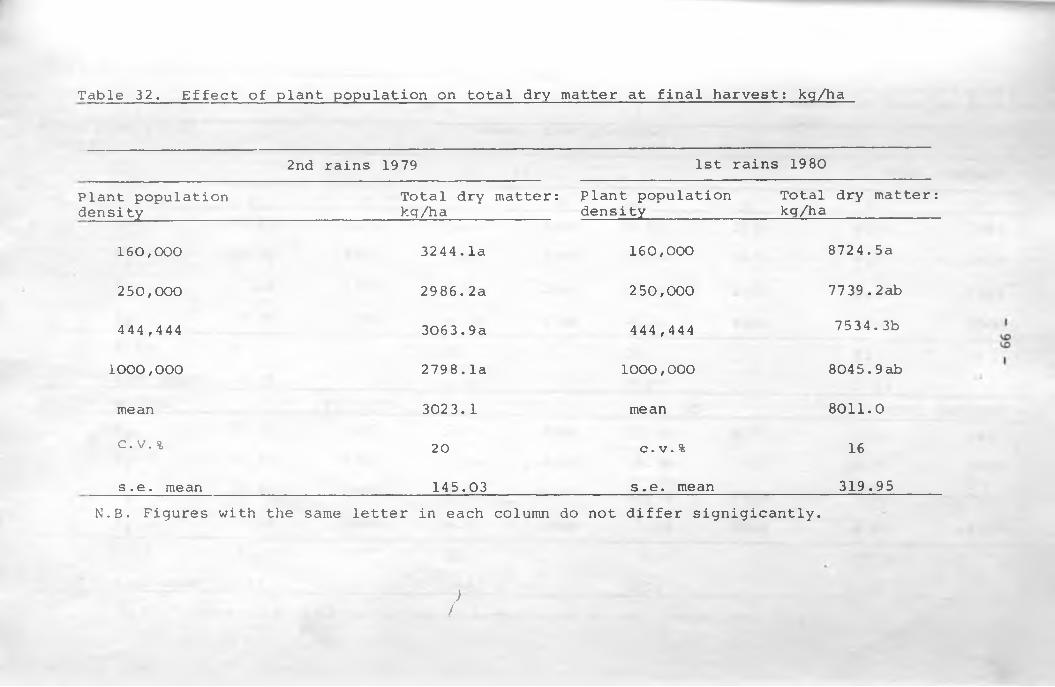
Table 32. Effect of plant population on total dry matter at final harvest: kg/ha
2nd rains 1979 1 st rains 1980
Plant population Total dry matter : Plant population Total dry matter:density kq/ha density kg/ha
160,000 3244.la 160,000 8724.5a
250,000 2986.2a 250,000 7739.2ab
444,444 3063.9a 444 ,444 7534.3b
1 0 0 0 , 0 0 0 2798.1a 1 0 0 0 ,0 0 0 8045.9ab
mean 3023.1 mean 8011.0
c. v. % 20 C . V . % 16
s .e . mean 145.03 s.e. mean 319.95N.B. Figures with the same letter in each column do not differ signigicantly.
)f

Table 33. Effect of plant population on number of pods/ x: Number
y : Number 1 0 0 0.
of p o d s of p o d s
perper
planthectare
Plant population density
W e e k s a f t e r p l a n t i n g
9 1 1 13 FINAL HARVEST
2nd rains 1979 X y X y • X y X ypi 13.6a 2176 11.3a 1808 1 0 . 2 a 1632 9.9a 1584
P 2 1 0 . lb 2525 7.9b 1975 6.7b 1675 6.7b 1675
P3 7.6c 3 378 6.4c 2844 5.3c 2356 5.1c 2268
P4 5.3d 5300 4.7d 4 700 4.Id 4100 3.5d 3500
c.v.% 33 26 24 22
s.e. mean 0. 78 0. 46 0. 37 0 . 331st rains 1980 1 1 13 15 FINAL, HARVEST
pi 22.7a 3632 17.3a 2768 19.7a 3152 15.6a 2496
P 2 19.4b 4850 17.0a 4250 15.9b 3975 1 1 .6b 2900
P3 13.4c 5956 1 2 .0b 5333 10.9c 4844 7.9c 3511
P4 7.8d 7 800 6 .8c 6800 5.9d 5900 4.9d 4900
C.V.% 25 2 1 22 18
s.e. mean 0. 99 0 . 68 0. 59 0.56N.B. Figures with the same letter i n each column d o n o t d i f f e r s i g n i f i c a n t l y .
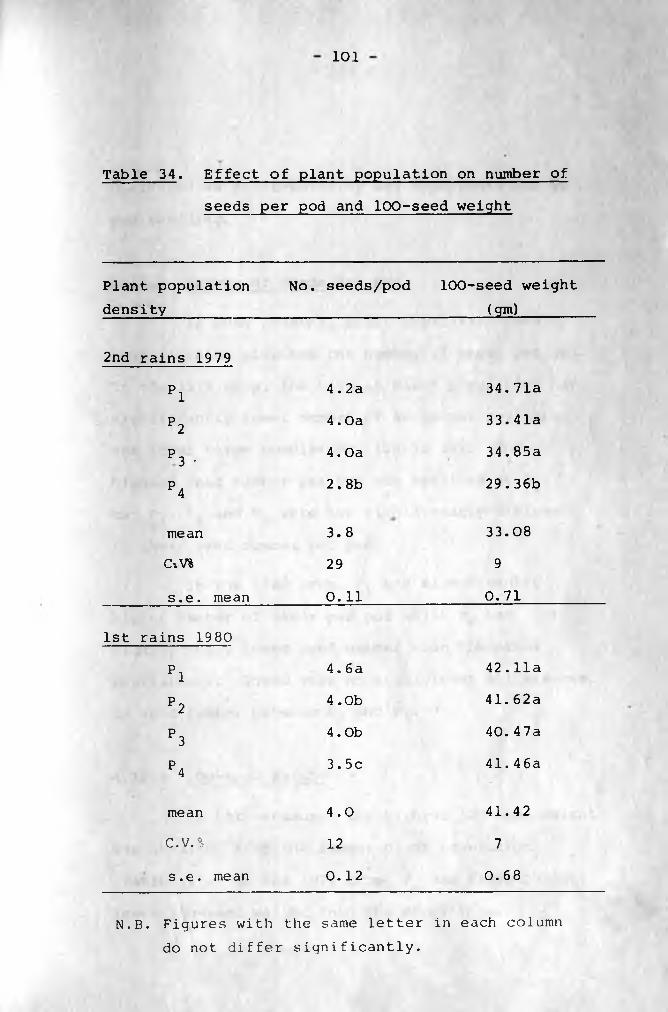
101
Table 34. Effect of plant population on number of
seeds per pod and 100-seed weight
Plant population density
No. seeds/pod 100-seed weight (gm)
2nd rains 1979
pi 4.2a 34.71a
P2 4. Oa 33.41a
P3 ■ 4. Oa 34.85a
P4 2.8b 29.36b
mean 3.8 33.08
CvV% 29 9
s.e. mean 0.11 0.71
1st rains 1980
pi 4.6a 42.11a
P2 4 .Ob 41.62a
P3 4.0b 40.47a
P4 3.5c 41.46a
mean 4.0 41.42
C.V.% 12 7
s.e. mean 0.12 0.68
N.B. Figures with the same letter in each columndo not differ significantly.
decreased as plant-maturity was approached due to
pod shedding.
4.12.2 Number of Seeds Per Pod
In both seasons, plant population density
significantly affected the number of seeds per pod.
In the 1979 crop, the highest plant population had
significantly lower number of seeds per pod than
the lower three populations (Table 34). The
highest seed number per pod was obtained at P^,
but P1, P2 and P3 were not significantly different
in their seed number per pod.
In the 1980 crop, PL had significantly
higher number of seeds per pod while P^ had
significantly lower seed number than the other
populations. There were no significant differences
in seed number between P2 and P^.
4.12.3 100-Seed Weight
In both seasons, the highest 100-seed weight
was obtained from the lowest plant population
(Table 34). In the 1979 crop, P4 had significantly
lower 10 0-seed weight than the other three
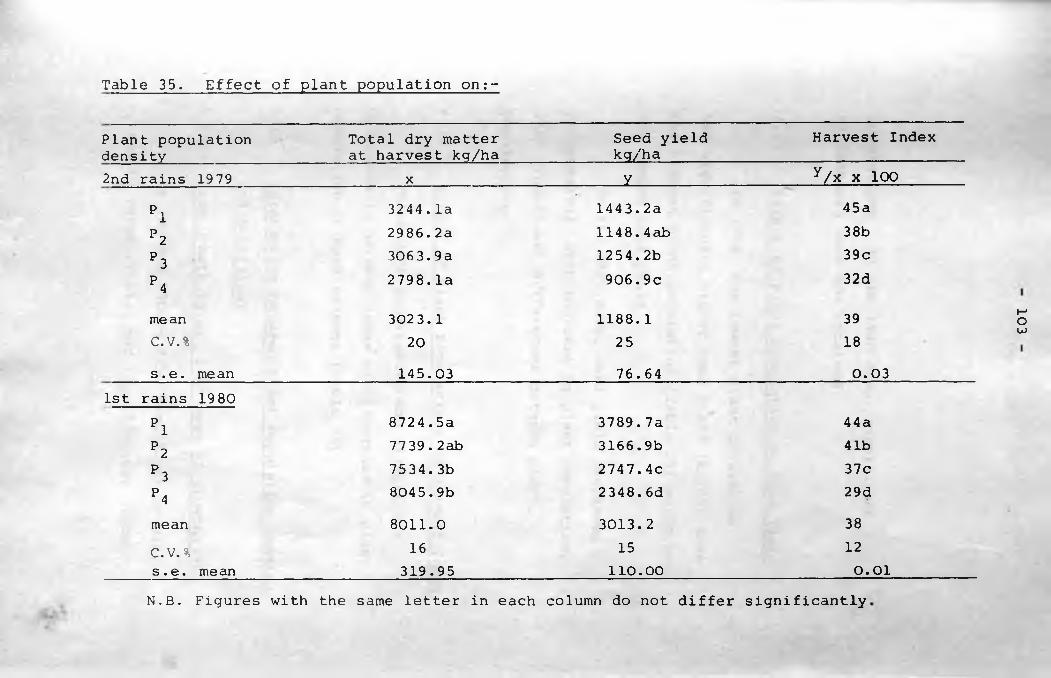
Table 35. Effect of plant population on:-
Plant population density
Total dry matter at harvest kg/ha
Seed yield kg/ha
Harvest Index
2nd rains 1979 X Y ^/x x 100
pi 3244.1a 1443.2a 45a
P2 2986.2a 1148.4ab 38b
P3 3063.9a 1254.2b 39c
P4 2798.1a 906.9c 32d
mean 3023.1 1188.1 39C.V.% 20 25 18
s .e . mean 145.03 76.64 0.031st rains 1980
pi 8724.5a 3789.7a 44a
P 2 7739.2ab 3166.9b 41bP 3 7534.3b 2747.4c 37cP4 8045.9b 2348.6d 29d
mean 8011.0 3013.2 38C.V.% 16 15 12
s.e. mean 319.95 1 1 0 . 0 0 0 . 0 1
N.B. Figures with the same letter in each column do not differ significantly
103
104
populations. In the 1980 crop, significant
differences were not obtained.
4.13 Effect of Plant Population on Seed Yield
In 1979, the lowest plant population
had significantly higher seed yield (kg/ha) than
the highest plant population (Table 35) which had
the lowest seed yield.
In the 1980 crop, seed yield decreased
progressively with increase in plant population,
with significant differences between plant
populations.
4.14 Effect of Plant Populations on Harvest Index
There were progressive and significant
decreases in harvest index with increase in plant
population in both seasons (Table 35).
4.15 Interaction between Plant Population Density
and Fertilizer
4.15.1 Stem Growth Rate: 15th week of growth:1980
At 100 and 150 kg P/ha fertilizer levels,
and P^ respectively, had significantly higher
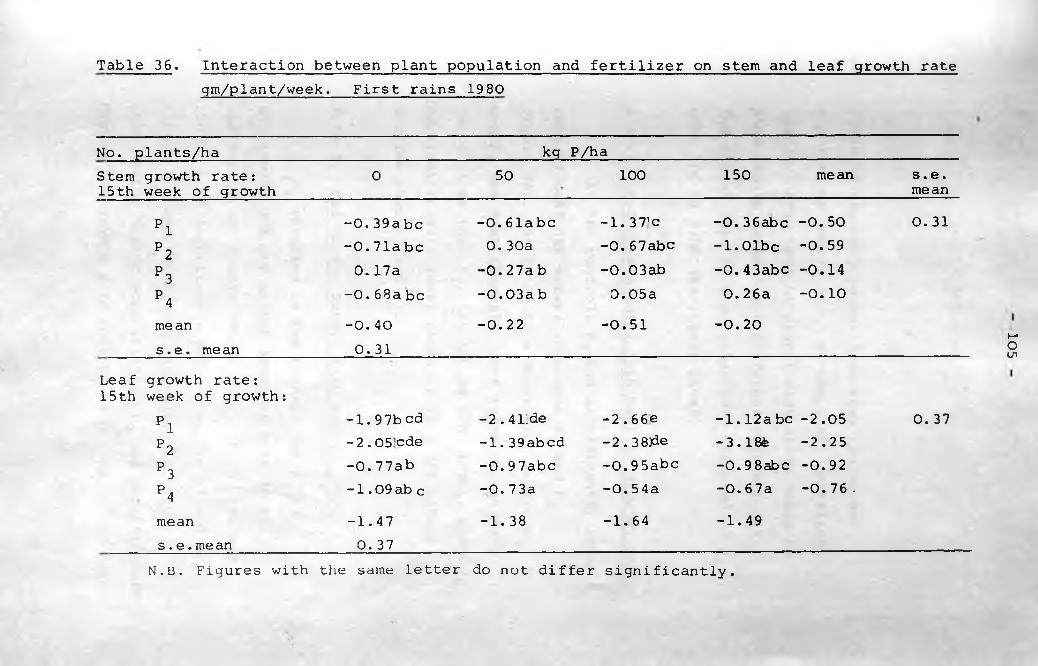
Table 36. Interaction between plant population and fertilizer on stem and leaf growth rate gm/plant/week. First rains 1980
No. plants/ha kg P/haStem growth rate: 15th week of growth
0 50 100 150 mean s. e . mean
pi -0.39a be -0.61abc -1.371c -0. 36abc -0. 50 0. 31
P2 -0.71a be 0. 30a -0.67abc — 1.0 lb c -0.59
P3 0.17a -0.27a b - 0.0 3 ab -0.43abc -0.14
P4 -0.68a be -0.03a b 0.05a 0. 26a -0.10
me an -0. 40 -0.22 -0.51 -0.20s . e . me an 0.31
Leaf growth rate:15th week of growth:
pi -1.97b cd -2.41.de -2.66e -1.12a be -2.05 0. 37P2 -2.05-cde -1.39abcd -2.38Jde -3.18& -2.25
P3 -0.7 7ab -0.97abc -0.95abc -0.98abc -0.92
P4 -1.09 ab c -0.73a -0.54a -0.67a -0.76 .
mean -1.47 -1.38 -1.64 -1.49s . e . mean 0. 37
N.B. Figures with the same letter do not differ significantly.
105

/
- 106 -
rates of stem dry matter loss than the higher
populations (Table 36). At the other fertilizer
levels there were no significant differences in
stem growth between the different populations.
The lowest rate of dry matter loss occurred at
with 100 kg P/ha fertilizer level.
4.15.2 Leaf Growth Rate: 15th Week of Growth: 1980
At the control, P^ had significantly lower
rate of leaf dry matter loss than P^ and P2
(Table 36). At 50 kg P/ha fertilizer level, P^
and had significantly lower rates of leaf dry
matter loss than P^. At 100 kg P/ha level, P^and P̂
had significantly lower rates of leaf dry matter
decline than P^ and P2*
4.15.3. Pod Growth Rate: 11th Week: 1979
P^ resulted in the highest and P4 in
the lowest pod dry matter increase rate at all
the fertilizer levels (Table 37). At 50, 100 and
150 kg P/ha fertilizer levels, the rate of pod dry
matter increase at P^ was significantly higher
than at the higher populations. P2 had significantly
higher pod growth rate than P^ at 0 and 100 kg P/ha
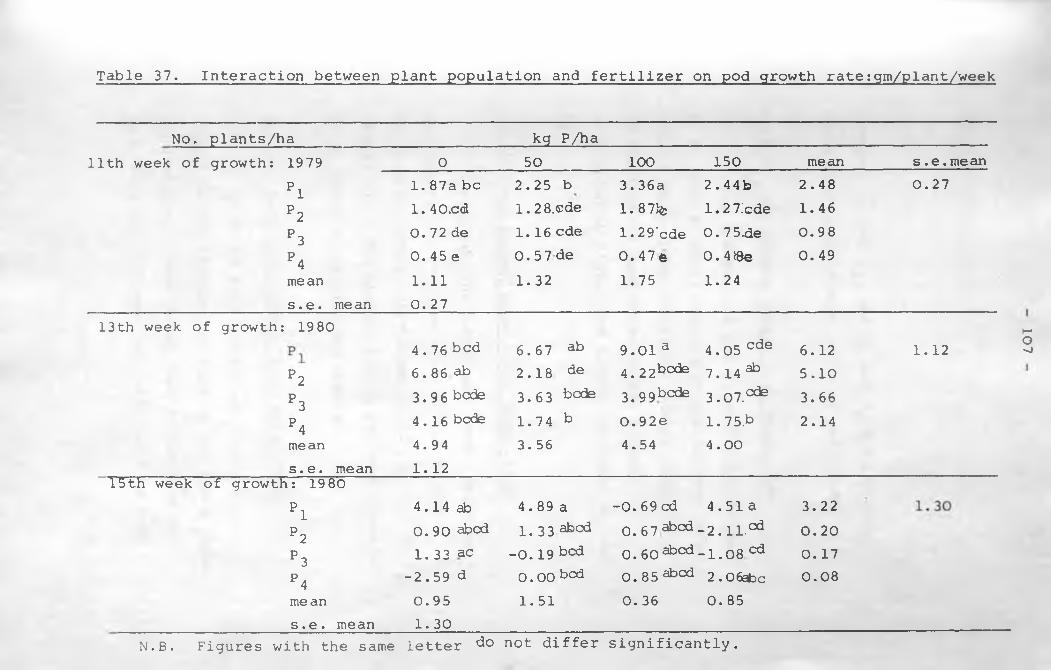
Table 37. Interaction between plant population and fertilizer on pod growth rate:gm/plant/week
No. plants/ha kg P/ha11th week of growth: 1979 0 50 100 150 mean s.e. me an
pi 1.87a be 2.25 b 3.36a 2.44b 2.48 0.27
P2 1. 40iCd 1.28.cde 1.87k 1.2 7!cde 1.46P3 0. 72 de 1.16 ede 1 • 29'cde 0. 7 5*de 0.98
P4 0. 45 e 0.5 7 de 0.47e 0. 4®e 0. 49mean 1.11 1.32 1.75 1.24s.e . mean 0.27
13th week of growth: 19804.76 bed 6.67 ab 9.01 a 4.05 cde 6.12 1.12
P2 6.86 ab 2.18 de 4.22bode 7.X4ab 5.10
P3 3 . 9 6 bede 3.63 bede 3.99bcde 3.07.036 3.66P4 4.16 bede 1.74 b 0 .9 2e 1.75.b 2.14me an 4.94 3.56 4.54 4.00s.e. mean 1.12
15th week of growth: 1980
p iP 2
4.14 ab 4.89 a -0. 69 cd 4.51a 3.220 . 90 abed 1. 33 ahed 0.67 abed - 2 .1 1 . ̂ 0 . 2 0
P3 1 . 3 3 ac -0.19 bcd 0 . 60 abed - 1 , 0 8 ̂ 0.17P4 -2 . 5 9 d O . O O b c d 0.85abcd 2.06abc 0.08me an 0.95 1.51 0.36 0.85s.e. mean 1.30
N.B. Figures with the same letter do not differ significantly.
107
108
levels. P2 and P3, and P3 and P4 did not have
significantly different rates of pod growth.
4.15.4. Pod Growth Rate: 13th Week; 1980
Pod growth rate was significantly higher
at P 1 than at the three higher populations in both
50 and 100 kg P/ha fertilizer levels (Table 37).
At the highest fertilizer level, P2 had
significantly higher pod growth rate than P 3 and
P4 *
4.15.5 Pod Growth Rate: 15th Week: 1980
At 0 kg P/ha fertilizer level, negative
pod growth had occurred while at the higher
fertilizer levels, growth was still positive at
(Table 37). The highest pod growth rate occurred
at P where 50 kg P/ha was applied.<
4.15.6. Leaf Area Index: 11th Week: 1980
At 50 kg P/ha fertilizer level, P4 had
significantly highest LAI than at the lower three
populations; these lower populations were not
significantly different in their LAI from each
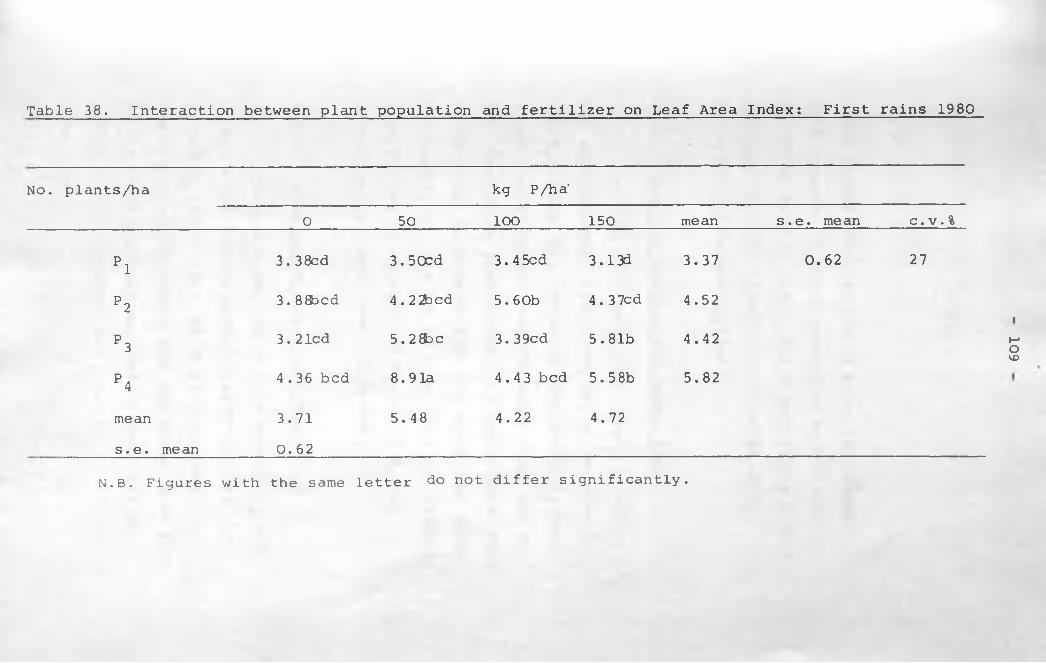
Table 38. Interaction between plant population and fertilizer on Leaf Area Index: First rains 1980
No. plants/ha kg P/ha'
0 50 lOO 150 mean s.e . mean i#>•
>6
P 1 3.38cd 3.50cd 3.45cd 3.13d 3.37 0.62 21
P 2 3.88bcd 4.2 2bcd 5.60b 4.37cd 4.52
P3 3. 2 led 5.2Sdc 3.39cd 5.81b 4.42
P4 4.36 bed 8.91a 4.43 bed 5.58b 5.82
mean 3.71 5.48 4.22 4.72
s. e . me an 0 . 62
N.B. Figures with the same letter do not differ significantly.
109

110 -
other (Table 38). At 100 kg P/ha, LAI changes
with increase in plant population were irregular.
At 150 kg P/ha and P^ had significantly higher
LAI than P^. The highest LAI occurred at P^
where 50 kg P/ha was applied.
4.15.7 Stem Dry Matter: 13th Week: 1980
At 0 kg P/ha fertilizer level, and P2
had significantly higher stem dry matter than P^
and P4 (Table 39). At 50 kg P/ha level, P ± had
significantly higher stem dry matter than any of
the other three populations. At 100 kg P/ha level,
P^ produced the highest stem dry matter per plant
followed by P2- At 150 kg P/ha level the highest
stem dry matter occurred at P2 , while P^ had
significantly lowest stem dry matter.
4.15.8. Leaf Dry Matter:__13th Week: 1980
At both 0 and 100 kg P/ha levels, P^ and
P2 had significantly higher leaf dry matter than
P^ and P^ (Table 39). At 50 kg P/ha level, P^
had significantly higher leaf dry matter than each
of the other populations. The highest leaf dry
matter amounts occurred at P2 and at the 150 kg
P/ha level.
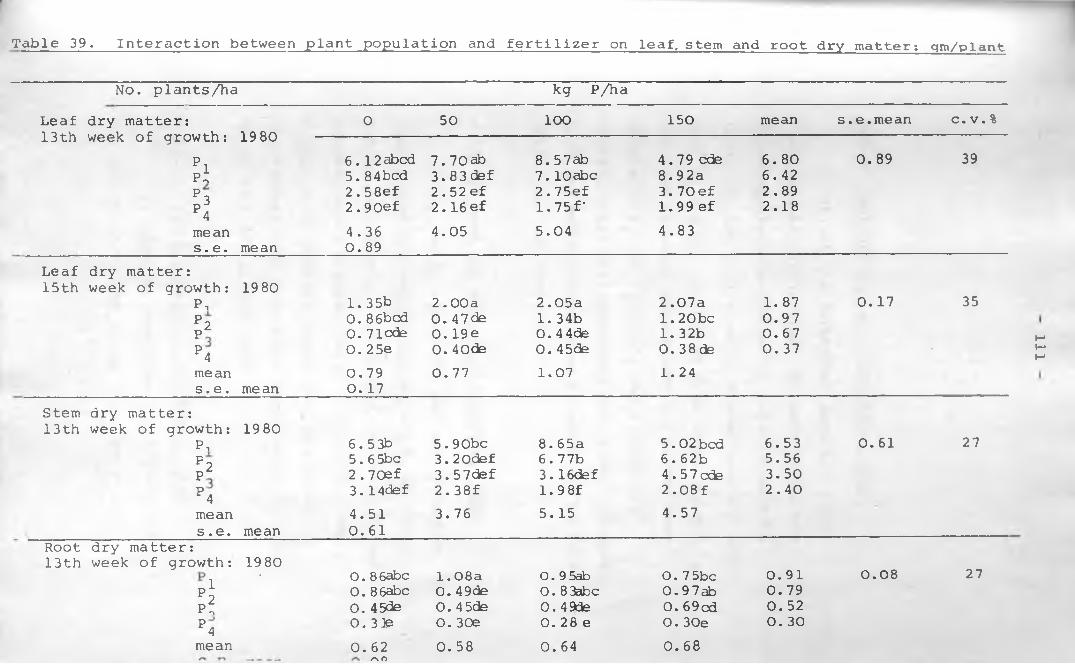
Table 39. Interaction between plant population and fertilizer on leaf, stem and root dry matter: gm/plant
No. plants/ha kg P/haLeaf13th
dry matter: week of growth: 1980
0 50 lOO 150 mean s.e.mean c.v.%
P, 6 . 1 2 abed 7.70ab 8.57ab 4.79 ede 6.80 0.89 39PI 5.84bed 3.83 def 7.lOabc 8.92a 6.42*3P4
2.58ef 2.52 ef 2 .75ef 3.70 ef 2.892.90ef 2.16ef 1.75 f* 1.99 ef 2.18
mean 4.36 4.05 5.04 4.83s. e. mean 0.89
Leaf dry matter:15th week of growth: 19 80
P, 1.35b 2 .0 0a 2.05a 2.07a 1. 87 0.17 35P 2 0 .86bed 0 . 4 7de 1.34b 1 .2 0be 0.97p2 0 . 7lede 0. 19e 0 .4 4de 1. 32b 0.67P4 0 . 25e 0 . 4Ode 0.45de 0. 38ds 0. 37 •mean 0.79 0.77 1.07 1. 24s. e . me an 0 . 17
Stem dry matter:13th week of growth: 1980
P, 6 .53b 5.90bc 8.65a 5 . 0 2 bed 6.53 0.61 27F 2 5.65bc 3.20def 6.77b 6.62b 5.56p2 2.70ef 3.57def 3.16def 4.57 ede 3.50P4 3.14def 2.38f 1 .9 8f 2.08 f 2.40mean 4.51 3.76 5.15 4.57s . e. mean 0 . 61
Root dry matter:13th week of growth: 1980 0.08 27• 0 .86abc 1.08a 0. 9 Sab 0 .7 5bc 0.91
pi 0 . 86abc 0 .49de 0. 8 3abc 0.97ab 0. 79p? 0 . 45de 0. 4 5de 0.49de 0.69cd 0. 52P4 0 . 3te 0 . 30e 0 . 28 e 0 . 30e 0. 30mean 0 . 62 0. 58 0. 64 0 . 6 8
r\ n
111

112
4.15.9 Leaf Dry Matter. 15th Week: 1980
At all the fertilizer levels, P had1significantly higher leaf dry matter than the
other populations (Table 39). At 100 kg P/ha
level, P2 had significantly higher leaf dry matter
than P^ and P^. At 150 kg P/ha level, P2 and P^
had significantly higher leaf dry matter than P^.
Otherwise P2 and P^and P 3 and P^ were not
significantly different from each other. Highest
leaf dry matter occurred at P-̂ where 150 kg P/ha
fertilizer was applied.
4.15.10 Root Dry Matter. 13th Week: 1980
and P2 (Table 39) had significantly
higher root dry matter than P^ and P^ at 0 and
100 kg P/ha levels. At 50 kg P/ha level, P-̂ had
significantly highest and at 150 kg P/ha level,
P 4 had significantly lowest root dry matter.
The highest root dry matter occurred at P^ with
50 kg P/ha fertilizer level.
4.15.11. Pod Dry Matter. 9th Week: 1980
P^ produced significantly highest pod
dry matter at 50 and 100 kg P/ha levels than
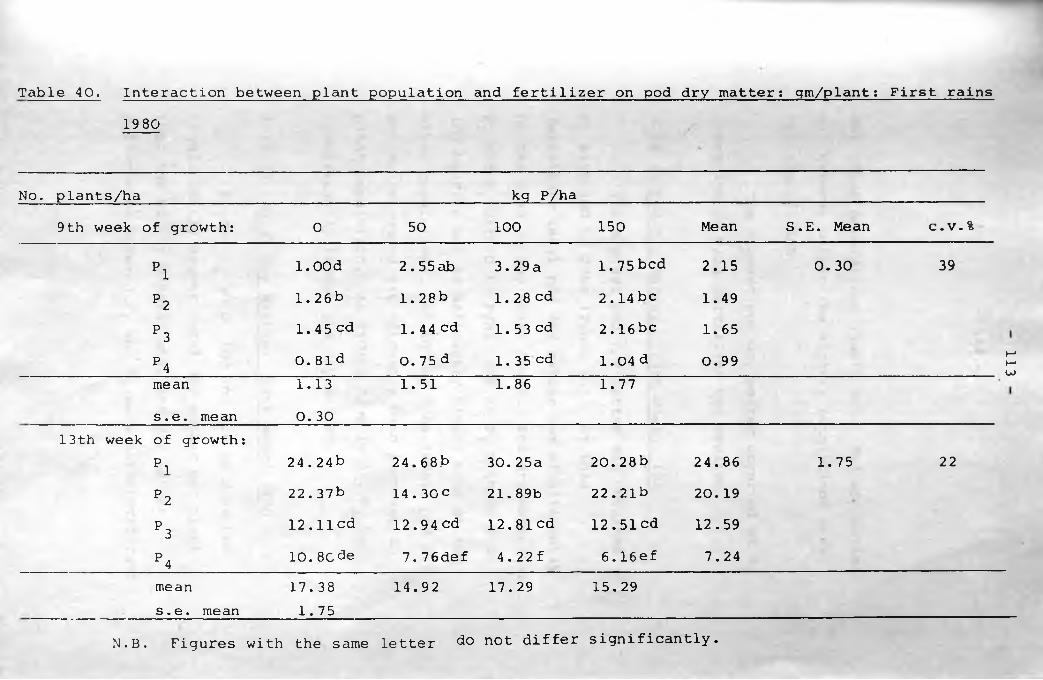
Table 40. Interaction between plant population and fertilizer on pod dry matter: gm/plant: First rains
1980
No. plants/ha__________________________________________ kg P/ha
9th week of growth: 0 50 100 150 Mean S.E. Mean c.v.%
pi l.OOd 2.55 ab 3.29a 1.75 bed 2.15 0.30 39
P2 1.26b 1.28b 1 . 2 8 cd 2.14 be 1.49
P3 1.45 cd 1. 44 cd 1.53 cd 2.16 be 1.65
P4 0. 81^ 0.75d 1.35 cd 1.04 d 0.99mean 1.13 1.51 1.86 1.77
s.e . mean 0. 3013th week of growth:
pi 24.24b 24.68b 30.25a 20.28b 24.86 1.75 22
P2 22.37b 14.30 c 21.89b 22.21b 20. 19
P3 12.lied 12.94 cd 12.81cd 12.51cd 12.59
P4 10. 8Cde 7.76def 4.22 f 6.16 e f 7.24mean 17.38 14.92 17.29 15.29s.e . mean 1.75
N. B. Figures with the same letter do not differ significantly.
113
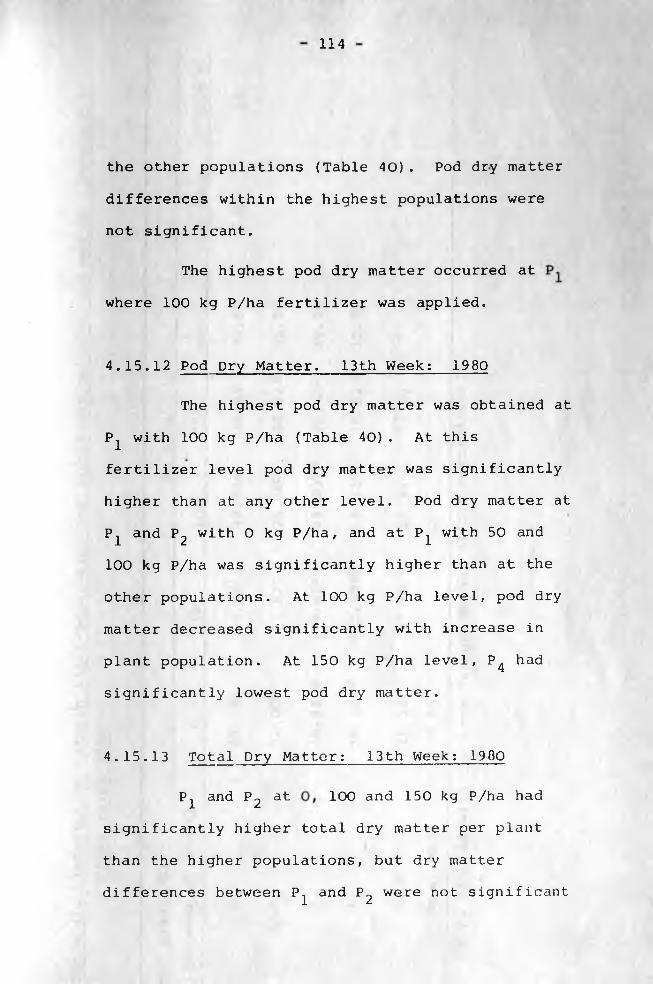
114
the other populations (Table 40). Pod dry matter
differences within the highest populations were
not significant.
The highest pod dry matter occurred at
where 100 kg P/ha fertilizer was applied.
4.15.12 Pod Dry Matter. 13th Week: 1980
The highest pod dry matter was obtained at
P^ with 100 kg P/ha (Table 40). At this
fertilizer level pod dry matter was significantly
higher than at any other level. Pod dry matter at
P^ and P2 with 0 kg P/ha, and at P^ with 50 and
100 kg P/ha was significantly higher than at the
other populations. At 100 kg P/ha level, pod dry
matter decreased significantly with increase in
plant population. At 150 kg P/ha level, P^ had
significantly lowest pod dry matter.
4.15.13 Total Dry Matter: 13th Week; 1980
P^ and 1?2 at 100 and 150 kg P/ha had
significantly higher total dry matter per plant
than the higher populations, but dry matter
differences between P^ and P2 were not significant
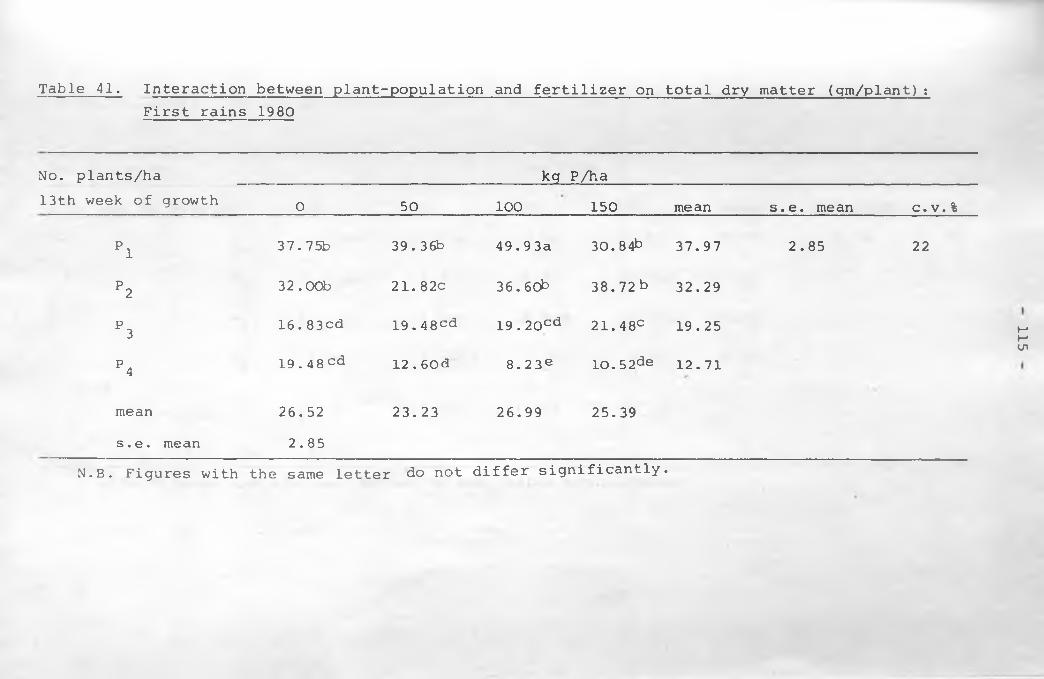
Table 41. Interaction between plant-population and fertilizer on total dry matter (gm/plant):First rains 1980
No. plants/ha kg P/ha13th week of growth 0 50 100 150 me an s.e. mean c. v. %
pi 37.75b 39.36b 49.93a 30. 84b 37.97 2.85 22
P 2 32.00b 21.82c 36.60b 38.72b 32.29
P 3 16.83 cd 19.48cd 19.20cd 21.48c 19.25
P4 19.48cd 12.60d 8.2 3 e 10.52de 12.71
mean 26.52 23.23 26.99 25.39s.e. mean 2.85
N.B. Figures with the same letter do not differ significantly.
115
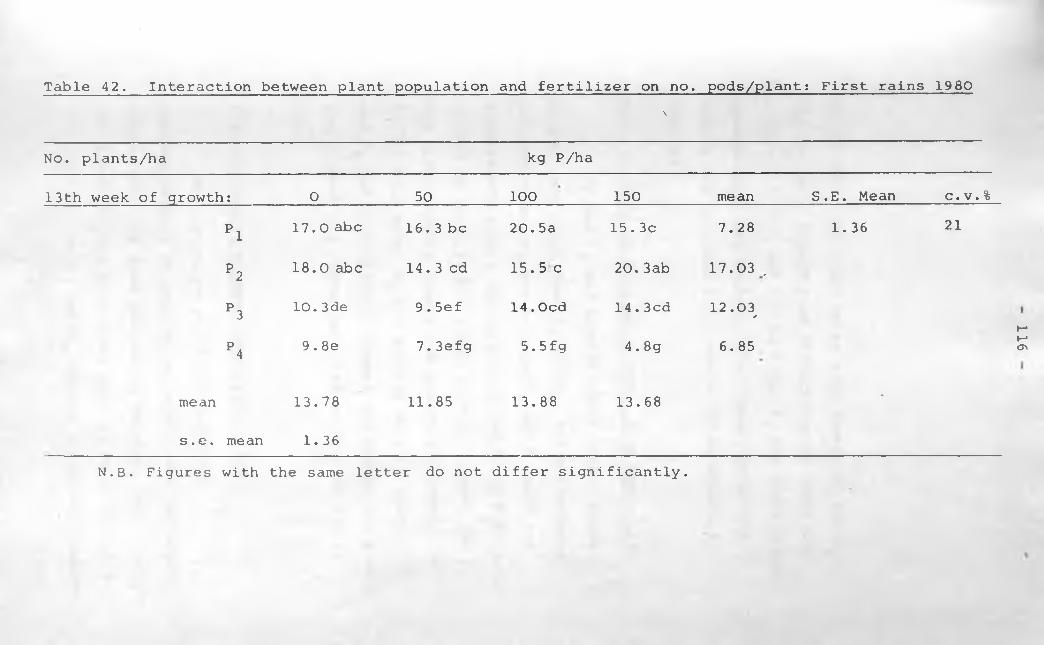
Table 42. Interaction between plant population and fertilizer on no. pods/plant: First rains 1980v
No. plants/ha kg P/ha
13th week of growth: 0 50 100 150 mean S.E. Mean c. v. %
pi 17.0 abc 16.3 be 20.5a 15.3c 7.28 1.36 21
P 218.0 abc 14.3 cd 15.5 c 2 0.3ab 17.03 ,
P3 1 0 .3de 9.5ef 14.Ocd 14.3cd 12.03^
P4 9.8e 7.3efg 5.5 f g 4.8g 6.85
mean 13.78 11.85 13.88 13.68 *
s .e . me an 1.36
N.B. Figures with the same letter do not differ significantly.
116
117
(Table 41). At O and 50 kg P/ha level, and P^
did not have significant differences in total dry
matter. At 100 and 150 kg P/ha, P4 had significantly
lowest total dry matter. The highest total dry
matter was recorded at P^ where 100 kg P/ha was
applied.
4.15.14. No. of Pods per Plant: 13th Week: 1980
P and P0 had significantly higher number
of pods per plant than P^ and P^, but differences
between P^ and P2 and between P^ and P4 were not
significant (Table 42) at both 0 and 50 kg P/ha level.
At 100 kg P/ha, P 1 had significantly highest and P4
had significantly lowest pod number per plant. At
150 kg P/ha level P2 had significantly highest,
and P4 had significantly lowest pod number per plant.
The highest pod number occurred at P, with 100 kg
P/ha.
4.15.15 Nodule Weight: 4th Week:__1980
Nodule weight per plant decreased
insignificantly as population density was increased
(Table 43). At each population density, nodule weight
was lower at 0 kg P/ha level than at where fertilizer
was applied. At P [ and P4, nodule weight was highest

Table 43. Interaction between plant population and fertilizer011 nodule weight: mg/plant
First rains 1980
No. plants/ha kg P/ha4 th week of growth 0 50 100 150 Mean S . E . Me an
157.5e 316.5 cde 508.5a 410.0 abed 348.13 72
P 2 214. Obcde 358.0 bcde 2 0 1. 5 cde 441.0 abc 303.63
P3 129 .Oe 4 4 4.0 ab 215.5bcde 514.5a 325.75
P4 207.Obcde 184.5 de 357.0 abcde 278. Oabode -256.63
Mean 176.88 325.75 320.63 410.85s.e. mean 72
N.B. Figures with the same letter do not differ significantly.
118
- 119 -
at the 100 kg P/ha fertilizer level while at P2 and
P3, the highest nodule weight occurred at the 150 kg
P/ha level. The highest recorded nodule weight per
plant was at P^ with 100 kg P/ha fertilizer level.
120
C H A P T E R F I V E
DISCUSSION
5.1. Seasonal Differences
The rate of growth, number of pods per plant
number of seeds per pod, 1 0 0-seed weight and
consequently seed yields 'were higher in
the first rains of 1980 than in the second rains
of 1979. The differences could have been mainly
due to the drier conditions in 1979 than in 1980.
In the second rains of 1979 (October to December)
only 242 mm of rain was received as compared to
443 mm received in the long rains of 1980 from
March to May (see Appendix I). For the crop to
be most successful, it must receive at least
300-380 mm of rainfall over a 10-week growing
season (Kay, 1979) but the rainfall received in
the 1979 season was well below this requirement.
Though the crop was irrigated twice the moisture
supplied could have been insufficient to fully
meet the crops requirement for best performance
hence subjecting the crop to water stress. Robins
121
and Domingo (1956) showed that water stress prior
to flowering reduced the number of pods per plant,
and that water stress during flowering and early
pod-fill stage reduced the number of seeds per
pod and later on reduced the mean seed weight of P. vulgaris. Shibles and Weber (1966) found in
soya beans that water stress during pod set was
beneficial, but excessive water stress caused
excessive pod and seed abortion which could lead
to complete loss of yield.
5.2. Phosphate Fertilizer Effects
5.2.1. Effect of phosphate fertilier on the rate of
growth and accumulated dry matter
The rates of dry matter increase in the
leaves, stems, pods and roots were increased by
the phosphate fertilizer before the onset of
negative growth. Phosphorus is essential for
cell development and division hence more
satisfactory growth is expected in the phosphorus
treated than in the control plants.
The rate of root growth was generally
higher in the fertilized than in the control
122
plants, resulting in higher root dry matter in
the former than in the latter plants, although
the differences were not significant. This
indicated that phosphorus stimulated production
of a stronger and more vigorous root system
which could provide better anchorage of the
plants in the soil, explore the soil for and
absorb more nutrients including phosphorus, and
water from the soil. This would lead to improved
growth and- development by the plant as a whole
as compared to the unfertilized plants.
Improved growth rate and dry matter
accumulation in the fertilized plants could also
have been due to improved nitrogen uptake by these
plants. Fertilized plants had higher number and
weight of nodules than the control plants, hence
the rate of nitrogen fixation and uptake could also
have been higher in the fertilizer-treated than in
the control plants. Sundara Rao (1971) found
that phosphate application increased nitrogen
uptake by lucerne crop by 26.4 kg N/ha.
The greater rate of leaf growth in the
fertilized than in the control plants resulted in
higher leaf area indices in these plants. Hence
123
greater amounts of photosynthates could have been
manufactured in the fertilized than in the control
plants, resulting in greater rates of growth and
higher dry matter quantities in the former than
in the latter plants.*
Higher stem dry matter amounts in the
fertilizer-treated plants implied that phosphorus
helped in producing stronger stems which had more
resistance to lodging, or taller plants with
consequent higher height to the first inflorescence
hence the reproductive organs were carried further
above the soil surface where they were less likely
to be damaged by soil fungi.
Peak rates of dry matter production and
peak dry matter amounts were higher in the
ferti 1 izer-treated than in the control plants. N<
Peak growth rates in the leaves, stems, and roots
were attained in the 9th week. Peak dry matter
amounts were attained in the same week, except
in the stems whose peaks were attained in the 11th
week. The peaks were more sharply defined, and
earlier, in the leaves than in the stems probably
because of leaf senescence and abscission.
Negative leaf growth occurred earlier in
124
the fertilizer-treated than in the control plants
in the 1979 crop. Negative leaf growth at the
50 kg P/ha treatment commenced in the 9th week,
and in the 11th week for all the other treatments.
In the 1980 crop negative leaf growth commenced
in the 11th week. The rates of leaf dry matter
decline in the leaves and in the other plant
organs were higher in the fertilizer-treated than
in the control plants. This could probably be
connected with the effect phosphorus has on
enhancing plant maturity, particularly if the
nutrient is in excess in relation to other nutrients
(Gt. Brt. Min. Agric. 1964), nitrogen being
one of the most important. When available
phosphates are abundant in the rooting medium, the absorption of inorganic nitrogen compounds
is depressed. The application of phosphatic
fertilizers may therefore alter the nitrogen
balance of the plant, resulting in the earlier
maturation of plants when available phosphates are
high, and the delay in reaching maturity occassioned
by phosphorus deficiency ( Meyer and Anderson,
1968). It is probable that the rates of
phosphorus used in this work were in sufficient
quantities to cause the nutrient imbalances
125
which would result in the above effect. The
quantity of fixed nitrogen in the fertilizer-
treated plants could probably not match the
amounts of available phosphates, and in the
latter stages of growth small or no amounts of
nitrogen could probably have been fixed due to
decay and disintegration of the nodules. Hence
the absorbed phosphorus might have accumulated
in the plant tissues without improving growth
or enhancing dry matter production. Parodi £_t
al* (1977) reported that phosphorus applications to
potted plants (P. vulgaris) increased the
relative and absolute content of phosphorus in the
plant but dry matter production did not increase.
Martin (1976) also found that phosphorus, potassium
and sulphur accumulated in the plant tissues
(P. vulgaris) in the absence of nitrogen.
The greater rate of leaf dry matter decline
in the fertilized plants implied higher rates of
leaf senescence than in the control plants. This
would lead to greater rates of reduction in
photosynthetic surface. Consequently rates of
dry matter production would also be lower than in
the control plants. Since the rates of leaf dry
matter decline were lower in the control than in

126
the fertilized plants, the former plants retained
their leaves and continued to produce plant dry
matter for a longer time than the fertilized
plants, hence the lower rates of plant dry matter
decline in the control plants, and the small
differences in dry matter between the fertilized
and the control plants.
-5.2.2. Effect of Phosphate Fertilizer on Leaf Area
Index
Leaf Area Index (LAI) increased with
increase in fertilizer level. The increase was
significant between the control and the fertilized
plants, but the difference within the fertilizer
treatments was not significant. These results
agree with Mahatanya's (1976) work in which he
also obtained higher LAI in the phosphorus-
treated than in the unfertilized plants but the
LAI differences within the different fertilizer
treatments were not significant. The higher the
LAI the higher the photosynthetic potential of a
crop up to a certain limit. Hence greater amounts
of photosynthates are manufactured at higher leaf
areas resulting in higher growth rates in the
leaves, stems and roots, and the plant as a whole.
127
The corresponding increase in dry matter with
increase in fertilizer level could therefore have
been partly due to the corresponding increase in
LAI. Watson (1956) concluded that leaf area
and yield are closely related and that increasing
the former will increase the latter.
It can be noted that at the two highest
fertilizer levels the LAI was beyond 5 in the 6th
week and beyond 6 in the 9th week in the 1980 crop
(Table 9): An optimum LAI for every economic
crop ranges from 2.5 to 5 (Mitchell/ 19 70) .
Probably, plants at the high fertilizer levels
produced more leaves of which the lower ones were
shaded by the upper ones, hence they could not
intercept sufficient incoming radiation to
photosynthesize efficiently. A condition of
parasitism might therefore have occurred, the
lower leaves using carbohydrates at a greater
rate than they could photosynthesize. This could
probably explain whyfwhile the increase in LAI
with increase in fertilizer level was significant
from the 6th to the 11th week in the 1980 crop,
the increases in seed yield and total dry matter
at final harvest with the rise in fertilizer level
were not significant.
128
5.2.3. Effect of Phosphate Fertilizer on Pod Dry
Matter and Number of Pods per Plant
The number of pods per plant increased with
increase in fertilizer level except at final
harvest in the 1980 crop. Other researchers
including Edje et al.. (1975) and Haag et al ( 1978)
also obtained increases in pod number per plant
with increase in fertilizer level. It is noted,
however, that the differences in pod number were
not significant. The rate of dry matter decline
was higher in the fertilizer-treated than in the
control plants. The rate of pod abscission could
also have been higher in the control than in the
fertilizer-treated plants, making the number of
pods more uniform at all the treatments. Also,
LAI at the control and at the lowest fertilizer
level was lower than at the two higher fertilizer
levels. Hence at the former two treatments,
the pods were less heavily shaded in the leaf
canopy and greater photosynthesis by the pods could
have occurred than at the two higher fertilizer
levels. Greater rate of leaf fall which was
indicated by the higher rate of negative leaf
growth from the 11th week in the fertilized plants
meant greater reduction in photosynthetic potential

129
of these plants. This would mean reduction in
dry matter that is partitioned to the pods. At
the control and at the lower fertilizer level
where the rates of leaf fall were lower, the
leaves could have photosynthesised for a longer
period, hence producing greater amounts of dry
matter for their pods. The greater rate of
pod abscission,the greater degree of pod shading,
and the higher rate of leaf fall at the highert
fertilizer levels would all tend to reduce the
advantage the plants at these levels have of
increased pod dry matter by the phosphate
fertilizer/ hence the insignificant increases in
pod dry matter and pod number per plant with
increase in fertilizer level. Duarte (1967)
found that defoliation at flowering reduced the
number of pods per plant but did not significantly
affect the number of seeds per pod or 100-seed
weight.
5.2.4. Effect of Phosphate Fertilizer on the
Number of Seeds per Pod and 100-Seed Weight
In the 1979 crop, the number of seeds per
pod at the 150 kg P/ha treatment was significantly
higher than at the control, but the seed number
130
differences within the three fertilizer treatments
were not significant. In the 1980 crop, no
significant changes in seed number per pod with
changes in fertilizer level were observed.
Mahatanya (1976) also reported increases in seed
number per pod with increase in fertilizer level,
but seed number differences within the fertilizer
treatments were not significant. Haag et al.
(1978) obtained significant increases in the
number of seeds per pod with increase in
fertility level. However, other researchers
including Leakey (1972) and Edje et al.(1975)
did not obtain significant effect of fertilizer
on the number of seeds per pod.
In both seasons, 100-seed weight was not
apparently affected by phosphate fertilizer
application. Leakey (1972) also found that the
mean seed weight was not altered by changes in
fertility level. Gurnah (1979) also did not obtain
any effect on Soybean weight by phosphate
fertilizer, but Haag et a_l. ( 1978) reported an
increase in bean seed weight with increase in
fertility level.
Since there was an increase in seed yield
with increase in fertility level, yet seed number
131
per pod and 100-seed weight increases were only
slight, the increase in seed yield could have
been largely due to the increases in the number
of pods per plant. Mujeeb and Greig (1973) found
that bean yield of four mutants were significantly
related to pod number which contributed more
to yield than did number of seeds per pod or
lOO-seed weight.
5.2.5. Effect of Phosphate Fertilizer on Seed Yield
In 1979 the 13% increase in seed yield at
the highest fertilizer level over the control
could probably be attributed to the higher number
of pods per plant and higher number of seeds per
pod. These two components of yield increased
with increase in fertilizer level, while the 100-
seed weight was seemingly unaffected by fertilizer
level changes. Haag et al. (1978) reported that
the main effect of high fertility level was to
enhance the role of "pods per plant" and "single
seed weight" in influencing seed yield. Hodgson
and Blackman (1955) and Goulden (1975) reported
that seed yield production was solely governed
by the number of mature pods formed.
132
In 1980, the 9% increase in seed yield at
the highest fertilizer level over the control was
probably due to the higher number of seeds per
pod and 100-seed weight. These yield components
increased, though insignificantly, with increase
in fertilizer level, while pod number per plant at
final harvest did not increase in fertilizer level.
Fertilized plants dried earlier than the
untreated’plants, but final harvest was taken at
the same time for all the treatments when all the
plants had dried. This implied that by final harvest
greater seed loss through seed shattering could have
occurred at the higher fertilizer levels where
plants dried earlier than at the control and the
lower fertilizer level. This might help to explain
the non-significant difference in seed yield between
the fertilized and the unfertilized plants.
5.2.6. Effect of Phosphate Fertilizer on Harvest
Index
This is a measure of dry matter
partitioning between economically useful parts and
the rest of the plant. It is expressed as:-
133
Harvest Index Economic yield x 100Total biological yield(F.A.O., 1977)
When calculating harvest index (HI) in this study,
the numerator was seed yield in kg/ha, and the
denominator was total dry matter at harvest in kg/
ha. These two components were not significantly
affected by fertilizer level changes. Consequently,
H.I. was also not significantly altered by
fertilizer rates.
The average HI in 1979 crop was higher than
in 1980 crop, being 40% and 38% respectively. It
therefore appears that a greater proportion of dry
matter was partitioned to the seeds in 1979 than
in 1980. The more favourable rainfall regime in
the first rains of 1980, and consequently better
growth conditions than those of 1979, might have
favoured production of greater proportion of
vegetative growth.
In many food legumes there is a continuous
senescence and fall of leaves during the growth
of plants. These leaves are also part of the
biological yield produced by the plant, hence
harvest indices calculated from final harvest data
may be higher than they actually should be because
134
only sun-dried shoots without, or with very few,
leaves, are used to determine the H.I. The
figures therefore do not trully represent the H.I.
(F.A.O. 1977).
5.2.7. Effect of Phosphate Fertilizer on Number
and Weight of Nodules
In the second rains of 19 79 the number and
weight of nodules was lower than in the first
rains of 1980. A possible explanation could be
that the 1979 crop was planted in field 19 while
the 19 80 crop was grown in field 14*, rhizobia
strains capable of nodulating bean roots are
lacking in field 19 (Keya and Mukunya, 1979).
The poorer growth conditions in 1979 which adversely
affected general plant growth including the roots,
could also have interfered with nodule formation.
Phosphorus significantly increased the number
and weight of the nodules formed. The phosphorus
effect agrees with Keya's (1975) observation that
the effect of superphosphates in legume nodulation
was to increase the number of nodules formed per
plant. Singh (1971) working with chickpeas,
(Cicer arietinum L.) also obtained significant

135
increases in nodule number and weight. Thus
with 67.5 kg P2 O^/ha, a maximum of 138 nodules
having 471 mg dry weight were produced. Most
probably phosphorus stimulated nodulation more
through its effect on bacteria than on the hosts.
In the presence of adequate phosphorus, the
bacterial cells become motile and flagellate, the
pre-requisite for bacterial migration, whereas in
the absence of phosphorus or with its inadequate
supply, the infection remains latent, leading to
the poor development of nodules (Singh, 1971).
The effect of increasing the rate of growth,
plant dry matter and yield by phosphorus could
partly be attributed to the increase in the number
and weight of nodules by the phosphate fertilizer.
The increase in the number and weight of nodules is
associated with increase in nitrogen fixation. Nodule
number and nodule mass can serve as reliable
indicators of nitrogen fixation even as early as 3
weeks after emergence (Keya and Mukunya, 1979). During
the late stages of growth, these indicators become
less reliable because the nodules decay and
disintegrate as the plant approaches maturity.
The number and weight of nodules increased

136
significantly with increase in fertilizer level, the corresponding yield increase was not
significant. Ttiis implied that the effect of phosphorus on the magnitude of nodulation was not
same for the dry matter production. This could mean that some or most of the nodules formed might have been partially or wholly ineffective in fixing nitrogen. Kintungulu Zake (1979) had found in groundnuts that, while phosphorus increased root number of nodules l i ne ar l y , it increased the dry weight of
groundnut tops in a quadratic manner, and the find in g s warned against equating nodulation with
nitro g e n fixation.
It can be noted that the number and weight
of nodules decrease as plant maturity was approached. The same effect was observed by Keya and Mukunya (1979) who obtained peak nodulation between 30-40 days after plant emergence, one nonth later, the number of nodules decreased
drastically irrespective of treatment.
137
maximum number of nodules is formed shortly before
anthesis, and the nodules decay by the time the
plants are mature. This is probably due to
competition for photosynthates between the
developing pods and the nodules. Since the
developing pods provide a "sink" closer to the
"source" leaves, the former become the
recipients of photosynthates at the cost of the
nodules (F.A.O. 1977).
5.2.8. Possible Reasons for Lack of Significant
Phosphate Fertilizer Effects on Growth
and Yield
1. Field beans (P. vulgaris) like other legumes
have a well-developed tap root system with
an extensive lateral root system
concentrated largely in the top 25 cm of
the soil (Smartt, 1976)*, the tap root
grows deeper into the soil. Phosphorus
was applied at a depth of about 3 cm in
the furrows at planting time. Being one
138
of the less mobile elements, Phosphorus
could have been out of reach of most of
the bean roots. Dow et al. (1970) obtained
little or no response of dry beans
(P. vulgaris) to NPKS and Zn fertilizers
and it was suggested that one of the
reasons for lack of response was deep
rooting,
2. Excess of phosphorus in relation to other
nutrients can cause the too early maturation
of a crop so that yields are decreased
(Gt. Brt. Min. Agric. 1964). In this
study, the high concentrations of phosphorus,
ranging from 50 to 150 kg P/ha, which were
used could have caused imbalances of the
other essential nutrients particularly
nitrogen, sulphur and the micro-nutrients
zinc and molybdenum, causing the overall
effect of depressed growth in the latter
stages of growth and reduced yield.
Excess phosphate has been found to induce
zinc deficiency (Dow et aj.. 1970).
Devarajan e_t cal. (1980) working with red
gram (Cajanus cajan), black gram (Phaseolus
reported antagonistic effect of phosphorus
and zinc where high levels of phosphorus
(50 kg P/ha) resulted in lower straw and
grain yield,P content and uptake of
nutrients. Anderson (1956) observed
molybdenum deficiencies after thet
application of phosphorus in groundnuts.
Phosphorus fixation could also have occurred. Fixation refers to processes by which phosphorus is combined with soil constituents to form insoluble compounds which are largely unavailable to plants. Phosphorus may form insoluble compounds of calcium,magnesium, iron, aluminium and manganese. It may also combine with organic matter, or it may be adsorbed by the clay complex (Gt. Brt. Min. Agric. 1964). The pH range within which forms of phosphorus which the plants can absorb occur is between 5 . 5 , - 7. oH soils have high c oncentrations of iron, aluminium and manganese. if the pH is below 5 . 5 ,
insoluble compounds of iron and aluminium
140
immediate value for crops. Kaolinitic
soils are high fixers of phosphorus,
fixing it in the order of 500 to 1000 ppm
added P, except for coarse-textured soils
(Sanchez, 1976). Kabete soils are
basically kaolinitic, with a low pH
(5.2 - 5.6 as measured in 0.01 m calcium
chloride solution) , hence fixation of
the applied phosphate could have occurred.
Fixation capacity of the soils requires
to be satisfied at least locally around
the bands or spots where the fertilizer
is applied, before crops would show a
response.
The low response to phosphorus could also
have been due to there being an adequate
amount of phosphorus already present in
the soils. Soil analysis indicated that
the soil phosphorus was in the region of
4 ppm. This value is just below the
margin above which phosphate fertilizer
response is only probable (see Table 1 and the note below it)
141
5. In 1979, the limited phosphate fertilizer
response could have been caused by lack
of sufficient soil moisture due to the
dry conditions that persisted throughout
most of the growing season. Soil water
must be adequate to keep the nutrient
elements in solution from which they can
be absorbed by the plants. This is
particularly important for phosphorus
because the diffusion rate of phosphate
anion, which is slow enough even in moist
soils, is drastically reduced due to lack
of continuous moisture films as the soil
dries up. Phosphate anions diffuse in
short distances of not more than 1 mm.
Root growth is also restricted during
the dry season hence the root will not be
able to explore the soil for phosphorus
during this dry season. Where rainfall
is marginal for crop production, no
benefit from fertilizers may be obtained,
and in other areas where cropping
intensity and other yield potentials are
limited by low or poorly distributed
142
rainfall, only relatively small dressings may prove economic (Webster and Wilson, 1966).
5.3. Plant Population Effects
5.3.1. Effect of plant population on growth rate
The rate of dry matter accumulation in each
plant decreased with increase in plant population
(Table 25) . This indicated that the increase in
plant numbers imposed a stress which restricted
plant growth. This stress increased progressively
from the lowest to the highest plant population.
Supply of factors of production (nutrients,
moisture, light etc) apparently became less and
less as plant population was increased, hence
competition for these factors increased as plant
numbers per unit area increased. Among the
vegetative organs, the leaves were the most
affected by the competitional stress, as compared
to the stems and roots; this was indicated by
the more frequent significant differences in leaf
than in stem and root growth rates between the
various populations (Tables 21, 22 and 24).
143
On the "per unit area" basis, the rate of
increase in total dry matter per hectare increased
with increase in plant population (Table 25).
Hence growth rate per plant decreased,but growth rate per unit area increased with increase in
plant population. The decrease in the rate of
growth per plant was therefore more than
compensated for by the increase in plant numbers
per unit area. This trend was similar to that
observed in the rate of dry matter changes in
the leaves up to the 8th and the 6th week in the
1979 and the 1980 crops respectively. In the
stems and roots the trend was observed up to the
9th week in both seasons, while for pods it was
observed up to the 13th week.
Negative growth in the leaves, stems and
roots tended to commence earlier in the higher
than in the lower plant populations, again due to
the more severe inter- and intra-plant competition
at the higher populations. The rate of negative
growth per plant decreased with increase in plant
population, but the rate of negative growth per
hectare increased with increase in plant
population. Hence the higher plant populations
144
lost dry matter per hectare at a faster rate than
the lower populations. Among the vegetative organs,
this effect was again most obvious in the leaves.
The rate of stem and root growth did not appear to
be very much influenced by plant population
changes.
In the 9th week of the 1979 crop, stem
dry matter was still increasing at the rate of
270 kg/ha/week at the highest plant population,
but leaf dry matter was decreasing at the rate
of 250 kg/ha/week (Tables 21 and 22). In the
11th week of the 1980 crop stem dry matter was
increasing at the rate of 88.9 and 10.0 kg/ha/week
at the second highest and the highest populations
respectively. In the same week, root dry matter
was decreasing at the rate of 31.1 and 60.0 kg/ha/
week at the respective plant populations (Table
24). Hence the sharp drop in the rate of total
dry matter increase at the highest plant population
in the 9th week of the 1979 crop and the 11th week
of the 1980 crop could have been caused mainly by
the drop in the rate of leaf dry matter production.
Leaf dry matter decrease w a s caused mainly by
leaf senescence and a b s c i s s i o n a s a result of
translocation of n u t r i e n t s f r o m t h e l e a v e s to t h e
145
pods. The leaves withered faster in the high
than in the low plant populations probably due
to the mutual shading of the lower leaves, and
the more severe inter- and intra-plant competition
at the higher than at the lower plant populations.
Between the 11th and 13th weeks of growth,
the rise in the rate of total dry matter
production per unit area with increase in plant
population was due mainly to the increase in the
rate of pod dry matter accumulation with rise in
plant population. At this stage, the rate of
pod growth per hectare was positive, and increased
with increase in plant population (Table 23),
while the other plant parts i.e. leaves, stems and
roots had negative growth rates. Hence after pod
initiation, the available assimilates were
translocated to the pods, rather than to the
vegetative organs.
In the 15th week of the 1980 crop, the
rate of growth was still positive at the lowest
plant population, but negative at all the three
higher populations. Hence the more sparsely
spaced plants continued to accumulate dry matter
for a longer time than the more densely packed
plants. This was because of lack of competition
146
between the low population plants, so that a
positive continued growth was observed.
5.3.2. Effect of plant population on Leaf Area
Index
Leaf Area Index (L.A.I.) increased
progressively with increase in the number of
plants per hectare (Table 26). Optimum L.A.I.
for economic crops ranges from 2.5 to 5 (Mitchell,
1970) but leaf area indices at the two lower
populations did not get beyond 2.3, and at the
lowest population the L.A.I. was below 2 in the
1979 crop. At the lowest population in the 1980
crop, peak L.A.I. of 4.2 occurred in the 9th
week, while at the highest population the peak
was 9.3. This implied that more complete ground
cover was attained at the higher than at the
lower plant populations. Consequently,
interception of photosynthetically active
radiations would also be expected to be higher
at the higher plant populations, resulting in
higher rates of photosynthesis and dry matter
accumulation than at the lower populations. The
observed higher rates of growth and dry matter
- 147 -
accumulation per hectare at the higher plant
populations could therefore have been due to the
higher L.A.I.
It was noted that L.A.I. at the highest
plant population in the 8th week of the 1979 crop
was higher than 5. In the 6th week of the 1980
crop also,the two highest, and in the 9th week
the three highest populations had leaf area
indices which were higher than 5. It was also
observed that the rate of dry matter decline per
hectare, particularly leaf dry matter was higher
at the high than at the low plant populations.
This could probably have been due to insufficient utilisation of all the available leaf area at the high plant populations because of excessive shading of the lower leaves. The lower leaves were therefore shed earlier and at a faster rate at the high than at the low plant populations.
After pod initiation in the 7th week,
the developing pods at the lowest plant
populations were not as heavily shaded in the leaf
canopy as those at the higher populations, hence
direct sunlight could have had access to these
pods which could therefore have photosynthesised
- 148 -
a t a g r e a t e r r a t e t h a n t h o s e a t t h e h i g h e r
p o p u l a t i o n s . T h e h i g h e r n u m b e r o f p o d s p e r
p l a n t , n u m b e r o f s e e d s p e r p o d and s e e d w e i g h t
a t t h e l o w e r t h a n a t t h e h i g h e r p l a n t p o p u l a t i o n s
c o u l d h a v e b e e n p a r t l y d u e t o t h i s e f f e c t .
Lucas and Milbourne (1970) reported that a
reduction in leaf area after flowering and
during the podding stage enhanced seed-weight as
well as increasing the number of filled pods,
and this provided evidence of the Dossible value
of direct sunlight to the pods.
5.3.3. Effect of plant population on dry matter
T h e v a r i a t i o n s i n d r y m a t t e r a c c u m u l a t i o n
r a t e s c a u s e d b y t h e v a r i o u s p l a n t p o p u l a t i o n s
w e r e r e f l e c t e d i n t o t a l d r y m a t t e r a c c u m u l a t e d
a t v a r i o u s s t a g e s o f g r o w t h ( T a b l e 30). A s
w i t h t h e r a t e o f g r o w t h , d r y m a t t e r p e r p l a n t
d e c r e a s e d w h i l e d r y m a t t e r p e r u n i t a r e a i n c r e a s e d
w i t h i n c r e a s e i n p l a n t p o p u l a t i o n . E v e n a t w e e k
13 o f b o t h c r o p s i n t h e h i g h e s t p l a n t p o p u l a t i o n
t o t a l d r y m a t t e r p e r u n i t a r e a w a s s t i l l
i n c r e a s i n g . T h i s i n d i c a t e d t h a t t h e d e c r e a s e in
d r y m a t t e r p e r p l a n t w i t h i n c r e a s e i n p l a n t

- 149 -
population was still being more than compensated
for by the increase in plant numbers per
hectare even at the highest plant population.
This implied an asymptotic relationship between
plant density and dry matter yield. Similar
effect has been reported in P. vulgaris by
Leakey (1972) and Enyi (1975) among others.
In the 1980 crop, the three highest
populations attained their peak dry matter per
unit area in week 13 after which there occurred
a rapid decline towards the 15th week of growth.
At the lowest population, dry matter per unit
area was still increasing even in week 15. The
continued dry matter additions at the lowest
plant population could have been due to the
lower rate of leaf dry matter decline. The
leaves at this population in the 15th week were
being shed at the rate of 368 kg/ha/week as
compared to the rate of 850 kg/ha/week at the
highest population,a difference of about 57%
(Table 21). The lower rate of leaf senescence
at the lowest plant population also implied that
there was a greater number of leaves which could
photosynthesise, hence cause dry matter additions.
150
Lucas and Milbourne (1976) also reported slower
senescence and prolonged photosynthetic activity
in the more widely spaced plants.
In the 1979 crop, peak total dry matter
was not attained and continued to increase up to
the 13th week in all the plant populations. This
was probably because sequential harvesting was
terminated two weeks earlier in this season than
in the 1980 crop. A similar effect as that
observed in the 1980 crop could probably have
been obtained had a further harvest been taken
in the 15th week.
In the 1979 crop, peak leaf dry matter
per plant was obtained in the 8th week at the
highest plant population, but in the 9th week at
all the other populations, (Table 27). In the
1980 crop, peak leaf dry matter was obtained in
the 9th week in all the four populations. Peak
stem and root dry matter per plant also tended
to occur later at the lowest plant population
(Tables 28 and 30). Hence peak dry matter per
plant tended to occur later at the lower than at
the higher plant populations indicating that at
the lower population, dry matter production per

- 151 -
plant, and hence per unit area, continued for a
longer time than at the higher plant populations.
The increase in plant numbers compensated for
this effect by having higher peaks per unit
area than at the lowest plant population, hence
the advantage of longer period of dry matter
production at the lowest plant population was
offset when considering dry matter production
per unit area.
5.3.4. Effect of plant population on total dry
matter at harvest
As observed earlier plants at the higher
populations lost their dry matter per unit area
at a faster rate than those at the lower plant
populations (Table 25). This had the effect of
reducing the difference in dry matter between the
lower and the higher plant populations caused by
the higher dry matter accumulation rates per
hectare at the higher populations during the
earlier stages of growth. It was also observed
that the leaves at the lower populations continued
to produce dry matter for a longer period than
those at the higher plant populations, hence dry

152
matter production continued at the lower
populations while production at the higher
populations had already stopped. This might be
attributed to less competition in lower populations
and hence continued growth. This might probably
account for the lack of significant differences
in the final dry matter at harvest in the 1979
crop, and for the lowest population having
higher final total dry matter than the higher
plant populations.
5.3.5. Effect of Plant Population on Yield Components
5.3.5.1. Number of pods
As was the case with the vegetative dry
matter", the number of pods per plant decreased with
increase in plant populations and the number of
pods per hectare increased with increase in plant
population (Table 33). This is in agreement with
the findings of Leakey, (1972) , Rojas et a_l. ( 1975) ,
and Westermann and Crothers (1977).
T h o u g h n o d a t a w a s c o l l e c t e d on t h e numbe r
o f b r a n c h e s i t w a s o b s e r v e d t h a t a s p l a n t
p o p u l a t i o n w a s i n c r e a s e d , p l a n t s t e n d e d t o g r o w/
t a l l e r d u e t o i n c r e a s e d i n t e r n o d e l e n g t h , a n d t o
h a v e f e w e r b r a n c h e s t h a n p l a n t s a t t h e l o w e s t
population. Hodgson and Blackman (1956) reported
an increase in the number of podless stems per
plant with increase in plant density. Bennet
et al. (1977) had found in P. vulgaris that the
number of racemes per node and branches per plant
were significantly reduced by increasing plant
population density. Most of the variation in
the number of pods per plant was attributed to
changes in the number of branches and raceme
development.
Edje and Mughogho (1975) also reported
a decrease in the number of flowers setting mature
pods, resulting from interplant competition at
high plant densities. Leakey (1972) also
reported that the number of pods produced per
plant was actually much less than the number of
flowers. Hodgson and Blackman (1956) found in
broad beans (Vicia faba) that as plant density
was increased, the number of nodes bearing pods
diminished primarily due to the abscission of
the inflorescences. Meadley and Milbourne (1970)
reported that there was a 34% greater flower and
pod wastage in vining peas planted at 172 plants
per meter square than at a lower plant population.
This reduction in the number of flowers with
154
increase in plant density was due to competition
between plants for environmental resources,and
within plants for the available assimilates, which
results in the reduction in the number of potential
"sinks".
The observed reduction in the number of
pods per plant with increasing plant population
could therefore have been due to:
1. decrease in the number of branches per
plant
2. decrease in the number of productive
stems or decrease in the number of
branches that bear flowers
3. greater flower wastage at high plant
densities.
When plant population is increased, the resulting
reduction in the number of pods per plant is
relatively less, so that pods per unit area rises./
5.3.5.2. Number of seeds per pod
In both seasons, the highest plant population
had significantly lower number of seeds per pod
than the lower populations (Table 34). Leakey
(1972), and Westermann and Crothers (1977) had also
obtained a similar trend. Hence at the highest
155
population competition was severe enough to affect
the seed number per pod, but in the 1979 crop,
competition was apparently not severe enough to
result in significant differences in seed number
per pod between the three lower plant populations
5.3.5.3. 100-seed weight
No significant changes in 100-seed weight
with variations in plant population were obtained4
in the 1980 crop, and in the 1979 crop the
variations were irregular (Table 34). However,
the lowest 100-seed weight was obtained at the
highest population in the 1979 crop, and the
difference in seed weight between this population
and the other three was significant. This
implied that competition between and within
plants must have been quite severe in this season
at the highest plant population, probably
because of the less favourable rainfall regime
in that season as compared to the 1980 season.
Froussios (1970) had also found that the weight
of seed decreased at plant densities higher than 2100 plants/m , Enyi (1975) and Westermann and
Crothers (1977) also reported that grams/seed
increased as plant population decreased.
156
Among t h e h i g h l y p l a s t i c c o m p o n e n t s o f
y i e l d , t h a t i s , n u m b e r o f p o d s p e r p l a n t , n u m b e r
o f s e e d s p e r p o d , a n d s e e d w e i g h t , t h e l a t t e r
c o m p o n e n t i s n o r m a l l y t h e l a s t t o b e a f f e c t e d b y
c o m p e t i t i o n a l s t r e s s ( A r n o n , 1972).H a r p e r (1961)
c o n s i d e r s t h i s t o b e an i n t e r n a l o-r p h y s i o l o g i c a l
h o m e o s t a s i s w i t h r e s p e c t t o t h e o r g a n t h a t i s
e s s e n t i a l f o r r e p r o d u c t i o n a n d d i s p e r s a l .
5.3.6. Effect of plant population on seed yield
I t w a s n o t e d e a r l i e r t h a t t h e r a t e o f
l e a f s e n e s c e n c e p e r h e c t a r e i n c r e a s e d a s p l a n t
p o p u l a t i o n r o s e ( T a b l e 21). C o n s e q u e n t l y
p l a n t s a t t h e h i g h e r p l a n t p o p u l a t i o n s d r i e d
f a s t e r t h a n t h o s e a t t h e l o w e r p o p u l a t i o n s , h e n c e
s e e d l o s s t h r o u g h s e e d s h a t t e r i n g c o u l d h a v e
b e e n g r e a t e r a t t h e h i g h e r t h a n a t t h e l o w e r p l a n t
p o p u l a t i o n s . L e a k e y (1972) a l s o r e p o r t e d a d e c l i n e
i n s e e d y i e l d a t h i g h p l a n t d e n s i t i e s d u e t o s e e d
s h a t t e r i n g . P l a n t s a t t h e l o w e r p o p u l a t i o n s
w h i c h had a l o w e r r a t e o f l e a f s e n e s c e n c e p e r
h e c t a r e c o u l d a l s o h a v e p r o d u c e d more p o d d r y
m a t t e r , h e n c e g r e a t e r n u m be r o f p o d s an d s e e d s
a f t e r t h e p l a n t s a t t h e h i g h p o p u l a t i o n s h a d
157
already stopped to produce additional dry matter.
The seeds at the highest plant populations were
also significantly lighter than those at the
lower populations. These factors might probably
help to explain the decrease in seed yield
with increase in plant population.
5.3.7. Effect of Plant Population on Harvest Index
Harvest index decreased significantly
with increase in plant population, indicating
that the proportion of vegetative dry matter
increased as plant population rose (Table 35).
This is in agreement with Nichols (1975) who
suggested that with increasing plant density,
a smaller proportion of assimilates is
partitioned to the seeds, and more to the leaves
and stems. Arnon (1972) reported that the internal
competition within the individual plant between
vegetative and reproductive parts becomes more
severe as competition between plants increases,
for example with increasing population pressure.
As plant density is increased, changes may occur
in the allocation of assimilates to different
parts of the plant as a result of which greater
- 158 -
proportion of the plants or of the reproductive
parts of an individual plant may become
barren. Grain production then shows a decline
in yield whereas the total dry matter production
may remain constant (Arnon, 1972).
5.4. Plant Population Density x Fertilizer
Interaction
Significant interactions between plant
population density and fertilizer were obtained
at only a few stages of growth (Tables 36 to
43) . Tables 36, 37, 39, 41 and 43 show that
where fertilizer was not applied( control)
significant differences in stem growth rate in
the 15th week, pod growth rate in the 13th week,
leaf area index in the 11th week, pod dry matter
in the 9th week and nodule weight in the 4th week,
between different populations were not obtained.
Significant differences were obtained only where
fertilizer was applied. Where significant
differences at the control occurred, they were not
as clearly marked as where the fertilizer was
applied. During the 15th week of growth for
example, significant differences in leaf growth

- 159 -
rate (Table 36 ) between the four population
densities were obtained but the clearest
responses occurred at the 100 kg P/ha and 150 kg
P/ha fertilizer levels. This tends to indicate
that phosphorus is already a limiting factor in
Kabete soils, and responses to plant population
densities can only be obtained after phosphorus
application. Different phosphate fertilizer
levels did not influence the various population
densities differently.
160
C H A P T E R 6
CONCLUSION
In this study, significant phosphate fertilizer
effects on growth and yield of beans were not
obtained. However, fertilized plants showed improved
growth, dry matter and seed yield over unfertilized
plants. Fertilized plants had:-
1. More vigorous root systems which indicated
improved water and nutrient absorption
from the soil.
2. Higher leaf growth rate with consequent
higher LAI resulting in manufacture of
greater amounts of photosynthates.
3. Higher stem dry matter indicating
production of stronger stems more
resistant to lodging and higher height
to the first inflorescence protecting
the reproductive organs from possible
soil pathogens.
4. Higher number of pods per plant and higher
number of seeds per pod which resulted
in 13% and 9% increase in seed yield in/
161
1979 and 1980 respectively over
unfertilized plants.
5. Significantly higher number and weight
of nodules which could have resulted in
higher rates of nitrogen fixation with
consequent improvement in crop growth
rate and yield.
6. H i g h e r r a t e o f p l a n t s e n e s c e n c e w h i c h
e x e m p l i f i e d t h e e f f e c t p h o s p h o r u s has
i n e n h a n c i n g p l a n t m a t u r i t y .
The non-significant differences in growth and
yield due to the different fertilizer levels indicated
that the bean plants did not substantially benefit
from fertilizer rates higher than 50 kg P/ha. Higher
fertilizer rates also tended to result in
excessively high LAI in 1980 which did not result in
corresponding increase in yield. Taking into
account the improved performance of the fertilized
plants and the non-significant yield differences
due to the various fertilizer levels, application of
50 kg P/ha to the bean plants appears to be the best
under Kabete conditions.
Rising rates of dry matter production with
increase in plant population did not result in
162
corresponding increase in seed yield. This indicated
that vegetative rather than reproductive growth
increased as plant population density was raised as
shown by decrease in Harvest Index Values with increase
in plant population. Thus vegetative growth
appeared to have increased at the expense of
reproductive growth. Since this particular crop is
grown mainly for its seed, increasing plant
population beyond 160,000 plants/ha does not appear
to result in any advantage. Hence for this particular
bean variety and under the Kabete conditions,
population of 160,000 plants/ha appears to be the
best.
Plant population density x fertilizer
interactions were largely insignificant. In the few
instances where significant interactions were
obtained, significant differences in different plant
densities occurred only where fertilizer was applied
and not at the control. This seemed to indicate
that phosphorus can be limiting in Kabete soils and
responses to plant population densities can only be
obtained after application of the element.

163
LITERATURE CITED
Acland, J.D., 1971: East African Crops.
Longman Group Ltd., london.
Adams, M.W., 1967: B a s i s o f y i e l d c o m p o n e n t
compensation in crop plants with special
reference to the field beans Phaseolus
vulgaris. Crop Sci. 7: 505-510.
Ahn, P.M., 1973, 1975: A n a l y t i c a l m e th o d s used
in t h e D e p a r tm e n t o f S o i l S c i e n c e ,
U n i v e r s i t y o f N a i r o b i . T e c h n i c . Communic.
1 and 5 .
Ahn, P.M., 1970. West African Soils. Oxford
U n i v e r s i t y P r e s s , London. (332 pp).
Almeida, D.L. De, 1973: /'Effect of liming and
NP fertilization on bean nodulation and
yield_/. Serie Agronomica 8 : 127-130.
Anderson, A.J., 1956: Molybdenum deficiencies
in legumes in Australia: Soil Sci.
81: 173-182.
Anderson, G.D., 1973: Bean responses to fertilizer
on Mt. Kilimanjaro in relation to soil and
climatic conditions. E.A. Agric.For. J. 34:

164
Appadural, R.R., J.B. Rajakarana and H. Gunasema,
1967. Effect of spacing and leaf area
on pod yields of kidney beans, Phaseolus
vulgaris. Ind. J. Agric Sci., 37: 22-26.
Arnon, I., 1972. Crop Production in Dry Regions.
Leonard Hill, London.
Bennett, J.P., Adams, M.W., and Burga, C. 1977.
Pod yield component variation and intercorrelation in Phaseolus vulgaris L.
as affected by planting density. Crop
Sci. Vol. 17: 73-75.
Carvalho, B.C.L. De, et al. 1974. / Planting
distances and density for beans in the
Northern State of Bahia/. In Procecto
Feljao, Brazil.
Chagas, I.M. and Viera, A.C., 1975. Influence of
planting distances and levels of
fertilization on bean yields and its
components. Revista ceres 22 (122): 244-263.
Comacho, L.H.S., S.H. Orozco and G. Bastidas, 1968.
Yield component vs. plant spacing in
beans. Bean Improv. Coop. Ann. Rep. 11:15.
165
Devarajan, R. , Moosa Sherrif, M., Ramanathan, G.
and Selvakumari, G. 1980. Effect of
phosphorus on yield content and its uptake
by pulse crops. Indian J. Agric. Res. 1980,
14(1): 47-52.
Donald, C.M., 1963. Competition among crop and
pasture plants: Adv. Agron. 15: 1-118.
Dow, A.I., Roberts, S. and Hintze. R., 1970.
Fertilizer trials on irrigated beans in
Central Washington. Washington
Agricultural Experiment Station. Circular
No. 564. 1973. 14p.\
Duarte, M.W. and Adams, M.W., quoted by Denis,
J.C. and Adams, M.W. Factor analysis of
plant variables related to yield in dry
beans 1. Morphological traits. Crop
Science Vol. 18 (1) : 74-78.
Edje, 0. T. , Mughogho, L.K., Ayonoadu, U.W.V. ,
1975. Bean yield and yield components
as affected by fertilizer and plant
population. Turrialba 25(1): 79-84.

166
Enyi, B.A.C., 1975. Effect of plant population on
grain yield production and distribution
of dry matter in beans (Phaseolus vulgaris)
Ghana J. Agric. Sci. 15 (2): 159-169.
F.A.O. Fertilizer programme. Ministry of Agric.
Kenya, 1971-1972: Crop Production
Division. Report Nos. 3 and 4.
F.A.O. 1977: Food legumes. Distribution,
adaptability and biology of yield. Sinha,
S.K., F.A.O. Consultant.
Froussios, G., 1970. Genetic diversity and
agricultural potential in Phaseolus
vulgaris L. Experimental Agric. 6 : 129-41.
Goulden, D.S., 1979. Effect of plant population
and row spacing on yield and components
of yield of navy beans. Phaseolus vulgaris
N.Z. Journal of Experimental Agric. 4:
177-80.
Grain Legume Project: Ministry of Agriculture.
National Horticultural Research Station,
Thika. Interim Report Nos. 8 , 9, 13 and 14
(1975, 1976, 1978, 1979).
167
Gt. Brit. Ministry of Agriculture. Fertilizers for
the Farm. Bulletin No. 195. Her
Majesty's Stationery Office. 1964.
Gurnah, A.M. 1979 . The effect of phosphate, plant
population and plant arrangement on yield
of soya beans at Kabete, Kenya. Paper
presented at the Symposium on Grain Legume
Improvement in Eastern Africa, Nairobi,
Kenya: August, 1979.
Haag, W.L., Adams, M.W. and Wiersman, J.U., 1978.
Differential responses of dry bean
genotypes to Nitrogen and Phosphorus
Fertilization of a Central American Soil.
Agron. J. 70: 565-568.
Harper, J.L., 1961. Approaches to the study of
plant competition: pp. 1-39. In
Mechanisms in Biological Competition.
Ed. F.L. Mithorpe, quoted by Arnon, 1972.
Hiroce, R., Romano, G., and Mascarenhas, H.A.A.
1970. / Leaf analysis in beans II.
Diagnosis of P. nutrition_?. Bragantia
(Brazil). 29 (2) : VII-XIII.

168
Immer, A.M. , Fischer, D.A. , Joshuel, S., 1977.
Effects of plant density and thinning on
high yielding dry beans (Phaseolus vulgaris)
in Mexico. Expl. Agric. 13: 325-335.
Kay, D.E., 1979. Crop Product Digest No. 3. Food
Legumes. London: Tropical Products
Institute, XVI +435 pp.
Keya, S.O., 1977. Nodulation and Nitrogen Fixation
in Legumes in E. Africa. In Biological
Nitrogen Fixation in Farming Systems of
the Tropics. A. Ayanaba and P.J. Dart
(eds.) John Wiley and Sons, New York.
Keya, S.O. and Mukunya, D.M. , 1979. The influence
of phosphorus and micronutrients on
nodulation of P. vulgaris at Kabete, Kenya.
Paper presented at the Symposium on Grain
Legume Improvement in Eastern Africa,
Nairobi, Kenya. August 1979.
Kintungulu Zake, J.V. 1979. The effect of Phosphorus,
S u l p h u r a n d tolybdenum on t h e g r o w t h o f
g r o u n d n u t s (A r a c h i s h y p o g a e a ) . P a p e r
p r e s e n t e d a t t h e S y m p o s i u m on G r a i n Legu me
I m p r o v e m e n t i n E a stern A f r i c a , N a i r o b i , Keny£i.
August 1979.

169
Kueneman, E.A., et al., 1979 . Effect of plant
arrangement and densities on yield of
dry beans. Agronomy journal 71: 419-424.
Lang, A .L . et al. (1956). Influence of population
and nitrogen levels on yield and protein
and oil contents of nine corn hybrids.
Agron. J. 48: 284-9. Quoted by Arnon,
1972./
Leakey, C.L.A. 1972. The effects of plant population
and fertility level on yield and its
components in two determinate cultivars
of P. vulgaris L. Savi. J. Agric. Sci.
79: 259-267.
Lucas, E.O. and Milbourne, G.M. 1975. The effect
of density of planting on the growth of
two Phaseolus vulgaris varieties in
England. J. Agric. Sci. 87: 88-98.
Mahatanya, E.T. 1976. The effects of P and Cu on the
bean plant. P. vulgaris. Mysore J.
Agric. Sci. 10 (2): 214-225.
170
Martin, M.I., Teixeira, N.T. and Netto, A. 1976.
/ Evaluation of micronutrients and total
and soluble nitrogen in beans/. Revista
Livroceres 1(2): 5-6.
Mascarenhas, H.A.A. (1966). (Spacing trials of the
dry bean variety Goiano brecace).
Bragantia 25: LI - LIII.
Matthews, W.A. 1933. The influence of planting
distances on the yield of snap and lima
beans. Proc. Am. Soc. Hort. Sci. 30:/
567-570.
Meyer, B.S., and Anderson, D.B. 1968. Plant
Physiology. D. Van Nostrand Co.
(Canada) Ltd.
Mitchell, A .R. 1964. Fertilizers for culinary
bean seed production in Northern Queensland,
Australia. Queensland J. Agric. Sci. 21
(3-4): 295-302.
Mitchell, R.L. 1970. Crop growth and culture.
Iowa State University Press, Ames.
Miyasaka, S. et al. (1965) / Fertilizer experiments
with dry beans on sandy soils of the
"Arenito Bauru" type/: Bragantia 24 (20):
231-245.

171
Mosley, A.R. 1972: Responses of bush snap bean
P. vulgaris to population density and
planting arrangement. Ph.D. thesis
Corvallis, Oregon State University.
Mujeeb Kazi, A. and Greig, J.K., 1973. Gamma
irradiation induced variability in
P. vulgaris L. Cu. Blue Lake. Radiat.
Bot., 13: 121-126, quoted by Mahatanya,
1976.
Nichols, M.A. 1974. Effect of sowing rate and
fertilizer application on yield of
dwarf beans. New Zealand J. Expl.
Agric. 2: 155-159.
Parodi, A.E., Opazo, A.J.D. and Masjidisch, J.1977. /"Effect of applying phosphorus on
biological yield and N.P.K. content of
the bean plant/. Agriculture Tecnica
37 (1): 12-18.
Pursglove, J.W. 1968. Tropical Crops.
Dicotyledons. Longman Group Ltd. London.
Rojas, G., Bravo, A., and Parodi, P. 1975 / The
effect of spacing on the yield of four
beans cultivars). Cienciae investigation
172
Agraria 2: 163-168.
Sanchez, Pedro A. Properties and Management of
Soils in the Tropics. John Wiley and Sons.
1976.
Schonher, S. and Mbugua, E.S., 1976. Bean Production
in Kenya's Central and Eastern Provinces.
University of Nairobi. Institute for
Development Studies. Occasional Paper
No. 23. 69p.
Singh, R.G. 1971. Responses of gram (Cicer
arietinum L.) to the application of
nitrogen and phosphate. Indian J. Agric.
Sci. 41 (2): 101-6.
Smartt, J. 1976. Tropical pulses. Longman Group
Ltd. London.
Stephens, D. 1967: The effect of ammonium sulphate
and other fertilizers and innoculation
treatments on beans P. vulgaris.
E.A.A.F. Journal 32: 411-417-
Sundara, Rao, W.V.B. 1971. Field experiments on
nitrogen fixation by nodulated legumes.
Plant and Soil. Special Volume 1971:
287-291.

173
Treshaw, M. 1970. Environment and plant responses,
MacGraw-Hill Book Company.
Watson, D.J. 1956. In the growth of leaves.
Proc. 3rd Easter Sch. University of
Nittingham, quoted by Mahatanya, 1976.
Webster, C.C. and Wilson, P.N. 1966. Agriculture
in the Tropics. Longman Group Ltd.,
London.
Westermann, D.T. and Crothers, S.E. 1977. Plant
population effects on the seed yield
components of beans. Crop Sci. 17:
493-496.
Wiley, R.W. and Osiru, D.S.O. 1972. Studies on
mixtures of maize and beans (Phaseolus
vulgaris) with special reference to plant
population. J. Agric. Sci. Camb. 79:
517-529 .

A P P E N D I X ___I: Rainfall and Temperature Data: Kabete
Rainfall (mm) Mean Monthly Temperature: °C
1979 1980 1979 1980January 61.3 159.1 18.1 18.2
February 205.1 63.5 18.7 18.9
March 1 2 0 . 6 61.2 19.0 19.7
Apri 1 209.3 154.2 18.7 19.8May 187.5 423.5 17.9 18.7June O6rr 24.9 16.6 15.8July 33.4 3.4 15.6 15.5Augus t 12.7 18.8 16.2 15.7September 15.6 28.9 17.6 17.6October 26.4 25.9 19 .0 18.8November 133.1 255.2 18.2 18.1December 82.2 73.7 18.3 18.0Total 1127.2 1292.2
174
APPENDIX II. Analysis of variance table showing mean squares for the studied variables
1979Weeks after plan ting 4 6 8 9 1 1 13
Variable Source of Variation dfLeaf Area Index Total 63
Replications 3 0.09** 3.96* 2 .2 2* 0.58 1.26**Fertilizer 3 0 . 0 1 1.71 0.64 0. 53 0. 14Spacing 3 2.57** 38.06** 16.07** 5.83** 4.28** ,Fertilizer x spacing 9 0.03 2 . 1 2 0. 38 0.29 0 . 1 1
Error 45 0 . 0 2 1.31 0.65 0.26 on0.18Leaf dry matter Total 63
Replications 3 13.65** 256.34** 843.18** 726.50** 97.94 141.43*Fertilizer 3 2.06 8.60 114.52 123.35 156.86 29.92
. Spacing 3 30.63** 425.87** 2338.35** 5402.31** 2997.69** 700.18**Fertilizer x spacing 9 3.59 4.04 164.59 68.53 27.40 35.36
Error 45 2.15 23.92 135.33 142.82 60. 19 47.35Stem dry matter Total 63
Replications 3 1 .2 2** 11.23* 210.79** 302.57** 109.35 145.82*Fertilizer 3 0.08 1.38 25.06 16.76 95.43 75.06Spacing 3 0.82** 47.10** 365.79** 1746.39** 1641.31** 1262.51**Fertilizer x spacing 9 0.04 1.83 18.06 19.57 68.69 23.00Error 45 0 . 12 2.98 22.53 59.85 58.37 48.26

APPENDIX II (CONTD...)- - 1979
Weeks after planting 4 6 8 9 1 1 13Variable Source of variation dfPod dry matter Total 63 t
Replications 3 81.01** 257.62 2004.44*Fertilizer • 3 7.97 414.09* 519.51Spacing 3 354.08** 6659.91** 12489.92**Fertilizer x spacing 9 7.59 102.08 211.41Error 45 1 0 . 82 121.85 493.35
Root dry matter Total 63Replications 3' Fertilizer 3Spacing 3Fertilizer x spacing 9Error 45
Total dry matter Total 63Replications 3 22.97** 380.46** 1875.76** 2646.17** 780.82 4136.03*Fertilizer 3 2.81 7.55 245.08 206.52 1108.48 1332.46Spacing 3 41.16** 773.80** 4532.15** 17837.28** 28380.03** 29985.99**Fertilizer x spacing 9 1.55 29.16 280.03 166.08 330.72 409.96Error 45 3.10 38.45 262.78 480.37 603.61 870.22
No.pods/plant TotalReplications Fertili zer
4820.06502.40
635.08937.03
687.8769.83
SpacingFertilizer x spacing
24293.13**391.01
13989.53**545.39
14707.85**141.16
- ■ - Error 965.50 336.35 215.71
176
APPENDIX II (CONTD....)
1980Weeks after planting 4 6 9 1 1 13 15Variable Source of variation dfLeaf Area Index Total 63
Replications 3 0. 34 5.15 6.75 2.78Fertilizer 3 0.43 5.37 7.61 9.12**Spacing 3 41.45** 90.11** 81.31** 16.15**Fertilizer x Spacing 9 0 . 33 2.38 3.44 6 .1 2 *Error 45 0.41 2 . 2 2 3.09 1.53
Leaf dry matter Total 63Replications 3 21.15** 211.91** 402.67** 108.01 180.40 7.75Fertilizer 3 4.80 50.90 310.81 172.12 81.55 2 1 .2 1 **Spacing 3 26.43 1164.66** 3814.94** 4237.98** 2245.03** 168.25**Fertilizer x Spacing 9 3.22 27.43 78.17 114.69 237.25** 1 0 .1 2 *Error 45 3.84 43.54 136.80 121.71 79.59 2.19
Stem dry matter Total 63Replications 3 1.74** 55.63** 182.11** 36.39 192.61** 36.52Fertilizer 3 0. 37 24.16* 129.34* 107.50 127.75* 21.70Spacing 3 1.04* 149.76** 735.28** 1418.66** 1421.38** 925.29**Fertilizer x Spacing 9 0.29 4. 64 11.75 43.37 158.27 30.39Error 45 0 . 35 7.71 37.99 64.94 37.71 27.28
177

APPENDIX II (OONTD.... )
1980
Weeks after plantinq 4 6 9 1 1 13 15Variable Pod dry ratter
Source of variation TotalReplicationsFertilizerSpacingFertilizer x Spacing
df633339
36.07*43.59**91.96**30.99*
756.3966.64
7731.91**308.13
44.39672.74
24581.79**1114.40*
239.19376.78
47776.58**1243.09
Error 45 9.13 282.18 305.52 705.11Root dry matter Total 63
- Replications 3 0.25 2.32** 6.60** 0.72 0.95 1.60Fertilizer 3 0 .0 1 0.38 3.31* 3.67** 0.64 0.35Spacing 3 0.92** 15.88** 35.09** 47.06** 30.14** 33.54**Fertilizer x Spacing 9 0.06 0.47 0.99 0.83 2.36** 1.14Error 45 0 .10 0.41 0.85 0.66 0.70 0.73
Tctal dry matter Total 63Replications 3 35.73** 534.50** 1633.75** 1301.00 704.20 477.04Fertilizer 3 7.83 141.29 1274.67* 787.99 954.17 180.87Spacing 3 48.97** 2524.60** 10652.45** 38790.34** 55923.42** 69913.31**Fertilizer x Spacing 9 5.68 50.47 243.75 1031.34 3149.24* 1565.18Error 45 7.40 87.68 375.99 1083.33 813.83 1054.30
No. pods/plant Total 63Replications 3 13.79 11.56 1.04Fertilizer 3 34.00 15.18 2.79Spacing 3 692.79** 389.68** 570.46**Fertilizer x Spacing 9 22.49 26.13* 5.50
- Error 45 15.55 7.42 5.50
17
8
APPENDIX II (CONTD. .. )
'1979 1980
Weeks after Planting 4 8 9 4 6 9 11Variable Source of df
variationNo. nodules Total 63
5.02Replications 3 37842.30 2942.23 112.22 6440.21 1417.23 170.44Fertilizer 3 5384.41** 571.47 536.93 44781.38** 1027.69** 134.10 86.81*Spacing Fertilizer x
3 11467.55 2891.95 1164.79 6985.63 1163.52** 52.85 14.47Spacing 9 4763.98 908.51 325.23 8514.67 195.65 130.95 12.99Error 45 4487.46 1192.91 488.69 7733.63 232.20 76.84 25.09
Weight of nodules Total 63
Replications 3 0.01 0.06 0.03 1.13 1.36 0.71 0.05Fertilizer 3 0.01 0.04 0.03 3.77** 4.64** 4.44** 0.35**Spacing 3 0.01 0.13* 0.03 0.61 3.32** 2.34 0.06Fertilizer x Spacing 9 0.01 0.04 0.01 1.25 1.06 0.97 0.09Error 45 0.07 0.04 0.01 0.53 0.54 1.01 0.07
179
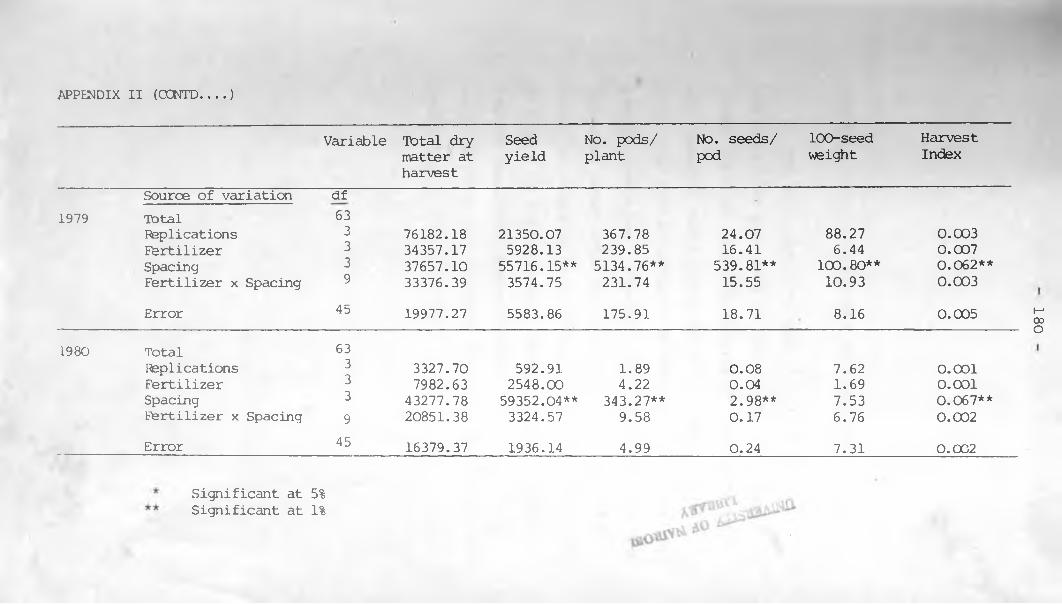
APPENDIX II (CONTD--- )
Variable Total dry matter at harvest
Seedyield
No. pods/ plant
No. seeds/ pod
10O-seed weight
HarvestIndex
Source of variation df1979 Total 63
Replications 3 76182.18 21350.07 367.78 24.07 88.27 0.003Fertilizer 3 34357.17 5928.13 239.85 16.41 6.44 0.007Spacing 3 37657.10 55716.15** 5134.76** 539.81** 100.80** 0.062**Fertilizer x Spacing 9 33376.39 3574.75 231.74 15.55 10.93 0.003
Error 45 19977.27 5583.86 175.91 18.71 8.16 0.005
1980 Total 63Replications 3 3327.70 592.91 1.89 0.08 7.62 0.001Fertilizer 3 7982.63 2548.00 4.22 0.04 1.69 0.001Spacing 3 43277.78 59352.04** 343.27** 2.98** 7.53 0.067**Fertilizer x Spacing 9 20851.38 3324.57 9.58 0.17 6.76 0.002Error 45 16379.37 1936.14 4.99 0.24 7.31 0.0C2
Significant at 5% Significant at 1%
180

181
APPENDIX III: Coefficient of Variation
The high coefficients of variation
(CV over 15%) obtained in this work could have
arisen because large quantities of bean material
were handled during each havest. Errors could
also have arisen because of working with different
people each time. However, the CVS are within the
range of those obtained from other work on field
beans for example that of the Grain Legumes Project,
Ministry of Agriculture. Beans, being an above
ground crop, are prone to many external factors
such as pests and diseases the effects of which are
reflected in the high CVS.


![A PATIENT’S GUIDE TO MEDICAL FOODS, SPECIALTY TOPICALS ... · Homocysteine levels Pyridoxal 5’-phosphate [active vitamin B 6] – Advanced glycation end products – Homocysteine](https://img.pdfslide.net/doc/110x75/5f87f6a15e09f21917510fa7/a-patientas-guide-to-medical-foods-specialty-topicals-homocysteine-levels.jpg)