Embed Size (px)
Citation preview
242 New Zealand Journal of Ecology, Vol. 38, No. 2, 2014
Effects of secondary shrublands on bird, lizard and invertebrate faunas in a dryland landscape
Susan Walker1, Deborah J. Wilson1, Grant Norbury2, Adrian Monks1 and Andrew J. Tanentzap1
1Landcare Research, Private Bag 1930, Dunedin 9054, New Zealand2Landcare Research, PO Box 282, Alexandra 9340, New Zealand*Author for correspondence (Email: [email protected])
Published online: 9 April 2014
Abstract: Succession from anthropogenic grassland to secondary woody plant communities in New Zealand’s eastern South Island dryland zone has potential to alter animal communities. We compared indigenous and exotic birds, terrestrial invertebrates and ground-dwelling lizards in 100-ha blocks representing vegetation at three woodiness levels (grassland, mixed grassland–shrubland, and shrubland) at three sites in Central Otago. We predicted that shrublands would support invertebrate taxa and indigenous bird species complementary (additional) to those in grasslands, thus increasing the diversity of taxa present in the landscape, and that shrublands would have higher indigenous dominance of bird composition than grassland. We also expected that vegetation woodiness would affect the taxonomic composition of assemblages of indigenous and exotic birds and of ground-dwelling invertebrates. We predicted shrubland would have little net effect on indigenous dryland ground-dwelling lizards, which we expected to be regulated by other microhabitat characteristics. To test our predictions we used rarefaction-based analyses of faunal complementarity, and canonical correspondence analysis (CCA) and generalised mixed models of animal response variables in relation to vegetation and environmental predictors. Our results showed that shrubland blocks supported ground-dwelling invertebrate orders and indigenous forest bird species complementary to those present in grasslands. Block-level woodiness was a primary predictor of indigenous, but not exotic, bird assemblages. At smaller scales of transects within blocks, the indigenous dominance of bird species assemblages in shrubland blocks was not significantly higher than elsewhere, but was related to plant-community-specific variations in more numerous and diverse exotic birds. Terrestrial beetle-family assemblages within plots varied significantly with local woodiness, but invertebrate-order assemblages did not. Shrubland development had little effect on common ground-dwelling lizards, which showed strong microhabitat preferences and favoured habitats dominated by indigenous plant species. We conclude that sizeable (i.e. >1 km2) areas of shrubland vegetation enhanced the diversity of indigenous birds and of ground invertebrate orders present at a landscape scale. Both grassland and shrubland habitat patches in drylands supported indigenous ground-dwelling lizards, but lizards may be vulnerable to habitat modifications that reduce indigenous plant dominance.
Keywords: Falco novaeseelandiae, Oligosoma maccanni, Oligosoma polychroma, Petroica macrocephala, Rhipidura fuliginosa, secondary succession, taxonomic complementarity, woody vegetation, Woodworthia “Central Otago”, Zosterops lateralis
Introduction
Increases in shrub density are taking place in many dry ecosystems around the world (Van Auken 2000; Graz 2008) and are attributed to multiple factors, including regional and global land use changes and climatic shifts (e.g. Brown et al. 1997; Peñuelas & Boada 2003). Transitions from grassland to shrubland habitat represent both a plant compositional change and an increase in the complexity of local habitat structure (Archer et al. 1988), and have potential to significantly alter animal communities (e.g. MacArthur & MacArthur 1961; Sirami et al. 2009). Woody vegetation can have both positive and negative effects on animal species’ distributions and interactions (Lawton 1983; McCoy & Bell 1991), and different biotic groups show different responses to grassland-to-woodland transitions. For example, in North America (Coppedge et al. 2001) and South Africa (Sirami et al. 2009), increasing woody plant cover had positive effects on open-habitat generalist, woodland, and successional shrub bird species, but negative effects on grassland endemic birds.
The inland eastern South Island of New Zealand historically supported a variety of forest and shrubland vegetation types, which were replaced by anthropogenic grasslands within a few decades of New Zealand’s first human settlement in c. 730 BP (McGlone 2001; McWethy et al. 2010). These grasslands are reverting to shrublands in some parts of this region through secondary woody succession (Rogers et al. 2005; Walker et al. 2009a, b). In this study, we investigated how bird and lizard faunas and invertebrate associations vary across gradients of grassland and secondary shrubland in a New Zealand dryland landscape (Central Otago).
Our principal prediction was that the presence of shrubland would increase the diversity of animals present in a deforested dryland landscape, by increasing the variety of habitats present. Regardless of whether woody habitats were species-poor or species-rich relative to grassy habitats at local scales, we expected they would support different animal species (‘complementary’ taxa, in the sense of novel species added to the existing set present in grasslands; Vane-Wright et al. 1991; Colwell & Coddington 1994). We expected that complementary
New Zealand Journal of Ecology (2014) 38(2): 242-256 © New Zealand Ecological Society.
Available on-line at: http://www.newzealandecology.org/nzje/
243Walker et al.: Successional effects on dryland fauna
woody-habitat specialist taxa associated with developing shrublands would make a positive contribution to the regional species pool, and increase the extent to which the diversity of indigenous species capable of living within a dryland landscape was actually present (i.e. ‘species occupancy’ sensu Lee et al. (2005) and Carswell et al. (2012)). We also tested predictions specific to three biotic groups: birds, invertebrates and lizards.
Birds: We expected the presence of secondary shrubland to influence the community composition of exotic birds as well as indigenous birds, and that indigenous birds would be more dominant in woodier vegetation in both number (i.e. a higher percentage of individuals indigenous) and composition (i.e. a higher percentage of species indigenous). The bird fauna of the eastern South Island ‘dryland’ zone is one of the most transformed in New Zealand, owing to habitat loss and predation by invasive exotic mammals (Worthy & Holdaway 2002; Wood 2007). Most ground-dwelling indigenous bird species have been extirpated (Wood 2007), but some tree- and shrub-nesting passerines (‘forest bird species’ sensu Innes et al. (2010)) persist in places. We expected these remaining forest birds would depend strongly on the presence of woody vegetation for shelter, nesting sites and food (especially fruits and invertebrates) in deforested dryland landscapes. In contrast, we expected exotic birds to be less abundant and diverse in shrublands than in grasslands or mixed shrubland–grassland, because most are European species often associated with modified non-forest habitats (MacLeod et al. 2009; Wilson et al. 2014 this issue).
Invertebrates: Some dryland indigenous shrubs harbour rich invertebrate faunas (e.g. Derraik et al. 2001), but dryland grasslands and herbfields also support diverse assemblages of indigenous invertebrate groups (e.g. moths; White 2002). Norbury et al. (2009) found that vegetative habitat characteristics affected invertebrate taxon composition, and that in drylands grass and herb groundcover was positively related to the abundance of large terrestrial invertebrates in several taxa. Shrubland vegetation represents variation in habitat characteristics beyond that measured by Norbury et al. (2009), with potential to alter a range of habitat characteristics relevant to invertebrates, such as shading, food sources, understorey litter accumulation, and decomposition processes. We therefore predicted that woody vegetation would have a significant influence on ground-dwelling-invertebrate assemblages in dryland landscapes, while also expecting variation with other abiotic and biotic microhabitat characteristics.
Lizards: In contrast to our predictions for indigenous birds and invertebrates, we expected little difference between grasslands and shrublands in the abundance of ground-dwelling lizards. Although ectothermic ground-dwelling lizards could potentially be disadvantaged by greater shading in dryland secondary shrublands, these shrubland communities are often sparse-canopied and patchy and we expected lizards would be able to select sunny, thermally favourable microsites within them. Like indigenous birds and macroinvertebrates, lizards are vulnerable to predation by introduced mammals (Norbury 2001) and secondary shrublands could either mitigate or increase predation on lizards. For example, structurally complex shrublands might offer more refugia from predators compared with grasslands, and could also lower numbers of exotic mammalian predators and their impacts on lizards indirectly, by reducing habitat suitability for rabbits, which
are the primary prey of feral cats and ferrets that also prey on lizards (Norbury 2001). Conversely, woody vegetation could favour smaller predators such as rodents, leading to additional predatory impacts on lizards (Norbury et al. 2013).
Overall, we predicted that other local microhabitat qualities would influence lizard populations more than the presence of shrubland. In particular, we expected fewer McCann’s skinks and common skinks (Oligosoma maccanni and O. polychroma) in exotic-dominated grasslands than in indigenous-dominated plant communities, due to lower habitat quality (e.g. lower diversity or abundance of indigenous plant and invertebrate food resources) or higher impacts of top mammalian predators such as cats and ferrets in pasture (Norbury 2001). As observed elsewhere in dryland habitats (e.g. Frank & Wilson 2011) we also expected a positive association between geckos and rock outcrops, which may provide additional or superior shelter, food plant refugia, or thermal storage (Rock & Cree 2003).
To test our predictions, we compared faunas associated with different grassland and secondary shrubland vegetation states, represented by 1-km2 blocks of vegetation of low, intermediate and high woodiness respectively (hereafter grassland, intermediate, and shrubland block-level woodiness). We sampled birds, invertebrates, lizards and vegetation across the three woodiness levels at each of three locations (hereafter ‘sites’) in Central Otago. We first used a rarefaction method to investigate landscape-scale taxonomic complementarity of the invertebrate and indigenous bird faunas in shrubland and intermediate blocks to the faunas of grassland blocks. We then tested our predictions about responses of different biotic groups at the smaller scale of sampling units to the degree of vegetation woodiness, other vegetative habitat characteristics, and abiotic factors. We apply our results to discuss the changes in fauna that may accompany secondary succession in this landscape.
Methods
Survey design
Study sitesWe selected three sites (Bendigo, Blackstone Hill and Cambrian) where (1) we could identify three blocks of at least 1 km2 that represented a gradient of vegetation woodiness from grassland (with cover dominated by exotic or indigenous grasses and herbs) to a mosaic or mixture of grassland and shrubland cover (hereafter ‘intermediate’) to shrubland (with cover dominated by shrubs and/or trees), and (2) the three blocks were relatively similar in slope, aspect, and elevation. All sites and blocks had been under pastoral management and grazed by sheep since the 1850s, with feral lagomorphs and ungulates present in various combinations and levels of abundance. Historical aerial photographs confirmed the shrubland vegetation at our sites was not relictual, but arose through secondary succession over the last 30 to 70 years, through unassisted spread of early-seral woody plants that were left scattered in the landscape under more frequent pastoral fire regimes (Walker et al. 2004).
All sites (Table 1) were on faces of the district’s north-east to south-west trending mountain ranges, within the same group (Type H: Mackenzie Basin and Central Otago hillslopes) of the eight-group environmental classification of drylands (Rogers et al. 2005). The Bendigo and Cambrian sites were on north-west and south-east faces of the Dunstan Mountains,
244 New Zealand Journal of Ecology, Vol. 38, No. 2, 2014
Table 1. Location of and sampling dates at the three study sites, and averages (and ranges) of physical characteristics and climate variables at the 30 sampled plots. Slope and climate variables are extracted from GIS surfaces at the GPS coordinates of each plot (and trapping grid) location. Degrees north and east (where 180° represents both due north and due east) were produced by transformation of corrected compass bearings taken at each site. Slope is derived from a 25-m digital elevation model in a GIS, and climate variables from interpolated national climate surfaces (Leathwick et al. 2003; Leathwick et al. unpubl. data).__________________________________________________________________________________________________________________________________________________________________
Site Bendigo Blackstone Hill CambrianLatitude, Longitude 169.37E, 44.94S 169.84E, 44.97S 169.72E, 44.89SSampling dates 8–12 March 2007 5–9 December 2007 8–11 February 2008 Average Range Average Range Average Range__________________________________________________________________________________________________________________________________________________________________
Physical Elevation (m) 625 512 to 702 624 460 to 762 736 623 to 868North aspect (° N) 109 10 to 170 124 0 to 180 85 0 to 180East aspect (° E) 68 5 to 180 49 5 to 120 110 50 to 164Slope (°) 13.9 2.6 to 31.3 17.5 8.3 to 25.2 25.3 9.9 to 35.4Topographic shelter (°) 12 4 to 27 9 5 to 15 14 6 to 26Rock outcrop area (m2) 1.8 0 to 14.5 2.3 0 to 23.7 1.3 0 to 19.1Climate December solar radiation (MJ m–2 day–1) 23 22.99 to 23.08 22.8 22.72 to 22.84 22.8 22.79 to 22.88Penman water deficit (mm) 531 486 to 617 487 411 to 600 354 280 to 415Annual extreme minimum temperature (°C) −9.6 −10.0 to −8.5 −9.7 −10.4 to −8.7 −9.8 −10.7 to –9.3Days of air frost in July (days) 20.8 19.0 to 21.9 20.7 20.1 to 21.7 19.4 17.8 to 21.0__________________________________________________________________________________________________________________________________________________________________
respectively, and the Blackstone Hill site was located on the north-west face of Blackstone Hill, which divides the Ida Valley from the Maniototo Plain.
Blocks (woodiness levels)Blocks at Bendigo and Blackstone Hill were square (1 × 1 km) and oriented parallel to the major slope (due north at Bendigo, north-west at Blackstone Hill) (see also Walker et al. 2014 this issue). At Cambrian, each block was a polygon narrower than long, although all blocks were wider than 500 m at their narrowest point. Here, each block spanned a creek, and block orientation varied from east to south-east. Vegetation composition was different at each site, representing a variety of the mixed indigenous–exotic plant communities now present in the district (see Appendix S1 in Supplementary Material). Shrubland blocks were dominated by indigenous Kunzea ericoides (kānuka) shrubs at Bendigo, by indigenous Discaria toumatou (matagouri) and exotic Rosa rubiginosa (sweet briar) shrubs at Blackstone Hill, and by indigenous matagouri and Coprosma propinqua shrubs and several lianes at Cambrian. The grassland block at Bendigo was dominated by exotic annual and perennial herbs and grasses, while at Blackstone Hill perennial exotic grasses, clovers (Trifolium spp.) and indigenous tussocks of Festuca novae-zelandiae, Poa cita (silver tussock) and P. colensoi (blue tussock) predominated. The grassland block at Cambrian was dominated by the indigenous snow tussock Chionochloa rigida.
Sampling layout within blocksWe established up to six sampling transects in each block, running parallel to the slope direction. At Bendigo and Blackstone Hill, three transects 667 m long were spaced 300 m apart in each block, orientated north to south, and north-west to south-east, respectively. At Cambrian, where blocks had different shapes, we laid out five, four and six parallel transects in the grassy, intermediate and woody blocks, respectively. Here, transect lengths varied from 580 to 260 m, spaced 200–275 m apart. We also positioned 10 plots of 12
× 12 m within each block using the tessellated grid-stratified sampling method to place them at random but spread out spatially across each block.
Data collection In the summers of 2007 and 2008 (Table 1) we sampled birds and vegetation along transects in each block, and ground-dwelling invertebrates, lizards, and vegetation at plots.
BirdsWe used a distance sampling technique (Buckland et al. 2001) along transects to sample birds. Between 0800 and 1200 hours, observers walked slowly along each transect. Each bird or group of birds seen, and each bird heard, was recorded and (where possible) identified to species. Transects were sampled three times by different observers on consecutive days, but due to unsuitable weather conditions, only two of three transects were sampled in each of the Bendigo intermediate and woody blocks (1334 m per block), and only four of six were sampled in the Cambrian woody block (1329 m). Birds identified to species in the field were assigned to indigenous or exotic categories. Unidentified birds were recorded as unknown (7.7% of all observations) and excluded from our analyses.
Lizards and invertebratesWe sampled ground-dwelling lizards and invertebrates in the 12 × 12 m plots. Twenty-five 100-mm-diameter, 750-ml pitfall traps (each with drainage holes and sheltered by a 150 × 150 mm raised plywood cover) were arranged in a square grid with 3-m spacing. Few geckos were captured in our first survey (at Bendigo), so in later surveys (at Blackstone Hill and Cambrian) we coated the insides of plastic containers with Fluon® AD1 (a slippery compound available from Australasian Entomological Supplies Pty Ltd, Bangalow, NSW) to reduce escapes. Traps were baited daily with 1 cm3 of canned pear and checked each morning on five consecutive sampling days.
All lizards caught were identified to species in the field (all were indigenous). We recorded all captures and recaptures,
245Walker et al.: Successional effects on dryland fauna
marking (by toe-clipping) each new unique lizard individual captured. In a few plots, traps were found disturbed (we suspect by introduced brushtail possums, Trichosurus vulpecula, or hedgehogs, Erinaceus europaeus), and we recorded the number of undisturbed traps as a measure of effective sampling effort at each plot on each day. Because lizards consume invertebrates and potentially confound invertebrate data from pitfall traps, we collected invertebrate data only from traps that were both undisturbed and did not capture lizards. In each undisturbed and lizard-free trap, we identified all invertebrates greater than 2 mm in length to order level and all beetles greater than 2 mm length to family where possible, but did not attempt to distinguish indigenous from exotic taxa. We included annelid worms (subclass Oligochaeta) and flatworms (family Platyhelminthes) as invertebrate ‘orders’ and separated Formicidae (ants) from other suborders (including sawflies, wasps and bees) within the order Hymenoptera. Invertebrates not identified to order and beetles not identified to family were excluded from our analyses (0.2% of records).
Vegetation height-frequency dataVegetation was measured using a modified Scott height-frequency method (Scott 1965) at each plot (containing a fauna-sampling grid), and along each transect (used for bird distance sampling). In plots, sampling points were spaced at 1-m intervals along five parallel 12-m sampling lines, 2 m apart (i.e. 13 points per line × 5 lines per plot = 65 points per plot; n = 650 points per block). Along transects, points were spaced at 8-m intervals, and 300 vegetation points were sampled in total in each block at each site. At each point, we recorded the presence of all vascular plant species in 10 × 10 × 10 cm vertically contiguous cubes to the maximum height of the vegetation.
Vascular plants were identified to species level and assigned to indigenous or exotic categories (Walker et al. 2014 this issue). A measure of relative abundance (i.e. ‘frequency’) was calculated for each species as the summed presence of each species in each plot or transect, expressed as a percentage of the number of sampled points. Frequency can exceed 1.0 (or 100%) where a species is present, on average, in more than one of the vertically contiguous sampling cubes per point.
We calculated a number of habitat predictor variables from the frequencies of different vascular plant groups (Appendix S2). For example, we used the summed frequency of all woody plant species as an index of plot- or transect-level woodiness, and the percent of total frequency contributed by indigenous plants as an index of indigenous structural dominance (a proxy for the level of influence of indigenous plants on physical structure of the plant community). To indicate the height-distribution and frequency of exotic species in the vegetation together, we calculated an index of ‘exotic structural complexity’ as the Shannon–Weiner index (H’) for exotic plant species presence or absence in height classes.
Ground cover and environmental data at plotsIn each whole 12 × 12 m plot (each containing a fauna-sampling grid) we estimated, by eye, the percentage of ground cover that was litter, rock, pebbles and/or gravel, and vascular plant vegetation (Appendix S2). We also recorded aspect (degrees north and degrees east (transformed to west aspect for analysis), each with range 0°–180°), topographic position (in three categories: face, gully or ridge), a topographic shelter score (average of positive and negative angles to the horizon at eight cardinal compass points from the grid centre), and the area of
exposed large rock outcrops within a 10-m radius of plot centre in each of four cardinal compass sectors.
Data analysesWe used R software for statistical computing, version 3.0.1 (R Development Core Team 2013) for all analyses.
Complementarity of shrubland and grassland faunaOur first tests investigated whether shrubland vegetation supported indigenous bird species or invertebrate taxa that were complementary (additional) to those present in the non-woody parts of the landscape. We arranged data for indigenous birds so that each sample represented a single observation of a bird or bird flock on a single day. Using the poolaccum function in the vegan library (Oksanen et al. 2012) for R, we then drew 1000 random subsets at all possible sample sizes from 1 to the total number of samples we recorded across all days (n) from our grassland, intermediate, and shrubland levels, and from two-level combinations (grassland plus shrubland and grassland plus intermediate). For each draw in each sample size, we recorded the total number of indigenous bird individuals observed (as an index of sampling effort) and the number of indigenous bird species observed. Averages and 95% confidence intervals of numbers of indigenous bird species were then calculated for each sample size for each different woodiness level and two-level combination, and plotted against average sampling effort.
We used a similar procedure for invertebrate orders and beetle families in turn, first arranging the data so that individual samples recorded the presence and absence of species from all undisturbed and lizard-free traps inspected at one plot on a single sampling day. We drew 1000 random subsets of 1 to n possible samples from each woodiness level separately and from the two-level combinations. For each draw in each sample size we recorded the total number of undisturbed and lizard-free traps as an index of sampling effort, and the observed numbers of invertebrate orders and beetle families. Finally, we plotted rarefaction curves and 95% confidence intervals for each group against average sampling effort.
Significantly higher numbers of taxa in mixed (grassland plus shrubland) samples than in grassland alone would indicate significant complementarity of taxon composition; i.e. that shrubland added novel taxa to the set already present in the non-woody parts of the landscape. However, if succession added few novel taxa but excluded grassland specialists, so that shrubland contained only a subset of those taxa present in grassland, numbers of taxa would be significantly lower within grassland plus shrubland samples than in grassland blocks alone. We could not test for significant differences by computing confidence intervals of differences between means at particular effort levels because our effort differed among samples (a single sample could be an observation of a single bird or a flock of birds, or zero to 25 undisturbed lizard-free traps). Therefore we relied on non-overlap of confidence intervals of the taxon rarefaction curves to indicate whether complementarity was likely to be significant. Non-overlapping confidence intervals would require a high degree of taxonomic complementarity because draws from two-level combinations could not be stratified for equal effort (numbers of birds or traps) in each woodiness level, and therefore some draws derived mainly from one level or the other. Some complementarity in two-level combinations could arise from inherent spatial turnover of taxa between blocks at a site, rather than habitat
246 New Zealand Journal of Ecology, Vol. 38, No. 2, 2014
differences. Because our field design did not include replicate grassland blocks to control for spatial turnover, we use the intermediate plus grassland level-combination as a reference.
Effects of habitat on the composition of bird and invertebrate assemblagesWe used canonical correspondence analysis (CCA; Legendre & Legendre 1998) to test whether transect-level assemblages of birds and plot-level assemblages of invertebrate taxa (Appendices S1 & S3) were related to woodiness and other environmental covariates. The CCA models were fitted using the vegan package for R (Oksanen et al. 2012) and statistical significance was assessed using permutation tests.
We modelled indigenous bird, exotic bird, high-level invertebrate and beetle family assemblages separately and used appropriate measures of woodiness and other environmental covariates as constraining variables. We selected environmental covariates a priori to account for likely relationships between habitat or environment, and assemblage composition. Where the Pearson’s correlation coefficient between two selected variables was ≥0.6, we retained the characteristic with the more likely biological relationship as a potential predictor variable (Appendices S2 & S3). Continuous constraining variables were centred and divided by their standard deviation prior to model fitting.
For indigenous and exotic birds we modelled transect-level counts of individuals of each species standardised for sampling effort (i.e. number of individual birds recorded per transect kilometre). Because we expected highly mobile birds to respond to the degree of woodiness at large rather than local scales, we used block-level woodiness as explanatory variable, in addition to grassiness, exotic structural complexity, and site (Appendices S2 & S3).
For invertebrates we modelled counts of invertebrate orders or beetle families recorded in all traps in a plot standardised for effort (i.e. count per undisturbed lizard-free trap) in two analyses. Beetles were separated out for further analysis because they were a diverse and numerous invertebrate group and often useful indicators of environmental differences (Rainio & Niemelä 2003). Our constraining variables for invertebrate models were plot-level woodiness (because we assumed ground invertebrates would have small home-range sizes and respond to microhabitat variation), indigenous grass frequency, exotic grass frequency, proportion of vascular plant species indigenous per plot, litter cover, amount of ground rock, pebbles and/or gravel, and site (Appendices S2 & S3).
Effects of habitat on bird response variables at the transect levelNext we tested our expectation that woody vegetation would favour indigenous birds more than exotic birds, and evaluated the relative importance of other habitat variables on bird numbers and indigenous dominance at the scale of transects. Numbers of observations of many bird species on transects were too low to estimate bird population densities based on distance sampling (Appendix S4). We therefore modelled four dependent variables derived from transect-level counts of bird individuals and bird species: total number of bird species; proportion of bird species that were indigenous; total number of bird individuals, and; proportion of bird individuals that were indigenous on each transect.
We used block-level woodiness as our measure of woody cover and a priori selected other environmental covariates
to account for likely relationships between habitat or environment, and animal abundance (Appendices S2 & S3). All models included block-level woodiness, grassiness and exotic structural complexity as fixed effects, and a block-level random intercept. For the model of total number of bird species we included the total number of observed birds as a covariate because numbers of species observed can be expected to rise with numbers of individuals observed (Gotelli & Colwell 2001). For the model of number of bird individuals we included the length (km) of transect sampled as a covariate to account for sampling effort.
Models were fitted using generalised mixed models in the lme4 package for R. Total numbers of bird species and total numbers of bird individuals were modelled assuming a Poisson error variance, with an observation-level random effect in each model to account for overdispersion (Browne et al. 2005). Proportions of bird species and bird individuals indigenous were both modelled, assuming binomial errors, with number of native bird species (or number of individuals native) as the number of successes and number of exotic bird species (or number of exotic individuals) as the number of failures in each trial. Unless otherwise indicated we present coefficient means and their 95% highest posterior density intervals (HPDI). All HPDI were calculated from 1000 draws from the posterior distribution for each of the estimated fixed effects, using the HPDinterval function in the coda package for R (Plummer et al. 2006). The variance explained by the mixed-effects models was calculated using the method of Nakagawa and Schielzeth (2013).
Effects of habitat and environment on lizard speciesTo test whether lizard abundance varied with woodiness and other selected environmental covariates, we modelled the number of unique individuals of each species caught at each trapping grid (i.e. plot) over 5 nights, using generalised mixed models with a Poisson error structure.
We modelled effects of woodiness at two spatial scales: plot and block level. Plot-level measures of woodiness and other environmental covariates are appropriate to model local lizard abundance because home-range lengths of New Zealand skinks and geckos are typically less than 20 m (e.g. Barwick 1959; Lettink 2007). However, densities of predators such as cats and mustelids are affected by landscape-scale vegetation (Alterio et al. 1998; Ragg & Moller 2000) and predation is a major source of mortality for dryland skinks and geckos (Norbury 2001; Lettink et al. 2010). Therefore landscape context may also be important for lizards, and we included block-level woodiness as a factor in the models. Plot-level woodiness was not particularly strongly related to block-level categorisation of woodiness (R2 = 0.18; F2,85 = 9.55, P = 0.0002) because the woody blocks were mosaics of shrubs and grassland.
We used the lme4 package for R for these analyses. We a priori selected environmental covariates with Pearson’s correlation coefficient ≤ 0.6 to account for likely relationships between environment or habitat and lizard abundance. In the skink models, we included woodiness (plot- and block-level), grassiness, indigenous structural dominance, rockiness, northerly aspect and the topographic position (face, gully or ridge) as fixed effects. We also included an interaction between aspect and landform because we expected aspect to be more important in gullies and on faces than on ridges. For McCann’s skinks, grassiness was modelled as a second-order polynomial, because a diagnostic plot of the term against the residuals from
247Walker et al.: Successional effects on dryland fauna
a linear fit of the term indicated a non-linear relationship. In the Central Otago gecko model we included woodiness (plot- and block-level), indigenous structural dominance, area of rock outcrop, and western aspect (representing site orientation to the afternoon sun, and thus potential thermal acquisition) as fixed effects. For all models we included a random intercept for block nested within site and a random intercept for the number of undisturbed traps. We also included an observation-level random effect to account for overdispersion in the counts (Browne et al. 2005).
Results
Faunal compositionIn total, we recorded 561 indigenous birds (of 8 species) and 2746 exotic birds (of 14 species) in our nine blocks over multiple days (some observations may not have been unique individuals; Appendix S4). Seven indigenous and 14 exotic bird species were recorded in woody blocks, 5 indigenous and 13 exotic bird species in intermediate blocks, and 3 indigenous and 12 exotic bird species in grassy blocks (Appendix S4). Most indigenous bird observations were of silvereye (60.2%), grey warbler (26.4%) or Australasian harrier (9.2%). Of the exotic bird observations, redpoll accounted for 42.1%, and goldfinch, greenfinch, yellowhammer, dunnock and chaffinch each accounted for between 8% and 10%.
More invertebrate orders (21) were identified in woody blocks than in grassy (17) and intermediate blocks (15) across our three sites, and intermediate blocks held more beetle families (9) than woody (7) and grassy blocks (6) overall. However, numbers of invertebrate orders and beetle families in woodiness levels varied widely among sites (Appendix S4).
Most lizards captured were McCann’s skink (461 unique individuals in 5 trapping nights) followed by common skink (88 individuals) and Central Otago gecko (Woodworthia “Central Otago”) (37 individuals) (Appendix S5). A single gecko was caught at Bendigo (where we did not use Fluon® to reduce escapes) and another at Cambrian (where we did). All three lizard species were caught in woody blocks at all sites, in intermediate blocks at two sites, and in a grassy block at one site (Appendices S4 & S5).
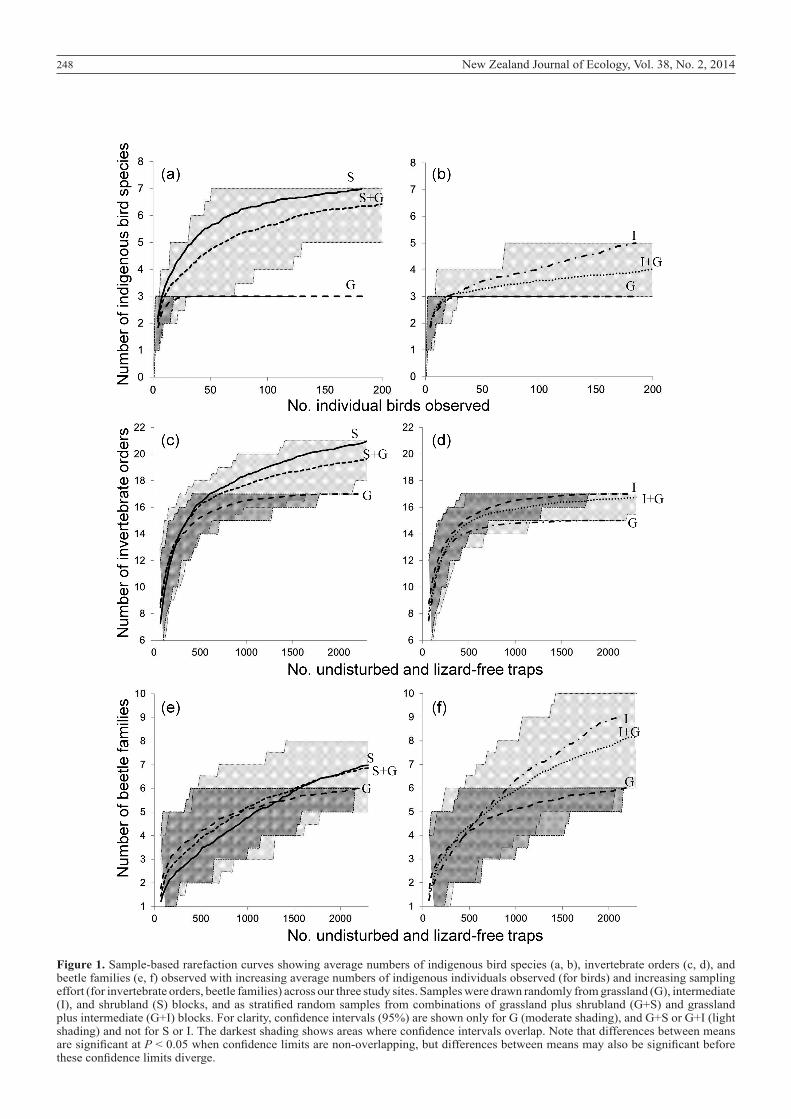
Complementarity of shrubland and grassland faunaIndigenous bird species in shrubland were complementary to those found in grassland vegetation and added significantly to the total number of indigenous bird species present across our sites (Fig. 1a). The rarefaction curve shows numbers of indigenous bird species observed in grassland vegetation plateaued at three species after relatively few (~30) random observations. Numbers of species in shrubland and intermediate vegetation rapidly exceeded those in grassland and continued to rise with additional observations (Fig. 1a, b) suggesting further indigenous bird species not observed in our sampling might be present (albeit rare) in these non-grassland vegetation types. Confidence intervals (CIs) in samples drawn from grassland alone narrowed rapidly (within 20 random observations) and became non-overlapping with CIs of samples drawn from grassland and shrubland together after about 70 individual indigenous birds had been observed (Fig. 1a). CIs of samples drawn from grassy and intermediate blocks together did not become non-overlapping with CIs of samples drawn from grassland within the limit of 182 grassland indigenous bird
observations (Fig. 1b).Numbers of invertebrate orders observed plateaued
in grassland and intermediate vegetation after about 1000 undisturbed and lizard-free traps were sampled, but continued to rise with additional numbers of traps sampled in shrubland (Fig. 1c, d), reflecting that four invertebrate ‘orders’ (pseudoscorpions, annelid worms, jumping bristletails and millipedes were recorded rarely and only in shrubland blocks (Appendix S1). The pattern suggests more invertebrate orders were present in shrubland than in grassland or intermediate vegetation across our sites, and also that more invertebrate orders were present in shrubland than we observed in our sampling. Invertebrate-order CIs in samples drawn from grassland and shrubland together diverged from those of samples drawn from grassland alone after high numbers of traps were sampled (i.e. towards the right of our horizontal axis of sampling effort) (Fig. 1c). Numbers of beetle families recorded in samples continued to rise with additional sampling effort in all woodiness levels and level-combinations, but there was no divergence of CIs evident at our maximum number of samples (Fig. 1e, f), and leaf beetles were the only beetle family we recorded in shrubland alone.
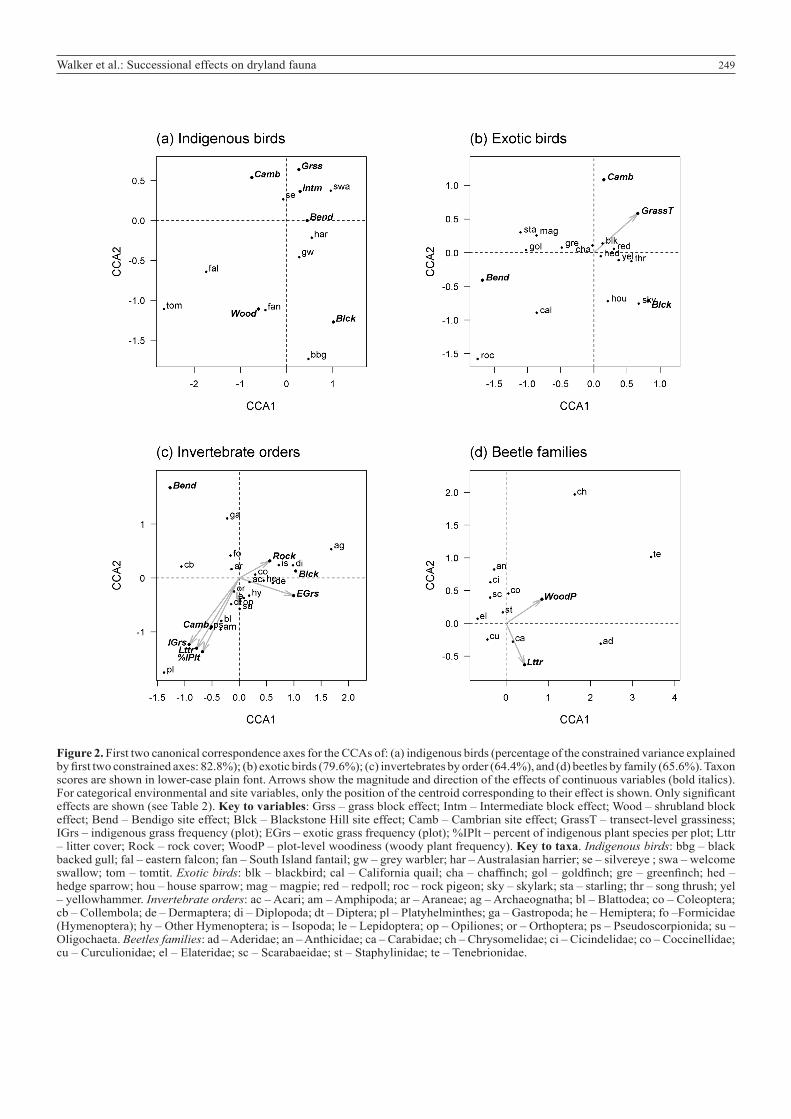
Effects of habitat on bird and invertebrate assemblagesCanonical correspondence analysis indicated that block-level woodiness significantly affected the composition of indigenous, but not exotic, bird assemblages along transects (Table 2). Increased numbers of indigenous eastern falcon, South Island tomtit, South Island fantail and black-backed gulls were associated with increased woody cover (Fig. 2a). In contrast, exotic bird assemblages were differentiated along a transect-level grassiness gradient (Table 2), with rock pigeon and California quail more likely to be associated with less grassy transects (Fig. 2b).
The high level (i.e. order-level) composition of the invertebrate order assemblages in plots was unaffected by plot-level woodiness (Table 2, Fig. 2c). Instead these assemblages were related to a range of other environmental covariates including grassiness, numbers of indigenous plant species per plot, litter cover, and the amount of ground rock. Flatworms, pseudoscorpions, amphipods and cockroaches were associated with increased levels of indigenous grass cover, higher numbers of indigenous plant species per plot and more litter, while jumping bristletails were associated with fewer indigenous plant species and less indigenous grass cover, but a more rocky environment. While invertebrate diversity at this coarse level of taxonomic distinction (i.e. orders) did not respond to woodiness, there was, however, some differentiation within invertebrate orders that was attributable to plot-level woodiness, as demonstrated by beetles (Table 2; Fig. 2d). The rarely-encountered beetle families Chrysomelidae, Tenebrionidae and Aderidae were present only in plots with locally woodier vegetation. There was also some separation of beetle families based on the amount of litter present, with Chrysomelidae being negatively, and Aderidae positively, associated with litter cover.
Effects of habitat on bird response variablesOverall, a mean (±SE) of 68.2 (±4.5) individual birds per kilometre of transect (‘transect-km’) were observed across our sites. We observed 12.5 (±1.2) indigenous birds per transect-km and 55.8 (±4.3) exotic birds. The total number of birds observed in shrubland blocks (mean 78.4 per transect-
248 New Zealand Journal of Ecology, Vol. 38, No. 2, 2014
Figure 1. Sample-based rarefaction curves showing average numbers of indigenous bird species (a, b), invertebrate orders (c, d), and beetle families (e, f) observed with increasing average numbers of indigenous individuals observed (for birds) and increasing sampling effort (for invertebrate orders, beetle families) across our three study sites. Samples were drawn randomly from grassland (G), intermediate (I), and shrubland (S) blocks, and as stratified random samples from combinations of grassland plus shrubland (G+S) and grassland plus intermediate (G+I) blocks. For clarity, confidence intervals (95%) are shown only for G (moderate shading), and G+S or G+I (light shading) and not for S or I. The darkest shading shows areas where confidence intervals overlap. Note that differences between means are significant at P < 0.05 when confidence limits are non-overlapping, but differences between means may also be significant before these confidence limits diverge.
249Walker et al.: Successional effects on dryland fauna
Figure 2. First two canonical correspondence axes for the CCAs of: (a) indigenous birds (percentage of the constrained variance explained by first two constrained axes: 82.8%); (b) exotic birds (79.6%); (c) invertebrates by order (64.4%), and (d) beetles by family (65.6%). Taxon scores are shown in lower-case plain font. Arrows show the magnitude and direction of the effects of continuous variables (bold italics). For categorical environmental and site variables, only the position of the centroid corresponding to their effect is shown. Only significant effects are shown (see Table 2). Key to variables: Grss – grass block effect; Intm – Intermediate block effect; Wood – shrubland block effect; Bend – Bendigo site effect; Blck – Blackstone Hill site effect; Camb – Cambrian site effect; GrassT – transect-level grassiness; IGrs – indigenous grass frequency (plot); EGrs – exotic grass frequency (plot); %IPlt – percent of indigenous plant species per plot; Lttr – litter cover; Rock – rock cover; WoodP – plot-level woodiness (woody plant frequency). Key to taxa. Indigenous birds: bbg – black backed gull; fal – eastern falcon; fan – South Island fantail; gw – grey warbler; har – Australasian harrier; se – silvereye ; swa – welcome swallow; tom – tomtit. Exotic birds: blk – blackbird; cal – California quail; cha – chaffinch; gol – goldfinch; gre – greenfinch; hed – hedge sparrow; hou – house sparrow; mag – magpie; red – redpoll; roc – rock pigeon; sky – skylark; sta – starling; thr – song thrush; yel – yellowhammer. Invertebrate orders: ac – Acari; am – Amphipoda; ar – Araneae; ag – Archaeognatha; bl – Blattodea; co – Coleoptera; cb – Collembola; de – Dermaptera; di – Diplopoda; dt – Diptera; pl – Platyhelminthes; ga – Gastropoda; he – Hemiptera; fo –Formicidae (Hymenoptera); hy – Other Hymenoptera; is – Isopoda; le – Lepidoptera; op – Opiliones; or – Orthoptera; ps – Pseudoscorpionida; su – Oligochaeta. Beetles families: ad – Aderidae; an – Anthicidae; ca – Carabidae; ch – Chrysomelidae; ci – Cicindelidae; co – Coccinellidae; cu – Curculionidae; el – Elateridae; sc – Scarabaeidae; st – Staphylinidae; te – Tenebrionidae.
250 New Zealand Journal of Ecology, Vol. 38, No. 2, 2014
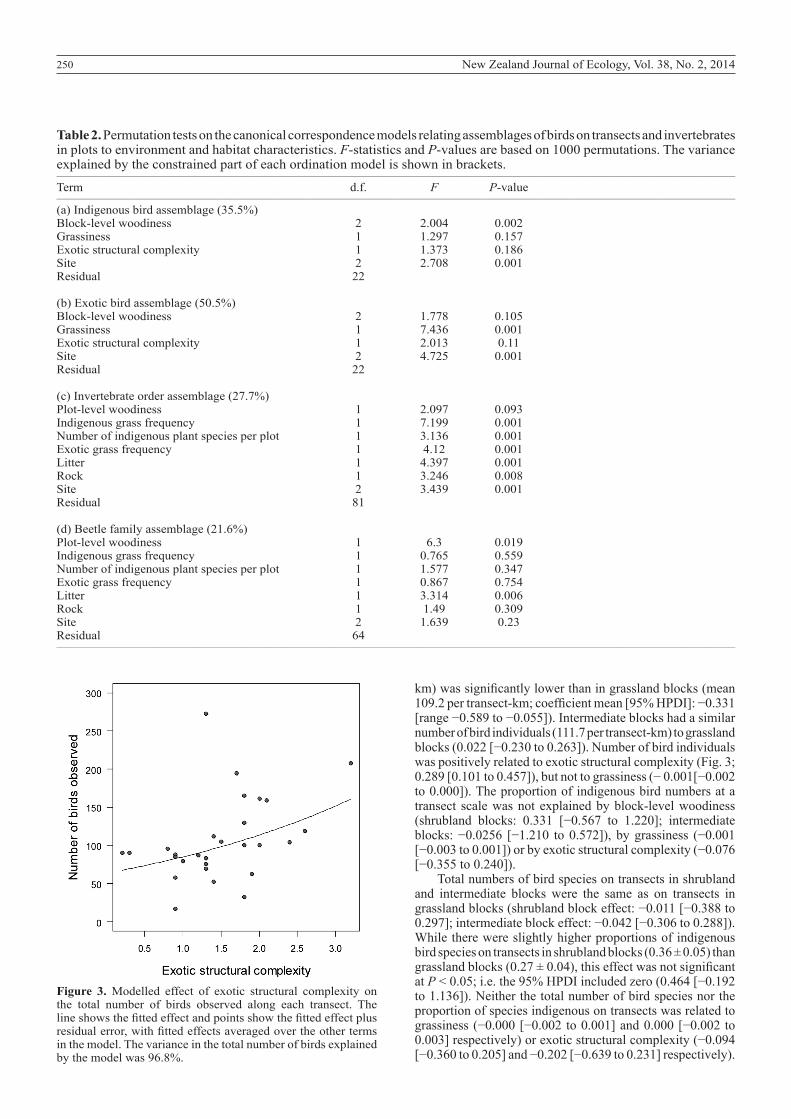
Table 2. Permutation tests on the canonical correspondence models relating assemblages of birds on transects and invertebrates in plots to environment and habitat characteristics. F-statistics and P-values are based on 1000 permutations. The variance explained by the constrained part of each ordination model is shown in brackets.__________________________________________________________________________________________________________________________________________________________________
Term d.f. F P-value__________________________________________________________________________________________________________________________________________________________________
(a) Indigenous bird assemblage (35.5%) Block-level woodiness 2 2.004 0.002Grassiness 1 1.297 0.157Exotic structural complexity 1 1.373 0.186Site 2 2.708 0.001Residual 22 (b) Exotic bird assemblage (50.5%) Block-level woodiness 2 1.778 0.105Grassiness 1 7.436 0.001Exotic structural complexity 1 2.013 0.11Site 2 4.725 0.001Residual 22 (c) Invertebrate order assemblage (27.7%) Plot-level woodiness 1 2.097 0.093Indigenous grass frequency 1 7.199 0.001Number of indigenous plant species per plot 1 3.136 0.001Exotic grass frequency 1 4.12 0.001Litter 1 4.397 0.001Rock 1 3.246 0.008Site 2 3.439 0.001Residual 81 (d) Beetle family assemblage (21.6%) Plot-level woodiness 1 6.3 0.019Indigenous grass frequency 1 0.765 0.559Number of indigenous plant species per plot 1 1.577 0.347Exotic grass frequency 1 0.867 0.754Litter 1 3.314 0.006Rock 1 1.49 0.309Site 2 1.639 0.23Residual 64__________________________________________________________________________________________________________________________________________________________________
Figure 3. Modelled effect of exotic structural complexity on the total number of birds observed along each transect. The line shows the fitted effect and points show the fitted effect plus residual error, with fitted effects averaged over the other terms in the model. The variance in the total number of birds explained by the model was 96.8%.
km) was significantly lower than in grassland blocks (mean 109.2 per transect-km; coefficient mean [95% HPDI]: −0.331 [range −0.589 to −0.055]). Intermediate blocks had a similar number of bird individuals (111.7 per transect-km) to grassland blocks (0.022 [−0.230 to 0.263]). Number of bird individuals was positively related to exotic structural complexity (Fig. 3; 0.289 [0.101 to 0.457]), but not to grassiness (− 0.001[−0.002 to 0.000]). The proportion of indigenous bird numbers at a transect scale was not explained by block-level woodiness (shrubland blocks: 0.331 [−0.567 to 1.220]; intermediate blocks: −0.0256 [−1.210 to 0.572]), by grassiness (−0.001 [−0.003 to 0.001]) or by exotic structural complexity (−0.076 [−0.355 to 0.240]).
Total numbers of bird species on transects in shrubland and intermediate blocks were the same as on transects in grassland blocks (shrubland block effect: −0.011 [−0.388 to 0.297]; intermediate block effect: −0.042 [−0.306 to 0.288]). While there were slightly higher proportions of indigenous bird species on transects in shrubland blocks (0.36 ± 0.05) than grassland blocks (0.27 ± 0.04), this effect was not significant at P < 0.05; i.e. the 95% HPDI included zero (0.464 [−0.192 to 1.136]). Neither the total number of bird species nor the proportion of species indigenous on transects was related to grassiness (−0.000 [−0.002 to 0.001] and 0.000 [−0.002 to 0.003] respectively) or exotic structural complexity (−0.094 [−0.360 to 0.205] and −0.202 [−0.639 to 0.231] respectively).
251Walker et al.: Successional effects on dryland fauna
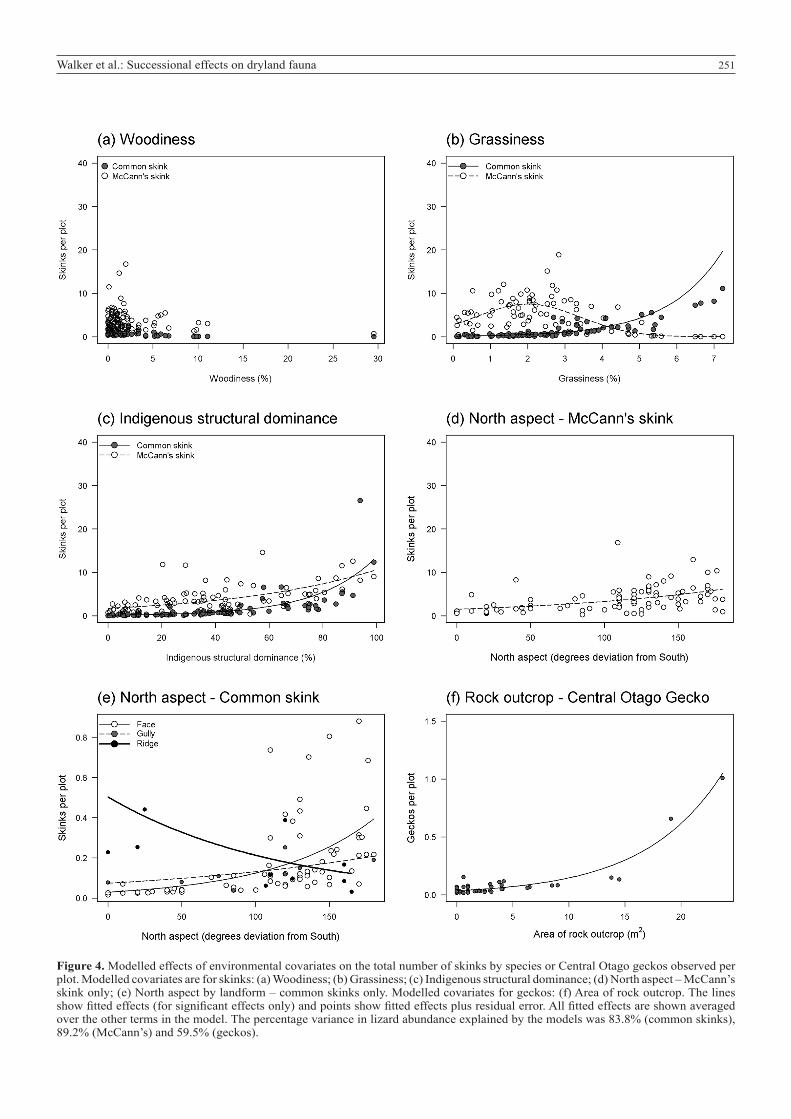
Figure 4. Modelled effects of environmental covariates on the total number of skinks by species or Central Otago geckos observed per plot. Modelled covariates are for skinks: (a) Woodiness; (b) Grassiness; (c) Indigenous structural dominance; (d) North aspect – McCann’s skink only; (e) North aspect by landform – common skinks only. Modelled covariates for geckos: (f) Area of rock outcrop. The lines show fitted effects (for significant effects only) and points show fitted effects plus residual error. All fitted effects are shown averaged over the other terms in the model. The percentage variance in lizard abundance explained by the models was 83.8% (common skinks), 89.2% (McCann’s) and 59.5% (geckos).
252 New Zealand Journal of Ecology, Vol. 38, No. 2, 2014
Effects of habitat and environment on lizard speciesOverall mean (±SE) counts of skinks per plot were 1.0 (±0.2) for common skinks and 5.1 (±0.6) for McCann’s skinks. There was no effect of plot-level woodiness on the abundance of common (coefficient mean [95% HPDI]: −0.238 [−0.448 to 0.020]) or McCann’s (−0.051 [−0.119 to 0.022]) skinks (Fig. 4a). Block-level woodiness also had no effect on skink abundance. Estimated model coefficients for differences in abundance on plots in intermediate and woody blocks from those in grassy blocks were not significantly different from zero for common (intermediate: 1.257 [−2.330 to 4.857]; woody: −0.816 [−4.435 to 3.149]) or McCann’s skinks (intermediate: −0.335 [−1.313 to 0.728]; woody: −1.037 [−2.030 to 0.006]). Common skinks were almost absent from plots with low grassiness, but abundant in plots with high grassiness (Fig. 4b; 0.682 [0.231 to 1.179]). By contrast, McCann’s skinks were most common in less grassy plots and declined in abundance in more grassy plots (grassiness: 1.023 [0.380 to 1.687]; grassiness2: –0.255 [−0.383 to −0.125]). Abundance of both common and McCann’s skinks was positively related to indigenous structural dominance (0.046 [0.012 to 0.076] and 0.018 [0.008 to 0.028], respectively; Fig. 4c). Both McCann’s (main effect: 0.008 [0.002 to 0.013]) and common skinks (0.014 [0.002 to 0.027]) were more abundant at sites with northerly aspects (Fig. 4d, e). However, this effect of aspect was less strong for common skinks on ridges compared with other landforms (ridge by aspect interaction: −0.023 [−0.047 to −0.002]), with common skinks being more abundant on ridges regardless of aspect (ridge main effect: 2.84 [0.477 to 5.459]). No significant effects of plot rockiness were detected.
Central Otago geckos were uncommon at our sites, with an average of 0.4 (±0.1) captured per plot. Gecko abundance was positively related to the area of rock outcrop (Fig. 4f; 0.144 [0.043 to 0.240]). No significant effects of woodiness, western aspect or indigenous compositional dominance were detected.
Discussion
Effects of secondary woody vegetation on dryland birdsOur study supported the prediction that vegetative habitat characteristics would significantly influence the residual indigenous bird fauna of New Zealand’s eastern South Island drylands. Although mammalian predators are presently thought to be the most important limiting factor for indigenous bird populations in New Zealand (Innes et al. 2010), our results suggest depletion of taller and woodier vegetation also limits bird diversity in a region with high numbers of mammalian predators (Norbury 2001; Norbury et al. 2009; Reardon et al. 2012) and a history of extreme deforestation and habitat modification.
For indigenous bird species, vegetation woodiness was the factor most strongly influencing assemblage composition, and shrubland habitat significantly increased occupancy (sensu Lee et al. 2005) in the landscape, with five of eight species observed only in shrubland and not in grassland. Our rising rarefaction curve for shrubland blocks suggests additional indigenous bird species might also be present (albeit rare and not recorded) in secondary woody vegetation at our study sites. This prediction is consistent with observations of bellbird (Anthornis melanura melanura) in patches of secondary kānuka – Hall’s tōtara woodland in the Upper Clutha Valley (about 9 km north of our Bendigo site; Ward et al. 1994; Walker pers. obs.).
The three indigenous bird species we observed only in shrubland blocks were an avian predator (eastern falcon, listed as At Risk ‘Recovering’ in 2012; Department of Conservation unpubl. data) and two ‘Not Threatened’, insectivorous, tree-nesting ‘forest birds’ (sensu Innes et al. 2010), South Island fantail and South Island tomtit. Though rarely seen in our study, eastern falcon is known to forage in both woody and non-woody habitats in eastern South Island, and is unlikely to be restricted to woody vegetation in drylands. However, both tomtit (a trunk and branch gleaner) and fantail (a sallying flycatcher) are woody vegetation specialists in feeding groups that are expected to increase in density relative to other guilds during succession to taller, woodier vegetation (Wiens 1989). Our observations suggest relatively large and continuous blocks of secondary woody vegetation may be required to support them in drylands. Their relative rarity in our study sites is also consistent with more specialised feeders being naturally scarce in environments, such as drylands, where resource availability fluctuates seasonally or in response to rainfall (Pyke et al. 1977).
The strongly asymptotic rarefaction curve for indigenous bird species in grassland blocks suggests few indigenous bird species use the dry Central Otago grassland habitats we studied. We observed no grassland-specialist indigenous birds in our study, and grassland habitats are almost certainly ‘sink’ (sensu Pulliam 1988) rather than primary or source habitats for the two indigenous bird species we recorded most frequently in grasslands (silvereye and grey warbler). Both silvereye and grey warbler are more habitat-generalist than fantail and tomtit (Heather & Robertson 2000; van Heezik et al. 2008) but are nevertheless tree- and shrub-nesting species that depend on nearby woody habitat for their persistence.
Exotic birds were more diverse and numerous than indigenous birds in all habitat types sampled (Appendix S4), and variations in exotic bird abundance and species diversity dominated variation in our four, transect-scale bird response variables. For example, residual indigenous specialist forest birds were rarely observed on individual shrubland transects, while exotic birds were present in greater numbers and diversity, and fluctuated more widely among transects, exerting greater influence on indigenous dominance measures at transect-scale compared with the indigenous bird fauna. Thus, our prediction that indigenous bird dominance (either proportion of total number of birds present or proportion of bird species present) would be higher in shrubland was not supported at smaller scales of sampling. Detecting the contribution of shrubland to regional diversity and dominance of indigenous birds in dryland landscapes therefore requires a sampling scale larger than transects within blocks.
Although we predicted that shrubland development would affect assemblages of exotic as well as indigenous birds, we found no evidence that vegetation woodiness was a key driver of exotic bird assemblages. Instead, exotic bird assemblages were related to our measure of grassiness and showed strong site differences. Wilson et al. (2014 this issue) also found relatively subtle effects of woodiness on exotic birds at our sites. They showed declining density of just one of the seven most common exotic bird species with increasing woodiness, and greater densities of two other species at intermediate woodiness. Our results showed total bird numbers on transects, which were principally driven by exotic bird abundance, were highest in sites with high exotic-plant structural complexity in the vegetation (a measure that reflected high frequencies of exotic sweet briar shrubs). Together these results suggest
253Walker et al.: Successional effects on dryland fauna
exotic bird assemblages and abundances at our sites were related to particular vegetation types, and perhaps especially exotic vegetation components. The pattern is consistent with a greater variety and versatility of exotic-bird feeding guilds in dryland landscapes, contrasting with a narrower suite of diet, feeding, and behaviours in the indigenous fauna (MacLeod et al. 2009; Wilson et al. 2014 this issue).
Effects of secondary woody vegetation on invertebrate compositionAlthough we did not find clear evidence of effects of local (plot-level) woodiness on associations of higher-level invertebrate orders, the presence of large blocks of woody vegetation appeared to enhance the diversity of invertebrate orders present at regional scales. These results suggest that, as with indigenous birds, development of relatively large continuous areas of woody vegetation may be required for significant gains in the landscape-scale diversity of invertebrate orders. It is possible that shrubland ‘interior’ conditions (e.g. low light and buffered temperature and moisture extremes) are required to support new invertebrate orders in South Island dryland environments.
Our sampling was insufficient to determine whether beetle families in shrubland were complementary to those in grasslands overall, but beetle family assemblages at our sites were clearly affected by plot-scale variation in vegetation woodiness. Thus, assemblage changes within the order Coleoptera were evident with changes in habitat structure at smaller scales while changes among all invertebrate orders were not. Our result showing change in beetle assemblages with local-scale variation in plant community woodiness is consistent with the rapid changes in beetle species composition at habitat edges just west of the dryland zone in Canterbury shown by Ewers and Didham (2008).
Although rising rarefaction curves suggest our study recorded relatively small fractions of the invertebrate and beetle faunas that were actually present, our results are consistent overall with plant community structure (woodiness, indigenous grasses) being a key influence on dryland invertebrate composition, as predicted by theory and demonstrated empirically overseas (e.g. Lawton 1983; Reid & Hochuli 2007). Studies providing greater resolution of taxa, indigenous and exotic groups, and functional types may well reveal effects of secondary succession that we did not distinguish.
Dryland lizard nichesOur results were consistent with our prediction that the three common ground-dwelling lizard species (common and McCann’s skink, and Central Otago gecko) at our study sites would be largely unaffected by secondary woody succession. All species were evidently able to occupy both secondary woody vegetation and grasslands, and no species was positively or negatively affected by woodiness at either plot or block scales within the range of vegetation and successional variation we sampled. However, the clear preference of both skink species for vegetation that was structurally more dominated by indigenous species suggests that all three species may be vulnerable to land-use intensification practices that diminish indigenous vegetation structure or increase the dominance of exotic plant species. This preference also potentially explains observations that grassland lizards have become restricted to isolated pockets of relictual indigenous habitat within pasture elsewhere in New Zealand drylands (Lettink & Seddon 2007;
Frank & Wilson 2011). Although not classified as threatened (Hitchmough et al. 2013) and considered among the more robust of New Zealand’s lizards to predation by introduced mammals and to habitat modification, present-day populations of these skink species may contract further with ongoing land-use intensification in dryland New Zealand.
Our models indicate that our captures of all three lizard species were strongly related to multiple local microhabitat variables, consistent with their relatively low mobility and small home ranges (Barwick 1959; Lettink 2007), and their patchy distributions and persistence in small enclaves of suitable habitat (Patterson 1992; Frank & Wilson 2011). We also found microhabitat separation in the two skink species across a gradient of grassiness at our sites. Similar niche differentiation was observed by Patterson (1992) in upland Otago grasslands, and at our sites it may reflect a competitive interaction in which common skinks are relegated to more marginal habitats. Although both skinks selected north-facing microsites, indicating selection of sunnier and more thermally favourable positions, the more abundant McCann’s skinks occupied almost all less-grassy microsites. This pattern is consistent with less-abundant common skinks being confined to grassier, more shaded microsites by swards, within which they selected more thermally favourable positions, especially in gullies and on faces.
Central Otago geckos in our study area were associated with larger outcrops, but neither west aspect nor woodiness had discernible effects. Larger rock outcrops have inherently greater thermal storage capacity (Norbury pers. obs.) and site thermal regimes are known to influence reproduction in nocturnal Central Otago gecko (Rock & Cree 2003). However, our results do not support the proposition that taller woody vegetation reduces the suitability of outcrops for geckos, for example through shading, nor do they show strong selection by geckos for outcrops that provide greater potential for thermal acquisition through orientation to the afternoon sun.
Conclusions and implications for dryland fauna conservationOur results support our primary prediction that secondary shrublands would increase the diversity of the fauna present in deforested landscapes of inland eastern South Island, New Zealand. Indigenous birds showed the clearest positive response, in that shrubland markedly increased the diversity of indigenous bird species present in the landscape. Relatively sizeable areas (i.e. at least 1-km2 blocks) of indigenous-dominated shrubland habitat appeared necessary to support more specialised insectivorous indigenous forest bird species, but more generalist species (silvereye, grey warbler) were more widespread and may require less-continuous woody cover for persistence. Our findings for birds are analogous to those for plants at the same dryland Otago landscape (Walker et al. 2014 this issue): secondary shrublands contained more indigenous plant and bird species than grasslands, and vascular plants and indigenous birds of shrubland habitats were complementary to those of grassland.
Relatively large blocks of secondary shrubland also supported ground-dwelling invertebrate orders complementary to those in grasslands, apparently enabling a greater diversity of invertebrate orders to occupy the dryland landscape. Although we found just one ground-dwelling beetle family in shrubland blocks that was not present in grassland, beetle family assemblages varied significantly across small-scale gradients of woodiness, consistent with significant changes
254 New Zealand Journal of Ecology, Vol. 38, No. 2, 2014
in composition with shrubland development.We found no evidence that diversity or local abundance
of ‘common’ ectothermic lizards would be negatively affected by secondary succession. To the contrary, although the skinks we studied evidently tolerate relatively high degrees of habitat modification, more indigenous-dominated plant communities, including shrublands, are likely to foster their abundance in dryland landscapes.
Acknowledgements
This study was funded by the Ministry of Business, Innovation and Employment (Contract C09X0503). We are grateful to landholders for enabling access to private land for this study; to our field sampling teams, especially K. Ladley, D. Clarke, I. Cooney, K. Drew, M. Green, S. Hicks, R. Lawrence, P. Lei, R. Mitchell, R. Mulvey, T. Murray, D. Richards, and J. Smith; to A. Colligan for entering data; T. Bell and M. Lettink for advice on lizard sampling; J. Wood for sharing his bird guild database; R. Wardle and T. Whittaker for help with site selection and logistics; and B. McKinlay, J. Barkla, C. Wilson and G. Rogers for critiquing our approach. We thank D. Towns, H. Buckley and an anonymous reviewer for significantly improving the manuscript with their insightful comments on drafts.
References
Alterio N, Moller H, Ratz H 1998. Movements and habitat use of feral house cats Felis catus, stoats Mustela ermine and ferrets Mustela furo, in grassland surrounding yellow-eyed penguin Megadyptes antipodes breeding areas in spring. Biological Conservation 83: 187–194.
Archer S, Scifres C, Bassham CR, Maggio R 1988. Autogenic succession in a subtropical savanna: conversion of grassland to thorn woodland. Ecological Monographs 58: 111–127.
Barwick RE 1959. The life history of the common New Zealand skink Leiolopisma zelandica (Gray, 1843). Transactions of the Royal Society of New Zealand 86: 331–380.
Brown JH, Valone TJ, Curtin CG 1997. Reorganization of an arid ecosystem in response to recent climate change. Proceedings of the National Academy of Sciences (USA) 94: 9729–9733.
Browne WJ, Subramanian SV, Jones K, Goldstein H 2005. Variance partitioning in multilevel logistic models that exhibit overdispersion. Journal of the Royal Statistical Society A 168: 599–613.
Buckland ST, Anderson DR, Burnham KP, Laake JL, Borchers DL, Thomas L 2001. Introduction to distance sampling: estimating abundance of biological populations. Oxford University Press. 432 p.
Carswell FE, Burrows LE, Hall GMJ, Mason NWH, Allen RB 2012. Carbon and plant diversity gain during 200 years of woody succession in lowland New Zealand. New Zealand Journal of Ecology 36: 191–202.
Colwell RK, Coddington JA 1994. Estimating terrestrial biodiversity through extrapolation. Philosophical Transactions of the Royal Society of London B 345: 101–118.
Coppedge BR, Engle DM, Masters RE, Gregory MS 2001. Avian response to landscape change in fragmented southern Great Plains grasslands. Ecological Applications
11: 47–59.Derraik JGB, Barratt BIP, Sirvid P, MacFarlane RP, Patrick
BH, Early J, Eyles AC, Johns PM, Fraser PM, Barker GM, Henderson R, Dale PJ, Harvey MS, Fenwick G, McLellan ID, Dickinson KJM, Closs GP 2001. Invertebrate survey of a modified native shrubland, Brookdale Covenant, Rock and Pillar Range, Otago, New Zealand. New Zealand Journal of Zoology 28: 273–290.
Ewers RM, Didham RK 2008. Pervasive impact of large-scale edge effects on a beetle community. Proceedings of the National Academy of Sciences (USA) 105: 5426–5429.
Frank H, Wilson DJ 2011. Distribution, status and conservation measures for lizards in limestone areas of South Canterbury, New Zealand. New Zealand Journal of Zoology 38: 15–28.
Gotelli NJ, Colwell RK 2001. Quantifying biodiversity: procedures and pitfalls in the measurement and comparison of species richness. Ecology Letters 4: 379–391.
Graz FP 2008. The woody weed encroachment puzzle: gathering pieces. Ecohydrology 1: 340–348.
Heather BD, Robertson HA 2000. The field guide to the birds of New Zealand. Rev. edn. Auckland, Viking. 440 p.
Hitchmough R, Anderson P, Barr B, Monks J, Lettink M, Reardon J, Tocher M, Whitaker T 2013. Conservation status of New Zealand reptiles, 2012. New Zealand Threat Classification Series 2. 16 p.
Innes J, Kelly D, Overton JMcC, Gillies C 2010. Predation and other factors currently limiting New Zealand forest birds. New Zealand Journal of Ecology 34: 86–114.
Lawton JH 1983. Plant architecture and the diversity of phytophagous insects. Annual Review of Entomology 28: 23–39.
Leathwick J, Morgan F, Wilson G, Rutledge D, McLeod M, Johnston K 2003. LENZ technical guide. Wellington, Ministry for the Environment. 237 p.
Lee WG, McGlone M, Wright E 2005. Biodiversity inventory and monitoring: a review of national and international systems and a proposed framework for future biodiversity monitoring by the Department of Conservation. Landcare Research Contract Report LC0405/122. Prepared for the Department of Conservation, Wellington. 216 p. http://www.landcareresearch.co.nz/research/obi/public/biodiv_inventory_monitoring.pdf
Legendre P, Legendre L 1998. Numerical ecology. 2nd English edn. Elsevier, Amsterdam. 990 p.
Lettink M 2007. Detectability, movements and apparent lack of homing in Hoplodactylus maculatus (Reptilia: Diplodactylidae) following translocation. New Zealand Journal of Ecology 31: 111–116.
Lettink M, Seddon PJ 2007. Influence of microhabitat factors on capture rates of lizards in a coastal New Zealand environment. Journal of Herpetology 41: 187–196.
Lettink M, Norbury G, Cree A, Seddon PJ, Duncan RP, Schwarz CJ 2010. Removal of predators, but not artificial refuge supplementation, increases skink survival in coastal duneland. Biological Conservation 143: 72–77.
MacArthur RH, MacArthur JW 1961. On bird species diversity. Ecology 42: 594–598.
MacLeod CJ, Newson SE, Blackwell G, Duncan RP 2009. Enhanced niche opportunities: can they explain the success of New Zealand’s introduced bird species? Diversity and Distributions 15: 41–49.
McCoy ED, Bell SS 1991. Habitat structure: the evolution and diversification of a complex topic. In: Bell SB, McCoy ED, Mushinsky HR eds Habitat structure, the physical
255Walker et al.: Successional effects on dryland fauna
arrangement of objects in space. London, Chapman & Hall. Pp. 3–17.
McGlone MS 2001. The origin of the indigenous grasslands of southeastern South Island in relation to pre-human woody ecosystems. New Zealand Journal of Ecology 25(1): 1–15.
McWethy DB, Whitlock C, Wilmshurst JM, McGlone MS, Fromont M, Li X, Dieffenbacher-Krall A, Hobbs WO, Fritz SC, Cook ER 2010. Rapid landscape transformation in South Island, New Zealand, following initial Polynesian settlement. Proceedings of the National Academy of Sciences (USA) 107: 21343–21348.
Nakagawa S, Schielzeth H 2013. A general and simple method for obtaining R2 from generalized linear mixed-effects models. Methods in Ecology and Evolution 4: 133–142.
Norbury G 2001. Conserving dryland lizards by reducing predator-mediated apparent competition and direct competition with introduced rabbits. Journal of Applied Ecology 38: 1350–1361.
Norbury G, Heyward R, Parkes J 2009. Skink and invertebrate abundance in relation to vegetation, rabbits and predators in a New Zealand dryland ecosystem. New Zealand Journal of Ecology 33: 24–31.
Norbury G, Byrom A, Pech R, Smith J, Clarke D, Anderson D, Forrester G 2013. Invasive mammals and habitat modification interact to generate unforeseen outcomes for indigenous fauna. Ecological Applications 23: 1707–1721.
Oksanen J, Blanchet FG, Kindt R, Legendre P, Minchin PR, O’Hara RB, Simpson GL, Solymos P, Stevens MHH, Wagner H 2012. vegan: Community Ecology Package. R package version 2.0-4. http://CRAN.R-project.org/package=vegan.
Patterson GB 1992. The ecology of a New Zealand grassland lizard guild. Journal of the Royal Society of New Zealand 22: 91–106.
Peñuelas J, Boada M 2003. A global change-induced biome shift in the Montseny mountains (NE Spain). Global Change Biology 9: 131–140.
Plummer M, Best N, Cowles, K, Vines, K 2006. coda: convergence diagnosis and output analysis for MCMC. R News 6: 7–11.
Pulliam HR 1988. Sources, sinks, and population regulation. The American Naturalist 132: 652–661.
Pyke GH, Pulliam HR, Charnov EL 1977. Optimal foraging: a selective review of theory and tests. Quarterly Review of Biology 52: 137–154.
R Development Core Team 2013. R: A language and environment for statistical computing. Vienna, Austria, R Foundation for Statistical Computing. http://www.R-project.org/.
Ragg JR, Moller H 2000. Microhabitat selection by ferrets (Mustela furo) in a pastoral habitat, East Otago, New Zealand. New Zealand Journal of Ecology 24: 39–46.
Rainio J, Niemelä J 2003. Ground beetles (Coleoptera: Carabidae) as bioindicators. Biodiversity and Conservation 12: 487–506.
Reardon JT, Whitmore N, Holmes KM, Judd LM, Hutcheon AD, Norbury G, Mackenzie DI 2012. Predator control allows critically endangered lizards to recover on mainland New Zealand. New Zealand Journal of Ecology 36: 141–150.
Reid AM, Hochuli DF 2007. Grassland invertebrate assemblages in managed landscapes: Effect of host plant and microhabitat architecture. Austral Ecology 32: 708–718.
Rock J, Cree A 2003. Intraspecific variation in the effect of temperature on pregnancy in the viviparous gecko Hoplodactylus maculatus. Herpetologica 59: 8–22.
Rogers G, Walker S, Lee B 2005. The role of disturbance in dryland New Zealand: past and present. Science for Conservation 258. Wellington, Department of Conservation. 122 p.
Scott D 1965. A height frequency method for sampling tussock and shrub vegetation. New Zealand Journal of Botany 3: 253–260.
Sirami C, Seymour C, Midgley G, Barnard P 2009. The impact of shrub encroachment on savanna bird diversity from local to regional scale. Diversity and Distributions 15: 948–957.
Van Auken OW 2000. Shrub invasions of North American semiarid grasslands. Annual Review of Ecology and Systematics 31: 197–215.
Van Heezik Y, Smyth A, Mathieu R 2008. Diversity of native and exotic birds across an urban gradient in a New Zealand city. Landscape and Urban Planning 87: 223–232.
Vane-Wright RI, Humphries CJ, Williams PH 1991. What to protect?—Systematics and the agony of choice. Biological Conservation 55: 235–254.
Walker S, Lee WG, Rogers GM 2004. The woody vegetation of Central Otago. New Zealand Journal of Botany 42: 589–612.
Walker S, Cieraad E, Monks A, Burrows L, Wood J, Price R, Rogers G, Lee B 2009a. Long-term dynamics and rehabilitation of woody ecosystems in dryland South Island, New Zealand. In: Hobbs RJ, Suding KN eds New models for ecosystem dynamics and restoration. New York, Island Press. Pp. 99–111.
Walker S, King N, Monks A, Williams S, Burrows L, Cieraad E, Meurk C, Overton JMcC, Price R, Smale M 2009b. Secondary woody vegetation patterns in New Zealand’s South Island dryland zone. New Zealand Journal of Botany 47: 367–393.
Walker S, Wilson DJ, Norbury G, Monks A, Tanentzap AJ 2014. Complementarity of indigenous flora in shrublands and grasslands in a New Zealand dryland landscape. New Zealand Journal of Ecology 38: xx–xx.
Ward CM, Bruce DL, Rance BD, Roozen DA, Grove P 1994. Lindis, Pisa and Dunstan ecological districts: a survey report for the Protected Natural Areas Programme. New Zealand Protected Natural Areas Programme. Dunedin, Department of Conservation. 236 p.
White EG 2002. New Zealand tussock grassland moths: a taxonomic and ecological handbook based on light-trapping studies in Canterbury. Lincoln, Manaaki Whenua Press. 362 p.
Wiens JA 1989. The ecology of bird communities. Vol. I: Foundations and patterns. Cambridge, Cambridge University Press. 544 p.
Wilson DJ, Norbury G, Walker S 2014. How does woody succession affect population densities of passerine birds in New Zealand drylands? New Zealand Journal of Ecology 38: xx–xx.
Wood JR 2007. Pre-settlement paleoecology of Central Otago’s semi-arid lowlands, with emphasis on the pre-settlement role of avian herbivory in South Island dryland ecosystems, New Zealand. Unpublished PhD thesis, University of Otago, Dunedin, New Zealand. 432 p.
Worthy TH, Holdaway RN 2002. The lost world of the moa: prehistoric life in New Zealand. Christchurch, Canterbury University Press. 718 p.
256 New Zealand Journal of Ecology, Vol. 38, No. 2, 2014
Supplementary Material
Additional supporting information may be found in the online version of this article:
Appendix S1. Bird and invertebrate fauna and principal plant species at the three sites.Appendix S2. Predictor variables used in models.Appendix S3. Correlation matrices showing Pearson’s correlation coefficients for the model variables.Appendix S4. Sums of taxa observed in woody (shrubland), intermediate and grassy blocks.Appendix S5. Numbers of unique individuals of three lizard species captured, grouped by site and woodiness level.
The New Zealand Journal of Ecology provides online supporting information supplied by the authors where this may assist readers. Such materials are peer-reviewed and copy-edited but any issues relating to this information (other than missing files) should be addressed to the authors.
Editorial Board member: Hannah BuckleyReceived 7 March 2013; accepted 23 November 2013