Embed Size (px)
Citation preview

Effects of Socioeconomic andDemographic Factors on Consumptionof Selected Food Nutrients
Rodolfo M. Nayga, Jr.
The effects of socioeconomic and demographic factors on the consumption of food energy,protein, vitamin A, vitamin C, thiamin, riboflavin, niacin, calcium, phosphorus, and iron areexamined. Socioeconomic and demographic factors analyzed are urbanization, region, race,ethnicity, sex, employment status, food stamp participation, household size, weight, height,age, and income. Several of these factors significantly affect consumption of certain nutrients.Income is an important factor affecting the consumption of vitamin A, vitamin C, andcalcium. Income elasticities are relatively small at low income levels. For example, incomeelasticities range from 0.016 for calcium to 0.123 for vitamin C at an income level of$20,000. -
Introduction
Increased interest in nutrition and health hasheightened the need for a more complete under-standing of nutrient consumption patterns (Adrianand Daniel, p. 31). Analysis of nutrient consump-tion provides information for a number of criticalpurposes, including the assessment of dietary sta-tus and development of nutrition education mes-sages and policies (Windham et al.).
Many factors are believed to be influencing theeating patterns of Americans. The socioeconomicand demographic structure of the United States(U. S.) population has changed dramatically sincethe end of World War II with respect to urbaniza-tion, racial mix of the population, age and incomedistribution, and size of households (McCrackenand Brandt). In particular, average household sizehas been falling; the percentage of the populationin older age categories has been increasing; popu-lation growth has shifted to the south and west; andper capita income has risen. These changes, alongwith increased emphasis on health and nutrition,have altered dietary patterns.
Knowledge of the influence of socioeconomicand demographic factors on nutrient consumptionare important, especially in the design and practi-
AssistantProfessor,Departmentof AgriculturalEconomicsandMarket-ing,RutgersUniversity.Theauthorwishesto acknowledgehelpfulcom-mentsmadeby threeanonymousjournalreviewers.The authoris alsogratefulto MauriceHartleyfor somevaluablesuggestionsandeditorialassistance.
cal implementation of nutrition outreach programs.For instance, the relationship between certain so-cio-demographic factors and the consumption of acertain nutrient can be evaluated, and knowlege ofthese relationships can be utilized to develop nu-trition education programs that focus on certaingroups of individuals that consume unacceptablelevels of certain nutrients.
Several previous studies have focused on pro-viding information on the effects of socio-demographic factors and domestic food programson nutrient intake (see Literature Review sectionbelow). Despite a considerable literature on nutri-ent consumption, Devaney and Moffitt acknowl-edged that the empirical results reported in variousstudies differ. Many of these studies have usedrelatively older data sets (e.g. 1977–78 NFCS) andhave been limited to particular subgroups of people(e.g. elderly, low income) and localized areas.
The objective of this paper is to determine theeffects of socioeconomic and demographic factorson nutrient intake of persons in the U.S. and tocompare results with those of previous studies.This study provides information on the dietary ef-fects of socioeconomic and demographic factorson nutritional intake of individuals.
Literature Review
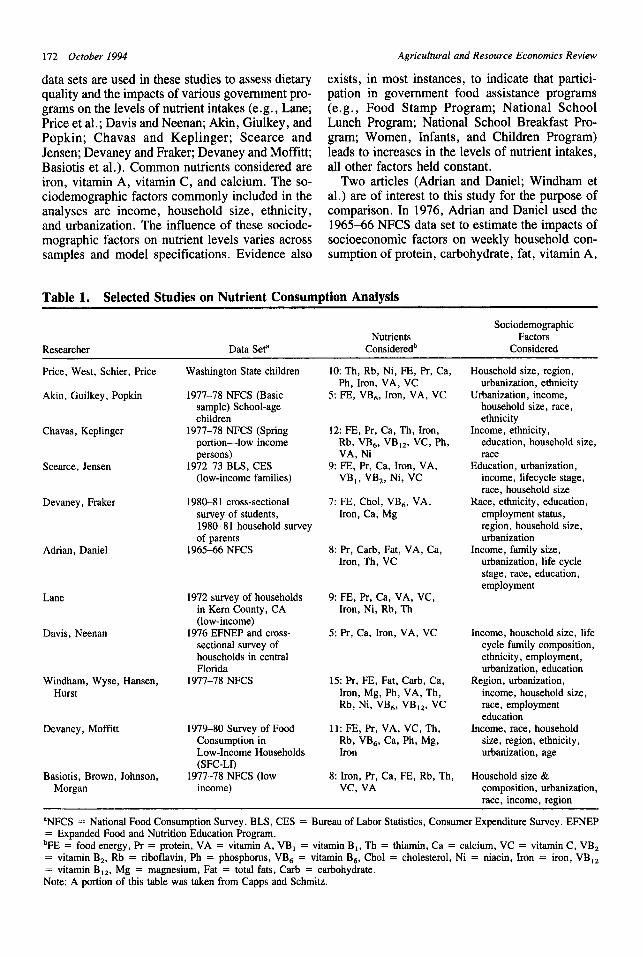
A summary of selected studies on nutrient con-sumption is presented in Table 1. Cross-sectional
172 October 1994 Agricultural and Resource Economics Review
data sets are used in these studies to assess dietaryquality and the impacts of various government pro-grams on the levels of nutrient intakes (e.g., Lane;Price et al.; Davis and Neenan; Akin, Giulkey, andPopkin; Chavas and Keplinger; Scearce andJensen; Devaney and Fraker; Devaney and Moffitt;Basiotis et al.), Common nutrients considered areiron, vitamin A, vitamin C, and calcium. The so-ciodemographic factors commonly included in theanalyses are income, household size, ethnicity,and urbanization. The influence of these sociode-mographic factors on nutrient levels varies acrosssamples and model specifications. Evidence also
exists, in most instances, to indicate that partici-pation in government food assistance programs(e.g., Food Stamp Program; National SchoolLunch Program; National School Breakfast Pro-gram; Women, Infants, and Children Program)leads to increases in the levels of nutrient intakes,all other factors held constant.
Two articles (Adrian and Daniel; Windham etal.) are of interest to this study for the purpose ofcomparison. In 1976, Adrian and Daniel used the1965-66 NFCS data set to estimate the impacts ofsocioeconomic factors on weekly household con-sumption of protein, carbohydrate, fat, vitamin A,
Table 1. Selected Studies on Nutrient Consumption Analysis
SociodemographicNutrients Factors
Researcher Data Set’ Consideredb Considered
Price, West, Schier, Price
Akin, Guilkey, Popkin
Chavas, Keplinger
Scearce, Jensen
Devaney, Fraker
Adrian, Daniel
Lane
Davis, Neenan
Windham, Wyse, Hansen,Hurst
Devaney, Moffitt
Basiotis, Brown, Johnson,Morgan
Washington State children
1977–78 NFCS (Basicsample) School-agechildren
1977-78 NFCS (Springportion-low incomepersons)
1972-73 BLS, CES(low-income families)
1980-81 cross-sectionalsurvey of students,1980-81 household surveyof parents
1965-66 NFCS
1972 survey of householdsin Kern County, CA(Iow-income)
1976 EFNEP and cross-sectional survey ofhouseholds in centralFlorida
1977-78 NFCS
1979–80 Survey of FoodConsumption inLow-Income Households(SFC-LI)
1977-78 NFCS (low
income)
10: Th, Rb, Ni, FE, Pr, Ca,Ph, Iron, VA, VC
5: FE, VB., Iron, VA, VC
12: FE, Pr, Ca, Th, Iron,Rb, VB6, VB12, VC, Ph,VA, Ni
9: FE, Pr, Ca, Iron, VA,VB1, VB2, Ni, VC
7: FE, Chol, VB6, VA,Iron, Ca, Mg
8: Pr, Carb, Fat, VA, Ca,Iron, Th, VC
9: FE, Pr, Ca, VA, VC,Iron, Ni, Rb, Th
5: Pr, Ca, Iron, VA, VC
15: Pr, FE, Fat, Cnrb, Ca,Iron, Mg, Ph, VA, Th,Rb, Ni, VB6, VB12, VC
11: FE, Pr, VA, VC, Th,Rb, VB6, Ca, Ph, Mg,Iron
8: Iron, Pr, Ca, FE, Rb, Th,VC, VA
Household size, region,urbanization, ethnicity
Urbanization, income,household size, race,ethnicity
Income, ethnicity,education, household size,race
Education, urbanization,income, lifecycle stage,race, household size
Race, ethnicity, education,employment status,region, household size,urbanization
Income, family size,urbanization, life cyclestage, race, education,employment
Income, household size, lifecycle family composition,ethnicity, employment,urbanization, education
Region, urbanization,income, household size,race, employmenteducation
Income, race, householdsize, region, ethnicity,urbanization, age
Household size &composition, urbanization,race, income, region
8NFCS = National Food Consumption Survey. BLS, CES = Bureau of Labor Statistics, Consumer Expenditure Survey. EFNEP= Expanded Food and Nutrition Education Program.bFE = food energy, Pr = protein, VA = vitamin A, VB, = vitamin B~,Th = thiamin, Ca = calcium, VC = vitamin C, VB2= vitamin B2, Rb = riboflavin, Ph = phosphorous,VB6 = vitamin B6, Chol = cholesterol, Ni = niacin, Iron = iron, VB,Z– vitamin B~z,Mg = magnesium, Fat = total fats, Carb = carbohydrate.—Note: A portion of this table was taken from Capps and Schmitz.
Nayga Consumption of Selected Food Nutrients 173
calcium, iron, thiamin, and vitamin C. The socio-economic factors considered were income, degreeof urbanization, race, educational attainment of thehomemaker, stage of the household in the familylife cycle, family size, meal adjustment, and em-ployment status of the homemaker. They foundthat income was a significant factor affecting theconsumption of all nutrients analyzed except car-bohydrate. Nutrient consumption responsivenessto income, however, was relatively small. The re-sults of this study also indicated that urban andrural households consumed smaller quantities ofall nutrients analyzed except vitamins A and Cthan do farm households. Black households con-sumed less carbohydrate, calcium, and thiaminthan do white or other race households.
In 1983, Windham et al. explored the relation-ships between some demographic and socioeco-nomic characteristics of individuals and the nutri-ent density of their diets. Using the 1977–78 NFCSdata set, regression analysis was employed to testthe effects of various socioeconomic and demo-graphic factors on the nutrient density consump-tion of food energy and 14 nutrients. The nutrientsanalyzed are protein, fat, carbohydrate, calcium,iron, magnesium, phosphorus, vitamin A, thia-min, riboflavin, niacin, vitamin B6, vitamin B12,and vitamin C. The results of this study indicatedthat geographic region of the place of residenceand race or ethnic origin of individuals were sig-nificant factors affecting calcium intake. Resultsalso suggested that nutrient intake did not varywith income level.
Model
Following Nayga and Capps, the basic model ofconsumption for specific nutrients resembles theEngel function, which relates changes in the con-sumption of a good to changes in income. Thisfunction can be derived from consumer theory byassuming that a consumer chooses a consumptionbundle so as to maximize utility subject to a budgetconstraint. Maximizing a consumer’s utility sub-ject to the budget constraint will lead to consump-tion functions for commodities:
9/ = fi(P, Y)> (1)
where p denotes a vector of prices; y is consumerincome; and qi is the consumption of the ith com-modity. By extending this model to examine theconsumption of nutrients, the intake of a certainnutrient is given by:
N = Zj aj qj, (2)
where aj denotes the amount of nutrients contained
in each unit of commodity qj. Substituting equa-tion (1) into equation (2) leads to the nutrient con-sumption function of the following form:
N = g(p,y). (3)
Recognizing that consumers’ preferences may varywith various socioeconomic and demographic vari-ables, and assuming that prices are constant in across-sectional data set, a consumption model for aparticular nutrient can be specified as:
Ni = hi(yi, S), (4)
where Ni corresponds to the intake of a certainnutrient by individual i; Yi corresponds to the in-come level of the individual i; and S is a vectorrepresenting various socioeconomic and demo-graphic factors (Nayga and Capps).
Results of previous research provide evidenceon how a number of socioeconomic and demo-graphic variables affect food consumption behav-ior and nutrient intake. For example, urbanization,race, location, income, and household size havebeen found to significantly influence food and nu-trient consumption (e.g. Buse and Salathe; Adrianand Daniel; Chavas and Keplinger).
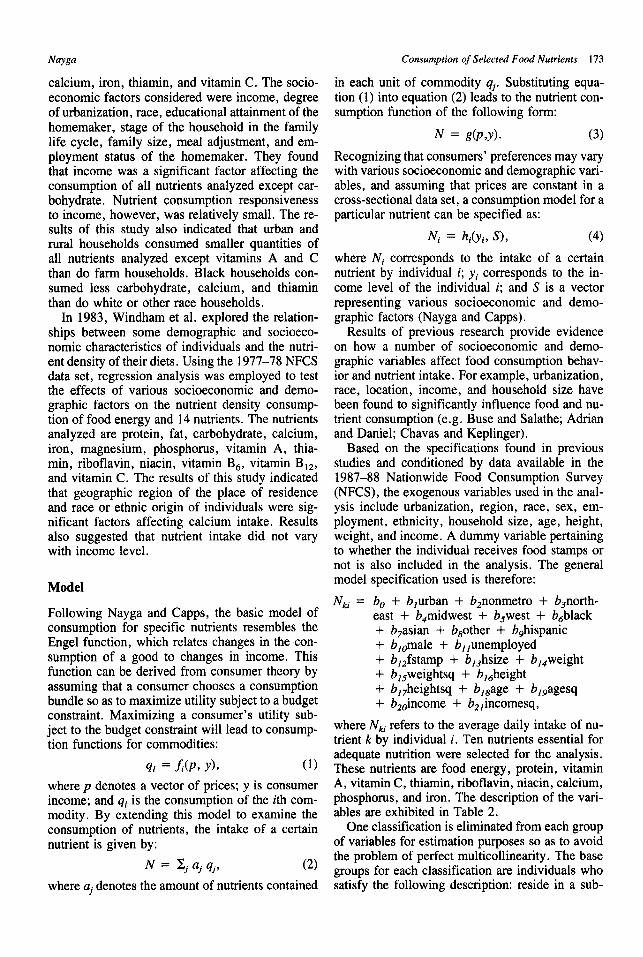
Based on the specifications found in previousstudies and conditioned by data available in the1987–88 Nationwide Food Consumption Survey(NFCS), the exogenous variables used in the anal-ysis include urbanization, region, race, sex, em-ployment, ethnicity, household size, age, height,weight, and income. A dummy variable pertainingto whether the individual receives food stamps ornot is also included in the analysis. The generalmodel specification used is therefore:
N~i = b. + b,urban + bznonmetro + b3north-east + bdmidwest + b~west + bbblack+ b~asian + b~other + bghispanic+ blomale + bllunemployed+ blzfstamp + b,jhsize + bldweight+ bl~weightsq + b,dheight+ b,,heightsq + blaage + blgagesq+ b20income + bzlincomesq,
where N~irefers to the average daily intake of nu-trient k by individual i. Ten nutrients essential foradequate nutrition were selected for the analysis.These nutrients are food energy, protein, vitaminA, vitamin C, thiamin, riboflavin, niacin, calcium,phosphorus, and iron. The description of the vari-ables are exhibited in Table 2.
One classification is eliminated from each groupof variables for estimation purposes so as to avoidthe problem of perfect multicollinearity. The basegroups for each classification are individuals whosatisfy the following description: reside in a sub-

174 October 1994 Agricultural and Resource Economics Review
Table 2. Description of the Variables Usedin the Analvsis
Name Description
urban
nonmetro
northeast
midwest
west
blackasian
other
maleunemploy{
fstamp
hsizeweightweightsq
heightheightsq
ageagesqincome
average daily intake of nutrient kbyindividual i
1 ifindividual resides in a centralcity; O otherwise
1 ifindividual resides in anonmetroarea; O otherwise
1 if individual is in the Northeast; Ootherwise
1 if individual is in the Midwest; Ootherwise
1 if individual is in the West; Ootherwise
1 if individual is black; Ootherwise1 if individual is Asian or Pacific
IslandeL O otherwise1 if individual is of some other
race; O otherwise1 if individual is hispanic; O
otherwise1 if individual is male; O otherwise
>d 1 if individual is unemployed; Ootherwise
1 if individual is receiving foodstamps; O otherwise
household sizeweight of the individual in poundssquare of the weight of the
individualheight of the individual in inchessquare of the height of the
individualage of the individual in yearssquare of the age of the individualhousehold incomesauare of household income
urban area; in the South; white; nonhispanic; fe-male; employed; and not participating in the foodstamp program. Household income is used insteadof individual income because the NFCS data setprovides income information only for the house-hold and not for an individual. Hispanics are sep-arated from the race variables because they aredefined by USDA as an ethnic group rather than arace. Therefore, a hispanic can be white, black orsome other race. Education is not included in theanalysis because the NFCS data set contains infor-mation on education for only the household head.The anthropomorphic measurements of the indi-vidual—age, sex, height, and weight—are in-cluded as exogenous variables to account for phys-ical differences between individuals. Squaredterms are included for weight, height, income andage in order to investigate possible nonlinearitiesin the Engel relationships with the consumption ofnutrients. Selected findings from the National Nu-trition Monitoring and Related Research Program
report have indicated some nonlinearities in therelationship between these four variables and nu-trient consumption (Interagency Board for Nutri-tion Monitoring and Related Research).
It is hypothesized that individuals who reside ina central city or suburban area consume lesseramounts of most nutrients than individuals residingin a nonmetro area due to decreased food con-sumption because of more sedentary work habits(Adrian and Daniel). Urbanization is also relatedto several variables like accessibility to diversetypes of stores providing a wide variety of foods;differences in the social, cultural, and economicenvironment such as occupational opportunitiesand education: and the amount of informationavailable to the individual (Scearce and Jensen).
Race of the individual can affect the purchasinghabits and hence the amount of nutrients availableto an individual, However, race is complicated byits relationship with other socioeconomic and de-mographic characteristics. No a priori hypothesisis then sDecified about the imt)act of race on the.amount of nutrient intake of a: individual. Beingmale is expected to have a greater impact on nu-trient intake than being female because males gen-erally consume more food than do women (Frazaoand Cleveland). Because unemployed and foodstamp recipients are generally less affluent thantheir- counterparts, they are expected to consumeless amounts of various nutrients than do employedand food stamp non-recipients, respectively.
As household size increases, it is hypothesizedthat the individual would decrease the intake ofmost nutrients because of possible income con-straint. As mentioned earlier, weight, height, age,and income are hypothesized to have nonlinear re-lationships with nutrient intake.
The analysis is based on cross-sectional datacollected over the April 1987 to August 1988 pe-riod. The data set does not contain price informa-tion. Although relative prices for food items couldbe the same for all individuals. some urban andregional variation in the consumption of nutrientsmay represent urban and regional differences inaverage prices over the 1987–88 data collectionperiod (Nayga and Capps). Moreover, as supplyand demand conditions change over time, relativeprices will change and the consumption patternssuggested in this-paper could change as well.
A problem in the estimation of regression mod-els using cross-sectional data is heteroskedasticity.When heteroskedasticity is present, ordinary leastsquares (OLS) estimation places more weight onthe observations which have large error variancesthan on those with small error variances. Due tothis implicit weighting, OLS parameter estimates
Nayga Consumption of Selected Food Nutrients 175
are unbiased and consistent, but they are not effi-cient (Pindyck and Rubinfeld). To detect the pres-ence of heteroskedasticity, the Breusch-Pagan-Godfrey (BPG) test is used in all the regressions(Breusch and Pagan; Godfrey). The BPG test in-volves an auxiliary regression in which eachsquared residual from the OLS estimation is re-gressed on the same set of regressors used in theoriginal equation. An F-test is then performed onall the coefficients except the intercept. The nulIhypothesis of no heteroskedasticity is rejected ifthe F test is statistically significant at a specifiedsignificance level (0.05 level in this study). If het-eroskedastic disturbances are indeed found in theseequations, weighted least squares is employedwherein the weights are the reciprocal of thesquare root of the fitted values from the auxiliaryregression involving the squared residuals.
Another potential problem in multiple regres-sion analysis is multicollinearity, Multicollinearitytests are conducted in the models using the diag-nostic tools described in Belsley, Kuh, andWelsch.
Data
The data set used in this study is the IndividualIntake phase of the U.S. Department of Agricul-ture’s (USDA) 1987–88 Nationwide Food Con-sumption Survey (NFCS). This data set is the mostrecent of the nationwide household food consump-tion surveys conducted by USDA. The individualintake phase of the 1987–88 NFCS data set pro-vides data on three days of food intake by individ-uals of all ages surveyed in the 48 contiguousstates. These individuals were asked to providethree consecutive days of dietary data. The firstday’s data were collected using 24-hour dietaryrecall. The time period for this one-day recall wasfrom midnight to 11:59 p.m. on the day precedingthe interview (USDA). This collection process wasconducted using an in-home personal interview.Data for the second and third days were collectedusing a self-administered two-day dietary record.
Nutrient intake for the day is simply the sum ofthe amounts of nutrient in each food reported by anindividual. The amount of nutrient in each foodeaten was calculated using the weight (in grams) ofthat food and the nutritive value of that food (per100 grams) from a nutrient data base developed byHuman Nutrition Information Service (HNIS).
The number of days in which food intake infor-mation was available for an individual varied.Thus, for some individuals the information wasprovided for only a one-day or two-day period.
Due to the different interview processes that wereemployed in each of the three days of intake, it isinappropriate to combine and analyze all the indi-viduals with one day, two days, and three days ofcompleted intake. Moreover, over 80 percent ofthe sample completed three days of intake. Forthese reasons, only individuals who completedthree days of intake were included in the analysis.
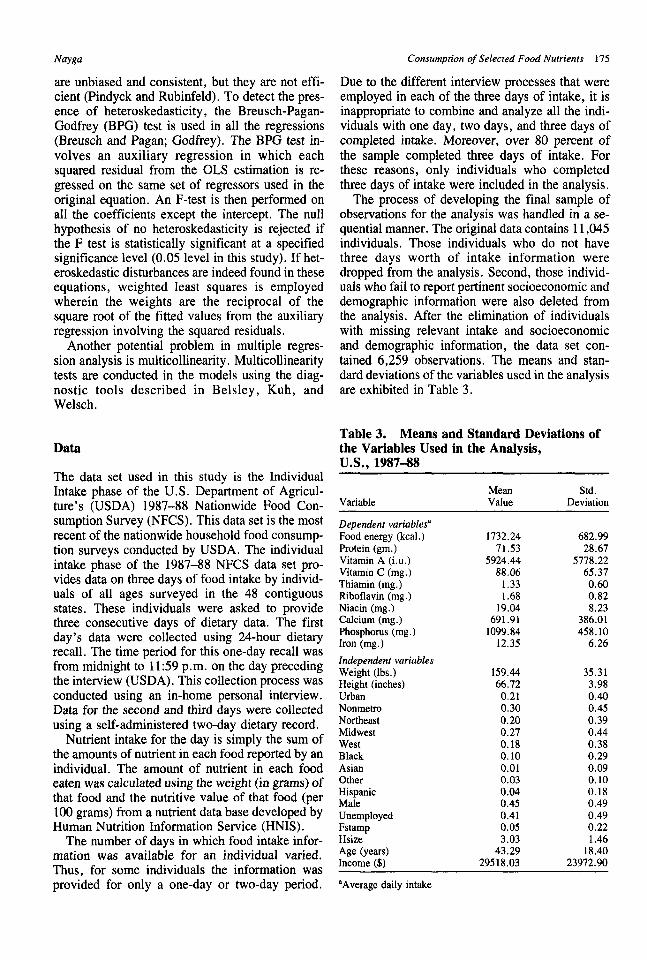
The process of developing the final sample ofobservations for the analysis was handled in a se-quential manner. The original data contains 11,045individuals. Those individuals who do not havethree days worth of intake information weredropped from the analysis. Second, those individ-uals who fail to report pertinent socioeconomic anddemographic information were also deleted fromthe analysis. After the elimination of individualswith missing relevant intake and socioeconomicand demographic information, the data set con-tained 6,259 observations. The means and stan-dard deviations of the variables used in the analysisare exhibited in Table 3.
Table 3. Means and Standard Deviations ofthe Variables Used in the Analysis,U.S., 1987-88
Mean Std.Variable Value Deviation
Dependent variables”Food energy (kcal.)Protein (gm.)Vitamin A (i.u.)Vitamin C (reg.)Thiamin (reg.)Riboflavin (reg.)Niacin (reg.)Calcium (reg.)Phosphorus (reg.)Iron (reg.)
lndependen~ variablesWeight (Ibs.)Height (inches)UrbanNonmetroNortheastMidwestWestBlackAsianOtherHispanicMaleUnemployedFstampHsizeAge (years)Income ($)
1732.2471.53
5924.4488.06
1.331.68
19.04691.91
1099.8412.35
159.4466,72
0.210.300.200.270.1s0.100.010.030.040.450.410.053.03
43.2929518.03
682.9928.67
5778.2265.370.600.828.23
386.01458.10
6.26
35.313.980.400.450.390.440.380.290.090.100.180.490.490.221.46
18.4023972.90
‘Average daily intake

176 October 1994 Agriculmral and Resource Economics Review
Table 4. Parameter Estimates of the Nutrient Equations, U.S., 1987-88
Variable Food Energy Protein Vit. A Vit. C Thiamin
Intercept
Weight
Wsq
Height
Hsq
Urban
Nonmetro
Northeast
Midwest
West
Black
Asian
Other
Hispanic
Male
Unemployed
Fstamp
Hsize
Age
Agesq
Income
Incomesq
Adi. R2
3987.25*(925.17)
1.03(1.49)
–0.001(0.004)
– 82.32*(28.01)
0.74*(0.21)
– 1.40(20.28)17.79
(17.77)– 15.63
(22.16)–43.50*
(19.58)– 85.47*
(21.64)– 68.70*
(25.13)1.36
(65.08)124.69*(51.92)
–41.13(44.65)488.78*(22.02)–5.71(17.57)
–28.15(33,58)
2,25(5.60)
– 14.33*(2.32)o. 10*
(0.02)–0.00007
(0.0006)–2.OIE-9
(1.OE-8)0.24
126.56*(39.72)
o. 15*(0.06)
–0.0003(0.0002)
–2.74*(1.20)0.02”
(0.009)0.87
(0.87)1.05
(0.76)0.21
(0.95)–0.50
(0.84)–2.62*
(0.93)–0.27
(1.08)3.58
(2.79)5.20*
(2.22)2,32
(1.92)20.33*(0.94)0.12
(0.75)–0.15
(1.44)–0.04
(0.24)–0.13
(o. 10)– 0.00007
(0.001)0.00002
(0.00002)–8.49E-11(1.OOE-1O)0.20
7754.59(8254.23)
8.54(13.81)–0.02
(0.03)– 188.38
(248.55)1,78
(1.88)273.22
(196.33)– 163.95
(177.01)677.88*
(210.23)115.84
(192.28)451.03*
(214.09)– 593.68*
(266.94)499.56
(792.63)1042.07’(509.61)
– 474.26(435.64)661.61*
(210.36)31O.44*
(173.87)–218.60(349.46)
– 197.70’(56.30)32.40
(22. 16)0.07
(0,23)0.02”
(0.006)– 4.OE-8
(4.OE-8)0.04
64.61(100.40)
0.26(0.16)
– 0.0006(0.0004)
– 1.05(3.04)0.01
(0.02)– 2.78
(2.20)–6.71*
(1.93)12.94*(2.40)0.69
(2.12)3.52
(2.34)18.06*(2.73)20.46”(7.06)27.90*(5,63)3.86
(4,84)9.86*
(2.39)8.49*
(1.91)–4.09
(3.64)–3.08”
(0.61)–0.22
(0.25)0.005*
(0.002)0.0005*
(0.00007)– 1.7E-9*
(1.OE-1O)0.05
2.96*(0.89)0.001
(0.001)– 0.000001
(4.OE-6)–0.06*
(0.02)0.0005”
(0.0002)0.001
(0.019)0.017
(0.017)– 0.0002
(0.02)–0.018
(0.018)–O.1O9*
(0.02)–0.063”
(0.02)0.13*
(0.06)0.13*
(0.05)–0.02
(0.04)0.38*
(0.02)0.02
(0.02)–0.02(0.03)0.009*
(0.005)– 0.009*
(0.002)O.0001*
(0.00002)3.35E-7
(6.30E-7)–3.4E-12
(1.OE-11)0.14
*Statistically significant at the 0.05 level.Note: Standard errors are in parentheses. All the equations are estimated using weighted least squares except for vitamin A.
Based on the U.S. population in 1988, the sam-ple is underrepresentative of individuals located inthe northeast and west and overrepresentative ofindividuals located in the south. In addition, thesample is under-representative of the number ofemployed individuals. The average age of individ-uals in the sample and the average household sizeare also above the national average. However, thedistribution of individuals by urbanization, race,sex, and income is representative of the U. S, pop-ulation in 1988 (Spencer).
Deleting data for individuals who fail to reportpertinent socioeconomic and demographic infor-mation may also give rise to a potential self-selection problem. One way to assess the degree towhich this problem may exist is by comparing themeans of the variables used in the analysis withand without the deleted data. The means of thevariables with the deleted data compare reasonablywell with the means of the variables without thedeleted data, except for the employment, age, andhousehold size variables.
Nayga Consumption of Selected Food Nutrients 177
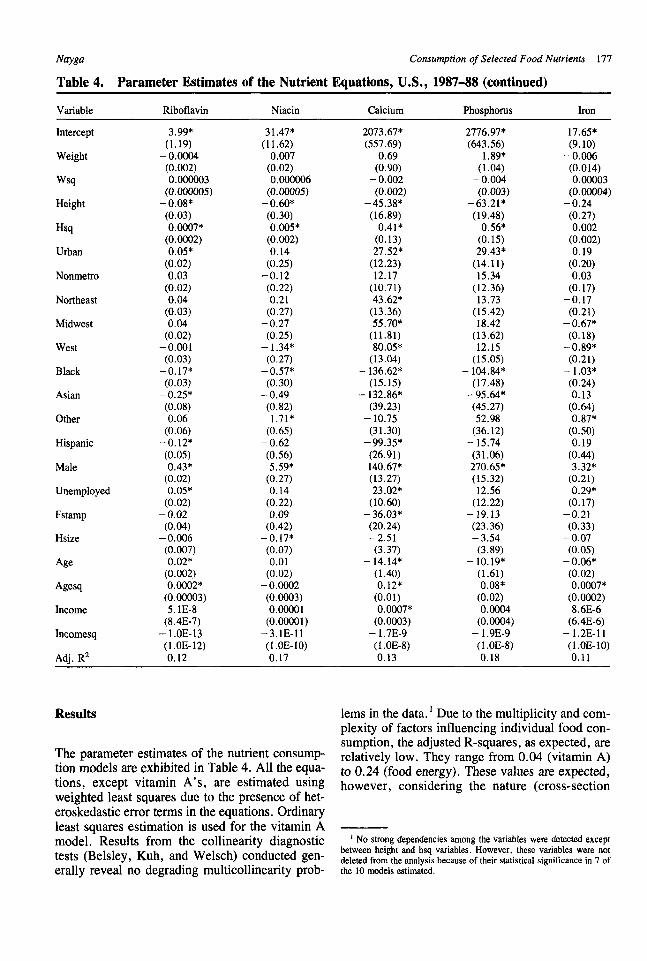
Table 4. Parameter Estimates of the Nutrient Equations, U.S., 1987-88 (continued)
Variable Riboflavin Niacin Calcium Phosphorus fron
Intercept
Weight
Wsq
Height
Hsq
Urban
Nonmetro
Northeast
Midwest
West
Black
Asian
Other
Hispanic
Male
Unemployed
Fstamp
Hsize
Age
Agesq
Income
Incomesq
Adi. R2
3.99*(1.19)
-0.0004(0.002)0.000003
(o.000005)–0.08’
(0.03)0.0007*
(0.0002)0.05”
(0.02)0.03
(0.02)0.04
(0.03)0.04
(0.02)-0.001
(0.03)–0.17”(0.03)
–0.25”(0.08)0.06
(0.06)-0.12”(0.05)0.43”
(0.02)0.05*
(0.02)– 0.02
(0,04)–0.006
(0.007)–0.02*
(0.002)0.0002*
(0.00003)5,1E-8
(8.4E-7)–1.OE-13
(1.OE-12)0.12
31.47*(11.62)
0.007(0.02)0.000006
(0.00005)–0.60*
(0.30)0.005”
(0.002)0.14
(0.25)-0.12
(0.22)0.21
(0,27)–0.27
(0,25)- 1.34*
(0.27)–0.57*(0.30)
–0.49(0.82)1.71*
(0.65)–0,62(0,56)5.59*
(0.27)0.14
(0.22)0.09
(0.42)–0.17*(0.07)0.01
(0.02)–0.0002
(0.0003)0.00001
(0.00001)–3.lE-11(l, OE-10)0.17
2073.67”(557.69)
0.69(0.90)
– 0.002(0.002)
–45.38*(16.89)
0.41*(0.13)27.52*
(12.23)12.17
(10.71)43.62*
(13.36)55.70*
(11.81)80,05*
(13.04)– 136.62*
(15.15)– 132.86*
(39.23)-10.75
(31.30)–99.35*(26.91)140.67”(13.27)23.02*
(10.60)-36.03”
(20.24)–2.51(3.37)
– 14.14*(1.40)0.12*
(0.01)0.0007*
(0.0003)- 1.7E-9(1.OE-8)0.13
2776.97*(643.56)
1.89*(1.04)
–0.004(0.003)
-63.21*(19.48)
0.56*(0.15)29.43*
(14.11)15.34
(12.36)13.73
(15.42)18.42
(13.62)12.15
(15,05)– 104.84*
(17.48)-95 .64*(45.27)52.98
(36. 12)– 15.74(31.06)270,65*(15.32)12.56
(12.22)–19.13
(23.36)–3.54
(3.89)– 10.19*
(1.61)0.08*
(0.02)0.0004
(0.0004)- 1.9E-9(1.OE-8)0.18
17.65*(9.10)
–0.006(0.014)0.00003
(0.00004)-0.24
(0.27)0.002
(0.002)0.19
(0.20)0.03
(o. 17)–0.17
(0.21)–0.67”
(0.18)–0.89*
(0.21)– 1.03*
(0.24)0.13
(0.64)0.87*
(0.50)0.19
(0.44)3.32*
(0.21)0.29”
(0.17)-0.21(0.33)
–0.07(0,05)
– 0.06*(0.02)0.0007*
(0.0002)8.6E-6
(6.4E-6)–1.2E-11(1.OE-1O)0.11
Results
The parameter estimates of the nutrient consump-tion models are exhibited in Table 4. All the equa-tions, except vitamin A’s, are estimated usingweighted least squares due to the presence of het-eroskedastic error terms in the equations. Ordinaryleast squares estimation is used for the vitamin Amodel. Results from the collinearity diagnostictests (Belsley, Kuh, and Welsch) conducted gen-erally reveal no degrading multicollinearity prob-
lems in the data. 1Due to the multiplicity and com-plexity of factors influencing individual food con-sumption, the adjusted R-squares, as expected, arerelatively low. They range from 0.04 (vitamin A)to 0.24 (food energy). These values are expected,however, considering the nature (cross-section
1No strong dependenciesamongthe variablesweredetectedexceptbetween height and hsq variables. However, these variables were notdeleted from the analysis because of their statistical significance in 7 ofthe 10 mudels estimated.
178 October 1994 Agricultural and Resource Economics Review
of individuals) of the data set used, The discussionof the results below is focused on the effects of thestatistically significant variables (the 0.05 level) onaverage daily intake of nutrients.
Urbanization, Region, and Race
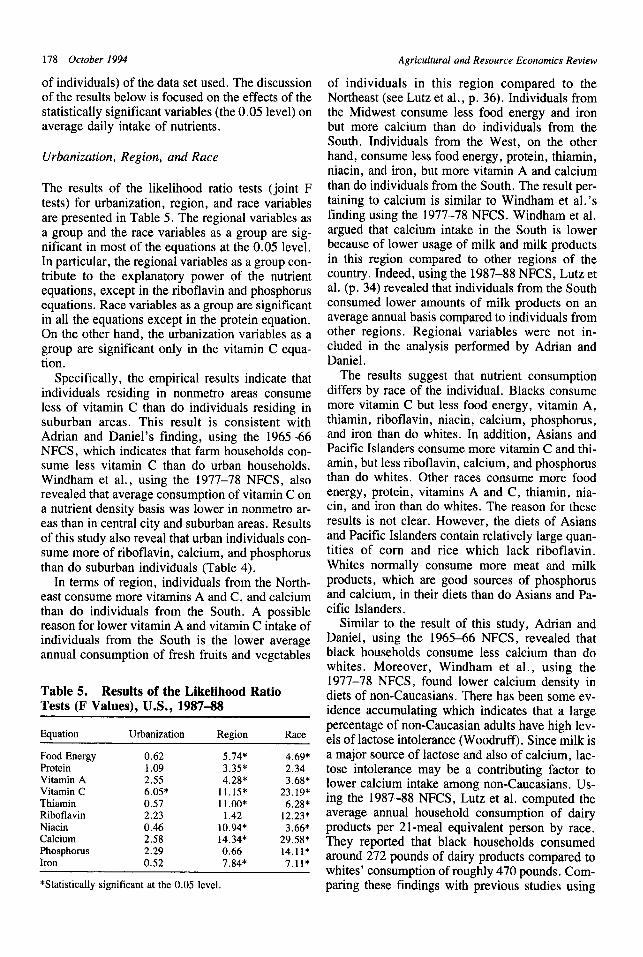
The results of the likelihood ratio tests (joint Ftests) for urbanization, region, and race variablesare presented in Table 5. The regional variables asa group and the race variables as a group are sig-nificant in most of the equations at the 0.05 level,In particular, the regional variables as a group con-tribute to the explanatory power of the nutrientequations, except in the riboflavin and phosphorusequations. Race variables as a group are significantin all the equations except in the protein equation.On the other hand, the urbanization variables as agroup are significant only in the vitamin C equa-tion.
Specifically, the empirical results indicate thatindividuals residing in nonmetro areas consumeless of vitamin C than do individuals residing insuburban areas. This result is consistent withAdrian and Daniel’s finding, using the 1965–66NFCS, which indicates that farm households con-sume less vitamin C than do urban households.Windham et al., using the 1977–78 NFCS, alsorevealed that average consumption of vitamin C ona nutrient density basis was lower in nonmetro ar-eas than in central city and suburban areas. Resultsof this study also reveal that urban individuals con-sume more of riboflavin, calcium, and phosphorusthan do suburban individuals (Table 4).
In terms of region, individuals from the North-east consume more vitamins A and C, and calciumthan do individuals from the South. A possiblereason for lower vitamin A and vitamin C intake ofindividuals from the South is the lower averageannual consumption of fresh fruits and vegetables
Table 5. Results of the Likelihood RatioTests (F Values), U. S., 1987-88
Equation Urbanization Region Race
Food EnergyProteinVitamin AVitamin CThiaminRiboflavinNiacinCalciumPhosphorusIron
0,621.092.556.05*0.572.230.462.582.290.52
5.74*3.35*4.28*
11.15*11.00*
1.4210.94*14.34*0.667.84*
4.69*2.343.68*
23.19*6.28*
12.23*3.66*
29.58*14.11*7.11*
*Statistically significant at the 0.05 level.
of individuals in this region compared to theNortheast (see Lutz et al., p. 36). Individuals fromthe Midwest consume less food energy and ironbut more calcium than do individuals from theSouth. Individuals from the West, on the otherhand, consume less food energy, protein, thiamin,niacin, and iron, but more vitamin A and calciumthan do individuals from the South. The result per-taining to calcium is similar to Windham et al.’sfinding using the 1977–78 NFCS. Windham et al.argued that calcium intake in the South is lowerbecause of lower usage of milk and milk productsin this region compared to other regions of thecountry. Indeed, using the 1987–88 NFCS, Lutz etal. (p. 34) revealed that individuals from the Southconsumed lower amounts of milk products on anaverage annual basis compared to individuals fromother regions. Regional variables were not in-cluded in the analysis performed by Adrian andDaniel.
The results suggest that nutrient consumptiondiffers by race of the individual. Blacks consumemore vitamin C but less food energy, vitamin A,thiamin, riboflavin, niacin, calcium, phosphorus,and iron than do whites. In addition, Asians andPacific Islanders consume more vitamin C and thi-amin, but less riboflavin, calcium, and phosphorusthan do whites. Other races consume more foodenergy, protein, vitamins A and C, thiamin, nia-cin, and iron than do whites. The reason for theseresults is not clear. However, the diets of Asiansand Pacific Islanders contain relatively large quan-tities of corn and rice which lack riboflavin.Whites normally consume more meat and milkproducts, which are good sources of phosphorusand calcium, in their diets than do Asians and Pa-cific Islanders.
Similar to the result of this study, Adrian andDaniel, using the 1965–66 NFCS, revealed thatblack households consume less calcium than dowhites. Moreover, Windham et al., using the1977–78 NFCS, found lower calcium density indiets of non-Caucasians. There has been some ev-idence accumulating which indicates that a largepercentage of non-Caucasian adults have high lev-els of lactose intolerance (Woodruff). Since milk isa major source of lactose and also of calcium, lac-tose intolerance may be a contributing factor tolower calcium intake among non-Caucasians. Us-ing the 1987–88 NFCS, Lutz et al. computed theaverage annual household consumption of dairyproducts per 21-meal equivalent person by race,They reported that black households consumedaround 272 pounds of dairy products compared towhites’ consumption of roughly 470 pounds. Com-paring these findings with previous studies using

Nayga
Table 6. Simulated Impact of Weight on theConsumption of Selected Nutrients,U.S.. 1987-88
Consumption of Selected Food Nutrients 179
Table 8. Simulated Impact of Age on theConsumption of Selected Nutrients,U.S., 1987-88
Selected Weight Levels(pounds)
Nutrienta 100 150 200
Protein 67.637 71.380 73.637Phosphorus 1027.56 1071.00 1095.56
‘Simulated impact of weight on the consumption of the othereight nutrients are excluded because the relationship betweenweight and quantity consumed was not significant at the 0.05level.Note: These estimates were derived from the respective nutrientconsumption estimates by shifting weight from each level andholding other variables other than weight at their means.
the 1965-66 and the 1977–78 NFCS data, it ap-pears that not much progress has been made inimproving the calcium intake among blacks overthe period covering 1965–66 and 1987–88.
Weight, Height, and Age
Weight is significant in protein and phosphorusequations (Table 6). Consumption of protein andphosphorus increases initially and peaks, beforedeclining with successive increments of weight,other factors held constant. These estimates arederived from the nutrient demand estimates byshifting weight from one level to another and hold-ing other variables other than weight at theirmeans.
Height is statistically significant in the food en-ergy, protein, thiamin, riboflavin, niacin, calcium,
Table 7. Simulated Impact of Height on theConsumption of Selected Nutrients,U. S., 1987-88
Selected Height Levels(inches)
Nutnenta 50 60 70
Food Energy 1648.75Protein 69.981Thiamin 1.356Riboflavin 1.974Niacin 17.469Calcium 803.47Phosphorus 1047.27
1639.7569.081
1.3062.011
16.969800.47
1020.27
1778.7572.981
1.3562.182
17.469879.47
1103.27
‘Simulated impact of height on the consumption of vitamin A,vitamin C, and iron are excluded because the relationship be-tween height and quantity consumed was not significant at the0.05 level.Note: These estimates were derived from the respective nutrientconsumption estimates by shifting height from each level andholding other variables other than height at their means.
Selected Age Levels(years)
Nutrientn 20 40 60 80
Fond Energy 1881.04 1714.44 1627.84 1621.24Thiamirr 1.371 1.307 1.321 1.413Riboflavin 2.225 2.066 2.066 2.225Calcium 835.94 781.14 878.34 1127.54Phosphorus 1173.77 1060.17 1006.57 1012.97Iron 10.652 10.231 10.372 11.072
‘Simulated impact of age on the consumption of protein, vita-min A, vitamin C, and niacin are excluded because the rela-tionship between age and quantity consumed was not signifi-cant at the 0.05 level.Note: These estimates were derived from the respective nutrientconsumption estimates by shifting age from each level andholding other variables other than age at their means.
and phosphorus models (Table 7). Consumption ofthese nutrients decreases initially and then in-creases with successive increments of height, cet-eris paribus. The simulations reveal that consump-tion of food energy, protein, thiamin, and ribofla-vin decrease initially until height levels of 56, 57,60, and 52 inches (inflection points) are reached.Increases in the consumption of these nutrients arethen observed with successive increments of heightabove these levels. Similarly, the inflection pointsfor niacin, calcium, and phosphorus consumptionare 60, 55, and 57 inches, respectively.
Age is a significant factor affecting consumptionof food energy, thiamin, riboflavin, calcium,phosphorus, and iron (Table 8). Consumption ofthese nutrients decreases initially before increasingwith successive increments of age, as indicated bythe significant negative and positive signs of theage and age-squared coefficients. Although not ap-parent in Table 8, detailed simulation values showthat the inflection points where the change in di-rection in consumption occur is at age 72 for foodenergy, age 46 for thiamin, age 50 for riboflavin,age 37 for calcium, age 68 for phosphorus, and age45 for iron.2
Income
Annual household income is a significant factoraffecting the consumption of vitamin A, vitaminC, and calcium (Table 9). Consistent with the find-ings of Adrian and Daniel, consumption of these
2 Weight, height, and age of individuals were not analyzed in theWindham et al. and Adrian and Daniel studies.
180 October 1994 Agricultural and Resource Economics Review
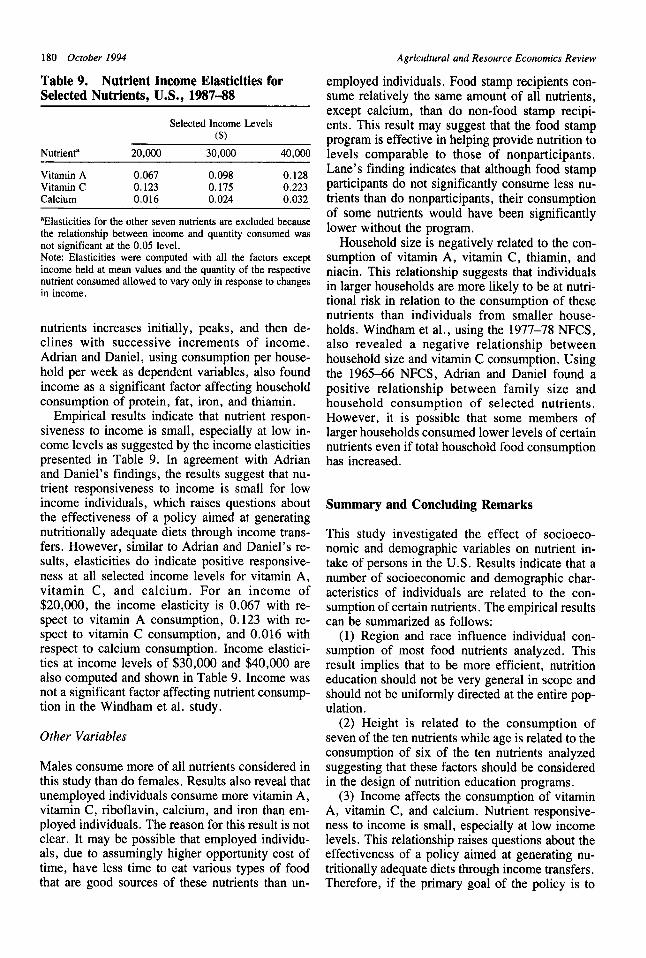
Table 9. Nutrient Income Elasticities forSelected Nutrients. U.S.. 1987-88
Selected Income Levels($)
Nutrient’ 20,000 30,000 40,000
Vitamin A 0.067 0.098 0.128Vitamin C 0.123 0.175 0.223Catcium 0.016 0.024 0.032
‘Elasticities for the other seven nutrients are excluded becausethe relationship between income and quantity consumed wasnot significant at the 0.05 level.Note: Elasticities were computed with all the factors exceptincome held at mean values and the quantity of the respectivenutrient consumed atlowed to vary only in response to changesin income.
nutrients increases initially, peaks, and then de-clines with successive increments of income.Adrian and Daniel, using consumption per house-hold per week as dependent variables, also foundincome as a significant factor affecting householdconsumption of protein, fat, iron, and thiamin.
Empirical results indicate that nutrient respon-siveness to income is small, especially at low in-come levels as suggested by the income elasticitiespresented in Table 9. In agreement with Adrianand Daniel’s findings, the results suggest that nu-trient responsiveness to income is small for lowincome individuals, which raises questions aboutthe effectiveness of a policy aimed at generatingnutritionally adequate diets through income trans-fers. However, similar to Adrian and Daniel’s re-sults, elasticities do indicate positive responsive-ness at all selected income levels for vitamin A,vitamin C, and calcium. For an income of$20,000, the income elasticity is 0.067 with re-spect to vitamin A consumption, 0.123 with re-spect to vitamin C consumption, and 0.016 withrespect to calcium consumption. Income elastici-ties at income levels of $30,000 and $40,000 arealso computed and shown in Table 9. Income wasnot a significant factor affecting nutrient consump-tion in the Windham et al. study.
Other Variables
Males consume more of all nutrients considered inthis study than do females, Results also reveal thatunemployed individuals consume more vitamin A,vitamin C, riboflavin, calcium, and iron than em-ployed individuals. The reason for this result is notclear. It may be possible that employed individu-als, due to assumingly higher opportunity cost oftime, have less time to eat various types of foodthat are good sources of these nutrients than un-
employed individuals. Food stamp recipients con-sume relatively the same amount of all nutrients,except calcium, than do non-food stamp recipi-ents. This result may suggest that the food stampprogram is effective in helping provide nutrition tolevels comparable to those of nonparticipants.Lane’s finding indicates that although food stampparticipants do not significantly consume less nu-trients than do nonparticipants, their consumptionof some nutrients would have been significantlylower without the program,
Household size is negatively related to the con-sumption of vitamin A, vitamin C, thiamin, andniacin. This relationship suggests that individualsin larger households are more likely to be at nutri-tional risk in relation to the consumption of thesenutrients than individuals from smaller house-holds. Windham et al., using the 1977–78 NFCS,also revealed a negative relationship betweenhousehold size and vitamin C consumption. Usingthe 1965-66 NFCS, Adrian and Daniel found apositive relationship between family size andhousehold consumption of selected nutrients.However, it is possible that some members oflarger households consumed lower levels of certainnutrients even if total household food consumptionhas increased,
Summary and Concluding Remarks
This study investigated the effect of socioeco-nomic and demographic variables on nutrient in-take of persons in the U.S. Results indicate that anumber of socioeconomic and demographic char-acteristics of individuals are related to the con-sumption of certain nutrients. The empirical resultscan be summarized as follows:
(1) Region and race influence individual con-sumption of most food nutrients analyzed. Thisresult implies that to be more efficient, nutritioneducation should not be very general in scope andshould not be uniformly directed at the entire pop-ulation.
(2) Height is related to the consumption ofseven of the ten nutrients while age is related to theconsumption of six of the ten nutrients analyzedsuggesting that these factors should be consideredin the design of nutrition education programs.
(3) Income affects the consumption of vitaminA, vitamin C, and calcium. Nutrient responsive-ness to income is small, especially at low incomelevels. This relationship raises questions about theeffectiveness of a policy aimed at generating nu-tritionally adequate diets through income transfers.Therefore, if the primary goal of the policy is to
Nayga Consumption of Selected Food Nutrients 181
improve the nutrition of low income persons, di-rect food transfers may be more effective than in-come transfers. Moreover, similar to the results ofWindham et al., income is not a significant factoraffecting the consumption of seven of the 10 nu-trients analyzed suggesting that individuals withlower incomes may select good dietary quality butless costly foods to meet their dietary needs. Theseresults also imply that future income increaseshave small impacts on nutrient consumption.
(4) Unemployed individuals consume more offive of the ten nutrients analyzed than do employedindividuals. This relationship is probably the resultof the decrease in consumption of certain foodsamong employed individuals due to more demand-ing time spent at work.
(5) Food stamp recipients do not significantlyconsume less of all nutrients except calcium thando non-recipients. This finding may imply that thefood stamp program is an effective instrument forincreasing nutrient intake of participants to levelscomparable to those of nonparticipants.
(6) Individual intake of vitamin A, vitamin C,thiamin, and niacin decreases with the size of thehousehold, implying that members of larger house-holds are more likely to be at nutritional risk inrelation to the consumption of these nutrients.
In general, some of the results in this study aresimilar to the results of Windham et al.’s andAdrian and Daniel’s studies using the 1977–78 andthe 1965-66 NFCS data sets. In particular, nutrientconsumption is generally unresponsive to changesin income. Calcium intake among blacks and in-dividuals from the South is still an area of concern.Moreover, individuals residing in nonmetro areasand the South generally consume less vitamin Cthan do their counterparts. Although Americansare generally more aware of the relationship be-tween diet and health (Frazao and Cleveland), it isstill not clear whether this awareness is enough tochange behavior effectively. Perhaps, furtherstudy is needed to address this issue.
The various impacts of the different socio-demographic and economic factors on nutrientconsumption have importance implications for nu-trition education and public nutrition programs. If,in fact, people have different consumption habits,then nutrition education should not be directed atthe entire population.
Although this analysis helps improve under-standing of consumption of food nutrients, the re-sults are subject to the limitations of the data used.For instance, the General Accounting Office(GAO) has expressed reservations about the repre-sentativeness of the data. Moreover, only 34 per-cent of the households surveyed provided individ-
ual intake data. However, the GAO concluded thatit is not possible to determine if nonrespondentsdiffered systematically from respondents. Lutz etal. (p. 13) also indicated that, in most instances,the data on food consumption were fairly consis-tent with the data from Continuing Consumer Ex-penditure Surveys.
References
Adrian, J., and R. Daniel. “Impact of Socioeconomic Factorson Consumption of Selected Food Nutrients in the UnitedStates. ” American Journal of Agricultural Economics.
58(1976):31-8.
Akin, J.D., D.K. Guilkey, and B.M. Popkln. “The SchoolLunch Program and Nutrient Intake: A Switching Regres-sion Analysis. ” American Journal of Agricultural Eco-
nomics 65(1983):477–85.Basiotis, P., M. Brown, S.R. Johnson, and K.J. Morgan. “Nu-
trient Availability, Food Costs, and Food Stamps. ” Amer-ican Journal of Agricultural Economics 65( 1983):685–93.
Belsley, D.A., E. Kuh, and R.E. Welsch. Regression Diag-nostics, Identifying Influential Data and Sources of Col-
linearity, Wiley, 1980.Breusch, T.S., and A.R. Pagan. “A Simple Test for Hetero-
scedasticity and Random Coefficient Variation. ” Econo-
metrics 47( 1979):1287–94.
Buse, R. C., and L.E. Salathe. “Adult Equivalent Scales: AnAlternative Approach.” American Jaurnal of AgriculturalEconomics 60(1978):460-8.
Capps Jr., O., and J. Schmitz. “A Recognition of Health andNutrition Factors in Demand Analysis. ” Western Journalof Agricultural Economics 16(1991):21–35.
Chavas, J.P., and K.O. Keplinger. “Impact of Domestic FoodPrograms on Nutrient Intake of Low Income Persons in theUnited States. ” Southern Journal of Agricultural Econom-
ics 15(1983): 155–63.
Davis, C.G., and P.H. Neetran. “The Impact of Food Stampsand Nutrition Education programs on Food Groups Expen-diture and Nutrient Intake of Low Income Households.”Southern Journal of Agricultural Economics 11(1979):121-9.
Devaney, B., and T. Fraker. “The Dietary Impacts of theSchool Breakfast Program.” American Journal of Agri-
cultural Economics 71(1989):932-48.
Devaney, B., and R. Moffitt. “Dietary Effects of the FoodStamp Program. ” American Journal of Agricultural Eco-nomics 73(1991):202–1 1.
Frazao, B., and L. Cleveland. ‘‘D]et-Health Awareness aboutFat and Cholesterol—Orrly a Start. ” Food Review17,1(1994):15-22.
Godfrey, L.G. “Testing for Multiplicative Heteroscedastic-ity. ” Journal of Econometrics 8(1978):227-36.
Interagency Board for Nutrition Monitoring and Related Re-search, Nutrition Monitoring in the United States, eds. B.Ervin and D. Reed, Hyattsville, Maryland, 1993.
Lane, S. “Food Distribution and Food Stamp Program Effectson Nutritional Achievement of Low Income Persons in
182 October 1994
Kern County, California. ”American Journal of Agricul-tural Economics 60(1978): 108-16.
Lutz, S.M., D.M. Smallwood, J.R. Blaylock, and M.Y.Hama. “Changes in Food Consumption and Expendituresin American Households during the 1980s.” U.S. Depart-ment of Agriculture Statistical Bulletin No. 849, HumanNutrition Information Service and Economic ResearchService, Washington, DC, December 1992.
McCracken, V., and J. Brandt. “Time Value and its Impact onHousehold Food Expenditures Away from Home, ” Home
Economics Research Journal 18(1990):267-85.Nayga Jr., R.M. and O. Capps. “Analysis of Away-from-
Home and At-Home Intake of Saturated Fat and Choles-terol. ” Review of Agricultural Economics 16(1994):429-40.
P1ndyck, R.S., and D.L. Rubinfeld. Econometric Models and
Economic Forecasts, Third 13cfhion,McGraw-Hill, 1991.Price, D.W., D.A. West, G.E. Schier, and D.Z. Price. “Food
Delivery Programs and Other Factors Affecting Nutrient
Agricultural and Resource Economics Review
Intake of Children. ” American Journal of AgriculturalEconomics 60(1978):60%18.
Scearce, WK., and R.B. Jensen. “Food Stamp Program Ef-fects on Availability of Food Nutrients for Low IncomeFamilies in the Southern Region of the United States. ”Southern Journal of Agricultural Economics 11(1979):113-20.
Spencer, G. “Population Estimates and Projections: 1988-2080,” Series P-25, No. 1018, U.S. Department of Com-merce, Washington, D.C., 1989.
Windham, C., B. Wyse, R. Hansen, and R. Hurst. “NutrientDensity of Diets in the USDA Nationwide Food Consump-tion Survey, 1977–78:Impact of Socioeconomic Status onDietary Density. ” Journal of the American Dietetic Asso-
ciation 82(1983):28–34.
Woodruff, C.W. “Milk Intolerances, ” in Present Knowledge
of Nurrition, D.M. Hegsted, ed., 4th edition, New York,1976.