Embed Size (px)
Citation preview
EFFECTS OF SUGAR BEET PULP ON CHEATGRASS AND BLUEBUNCH
WHEATGRASS GROWTH UNDER CONTROLLED CONDITIONS
by
Charles Emanuel Sloane
A thesis submitted in partial fulfillment of the requirements for the degree
of
Master of Science
in
Animal and Range Sciences
MONTANA STATE UNIVERSITY Bozeman, Montana
May 2011
©COPYRIGHT
by
Charles Emanuel Sloane
2011
All Rights Reserved
ii
APPROVAL
of a thesis submitted by
Charles Emanuel Sloane
This thesis has been read by each member of the thesis committee and has been found to be satisfactory regarding content, English usage, format, citation, bibliographic style, and consistency and is ready for submission to The Graduate School.
Dr. Clayton B. Marlow
Approved for the Department of Animal and Range Sciences
Dr. Glenn C. Duff
Approved for The Graduate School
Dr. Carl A. Fox

iii
STATEMENT OF PERMISSION TO USE
In presenting this thesis in partial fulfillment of the requirements for a master’s
degree at Montana State University, I agree that the Library shall make it available to
borrowers under rules of the Library.
If I have indicated my intention to copyright this thesis by including a copyright
notice page, copying is allowable only for scholarly purposes, consistent with “fair use”
as prescribed in the U.S. Copyright Law. Requests for permission for extended quotation
from or reproduction of this thesis in whole or in parts may be granted only by the
copyright holder.
Charles Emanuel Sloane
May, 2011

iv
ACKNOWLEDGEMENTS I wish to take this opportunity to express my sincerest appreciation to Dr. Bret E.
Olson and Dr. Bok Sowell and other faculty of the Department of Animal and Range
Sciences, Montana State University, for allowing me to initiate and complete my studies.
I especially wish to thank Dr. Clayton B. Marlow for his time, continuous effort, patience
and friendship enabling me to pursue a second career in rangeland ecology. Lastly, I
wish to acknowledge the thoughtfulness and support of Susan Sloane, my wife, without
whom this work would not have been possible.
v
TABLE OF CONTENTS 1. INTRODUCTION ..........................................................................................................1 2. LITERATURE REVIEW ...............................................................................................2
Cheatgrass ......................................................................................................................2 Concept of nitrogen Depletion .......................................................................................7 Current Study ...............................................................................................................10 Objectives ....................................................................................................................11 Hypotheses ...................................................................................................................11
3. MATERIALS AND METHODS ..................................................................................11 4. RESULTS .....................................................................................................................14 Trial Experiment ..........................................................................................................14
Main Experiment .........................................................................................................17 Cheatgrass ..................................................................................................18 Bluebunch Wheatgrass ...............................................................................19
5. DISCUSION .................................................................................................................20 6. IMPLICATIONS FOR MANAGEMENT ....................................................................23
LITERATURE CITED ..................................................................................................29
APPENDICES ...............................................................................................................33
APPENDIX A: Analysis of Variance Table ..........................................................34 APPENDIX B: Multiple Linear Regression Table ................................................37

vi
LIST OF TABLES
Table Page
1. Viable plants on Day 35. ....................................................................................21
vii
LIST OF FIGURES
Figure Page
1. Weekly height of crested wheat grass as a function of cheatgrass
density of 0, 4, 16, 64, and 256 plants per sq. ft. (Evans 1961). ........................4
2. Cheatgrass shoot height as a function of week at 4,16, 64, and
256 plants per sq. ft. (Evans 1961). ...............................................................5
3. Figure 3. Seeded pots main experiment prior to watering. Trial
plants are in foreground ...................................................................................13
4. Plots of trial experiment regression models: SBP = sugar
beet pulp, 0 = control. ......................................................................................16
5. Trial Experiment: Total leaf number per plant ~Application
level of sugar beet pulp. ...................................................................................17
6. Plant growth of both species on Day 51. .........................................................18 7. Regression plots of total leaf number ~ treatment application level. ..............20 8. Stable but grazed bluebunch wheatgrass (background right) growing along cheatgrass dominated roadside on left side of fence and foreground ........................................................................................25
viii
ABSTRACT
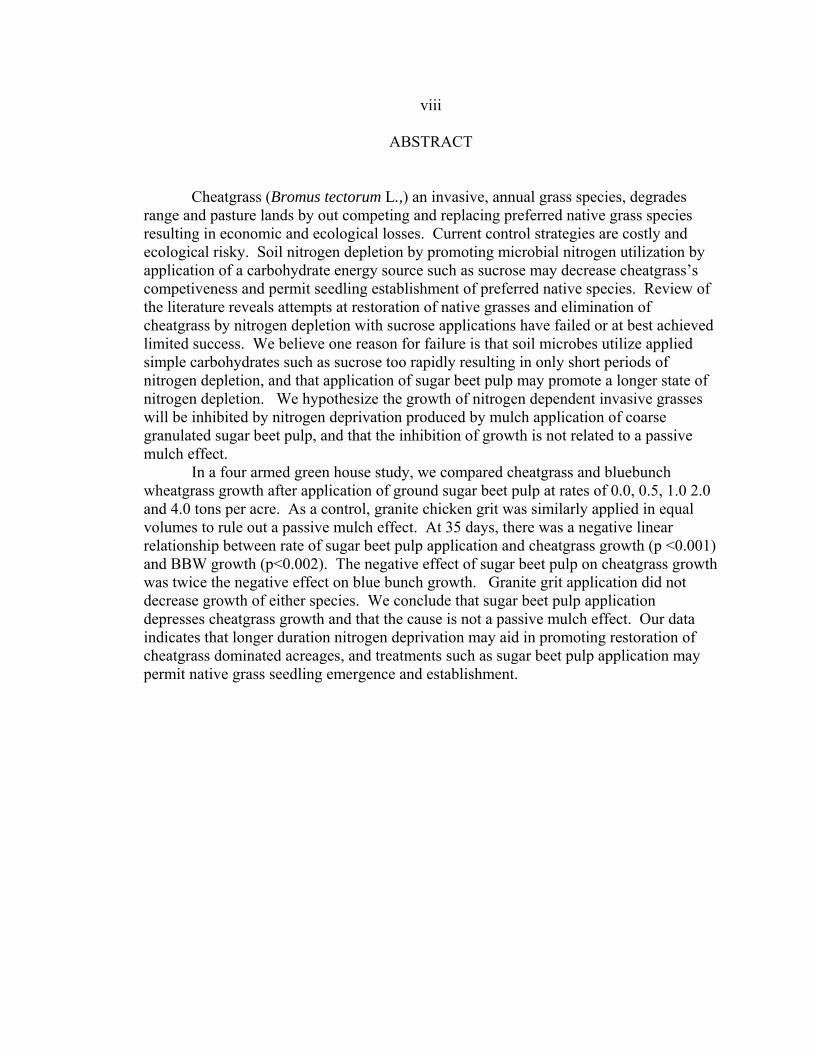
Cheatgrass (Bromus tectorum L.,) an invasive, annual grass species, degrades range and pasture lands by out competing and replacing preferred native grass species resulting in economic and ecological losses. Current control strategies are costly and ecological risky. Soil nitrogen depletion by promoting microbial nitrogen utilization by application of a carbohydrate energy source such as sucrose may decrease cheatgrass’s competiveness and permit seedling establishment of preferred native species. Review of the literature reveals attempts at restoration of native grasses and elimination of cheatgrass by nitrogen depletion with sucrose applications have failed or at best achieved limited success. We believe one reason for failure is that soil microbes utilize applied simple carbohydrates such as sucrose too rapidly resulting in only short periods of nitrogen depletion, and that application of sugar beet pulp may promote a longer state of nitrogen depletion. We hypothesize the growth of nitrogen dependent invasive grasses will be inhibited by nitrogen deprivation produced by mulch application of coarse granulated sugar beet pulp, and that the inhibition of growth is not related to a passive mulch effect.
In a four armed green house study, we compared cheatgrass and bluebunch wheatgrass growth after application of ground sugar beet pulp at rates of 0.0, 0.5, 1.0 2.0 and 4.0 tons per acre. As a control, granite chicken grit was similarly applied in equal volumes to rule out a passive mulch effect. At 35 days, there was a negative linear relationship between rate of sugar beet pulp application and cheatgrass growth (p <0.001) and BBW growth (p<0.002). The negative effect of sugar beet pulp on cheatgrass growth was twice the negative effect on blue bunch growth. Granite grit application did not decrease growth of either species. We conclude that sugar beet pulp application depresses cheatgrass growth and that the cause is not a passive mulch effect. Our data indicates that longer duration nitrogen deprivation may aid in promoting restoration of cheatgrass dominated acreages, and treatments such as sugar beet pulp application may permit native grass seedling emergence and establishment.
1
EFFECTS OF SUGAR BEET PULP ON CHEATGRASS AND BLUEBUNCH
WHEATGRASS GROWTH UNDER CONTROLLED CONDITIONS
Introduction
Cheatgrass (Bromus tectorum L.) is an invasive, annual grass species that
currently dominates more than 22 million ha (Vasquez et al. 2008) and may be the most
common plant in the western United States (Meyer and Leger 2010). Cheatgrass
invasion decreases rangeland productivity, produces major changes in species richness
and composition, increases fire frequency, degrades ecosystems and alters wildlife
habitats (Vasquez et al. 2008). In agricultural systems such as winter wheat production,
cheatgrass invasion significantly reduces crop quality and yields (Menalled et al. 2008).
Cheatgrass control attempts have achieved only limited success and have high capital and
labor costs (Young and Clements 2009). We believe that if control methods are not
based upon scientifically obtained, ecological data documenting individual plant
responses to treatment modalities, they will fail. We have designed our current
investigation in an effort to increase cheatgrass control effectiveness utilizing the concept
of soil nitrogen reduction by carbohydrate stimulation of soil microbial denitrification.
Our investigation documents altered cheatgrass growth response resulting from
application of an agricultural waste by product, sugar beet pulp.
2
Literature Review
Cheatgrass
By 1938, cheatgrass a non-native winter annual grass had dominated range and
pasturelands in the plains, foot hills and intermountain valleys of eleven western United
States (U. S. Forest Service 2005, Meyer, S. E and E. A. Leger 2010). One of the most
successful and wide spread invasive species in North American landscapes, cheatgrass
was introduced as a seed contaminant from Eurasia and the Mediterranean less than one
hundred seventy five years ago. (Harris 1967, Upadhyaya et al. 1986, Meyer and Leger
2010). As an annual plant, cheatgrass expansion violates two major concepts of seral
succession proposed by Clements: 1.) As an annual grass species, Clements classified
cheatgrass as either a colonizer or early seral state species (Clements 1936, Weaver and
Clements 1938); 2.) Although cheatgrass invades and dominates only as a consequence
of disturbance such as heavy grazing, cheatgrass remains a dominant species long after
the disturbance is removed (Harris 1967). However, more recent ecologists would
classify cheatgrass as a climax species (Young and Clements 2009,) in that cheatgrass
invasion supports the more recent concept of State and Transition Theory. Once
establishment occurs, the ecological threshold is extremely difficult to reverse (Stringham
et al. 2003). Cheatgrass dominance is related to its ability to:
1. “…exploit disturbance at multiple spatial scales to become established …”.
2. Produce large amounts of seed.
3. “… be highly competitive for below ground resources with an extensive fine
root system that usurps available water and nutrients from the soil…”
3
4. Self pollinate; one seed can produce a stable, dominant population (Meyer
and Leger 2010).
Once domination occurs, cheatgrass eliminates other botanical species either by its innate
ability to compete or by its positive co-existence with fire.
Competition amongst species occurs when two organisms in close proximity
utilize a factor present in quantities less than the combined needs of both organisms
(Weaver and Clements 1938). As a winter annual, cheatgrass establishes in autumn,
survives over winter and resumes growth early in the spring at lower soil temperatures
than its neighbors (Harris 1967, Young and Clements 2009). Cheatgrass utilizes water
and thereby water soluble nutrients before slower growing native grass species initiate
spring growth (Harris 1967). Cheatgrass seedling survival is greater than native seedling
survival because of better ability to extract water from soil (Warg 1938). In greenhouse
studies, crested wheat grass (Agropyron cristatum (L.) Gaertn.) seedling tiller growth was
shown to be inversely proportional to density of cheatgrass seedlings due to increased
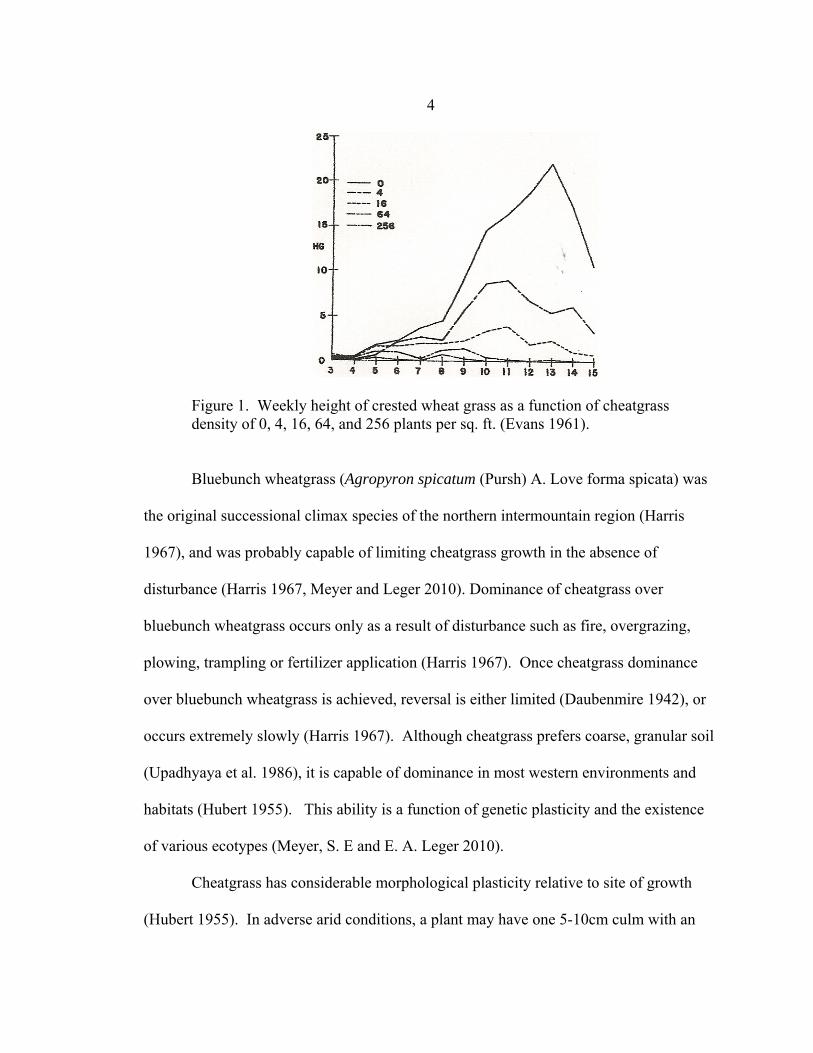
soil water depletion associated with increasing cheatgrass density (Figure 1), (Evans
1961). Additionally once established, the increased shoot height of cheatgrass seedlings
compared to crested wheatgrass seedlings may enable cheatgrass to successfully compete
for light (Evans 1961).
4
Figure 1. Weekly height of crested wheat grass as a function of cheatgrass density of 0, 4, 16, 64, and 256 plants per sq. ft. (Evans 1961). Bluebunch wheatgrass (Agropyron spicatum (Pursh) A. Love forma spicata) was
the original successional climax species of the northern intermountain region (Harris
1967), and was probably capable of limiting cheatgrass growth in the absence of
disturbance (Harris 1967, Meyer and Leger 2010). Dominance of cheatgrass over
bluebunch wheatgrass occurs only as a result of disturbance such as fire, overgrazing,
plowing, trampling or fertilizer application (Harris 1967). Once cheatgrass dominance
over bluebunch wheatgrass is achieved, reversal is either limited (Daubenmire 1942), or
occurs extremely slowly (Harris 1967). Although cheatgrass prefers coarse, granular soil
(Upadhyaya et al. 1986), it is capable of dominance in most western environments and
habitats (Hubert 1955). This ability is a function of genetic plasticity and the existence
of various ecotypes (Meyer, S. E and E. A. Leger 2010).
Cheatgrass has considerable morphological plasticity relative to site of growth
(Hubert 1955). In adverse arid conditions, a plant may have one 5-10cm culm with an
5
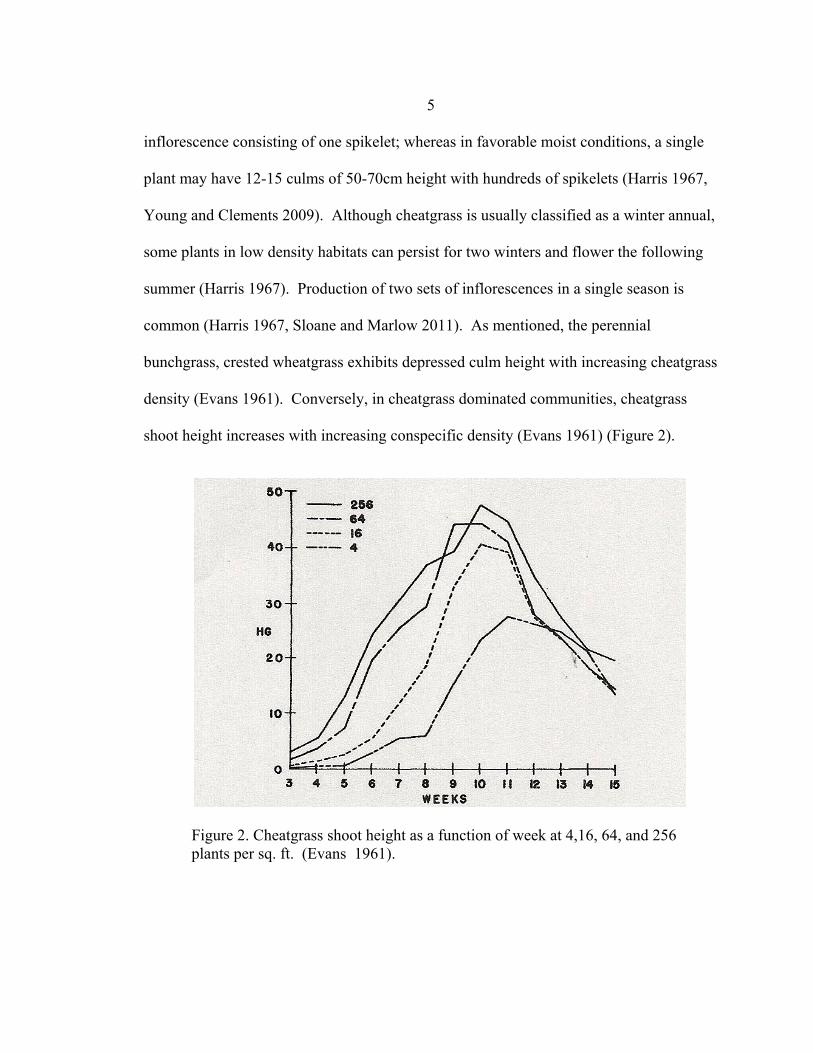
inflorescence consisting of one spikelet; whereas in favorable moist conditions, a single
plant may have 12-15 culms of 50-70cm height with hundreds of spikelets (Harris 1967,
Young and Clements 2009). Although cheatgrass is usually classified as a winter annual,
some plants in low density habitats can persist for two winters and flower the following
summer (Harris 1967). Production of two sets of inflorescences in a single season is
common (Harris 1967, Sloane and Marlow 2011). As mentioned, the perennial
bunchgrass, crested wheatgrass exhibits depressed culm height with increasing cheatgrass
density (Evans 1961). Conversely, in cheatgrass dominated communities, cheatgrass
shoot height increases with increasing conspecific density (Evans 1961) (Figure 2).
Figure 2. Cheatgrass shoot height as a function of week at 4,16, 64, and 256 plants per sq. ft. (Evans 1961).
6
These results conflict with the accepted concepts that individual plant growth
should decrease as competition increases. This response could possibly be caused by the
individual plant competing for light. If biomass increases, one would expect root mass to
also increase resulting in increasing cheatgrass domination of the above and below
ground growth site.
After seed drop, cheatgrass seeds are consider to remain dormant as long as hot,
dry weather persists, usually a period of six to eight weeks (Harris 1967). Since
cheatgrass is a winter annual, germination and emergence occur with onset of cooler
weather and autumn precipitation. Seedlings grow in a basilar fashion on the soil surface
through the winter. In the absence of snow cover, I have observed winter growth in a
basal fashion manifested as surface greening whenever several warm sunny winter days
occur. Cheatgrass root growth continues throughout the winter (Harris 1977). Seedlings
are primed and ready for the onset of warmer days in early spring when growth rate
accelerates at soil temperatures that are too low for native grass growth (Harris 1967,
Young and Clements 2009). Cheatgrass seedlings prevent establishment of other grasses
by monopolizing soil moisture, nitrogen and space prior to physiologic “wake-up” of its
competitors (Evans 1961). Competition for and utilization of nitrogen may be as
relevant to cheatgrass competiveness as water use and low temperature germinability.
Cheatgrass seedling growth rate has been shown to correlate mostly with soil
temperatures early in springtime and subsequently tissue nitrogen levels later on in spring
when adequate soil moisture is present, and to a lesser extent with soil moisture alone
(Uresk et al. 1979).
7
Concept of Nitrogen Deprivation as a Treatment Modality
Workers at the Agricultural Research Station in Reno postulated that limiting
cheatgrass’s access to soil nitrogen including its own replacement nitrogen may limit
cheatgrass’s ability to compete with and maintain its dominance over native grasses
(Young et al. 1998). Specifically, application of carbohydrate in the form of sucrose as
an energy source for soil microbes may increase denitrification and lower soil nitrogen
content. These researchers employed this concept in an eight armed study of the effects
of nitrogen on invasive grass growth incorporating sucrose application and nitrapyrin, an
agent that blocks organic nitrogen breakdown. In three of the arms, sucrose and
nitrapyrin were applied individually and combined (Young, J. A. et al. 1998). However,
in this study medusahead, an invasive annual similar to cheatgrass, was the dominant
invasive grass. Both nitrapyrin and sucrose application decreased medusahead density
and there was an additive effect when both treatments were simultaneously applied
(Young et al. 1998).
Besides introducing the concept of nitrogen deprivation as a control modality, this
review uncovers another aspect of this topic. The target invasive species and the desired
restorative species frequently differ from study to study sometimes even at the same
location and with the same group of investigators, but conclusions are frequently
generalized from individual species responses.
There are reports of multiple studies employing the concept of nitrogen
deprivation of invasive grasses in attempts to restore native or desired species (Mangold
and Sheley 2008, Alpert, P. 2010). Review of the literature reveals studies differ in
8
location, methods and results, but in general these trials are either unsuccessful or
demonstrate limited effects (Alpert 2010). In my review of the literature, most do not
investigate the underlying science involved nor do they measure individual plant
parameters. Rather they are focused on producing a desired restoration result. The actual
carbohydrate applied, method of carbohydrate application and number of applications
vary significantly amongst studies suggesting that the nature and source of carbohydrate
may be an important factor.
In early studies, finely ground wheat straw and saw dust did not inhibit long term
cheatgrass growth. Although there was depression with sawdust noted in the first year,
there was increased cheatgrass growth in subsequent years compared to control areas
(Smoliak 1965). Subsequently, saw dust was thought to have some depressive effects
(Alpert 2000). In tall grass Canadian prairie, a mixture of sawdust and sucrose was
employed in 1992 (Morgan 1994). One of three sites showed a significant decrease in
weed growth (species not specified) lasting more than one year, but there was no increase
in seeded native grass or forb growth. The other two sites manifested no changes
(Morgan 1994). Nitrogen content of these two sites was thought to be higher than the
initial site. Carbohydrate was raked in to the soil by an unspecified method. Morgan
(1994) describes his technique as “Soil Impoverishment” and includes a list of suggested
implementation methods for range restoration utilizing nitrogen depletion which other
investigators then cite (McClendon and Redente 1991, Morghan et al. 1999, Seastadt et
al. 1996).
1. Choose site with non-native invasion. 2. Perform a soil sample analysis including nitrogen level.
9
3. Utilize equal size representative experimental and control plots. 4. Consult soil scientists to determine amount of carbohydrate required to lower
soil nitrogen for at least one growing season. 5. Apply recommended amounts of carbohydrate. 6. Identically seed experimental and control plots 7. Monitor plots for species density and cover for at least one growing season.
(Morgan 1994)
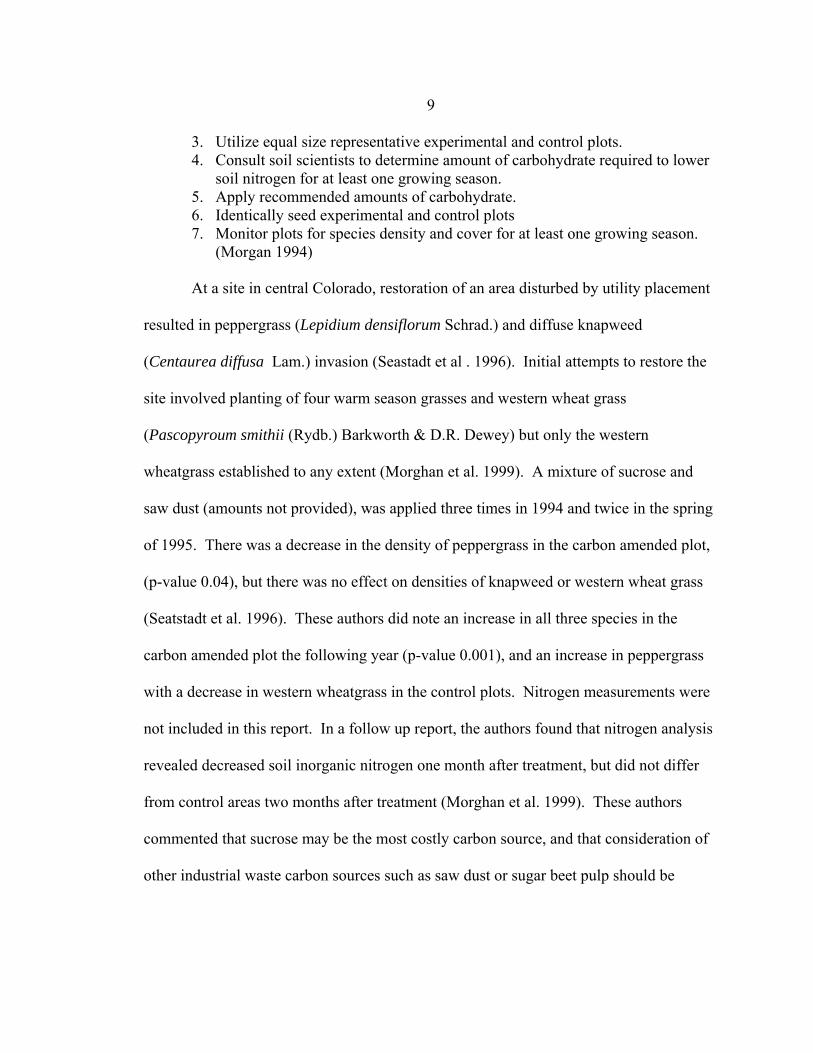
At a site in central Colorado, restoration of an area disturbed by utility placement
resulted in peppergrass (Lepidium densiflorum Schrad.) and diffuse knapweed
(Centaurea diffusa Lam.) invasion (Seastadt et al . 1996). Initial attempts to restore the
site involved planting of four warm season grasses and western wheat grass
(Pascopyroum smithii (Rydb.) Barkworth & D.R. Dewey) but only the western
wheatgrass established to any extent (Morghan et al. 1999). A mixture of sucrose and
saw dust (amounts not provided), was applied three times in 1994 and twice in the spring
of 1995. There was a decrease in the density of peppergrass in the carbon amended plot,
(p-value 0.04), but there was no effect on densities of knapweed or western wheat grass
(Seatstadt et al. 1996). These authors did note an increase in all three species in the
carbon amended plot the following year (p-value 0.001), and an increase in peppergrass
with a decrease in western wheatgrass in the control plots. Nitrogen measurements were
not included in this report. In a follow up report, the authors found that nitrogen analysis
revealed decreased soil inorganic nitrogen one month after treatment, but did not differ
from control areas two months after treatment (Morghan et al. 1999). These authors
commented that sucrose may be the most costly carbon source, and that consideration of
other industrial waste carbon sources such as saw dust or sugar beet pulp should be
10
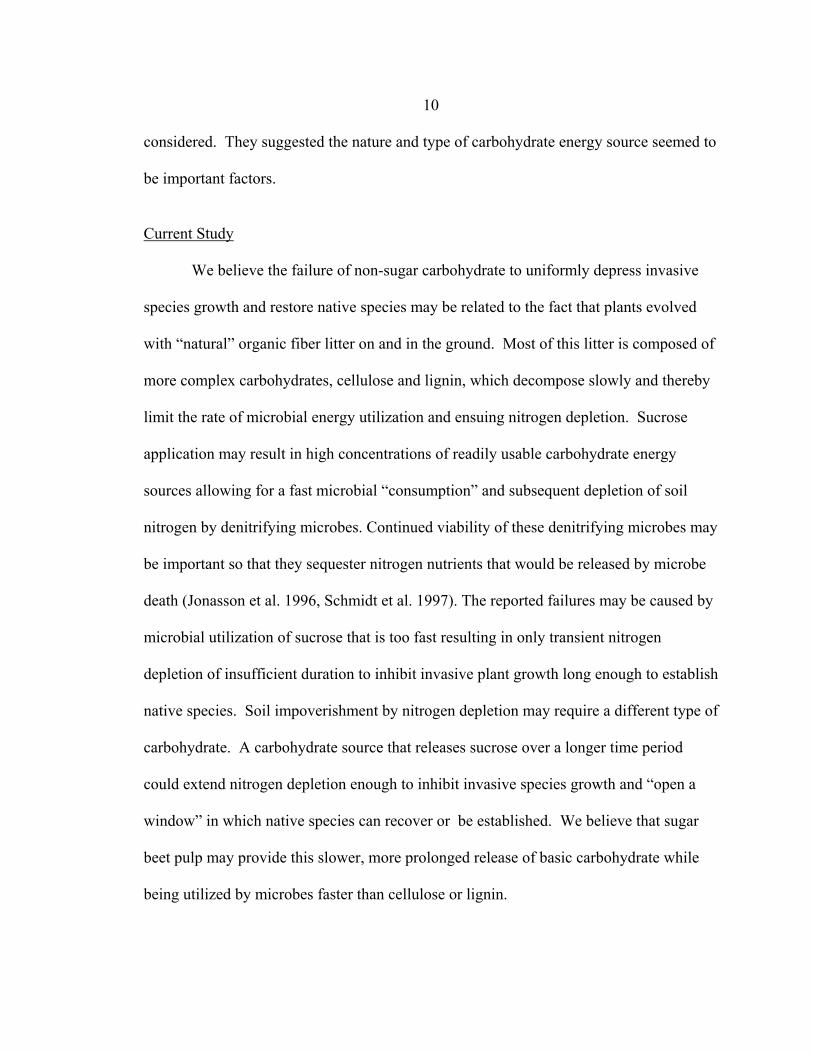
considered. They suggested the nature and type of carbohydrate energy source seemed to
be important factors.
Current Study
We believe the failure of non-sugar carbohydrate to uniformly depress invasive
species growth and restore native species may be related to the fact that plants evolved
with “natural” organic fiber litter on and in the ground. Most of this litter is composed of
more complex carbohydrates, cellulose and lignin, which decompose slowly and thereby
limit the rate of microbial energy utilization and ensuing nitrogen depletion. Sucrose
application may result in high concentrations of readily usable carbohydrate energy
sources allowing for a fast microbial “consumption” and subsequent depletion of soil
nitrogen by denitrifying microbes. Continued viability of these denitrifying microbes may
be important so that they sequester nitrogen nutrients that would be released by microbe
death (Jonasson et al. 1996, Schmidt et al. 1997). The reported failures may be caused by
microbial utilization of sucrose that is too fast resulting in only transient nitrogen
depletion of insufficient duration to inhibit invasive plant growth long enough to establish
native species. Soil impoverishment by nitrogen depletion may require a different type of
carbohydrate. A carbohydrate source that releases sucrose over a longer time period
could extend nitrogen depletion enough to inhibit invasive species growth and “open a
window” in which native species can recover or be established. We believe that sugar
beet pulp may provide this slower, more prolonged release of basic carbohydrate while
being utilized by microbes faster than cellulose or lignin.
11
Objectives
The goal of our experiment was to determine if we could inhibit cheatgrass
growth by the application of sugar beet pulp to the soil surface in a greenhouse
environment. Secondly, we wanted to determine, if cheatgrass growth was inhibited,
whether such inhibition relates to sugar beet pulp application or to a passive mulch
effect. Thirdly, we wanted to determine if sugar beet pulp application will also inhibit a
native grass such as bluebunch wheatgrass. Lastly, as an indirect measure of nitrogen
depletion, we wanted to determine if inert mulch with no carbohydrate content would
produce similar inhibition. If similar inhibition occurred with the inert mulch, this
would indicate a physical rather than a nutritive cause.
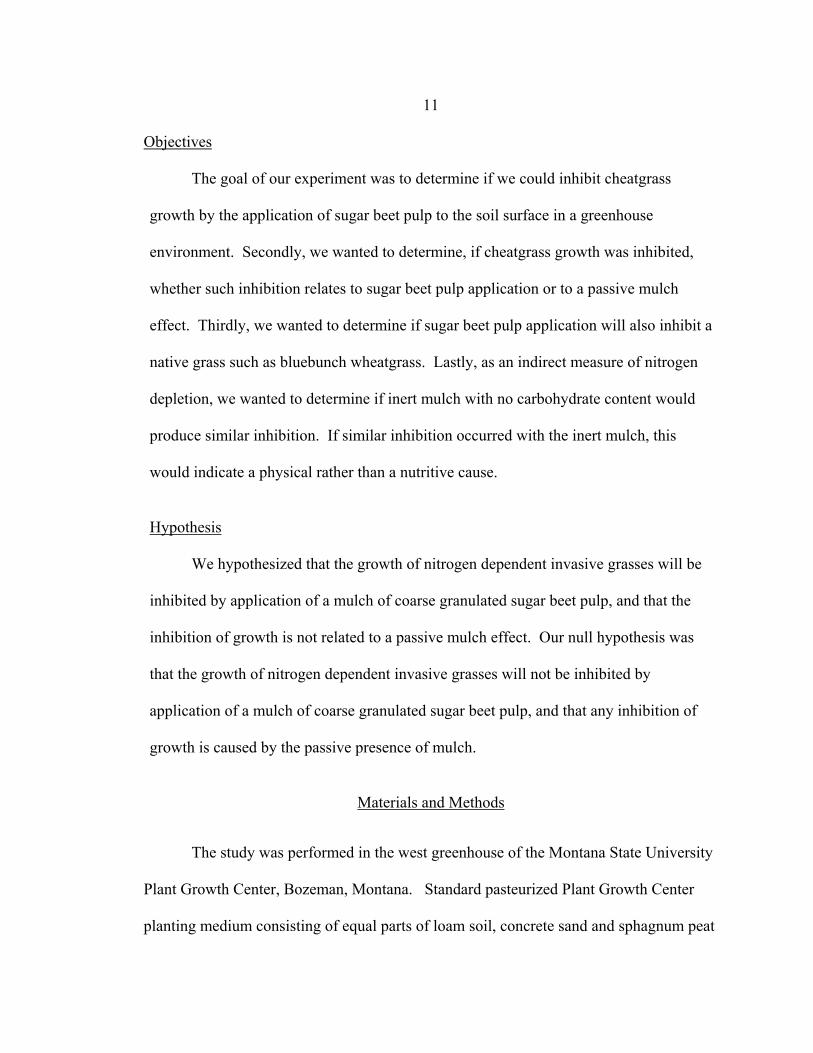
Hypothesis
We hypothesized that the growth of nitrogen dependent invasive grasses will be
inhibited by application of a mulch of coarse granulated sugar beet pulp, and that the
inhibition of growth is not related to a passive mulch effect. Our null hypothesis was
that the growth of nitrogen dependent invasive grasses will not be inhibited by
application of a mulch of coarse granulated sugar beet pulp, and that any inhibition of
growth is caused by the passive presence of mulch.
Materials and Methods
The study was performed in the west greenhouse of the Montana State University
Plant Growth Center, Bozeman, Montana. Standard pasteurized Plant Growth Center
planting medium consisting of equal parts of loam soil, concrete sand and sphagnum peat
12
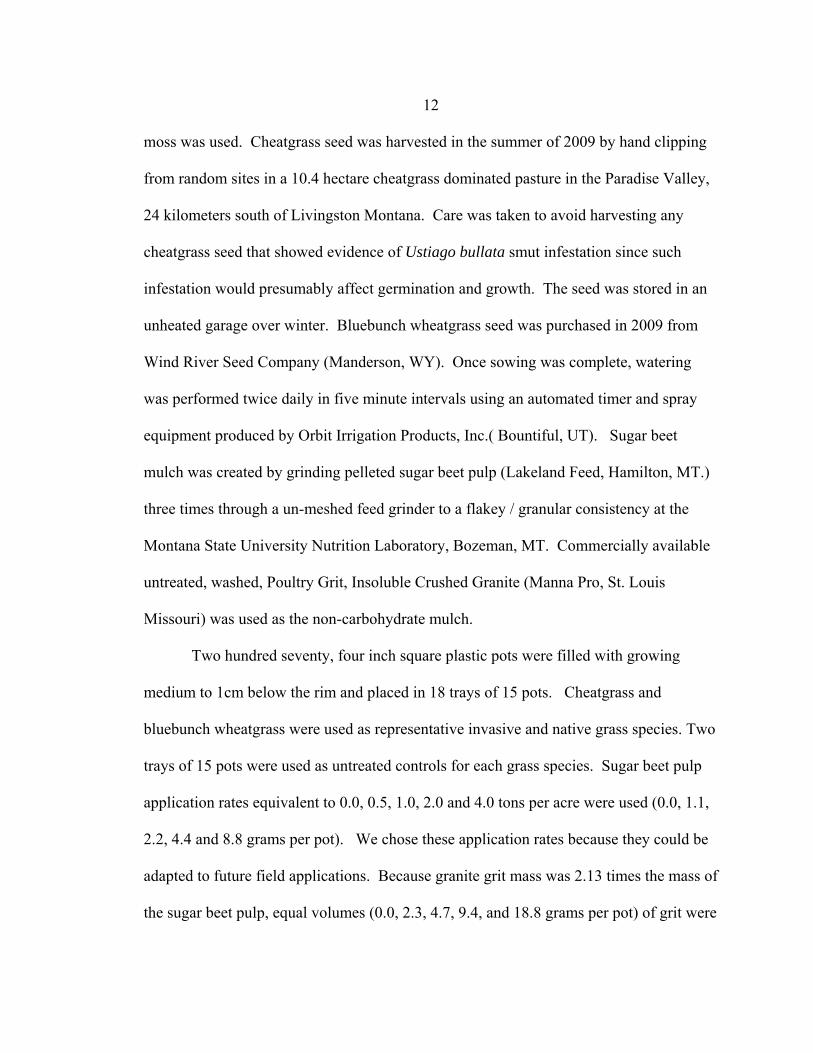
moss was used. Cheatgrass seed was harvested in the summer of 2009 by hand clipping
from random sites in a 10.4 hectare cheatgrass dominated pasture in the Paradise Valley,
24 kilometers south of Livingston Montana. Care was taken to avoid harvesting any
cheatgrass seed that showed evidence of Ustiago bullata smut infestation since such
infestation would presumably affect germination and growth. The seed was stored in an
unheated garage over winter. Bluebunch wheatgrass seed was purchased in 2009 from
Wind River Seed Company (Manderson, WY). Once sowing was complete, watering
was performed twice daily in five minute intervals using an automated timer and spray
equipment produced by Orbit Irrigation Products, Inc.( Bountiful, UT). Sugar beet
mulch was created by grinding pelleted sugar beet pulp (Lakeland Feed, Hamilton, MT.)
three times through a un-meshed feed grinder to a flakey / granular consistency at the
Montana State University Nutrition Laboratory, Bozeman, MT. Commercially available
untreated, washed, Poultry Grit, Insoluble Crushed Granite (Manna Pro, St. Louis
Missouri) was used as the non-carbohydrate mulch.
Two hundred seventy, four inch square plastic pots were filled with growing
medium to 1cm below the rim and placed in 18 trays of 15 pots. Cheatgrass and
bluebunch wheatgrass were used as representative invasive and native grass species. Two
trays of 15 pots were used as untreated controls for each grass species. Sugar beet pulp
application rates equivalent to 0.0, 0.5, 1.0, 2.0 and 4.0 tons per acre were used (0.0, 1.1,
2.2, 4.4 and 8.8 grams per pot). We chose these application rates because they could be
adapted to future field applications. Because granite grit mass was 2.13 times the mass of
the sugar beet pulp, equal volumes (0.0, 2.3, 4.7, 9.4, and 18.8 grams per pot) of grit were
13
calculated, measured and applied. There were four trays of 15 pots of each treatment for
each grass species. On 1/17/2011, seeds were individually planted on the same day in the
center of the pot just below the surface using a forceps. Sugar beet pulp and granite were
evenly dispersed on the soil in the center area of each pot after planting the seeds. Each
pot was labeled prior to planting with species, group number and application rate. A
random sample of 270 numbers was generated with a statistical program (R 2.11.1), and
prior to watering, each pot was assigned and labeled with a second identification number
(1:270). Pots were then rearranged in trays in the numerical order of the random
sequence. Trays were arranged on a standard greenhouse table in three rows of six and
were randomly rotated several times during the course of the experiment. Daily watering
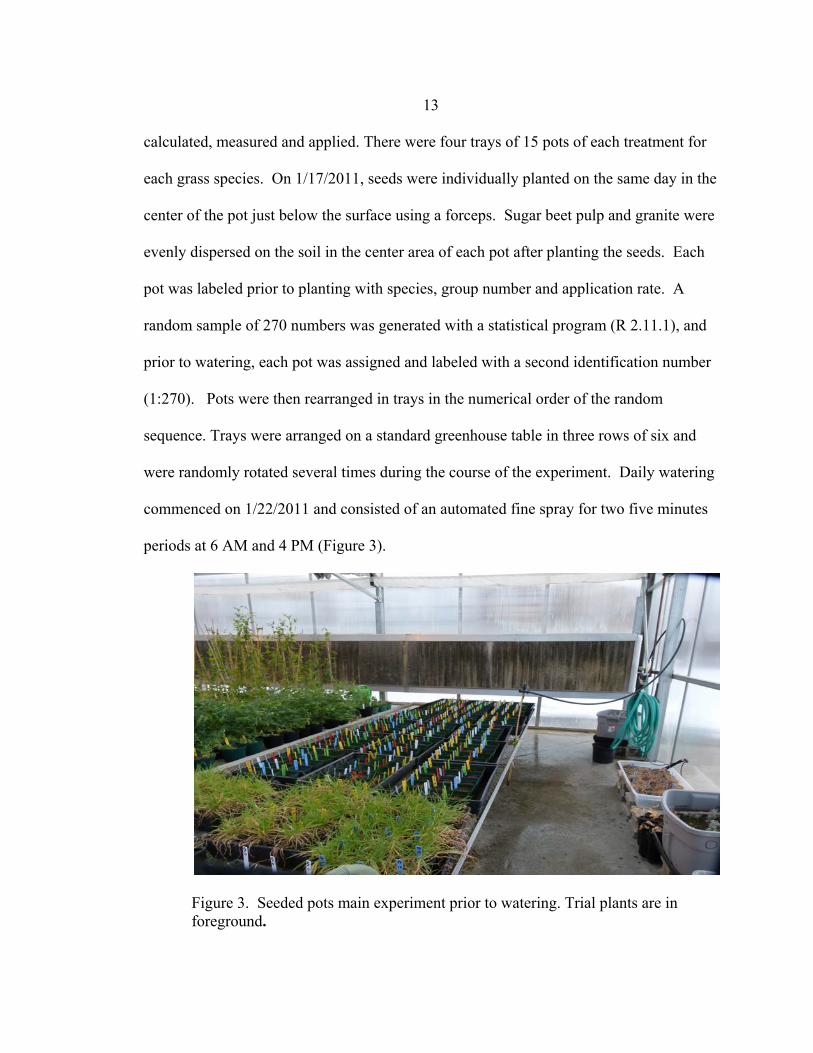
commenced on 1/22/2011 and consisted of an automated fine spray for two five minutes
periods at 6 AM and 4 PM (Figure 3).
Figure 3. Seeded pots main experiment prior to watering. Trial plants are in foreground.
14
Measurements of total number of tillers per plant, total number of leaves per
plant, total length of each leaf from tip to crown were performed on day 35. Measuring
was performed using a narrow metal ruler with minimal vegetative manipulation to limit
plant reaction previously documented in other cheatgrass studies in an effort to minimize
handling effects on future measurements. All measurements were performed by one
individual with data recording by a second individual to minimize error.
Analysis of variance and linear regression analysis using R 2.11.1 and R 2.12.2
was performed using treatment level as an explanatory variable and total leaf number as a
response variable to determine if a quantifiable relationship existed between sugar beet
pulp application levels and grass responses.
Prior to performing the main experiment, a preliminary experiment tested the
effects of the same sugar beet pulp application levels on cheatgrass growth. A similar
format was used consisting of a control group and 4 treatment levels of 15 pots each. All
other parameters were identical to the main trial except that measurements were made on
day 24. Linear regression analyses and model fitting were performed using treatment rate
as an explanatory variable and total leaf length or leaf number per plant as a response
variables.
Results
Trial Experiment
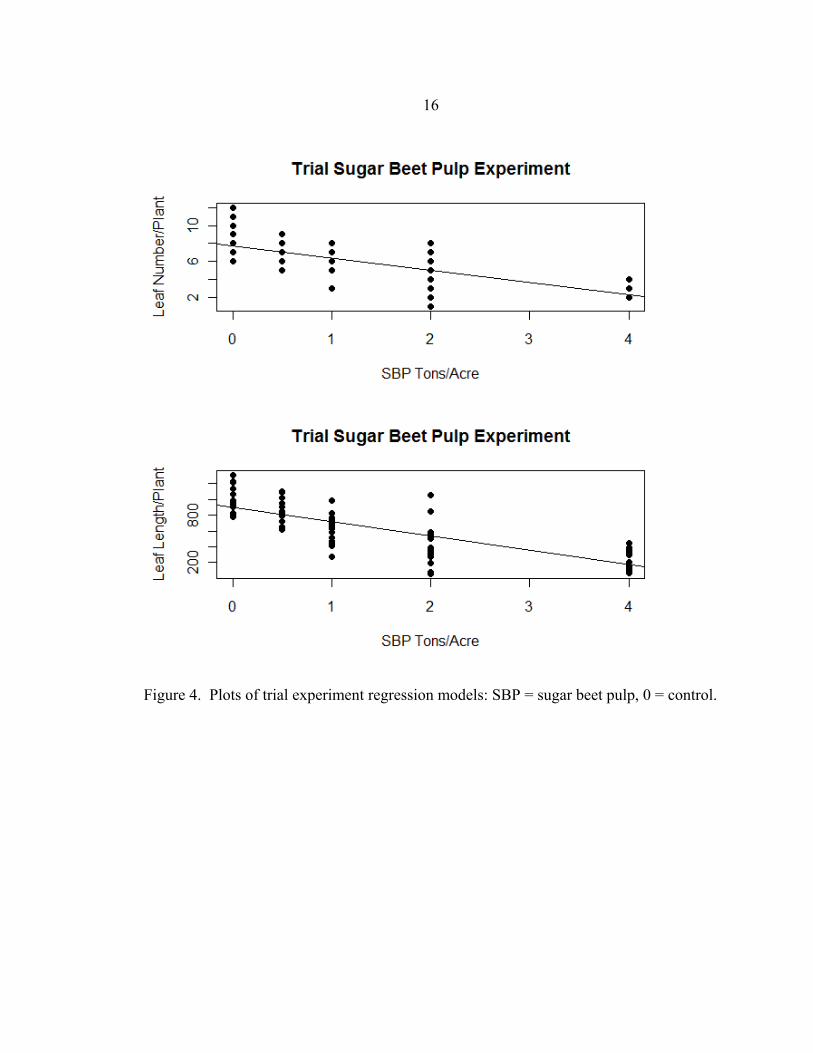
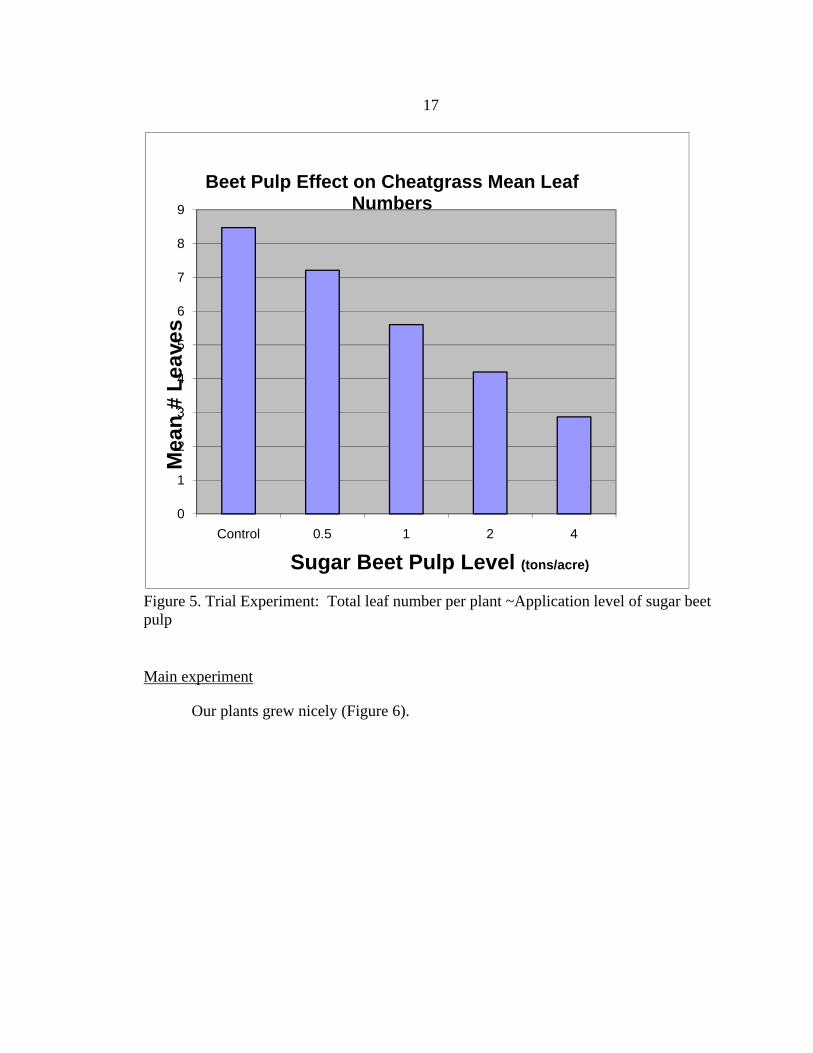
There was a negative linear relationship between growth rate as measured by total
leaf number and the rate of sugar beet pulp application (p value <.001 on seventy two
15
degrees of freedom). For each unit increase in tons per acre of sugar beet pulp
application, there was an associated decrease in total leaf number of each cheatgrass plant
on Day 24 of 1.34 (95% C.I. -1.6,-1.0). There was also a negative linear relationship of
growth as measured by total leaf length per cheatgrass plant and the rate of sugar beet
pulp application with a similar slope (p<.001). For each unit increase in tons per acre of
sugar beet pulp application, there was an associated decrease in total leaf length of each
cheatgrass plant of 180mm (95% C.I. -214mm,-146mm). A.I.C. analysis favored the fit
of the leaf number model (280, 1004). Therefore, we used an analysis model utilizing
only leaf number for the main experiment. Plots of the models are provided (Figure 4).
A bar graph of the leaf number data is provided (Figure 5).
16
Figure 4. Plots of trial experiment regression models: SBP = sugar beet pulp, 0 = control.
17
Figure 5. Trial Experiment: Total leaf number per plant ~Application level of sugar beet pulp
Main experiment
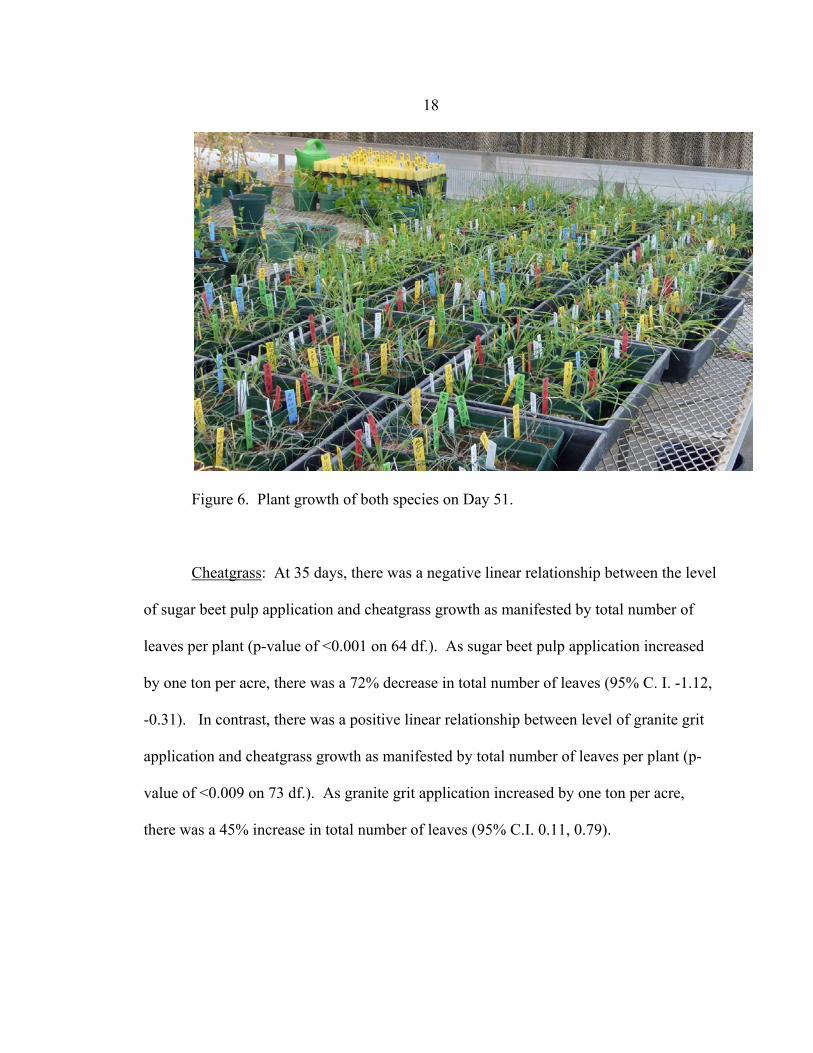
Our plants grew nicely (Figure 6).
0
1
2
3
4
5
6
7
8
9
Control 0.5 1 2 4
Mea
n #
Lea
ves
Sugar Beet Pulp Level (tons/acre)
Beet Pulp Effect on Cheatgrass Mean Leaf Numbers
18
Figure 6. Plant growth of both species on Day 51.
Cheatgrass: At 35 days, there was a negative linear relationship between the level
of sugar beet pulp application and cheatgrass growth as manifested by total number of
leaves per plant (p-value of <0.001 on 64 df.). As sugar beet pulp application increased
by one ton per acre, there was a 72% decrease in total number of leaves (95% C. I. -1.12,
-0.31). In contrast, there was a positive linear relationship between level of granite grit
application and cheatgrass growth as manifested by total number of leaves per plant (p-
value of <0.009 on 73 df.). As granite grit application increased by one ton per acre,
there was a 45% increase in total number of leaves (95% C.I. 0.11, 0.79).
19
Bluebunch Wheatgrass: At 35 days, there was a negative linear relationship
between the level of sugar beet pulp application and bluebunch wheatgrass growth as
manifested by total number of leaves per plant ( p-value of <0.002 on 73 df.). As sugar
beet pulp application increased by one ton per acre, there was 35% decrease in total
number of leaves (95% C. I. -0.56, -0.13). There was a no linear relationship between
rate of granite grit application and bluebunch wheatgrass growth as manifested by total
number of leaves per plant (p-value of 0.97 on 73 df.).
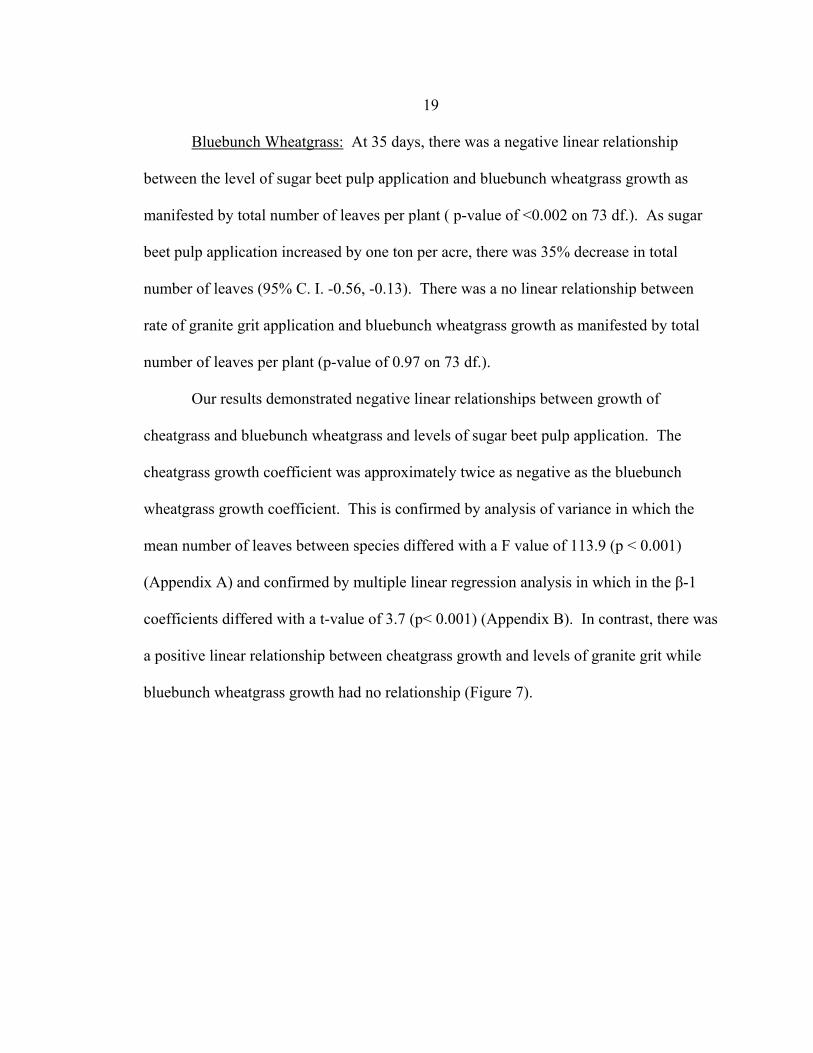
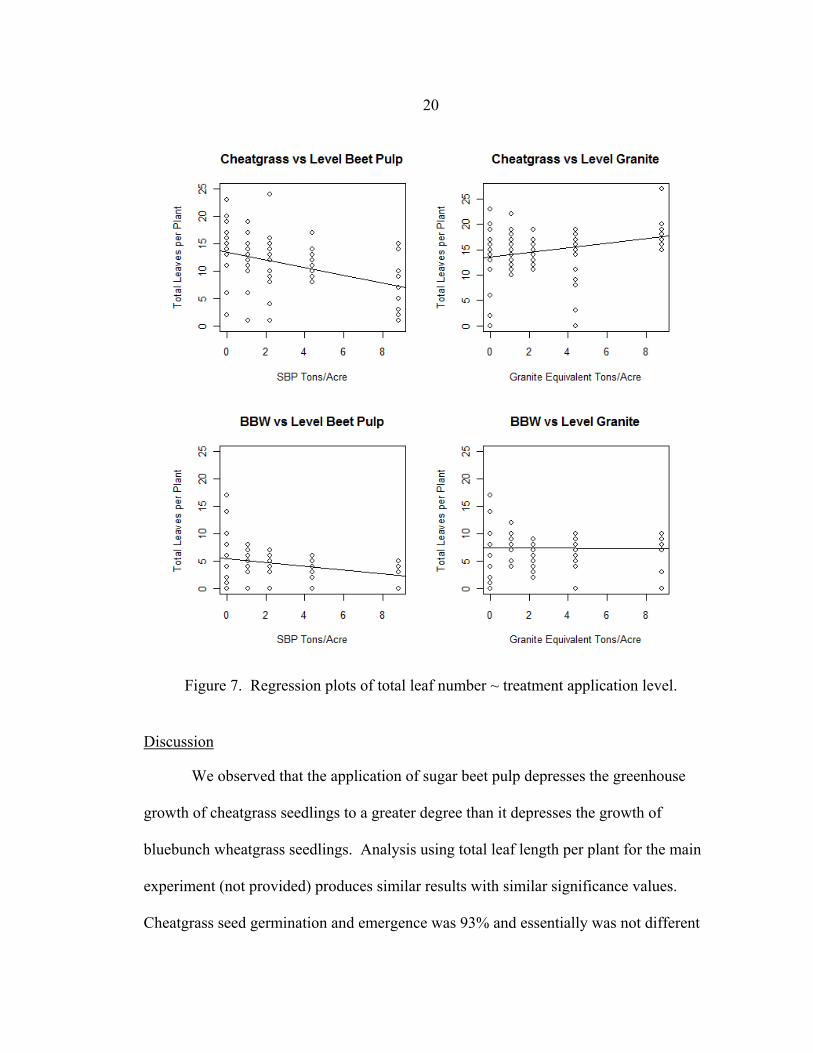
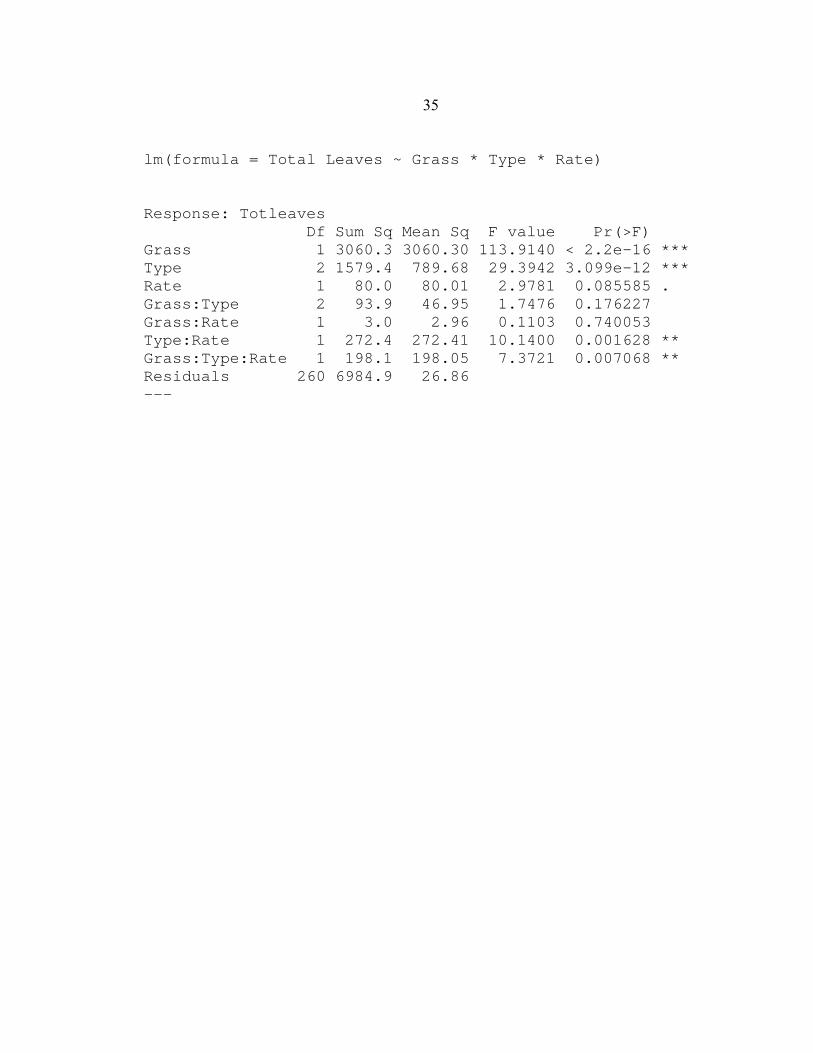
Our results demonstrated negative linear relationships between growth of
cheatgrass and bluebunch wheatgrass and levels of sugar beet pulp application. The
cheatgrass growth coefficient was approximately twice as negative as the bluebunch
wheatgrass growth coefficient. This is confirmed by analysis of variance in which the
mean number of leaves between species differed with a F value of 113.9 (p < 0.001)
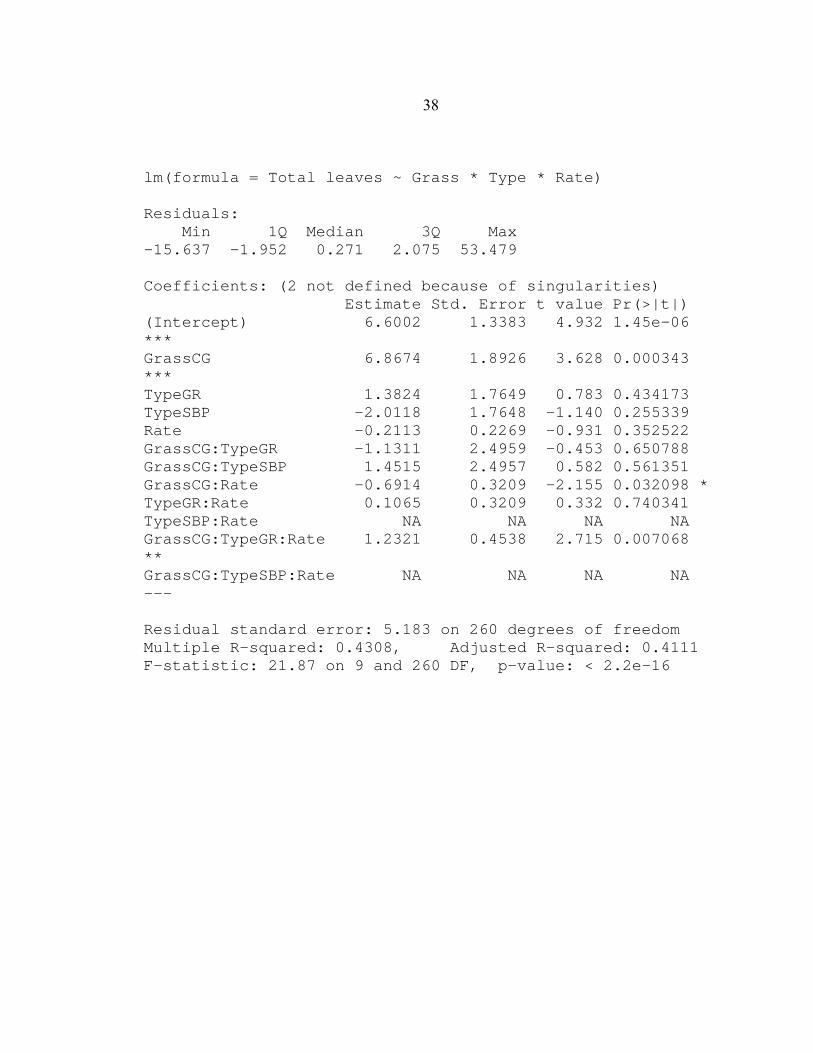
(Appendix A) and confirmed by multiple linear regression analysis in which in the β-1
coefficients differed with a t-value of 3.7 (p< 0.001) (Appendix B). In contrast, there was
a positive linear relationship between cheatgrass growth and levels of granite grit while
bluebunch wheatgrass growth had no relationship (Figure 7).
20
Figure 7. Regression plots of total leaf number ~ treatment application level.
Discussion
We observed that the application of sugar beet pulp depresses the greenhouse
growth of cheatgrass seedlings to a greater degree than it depresses the growth of
bluebunch wheatgrass seedlings. Analysis using total leaf length per plant for the main
experiment (not provided) produces similar results with similar significance values.
Cheatgrass seed germination and emergence was 93% and essentially was not different
21
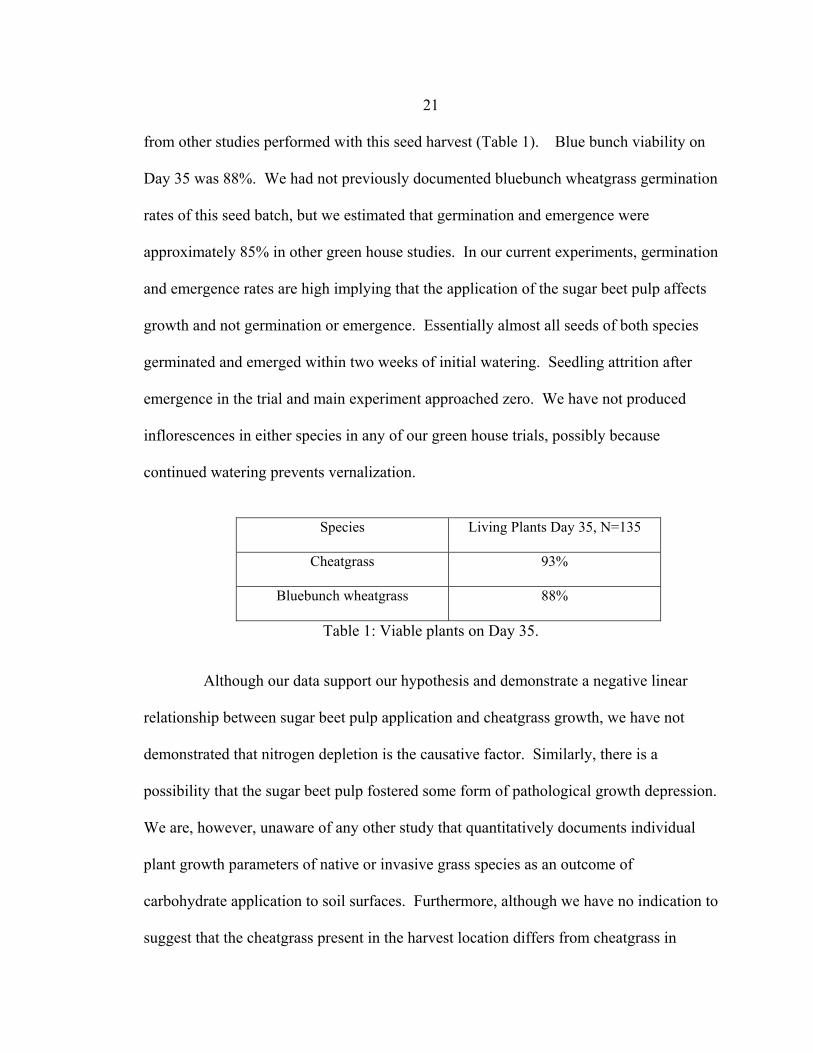
from other studies performed with this seed harvest (Table 1). Blue bunch viability on
Day 35 was 88%. We had not previously documented bluebunch wheatgrass germination
rates of this seed batch, but we estimated that germination and emergence were
approximately 85% in other green house studies. In our current experiments, germination
and emergence rates are high implying that the application of the sugar beet pulp affects
growth and not germination or emergence. Essentially almost all seeds of both species
germinated and emerged within two weeks of initial watering. Seedling attrition after
emergence in the trial and main experiment approached zero. We have not produced
inflorescences in either species in any of our green house trials, possibly because
continued watering prevents vernalization.
Species Living Plants Day 35, N=135
Cheatgrass 93%
Bluebunch wheatgrass 88%
Table 1: Viable plants on Day 35.
Although our data support our hypothesis and demonstrate a negative linear
relationship between sugar beet pulp application and cheatgrass growth, we have not
demonstrated that nitrogen depletion is the causative factor. Similarly, there is a
possibility that the sugar beet pulp fostered some form of pathological growth depression.
We are, however, unaware of any other study that quantitatively documents individual
plant growth parameters of native or invasive grass species as an outcome of
carbohydrate application to soil surfaces. Furthermore, although we have no indication to
suggest that the cheatgrass present in the harvest location differs from cheatgrass in
22
general, various ecotypes of cheatgrass are known to exist (Upadhyaya et al. 1986), so
our data is only valid for cheatgrass harvested at this location during the summer of 2009.
Similarly, our data is valid only for seeds harvested in 2009. We currently have a trial in
progress using cheatgrass seeds harvested in 2010 from the same location.
The differences in the relationship of sugar beet pulp application between
cheatgrass and bluebunch wheatgrass is consistent with the previously explained concepts
that native grass growth is less dependent on soil inorganic nitrogen content than nitrogen
dependent invasive grass growth. All grasses tested so far are cool season C-3 grasses.
Based on an extensive literature review, response of warm season grasses to carbohydrate
related nitrogen depletion has not been documented. Preparation is underway to test the
response of side oats grama (Bouteloua curtipendula (Michx.) Torr.), a middle height
warm season C-4 grass and little bluestem (Schizachyrium scoparium (Michx.) Nash), a
tall warm season C-4 grass, to sugar beet pulp application.
At the current time, we cannot explain the positive relationship of the granite grit
on cheatgrass growth. In addition to the statistical documentation, this relationship was
easily documented by casual visual inspection in the greenhouse. Despite randomization,
the tallest cheatgrass plants were almost always those emerging through the granite
mulch. Bluebunch wheatgrass also emerged through the granite. Neither species seemed
to have any difficulty with the granite. Observers have previously noted that cheatgrass
avoids clayey soils and prefers coarse growing mediums (Upadhyaya et al. 1986).
Granite chicken grit enhancement may be related to increased soil coarseness. Studies
are needed to determine if “beneficial” ions leaching off the granite are a causative factor,
23
but since a similar effect on bluebunch wheatgrass was not noticed, this seems unlikely.
Since the regression analysis of bluebunch leaf number per plant yielded a β-1 coefficient
approaching zero, a granite common mulch or ion effect does not seem likely. Possible
explanations may relate to moisture trapped under the granite or temperature effects of
granite warmed by sun that are more efficiently utilized by cheatgrass.
Although it is tempting to statistically compare growth parameters of the two
grass species utilized in our experiment, I believe such comparisons may not be
appropriate. We have observed these grass seedlings are markedly structurally different
from each other in the number of leaves, number of tillers, leaf length, surface cover, root
configuration, root diameter and root depth. Bluebunch wheatgrass seedlings reach to the
sky in a thin column of a few long leaves, with the last, youngest leaf, usually being the
longest. Cheatgrass seedlings produce larger numbers of tillers that grow laterally from a
quickly developing crown before extending upwards. The first and second blades of each
tiller are usually the longest. Bluebunch wheat grass sequesters a vertical column of
space similar to warm season perennial grasses noted by Weaver (1968). Cheatgrass
grows laterally from the crown and sequesters basal soil surface area in a dish like
fashion.
Implications for Management
Cheatgrass invasion is responsible for ongoing degradation of residential
properties, dry land pastures, agricultural acreage and rangelands with major financial
consequences in all 4 categories (Young and Clements 2009). We as well as other
observers have noticed that established grasses in pastures and rangelands can
24
successfully compete with cheatgrass as long as there is no disturbance such as fire, over
grazing, or damage by construction equipment, but once such a disturbance occurs, cheat
grass domination occurs. Once cheatgrass domination is present, cheatgrass becomes a
formable adversary because it is able to consistently compete with almost all vegetation
(Harris 1967, Hubert 1955). Two different groups of investigators at the Agricultural
Research Station at Burns, Oregon and the University of Nevada-Reno presented
information at the recent SRM Meeting in Billings that below ground germination rates
of native grasses in annual invasive grass dominated grasslands are very high, similar to
those in our greenhouses studies. However, seedling emergence in cheatgrass dominated
sites is virtually nonexistent (James et al. 2011, Ledger et al. 2011). However, if native
seedlings emerge and live a short period of time, they are capable of establishing viable
populations (Clements 2011). These presenters concluded that growth of invasive grasses
such as cheatgrass and medusahead needed to be depressed long enough with sufficient
magnitude to “open a window” that permitted native grass establishment.
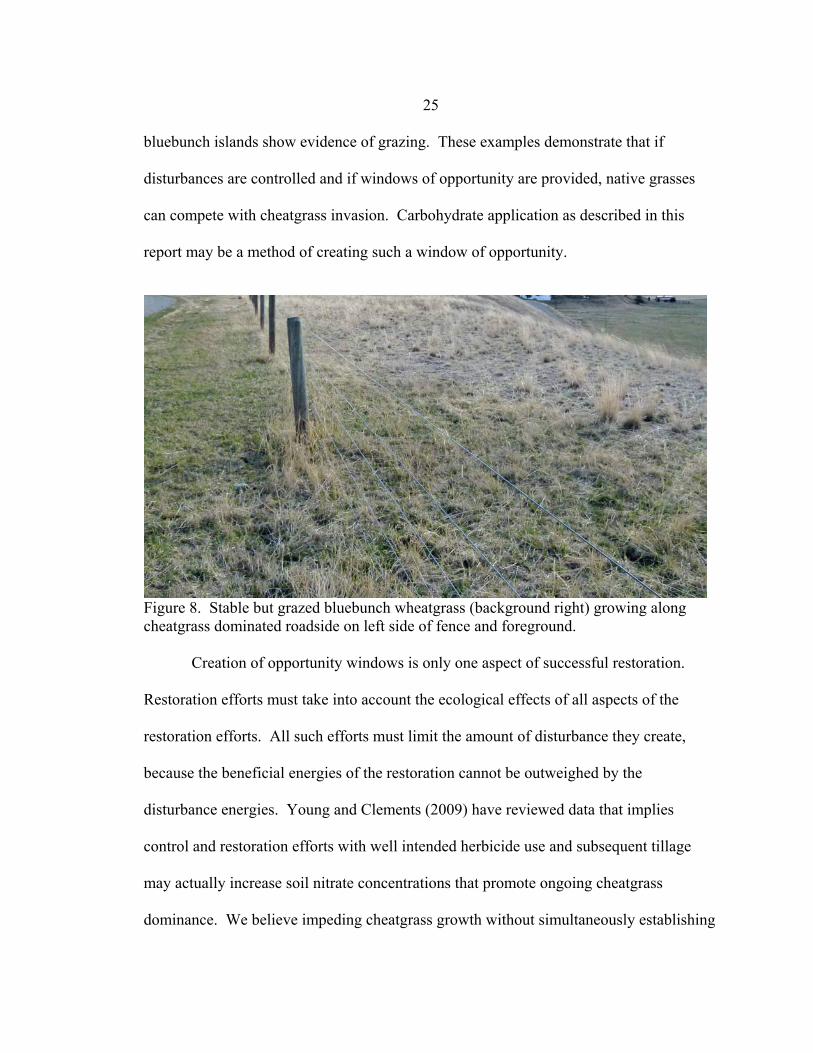
I have observed a stable 50m by 15 m area of established bluebunch wheat grass
growing alongside 15ha of a cheatgrass dominated pasture (Figure 8). The bluebunch
wheatgrass is situated on the top edge of a bench and separated from a road by a standard
barb wire fence. The fence protects the bluebunch wheatgrass from well intended, twice
yearly mowing of the adjacent cheat grass dominated roadside. Although the road side
berm and the surrounding pasture are dominated by cheatgrass, the bluebunch wheatgrass
maintains its presence even though deer traverse this fence repeatedly on a daily basis
and undoubtedly transfer cheatgrass seed into the bluebunch area. Some of the
25
bluebunch islands show evidence of grazing. These examples demonstrate that if
disturbances are controlled and if windows of opportunity are provided, native grasses
can compete with cheatgrass invasion. Carbohydrate application as described in this
report may be a method of creating such a window of opportunity.
Figure 8. Stable but grazed bluebunch wheatgrass (background right) growing along cheatgrass dominated roadside on left side of fence and foreground.
Creation of opportunity windows is only one aspect of successful restoration.
Restoration efforts must take into account the ecological effects of all aspects of the
restoration efforts. All such efforts must limit the amount of disturbance they create,
because the beneficial energies of the restoration cannot be outweighed by the
disturbance energies. Young and Clements (2009) have reviewed data that implies
control and restoration efforts with well intended herbicide use and subsequent tillage
may actually increase soil nitrate concentrations that promote ongoing cheatgrass
dominance. We believe impeding cheatgrass growth without simultaneously establishing
26
desired native species to compete with cheatgrass for space, nutrients and water will be a
waste of time and finances. Similarly, we believe that it will not be possible to restore
every native species of a given site. Scientifically obtained ecological data is required to
avoid blindly restoring a species that has no chance of survival. This is our reason for
including bluebunch wheatgrass in our experiments, and why further trials will involve
desirable warm season grasses such as side-oats grama and little bluestem as well as other
cool season grasses. We believe that single or multiple sugar beet pulp applications with
subsequent nitrogen depletion may open a window for native grass establishment, but
will only do so if all other activities that promote invasive growth are minimized or
avoided, and the entire restoration effort is based on documented ecological fact.
We believe that any site preparation should be practical and cost effective. Many
cheatgrass invaded rangelands are not amenable to mechanical manipulation such as
tilling or raking never mind drilling. The detrimental effects of rangeland restoration on
agricultural equipment are discussed in detail by Young and Clements (2009). Methods
of application of carbohydrate source and site preparation techniques require comment.
Sucrose saw dust application by raking has been mentioned in our literature review. Our
experience is that this is not feasible. In a frequently cited publication, bulldozing a site
was performed to remove the seed bed of undesired species followed by two years of
weeding and subsequent mechanical tilling to document nitrogen effect on succession
stage (McLendon and Redente 1991). Such efforts are too costly even if they are
necessary. Seed must be sufficiently covered to allow germination and establishment in
27
semi-arid environments, but coverage techniques must be ecologically and financially
feasible.
The original medusahead field trials as previously discussed employed surface
broad cast application of sucrose. We have commented that sucrose is considered to be
expensive (Morghan and Seastadt 1999). Financial aspects will require an effective low
cost carbohydrate source that can be applied evenly with minimal labor and diesel fuel
expense. Broadcast application of beet pulp seems to be the least expensive application
method of achieving our goal of discovering a method to promote native species
establishment with as little disturbance and cost as possible.

28
29
LITERATURE CITED
30
Alpert , P. 2010. Amending invasion with carbon: After fifteen years, a partial success. Rangelands 32: 12-15. Alpert, P. AND J. L. Maron. 2000. Carbon addition as a countermeasure against biological invasion by plants. Biological Invasions 2:33-40. Berg, W.A. , J.A. Bradford, AND P. I. Sims. 1997. Long-term soil nitrogen and vegetation change on sand hill rangeland. Journal of Range Management 50:482-486. Clements, C. 2011. Seedlings: from seed to establishment. 2011 Annual Meeting Society for Range Management; 5-11 February 2011; Billings MT, USA: The Ecology of Seedling Establishment on Rangeland. Clements, F. E. 1936. Nature and structure of the climax. Journal of Ecology 24:252-284. Daubenmire, R. F. 1942. An ecological study of the vegetation of southeastern Washington and adjacent Idaho. Ecological Monographs) 12:53-79. Evans, R. A. 1961. Effects of different densities of downy brome (Bromus tectorum) on growth and survival of crested wheatgrass (Agropyron desertorum) in the greenhouse. Weeds 9:216-223. Harris, G. A. 1967. Some competitive relationships between Agropyron spicatum and Bromus tectorum. Ecological Monographs 37:89-111. Harris, G. A. 1977. Root phenology as a factor of competition among grass seedlings. Journal of Range Management 30:172-177. Hubert, L. C. 1955. Ecological studies of Bromus tectorum and other annual brome grasses. Ecological monographs 25:181-213. Hull. A. C. Jr. 1949. Growth periods and herbage production of cheatgrass and reseeded grasses in southwestern Idaho. Journal of Range Management 2:183-186. James, J., T. Svejcar, AND M. Rinella. 2011. Grass seedling demography in the Great Basin: implications for restoration. 2011 Annual Meeting Society for Range Management; 5-11 February 2011; Billings MT, USA: The Ecology of Seedling Establishment on Rangeland. Jonasson, S., A. Michelsen, I. K. Schmidt, E. V. Nielson AND T. V. Callaghan. 1996. Microbial biomass C, N, and P in two artic soils and responses to addition of NPK fertilizer and sugar: implications for plant nutrient uptake. Oecologia. 106:507-515.
31
Leger, E., E. Goergen, AND C. Rowe. 2011. Field establishment of perennial Grass seedlings in cheatgrass invaded systems. 2011 Annual Meeting Society for Range Management; 5-11 February 2011; Billings MT, USA: The Ecology of Seedling Establishment on Rangeland. Mangold, J. M. AND R. L. Sheley. 2008. Controlling performance of bluebunch wheatgrass and spotted knapweed using nitrogen and sucrose amendments. Western North American Naturalist 68:129-137. McClendon, T. AND E. F. Redente. 1991. Nitrogen and phosphorus effects on secondary succession dynamics on a semi-arid sagebrush site. Ecology. 76:2016-2024. Menalled, F., J. Mangold, AND E. Davis. 2008. Cheatgrass: identification, biology and integrated management. MontGuide MT200811AG 500-1008SA. Bozeman, MT. Montana State University Extension. Meyer, S. E. AND E. A. Leger. 2010: Inbreeding, genetic variation, and invasiveness: The strange case of Bromus tectorum. Rangelands 32:6-11. Morgan, J. P. 1994. Soil impoverishment a little-known technique holds potential for establishing prairie. Restoration & Management Notes. 12:55-56.
Morghan, Reever, K. J. AND T. R. Seatstadt. 1999. Effects of soil nitrogen reduction on nonnative plants in restored grasslands. Restoration Ecology. 7:51-55. R Development Core Team (2008). R: A language and environment for statistical computing. R Foundation for Statisical Computing. Vienna, Austria. ISBN 3-900051-07-0, URL http;//www.R-project.org. Schmidt, I. K., A. Michelsen AND S. Jonasson. 1997. Effects on plant production after addition of labile carbon to arctic/alpine soils. Oecologia. 112:305-313. Seastadt T. R., P. A. Duffy, AND J. N. Knight. 1996. Reverse fertilization experiment produces mixed results (Colorado). Restoration & Management Notes 14:64.
Sloane, C. E. AND C. Marlow. 2011. Environmental influences on structural characteristics of cheatgrass (Bromus tectorum) 2011 Annual Meeting Society for Range Management; 5-11 February 2011; Billings MT, USA: Invasive Species/Weed Management I. Smoliak, S. 1965. Effects of manure, straw, and inorganic fertilizers on northern great plains ranges. Journal of Range Management 18: 11-15.
32
Stringham, T. K., W. C. Krueger, AND P. L. Shaver. 2003. State and transition modeling: an ecological process approach. Journal of Range Management. 56:106-113. Upadhyaya M.K., R. Y. Turkington AND D. McIlvride. 1986. The biology of Canadian weeds. 75. Bromus tectorum L. Canadian Journal of Plant Science. 66:689-709. Uresk, D. W., J. F. Cline AND W. H. Rickard. 1979. Growth rates of a cheatgrass community and some associated factors. Journal of Range Management. 32:168-170. U. S. Forest Service, U. S. Department of Agriculture 2005. Range plant handbook. Honolulu. University Press of the Pacific. (Vasquez,E., R. Sheley AND T. Svejcar. 2008. Nitrogen enhances the cpmpetitive ability of cheatgrass (Bromus tectorum) relative to native grasses. Invasive Plant Science and Management 1:267-295. Warg, S. A. 1938. Life history and economic studies on Bromus tectorum [thesis]. Missoula, MT, USA: State University of Montana. 38 p. Weaver, J. E. 1968. Prairie plants and their environment. Lincoln, NB ,USA University of Nebraska Press. Weaver, J. E. AND F. E. Clements. 1938. Plant Ecology. New York, USA. McGraw-Hill Book Compancy, Inc. Wilson, A.M., G.A. Harris AND D. H. Harris. 1966. Fertilization of mixed cheatgrass-bluebunch wheatgrass stands. Journal of Range Management 19:134-137. Young, J. A., J. D. Trent, R. R. Blank, AND D. E. Palmquist. 1998. Nitrogen interactions with medusahead ((Taeniatherum caput-medusae ssp. asperum). Weed Science 46: 191-195. Young, J. A. AND C. D. Clements. 2009. Cheatgrass fire and forage on the range. Reno. University of Nevada Press.

33
APPENDICES
34
APPENDIX A
ANALYSIS OF VARIANCE TABLE
35
lm(formula = Total Leaves ~ Grass * Type * Rate) Response: Totleaves Df Sum Sq Mean Sq F value Pr(>F) Grass 1 3060.3 3060.30 113.9140 < 2.2e-16 *** Type 2 1579.4 789.68 29.3942 3.099e-12 *** Rate 1 80.0 80.01 2.9781 0.085585 . Grass:Type 2 93.9 46.95 1.7476 0.176227 Grass:Rate 1 3.0 2.96 0.1103 0.740053 Type:Rate 1 272.4 272.41 10.1400 0.001628 ** Grass:Type:Rate 1 198.1 198.05 7.3721 0.007068 ** Residuals 260 6984.9 26.86 ---

36

37
APPENDIX B
MULTIPLE LINEAR REGRESSION TABLE
38
lm(formula = Total leaves ~ Grass * Type * Rate) Residuals: Min 1Q Median 3Q Max -15.637 -1.952 0.271 2.075 53.479 Coefficients: (2 not defined because of singularities) Estimate Std. Error t value Pr(>|t|) (Intercept) 6.6002 1.3383 4.932 1.45e-06 *** GrassCG 6.8674 1.8926 3.628 0.000343 *** TypeGR 1.3824 1.7649 0.783 0.434173 TypeSBP -2.0118 1.7648 -1.140 0.255339 Rate -0.2113 0.2269 -0.931 0.352522 GrassCG:TypeGR -1.1311 2.4959 -0.453 0.650788 GrassCG:TypeSBP 1.4515 2.4957 0.582 0.561351 GrassCG:Rate -0.6914 0.3209 -2.155 0.032098 * TypeGR:Rate 0.1065 0.3209 0.332 0.740341 TypeSBP:Rate NA NA NA NA GrassCG:TypeGR:Rate 1.2321 0.4538 2.715 0.007068 ** GrassCG:TypeSBP:Rate NA NA NA NA --- Residual standard error: 5.183 on 260 degrees of freedom Multiple R-squared: 0.4308, Adjusted R-squared: 0.4111 F-statistic: 21.87 on 9 and 260 DF, p-value: < 2.2e-16