Embed Size (px)
Citation preview
1
4th IASPEI / IAEE International Symposium:
Effects of Surface Geology on Seismic Motion August 23–26, 2011 · University of California Santa Barbara
EFFECT OF MATERIAL RHEOLOGY WHEN MODELING WAVE PROPAGATION IN COMPLEX MEDIA: A 2D P-SV CASE STUDY
Gélis Céline Bonilla Fabian Liu Peng-Cheng Institut de Radioprotection Institut Français des Sciences et US Bureau of Reclamation et de Sûreté Nucléaire Technologies des Transports Denver Federal Center, BP 17 de l'Aménagement et des Réseaux Box 25007, MS 86-68330, 92 262 Fontenay aux roses cedex 58 Bd Lefebvre Denver, Colorado 80225-0007 France 75 015 Paris Cedex USA [email protected] France [email protected] ABSTRACT Basin response depends on the site geometry, impedance contrast, soil properties and constitutive model, and on the complexity and strength of the input solicitation. Numerical modeling is a useful tool to understand the role and the influence of these different parameters governing site effects. In this study we focus on the 2D P-SV seismic wave propagation in a simple-shaped asymmetric model. We assess the influence of the material constitutive model (elastic, viscoelastic and/or nonlinear) on the wave propagation as well as the importance of the source intensity and complexity on the development of nonlinearity. In particular, we show that the PGA only is not a good indicator to have an idea of nonlinear effects since nonlinearity has a cumulative effect. We also show that both viscoelasticity and nonlinearity strongly modify the ground motion on a broadband range of frequencies but that they compete together in the different frequency bands. It means that realistic simulations should couple both viscoelasticity and nonlinear soil behavior. At last, we test the importance of dynamic soil properties on the wave propagation and show that curves of shear modulus and damping that are close together may lead to significant variations in the velocity and acceleration fields. Simulations should take into account this variability to assess the uncertainties on computed ground motion.
INTRODUCTION Throughout the world, numerous examples have shown the importance of site effects in sedimentary basins. Several studies focus on large sedimentary basins in the United States, Japan or New Zealand (Olsen and Archuleta, 1996; Satoh et al., 2001; Benites and Olsen, 2005); whereas other focus on wave propagation studies in smaller sedimentary basins, such as the Nice basin (Semblat et al., 2000; Gélis et al., 2007), The Grenoble basin (Bonilla et al., 2006) or the Sion basin (Roten et al., 2009) in Europe. In general, a basin seismic response depends on its geometry, the impedance contrast between sediments and bedrock, sediments properties and constitutive models, and the characteristics of the seismic source (complexity and intensity). Numerical simulation is a tool that allows understanding and assessing the influence of different parameters governing site effects. For example, Semblat et al. (2005) or Gelagoti et al. (2010) study the influence of these different factors through numerical simulations. This paper focuses on the study of 2D P-SV wave propagation in a sedimentary basin whose asymmetric shape and elastic properties (P and S waves velocity, density) are known. The shape of the basin is similar to those characterized for European Alpine basins according to Lacave and Lemeille (2006). The objective of this paper is to study different parameters that can affect the wave propagation in this specific configuration. We first study here the influence of the soil constitutive model. We then show the strong interaction between the input motion and the soil properties. At last, we focus on the influence of nonlinear soil properties on the
2
propagation wavefield. MATERIAL CONSTITUTIVE MODELS In this study we compare results coming from numerical simulations in an isotropic medium with the stencil of Saenger et al. (2000). In comparison with the classical staggered grid stencil of Virieux (1986), this rotated staggered grid stencil allows using soil parameters such as Lamé parameters and density only once in the numerical stencil, thus avoiding to perform numerical spatial average of these parameters. Moreover, stresses and strains share the same location, making easier to implement a nonlinear constitutive model in the same way as finite element methods. Four different constitutive models are considered:
- A linear elastic model. Hooke’s law is used to link strain tensor components to stress tensor components. - A linear viscoelastic model. The technique of Liu and Archuleta (2006) is used to implement constant attenuation between
0.1 and 50 Hz through quality factors ranging between 5 and 5000. - A nonlinear constitutive model. In this study the nonlinear rheology described by Bonilla et al (2005) and based on the
method of Towhata and Ishihara (1985) and Iai et al (1990) is used. In this method, several shear mechanisms model the nonlinear rheology by using distributed springs, each of them following the hyperbolic model during the loading and unloading process. This allows to following the shear modulus degradation and damping ratio curves (G, D) curves when the shear strain γ increases. In this study, pore pressure is not included.
- A coupling between the nonlinear and viscoelastic models previously cited. Here, shear stress components calculated in a linear viscoelastic model are used to get effective shear strain components, which are in turn used by the nonlinear model. In this case, the nonlinear damping must be zero at small shear strains to avoid taking into account the attenuation twice.
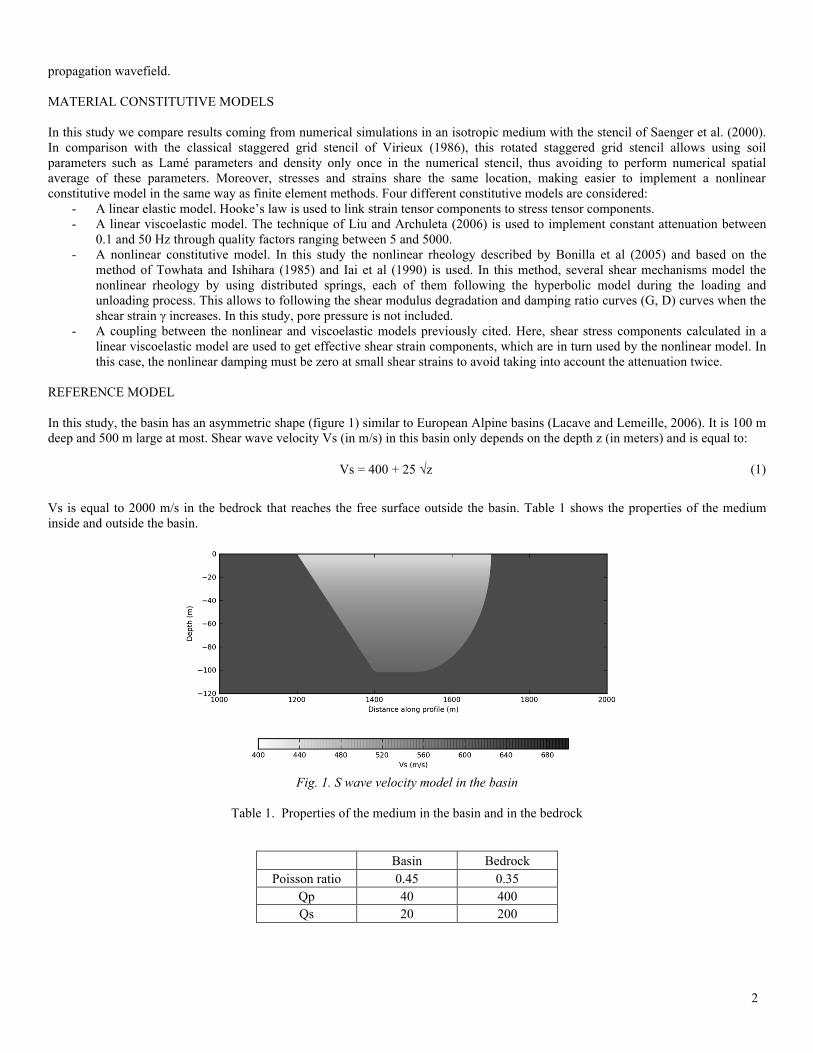
REFERENCE MODEL In this study, the basin has an asymmetric shape (figure 1) similar to European Alpine basins (Lacave and Lemeille, 2006). It is 100 m deep and 500 m large at most. Shear wave velocity Vs (in m/s) in this basin only depends on the depth z (in meters) and is equal to:
Vs = 400 + 25 √z (1)
Vs is equal to 2000 m/s in the bedrock that reaches the free surface outside the basin. Table 1 shows the properties of the medium inside and outside the basin.
Fig. 1. S wave velocity model in the basin
Table 1. Properties of the medium in the basin and in the bedrock
Basin Bedrock Poisson ratio 0.45 0.35
Qp 40 400 Qs 20 200
3
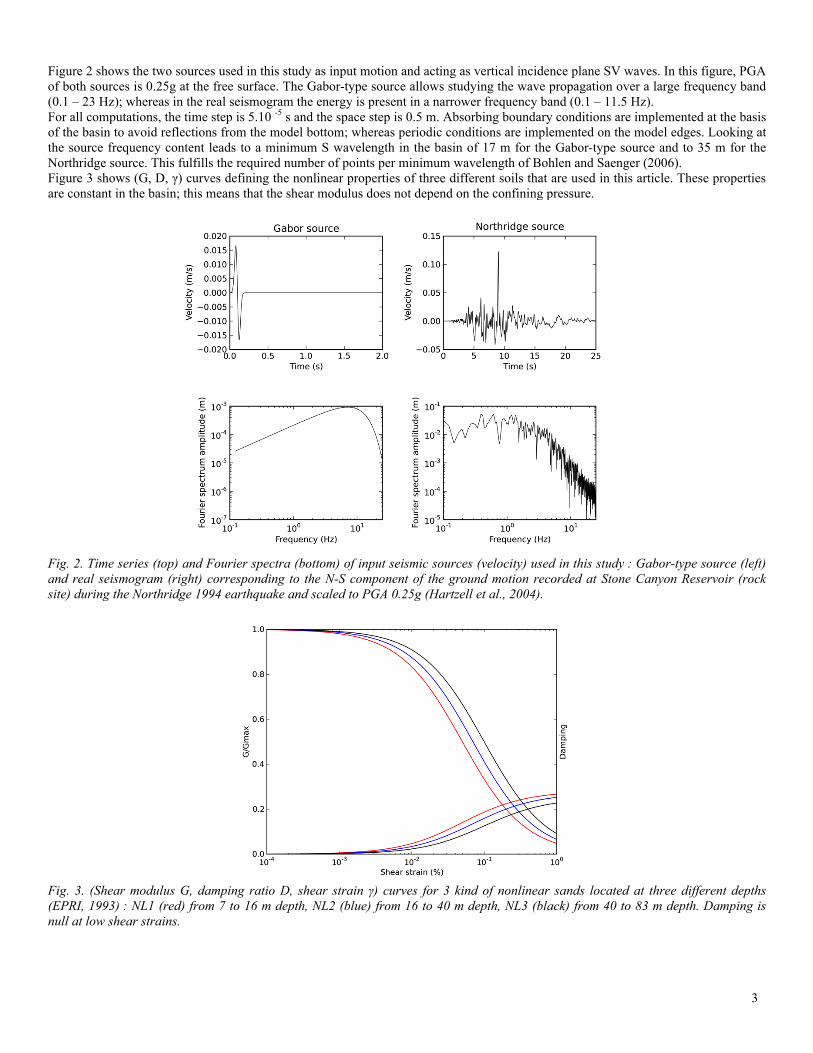
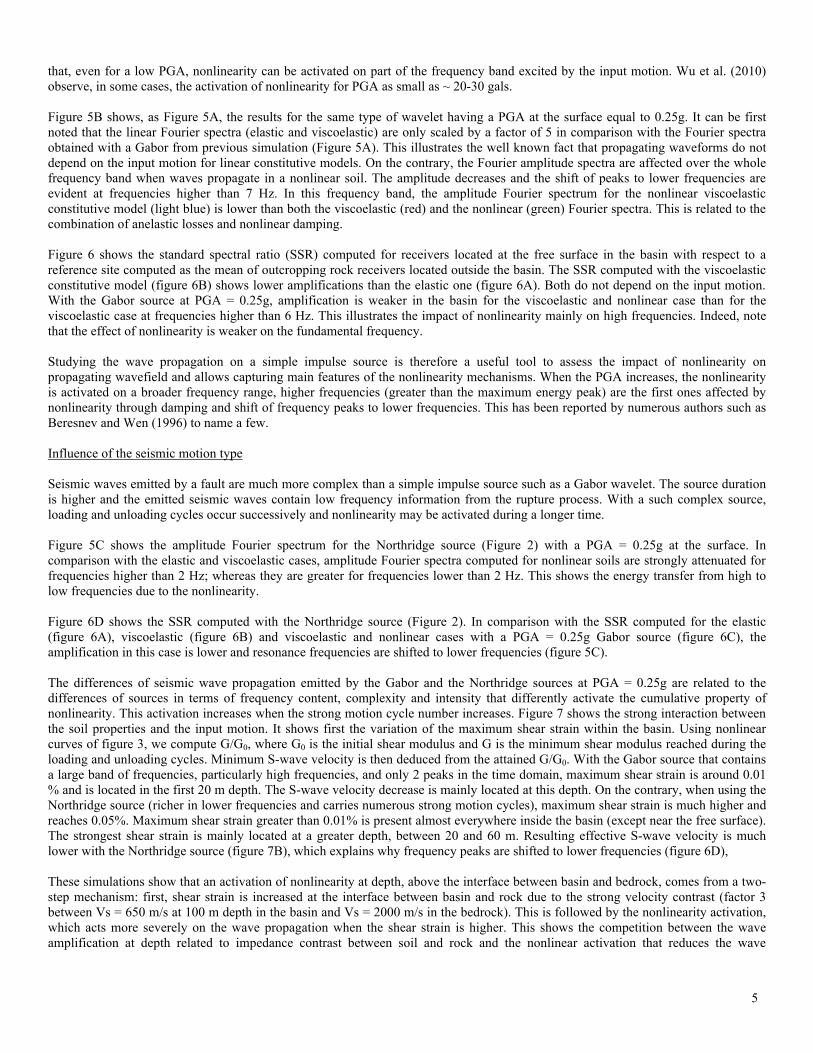
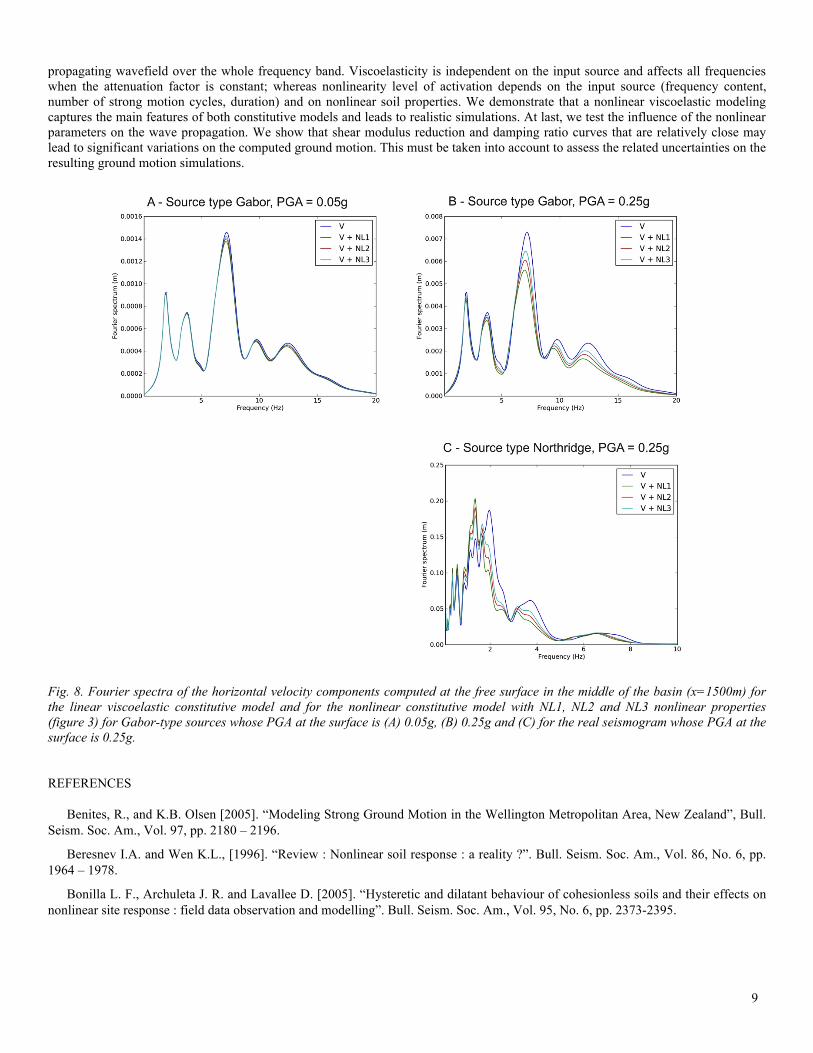
Figure 2 shows the two sources used in this study as input motion and acting as vertical incidence plane SV waves. In this figure, PGA of both sources is 0.25g at the free surface. The Gabor-type source allows studying the wave propagation over a large frequency band (0.1 – 23 Hz); whereas in the real seismogram the energy is present in a narrower frequency band (0.1 – 11.5 Hz). For all computations, the time step is 5.10 -5 s and the space step is 0.5 m. Absorbing boundary conditions are implemented at the basis of the basin to avoid reflections from the model bottom; whereas periodic conditions are implemented on the model edges. Looking at the source frequency content leads to a minimum S wavelength in the basin of 17 m for the Gabor-type source and to 35 m for the Northridge source. This fulfills the required number of points per minimum wavelength of Bohlen and Saenger (2006). Figure 3 shows (G, D, γ) curves defining the nonlinear properties of three different soils that are used in this article. These properties are constant in the basin; this means that the shear modulus does not depend on the confining pressure.
Fig. 2. Time series (top) and Fourier spectra (bottom) of input seismic sources (velocity) used in this study : Gabor-type source (left) and real seismogram (right) corresponding to the N-S component of the ground motion recorded at Stone Canyon Reservoir (rock site) during the Northridge 1994 earthquake and scaled to PGA 0.25g (Hartzell et al., 2004).
Fig. 3. (Shear modulus G, damping ratio D, shear strain γ) curves for 3 kind of nonlinear sands located at three different depths (EPRI, 1993) : NL1 (red) from 7 to 16 m depth, NL2 (blue) from 16 to 40 m depth, NL3 (black) from 40 to 83 m depth. Damping is null at low shear strains.
4
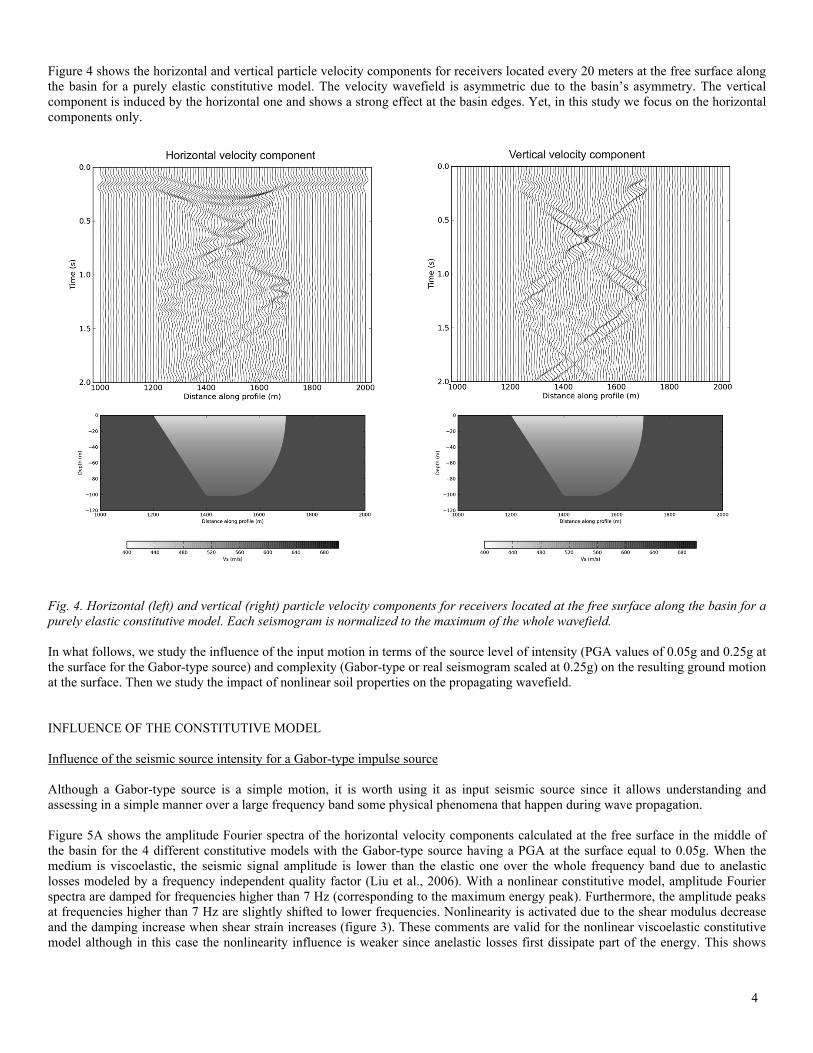
Figure 4 shows the horizontal and vertical particle velocity components for receivers located every 20 meters at the free surface along the basin for a purely elastic constitutive model. The velocity wavefield is asymmetric due to the basin’s asymmetry. The vertical component is induced by the horizontal one and shows a strong effect at the basin edges. Yet, in this study we focus on the horizontal components only.
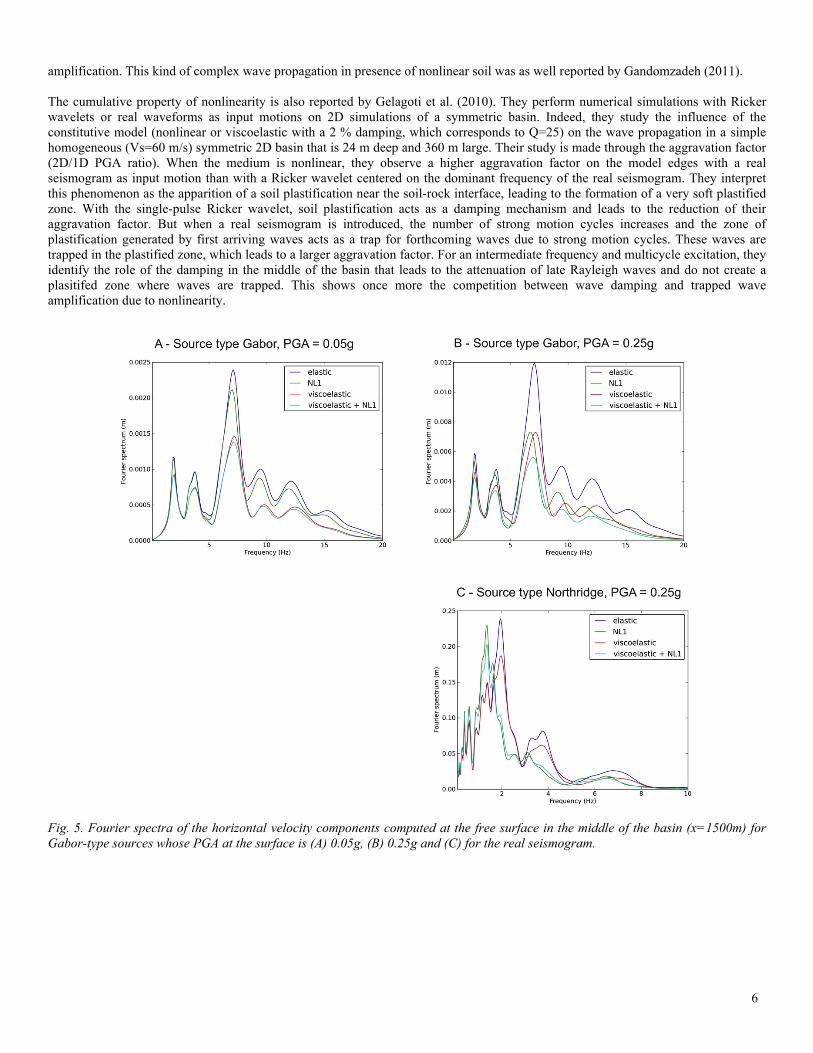
Fig. 4. Horizontal (left) and vertical (right) particle velocity components for receivers located at the free surface along the basin for a purely elastic constitutive model. Each seismogram is normalized to the maximum of the whole wavefield. In what follows, we study the influence of the input motion in terms of the source level of intensity (PGA values of 0.05g and 0.25g at the surface for the Gabor-type source) and complexity (Gabor-type or real seismogram scaled at 0.25g) on the resulting ground motion at the surface. Then we study the impact of nonlinear soil properties on the propagating wavefield. INFLUENCE OF THE CONSTITUTIVE MODEL Influence of the seismic source intensity for a Gabor-type impulse source Although a Gabor-type source is a simple motion, it is worth using it as input seismic source since it allows understanding and assessing in a simple manner over a large frequency band some physical phenomena that happen during wave propagation. Figure 5A shows the amplitude Fourier spectra of the horizontal velocity components calculated at the free surface in the middle of the basin for the 4 different constitutive models with the Gabor-type source having a PGA at the surface equal to 0.05g. When the medium is viscoelastic, the seismic signal amplitude is lower than the elastic one over the whole frequency band due to anelastic losses modeled by a frequency independent quality factor (Liu et al., 2006). With a nonlinear constitutive model, amplitude Fourier spectra are damped for frequencies higher than 7 Hz (corresponding to the maximum energy peak). Furthermore, the amplitude peaks at frequencies higher than 7 Hz are slightly shifted to lower frequencies. Nonlinearity is activated due to the shear modulus decrease and the damping increase when shear strain increases (figure 3). These comments are valid for the nonlinear viscoelastic constitutive model although in this case the nonlinearity influence is weaker since anelastic losses first dissipate part of the energy. This shows
5
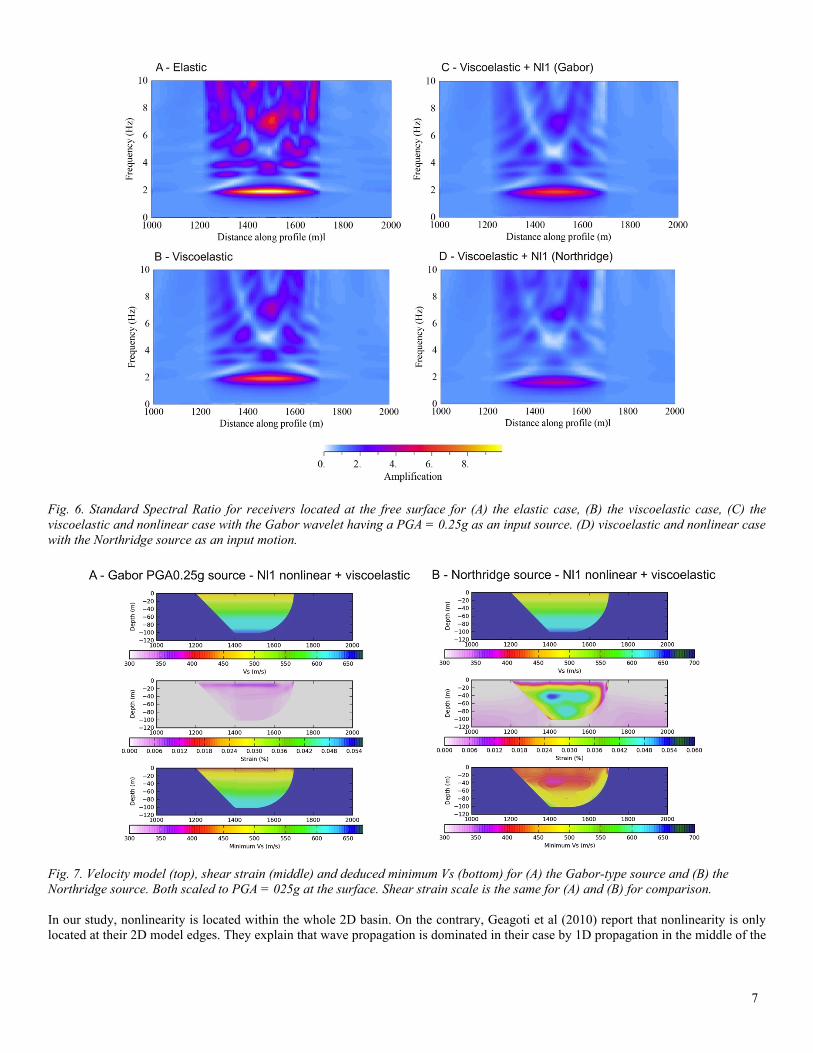
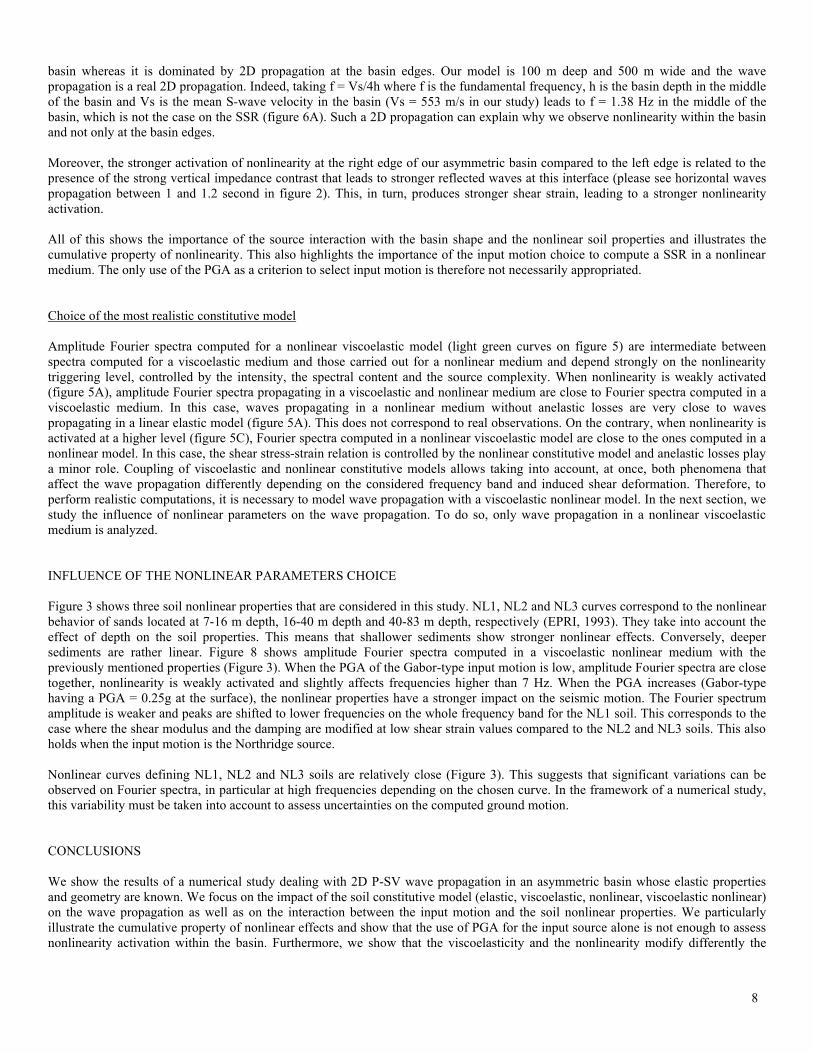
that, even for a low PGA, nonlinearity can be activated on part of the frequency band excited by the input motion. Wu et al. (2010) observe, in some cases, the activation of nonlinearity for PGA as small as ~ 20-30 gals. Figure 5B shows, as Figure 5A, the results for the same type of wavelet having a PGA at the surface equal to 0.25g. It can be first noted that the linear Fourier spectra (elastic and viscoelastic) are only scaled by a factor of 5 in comparison with the Fourier spectra obtained with a Gabor from previous simulation (Figure 5A). This illustrates the well known fact that propagating waveforms do not depend on the input motion for linear constitutive models. On the contrary, the Fourier amplitude spectra are affected over the whole frequency band when waves propagate in a nonlinear soil. The amplitude decreases and the shift of peaks to lower frequencies are evident at frequencies higher than 7 Hz. In this frequency band, the amplitude Fourier spectrum for the nonlinear viscoelastic constitutive model (light blue) is lower than both the viscoelastic (red) and the nonlinear (green) Fourier spectra. This is related to the combination of anelastic losses and nonlinear damping. Figure 6 shows the standard spectral ratio (SSR) computed for receivers located at the free surface in the basin with respect to a reference site computed as the mean of outcropping rock receivers located outside the basin. The SSR computed with the viscoelastic constitutive model (figure 6B) shows lower amplifications than the elastic one (figure 6A). Both do not depend on the input motion. With the Gabor source at PGA = 0.25g, amplification is weaker in the basin for the viscoelastic and nonlinear case than for the viscoelastic case at frequencies higher than 6 Hz. This illustrates the impact of nonlinearity mainly on high frequencies. Indeed, note that the effect of nonlinearity is weaker on the fundamental frequency. Studying the wave propagation on a simple impulse source is therefore a useful tool to assess the impact of nonlinearity on propagating wavefield and allows capturing main features of the nonlinearity mechanisms. When the PGA increases, the nonlinearity is activated on a broader frequency range, higher frequencies (greater than the maximum energy peak) are the first ones affected by nonlinearity through damping and shift of frequency peaks to lower frequencies. This has been reported by numerous authors such as Beresnev and Wen (1996) to name a few. Influence of the seismic motion type Seismic waves emitted by a fault are much more complex than a simple impulse source such as a Gabor wavelet. The source duration is higher and the emitted seismic waves contain low frequency information from the rupture process. With a such complex source, loading and unloading cycles occur successively and nonlinearity may be activated during a longer time. Figure 5C shows the amplitude Fourier spectrum for the Northridge source (Figure 2) with a PGA = 0.25g at the surface. In comparison with the elastic and viscoelastic cases, amplitude Fourier spectra computed for nonlinear soils are strongly attenuated for frequencies higher than 2 Hz; whereas they are greater for frequencies lower than 2 Hz. This shows the energy transfer from high to low frequencies due to the nonlinearity. Figure 6D shows the SSR computed with the Northridge source (Figure 2). In comparison with the SSR computed for the elastic (figure 6A), viscoelastic (figure 6B) and viscoelastic and nonlinear cases with a PGA = 0.25g Gabor source (figure 6C), the amplification in this case is lower and resonance frequencies are shifted to lower frequencies (figure 5C). The differences of seismic wave propagation emitted by the Gabor and the Northridge sources at PGA = 0.25g are related to the differences of sources in terms of frequency content, complexity and intensity that differently activate the cumulative property of nonlinearity. This activation increases when the strong motion cycle number increases. Figure 7 shows the strong interaction between the soil properties and the input motion. It shows first the variation of the maximum shear strain within the basin. Using nonlinear curves of figure 3, we compute G/G0, where G0 is the initial shear modulus and G is the minimum shear modulus reached during the loading and unloading cycles. Minimum S-wave velocity is then deduced from the attained G/G0. With the Gabor source that contains a large band of frequencies, particularly high frequencies, and only 2 peaks in the time domain, maximum shear strain is around 0.01 % and is located in the first 20 m depth. The S-wave velocity decrease is mainly located at this depth. On the contrary, when using the Northridge source (richer in lower frequencies and carries numerous strong motion cycles), maximum shear strain is much higher and reaches 0.05%. Maximum shear strain greater than 0.01% is present almost everywhere inside the basin (except near the free surface). The strongest shear strain is mainly located at a greater depth, between 20 and 60 m. Resulting effective S-wave velocity is much lower with the Northridge source (figure 7B), which explains why frequency peaks are shifted to lower frequencies (figure 6D), These simulations show that an activation of nonlinearity at depth, above the interface between basin and bedrock, comes from a two-step mechanism: first, shear strain is increased at the interface between basin and rock due to the strong velocity contrast (factor 3 between Vs = 650 m/s at 100 m depth in the basin and Vs = 2000 m/s in the bedrock). This is followed by the nonlinearity activation, which acts more severely on the wave propagation when the shear strain is higher. This shows the competition between the wave amplification at depth related to impedance contrast between soil and rock and the nonlinear activation that reduces the wave
6
amplification. This kind of complex wave propagation in presence of nonlinear soil was as well reported by Gandomzadeh (2011). The cumulative property of nonlinearity is also reported by Gelagoti et al. (2010). They perform numerical simulations with Ricker wavelets or real waveforms as input motions on 2D simulations of a symmetric basin. Indeed, they study the influence of the constitutive model (nonlinear or viscoelastic with a 2 % damping, which corresponds to Q=25) on the wave propagation in a simple homogeneous (Vs=60 m/s) symmetric 2D basin that is 24 m deep and 360 m large. Their study is made through the aggravation factor (2D/1D PGA ratio). When the medium is nonlinear, they observe a higher aggravation factor on the model edges with a real seismogram as input motion than with a Ricker wavelet centered on the dominant frequency of the real seismogram. They interpret this phenomenon as the apparition of a soil plastification near the soil-rock interface, leading to the formation of a very soft plastified zone. With the single-pulse Ricker wavelet, soil plastification acts as a damping mechanism and leads to the reduction of their aggravation factor. But when a real seismogram is introduced, the number of strong motion cycles increases and the zone of plastification generated by first arriving waves acts as a trap for forthcoming waves due to strong motion cycles. These waves are trapped in the plastified zone, which leads to a larger aggravation factor. For an intermediate frequency and multicycle excitation, they identify the role of the damping in the middle of the basin that leads to the attenuation of late Rayleigh waves and do not create a plasitifed zone where waves are trapped. This shows once more the competition between wave damping and trapped wave amplification due to nonlinearity.
Fig. 5. Fourier spectra of the horizontal velocity components computed at the free surface in the middle of the basin (x=1500m) for Gabor-type sources whose PGA at the surface is (A) 0.05g, (B) 0.25g and (C) for the real seismogram.
7
Fig. 6. Standard Spectral Ratio for receivers located at the free surface for (A) the elastic case, (B) the viscoelastic case, (C) the viscoelastic and nonlinear case with the Gabor wavelet having a PGA = 0.25g as an input source. (D) viscoelastic and nonlinear case with the Northridge source as an input motion.
Fig. 7. Velocity model (top), shear strain (middle) and deduced minimum Vs (bottom) for (A) the Gabor-type source and (B) the Northridge source. Both scaled to PGA = 025g at the surface. Shear strain scale is the same for (A) and (B) for comparison. In our study, nonlinearity is located within the whole 2D basin. On the contrary, Geagoti et al (2010) report that nonlinearity is only located at their 2D model edges. They explain that wave propagation is dominated in their case by 1D propagation in the middle of the
8
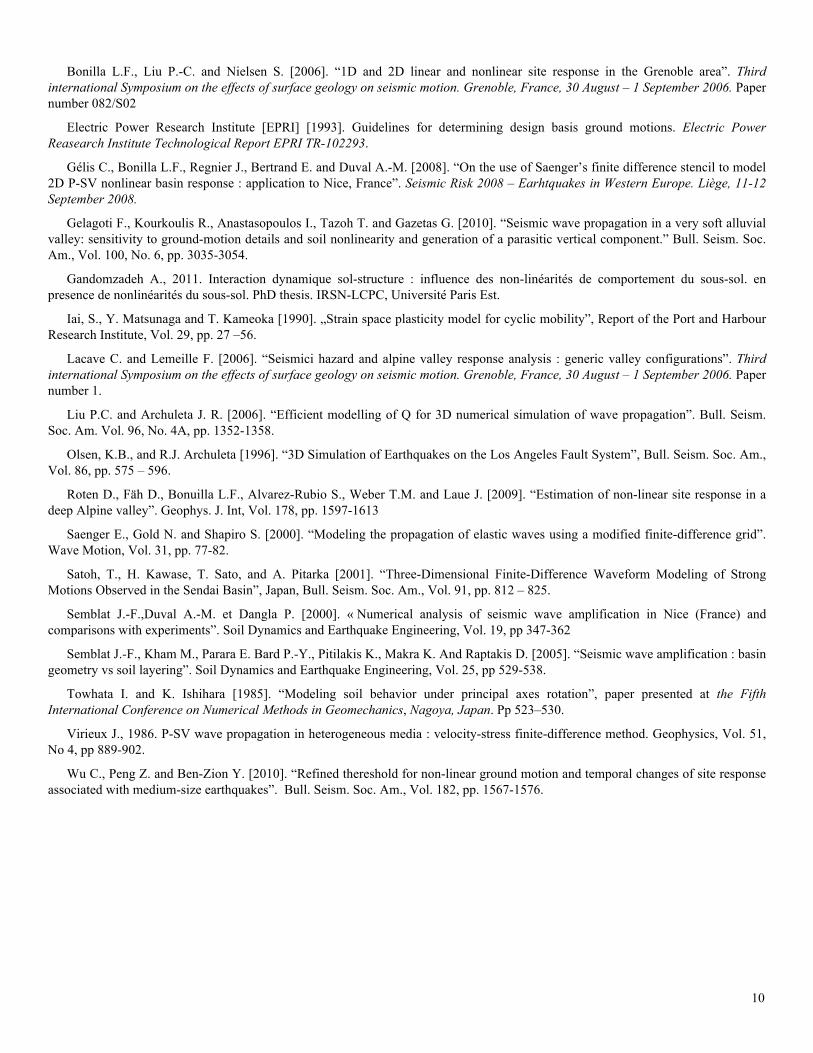
basin whereas it is dominated by 2D propagation at the basin edges. Our model is 100 m deep and 500 m wide and the wave propagation is a real 2D propagation. Indeed, taking f = Vs/4h where f is the fundamental frequency, h is the basin depth in the middle of the basin and Vs is the mean S-wave velocity in the basin (Vs = 553 m/s in our study) leads to f = 1.38 Hz in the middle of the basin, which is not the case on the SSR (figure 6A). Such a 2D propagation can explain why we observe nonlinearity within the basin and not only at the basin edges. Moreover, the stronger activation of nonlinearity at the right edge of our asymmetric basin compared to the left edge is related to the presence of the strong vertical impedance contrast that leads to stronger reflected waves at this interface (please see horizontal waves propagation between 1 and 1.2 second in figure 2). This, in turn, produces stronger shear strain, leading to a stronger nonlinearity activation. All of this shows the importance of the source interaction with the basin shape and the nonlinear soil properties and illustrates the cumulative property of nonlinearity. This also highlights the importance of the input motion choice to compute a SSR in a nonlinear medium. The only use of the PGA as a criterion to select input motion is therefore not necessarily appropriated. Choice of the most realistic constitutive model Amplitude Fourier spectra computed for a nonlinear viscoelastic model (light green curves on figure 5) are intermediate between spectra computed for a viscoelastic medium and those carried out for a nonlinear medium and depend strongly on the nonlinearity triggering level, controlled by the intensity, the spectral content and the source complexity. When nonlinearity is weakly activated (figure 5A), amplitude Fourier spectra propagating in a viscoelastic and nonlinear medium are close to Fourier spectra computed in a viscoelastic medium. In this case, waves propagating in a nonlinear medium without anelastic losses are very close to waves propagating in a linear elastic model (figure 5A). This does not correspond to real observations. On the contrary, when nonlinearity is activated at a higher level (figure 5C), Fourier spectra computed in a nonlinear viscoelastic model are close to the ones computed in a nonlinear model. In this case, the shear stress-strain relation is controlled by the nonlinear constitutive model and anelastic losses play a minor role. Coupling of viscoelastic and nonlinear constitutive models allows taking into account, at once, both phenomena that affect the wave propagation differently depending on the considered frequency band and induced shear deformation. Therefore, to perform realistic computations, it is necessary to model wave propagation with a viscoelastic nonlinear model. In the next section, we study the influence of nonlinear parameters on the wave propagation. To do so, only wave propagation in a nonlinear viscoelastic medium is analyzed. INFLUENCE OF THE NONLINEAR PARAMETERS CHOICE Figure 3 shows three soil nonlinear properties that are considered in this study. NL1, NL2 and NL3 curves correspond to the nonlinear behavior of sands located at 7-16 m depth, 16-40 m depth and 40-83 m depth, respectively (EPRI, 1993). They take into account the effect of depth on the soil properties. This means that shallower sediments show stronger nonlinear effects. Conversely, deeper sediments are rather linear. Figure 8 shows amplitude Fourier spectra computed in a viscoelastic nonlinear medium with the previously mentioned properties (Figure 3). When the PGA of the Gabor-type input motion is low, amplitude Fourier spectra are close together, nonlinearity is weakly activated and slightly affects frequencies higher than 7 Hz. When the PGA increases (Gabor-type having a PGA = 0.25g at the surface), the nonlinear properties have a stronger impact on the seismic motion. The Fourier spectrum amplitude is weaker and peaks are shifted to lower frequencies on the whole frequency band for the NL1 soil. This corresponds to the case where the shear modulus and the damping are modified at low shear strain values compared to the NL2 and NL3 soils. This also holds when the input motion is the Northridge source. Nonlinear curves defining NL1, NL2 and NL3 soils are relatively close (Figure 3). This suggests that significant variations can be observed on Fourier spectra, in particular at high frequencies depending on the chosen curve. In the framework of a numerical study, this variability must be taken into account to assess uncertainties on the computed ground motion. CONCLUSIONS We show the results of a numerical study dealing with 2D P-SV wave propagation in an asymmetric basin whose elastic properties and geometry are known. We focus on the impact of the soil constitutive model (elastic, viscoelastic, nonlinear, viscoelastic nonlinear) on the wave propagation as well as on the interaction between the input motion and the soil nonlinear properties. We particularly illustrate the cumulative property of nonlinear effects and show that the use of PGA for the input source alone is not enough to assess nonlinearity activation within the basin. Furthermore, we show that the viscoelasticity and the nonlinearity modify differently the
9
propagating wavefield over the whole frequency band. Viscoelasticity is independent on the input source and affects all frequencies when the attenuation factor is constant; whereas nonlinearity level of activation depends on the input source (frequency content, number of strong motion cycles, duration) and on nonlinear soil properties. We demonstrate that a nonlinear viscoelastic modeling captures the main features of both constitutive models and leads to realistic simulations. At last, we test the influence of the nonlinear parameters on the wave propagation. We show that shear modulus reduction and damping ratio curves that are relatively close may lead to significant variations on the computed ground motion. This must be taken into account to assess the related uncertainties on the resulting ground motion simulations.
Fig. 8. Fourier spectra of the horizontal velocity components computed at the free surface in the middle of the basin (x=1500m) for the linear viscoelastic constitutive model and for the nonlinear constitutive model with NL1, NL2 and NL3 nonlinear properties (figure 3) for Gabor-type sources whose PGA at the surface is (A) 0.05g, (B) 0.25g and (C) for the real seismogram whose PGA at the surface is 0.25g. REFERENCES
Benites, R., and K.B. Olsen [2005]. “Modeling Strong Ground Motion in the Wellington Metropolitan Area, New Zealand”, Bull. Seism. Soc. Am., Vol. 97, pp. 2180 – 2196.
Beresnev I.A. and Wen K.L., [1996]. “Review : Nonlinear soil response : a reality ?”. Bull. Seism. Soc. Am., Vol. 86, No. 6, pp. 1964 – 1978.
Bonilla L. F., Archuleta J. R. and Lavallee D. [2005]. “Hysteretic and dilatant behaviour of cohesionless soils and their effects on nonlinear site response : field data observation and modelling”. Bull. Seism. Soc. Am., Vol. 95, No. 6, pp. 2373-2395.
10
Bonilla L.F., Liu P.-C. and Nielsen S. [2006]. “1D and 2D linear and nonlinear site response in the Grenoble area”. Third international Symposium on the effects of surface geology on seismic motion. Grenoble, France, 30 August – 1 September 2006. Paper number 082/S02
Electric Power Research Institute [EPRI] [1993]. Guidelines for determining design basis ground motions. Electric Power Reasearch Institute Technological Report EPRI TR-102293.
Gélis C., Bonilla L.F., Regnier J., Bertrand E. and Duval A.-M. [2008]. “On the use of Saenger’s finite difference stencil to model 2D P-SV nonlinear basin response : application to Nice, France”. Seismic Risk 2008 – Earhtquakes in Western Europe. Liège, 11-12 September 2008.
Gelagoti F., Kourkoulis R., Anastasopoulos I., Tazoh T. and Gazetas G. [2010]. “Seismic wave propagation in a very soft alluvial valley: sensitivity to ground-motion details and soil nonlinearity and generation of a parasitic vertical component.” Bull. Seism. Soc. Am., Vol. 100, No. 6, pp. 3035-3054.
Gandomzadeh A., 2011. Interaction dynamique sol-structure : influence des non-linéarités de comportement du sous-sol. en presence de nonlinéarités du sous-sol. PhD thesis. IRSN-LCPC, Université Paris Est.
Iai, S., Y. Matsunaga and T. Kameoka [1990]. „Strain space plasticity model for cyclic mobility”, Report of the Port and Harbour Research Institute, Vol. 29, pp. 27 –56.
Lacave C. and Lemeille F. [2006]. “Seismici hazard and alpine valley response analysis : generic valley configurations”. Third international Symposium on the effects of surface geology on seismic motion. Grenoble, France, 30 August – 1 September 2006. Paper number 1.
Liu P.C. and Archuleta J. R. [2006]. “Efficient modelling of Q for 3D numerical simulation of wave propagation”. Bull. Seism. Soc. Am. Vol. 96, No. 4A, pp. 1352-1358.
Olsen, K.B., and R.J. Archuleta [1996]. “3D Simulation of Earthquakes on the Los Angeles Fault System”, Bull. Seism. Soc. Am., Vol. 86, pp. 575 – 596.
Roten D., Fäh D., Bonuilla L.F., Alvarez-Rubio S., Weber T.M. and Laue J. [2009]. “Estimation of non-linear site response in a deep Alpine valley”. Geophys. J. Int, Vol. 178, pp. 1597-1613
Saenger E., Gold N. and Shapiro S. [2000]. “Modeling the propagation of elastic waves using a modified finite-difference grid”. Wave Motion, Vol. 31, pp. 77-82.
Satoh, T., H. Kawase, T. Sato, and A. Pitarka [2001]. “Three-Dimensional Finite-Difference Waveform Modeling of Strong Motions Observed in the Sendai Basin”, Japan, Bull. Seism. Soc. Am., Vol. 91, pp. 812 – 825.
Semblat J.-F.,Duval A.-M. et Dangla P. [2000]. « Numerical analysis of seismic wave amplification in Nice (France) and comparisons with experiments”. Soil Dynamics and Earthquake Engineering, Vol. 19, pp 347-362
Semblat J.-F., Kham M., Parara E. Bard P.-Y., Pitilakis K., Makra K. And Raptakis D. [2005]. “Seismic wave amplification : basin geometry vs soil layering”. Soil Dynamics and Earthquake Engineering, Vol. 25, pp 529-538.
Towhata I. and K. Ishihara [1985]. “Modeling soil behavior under principal axes rotation”, paper presented at the Fifth International Conference on Numerical Methods in Geomechanics, Nagoya, Japan. Pp 523–530.
Virieux J., 1986. P-SV wave propagation in heterogeneous media : velocity-stress finite-difference method. Geophysics, Vol. 51, No 4, pp 889-902.
Wu C., Peng Z. and Ben-Zion Y. [2010]. “Refined thereshold for non-linear ground motion and temporal changes of site response associated with medium-size earthquakes”. Bull. Seism. Soc. Am., Vol. 182, pp. 1567-1576.

11