Embed Size (px)
Citation preview

EFFECTS OF TRAINING IN MODIFYING WORK METHODS AND
BEHAVIORS DURING COMMON PATIENT HANDLING ACTIVITIES
Noris Torres
Thesis submitted to the Faculty of the
Virginia Polytechnic Institute and State University
in partial fulfillment of the requirements for the degree of
Master of Science
in
Industrial and Systems Engineering
Maury A. Nussbaum, PhD., Chair
Karl H. E. Kroemer, Dr. Ing.
Robert C. Williges, PhD.
September 11, 1998
Blacksburg, Virginia
Keywords: Patient handling, Training, Biomechanics, Ratings of Perceived Exertion

Effects of Training in Modifying Work Methods and Behaviors during common
Patient Handling Activities
Noris Torres
(ABSTRACT)
In a 1994 survey, on incidence rates of musculoskeletal injuries among private
industries within the U.S, nurses ranked first nationally. Patient handling tasks are
considered to be a precipitating factor in the development of many musculoskeletal
injuries. For many decades personnel training has been an intervention widely used for
the nursing back problem. Inconsistency regarding the effectiveness of many personnel
training programs, lack of controlled research among existing studies, and a primary
focus only on long term reduction of injury rates makes the interpretation of the success
of personnel training programs a difficult one. This study is based on the assumption
that, if a training program is to be effective as a means of reducing musculoskeletal
injuries, it must first modify worker behaviors and biomechanical stresses to a
measurable degree.
This research investigated the effects of training (Video and Lecture/Practice) on
modifying working behaviors and biomechanical stress. Two tasks were examined
(wheelchair to bed and lift up in bed) with two types of assistance (one-person or two-
person) and two levels of patient’s dependence (semi-dependent or dependent).
Changes in behaviors were examined immediately following training (1-2 days delay)
and after a short period of time (4-6 weeks) and evaluated using the criteria of subjective
ratings of exertion, and postural and biomechanical measures. Results indicated that
training led to several significant changes in the knee, hip, elbow and torso angles,
whole body, shoulders and low back RPE, shear forces and shoulder moments. No
differences were observed in these measures after a short period of time, suggesting
retention of the information presented during the training programs. Results as a whole
suggest that training can positively affect the working postures and biomechanical stress

during common patient handling tasks. All the postural changes and biomechanical
measures were advantageous in terms of reducing musculoskeletal stress. It was also
found that after a short period of time (4-6 weeks) still retained the information
presented during the training programs. Training using a combination of lecture and
practice in some cases achieved better results than Video-based training.

iv
To my beloved husband…
for your love and support

v
ACKNOWLEDGEMENTS
I would like to express my gratitude to Dr. Maury Nussbaum, Dr. Karl Kromer,
and Dr. Robert Williges who helped me throughout the completion of this research with
their support and technical expertise. Special thanks to Dr. Maury Nussbaum for his
advice, guidance, assistance and for your great job as chairman. My gratitude to my good
friends Dimaris Quiñones, Myra Blanco, Miguel Pérez, Deborah Rodríguez, and Edwin
Ayala and especially to Laura and Daddi for helping me in the execution of the study as
well as to my fellow graduate students. And to the person that helped me since the very
first moment that I arrived to Virginia Tech, Lovedia Cole thanks for your help and for
being so charming.
More important, to God for giving me the strength and capacity to reach this point
in my academic career. My love and thanks go to my family for their constant support
and love.
I would also like to express my gratitude to Mr. Michael Tatman, for his time and
unconditional help in the development of the training programs.
Finally, special thanks to a person who has been my best friend, who had always
support me in all things, who had helped me in getting my job done, who had encouraged
me to go on when things have gone wrong. My dearest thanks to my husband, Oscar,
because his support and love has been the reason and strength to reach my goals.

vi
TABLE OF CONTENTS
Abstract…………………………………………………………………………….…ii
Dedication………………………………………………………………………….…iv
Acknowledgements…………………………………………………………………...v
LIST OF FIGURES………………………………………………………………......ix
LIST OF TABLES……………………………………………………………………x
LIST OF APPENDICES…………………………………………………….……....xiii
CHAPTER 1. INTRODUCTION………………………………………………………. 1
1.1. Background…………………………………………………………………….. 1
1.2. Research Objectives……………………………………………………………. 4
CHAPTER 2. REVIEW OF LITERATURE…………………………………………... 6
2.1. Musculoskeletal Injuries and Stressful Work………………………………….. 6
2.1.1. Risk Factors…………………………………………………………….. 6
2.2. Nursing Personnel……………………………………………………………….8
2.2.1. Patient Handling as a Risk Factor for Musculoskeletal Disorders………9
2.3. Workplace Interventions to Control Musculoskeletal Disorders……………….10
2.3.1. Background……………………………………………………………..10
2.3.2. Personnel Training……………………………………………………...12
2.4. Instructional Media…………………………………………………………….. 14
2.5. Personnel Training Programs in the Nursing Profession………………….……17
2.6. Task Evaluation Methods………………………………………………….…... 19
2.6.1. Psychophysical Methods………………………………………………..19
2.6.2. Postural Evaluation Methods……………………………………….…..20
2.6.3. Biomechanical Models………………………………………………… 21
2.7. Summary of Previous Studies……………………….…………………….……22
2.7.1. Biomechanical Studies………………………………………………….22
2.7.2. Longitudinal Studies…………………………………………………… 24
2.7.3. Cross-sectional Studies………………………………………………… 25

vii
CHAPTER 3. EXPERIMENTAL METHOD………………………………………..27
3.1 Model of Injury Processes and the Influence of Training……………….….. 27
3.2 Experimental Goals…………………………………………………………. 28
3.3 Experimental Design………………………………………………………... 29
3.3.1 Independent Variables……………………………………………….. 31
3.3.2 Dependent Variables………………………………………………….33
3.3.3 Control Variables……………………………………………………..39
3.4 Participants………………………………………………………………….. 40
3.5 Apparatus and Materials…………………………………………………….. 41
3.6 Pilot Testing…………………………………………………………………. 42
3.7 Experimental Procedures………………………………………………….… 43
3.7.1 Pretest…………………………………………………………………43
3.7.2 Training……………………………………………………………….44
3.7.3 Posttest 1……………………………………………………………... 44
3.7.4 Posttest 2……………………………………………………………... 44
3.8 Data Analysis………………………………………………………………... 44
3.8.1 Biomechanical Model………………………………………………... 45
3.8.2 Statistical Analysis……………………………………………………49
3.8.3 Psychophysical Methods……………………………………………...50
CHAPTER 4. RESULTS…………..………………………………………………...51
4.1 Psychophysical Method: Ratings of Perceived Exertion……………………. 51
4.1.1 Pretest………………………………………...……………………….51
4.1.2 Posttest 1 – Pretest: Original Learning…………………………….… 52
4.1.3 Posttest 2 – Posttest 1: Retention……………………………………..54
4.2 Postural Measures…...………………………………………………………. 58
4.2.1 Pretest………………………………………………………………... 58
4.2.2 Posttest 1 – Pretest: Original Learning………………………………. 60
4.2.3 Posttest 2 – Posttest 1: Retention……………………………………..66
4.3 Biomechanical Measures…………………………………………………….. 68

viii
4.3.1 Pretest……………………………………………………………….. 68
4.3.2 Posttest 1 – Pretest: Original Learning………………………………. 70
4.3.3 Posttest 2 – Posttest 1: Retention……………………………………..75
CHAPTER 5. DISCUSSION………………………………………..……………… 80
5.1 Pretest……………………………………………………………………….. 81
5.2 Posttest 1 – Pretest: Original Learning………………………………………. 82
5.3 Posttest 2 – Posttest 1: Retention……………………………………………..85
5.4 Limitations of the study…………………………………………………….... 86
5.5 Recommendations and Future Research…………………………………….. 87
CHAPTER 6. CONCLUSION……………………..………………………………. 89
CHAPTER 7. REFERENCES………………………………..……………………... 90
Appendix A…………………………………………………………………………...96
Appendix B……………………………………………………………………….… 100
Appendix C……………………………………………………………………….… 105
Appendix D……………………………………………………………………….… 110
Vita………………………………………………………………………………….. 112
ix
LIST OF FIGURES
Figure 1. Model of injury process and the influence of training……..……..………. 27
Figure 2. Example of the 3D SSPP Task Input Summary report for one experimental
task (lift up in bed with one person)……………………………………… 35
Figure 3. Example of the 3D SSPP Analysis Summary, Joint Moments and Posture
output reports for one experimental task (lift up in bed task with one
person)……………………………………………………………………...36
Figure 4. Borg’s RPE Scale…………………………………………………………. 37
Figure 5. Borg’s CR-10 RPE Scale…………………………………………………. 38
Figure 6. Postural angles measured with the 3D SSPP software…………………. 39
Figure 7. Experimental setting……………………………………………………… 41
Figure 8. Experimental design………………………………………………………. 43
Figure 9. Positive sign convention for the fx and fy force components……………...46
Figure 10. 3D SSPP oblique view for the wheelchair to bed task with two person
assistance………………………………………………………………….48
Figure 11. Video edited printout for the wheelchair to bed task with two person
assistance………………………………………………………………….48
Figure 12. Possible directions of the dependent measures after a short period
of time………………………………………………………………….. 49
Figure 13. Differences between Posttest 1 and Pretest for the whole body RPE for the
Training effect…………………………………………………………….53
Figure 14. Differences between Posttest 1 and Pretest for the shoulders RPE for the
Training effect…………………………………………………………….53
Figure 15. Differences between Posttest 1 and Posttest 2 for the whole body RPE from
the Assistance x Training interaction……………………………………. 56
Figure 16. Differences between Posttest 1 and Posttest 2 for the shoulders RPE from
the Assistance x Training interaction……………………………………..56
Figure 17. Differences between Posttest 1 and Posttest 2 for the low back RPE from
the Assistance x Training interaction……………………………………57

x
Figure 18. Included Knee angle results for the three training groups during the Pretest
session……………………………………………………………………. 59
Figure 19. Differences between Posttest 1 and Pretest for the Training effect on the
Included knee angle……………………………………………………… 61
Figure 20. Differences between Posttest 1 and Pretest for the Training effect on the
Included elbow angle…………………………………………………….. 62
Figure 21. Differences between Posttest 1 and Pretest for the Task x Training
interaction on the Included Elbow angle………………………………… 62
Figure 22. Differences between Posttest 1 and Pretest for the Assistance x Training
interaction on the Included hip angle……………………………………..63
Figure 23. Differences between Posttest 1 and Pretest for the Assistance x Training
interaction on the Torso angle……………………………………………. 63
Figure 24. Shoulder moment results for the three training groups during the Pretest
session……………………………………………………………………. 69
Figure 25. Differences between Posttest 2 and Posttest 1 for the Training effect on the
Shear force……………………………………………………………….. 72
Figure 26. Differences between Posttest 2 and Posttest 1 for the Training effect on the
Shoulder moments………………………………………………………...72
Figure 27. Differences between Posttest 1 and Pretest for the Task x Dependence x
Training interaction on the L5/S1 shear force (semi-dependent
level)………………………………………...…………………………… 73
Figure 28. Differences between Posttest 1 and Pretest for the Task x Dependence x
Training interaction on the L5/S1 shear force (dependent
level)………………………………………..……………………………. 74
Figure 29. Differences between Posttest 2 and Posttest 1 for the Task x Training
interaction on the L5/S1 compressive force………………………………77
Figure 30. Differences between Posttest 2 and Posttest 1 for the Task x Training
interaction on the L5/S1 disc moments…………………………………...77
Figure 31. Differences between Posttest 2 and Posttest 1 for the Task x Training
interaction on the Shoulder moments………………………………….… 78
xi
LIST OF TABLES
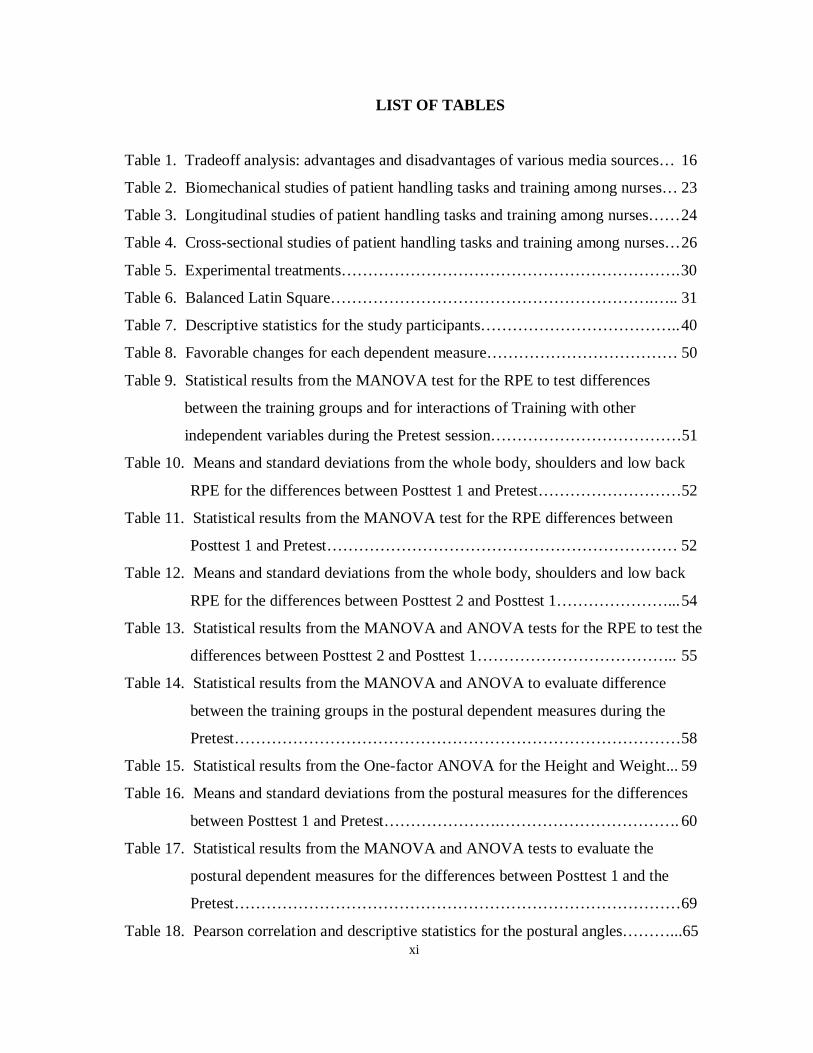
Table 1. Tradeoff analysis: advantages and disadvantages of various media sources… 16
Table 2. Biomechanical studies of patient handling tasks and training among nurses… 23
Table 3. Longitudinal studies of patient handling tasks and training among nurses……24
Table 4. Cross-sectional studies of patient handling tasks and training among nurses…26
Table 5. Experimental treatments……………………………………………………….30
Table 6. Balanced Latin Square…………………………………………………….….. 31
Table 7. Descriptive statistics for the study participants………………………………..40
Table 8. Favorable changes for each dependent measure……………………………… 50
Table 9. Statistical results from the MANOVA test for the RPE to test differences
between the training groups and for interactions of Training with other
independent variables during the Pretest session………………………………51
Table 10. Means and standard deviations from the whole body, shoulders and low back
RPE for the differences between Posttest 1 and Pretest………………………52
Table 11. Statistical results from the MANOVA test for the RPE differences between
Posttest 1 and Pretest………………………………………………………… 52
Table 12. Means and standard deviations from the whole body, shoulders and low back
RPE for the differences between Posttest 2 and Posttest 1…………………...54
Table 13. Statistical results from the MANOVA and ANOVA tests for the RPE to test the
differences between Posttest 2 and Posttest 1……………………………….. 55
Table 14. Statistical results from the MANOVA and ANOVA to evaluate difference
between the training groups in the postural dependent measures during the
Pretest…………………………………………………………………………58
Table 15. Statistical results from the One-factor ANOVA for the Height and Weight... 59
Table 16. Means and standard deviations from the postural measures for the differences
between Posttest 1 and Pretest………………….……………………………. 60
Table 17. Statistical results from the MANOVA and ANOVA tests to evaluate the
postural dependent measures for the differences between Posttest 1 and the
Pretest…………………………………………………………………………69
Table 18. Pearson correlation and descriptive statistics for the postural angles………...65

xii
Table 19. P-values from the ANOVA test main effects for the difference between Posttest
1 and Pretest…………………………………………………………………. 66
Table 20. Mean and standard deviation for the postural measures (differences between
Posttest 2 and Posttest 1)…………………………………………………….. 66
Table 21. Statistical results from the MANOVA and ANOVA to evaluate the postural
dependent measures for the difference between Posttest 2 and Posttest 1…... 67
Table 22. P-values from the ANOVA test for the Task factor for the difference between
Posttest 1 and Pretest………………………………………………………… 67
Table 23. Statistical results from the MANOVA and ANOVA tests to evaluate the
biomechanical dependent measures during the Pretest session……….….… 68
Table 24. P-values from the ANOVA test for the Task during the Pretest………….….70
Table 25. Mean and standard deviation for the biomechanical measures for the
differences between Posttest 1 and Pretest 1………………………………… 71
Table 26. Statistical results from the MANOVA and ANOVA tests to evaluate the
biomechanical measures for the difference between Posttest 1 and Pretest…72
Table 27. P-values from the ANOVA test for the significant main effects for the
difference between Posttest 1 and Pretest…………………………………….74
Table 28. Mean and standard deviation for the biomechanical measures for the difference
between Posttest 2 and Posttest 1……………………………………………..75
Table 29. Statistical results from the MANOVA and ANOVA tests to evaluate the
biomechanical measures for the difference between
Posttest 2 and Posttest 1………………………………………………………76
Table 30. P-values from the ANOVA test for the Task effect for the difference between
Posttest 1 and Posttest 2………………………………………………………79
Table 31. Comparison of significant results for the differences between Posttest 1 and
Pretest, and Posttest 2 and Posttest 1…………………………………….… 98

xiii
LIST OF APPENDICES
APPENDIX A………………………………………………………………………… 96
Outlines for the training topics……………………………………………….. 97
APPENDIX B………………………………………………………………………. 100
Procedures for wheelchair to bed transfer and lift patient up in bed………...101
APPPENDIX C……………………………………………………………………... 105
Health and History Questionnaire…………………………………………... 106
Informed Consent…………………………………………………..………..107
APPENDIX D………………………………………………………………………. 110
Borg’s CR-10 Rating of Perceived Exertion Scale…………………………..111
1
CHAPTER 1. INTRODUCTION
1.1. Background
Work related musculoskeletal disorders (MSDs) include disorders or injuries of
the back, trunk, upper extremities, neck, and lower extremities (Frymoyer, 1997). In the
U.S. it has been estimated that there are approximately 1.8 million disabling work related
injuries per year, 60,000 of which result in permanent impairment (Frymoyer, 1997). The
Bureau of Labor Statistics reported that musculoskeletal disorders accounted for the
majority of the occupational injuries and illnesses that resulted in work loss with an
estimated total cost of $13 billion per year (NIOSH, 1997). Musculoskeletal injuries
accounted for 76% of the workplace injuries, of which 47% involved the back, and 25%
involved the neck and upper limbs (NIOSH, 1997).
MSDs arise principally from forces and stresses within the human body as it
interacts with its immediate physical environment (Ayoub, Dempsey, and Karwowski,
1997). Specific force and stress levels are influenced by both workplace and personal risk
factors (key aspects associated with higher MSD incidence). Workplace risk factors
include: work shift, heavy physical work, heavy manual material handling, lifting,
bending, repetitive work, frequency and duration of a task, and dynamic work load
(Ayoub et al., 1997). Overexertion, particularly when associated with workplace risk
factors such as heavy material handling, lifting, carrying, pushing, and pulling is the
leading cause of injuries during manual material handling (NIOSH, 1997). Personal risk
factors include age, gender, anthropometry, musculoskeletal abnormalities, muscle
strength, physical fitness, psychosocial factors, smoking, and previous history of
musculoskeletal disorders (Ayoub et al., 1997; and Ryden, Molgaard, Bobbitt, and
Conway, 1989). Workplace risk factors are considered to be the principal and most
important cause for the majority of the MSDs in industry (Ryden et al.,1989). The
literature suggests that although both workplace and personal factors are key contributors
to higher incidences of MSDs, the former is the most significant source of MSDs.
Nurses are among the occupational groups with the highest incidence rates of
musculoskeletal injuries, especially those of the back (Cato, Olson, and Studer, 1989;
Garg, Owen, Beller, and Banaag, 1991a; Harber, Billet, Gutwski, SooHoo, Lew, and

2
Roman, 1985; Klein, Jensen, and Sanderson, 1984; Stubbs, Buckle, Hudson, Rivers, and
Worringham, 1983a; Troup, and Rauhala, 1987; Venning, Walter, and Stitt, 1987;
Videman, Rauhala, Asp, Lindstrom, Cedercreutz, Kamppi, Tola, and Troup, 1984; and
Winckelmolen, Landewwerd, and Drost, 1994). Nurses ranked first nationally (for the
year 1994) based on incidence rates among private industries within the U.S. (NIOSH,
1997). Patient handling tasks, which are considered here as a form of manual material
handling (MMH), involve many of the workplace factors associated with injury risk.
Since patients, as loads to be handled, may be characterized as being unpredictable (may
resist movement), having an undefined shape, and being dynamic loads, patient handling
tasks are considered a precipitating factor in the development of severe low back pain
(Corlett, Lloyd, Tarling, Troup, and Wright, 1994).
As an attempt to control high costs of MSDs, several intervention approaches have
been used in industry to reduce overexertion injuries. Particular attention, given the high
prevalence and cost, has been paid to upper extremity and low back injuries by
implementing workplace interventions. Workplace interventions generally follow one of
three major ergonomic approaches toward safer and more efficient MMH: personnel
selection, personnel training, and ergonomic job design (Kroemer, Kroemer, and
Kroemer-Elbert, 1994).
Personnel selection and personnel training are administrative interventions or
worker-directed approaches. The goal of personnel selection is to match the capacity of
the worker to the demands of the job while personnel training focuses on developing
specific material handling skills and informing the worker of the hazards of the job and
how to avoid them. Ergonomic job design is a workplace-directed approach that attempts
to fit the job to the worker.
For many decades personnel training has been an intervention widely used for the
nursing back problem. Some previous studies (Troup and Rauhala, 1987; Videman, et al.,
1989; and Wood, 1987) have supported that reduction of muskuloskeletal symptoms
among nurses may be achieved through the education and training of nursing personnel.
These studies have primarily examined ‘skills’, though this term has not been clearly
defined. Troup and Rauhala (1987), while analyzing patient handling tasks, observed
significant differences in the working postures of a trained and an untrained group of

3
nurses. Videman et al. (1989) reported that nurses who received education and training on
ergonomics and patient lifting techniques developed better patient handling skills
compared to nurses who did not receive the training condition. In addition, decreases in
injuries and lost time among nurses after the application of a training program have been
reported (Wood, 1987).
In contrast to these limited examples, some experts believe that training in proper
body mechanics and patient handling procedures has not been effective in reducing the
incidence of low back injuries. In a study of 4,000 workers who participated in a back
school training program, no reduction in the rate of low back injuries was reported after a
five year period (Daltroy, Iversen, Larson, Lew, Wright, Ryan, Zwerling, Fossel, and
Liang, 1997). Similarly, Lagerström and Hagberg (1997) reported no reduction of
musculoskeletal disorders in a group of nurses after participating in a training program
containing patient lifting techniques, physical fitness, and stress management. The
inconsistency of the results of many personnel training programs, and the lack of
controlled research among these studies, make very difficult the interpretation of the
success and effectiveness of personnel training programs.
A variety of assessment methodologies exist and have been used by researchers to
quantitatively or qualitatively evaluate nurses’ performance during patient handling
activities. The most common methodologies used are psychophysical, postural evaluation
and biomechanical models. The psychophysical methodology uses the worker’s
perception of workload, which is believed to be directly correlated to the degree of
physical strain on the human body (Borg, 1982). Evaluation of working postures to
identify the most frequent and potentially stressful job postures has also been used with
nursing as well as industrial work tasks. Biomechanical models are used to determine
musculoskeletal stresses on specific body regions; for instance, spinal forces during
manual handling activities (Chaffin and Andersson, 1991; and Garg, 1997).
Most studies related to training effectiveness have focused on long term reduction
in existing injury rates. Even though this must be the ultimate goal, the majority of the
available literature, rather than quantitatively measuring behavioral and biomechanical
changes during patient handling activities, has focused on qualitative measures. Further,

4
the type of training is often quite varied, failing to examine which methods and media are
adequate and optimal (Chaffin, Gallay, Woolley, and Kuciemba, 1986).
This study is based on the assumption that, if training is to be effective as a means
of reducing musculoskeletal injuries, it must first be able to modify worker behaviors and
biomechanical stresses to a measurable degree. It is the aim of this study to evaluate
whether and how instructional methods and media affect or modify task performance.
This study was focused on a particular set of relatively stressful tasks commonly
performed by nurses.
1.2. Research Objectives
The purpose of this research is to evaluate the potential effectiveness of different
types of training as interventions to alleviate musculoskeletal stress (specifically low back
and shoulder) associated with moving, lifting, and handling patients. This study
determined if training results in the short-term decrease of known injury risk factors
through changes in behaviors. The tasks investigated include transfer of a patient from a
wheelchair to a bed and lifting a patient up in bed. In addition to the type of training and
task, the level of dependence in a patient (dependent and semi-dependent) and lifting
assistance (one person and two person) are variables that were manipulated.
Each patient handling task was evaluated using the criteria of subjective rating of
exertion, working postures, and biomechanical loading. Ratings of perceived exertion
during patient handling tasks was assessed to evaluate the subjective perception of
physical stress in the whole body, shoulders, and low back. Working postures were
quantitatively evaluated to determine postural stress assumed at the beginning or at the
end of each task. The low back (L5/S1) compressive and shear forces, lumbar and
shoulder joint moments, and strength capabilities at the shoulders and torso were
estimated to evaluate the biomechanical stress during simulated patient handling tasks.

5
The experiment tested the following null hypotheses relating to data obtained
during the simulated patient transfer tasks:
Hypothesis #1: Biomechanical stress during patient-handling activities, specifically the
compressive and shear forces at the lumbrosacral disc, the lumbar and shoulder joint
moments, and the strength capabilities at the shoulders and torso, will not be affected by
the training program(s).
Hypothesis #2: Working postures, specifically the included hip, knee, elbow and torso
angles, and horizontal distances during patient handling activities will not be affected by
the training program(s).
Hypothesis #3: Whole body, shoulder, and low back ratings of perceived exertion during
patient handling activities will not be affected by the training program(s).

6
CHAPTER 2. REVIEW OF THE LITERATURE
2.1. Musculoskeletal Injuries and Stressful Work
Work related musculoskeletal disorders (MSDs) can be defined as any disease,
injury or trauma that affects the body’s soft tissues, including damage to the tendons,
tendon sheaths, muscles, and nerves of the hands, wrists, elbows, shoulders, neck and
back (Saldaña, 1996). In the U.S., work related MSDs are a major component of the cost
of work related illnesses and injuries, and results in work loss with an estimated total
direct cost of $13 billion annually (NIOSH, 1997).
The Bureau of Labor Statistics reported in their “Annual Survey of Occupational
Injuries and Illnesses” (from NIOSH, 1997) that injury and illness cases involving lost
days (approximately 705,800 cases or 32% of the total cases), and specifically resulting
from overexertion or repetitive motion, were principally caused by manual material
handling activities such as lifting, pulling, pushing, carrying and holding. NIOSH (1997)
reported that in 1994 lifting activities represented 367 thousand injuries, where 65%
affected the back. A total of nearly 100 thousand injuries were due to overexertion in
pushing/pulling activities, 52% affecting the back. Holding/carrying activities represented
70 thousand cases, where 58% affected the back. Of the total across these categories
nearly 50 thousand injuries affected the shoulders.
Back pain is by far the most prevalent and costly MSD among industries today
(NIOSH, 1997). Within the worker’s compensation system it has been estimated that the
total cost (direct and indirect costs) for low back pain could be as high as $35 billion each
year (Frymoyer, 1997). MSDs, especially those of the back and shoulders are a costly and
prevalent problem that is commonly induced by work related activities that are stressful
and repetitive. Their high incidence has forced the need to identify the risk factors that are
associated with them.
2.1.1 Risk Factors. Due to the prevalence and excessive costs associated with MSDs,
many studies of manual material handling (MMH) tasks have been done to identify risk
inducing factors (e.g. Marras, Lavender, Leurgans, Fathallah, Ferfuson, Allread, and
Rajulu, 1995). Risk factors associated with injuries during MMH are divided into two

7
main categories: 1) personal risk factors, and 2) workplace risk factors (Ayoub et al.,
1997).
Personal risk factors are characteristics of the worker that might contribute to the
probability that an injury occurs. These factors include age, gender, anthropometry
(height and weight), physical fitness and training, previous medical history, and smoking
among others (Chaffin and Andersson, 1991; and Waters and Putz-Andersson, 1997).
Some of the more important risk factors and possible reasons for their association with
injury risk are as follows.
1) Age: muscle strength appears to be greatest in the late 20’s and early 30’s and
declines thereafter.
2) Gender: women on average are weaker than men. Gender differences reported
in population strength data, however, are almost entirely explained by
differences in muscle size, as estimated by either the person’s fat-free body
weight or cross sectional area dimensions.
3) Anthropometry: body weight and height have been correlated with muscle
static strength.
Workplace risk factors probably are the most important because they are directly
related with the physical hazards to the worker (Waters and Putz-Andersson, 1997). The
more important job related risk factors and possible reasons for their association with
injury risk associated with manual material handling of loads are (Ayoub et al., 1997; and
Garg, 1997):
1) Horizontal and vertical location of the load relative to the worker: with an
increase in horizontal distance the external joint loads will increase, and
workers will use a larger proportion of their strength capability.
2) Distance load is to be moved: increased travel distance results in reduced
strength and higher energy expenditures.
3) Frequency and duration of the task: as the frequency of lifting increases,
metabolic demands are higher, and the onset of physical fatigue is more rapid.
4) Weight and size of the load: the weight of the load can affect the required
strength, and postural stress and metabolic demands.

8
These risk factors are also assumed to apply to patient handling tasks performed by
nurses since these tasks are similar to industrial material handling tasks. Patient handling,
like MMH, involves the acts of lifting, carrying, pushing, pulling, and holding.
2.2. Nursing Personnel
Available literature supports the premise that nursing professionals are at great risk
of suffering back injuries (Cato, et al., 1989; Garg, et al., 1991a; Harber, et al., 1985;
Klein, et al., 1984; Stubbs, et al., 1983a; Troup, and Rauhala, 1987; Venning, et al., 1987;
Videman et al, 1984; and Winckelmolen, et al., 1994). NIOSH (1997) established that the
nursing profession, which ranked first nationally (during 1994) in terms of the incidence
of musculoskeletal injuries, have rates of overexertion disorders four times higher (40
thousand cases) than the average rate among all private industries. Harber et al. (1985),
based on results from a questionnaire administered to 550 nurses in a California hospital,
reported that 58% of the nurses had suffered some degree of low back pain due to work
related activities sometime during the previous six months. Also, 44% of the nurses
reported having developed back pain at work at least once during the two-week study
period. Twenty nine percent of the nurses took medication for their back pain, and 9%
missed work.
In another study, Cato et al. (1989) reported that 72% of the nurses stated they had
experienced low back pain (LBP). Fifty three percent of the respondents experienced
LBP within the six months prior to the study; 62% of these cases were associated with the
current working environment. Dehlin, Hedenrud, and Horal (1976) reported that 46.8% of
the Swedish nursing aides in a geriatric hospital had low back pain symptoms. A
recurrence of these symptoms appeared in 82% of the subjects.
A survey developed by Venning et al. (1987) was performed to identify potential
factors that may affect the incidence rate of occupational back pain among nursing
personnel. Job related factors, rather than personal characteristics, were found to be major
predictors of back injuries. Job related factors such as service area, lifting, and job
categories were found to be significant predictors of back injury. The major personal
factor that contributed to the development of back injuries was previous medical history of
back pain or injury. It was also reported that 60% of the injuries (in 204 events) were low

9
back injuries, 16% neck injuries, and 18% upper back injuries. These injuries were
observed during a one-year period in 199 subjects.
2.2.1. Patient Handling as a Risk Factor for Musculoskeletal Disorders. Nurses have
attributed the onset of LBP to their patient handling activities (Cato et al., 1989; Harber et
al., 1985; Jensen, 1985; Owen and Garg, 1989). About 40% of all back pain episodes and
75% of compensable back injuries appear to be related to lifting, transfer or movement of
patients (Fragala, 1997). Out of the literature available, six major studies have been
selected and are introduced next. These studies addressed patient handling as a
precipitating factor in the development of LBP.
Stubbs et al. (1983a) administered a survey to 3,912 British nurses and reported
that 15.9% of all cases and 13% of the new cases of back pain complaints were associated
with patient handling tasks. A second study, by Jensen (1985), reported that the
prevalence rate of back injuries among nurses who are considered frequent patient
handlers was 3.7 times greater than the prevalence rate among infrequent patient handlers.
A questionnaire administered in a large U.S. hospital helped identify which
nursing activities were the most common causes of back pain (Harber et al., 1985). Forty
eight percent of the nurses rated lifting a patient in bed as an activity causing back pain;
helping a patient out of bed (30%) and lifting a patient from bed to bed (22%) were also
commonly reported. Another questionnaire study by Cato et al. (1989) reported that
lifting a patient in bed was most often (24%) rated by the staff to be the primary reason for
LBP. Other causes included turning a patient (12%), one person transfer (19%), and two
person transfer (9%). A study by Owen and Garg (1989), in a nursing care facility in
Wisconsin, U.S., tried to determine the patient handling tasks perceived as most stressful
among 57 nursing assistants. The top 5 patient handling tasks perceived by nurses as most
stressful were: transferring patient from wheelchair to toilet and toilet to wheelchair,
transferring patient from wheelchair to bed and bed to wheelchair, and lifting a patient up
in bed.
It has been suggested that the main reasons why patient handling is a physically
demanding activity and may precipitate low back pain involve the fact that patients may
be uncooperative, unpredictable (may resist movement), and they might have an uneven

10
and heavy weight that may move during patient transfers (Corlett et al., 1994).
Furthermore, the level of physical dependency of the patients and their need for nursing
care constitute additional significant contributors toward patient handling risks (Corlett et
al., 1994). Constraints in the working environment such as equipment interference,
unadjustable beds, and inadequate space also make the job difficult (Hellsing, Linton,
Andershed, Bergam, and Liew, 1993).
Patient handling by manual transferring or lifting, by using assistive devices (such
as gait belts, and draw sheets), or by employing hoists are the three methods by which
patient handling tasks are typically done (Garg et al., 1991a). The selection and use of
these methods are based on nurses’ preference, custom, and experience (Winkelmolen et
al., 1994). It is important to highlight the difference between a transfer and a lift during
patient handling activities. Transfer or transferring refers generally to actions in which the
movement is mainly horizontal though there may be a vertical component. Lift or lifting
refers to the action of raising vertically or to actions in which vertical displacement is the
dominant feature (Corlett et al., 1992).
2.3. Workplace Interventions to Control Musculoskeletal Disorders (MSDs)
2.3.1. Background. Given the magnitude and severity of MSDs, several workplace
intervention programs have been used to reduce or prevent musculoskeletal injuries.
These usually are classified as engineering and administrative controls (Waters and Putz-
Anderson, 1996).
Engineering controls are workplace-directed approaches that rely on changes in
the work to eliminate or minimize the physical stresses associated with manual material
handling (Waters and Putz-Anderson, 1996). These controls include elimination of
manual handling through automation or reduction of the amount of physical exertion
required to perform the task by using mechanical aids, or job modification. Automation is
recommended when the work requires high physical demands or is highly repetitive, and
is best suited for the design of new work processes (Waters and Putz-Anderson, 1996).
The main disadvantage of automation is that it may require a large capital investment. In
cases where automation is not practical or feasible (such as in patient handling tasks),
mechanical aids or assistive devices can be used to reduce the extent of physical stress of

11
a task. The use of assistive devices and hoists for patient-handling tasks may be helpful in
reducing back stress among nurses, yet they are infrequently used due to the excessive
time it takes to operate the sometimes sophisticated hoists (Garg and Owen, 1992). In
addition, neither assistive devices nor hoists are readily available to all nurses. Finally,
the use of mechanical devices to transfer patients has not necessarily been perceived by
nurses as less stressful nor more comfortable for patients (Garg and Owen, 1992).
However, in situations where none of the two previous engineering controls are
appropriate, job modification through ergonomic design is an alternative that attempts to
fit the job to the worker by reducing the job’s physical demands. Ergonomic design can
be accomplished by modifying the job layout or implementing procedures to reduce
bending, twisting, heavy lifting and repetitive motions among other stressful activities
(Garg, 1997).
Administrative interventions are worker-directed approaches that attempt to
maintain a match between the worker’s capacity and the demands of the job (Waters and
Putz-Anderson, 1996). Job rotation, job enlargement, personnel selection, and personnel
training are among the most common work practices used as administrative interventions
(Goldenhar and Schutle, 1994). The goal of job rotation is to reduce the constant
exposure to physically stressful tasks by, for example, rotating workers through different
workstations or tasks. Likewise, the adverse influences of low job content that creates
repetition and boredom can be balanced through job enlargement that introduces task
variety (Waters and Putz-Anderson, 1996). Personnel selection (or screening of worker)
attempts to match individual capabilities with the job demand by way of assessing
worker’s attributes (e.g. strength). This approach relies on the assessment of one or more
physical characteristics of the worker to select specific workers for certain manual
material handling jobs (Kroemer, 1992).
Finally, personnel training has been identified as an administrative solution to
minimize the exposure of workers to occupational hazards. The purpose of training is to
ensure that employees are sufficiently informed about the hazards to which they may be
exposed and thus be able to apply correct procedures to avoid them (Nordin, 1997).
Training in safe manual material handling is based on the belief that people can safely

12
handle greater loads when they perform the task correctly (Waters and Putz-Anderson,
1996).
2.3.2. Personnel Training. For many decades, personnel training has been an
administrative intervention widely used for the nursing back problem. Several researchers
(Takala and Kukkonen, 1987; Lagerström, and Hagberg, 1997; Videman, et al., 1989; and
Wood, 1987) have suggested that training in proper patient handling techniques, and
education on ergonomics, develops higher handling skills among nurses, and prevents
injuries. Several training methods used to reduce and prevent LBP have been categorized
in the literature as back injury prevention programs. The most common prevention
programs include back schools, fitness training, and education and training in proper
lifting techniques.
Even though back schools can be traced to the late 1950s, it was not until the
1980s that they became a popular intervention to rehabilitate back-injured patients
(Kroemer, et al, 1994). A typical back school program educates the worker on anatomy,
the structure and function of the spine, lifting techniques, ergonomics and biomechanics,
pain control, relaxation, nutrition, weight control, and personal responsibilities within
work related activities (Kroemer, et al., 1994). It may also provide information on stress
management and basic exercises.
Several studies have been performed to assess the impact of back schools. In a
recent review, Karas and Conrad (1996) surveyed literature related to back schools
programs, two of which are discussed next. Brown (1992) introduced a back school
program among 140 municipality workers. The results showed a reduction in back injury
rates but there was no change in the total cost for compensable back injuries. Galka
(1991) also reported a reduction in back injury rates among the nursing staff of a veteran
hospital following a training program. In another back school intervention study of 1,500
employees of eight different industries, a 40% reduction in lost workdays in the year
following the training program was observed (Goldenhar and Schulte, 1994). However,
an increase in the number of back injuries was reported and attributed to the newly
positive attitude of management and among employees to report injuries. The lack of
control groups within these studies puts into question the success of these programs

13
(Goldenhar and Schulte, 1994). The inconsistency of the results and the need of
controlled research make the interpretation of the success and effectiveness of back
schools very difficult.
Fitness training programs emphasize factors such as musculoskeletal strength,
aerobic capacity, endurance and flexibility (Kroemer, 1992). This training approach
includes topics on fitness, body mechanics, exercises, ways to prevent backache, weight
control, stress management, and nutrition (Appenzeller and Atkinson, 1981). It is widely
believed that improved physical fitness among workers would be associated with a
reduction in overexertion and thus low back pain (Garg, 1997). Some investigators have
reported that physical fitness has a significant effect on musculoskeletal injuries while
others have found that physical fitness and training have little or no effect in preventing
musculoskeletal injuries.
The work most frequently cited to support the premise that strong workers with a
high fitness level are at lower risk of suffering back injuries was provided by Cady,
Bischoff, O’Connell, Thomas, and Allan (1979). The study classified a group of
firefighters from California as most fit, middle fit, and least fit. In their results, 0.8% of
the most fit, 3.2% of the middle fit, and 7.1% of the least fit, experienced LBP. In
contrast, Hilyer, Brown, Sirles, and Peoples (1990) reported no significant difference in
the injury rate in a fitness training program applied to 469 firefighters. Another study
(Feldstein, Valanis, Vollmer, Stevens, and Overton, 1983) found no within group
differences between nurses and orderlies based on the results obtained after fitness
training was used to decrease back injuries.
Another way to reduce the risk of a back injury is through the training of the
workers on proper lifting, and transferring techniques. Training in safe handling is a
commonly used approach in the prevention of musculoskeletal injuries among manual
material handling activities (Authier, Lortie, and Gagnon, 1996). A training program on
lifting techniques is comprised of two major components: training on proper lifting
techniques and education on body mechanics. The program typically includes topics such
as 1) anatomy and physiology, 2) biomechanics and ergonomics, 3) injury prevention
methods, 4) stress and pain management, and 5) lifting techniques specifics to the job
(Hellsing et al., 1993; and Troup and Raulaha, 1987).

14
Researchers (Dehlin et al., 1976; Stubbs et al., 1983b; Wood, 1987; and Venning,
1988) have suggested that the traditional training on proper lifting techniques should not
be relied upon as the only component of an intervention program. As noted above,
preventing injuries by increasing knowledge of the body, ergonomics, biomechanics and
promoting attitude changes has been seen as an essential part of a training program on
lifting techniques (Troup and Rauhala, 1987). Training program can help employees
become aware of the risk factors for LBP. Finally, it is believed that education increases
safe behavior in work practices (King, Fisher, and Garg, 1997).
Available reports in the literature suggest that some existing training programs
show little effectiveness in reducing the incidence of injuries while some are successful in
reducing the number of back injuries. There is, in addition, a lack of agreement about the
best ways to train people to lift using methods that reduce back injuries, and even about
whether lifting behavior may be improved by training. St-Vincent, Tellier, and Lortie
(1989) speculate whether training is ineffective because the methods are never put into
practice or because methods themselves are inadequate. However, in order to properly
assess training as an administrative intervention to prevent LBP it is necessary to focus
not only on the results but on the media used to provide the training since the overall
results will be a function of what is being taught and how it is being taught. The
following section describes some of the alternate methods that can be used to introduce
both the practical and the educational components of a training program.
2.4. Instructional Media
The differences in learning outcomes are reflected by the type of media used to
deliver instruction in a training program. The type of instructional media must be based
on the skills to be taught and the availability of personnel and materials (Dick and Carey,
1996).
Special attention must be placed on psychomotor skills since patient handling tasks
are classified as such. The main characteristic describing a psychomotor or motor skill is
that the learner must execute muscular actions, with or without equipment, to achieve
specified results (Dick and Carey, 1996). The most efficient representation of the skill is
by visual instruction. Video or films can be used to capture movement, but often photos

15
or drawings are used. Practice and feedback are the hallmarks of psychomotor skills.
Practice of a skill should lead to mastery. Immediate feedback on the correctness of the
execution of the skill is important, since incorrect rehearsal will not promote skill
improvement (Dick and Carey, 1996). Also, simulators or equipment should be used for
teaching such skill to simulate the real physical environment.
The availability of a media can be expressed as its practicality. It is important to
consider if a suggested media will be available to the learner and the instructor. For
example, if a training program is to be designed for a community center, it is likely that
equipment such as projectors, video cassette recorders, etc. will not be available. A
related concern is the ability of the teacher to manage the selected media. The final factor
is the cost-effectiveness of a media when compared to others. For example, it might be
cheaper to videotape a lecture to view again and again as needed, than having an
instructor to work with the group as needed. Although the type of skill and the
practicality of a media influence the media selection process, it is important to evaluate
the advantages and disadvantages of each instructional media considered. Then, a trade-
off analysis can be performed to select the most appropriate media.
One of the most frequently used instructional media is the lecture method.
Lectures as well as videos are criticized for their one-way communication resulting in
passive learners that do not have the opportunity to clarify material (Goldstein, 1993).
During demonstrations learners are able to clarify material and practice sessions can be
included. Table 1 shows some advantages and disadvantages of these and other media
that can be applied to teaching and learning motor skills (i.e., patient handling tasks).

16
Table 1. Trade-off analysis: advantages and disadvantages of various media sources
(Adapted from Goldstein, 1993; and Andre and Schopper, 1997)
Media Advantages Disadvantages
Lecture
• Presents facts and ideas rapidly• Emphasis placed where teacher
wishes• Excellent for background
information• Can be interrupted by requests
for more detail• Teacher controls content and
sequencing
• One way communication• Difficult to adjust to
individual speed ofcomprehension
• Difficult to maintainattention
• Effectiveness depends onskill and personality
Demonstration/Hands-on Practice
• Saves time and talk• Helps assure understanding• Demonstration provides model
and standards for learnerperformance
• Gives learner confidence whenhe or she performs better
• Easier to watch a procedurethan to listen to verbaldescription
• Requires preparation foreffective demonstration
• May require expensiveequipment and personnel
• Frequent rehearsal neededto maintain demonstration
Video
• Large amount of visualinformation
• Allows motion and more threedimensional processes to bedescribed easily
• Costly to produce• Can look very bad with
inadequate equipment
Photos
• Can require little hardware• Shows hard to explain material
• Can be difficult toproduce
• Photos may look bad• Can be hardware intensive
Text
• Low cost• Can be combined with lecture
methods• Large amount of information• Relatively easy and cheap to
produce• Easily memorized
• Not visually attractive• Can bore user• Description of procedural
information getscomplicated

17
2.5. Personnel Training Programs in the Nursing Profession
This section summarizes seven studies that aimed to evaluate the effectiveness of
personnel training programs among nurses performing patient handling activities.
Although most of the studies did not specify the type of training used, some of the studies
were classified by the investigators as back schools programs and educational training
programs.
• Stubbs et al. (1983b) studied eight patient handling tasks to investigate the
effectiveness of teaching one and two person lifting techniques. Except for the task of
turning a patient on bed, all other tasks observed showed a reduction in intraabdominal
pressure (IAP) following training. Although controversial, some hypothesize that IAP
may protect the spine during heavy lifting. It is generally agreed, however, that this
protection is of small magnitude. Regardless, the study failed to prove a relationship
between time spent receiving training in handling techniques and the prevalence of
back pain.
• Troup and Rauhala (1987) studied the effects of introducing ergonomics and
biomechanical concepts in a nursing school program. As a result, significant
differences in working performance were found between handling ‘skills’ of the
trained and control groups of student nurses. The term ‘skills’ was not clearly defined.
• Wood (1987) used a back school program in an attempt to reduce back injuries.
Although there was a decrease in injuries and lost time, the effect was not significant.
Unfortunately, the first part of the study (a personnel program) prevented the
determination of which program had the greatest effect on the overall reduction of
back injuries.
• An observational methodology was used by St-Vincent et al. (1989) to evaluate the
methods taught in a 12-hour training program. The observational methodology
consisted of analyzing the vertical (i.e. lifting a patient up in bed) and horizontal
components (i.e. tasks carried out of bed) of several patient transferring tasks. The
results showed that the use of taught principles depended upon the type of patient

18
handling carried out. Mainly because of physical constraints, the methods suggested
during the training could not always be applied.
• Videman et al. (1989) reported that after training on patient handling for 40 hours the
trained group had higher patient handling skills than the control group. These results
were measured by observing subjects performing the patient handling tasks and
assessing their performance (using a 7-point scale). A reduction of incidences of LBP
in the trained group, when compared to the control group of nursing’ students, was
observed. The difference between these two groups was not significant.
• Hellsing et al. (1993) evaluated the effects of incorporating ergonomics as part of a
nursing program. Nursing students received an average of two hours of ergonomic
lectures per week during the two-year program and an intensive 3-day course on
patient handling techniques. Fifty-two nursing students were surveyed about their
attitudes and behaviors before, half way, and after receiving the training program. The
experimental group had better working postures than the control group (judged by the
investigators) and was more pleased with their education.
• In a recent study, Lagerström and Hagberg (1997) evaluated an education and training
program comprised of: 1) patient transfer techniques, 2) physical fitness exercise, and
3) stress management. A total of 348 nurses participated in the program during the 3-
year study period. Although 90% of the participants felt positive about the training
program, and 93% of the nurses actually used the techniques taught a reduction in
musculoskeletal disorders was not observed.
All of these studies have focused on reducing back injury rates in a long-term
basis, neglecting, however, changes in behavior in either short or long term. Other studies
have failed to isolate the effects of the training program when they are used in
combination with other intervention approaches. Moreover, the lack of agreement among
these studies may compromise the validity of these results (Goldenhar and Schulte, 1994).

19
2.6. Task Evaluation Methods
A variety of analytic tools are available for the evaluation of manual material
handling tasks in response to the need to reduce overexertion injuries. Among these tools,
three basic task evaluation methods have been widely used to assess manual lifting tasks
such as those performed during nursing activities. These are: psychophysical, postural
evaluation methods and biomechanical models.
2.6.1. Psychophysical Methods. Psychophysical methods assess the degree of subjective
physical strain on the human body based on the assumption that people perceive relative
physical stress levels (Borg, 1982). Several studies have sought to determine lifting
capacities based on subjective perception of exertion (e.g. Karwowski, 1991). Perceived
effort depends not only on the intensity of physical work performed but also on the
duration of the work (Gambergale, 1985). As previously reviewed, there are several
physical factors known to be associated with MSD risk. Psychophysical methods allow
for the simultaneous evaluation of the combined effects of different physical stressors
(Krawczyk, 1996). Psychophysical ratings are believed to result from an integration of
various information by the central nervous system, including the many signals elicited
from the peripheral working muscles and joints, and from the cardiovascular and
respiratory systems (Krawczyk, 1996). All of these signals, perceptions and experience
are combined to form a subjective response to workload.
Psychophysical approaches are based on the subjective judgement of physical
work, which are typically measured through the use of self reporting techniques such as
rating scales. Borg’s Rate of Perceived Exertion Scale (RPE Scale) has been identified by
many researchers as an useful tool to evaluate the perceived exertion of workload in
patient handling tasks (Garg et al., 1991a; Garg et al., 1991b; Garg and Owen, 1992;
Owen and Garg, 1989; and Winkelmolen et al., 1994). Garg et al. (1991b) reported that
when comparing pulling and lifting techniques to move patients the perceived stress
ratings for the whole body, the shoulder, the upper back, and the lower back were
significantly lower for the pulling than for the lifting techniques. The greatest amount of
exertion was felt in the lower back. Similarly, in a survey of nursing assistants, the tasks
that involved lifting and transferring patients received the highest ratings of perceived
20
exertion for the shoulder, upper back, lower back, and whole body (Owen and Garg,
1989). Garg and Owen (1992) used Borg’s scale to demonstrate how the ratings of
perceived exertion were affected by the working units, devices, the patient handling tasks,
and the whole body, shoulders, lower back and upper back before and after implementing
an ergonomic intervention. The wheelchair to bathtub transfer received the highest rating
for the lower back. No significant differences in the rating of perceived exertion between
the units and the devices used were found. In general, the ratings of perceived exertion
for the patient handling tasks were significantly reduced after the intervention.
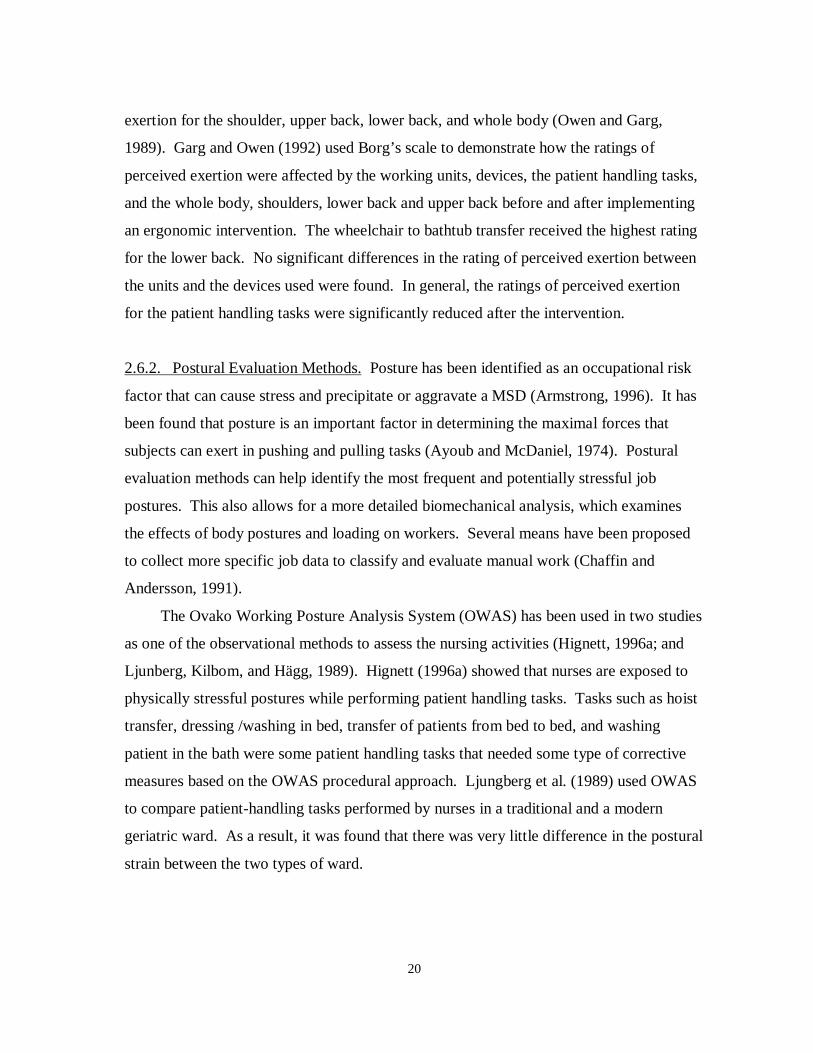
2.6.2. Postural Evaluation Methods. Posture has been identified as an occupational risk
factor that can cause stress and precipitate or aggravate a MSD (Armstrong, 1996). It has
been found that posture is an important factor in determining the maximal forces that
subjects can exert in pushing and pulling tasks (Ayoub and McDaniel, 1974). Postural
evaluation methods can help identify the most frequent and potentially stressful job
postures. This also allows for a more detailed biomechanical analysis, which examines
the effects of body postures and loading on workers. Several means have been proposed
to collect more specific job data to classify and evaluate manual work (Chaffin and
Andersson, 1991).
The Ovako Working Posture Analysis System (OWAS) has been used in two studies
as one of the observational methods to assess the nursing activities (Hignett, 1996a; and
Ljunberg, Kilbom, and Hägg, 1989). Hignett (1996a) showed that nurses are exposed to
physically stressful postures while performing patient handling tasks. Tasks such as hoist
transfer, dressing /washing in bed, transfer of patients from bed to bed, and washing
patient in the bath were some patient handling tasks that needed some type of corrective
measures based on the OWAS procedural approach. Ljungberg et al. (1989) used OWAS
to compare patient-handling tasks performed by nurses in a traditional and a modern
geriatric ward. As a result, it was found that there was very little difference in the postural
strain between the two types of ward.

21
2.6.3. Biomechanical Models. Biomechanical models are frequently reported as methods
to estimate forces exerted on tissues of the musculoskeletal system and how body joints
are strained during work. As an example, spinal stress is often quantified in manual
material handling activities. These models are based on the analysis of forces and torques
acting on the body during a given physical activity (Baker and Atha, 1994). The
estimated forces can be compared to predetermined tissue tolerance limits to assess the
biomechanical stress associated with specific loading conditions (Ayoub and Karwowski,
1997). Therefore, the goals of a biomechanical model are to help define exertion limits so
that excessive stresses on the components of the musculoskeletal system can be avoided
and to predict whether someone is likely to suffer an injury during a task (Chaffin, Herrin,
Keyserling, and Garg, 1977).
Biomechanical models have been used to determine spinal stress in the nursing
profession (Garg et al., 1991a; Garg and Owen, 1992; Ulin, Patellos, Chaffin, Blitz,
Emerick, Lundy, and Misher, 1997; and Winckelmolen et al., 1994). The results from
these four reports show how static biomechanical models can be used to measure physical
stress for specific postures. A biomechanical model was used by Garg et al. (1991a) as
one of the methods to evaluate different patient handling tasks requiring lifting and pulling
techniques. Compressive and shear forces at the L5/S1 disc were higher for the lifting
techniques than for the pulling techniques.
In a similar study performed at a nursing home, Garg and Owen (1992) evaluated
the physical demands required to perform patient handling tasks before and after an
ergonomic intervention. A biomechanical model (3D SSPP™) was used to compute the
mean compressive force on the L5/S1 disc, hand force required, and strength requirement.
It was found that the ergonomic intervention was effective in reducing back injuries.
Ulin et al. (1997) analyzed six patient transfer techniques completed by two nurses
to transfer dependent patients. The 3D SSPP™ was used to compute the peak
compressive forces on the L5/S1 disc and to estimate the percentage of the population
able to transfer patients based on their strength capabilities. The results of the
biomechanical analysis showed that compressive forces at the L5/S1 disc exceeded the
NIOSH recommended limit, except when using a mechanical lift.

22
Winkelmolen et al. (1994) evaluated five two-person manual lifting techniques to
determine the amount of physical exertion required by the nurses as well as spinal stress.
The compressive forces at the L5/S1 disc were assessed by means of a static
biomechanical program. In almost all situations the compressive force on the nurse’s
spine exceeded the NIOSH recommended limit.
2.7. Summary of Previous Studies
The following tables (Tables 2-4) summarize all the studies previously discussed.
It is a comprehensive review of the literature found to be relevant to handling tasks and
training programs associated with the nursing profession. Each study was classified as a
biomechanical, epidemiological or observational study based on the type of dependent
measure used. Most studies had multiple dependent measures, but the measure given the
most emphasis was used to classify the study. The elements examined in each of the
studies were: author and year of publication, sample size, population characteristics, study
period, dependent variables, independent variables, results, and conclusions.
Sample sizes ranged from six to twelve among the biomechanical studies,
epidemiological studies from 38 to 4,000, and observational studies from 26 to 5,649.
The mean age of participants among all studies ranged from 18 to 41 years. The study
durations ranged from 1 month to 5.5 years; some authors did not specify the exact
duration of their studies. Volunteers as well as experienced nurses have being involved.
2.7.1. Biomechanical Studies. Biomechanical studies (Table 2) have used several
biomechanical models to measure the compressive forces acting at the L5/S1 disc. These
studies have evaluated how different manual lifting techniques, and mechanical hoists
affect the physical stress on the back. The relative stress during patient handling tasks has
often been estimated using compressive forces on the L5/S1 disc in conjunction with the
perceived exertion. It can be concluded from the different studies that those techniques
learned from written instructions only and performed by one person are the ones that
generate the highest compressive force on the L5/S1 disc, more so if the patient is heavy.
In addition, it was determined that among manual lifting techniques and mechanical
hoists, it was the former one that exerted the most physical stress on the back. This was

23
not the case for all situations, and patients did not always feel secure or comfortable with
the hoists.
Table 2. Biomechanical studies of patient handling tasks and training among nurses
AuthorPopulation,Sample size
Dependentvariables
Independentvariables
Results/Conclusion
Baker and Atha,1994
VolunteersAge range: 18-40 yrs.N=12
Spinalcompression atL5/S1; Videoanalysis; RPE.
3 levels of training:written instructions,interactive personalinstruction, and notraining.
The volunteers thatparticipated in the trainingusing written instructions hadhigher compressive forces.Training should be performedon an interactive basis.
Garg et al,1991a
VolunteersAge: ?N=6
Compressiveforce at theL5/S1 disc;RPE; Comfortand securityratings
5 manual liftingtechniques and 3mechanical aids; 1or 2 person lifts;Task: bed-wheelchair andwheelchair-bed.
Compressive forces at L5/S1in one-person techniqueswere higher but notstatistically significant.Hoists had worstbiomechanical and subjectiveeffects.
Garg et al,1991b
Volunteers served asnursesAge: ?N=6
Compressiveforce on theL5/S1 disc;Comfortratings; RPE.
5 manual liftingtechniques and 3mechanical aids; 1or 2 person lifts;Tasks: wheelchair-showerchair, andviceversa.
Manual lifting techniques hadhigher compressive forcesthan mechanical hoists.Showerchair to wheelchairwas more stressful thanwheelchair to showerchair.
Garg andOwen, 1992
Nursing assistantsAverage age: 33 yrsN=38Patient: 62 kg
Compressiveforce onL5/S1; RPE;perform. time,comfortratings.
Manual techniques;Patients: dependent(weight bearing &non-weight bearing)and independent;Training:2 sessions.
Ergonomic intervention iseffective. Gait belt is betterfor light patients and hoistsfor heavy patients. The lowback was the body part moststressed for walking belt andthe use of the hoist.
Ulin et al, 1997 NursesAge range: 32 –39 yrsN=2
Compressiveforces at L5/S1using 3D-SSPP, andforce gauge;VideoAnalysis, andRPE, (Borg20)
Heavy and lightpatients; 6 transfermethods (3 manual,and 3 mechanical);Task: bed-to-wheelchair; Heavyand light weightnurse.
Higher compressive forceswhen moving heavy patientand when using manualtechniques.
24
AuthorPopulation,Sample size
Dependentvariables
Independentvariables
Results/Conclusion
Winkelmolen etal, 1994
UnexperiencedvolunteersN=10
Compressiveforce on theL5/S1 disc;Videoanalysis; RPE.
Patients: heavy (75kg) and light (55kg); 5 manual liftingtechniques.
Australian lift had the lowestcompressive forces.Significant differencebetween the techniques as tocompressive force whenlifting the 55 kg patient.
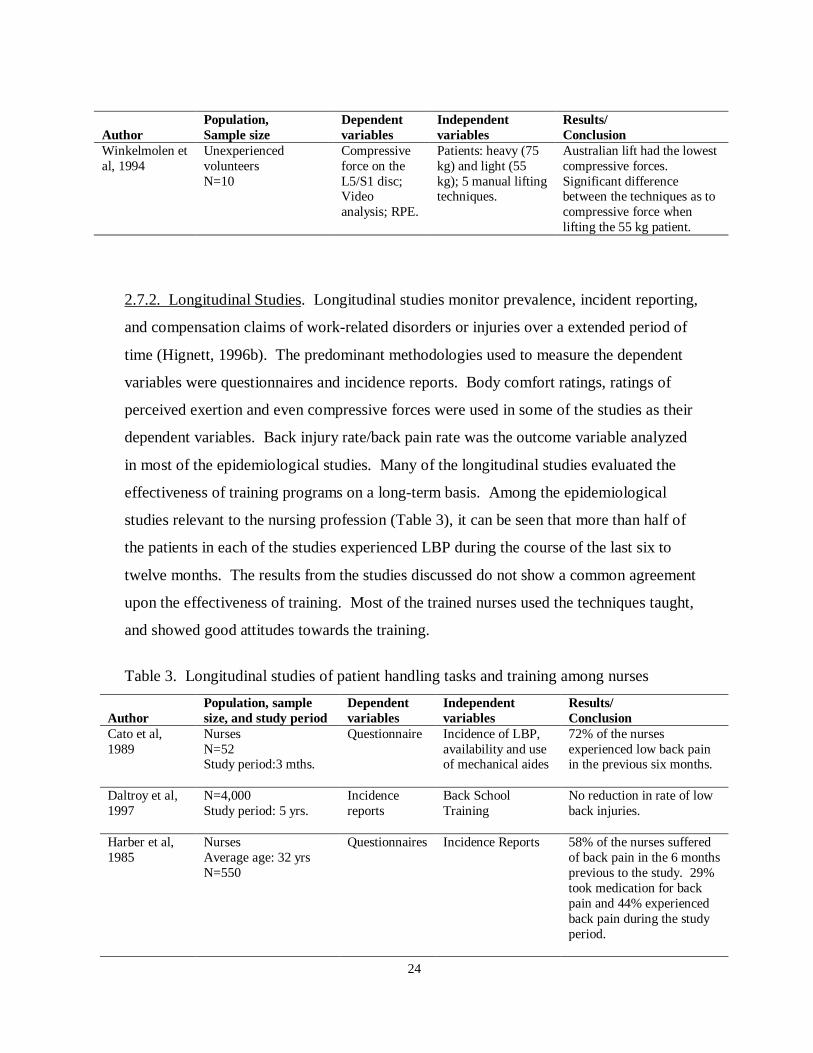
2.7.2. Longitudinal Studies. Longitudinal studies monitor prevalence, incident reporting,
and compensation claims of work-related disorders or injuries over a extended period of
time (Hignett, 1996b). The predominant methodologies used to measure the dependent
variables were questionnaires and incidence reports. Body comfort ratings, ratings of
perceived exertion and even compressive forces were used in some of the studies as their
dependent variables. Back injury rate/back pain rate was the outcome variable analyzed
in most of the epidemiological studies. Many of the longitudinal studies evaluated the
effectiveness of training programs on a long-term basis. Among the epidemiological
studies relevant to the nursing profession (Table 3), it can be seen that more than half of
the patients in each of the studies experienced LBP during the course of the last six to
twelve months. The results from the studies discussed do not show a common agreement
upon the effectiveness of training. Most of the trained nurses used the techniques taught,
and showed good attitudes towards the training.
Table 3. Longitudinal studies of patient handling tasks and training among nurses
AuthorPopulation, samplesize, and study period
Dependentvariables
Independentvariables
Results/Conclusion
Cato et al,1989
NursesN=52Study period:3 mths.
Questionnaire Incidence of LBP,availability and useof mechanical aides
72% of the nursesexperienced low back painin the previous six months.
Daltroy et al,1997
N=4,000Study period: 5 yrs.
Incidencereports
Back SchoolTraining
No reduction in rate of lowback injuries.
Harber et al,1985
NursesAverage age: 32 yrsN=550
Questionnaires Incidence Reports 58% of the nurses sufferedof back pain in the 6 monthsprevious to the study. 29%took medication for backpain and 44% experiencedback pain during the studyperiod.

25
AuthorPopulation, samplesize, and study period
Dependentvariables
Independentvariables
Results/Conclusion
Lagerströmand Hagberg,1997
NursesAverage age: 41 yrs.N=348Study period: 1 year
NordicQuestionnaire;RPE; Surveys
Education andexercises 1 day oftraining. Trainingon: patient liftingtechniques, physical,stress management.
93% of the nurses used thetechniques taught. Noreduction onmusculoskeletal disorders.90% were positive aboutexpected outcomes of theprogram.
Stubbs et al,1983a
NursesN=3,912
Questionnaire Incidence andprevalence reportsfor back pain
43.1% of the nurses sufferedback pain in one year. 16%was attributed to patienthandling. 53.7% of thecases affected low back.
Stubbs et al,1983b
NursesAge range: 19-23 yrsN= ?Study period: 9 months
Intraabdominalpressure (IAP)
8 lifting techniques;5 treatments;posttest after 15weeks of applyingthe trainingcondition
Reduction of IAP in most ofthe tasks, except in turning apatient in bed. Norelationship between timespent in training in handlingtechniques and prevalenceof LBP.
Venning et al,1987
NursesAverage age:37 yrs.N=5,649Study period:12mths.
Questionnaires Reports ofincidences.
60% of the totalmusculoskeletal injurieswere LBP. 52% of theinjuries required lost time.
Wood, 1987 NursesN= ?Study period: 9-13months
Incidentsreports
Back SchoolTraining Program
Decrease in injuries, andlost time.
2.7.3. Cross-sectional Studies. Cross-sectional epidemiological studies measure health
outcomes and exposures at a single point in time and are useful in identifying risk factors
(NIOSH, 1997). Questionnaires, OWAS, observational grids, and video analysis are the
most frequently used observational methods (Table 4) to evaluate patient handling tasks,
especially working postures. Cross sectional studies have also been used to evaluate the
effectiveness of training programs through the improvement of patient handling skills. An
improvement in patient handling ‘skills’ was reported in all studies where an educational
training program based on ergonomics was administered.

26
Table 4. Cross-sectional studies of patient handling tasks and training among nurses
AuthorPopulation,Sample size
Dependentvariables
Independentvariables
Results/Conclusion
Hellsing et al,1993
Nursing studentsAverage age: 25 yrs.N=52
Questionnaires;Observations;Attitudes andbehaviors
Training: lectures onergonomics 2hrs/week, and notraining.
Experimental group wasmore pleased with theireducation than controlgroup. Expert group hadbetter working postures.
Hignett,1996a
NursesAge: ?N=26
OWAS Nursing tasks(regular tasks vspatient handlingtasks)
Significant amount of“harmful” postures adoptedwhen performing patient-handling.
Ljungberg etal, 1989
NursesAge: ?N=24
RPE, OWAS, andheart rate.
Traditional andmodern ward
No significant difference inpostural strain betweentraditional and modernward.
St-Vincent etal, 1989
NursesAge: ?N=32
Observationalmethod
Training for 12 hrs.(Theory andPractice)
Because of physicalconstraints, training couldnot always be applied.Techniques not often usedfor tasks carried out of bed.
Takala et al,1987
NursesAge: 35.4 yrs.N=143
Questionnaire;Video Analysis;WorkplaceAnalysis
Patients: totallydependent, partiallydependent,independent;Training:1-2 hrs
92% of the nurses adoptedbending positions. Nursesdon’t usually use liftingaids.
Troup andRauhala,1987
Nursing studentsN=199
Rating Scales Observationsperforming patienthandling tasks;Training: 20 hrs oftheory and practicein nursing school.
Significant differencesbetween skills of trained andcontrol group.
Videman etal, 1989
Nursing studentsAge range: 20-24 yrs.N=199
Questionnairesand observationalmethod.
Training (40 hrs)and no training
Education and trainingprogram based onergonomics can improvepatient handling skills;nurses with poor handlingskills were at risk of backinjuries. Trained group hadhigher skills than controlgroup but, no statisticaldifference between groups.
27
CHAPTER 3. EXPERIMENTAL METHOD
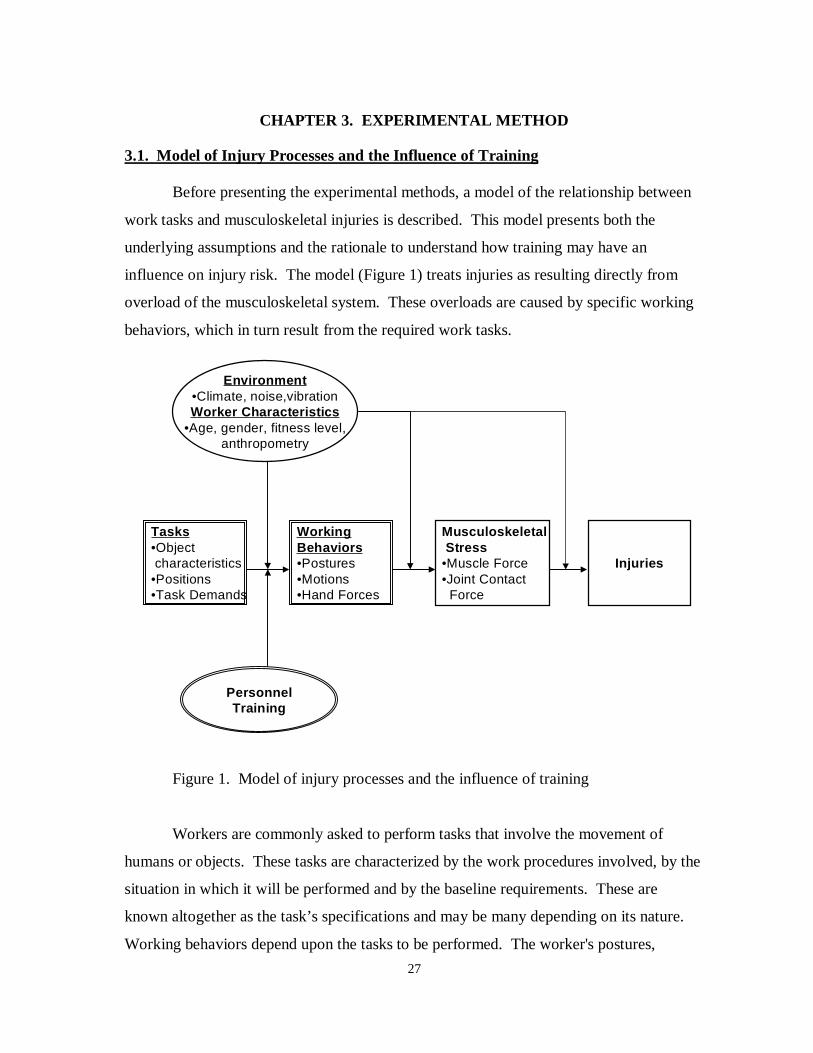
3.1. Model of Injury Processes and the Influence of Training
Before presenting the experimental methods, a model of the relationship between
work tasks and musculoskeletal injuries is described. This model presents both the
underlying assumptions and the rationale to understand how training may have an
influence on injury risk. The model (Figure 1) treats injuries as resulting directly from
overload of the musculoskeletal system. These overloads are caused by specific working
behaviors, which in turn result from the required work tasks.
Figure 1. Model of injury processes and the influence of training
Workers are commonly asked to perform tasks that involve the movement of
humans or objects. These tasks are characterized by the work procedures involved, by the
situation in which it will be performed and by the baseline requirements. These are
known altogether as the task’s specifications and may be many depending on its nature.
Working behaviors depend upon the tasks to be performed. The worker's postures,
Injuries
Musculoskeletal Stress•Muscle Force•Joint Contact Force
WorkingBehaviors•Postures•Motions•Hand Forces
Tasks•Object characteristics•Positions•Task Demands
Environment•Climate, noise,vibrationWorker Characteristics
•Age, gender, fitness level,anthropometry
PersonnelTraining

28
motions and forces exerted are a function of the task demands and characterize the
working behaviors. The specific behaviors used to accomplish a task, the musculoskeletal
stress resulting from these behaviors, and whether an injury occurs, can all be influenced
by the workers environment and personal characteristics. Personnel training is considered
to specifically influence how and which behaviors are used to complete a work task.
A long-term investigation of training on injury risk is beyond the scope of the
proposed work. Instead, it was the intention of this study to focus on the effect of training
on behaviors used to perform a specific task. It was assumed that a reduction of
musculoskeletal injuries can only be realized if working behaviors are modified or
improved through training. Training effects on behaviors will thus be examined in detail
for specific nursing tasks.
3.2. Experimental goals
The experimental methodology was designed in order to achieve the research
objectives presented in Section 1.2. In review, the focus of this research was to:
1. Determine if the perceived exertion of the whole body, shoulders, and low back
while performing simulated patient handling tasks were affected by the training
programs.
2. Determine if the posture, specifically the included hip, included knee, included
elbow and torso angles, and horizontal distance while performing simulated
patient handling tasks were affected by the training programs.
3. Determine if the compressive and shear forces at the lumbrosacral disc, lumbar
and shoulder joint moments, and strength capabilities at the shoulders and torso
while performing simulated patient handling tasks were affected by the training
programs.

29
3.3. Experimental Design
A 2X2X2X3 mixed factor design was used (Table 5). The experimental design
employed a pretest and posttest with a control group. There were four independent
variables:
1. Type of Training (between subject factor)
2. Task (within subject factor)
3. Patient Dependence (within subject factor)
4. Assistance Technique (within subject factor),
and five categories of dependent variables, which are:
1. Ratings of Perceived Exertion (whole body, shoulders, low back)
2. Postural angles and distances (included hip, included knee, and included elbow
and torso angle, and horizontal distance)
3. Spinal Forces (L5/S1 disc compression and shear forces)
4. Joint Moments (L5/S1 disc and shoulder moments)
5. Joint Strength Capabilities (shoulders and torso)
The statistical model that represents the experimental design is:
Y = µ + αi + βj + δk + φl + γm(l) + αγim(l) + βγjm(l) + αβij + αδik +αβγijm(l) + αδγikm(l)
+ αφil + βφjl + δφkl + βδjk + βδγikm(l) + αβδijk + αβδγijkm(l) + αβφijl + βδφjkl + αδφikl +
αβδφijkl + εn(ijklm)
where,µ = Population meanα = Task, i = type of taskβ = Dependence, j = level of patient dependenceδ = Assistance, k = type of assistanceφ = Training, l = type of trainingγ = Participant, m = participant numberε = random error, n = random error index

30
Table 5. Experimental Treatments
Treatment Tasks Patient Dependence Assistance Type of trainingT1 WB SD 1P TT1T2 WB D 1P TT1T3 WB SD 2P TT1T4 WB D 2P TT1T5 LU SD 1P TT1T6 LU D 1P TT1T7 LU SD 2P TT1T8 LU D 2P TT1T1 WB SD 1P TT2T2 WB D 1P TT2T3 WB SD 2P TT2T4 WB D 2P TT2T5 LU SD 1P TT2T6 LU D 1P TT2T7 LU SD 2P TT2T8 LU D 2P TT2T1 WB SD 1P TT3T2 WB D 1P TT3T3 WB SD 2P TT3T4 WB D 2P TT3T5 LU SD 1P TT3T6 LU D 1P TT3T7 LU SD 2P TT3T8 LU D 2P TT3
LegendTasks Patient Dependence Assistance Type of Training
WB Wheelchair to bed SD Semi-dependent patient 1P One person TT1 Video TrainingLU Lift patient up in bed D Dependent patient 2P Two person TT2 Lecture/Practice
TT3 No training
In employing within-subject factors, ordering of treatment conditions can
introduce a confounding variable to the analysis. This potential confound was controlled
by having the conditions presented in a Balanced Latin Square, one for each phase or
session of the study (Table 6). There were eight participants (P1-P8) in each of the
training conditions for a total of 24 participants. This presentation scheme balanced the
ordering of treatments to allow each condition to proceed and follow every other condition
an equal number of times, thus reducing confounding influence of treatment order (e.g.
intertask learning).

31
Table 6. Balanced Latin Square
ParticipantsOrder P1 P2 P3 P4 P5 P6 P7 P8
1 T1 T8 T2 T4 T6 T3 T6 T82 T2 T7 T5 T3 T5 T7 T2 T43 T6 T4 T1 T7 T2 T4 T1 T74 T5 T3 T6 T8 T1 T8 T5 T35 T7 T5 T3 T2 T8 T5 T7 T66 T4 T2 T8 T6 T3 T1 T8 T17 T8 T6 T4 T1 T4 T2 T4 T28 T3 T1 T7 T5 T7 T6 T3 T5
Pn = Participant n = 1, 2, 3,…, 8Tn = Treatment order n = 1, 2, 3,…, 8 (Refer to 8 treatments in Table 5 within
each training condition)
3.3.1. Independent Variables. Type of Training, Task, Patient Dependence, and
Assistance were the independent variables used in the experiment. The three types of
training programs used were a video, a lecture/practice training program, and no training
(control group). Training by means of a video is a good alternative whenever money is a
constraint, however it only allows minimal interaction and can not provide any practice or
feedback. On the contrary, an on-site lecture/practice training allows ongoing interaction
and permits hands-on practice with immediate feedback. The video is readily available
and can be bought and seen numerous times. A lecture/practice training program
however, in order to be effective, must be focused on specific work tasks and be well
organized. As a result the lecture/practice training program can sometimes be time
consuming and expensive. These two training options media are considered the extremes
of available training programs. It is the intention of this experiment to analyze both of
them as an attempt to find the advantages and disadvantages of such divergent techniques.
The video, “Save Your Back” from Educational Opportunities (Saunders, 1989),
included basic information on ergonomics and incorrect lifting techniques. It presented
and demonstrated how to perform the patient handling tasks evaluated in the experiment
in a 25 minutes video presentation (See Appendix A). The lecture/practice training
program was divided into two 1-hour sessions. The first session consisted of a lecture on
anatomy, body mechanics, ergonomics, and injury prevention methods presented by Karl

32
Kroemer, Dr. Ing. (Professor at Virginia Polytechnic Institute, Industrial and Systems
Engineering Department and Director of the Industrial Ergonomics Laboratory) (See
Appendix A). The second session was held in the Industrial Ergonomics Laboratory for
participants to practice in the same setting as the experiment was going to take place. A
certified physical therapist, Michael Tatman (Director of the Physical Therapy
Department at Radford Hospital) taught and practiced with the participants about how to
perform the patient handling tasks and techniques that were used on the experiment. The
control group was not exposed to any training program.
Each participant completed two types of patient-handling tasks. These were: 1)
wheelchair to bed transfer and 2) lift patient up in bed. As stated in the review of the
literature, nurses identified these patient handling activities as physically stressful
activities (Harber et al., 1985; Owen and Garg, 1989; and Jensen, 1985).
The level of dependence in a patient as well as the weight and physical condition
(size, shape, deformities, consciousness, and coordination) will determine how a patient
can be moved. Two levels of the Patient’s Dependence (dependent and semi-dependent)
were analyzed. A dependent patient was defined as one who can’t assist the nurse in the
transfer or movement, and may cause additional difficulties because of limited muscle
control (Corlett et al., 1992). In contrast, a semi-dependent patient may assist the nurse in
the transfer or movement, and may be able to sit up when lifted onto a wheelchair. The
principal investigator simulated the passive semi-dependent and dependent patient using
the following criteria:
Dependent patient Semi-dependent patient
• Unable to assist or cooperate in the transfer• Able to assist in the transfer• Unable to flex knees to push body up in bed• Able to flex knees to push body up• Unable to stand up • Able to stand up with assistance• Unable to sit without assistance • Able to sit and help with rotation of
the body
Two assistance levels were studied in the experiment: one person and two person
assistant lift. A one-person assistant lift is best suited for semi-dependent patients who are
able to assist in the movement, and whose weight is less than 50 kg (Corlett et al, 1992).
A two person assistant lift is typically used for dependent patients or patients with

33
neurological diseases or disabled and patients weighing more than 50 kg. In the two-
person assistance, one nurse acts in the leading position and the other one in the assisting
position. A detailed description of the steps participants followed when using the two
types of assistance for the three tasks are presented in Appendix B. The task descriptions
were adapted from Corlett et al. (1992), and Warner (1994).
3.3.2. Dependent Variables. Dependent variables were obtained using a biomechanical
model, and a psychophysical evaluation method. The 3D Static Strength Prediction
Program ™ (3D SSPP™) software was used as the biomechanical modeling tool to
estimate forces, moments, strength capabilities, as well as postural angles, and horizontal
distance used for postural evaluation. Borg’s Rating of Perceived Exertion assessed the
psychophysical aspects (Borg, 1970).
Five categories of dependent variables were obtained for each experimental
treatment:
1. Whole body, shoulders, and low back rating of perceived exertion.
2. Postural angles (included hip, included knee, included elbow and torso
angles) and horizontal distance (location of patient’s center of mass, or
hand grip center, measured horizontally from a point on the floor midway
between the ankles).
3. Peak low back compressive and shear force on the L5/S1 disc.
4. Peak joint moments at the L5/S1 disc and shoulders.
5. Strength Capabilities at the shoulders and torso.
Static and dynamic biomechanical models are available to simulate physical
requirements and estimate forces of the L5/S1 disc. Many of the biomechanical models
are static revealing stress due to gravitational forces. Static models neglect the effects of
acceleration and inertia on the body, leading to an underestimation of the forces and
moments generated on the body (Baker and Atha, 1994). However, static models can be
applied to relatively static postures assumed at the beginning and at the end of a task,
offering a simple and valid means for analyzing relatively static jobs. It is assumed that

34
the experimental patient transfer tasks are relatively slow and controlled motions, then a
static analysis will be appropriate.
In this study, low back compressive and shear forces on the L5/S1 disc, joint
moments and strength capability were assessed through of one of the most widely applied
and validated biomechanical models, the Three-Dimensional Static Strength Prediction
Program ™ (3D SSPP™) developed by the Center for Ergonomics at the University of
Michigan (1997). The biomechanical computations derived from the 3D SSPP™ assume
that the effects of acceleration and momentum are negligible and are typically used in the
analysis of manual material handling tasks involving slow movements.
Three major inputs were required to use the 3D SSPP™: worker anthropometry,
hand force, and posture. The hand force components were measured by using a force
platform system (Section 3.5). An example of the 3D SSPP™ task input summary is
given in Figure 2. L5/S1 compressive and shear forces, joint moments, and percent of the
population with sufficient strength capabilities are among the outputs given by the 3D
SSPP™. Figure 3 shows an example of the 3D SSPP™ output. Posture was modeled by
entering fifteen joint angles of the body. Anthropometry was determined by measuring
the height and weight of the subjects involved in the task to be modeled.

35
Figure 2. Example of the 3D SSPP™ Task Input Summary report for one experimental
task (lift up in bed task with one person).

36
Figure 3. Example of the 3D SSPP™ Analysis Summary, Joint Moments and Posture
output reports for one experimental task (lift up in bed task with one person).
Psychophysical methods are used to estimate physical stress based on the worker’s
subjective perception. One of the most widely used psychophysical methods is the Borg
Rating of Perceived Exertion Scale (RPE Scale, Borg, 1970). This scale is considered to
be a ratio scale with values ranging from 6 to 20 (Figure 4). The scale has been validated
by studies showing correspondence between the heart rate and the RPE (heart rate is
approximately 10 times rate of perceived exertion value). RPE ratings can be given for
whole body exertions or for specific body segments.

37
6 No exertion at all7 Extremely light89 Very light1011 Light1213 Somewhat hard1415 Hard1617 Very hard1819 Extremely hard20 Maximal exertion
Figure 4. Borg’s RPE Scale (Borg, 1970)
Borg’s original RPE Scale did not account for the benefits of a category rating scale
since it did not include ratio properties or numbers anchored by verbal expressions that
were simple and understandable to most people (Borg, 1982). Therefore, a new scale with
ratio properties was developed (Figure 5). The scale values range from 0 nothing at all for
to 10 for very, very strong. Since a person may imagine an intensity that is even stronger
than a “10”, another ratio property was provided (“maximal”). When using the scale,
people are permitted to use decimals and also go beyond 10. This scale can also be used
for whole body exertions or for specific body segments. Both scales are used with the
same procedures. Before the work, the subject is instructed on how to rate the degree of
exertion as accurately as possible. The subject has to answer verbally by saying a number
or to point with their finger at the scale value (Borg, 1970).

38
0 Nothing at all0.5 Extremely weak (just noticeable)1 Very weak2 Weak (light)3 Moderate4 Somewhat strong5 Strong (heavy)67 Very strong8910 Extremely strong (almost max.)• Maximal
Figure 5. Borg’s CR-10 RPE Scale (Borg, 1982).
There may not be a scale suitable for all kinds of subjective ratings and situations,
and the use of a specific scale likely depends upon the purpose of the study (Borg, 1982).
Borg (1982) recommended the use of the original RPE scale for exercise testing and for
clinical use in sports and rehabilitation medicine. The new category scale is especially
suitable for other subjective symptoms, such as pain and workload. Since this study
measured workload, and based on Borg's recommendations, the CR-10 RPE scale was
used to evaluate the workers’ perceived exertion.
OWAS, the Ovako Working Posture Analysis System, was developed in Finland
for examining workers postures in the steel industry (Karhu, Kansi, and Kuorinka, 1997;
Karhu, Härkönen, Sorvali, and Vepsäläinen, 1981). It is considered a practical method for
identifying and evaluating working postures. The OWAS procedure consists of two parts:
an observational technique to classify body postures, and a set of criteria for the redesign
of working methods and workplaces. From observations, four back, three arm (upper
limb), and seven leg (lower limb) posture categories can be defined in which each
category is classified with a digit code (Long, 1992). Given a posture code, an action
category can be determined and is used as the criteria to evaluate if the working method or
workplace needs to be redesigned.
The original aim of the analyst was to use the OWAS method as the tool to
evaluate posture. Once the method was applied to the experimental tasks, however, no
observable differences were found on the posture categories across all the eight
experimental conditions. The categories were found to be very broad and did not

39
differentiate for example, how much the back was bent (the back categories were divided
in straight or bent back and for most of the cases the participants bent their backs to some
degree). Although the method was easy to use it was not beneficial to evaluate the studied
postures. Instead, the following angles were used to evaluate posture: included hip, knee
and elbow, and torso angles and the horizontal distance obtained from the 3D SSPP™
model (See Figure 6).
3.3.3. Control Variables. In order to control possible confounding effects, questionnaires
were used to identify participants with ongoing (less than a month) or previous back
and/or shoulder injuries (less than a year). The questionnaire assessed participants’
knowledge about biomechanics, ergonomics and lifting techniques (Appendix C).
Knowledge of biomechanics, ergonomics or lifting techniques could introduce
confounding in the experiment because the purpose of the study is to measure workers
behaviors and biomechanical stress after receiving a lecture/practice training program that
will include information on these topics.
Age and gender were also used as control variables. Students with ages ranging
from 19-25 years were used in the experiment, since surveys among nursing aides found
that the maximum frequency of back pain occurred at this age (Videman et al., 1984).
Figure 6. Postural angles measured with the 3DSSPP software.
Included elbow angle
Included knee angle
Included hip angle
Torso angle

40
Only female volunteers were employed in an attempt to match the nursing population
(approximately 96% of nurses are females; Harber et al., 1985)
3.4. Participants
Twenty-four female volunteers, ages of 19 to 25 years, were selected according to
the control variables from among a pool of college students to serve as participants. The
descriptive statistics that characterize the participants are presented in Table 7.
Table 7. Descriptive Statistics for the Study ParticipantsHeight (cm) Weight (kg) Age (yrs)
Mean 165.2 61.9 21.0Standard Deviation 5.8 7.2 1.9Range 156, 178 52, 78.6 19, 25
The investigator served as the passive patient to avoid confounding influences in
the Patient Dependence factor (semi-dependent and dependent) following the criteria
discussed in Section 3.3.1. The participants received monetary compensation for their
participation. None of the participants withdrew from the study. Each participant was
informed of the purpose, methods, and experimental procedures used in the study. An
informed consent, which was approved by the Virginia Polytechnic Institute IRB
Committee, was read and signed by each participant (Appendix C). A coding scheme was
employed to identify the data by participant’s number only (e.g., Participant #1) to
maintain anonymity. All video recordings were confidential and will be erased upon
completion of the study.
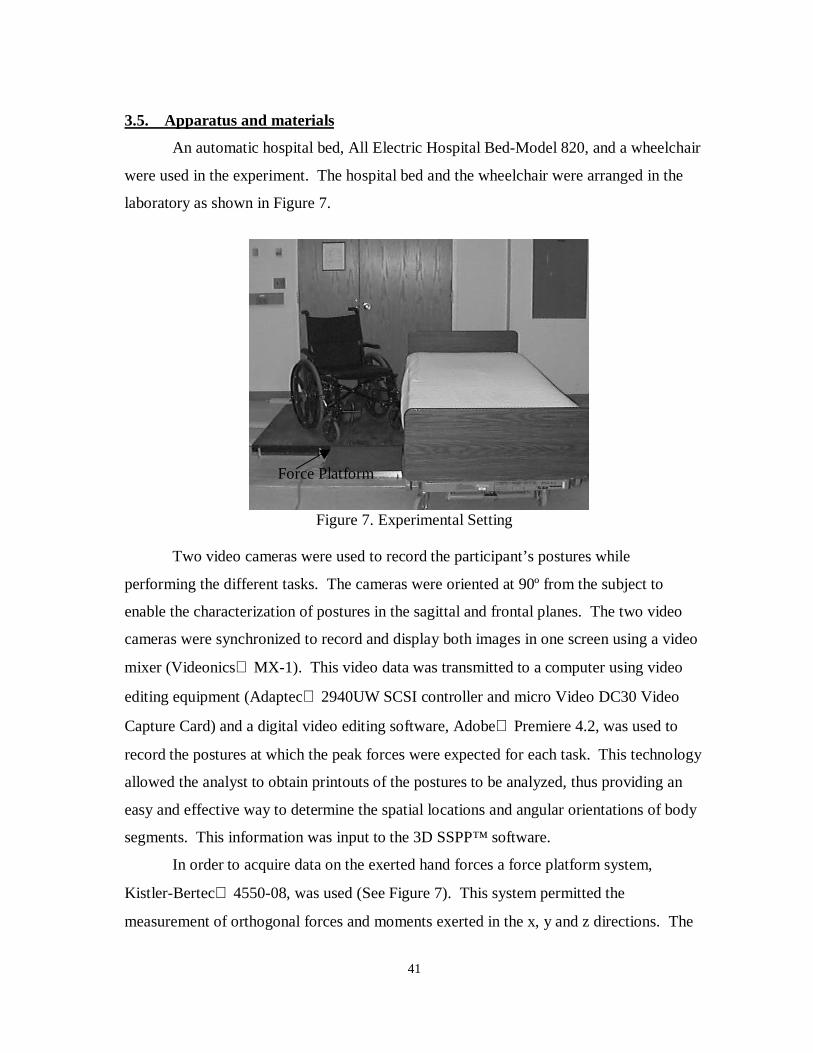
41
3.5. Apparatus and materials
An automatic hospital bed, All Electric Hospital Bed-Model 820, and a wheelchair
were used in the experiment. The hospital bed and the wheelchair were arranged in the
laboratory as shown in Figure 7.
Figure 7. Experimental Setting
Two video cameras were used to record the participant’s postures while
performing the different tasks. The cameras were oriented at 90º from the subject to
enable the characterization of postures in the sagittal and frontal planes. The two video
cameras were synchronized to record and display both images in one screen using a video
mixer (Videonics MX-1). This video data was transmitted to a computer using video
editing equipment (Adaptec 2940UW SCSI controller and micro Video DC30 Video
Capture Card) and a digital video editing software, Adobe Premiere 4.2, was used to
record the postures at which the peak forces were expected for each task. This technology
allowed the analyst to obtain printouts of the postures to be analyzed, thus providing an
easy and effective way to determine the spatial locations and angular orientations of body
segments. This information was input to the 3D SSPP™ software.
In order to acquire data on the exerted hand forces a force platform system,
Kistler-Bertec 4550-08, was used (See Figure 7). This system permitted the
measurement of orthogonal forces and moments exerted in the x, y and z directions. The
Force Platform

42
force platform output was sampled at a frequency of 100 Hz. The participants stood on
the force platform while performing the patient handling activities. The peak force of
each task was used as input to the 3D SSPP™ model (See Section 3.8.1). The platform
was used to estimate the total dynamic hand forces (total for both hands) occurring during
the experimental trials. This analysis was based on the assumption that any additional
dynamic contributions (e.g. body segment accelerations) were minimal. The use of a
force platform is necessitated by the difficulty of directly measuring hand forces during
patient handling. The platform system does not have a display to present the numerical
values of the forces and moments. Instead, the platform interfaces with the computer
where a numerical manipulation and interpretation software, Lab View, presents the
readings as form of graphs and the actual numerical values stored for later analysis.
3.6 Pilot Testing
The experiment was simulated during a pilot session according to the experimental
guidelines previously described. The purpose of the pilot test was to assure that the
equipment worked as expected and was placed properly, that the data collection forms
were complete and well understood, and to determine the total experimental time. Six
participants volunteered to perform the eight patient handling tasks, while their actions
were being videotaped.
As a result of the pilot test the following actions were taken:
• The video cameras distances from the force platform and the lens height
were set to the optimal locations.
• A wood platform was built and placed under the force platform to provide
more stability.
• A second wood platform was built for the assisting nurse to be at the same
height as the participant who was standing on top of the platform.
• RPEs Data Collection forms were simplified.
• No experimental procedure problems were identified.

43
3.7. Experimental Procedures
The experiment was conducted in four phases as shown in Figure 8: Pretest,
Training, Posttest 1, and Posttest 2. This section explains how each of the phases were
conducted and what they comprised.
Pretest Training Posttest 1 Posttest 2Group 1 O1 Video O2 O3
Group 2 O1 Lecture/Practice Training O2 O3
Group 3 O1 No training O2 O3
Figure 8. Experimental Design. (Ox indicates experimental observations taken during thethree testing phases. Each subject group performed the eight treatments indicated in Table5.)
3.7.1. Pretest. Upon arrival, the participants received verbal and written information
about the experiment, and were given an informed consent to be read and signed. The
participants were required to complete a screening questionnaire to account for the control
variables noted above. At this point, participants were asked to change their clothes and
wear black tight pants and a long sleeve shirt that were provided. White round dots were
placed at the participant’s shoulder, elbow, wrist, hip, knee, and ankle joints (in the
sagittal and frontal planes) to ease subsequent postural analysis.
Once the participants were prepared and all the anthropometric data (height and
weight) was recorded, they were introduced to the entire procedure, the bed settings, the
force platform functions, and the purpose of the video cameras. Participants were also
instructed on how to rate their perceived exertion and how to use the Borg’s 10-point RPE
Scale.
Participants were asked to perform the two patient handling tasks at the two levels
of the Patient’s Dependence factor and the two levels of the Assistance factor. The
experiment consisted of 8 experimental treatments. Participants were able to practice the
handling tasks before data was collected to allow them to become familiar with the tasks
and process. As an initial step, participants were told to stand in a straight position on top
of the platform and wait for an initial beep to start the task. After the initial beep,

44
participants performed the task and returned to the straight position until they heard the
second or final beep.
Each treatment condition lasted approximately 5 to 10 seconds. Each task was
videotaped for postural data analysis. Immediately after each patient transfer, the
participants rated their perceived exertion using the Borg 10-point Rating of Perceived
Exertion (Borg, 1970). A rest period of at least 1 minute, or as requested, was allowed
before starting the next task.
3.7.2 Training. In the second phase, 16 out of 24 participants participated in two different
training programs (Video and Lecture/practice Training Program). The training programs
were held in the Industrial Ergonomics Laboratory except for the lecture presentation of
the Lecture/Practice Training program, which was held in a conference room. The
training programs took place on different dates and followed the protocols as discussed in
Section 3.3.1. The other eight participants served as the control group; thus they did not
receive training on lifting techniques.
3.7.3 Posttest 1. The third phase (Posttest 1) was performed within 72 hours after
receiving the training condition. The same experimental procedures, as in the Pretest,
were followed. In this phase no forms needed to be filled out and the explanation given
was minimal. Participants’ postures and ratings of perceived exertion were measured as
described earlier.
3.7.4 Posttest 2. The last phase (Posttest 2) was conducted four to six weeks after
receiving the training program. As done in phase one and three, the respective procedures
were followed and measures were taken again.
3.8. Data Analysis
After each experimental session, the analyst retained the participant’s informed
consent form, health and history questionnaires, videotapes, all data files, and the
completed RPEs data collection sheet. Data analysis was performed over two main
categories: biomechanical model and psychophysical methods. Posture was analyzed as

45
part of the Biomechanical Model, since its data was obtained from the 3DSSPP
biomechanical model, but results are presented separately.
3.8.1 Biomechanical Model. This section describes how the 3D SSPP input data was
obtained. The anthropometric data used was the height (cm) and weight (kg) of each
participant. The hand force data was derived from the readings of the force platform.
This type of system is noise sensitive and could be affected by any unpredictable contact
with the force platform. For that reason a second order low pass Butterworth filter was
employed to eliminate the noise from the force signals. After an extended trial and error
process it was determined that cutoff frequency (fc) of 7 Hz provided the most reliable
signal. Required hand force data for the biomechanical model includes the magnitude of
the force, as well as horizontal and vertical angles for each hand (right and left). The
readings from the force platform represent the force in the x, y, and z axes for both hands.
The total force for both hands was calculated as:
(3-1)
The total force was assumed to be evenly distributed over the two hands therefore, force
in the right and left hand was assumed to be F/2 for each.
Once the forces were filtered and the total force calculated the maximum positive
peak force in the z axis for the wheelchair to bed task was determined as well as the
minimum negative peak force in the x axis for the lift up in bed task. Fz maximum was
used for the wheelchair to bed task since the maximum force occurs while lifting the
patient up from the chair and/or placing the patient down in the bed. Fz in the force
platform convention goes up. For the lift up in bed task, fx minimum was used since the
greatest amount of force occurs in this axis while moving or sliding the patient up in bed
and fx in the force platform convention goes to the right. In this study only the two
previous peak force were used to analyze the tasks.
The sign convention for the x, y and z axes was not the same for the force platform
system and the 3D SSPP biomechanical model. Also, the wheelchair to bed task was
performed differently than the lift up in bed task since the starting position was first to the
222 fzfyfxF ++=

46
side of the bed facing the chair and then facing the bed. This forced a change in fx for fy in
the wheelchair to bed task. Therefore, proper adjustments and change in signs had to be
done. Figure 9 presents the positive convention for the force platform system and the 3D
SSPP.
Figure 9. Positive sign convention for the fx, and fy force components. Fz positiveconvention (not illustrated) goes upward for the 3D SSPP and downward for the forceplatform.
In addition to the magnitude force for each hand, the hand force direction was
represented by a horizontal and vertical angles. The horizontal angle (H), which
represents the angle between the force vector and the vertical x-z plane, was calculated
using the following formula:
If f x > 0 and fy > 0 then H’ = H
If f x ≤ 0 and fy > 0 then H’ = H + 180°
If f x ≤ 0 and fy ≤ 0 then H’ = H – 180
If f x > 0 and fy < 0 then H’ = H (3-2)
fx
fy
fx
fy
(a) 3D SSPP (b) Force Platform
= −
fy
fxH 1tan

47
The vertical angle (V) is the angle between the force vector and the horizontal x-
y plane. It was calculated using the following formula:
If Fz > 0 then V’ = V
If Fz < 0 then V’ = -V (3-3)
To extract the 15 joint angles needed to represent the posture that correspond to
the peak force, both force platform readings, and videos were used. From the force
platform readings the time, where the peak force occurred was obtained. This procedure
was followed due to the need to provide the information needed for the video image
capture equipment. Once the correct time was determined, the posture was frozen and a
hard copy was obtained. After having the printouts of the postures corresponding to the
peak forces, the 15 angles that represented the posture were calculated. In order to
calculate the angles, lines were drawn throughout the picture of the participant’s joints
that were marked with the white dots. Angles were calculated using a protractor.
Due to limitations in the study not all the 15 angles could be calculated. Estimates
of those angles that could not be calculated were done by matching the picture with the
oblique view of the biomechanical model program. The program permitted a change in
camera view for more accurate results. Once all the biomechanical input data was
calculated it was entered in the software program. After joint angle estimates were done,
a sensitivity analysis was performed to evaluate the changes in the results or dependent
measures. Figures 10 and 11, actual printouts obtained from the video editing software
and an oblique view of the wheelchair to bed task obtained from the 3D SSPP, present
the similarity in working postures of both pictures.
( )
+++= −
222
221cos
fzfyfx
fyfxV

48
Figure 10. 3D SSPP Oblique view for the wheelchair to bed task with two person assistance
Figure 11. Video edited printout for the wheelchair to bed task with two person assistance

49
3.8.2. Statistical Analysis. The analysis was performed for the 192 tasks per session, for
a total of 576 analyzed postures. Descriptive statistics (mean and standard deviation)
were computed to characterize the raw data. A multivariate analysis of variance
(MANOVA) using Wilk’s Lambda criterion was used to test if the dependent variables
derived from the biomechanical model for the Pretest, differences between Posttest 1 and
Pretest, and differences between Posttest 2 and Posttest 1 were statistically significant. If
the MANOVA found significance in the Training effect or an interaction with Training,
an analysis of variance (ANOVA) for all dependent variables was conducted.
The differences between Posttest 2 and Posttest 1 evaluated the retention of
information presented on the training programs. The following null hypothesis tested the
retention of information: “RPEs, postural measures and biomechanical measures will not
change after a short period of time”. Therefore, no significant differences are expected,
corresponding to a failure to reject the null hypothesis. However, a significant result
could represent a favorable value as a result of continued learning or a nonfavorable value
as a result of forgetting what was learned. Figure 12 shows a graphical representation of
the possible directions for a significant difference. The three possible directions are
continued learning, retention, and forgetting.
Figure 12. Possible directions of the dependent measures after a short period of time (4-6weeks; Posttest 2 – Posttest 1).
Training Delay
Pretest Posttest 1 Posttest 2
Continued learning
Retention
Forgetting
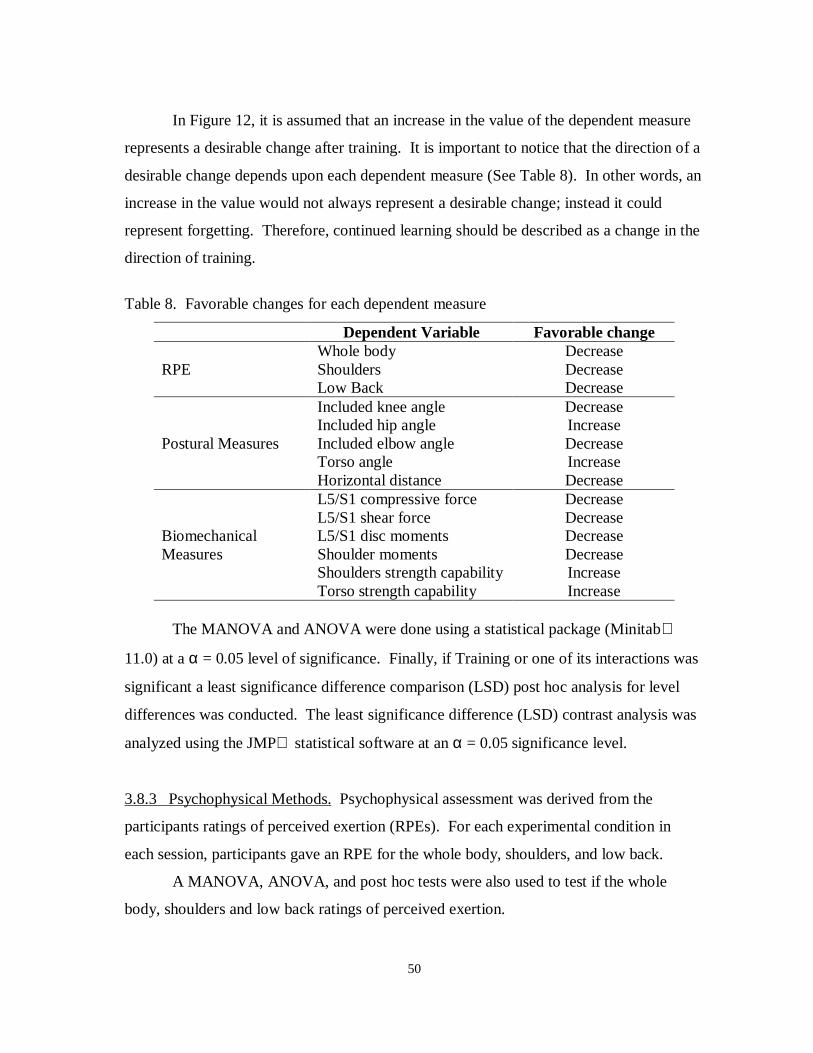
50
In Figure 12, it is assumed that an increase in the value of the dependent measure
represents a desirable change after training. It is important to notice that the direction of a
desirable change depends upon each dependent measure (See Table 8). In other words, an
increase in the value would not always represent a desirable change; instead it could
represent forgetting. Therefore, continued learning should be described as a change in the
direction of training.
Table 8. Favorable changes for each dependent measure
Dependent Variable Favorable changeWhole body Decrease
RPE Shoulders DecreaseLow Back DecreaseIncluded knee angle DecreaseIncluded hip angle Increase
Postural Measures Included elbow angle DecreaseTorso angle IncreaseHorizontal distance DecreaseL5/S1 compressive force DecreaseL5/S1 shear force Decrease
Biomechanical L5/S1 disc moments DecreaseMeasures Shoulder moments Decrease
Shoulders strength capability IncreaseTorso strength capability Increase
The MANOVA and ANOVA were done using a statistical package (Minitab
11.0) at a α = 0.05 level of significance. Finally, if Training or one of its interactions was
significant a least significance difference comparison (LSD) post hoc analysis for level
differences was conducted. The least significance difference (LSD) contrast analysis was
analyzed using the JMP statistical software at an α = 0.05 significance level.
3.8.3 Psychophysical Methods. Psychophysical assessment was derived from the
participants ratings of perceived exertion (RPEs). For each experimental condition in
each session, participants gave an RPE for the whole body, shoulders, and low back.
A MANOVA, ANOVA, and post hoc tests were also used to test if the whole
body, shoulders and low back ratings of perceived exertion.

51
CHAPTER 4. RESULTS
The results were divided into three main categories: Ratings of Perceived Exertion
(RPE), Posture, and Biomechanical Measures. These categories were subdivided as
Pretest, Posttest 1 – Pretest, and Posttest 2 – Posttest 1. The Pretest section intended to
obtain an initial measure or baseline to determine if there were initial differences between
the training groups. The difference between posttest 1 and the pretest (Posttest 1 –
Pretest) addressed the training effect on the groups that participated in a training program
to determine if training had an influence on behavior. It evaluated original learning after
the training condition based on changes in RPE, posture and biomechanical stress. The
Posttest 2 – Posttest 1 section determined whether the participants who participated in the
training programs remembered what they had learned after a short period of time.
4.1 Psychophysical Method: Ratings of Perceived Exertion
4.1.1 Pretest. For the RPE a MANOVA test was conducted to determine if the RPE
were significantly different between the training groups. Table 9 provides the output of
the MANOVA.
Table 9. Statistical results from the MANOVA test for the RPE to test differencesbetween the training groups and for interactions of Training with other independentvariables during the Pretest session.
Independent Variable F-value Degrees of Freedom P-valueTraining 0.771 6, 38 0.597
Task x Training 1.300 6, 38 0.277Assistance x Training 0.973 6, 38 0.443
Dependence x Training 0.880 6, 38 0.510
The lack of significance in the MANOVA for the Pretest session indicates that no
significant differences existed between the different training groups prior to training.

52
4.1.2. Posttest 1 – Pretest: Original Learning. Table 10 summarizes descriptive statistics
for the RPE grouped by training groups and dependent measures, for comparison. The
whole body RPE decreased by 0.599 on average, the shoulders by 0.991 (the largest
decrease) and the low back by 0.735 (t-test, Ho: µ = 0, Hi: µ < 0; p < 0.001 for all the
RPEs).
Table 10. Means and standard deviations from the whole body, shoulders and low backRPE for the difference between Posttest 1 and Pretest.
RPEsTraining Whole body Shoulders Low Back
Video -0.99 (1.7) -1.49 (1.9) -1.02 (2.3)Lecture/Practice -0.21 (1.6) -0.73 (1.8) -0.55 (1.9)
No Training -0.71 (1.8) -0.95 (2.1) -0.86 (2.3)
Table 11 provides the output of the MANOVA for the Training effect and its
second order interactions. A significant difference was found on the Training effect (p =
0.001).
Table 11. Statistical results from the MANOVA and ANOVA tests for the RPE to test thedifferences between Posttest 1 and Pretest. ANOVAs were performed on the main effectsor interactions found to be significant under the MANOVA. Statistically significantresults are indicated by an “ * ”.
ANOVAsIndependent Variable Parameter MANOVA Whole body Shoulders Low Back
Training F 4.631 13.43 8.05 1.83DF 6, 38 2, 21 2, 21 2, 21p 0.001* <0.001* 0.003* 0.185
Task x Training F 0.984 - - -DF 6, 38 - - -p 0.450 - - -
Assistance x Training F 0.518 - - -DF 6, 38 - - -p 0.791 - - -
Dependence x Training F 0.971 - - -DF 6, 38 - - -p 0.493 - - -

53
Based on the MANOVA results, p-values <0.001 and 0.003 were reported for the
whole body and shoulders RPE. A statistically significant difference does exist between
the levels of the Training factor for these RPE. Figures 13 and 14 present the graphs for
the significant RPE differences.
Figure 13. Differences between Posttest 1 and Pretest for the whole body RPE for theTraining effect. Significant differences are indicated by their corresponding p-values.
Figure 14. Differences between Posttest 1 and Pretest for the shoulders RPE for theTraining effect. Significant differences are indicated by their corresponding p-values.
-1.2
-1
-0.8
-0.6
-0.4
-0.2
0
Training
∆ R
PE
Video Lecture/Practice No tra ining
p = 0.006 p = 0.022
-1.6
-1.2
-0.8
-0.4
0
Training
∆ R
PE
p = 0.025
Video Lecture/Practice No training

54
For the whole body and shoulders RPE the levels of the Training effect were
statistically different. In both cases, the Video group had the largest decrease in RPEs
compared to the Lecture/Practice group (p = 0.006, 0.022). The No training group also
decreased their whole body RPE when compared to the Lecture/Practice group (p =
0.025).
The Dependence factor was also significant on the MANOVA (p = 0.001) for the
three dependent measures whole body, shoulders, and low back (p < 0.001, 0.001, and
0.005 respectively). For the whole body RPE the means for the semi-dependent and
dependent levels were –0.210 and –1.053; for the shoulders, -0.632 and –1.442; and for
the low back –0.373 and –1.187. The overall means suggested that the dependent level
had higher decreases in the RPE than the semi-dependent level.
4.1.3 Posttest 2 – Posttest 1: Retention. Descriptive statistics calculated for the
difference between Posttest 2 and Posttest 1 for all the experimental treatments grouped
by training are presented in Table 12. Whole body RPE decreased by 0.353 on average,
the shoulders increased by 0.047 and the low back decreased by 0.235 (t-test, Ho: µ = 0,
Hi: µ ≠ 0; p < 0.001, 0.640, 0.023 respectively). The whole body and low back had
favorable changes in RPE (continued learning). For the shoulders RPE no significant
change occurred.
Table 12. Means and standard deviations for the whole body, shoulders and low back RPEfor the difference between Posttest 2 and Posttest 1.
RPEsTraining Whole body Shoulders Low Back
Video -0.16 (1.16) 0.37 (1.26) -0.05 (1.36)Lecture/Practice -0.44 (0.98) 0.14 (0.83) -0.15 (1.01)
No Training -0.47 (1.58) -0.37 (1.80) -0.21 (1.80)
Although Training was not significant as a main effect, the Assistance x Training
interaction was significant (p-value = 0.024). Table 13 provides the full output of the
MANOVA and ANOVA tests for the Training effect and its second order interactions.

55
Table 13. Statistical results from the MANOVA and ANOVA tests for the RPE to test thedifferences between Posttest 2 and Posttest 1. ANOVAs were performed on the maineffects or interactions found to be significant under the MANOVA. Statisticallysignificant results are indicated by an “ * ”.
ANOVAsIndependent Variable Parameter MANOVA Whole body Shoulders Low Back
Training F 1.952 - - -DF 6, 38 - - -p 0.062 - - -
Task x Training F 0.563 - - -DF 6, 38 - - -p 0.757 - - -
Assistance x Training F 2.793 5.28 7.17 4.81DF 6, 38 2, 21 2, 21 2, 21p 0.024* 0.014* 0.004* 0.019*
Dependence x Training F 1.933 - - -DF 6, 38 - - -p 0.100 - - -
From the ANOVA results, p-values of 0.014, 0.004 and 0.019 were found for the
whole body, shoulders and low back RPE Assistance x Training interaction respectively.
Therefore, the results for all the RPE are significantly different for different combinations
of Training and Assistance level. Figure 15, 16 and 17 illustrate the Assistance x Training
interaction for the whole body, shoulders and low back RPE.

56
-1.00
-0.50
0.00
0.50
1.00
Training
∆R
PE
p = 0.001
p < 0.001
Figure 15. Differences between Posttest 1 and Posttest 2 for the whole body RPE fromthe Assistance x Training interaction. Significant differences are indicated by theircorresponding p-values. One person, Two person
Figure 16. Differences between Posttest 1 and Posttest 2 for the shoulders RPE from theAssistance x Training interaction. Significant differences are indicated by theircorresponding p-values. One person, Two person
Video Lecture/Practice No training
-0.8
-0.6
-0.4
-0.2
0
0.2
Training
∆ R
PE
Video Lecture/Practice No training
p = 0.012 p = 0.008

57
Figure 17. Differences between Posttest 1 and Posttest 2 for the low back RPE from theAssistance x Training interaction. Significant differences are indicated by theircorresponding p-values. One person, Two person
In Figure 15, differences between the training groups can be observed for the one-
person assistance. In this case, the Lecture/Practice and No training group had larger
decreases in the whole body RPE than the Video group.
As seen in Figure 16, the differences (Posttest 2 – Posttest 1) for the shoulders
RPE tend to increase for the Video and Lecture/Practice training while decreasing for the
No training group when using the one person assistance. Although not significant, the
average changes in RPE for the Lecture/Practice group were smaller. When performing
the two-person assistance there were no observable differences among the groups. For the
Low Back RPE there was a noticeable decrease between the training groups for both
assistance techniques except for the one-person assistance on the Video group (Figure 17).
As in the shoulders RPE, the Lecture/Practice group had a decrease in the low back RPE.
Based on the post hoc analysis for the shoulders RPE, there is a significant
difference between Video and No training (p < 0.001) and Lecture/Practice and No
training (p = 0.001) when using the one person assistance. The No training group showed
a reduction on the RPE while the training groups increased (Figure 16). For the Low
Back RPE there was a significant difference between Video and No training (p = 0.050)
-0.60
-0.30
0.00
0.30
0.60
Training
∆R
PE
p = 0.050
Video Lecture/Practice No training
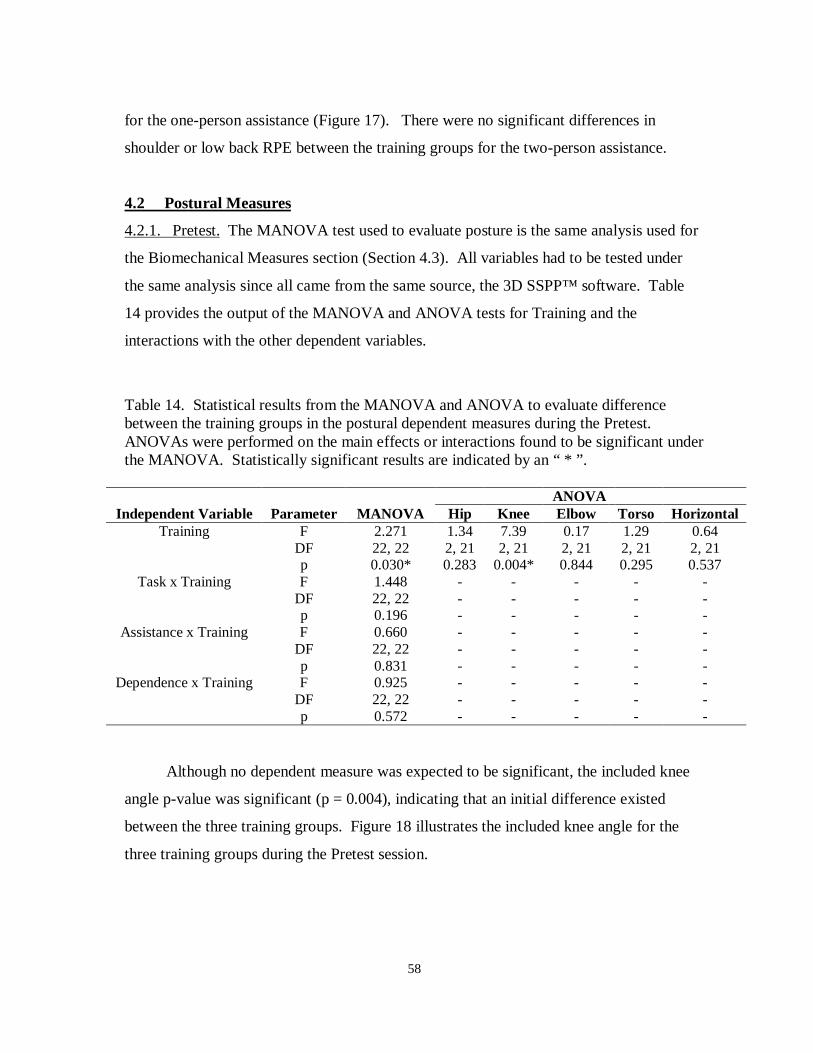
58
for the one-person assistance (Figure 17). There were no significant differences in
shoulder or low back RPE between the training groups for the two-person assistance.
4.2 Postural Measures
4.2.1. Pretest. The MANOVA test used to evaluate posture is the same analysis used for
the Biomechanical Measures section (Section 4.3). All variables had to be tested under
the same analysis since all came from the same source, the 3D SSPP™ software. Table
14 provides the output of the MANOVA and ANOVA tests for Training and the
interactions with the other dependent variables.
Table 14. Statistical results from the MANOVA and ANOVA to evaluate differencebetween the training groups in the postural dependent measures during the Pretest.ANOVAs were performed on the main effects or interactions found to be significant underthe MANOVA. Statistically significant results are indicated by an “ * ”.
ANOVAIndependent Variable Parameter MANOVA Hip Knee Elbow Torso Horizontal
Training F 2.271 1.34 7.39 0.17 1.29 0.64DF 22, 22 2, 21 2, 21 2, 21 2, 21 2, 21p 0.030* 0.283 0.004* 0.844 0.295 0.537
Task x Training F 1.448 - - - - -DF 22, 22 - - - - -p 0.196 - - - - -
Assistance x Training F 0.660 - - - - -DF 22, 22 - - - - -p 0.831 - - - - -
Dependence x Training F 0.925 - - - - -DF 22, 22 - - - - -p 0.572 - - - - -
Although no dependent measure was expected to be significant, the included knee
angle p-value was significant (p = 0.004), indicating that an initial difference existed
between the three training groups. Figure 18 illustrates the included knee angle for the
three training groups during the Pretest session.

59
Figure 18. Included knee angle results for the three training groups during the Pretestsession. Significant differences are indicated by their corresponding p-values.
As it can be seen from Figure 18, the Video and Lecture/Practice group performed
similarly and no difference can be established. However, the No training group seems to
have significantly smaller (7.4°) included knee angles than the other two groups.
The existence of significant differences between the three training groups was
further investigated using an ANOVA to confirm that the variations found were not due to
anthropometric differences. Table 15 shows the results of the ANOVA for the
participants’ height and weight.
Table 15. Statistical results from the one-factor ANOVA for the height and weight
Source F SS MS F-ratio P-value
Height Training 2 62.0 31.0 0.92 0.415Weight Training 2 182.8 91.4 1.93 0.171
No significant differences were found in the height and weight of the three training
groups. Also, after plotting the data it was found that several outliers in the No training
group could have decreased the average included knee angles.
130
140
150
160
Video Lecture/Practice No trainingTraining
Kne
e an
gle
(deg
rees
)p = 0.008
p = 0.001

60
4.2.2. Posttest 1 – Pretest: Original Learning. In Table 16, descriptive statistics
calculated for the experimental conditions are summarized and grouped by training and
dependent measures, for comparison. The included hip and torso angles increased 2.93
and 1.371 on average and the horizontal distance by –1.31 (t-test, Ho: µ = 0, Hi: µ > 0, p-
values = 0.025, 0.035, and 0.062); the included knee and elbow angles decreased on
average by 3.86, and 6.02 (t-test, Ho: µ = 0, Hi: µ < 0, p-values = 0.001, 0.002).
Table 16. Means and standard deviations for the postural measures for the differencebetween Posttest 1 and Pretest.
Included angles (°)
Training Hip Knee Elbow Torso angle (°)Horizontal
distance (cm)Video 6.96 (7.8) -3.52 (15.9) -11.14 (23.0) 2.88 (10.8) -1.27 (10.8)
Lecture/Practice 5.11 (24.2) -9.94 (17.3) -6.16 (26.6) 3.16 (17.1) -1.44 (11.0)No Training -3.27 (18.4) 1.88 (17.1) -0.77 (19.0) -2.22 (11.9) -0.40 (10.6)
Table 17 provides the output of the MANOVA and ANOVA tests for the Training
effect and the second order interactions with Training.
Table 17. Statistical results from the MANOVA and ANOVA tests to evaluate thepostural dependent measures for the differences between Posttest 1 and the Pretest.ANOVAs were performed on the Training effect or interactions found to be significantunder the MANOVA. Statistically significant results are indicated by an “ * ”.
ANOVAsIndependent Variable Parameter MANOVA Hip Knee Elbow Torso Horizontal
Training F 5.575 6.27 17.91 6.70 4.31 4.84DF 22, 22 2, 21 2, 21 2, 21 2, 21 2, 21p < 0.001* 0.107 < 0.001* 0.006* 0.215 0.079
Task x Training F 1.763 0.35 2.71 5.38 0.92 1.38DF 22, 22 2, 21 2, 21 2, 21 2, 21 2, 21p 0.046* 0.706 0.090 0.013* 0.415 0.274
Assistance x Training F 0.232 6.68 1.82 0.13 4.23 2.60DF 22, 22 2, 21 2, 21 2, 21 2, 21 2, 21p 0.044* 0.006* 0.067 0.875 0.029* 0.098
Dependence x Training F 1.017 - - - - -DF 22, 22 - - - - -p 0.485 - - - - -

61
The MANOVA shows statistical significance in the Training effect and Task x
Training and Assistance x Training interactions. Based on the ANOVA results, p-values
of <0.001 and 0.006 were reported for the included knee angle, and included elbow angle
Training effect. A statistically significant difference does exist between the levels of the
Training factor for these postural measures. For the Task x Training interaction the elbow
angle had a significant p-value of 0.013. Finally, for the Assistance x Training interaction
the included hip angle as well as the torso angles were found to be significant with p-
values of 0.006 and 0.029. Figures 19, 20, 21, 22 and 23 present the graphs for the
significant dependent measures.
Figure 19. Differences between Posttest 1 and Pretest for the Training effect on theIncluded knee angle. Significant differences are indicated by their corresponding p-values.
-15
-10
-5
0
5
Training
∆ K
nee
angl
e (d
egre
es)
p < 0.001
p = 0.030
Video Lecture/Practice No training
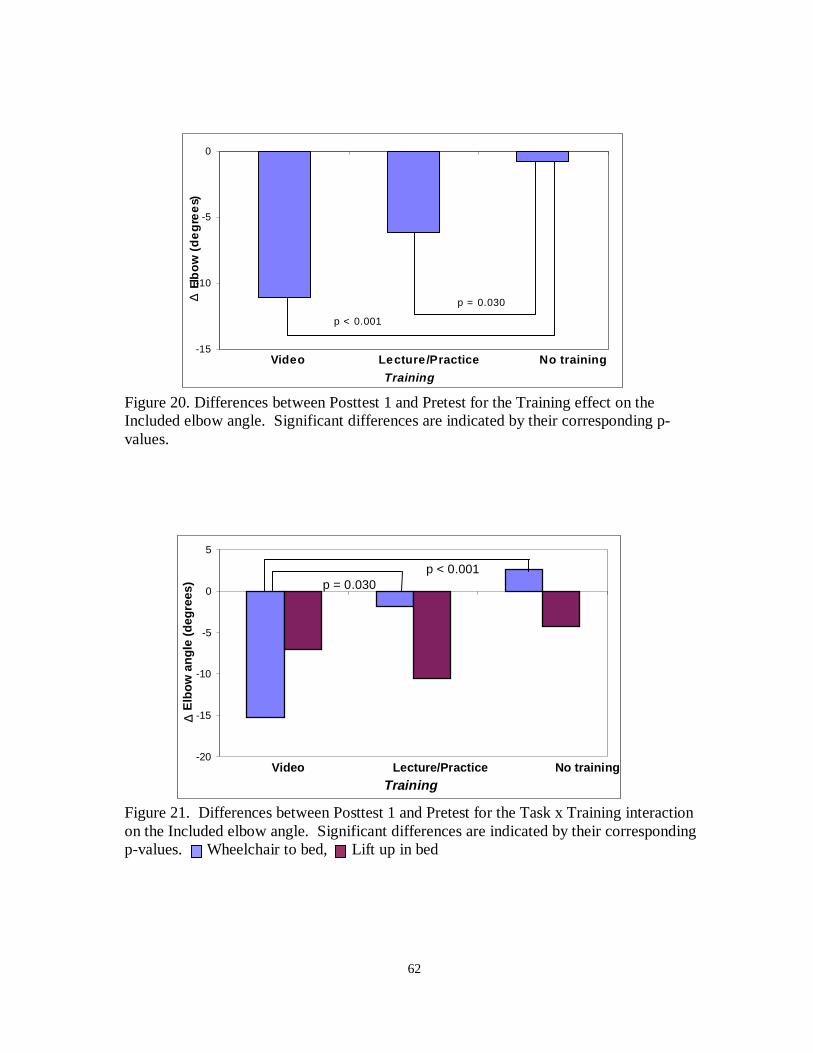
62
Figure 20. Differences between Posttest 1 and Pretest for the Training effect on theIncluded elbow angle. Significant differences are indicated by their corresponding p-values.
Figure 21. Differences between Posttest 1 and Pretest for the Task x Training interactionon the Included elbow angle. Significant differences are indicated by their correspondingp-values. Wheelchair to bed, Lift up in bed
-20
-15
-10
-5
0
5
Training
∆ E
lbow
ang
le (
degr
ees)
p < 0.001p = 0.030
Video Lecture/Practice No training
-15
-10
-5
0
Training
∆ El
bo
w (
de
gre
es )
Video L ecture/P ractice No training
p < 0.001
p = 0.030

63
Figure 22. Differences between Posttest 1 and Pretest for the Assistance x Traininginteraction on the Included hip angle. Significant differences are indicated by theircorresponding p-values. One person, Two person
Figure 23. Differences for the Posttest 1 and Pretest for the Assistance x Traininginteraction on the Torso angle. Significant differences are indicated by their correspondingp-values. One person, Two person
-10
-5
0
5
10
15
Training
∆ H
ip a
ngle
(de
gree
s)p < 0.001
p < 0.001
Video Lecture/Practice No training
-5
0
5
10
Training
∆ T
orso
ang
le (
degr
ees)
p = 0.002
p < 0.001
Video Lecture/Practice No training

64
Figure 19 shows that the Lecture/Practice group had the largest decrease in knee
angles. For the Training effect on the included elbow angle both training groups had a
reduction on this measure when compared the control group (Figure 20). The Video
group had the largest decrease in the elbow angles.
As it can be seen in Figure 21 the wheelchair to bed task had a larger decrease in
elbow angle for the Video group and a smaller decrease for the Lecture/Practice group. In
contrast, for the lift up in bed task, the Video group had a small decrease in elbow angle
while the Lecture/Practice group had a large decrease. For the hip angles and the torso
angles the Assistance x Training, there was no observable difference among the groups
when using the one-person assistance (Figures 22 and 23). However, for the two-person
assistance a large increase was found.
From the post hoc analysis, it can be concluded that the levels of the Training
factor are significantly different for the included knee and elbow angles (Figure 19 and
20). For the included knee angle the Lecture/Practice group was significantly different
than the Video and No training group (p = 0.030, and < 0.001). The included elbow
angles were significantly different for the Lecture/Practice and Video group when
compared to the No training group (p < 0.001, and 0.030). For the included elbow angle
Task x Training interaction, there are no significant differences among the groups for the
lift up in bed task. But, for the wheelchair to bed task the Video group was significantly
different than the Lecture/Practice and No training groups (See Figure 21).
Although the included hip angle was not significantly different for the one-person
assistance among the training groups, it was significantly different for the two-person
assistance specifically for the No training group (See Figure 22). The No training group
had a decrease in hip angle while the training group hip angle increased. Similarly, the
torso angle had no significant differences for the one-person assistance while the No
training group had a decrease on torso angles for the two-person assistance (See Figure
23).
Since the postural measures were found to be strongly influenced by training, the
reliability of these measures had to be evaluated. A Pearson correlation test was
performed on the included knee angle, included hip angle, included elbow angle and torso
angle to test how reliable the instrument used to measure the angles was. A random

65
sample of the 24 pretest conditions was chosen. From each of the 24 pretest conditions, 3
subjects were selected at random, and 4 of the angles recalculated. These recalculated
numbers were correlated with the original values. Table 18 shows the correlation values
(r), the mean difference as well as the maximum and minimum differences for the
included knee, hip, elbow and torso angles.
Table 18. Pearson correlation and descriptive statistics for the postural angles.
PearsonCorrelation
Meandifference
Minimumdifference
Maximumdifference
Included knee angle 0.944 1.67 0 9Included hip angle 0.946 0.54 0 7Included elbow angle 0.989 1.13 0 5Torso angle 0.985 1.20 0 0
The correlations were found to be high, suggesting that the measurement
instrument is reliable as well as the measurements taken (postural angles).
There were two three-way interactions that were statistically significant in the
MANOVA. These are Task x Assistance x Training and Assistance x Dependence x
Training (p = 0.007 and 0.0032). For the horizontal distance, and included elbow angle,
the Task x Assistance x Training interaction was significant (p = 0.042, and < 0.001).
For the Assistance x Dependence x Training the hip angle, and elbow angle were
significant (p = 0.036 and 0.005).
Although the objective of the study was to analyze training and its effects, it is
important to mention that Task, Assistance and Dependence main effects were found to be
significant in the MANOVA (p < 0.001, p < 0.001, and p < 0.001). Table 19 shows for
which dependent variables the Task, Assistance and Dependence factors were
significantly different.

66
Table 19. P-values from the ANOVA test main effects for the difference between Posttest1 and Pretest. Statistically significant results are indicated by an “*”.
P-valuesDependent Variable Task Assistance Dependence
Included hip angle 0.047* 0.147 0.447Included knee angle 0.037* 0.745 0.200Included elbow angle 0.308 < 0.001* 0.026*Torso angle 0.027* 0.047* 0.760Horizontal distance 0.025* 0.865 0.002*
4.2.3. Posttest 2 – Posttest 1: Retention. For the differences between Posttest 2 and
Posttest 1, Table 20 summarizes descriptive statistics calculated for the each dependent
measure and grouped by training, for comparison. Although some means increased and
other decreased (indicating both favorable changes) all the values were considered small,
suggesting retention. The included hip, knee and torso angles increased by 2.49, 7.76 and
2.04, respectively (t-test, Ho:µ = 0, Hi: µ ≠ 0, p-values = 0.098, 0.300, 0.019); the
included elbow angle and horizontal distance decreased by 6.14 and 0.98, respectively (t-
test, Ho:µ = 0, Hi: µ ≠ 0, p-values = <0.001, and 0.160).
Table 20. Means and standard deviations for the postural measures (differences betweenPosttest 2 and Posttest 1).
Included angles (°)
Training Hip Knee Elbow Torso angle (°)Horizontal
distance (cm)Video 1.02 (18.8) -3.28 (15.5) -6.02 (18.8) 2.05 (11.7) -2.05 (9.2)
Lecture/Practice 1.02 (25.0) 24.97 (13.2) -3.41 (26.2) 2.00 (12.5) -0.44 (10.5)No Training 5.44 (17.9) 1.58 (14.7) -9.00 (18.4) 1.46 (12.0) -0.46 (9.4)
The MANOVA and ANOVA tests results for the Training effect and its interactions
with other independent variables are presented in Table 21. Although the Training factor
was not significant, the Task x Training interaction was significant (p < 0.001).

67
Table 21. Statistical results from the MANOVA and ANOVA tests to evaluate thepostural dependent measures for the difference between Posttest 2 and Posttest 1.ANOVAs were performed on the Training effect and interactions found to be significantunder the MANOVA. Statistically significant results are indicated by an “*”.
ANOVAsIndependent Variable Parameter MANOVA Hip Knee Elbow Torso Horizontal
Training F 1.382 - - - - -DF 22, 22 - - - - -p 0.227 - - - - -
Task x Training F 2.582 1.45 1.64 0.41 1.10 0.18DF 22, 22 2, 21 2, 21 2, 21 2, 21 2, 21p 0.015* 0.257 0.217 0.666 0.351 0.839
Assistance x Training F 1.619 - - - - -DF 22, 22 - - - - -p 0.133 - - - - -
Dependence x Training F 0.613 - - - - -DF 22, 22 - - - - -p 0.871 - - - - -
None of the dependent variables were found to be significantly different.
Therefore, a statistically significant difference does not exist for the Task x Training
interaction.
Although the objective of the study was to analyze training and its effects, it is
important to mention that the Task factor was found to be significant in the MANOVA (p
< 0.001). Table 22 shows for which dependent variables Task was significantly different.
Table 22. P-values from the ANOVA test for the Task factor for the difference betweenPosttest 1 and Pretest. Statistically significant results are indicated by an “*”.
P-valuesDependent variable Task
Included hip angle 0.025 *Included knee angle 0.178Elbow angle < 0.001 *Torso angle 0.417Horizontal distance 0.047 *

68
4.3. Biomechanical Measures
4.3.1 Pretest. Table 23 provides the output of the MANOVA and ANOVA tests to
determine if the three training groups are initially different.
Table 23. Statistical results from the MANOVA and ANOVA tests to evaluate thebiomechanical dependent measures during the Pretest session. ANOVAs were performedon the Training effect and interactions found to be significant under the MANOVA.Statistically significant results are indicated by an “*”.
ANOVAs L5/S1 forces Moments Strength Cap.
Independent Variable Parameter MANOVA Compressive Shear L5/S1 Shoulder Shoulders TorsoTraining F 2.271 0.70 3.30 0.64 3.51 2.02 0.46
DF 22, 22 2, 21 2, 21 2, 21 2, 21 2, 21 2, 21p 0.030* 0.509 0.083 0.538 0.048* 0.158 0.639
Task x Training F 1.448 - - - - - -DF 22, 22 - - - - - -p 0.196 - - - - - -
Assistance x Training F 0.660 - - - - - -DF 22, 22 - - - - - -p 0.831 - - - - - -
Dependence x Training F 0.925 - - - - - -DF 22, 22 - - - - - -p 0.572 - - - - - -
The MANOVA found the Training factor to be statistically significant (p < 0.001).
For the Training factor, the shoulders moments were the only dependent measure with a
significant p-value (p = 0.048), thus a statistically significant difference does exist
between the training groups for this variable. Figure 24 presents the graph for the
shoulder moments.

69
Figure 24. Shoulder moment results for the three training groups during the Pretestsession. Significant differences are indicated by their corresponding p-values.
From the graph it can be said that the Video and Lecture/Practice group performed
similarly and no difference can be established. However, the No training group seems to
have significantly higher shoulder moments than the other two groups. The magnitude of
the difference is 5.2 Nm. (See Table 14 for ANOVA on anthropometric differences)
There were several interactions for some dependent variables that, although they
were not significant in the MANOVA, were significant in the ANOVA. For the shoulders
strength capability, the Task x Training and Dependence x Training interactions were
significant (p = 0.012, and p = 0.011). In the Task x Training interaction the wheelchair
to bed task had a higher percentage in strength capability for the shoulders meaning that
this task was less stressful than the lift up in bed task for the three training groups.
Similarly, the Dependence x Training interaction had higher percentages for the
population shoulders strength capability when moving a semi-dependent patient. The
Dependence x Training interaction was also significant (p = 0.019) for the L5/S1
compressive force. In this case the Video and Lecture/Practice training groups had
significantly different results (p = 0.006) for the semi-dependent level. The Video group
had lower compressive forces than the Lecture/Practice group during the Pretest when
moving a semi-dependent patient.
0
10
20
30
40
50
60
Video Lecture/Practice No trainingTraining
Sho
ulde
r m
omen
ts (
New
ton-
met
ers)
p = 0.016p = 0.049

70
Although the objective of the study was to analyze the effect of training on the
working behaviors, it is important to mention that Task, Assistance and Dependence
factors were found to be significantly different in the MANOVA (p < 0.001, p < 0.001,
and p < 0.001). Table 24 shows that Task, Assistance and Dependence were significantly
different for all the dependent variables.
Table 24. P-values from the ANOVA test for the Task factor during the Pretest.Statistically significant results are indicated by a “*”.
P-valuesDependent Variable Task Assistance Dependence
L5/S1 compressive force < 0.001 * < 0.001 * < 0.001 *L5/S1 shear force 0.053 * 0.049 * < 0.001 *L5/S1 moment < 0.001 * 0.043 * < 0.001 *Shoulder moment < 0.001 * < 0.001 * < 0.001 *Strength Capability Shoulders < 0.001 * 0.002 * < 0.001 *Strength Capability Torso < 0.001 * < 0.001 * < 0.001 *
In general, for all the dependent variables the main effects (except Training) were
statistically significant. Therefore, the biomechanical stress is affected by the task
performed, the assistance technique used, and the patient level of dependency.
4.3.2. Posttest 1 - Pretest: Original Learning. Table 25 summarizes descriptive statistics
for the three training groups and dependent measures. These values indicate relatively big
changes in behaviors for some of the dependent variables. The ones worth noting are:
shear force for the Lecture/Practice group, 15% change; shoulders strength capability for
the Lecture/Practice group, 34% change; shoulder moments for the Video group, 10%
change; L5/S1 compressive force and moments for the Video group, 8% change. Overall
the means and p-values for the t-test (Ho: µ = 0, Hi: µ < 0) are: for the L5/S1 compressive
force, -169.65, p = 0.007; L5/S1 shear force, -21.25, p = 0.027; shoulder moments; 2.29, p
= 0.92; L5/S1 moments, -5.70, p = 0.045; shoulders strength capability, -5.22, p = 0.031;
and torso strength capability, -4.74, p = 0.067.

71
Table 25. Means and standard deviations for the biomechanical measures for thedifference between Posttest 1 and Pretest.
L5/S1 force (N) Moments (Nm) Strength Capability (%)Training Compressive Shear Shoulder L5/S1 Shoulders Torso
Video -245.17 (1045.3) -15.67 (129.2) -4.22 (20.7) -11.36 (49.1) 2.97 (39.3) 0.69 (42.4)Lecture/Practice -179.10 (790.3) -62.19 (181.3) 9.53 (21.6) -3.07 (48.8) -14.72 (40.1) -5.19 (44.2)
No Training -84.67 (995.9) 14.05 (132.1) 1.58 (22.0) -2.68 (41.1) -3.91 (34.4) -9.74 (44.6)
To evaluate biomechanical stress a MANOVA was conducted to test which factors
and interactions were statistically significant. Table 26 provides the output of the
MANOVA and ANOVA tests for the Training effect and the second order interactions
with Training.
Table 26. Statistical Results from the MANOVA and ANOVA tests to evaluate thebiomechanical measures for the difference between Posttest 1 and Pretest. ANOVAs wereperformed on the Training effect and interactions found to be significant under theMANOVA. Statistically significant results are indicated by an “*”.
ANOVAs L5/S1 forces Moments Strength Cap.
Independent Variable Parameter MANOVA Compressive Shear Shoulder L5/S1 Shoulders TorsoTraining F 5.575 0.43 4.16 0.64 1.01 1.34
DF 22, 22 2, 21 2, 21 2, 21 2, 21 2, 21 2, 21p < 0.001* 0.655 0.030* 0.536 0.057 0.284
Task x Training F 1.763 0.51 0.30 2.24 1.13 0.40DF 22, 22 2, 21 2, 21 2, 21 2, 21 2, 21 2, 21p 0.046* 0.609 0.745 0.076 0.343 0.673
Assistance x Training F 0.232 0.61 1.38 1.62 0.60 2.26DF 22, 22 2, 21 2, 21 2, 21 2, 21 2, 21 2, 21p 0.044* 0.554 0.274 0.221 0.556 0.129
Dependence x Training F 1.017 - - - - - -DF 22, 22 - - - - - -p 0.485 - - - - - -
P-values of 0.030 and 0.002 were reported for the L5/S1 shear force and shoulder
moments respectively for the Training effect. A statistically significant difference does
exist between the levels of the Training factor for the L5/S1 shear force and shoulder
moments. Figure 25 and 26 present the graphs of the Training effect for the L5/S1 shear
force and shoulder moments respectively.

72
Figure 25. Differences between the Posttest 1 and Pretest for the Training effect on theShear force. Significant differences are indicated by their corresponding p-values.
Figure 26. Differences between the Posttest 1 and Pretest for the Training effect on theShoulder moments. Significant differences are indicated by their corresponding p-values.
As seen in Figure 25, the Lecture/Practice group had the greatest difference
indicating a reduction on the L5/S1 shear force. For the shoulder moments (Figure 26) the
Video group showed a reduction while the Lecture/Practice group had an increase. It
seems that the three training groups are different in the two significant dependent
variables.
-80
-60
-40
-20
0
20
Training
∆ F
orce
(N
ewto
n-m
eter
s)
p = 0.002
Video Lecture/Practice No training
-6
0
6
12
Training
∆ M
omen
t (N
ewto
n-m
eter
s) p < 0.001 p= 0.024
Video Lecture/Practice No training

73
There was one three-way interaction for some dependent variables that although
they were not significant in the MANOVA had p-values < 0.05 in the ANOVA. For the
L5/S1 shear force and for the L5/S1 moment, the Task x Dependence x Training
interaction was significant (p = 0.034, and p = 0.018). In the L5/S1 shear force, the semi-
dependent level of the Dependence factor had an overall increase in shear forces for the
two tasks. The Lecture/Practice group presented a decrease in shear force for the
wheelchair to bed task. For the dependence level of the Dependence factor, the Video and
Lecture/Practice group had a decrease in the L5/S1 shear force for both tasks, wheelchair
to bed and lift up in bed. Similarly, the moments at the L5/S1 disc show that when the
passive patient acted as a semi-dependent patient there was a increase in the moments for
the Video group for the wheelchair to bed task and an increase for the Lecture/Practice
group in the lift up in bed task. For the dependence level, there was an overall decrease
in the shear force for all the tasks and training groups. Figures 27 and 28 show the
graphical representation of the Task x Dependence x Training interaction.
Figure 27. Differences between Posttest 1 and Pretest for the Task x Dependence xTraining interaction on the L5/S1 shear force (semi-dependent level). Wheelchair to bed task, Lift up in bed task
Semi-dependent level
-200
-100
0
100
200
300
Training
∆ S
hear
forc
e (N
ewto
ns)
Video Lecture/Practice No trainin g

74
Figure 28. Differences between Posttest 1 and Pretest for the Task x Dependence xTraining interaction on the L5/S1 shear force (dependent level). Wheelchair to bed task, Lift up in bed task
Although the objective of the study was to analyze training and its effects, it is
important to mention that Task, Assistance and Dependence factors were found to be
significantly different in the MANOVA (p < 0.001, p < 0.001, and p < 0.001). Table 27
shows for which dependent variables the Task, Assistance and Dependence factors were
significantly different.
Table 27. P-values from the ANOVA test for the significant main effects for thedifference between Posttest 1 and Pretest. Statistically significant results are indicated bya “*”.
P-valuesDependent Variable Task Assistance Dependence
L5/S1 compressive force 0.063 0.509 0.014 *L5/S1 shear force 0.002 * 0.655 0.032 *L5/S1 moment 0.126 0.567 0.160Shoulder moment 0.468 0.051 * 0.004 *Strength Capability Shoulders 0.242 0.126 0.028 *Strength Capability Torso 0.012 * 0.462 0.075
The Dependence factor seems to be the effect that influences the most the
dependent measures.
Dependent level
-1000
-800
-600
-400
-200
0
Training
∆ S
hear
forc
e (N
ewto
ns)
Video Lecture/Practice No training

75
4.3.3. Posttest 2 – Posttest 1: Retention. Table 28 summarizes descriptive statistics
(means and standard deviations) calculated for the eight experimental conditions, which
are grouped by training groups and dependent measures, for comparison. In general, for
most of the dependent measures, the means are small which indicate consistent behaviors
immediately after training and after a short period of time. Overall the means and p-
values for the t-test (Ho: µ = 0, Hi: µ ≠ 0) are: for the L5/S1 compressive force, 27.63, p =
0.630; L5/S1 shear force, 30.15, p = 0.002; shoulder moments, -0.070, p = 0.830; L5/S1
moments, 0.690, p = 0.830; shoulders strength capability, -0.96, p = 0.710; and torso
strength capability, -1.17, p = 0.680). Shear force was the only significant result implying
that forgetting occurred.
Table 28. Means and standard deviations for the biomechanical measures for thedifference between Posttest 2 and Posttest 1.
L5/S1 force (N) Moments (Nm) Strength Capability (%)Training Compressive Shear Shoulder L5/S1 Shoulders Torso
Video 11.50 (650.8) 8.25 (126.6) 1.15 (12.2) -2.66 (33.8) -4.30 (30.0) -3.19 (34.5)Lecture/Practice 65.24 (805.8) 58.41 (155.2) -0.73 (26.4) 2.81 (49.5) 2.77 (39.6) -0.13 (44.3)
No Training 28.90 (910.7) 23.80 (119.1) -0.62 (18.9) 1.91 (44.8) -1.36 (35.6) -0.20 (37.2)
Although the Training factor was not significant, the Task x Training interaction
was significant (p < 0.001). Table 29 provides the output of the MANOVA and ANOVA
tests for the Training effect and its interactions.

76
Table 29. Statistical results from the MANOVA and ANOVA tests to evaluate thebiomechanical measures for the difference between Posttest 2 and Posttest 1. ANOVAswere performed on the Training effect and interactions found to be significant under theMANOVA. Statistically significant results are indicated by an “*”.
ANOVAs L5/S1 forces Moments Strength Cap.
Independent Variable Parameter MANOVA Compressive Shear L5/S1 Shoulder Shoulders TorsoTraining F 1.382 - - - - - -
DF 22, 22 - - - - - -p 0.227 - - - - - -
Task x Training F 2.582 8.33 1.16 3.91 8.39 1.16 0.77DF 22, 22 2, 21 2, 21 2, 21 2, 21 2, 21 2, 21p 0.015* 0.002* 0.334 0.036* 0.002* 0.334 0.475
Assistance x Training F 1.619 - - - - - -DF 22, 22 - - - - - -p 0.133 - - - - - -
Dependence x Training F 0.613 - - - - - -DF 22, 22 - - - - - -p 0.871 - - - - - -
The MANOVA results show significance in the Task x Training interaction
between the biomechanical measures. The p-values for the L5/S1 compressive force,
L5/S1 moments and shoulder moments were significant. That is, a statistically significant
difference does exist between the levels of the Task x Training interaction. Figure 29, 30,
and 31 present the graphs of the Task x Training interaction for the L5/S1 compressive
force, L5/S1 disc and shoulder moments respectively.

77
Figure 29. Differences between Posttest 2 and Posttest 1 for the Task x Traininginteraction on the L5/S1 compressive force. Significant differences are indicated by theircorresponding p-values. Wheelchair to bed task, Lift up in bed task
Figure 30. Differences between Posttest 2 and Posttest 1 for the Task x Traininginteraction on the L5/S1 disc moments. Significant differences are indicated by theircorresponding p-values. Wheelchair to bed task, Lift up in bed task
-550
-350
-150
50
250
450
Training
∆ L
5/S
1 co
mpr
essi
ve fo
rce
(New
tons
)
p = 0.016
Video Lecture/Practice No training
p = 0.022
p = 0.018
-20
-10
0
10
20
Training
∆ L
5/S
1 M
omen
ts (
For
ce-n
ewto
n)
p = 0.005p = 0.002
p = 0.030
Video Lecture/Practice No training

78
Figure 31. Differences between Posttest 2 and Posttest 1 for the Task x Traininginteraction on the shoulders moments. Significant differences are indicated by theircorresponding p-values. Wheelchair to bed task, Lift up in bed task
As it can be seen in Figures 29, 30, and 31 the wheelchair to bed task had larger
increases on the compressive forces and moments than the lift up in bed task (especially
for the Lecture/Practice group). Based on the post hoc analysis, there is a significant
difference between the Video and No training group for the wheelchair to bed task for the
L5/S1 compressive force (See Figure 29). For the lift up in bed task, both the Video and
Lecture/Practice group had significantly different compressive forces than the No training
group which had a significantly larger decrease.
The Lecture/Practice group had a significantly larger decrease in the L5/S1
moments for the wheelchair to bed task than the Video and No training group, which had
increases. For the lift up in bed task, the Video and No training group are significantly
different (See Figure 30). Finally, for the shoulder moments the only significant
difference was the Video and Lecture/Practice group in the lift up in bed task. In this
case, the Lecture/Practice group had a significantly larger decrease in shoulder moments
than the other groups (See Figure 31).
Although the objective of the study was to analyze training and its effects, it is
important to mention that the Task factor was found to be statistically significant in the
-16
-11
-6
-1
4
9
Training
∆ M
omen
t (F
orce
-new
ton)
p = 0.011
Video Lecture/Practice No training

79
MANOVA (p < 0.001). Table 30 shows for which dependent variables the Task factor
was significant.
Table 30. P-values from the ANOVA test for the Task effect for the difference betweenPosttest 1 and Posttest 2. Statistically significant results are indicated by a “*”.
P-valuesDependent variable Task
L5/S1 compressive force 0.003 *L5/S1 shear force 0.093L5/S1 moment 0.008*Shoulder moment 0.001 *Strength Capability Shoulders 0.142Strength Capability Torso 0.484
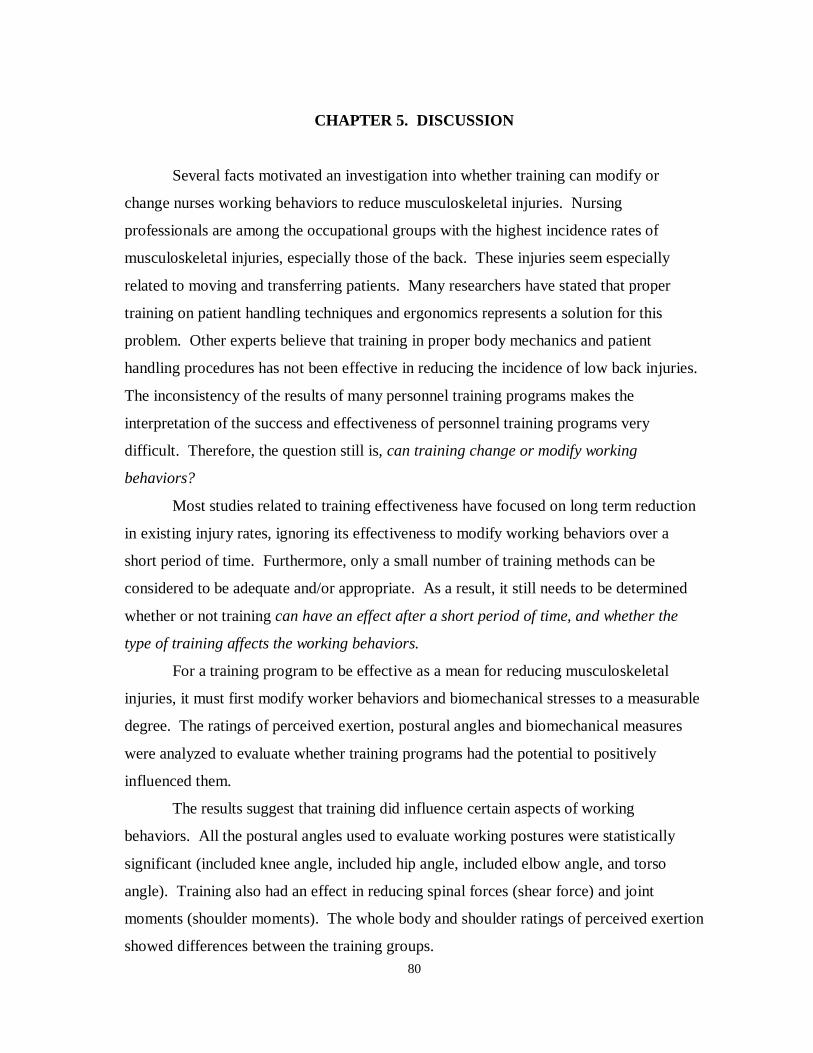
80
CHAPTER 5. DISCUSSION
Several facts motivated an investigation into whether training can modify or
change nurses working behaviors to reduce musculoskeletal injuries. Nursing
professionals are among the occupational groups with the highest incidence rates of
musculoskeletal injuries, especially those of the back. These injuries seem especially
related to moving and transferring patients. Many researchers have stated that proper
training on patient handling techniques and ergonomics represents a solution for this
problem. Other experts believe that training in proper body mechanics and patient
handling procedures has not been effective in reducing the incidence of low back injuries.
The inconsistency of the results of many personnel training programs makes the
interpretation of the success and effectiveness of personnel training programs very
difficult. Therefore, the question still is, can training change or modify working
behaviors?
Most studies related to training effectiveness have focused on long term reduction
in existing injury rates, ignoring its effectiveness to modify working behaviors over a
short period of time. Furthermore, only a small number of training methods can be
considered to be adequate and/or appropriate. As a result, it still needs to be determined
whether or not training can have an effect after a short period of time, and whether the
type of training affects the working behaviors.
For a training program to be effective as a mean for reducing musculoskeletal
injuries, it must first modify worker behaviors and biomechanical stresses to a measurable
degree. The ratings of perceived exertion, postural angles and biomechanical measures
were analyzed to evaluate whether training programs had the potential to positively
influenced them.
The results suggest that training did influence certain aspects of working
behaviors. All the postural angles used to evaluate working postures were statistically
significant (included knee angle, included hip angle, included elbow angle, and torso
angle). Training also had an effect in reducing spinal forces (shear force) and joint
moments (shoulder moments). The whole body and shoulder ratings of perceived exertion
showed differences between the training groups.

81
Although differences were found between the Video and Lecture/Practice training
groups, it was difficult to conclude which training method was optimal. For some
dependent measures the Video group had larger differences that favored it, while for
others the Lecture/Practice group seemed to perform better.
After a short period of time (four to six weeks) training still influenced the
participants working behaviors, especially the postural measures. The shoulders and low
back RPE were different as well as the compressive forces and joint moments. These
dependent measures were not positively influenced immediately following training,
therefore the difference found does not explain or imply retention after a short period of
time.
The following discussion includes the interpretation of the statistically significant
dependent variables, their implications on training as well as comparisons with previous
studies. Possible limitations of the study affecting the results are also discussed.
5.1. Pretest
As stated previously, results from the Pretest session were analyzed to determine if
the three training groups were initially uniform and ensure that no differences existed
among them. It was expected that none of the dependent variables for the Training effect
would to be significant, and no significant RPE differences were found between the
training groups. The included knee angle was significant due to differences in the No
training group, which had significantly lower included knee angles than the other groups.
This means that the No training group adopted more of a squat posture. Therefore, the
groups were not initially uniform based on the included knee angle. It was also found that
the No training group had higher shoulder moments than the other two groups. This
implies that the No training group held the patient farther away from their bodies than the
other groups.
The existence of significant differences among the three training groups was
further investigated using an ANOVA to determine if the variations found were not due to
anthropometric differences. No significant differences were found in the height and
weight of the three training groups, and the anthropometric characteristics therefore, not
likely the source of the initial differences. After plotting the data, it was found that

82
several outliers could have decreased and increased the average included knee angle and
the shoulder moments for the No training group respectively. Also, the magnitude for the
included knee angle and the shoulder moment, 7.4° and 5.2 Nm respectively, are
considered small enough so as not to restrict the interpretation of the results obtained from
the study or in further interpretations.
5.2. Posttest 1 – Pretest: Original Learning.
The whole body and shoulder’s RPE showed significant differences for the Training
effect. The Video group had greater decreases on the whole body and shoulders RPE than
the Lecture/Practice training group. This indicates that training, especially the Video
group had changes in the workload perception immediately after training. The control
group also presented large decreases in the RPE when compared to the Lecture/Practice
group.
The end result of this analysis is that the null hypothesis “whole body, shoulder,
and low back ratings of perceived exertion during patient handling activities will not be
affected by the training program(s)”, has been rejected. But, the data presented fail to
provide evidence regarding the effect of training on the low back ratings of perceived
exertion.
As for the postural measures, training caused specific changes in working postures.
The Lecture/Practice group had significantly greater decreases in the included knee
angles. This indicates that the Lecture/Practice group adopted more of a squat-like
posture as a result of the training. The changes in posture could be a result of the training
received on how to properly use the back and the legs. These results confirm the findings
by Hellsing et al. (1993) who reported a decrease in knee angles (more knee flexion) for
the group who received a 3-day intensive course on patient handling techniques.
Some significant differences were also found in the included elbow angles for the
Training effect and when the Task x Training interaction (the effect of training depends on
the task performed). The interaction showed that for the lift up in bed task the levels of
the Training factor were not significantly different while for the wheelchair to bed task the
Video group had an even greater decrease in elbow angle than the other groups. This
means that the Video group further minimized the included elbow angles to hold the

83
patient closer to their body for the wheelchair to bed task. In this case the training seems
to influence the participants working behaviors.
The Assistance x Training interaction was found to be significant for the included
hip angle and the torso angle meaning that the effect of training depends on the type of
assistance provided. The interaction analysis for the included hip angle interaction
showed that for the one person assistance the levels of the Training factor were not
significantly different, while for the two person assistance the No training had a
significant decrease in the included hip angles than the other groups. The Video and
Lecture/Practice groups had larger increases in the included hip angles. This most likely
means that training helped increase the included hip angles to keep the back straight. This
effect was observed for the two-person assistance (and especially for the lift up in bed
task) probably since they don’t have to reach with their hands under the patient’s back
when compared to the one-person assistance (reaching under the patient’s back caused the
participant to flex the trunk). Similarly, the torso angle Assistance x Training interaction
showed that for the one person assistance the levels of the Training factor were not
significantly different while with two person assistance the No training group had
significant decreases in the torso angle. As in the included hip angle, this means that the
participants who received training were trying to keep their backs straight. In other
words, larger included hip angles and torso angles imply that the body was closer to an
erect position. Although no significant differences were expected in the control group,
there were differences (favorable changes) for the included hip angle and torso angle as it
was mentioned. These differences could be an effect caused by learning through practice,
intrinsic learning (after performing the tasks in several occasions they found better ways
to do it), and even a random event. These findings agree with Hellsing’s study (1993)
who reported a reduction in torso angles (less trunk flexion) where the nurses adopted an
erect position since the training emphasized keeping their backs straight and using their
legs.
These results led to a rejection of the null hypothesis, “working postures,
specifically the included hip, included knee, included elbow and torso angles, and
horizontal distance during patient handling activities will not be affected by the training
program(s)”. The included knee angle, included hip angle, the included elbow angle, the

84
torso angle as well as the horizontal distance were affected by the training program. This
implies that training can be effective in changing or modifying working postures.
Some biomechanical measures were significantly affected by training such as the
L5/S1 shear force and the shoulder moments. The Lecture/Practice group had
significantly larger decreases in shear forces than the Video group. Reductions on the
shear force are probably directly related to the more upright posture. This is supported by
the non-significant difference in hand forces between the training groups.
The Lecture/Practice group had significant increases in shoulder moments while
the Video group had only a small decrease, which was not significant. The control group
had no significant differences. For the Lecture/Practice group this could mean that they
were increasing the horizontal distance by increasing the included elbow angles or
applying more force. An ANOVA was conducted on the total force data obtained from
the force platform system. The total force was statistically non-significant for the
Training effect (p = 0.231) and for its interactions. Therefore, the increases in the
shoulder moments could not be explained by changes in hand forces.
These results reject the hypothesis that states that the “biomechanical stress during
patient-handling activities, specifically the compressive and shear forces at the
lumbrosacral disc, the lumbar and shoulder joint moments, and the strength capability at
the shoulders and torso, will be affected by the training program(s)”. The L5/S1 shear
force and the shoulder moments were affected by the training program. For the
compressive force, L5/S1 disc moment and for the strength capabilities the null hypothesis
failed to be rejected.
Among all the dependent measures evaluated, the postural angles as well as the
spinal forces and joint moments were the most useful to evaluate changes in behavior.
The postural angles presented observable modifications in the posture. The
biomechanical measures also provided useful information based on their sensitivity to
changes in hand loads and postural changes. The strength capability is not a normally
distributed variable; it is insensitive to small changes in the input data but not to large
changes. Changes in the RPE for the control group can be observed probably due to the
effect of factors such as practice and intrinsic learning.

85
5.3. Posttest 2 – Posttest 1: Retention.
Another important aspect of the study was to test retention after a short period of
time (4-6 weeks). No significant differences were expected in the dependent variables
that were significant immediately following training implying that the variables that were
positively influenced by training are still being influenced by training after a short period
of time (since they had the same values or no changed occurred). If a dependent measure
is found to be significant it could mean that either a positive or negative change occurred
after a short period of time. In this case the measure must be individually evaluated.
Table 31 shows all the dependent measures with their respective significance or
nonsignificance after a short period of time and its interpretation.
Table 31. Comparison of significant results for the differences between Posttest 1 andPretest and Posttest 2 and Posttest 1. Significant results are indicated by an “*”.
Dependent Variable Posttest 1 -Pretest
Posttest 2 -Posttest 1
Interpretation
Whole body * * Continued learningRPE Shoulders * * Continued learning
Low Back * Continued learningIncluded Knee angle * RetentionIncluded Hip angle * Retention
Postural Measures Included Elbow angle * RetentionTorso angle * RetentionHorizontal distance * RetentionL5/S1 compressive force * Continued learningL5/S1 shear force * Forgetting
Biomechanical Shoulder moments * * Continued learningMeasures L5/S1 moments * Continued learning
Shoulders Strength Capability No changeTorso Strength Capability No change
Short-term retention of training was first evaluated using the RPE analysis. For
the RPE the Assistance x Training interaction was found to be significant after a short
period of time. This includes significant differences on the whole body, shoulders and
low back RPE. The two-person assistance had no significant differences among the levels
of the Training factor for the shoulders RPE while the No training group had significant
decreases for the one-person assistance when compared to the other groups. This might
occur because the two-person assistance is easy to perform, therefore it is hard to reduce

86
the RPE after training. The differences in the RPE imply a positive influence for the
training groups after a short period of time.
None of the postural dependent variables were found to be statistically significant
after a short period of time. Therefore, it is probable that training could have positively
influenced the working postures and behaviors even after a short period of time. In other
words, the participants retained the postures assumed after training (keeping a back
straight and holding the patients close to their bodies).
The L5/S1 compressive force, L5/S1 moments and the shoulder moments were
significantly different among the levels of the Task x Training interaction. The
Lecture/Practice group had reductions on the L5/S1 moments probably due to a reduction
in distance to keep the load close to the body. Similarly, the Lecture/Practice group also
had a significant reduction on the shoulder moments for the lift up in bed task most likely
for the same reasons.
Although it is beyond the scope of this study to clearly identify which training
method helped nurses retain more information, the findings suggest that the
Lecture/Practice group seemed to retain more of what they learned. The Lecture/Practice
group had better results (favorable changes) than the Video group in six out of eight
significant dependent measures. In a similar study, Chaffin et al. (1986) concluded that
the types of lifting behaviors most susceptible to alterations are the ones simple to learn
and to remember.
5.4 Limitations of the study
Certain factors affected the results of this study. Issues regarding the length of the
training, the equipment used and possible confounding influences on subjective
perception. Some of the most relevant sources of errors and/or limitations are listed next.
• Static models, as the 3D SSPP, neglect the effects of acceleration and inertia on the
body leading to an underestimation of the forces and moments generated on the body.
However, the patient handling tasks are relatively slow and controlled motions
offering a simple and relatively accurate means for performing a static analysis.
• The fact that the participants in the second and third session already knew which tasks
were more difficult and stressful could have affected their subjective ratings. That is,

87
the original experience could have affected the perception of the tasks and the effort or
force exerted by the participants even after training. Subjective measures could be
greatly influenced by the participants’ psychological perception and reaction to
different working conditions.
• The dots on the clothing kept moving and/or sticking out and this affected the
calculation of the angles. Also, at times, when drawing the angles on the paper print
outs it was hard to tell where the dots were at since they could have been covered in
the picture by the patients hand, or sometimes the bed. As a result, some of the angles
needed to be estimated.
• Only one single peak force was analyzed per event based on one of the force
components’ maximum reading. This means that the point where the total maximum
force occurred was not necessarily analyzed.
• To some extent the platform limited certain motions. For example, when getting
closer to the bed the participants were not capable of getting as close as they wanted
since they were not allowed to have their feet off the platform.
5.5 Recommendations and Future Research
• A three video camera approach would have provided the necessary information to
more precisely compute the angles that could be observed only from a top view.
• Another limiting factor could be the sample size (N) of the study. Although a sample
size of 24 subjects was employed, a larger sample would help reduce variability.
• Each individual’s aerobic capacity and strength are physical characteristics that could
have been measured. This analysis can help in the interpretation of the results since
the forces are affected by the inter-individual strength variability.
• In order to validate the results, which are obtained by simulating semi-dependent and
dependent patients, it might be necessary to conduct the same test by employing a
dummy or real person of the corresponding height and weight as a dependent patient.
It is expected that the results obtained from this new approach would provide more
accurate data regarding the behavior of a dependent patient.

88
• It is most likely that the differences observed after training are due to the content of
the training program. However, the duration of the two training programs was
different, implying that the effect of duration of the training programs was not isolated
from its content. Therefore, it remains unanswered if the time spent on the training
programs could have an effect on the dependent measures.
Although the Lecture/Practice training was found to be the best approach there are
factors that could be further evaluated to confirm that this type of training leads to less
biomechanical stress than the Video training. As a recommendation for future research,
the duration of the training should be controlled to specifically evaluate whether time or
the content of the training influenced the working behaviors the most. Also, larger sample
sizes and the use of a dynamic model would help to obtain more accurate or reliable
results. The use of a motion analysis system would also help on a more comprehensive
evaluation of the effect of training on the working postures.

89
CHAPTER 6. CONCLUSION
As an assumed precursor to reduce musculoskeletal injuries, training is a potential
modifier of working behaviors. This study has shown that a training program on patient
handling techniques can lead to some changes in nurses working behaviors (especially for
their working postures). These changes in behavior were most evident for the whole body
and shoulder RPE, included knee, elbow, hip, and torso angles, shear forces and shoulder
moments; these were positively influenced by training. Although the L5/S1 compressive
force, the lumbrosacral disc and the low back RPE were nonsignificant immediately after
training they were significant after a short period of time following training. These
differences were due to changes in the control group. This study did not reveal any
changes 4-6 weeks after training in the postural angles (postural angles were significant
immediately after training). No significant differences following a 4-6 weeks delay imply
that training might have still influenced working behaviors after a short period of time (as
a result of retaining the information presented during training). Thus, postural influences
occurring as a result of training, might be expected to continue at least as long as several
months.
After analyzing all the significant dependent measures that involved differences
between the Video and Lecture/Practice training groups the Lecture/Practice training led
to the best results (positive changes) six out of eight times. Therefore, it is probable that
lectures on biomechanics, back injury prevention methods and hands-on practice are the
best approach to reduce strenuous efforts on the L5/S1 disc and shoulders leading to a
reduction of low back and shoulder injuries. Regardless of which of the two training
methods proved to be more effective, this study has shown that training, by positively
influencing behavior, has the potential to provide benefits in terms of changing working
postures, and reducing biomechanical stress.

90
CHAPTER 7. REFERENCES
Andre, T., and Schopper, A. (ed.) (1997). Human Factors Engineering in Systems Design
Wright-Patterson Air Force Base, Ohio:CSERIAC
Armstrong, T. (1996). Control of upper-limb cumulative trauma disorders. Applied
Occupational Environment and Hygiene, 11(4), 275-281.
Appenzeller, O., and Atkinson, R. (1981). Sports Medicine: Fitness, Training and Injuries
(ed.) Maryland: Urban and Schwarzenberg.
Authier, M., Lortie, M., and Gagnon, M. (1996). Manual handling techniques: comparing
novices and experts. International Journal of Industrial Ergonomics, 17, 419-429.
Ayoub, M., McDaniel. (1974). Effects of operator stance on pushing and pulling tasks.
American Institute of Industrial Engineers Transactions, 6 (3), 185-195.
Ayoub, M.M., Dempsey, P.G., and Karwowski, W. (1997). Manual material handling. In
G. Salvendy (ed.), Handbook of Human Factors and Ergonomics (2nd ed.) (pp.1085-
1123). New York: John Wiley and Sons, Inc.
Barker, K.L., and Atha, J. (1994). Reducing the biomechanical stress of lifting by
training. Applied Ergonomics, 25 (6), 373-378.
Borg, G. (1970). Perceived exertion as an indicator of somatic stress. Scandinavian
Journal of Rehabilitation Medicine, 2-3, 92-98.
Borg, G. (1982). Psychophysical bases of perceived exertion. Medicine and Science in
Sports and Exercise, 14 (5), 377-381.
Cady, L., Bischoff, D., O’Connell E., Thomas, P., and Allan J. (1979). Strength and
fitness and subsequent back injuries in firefighters. Journal of Occupational Medicine,
21, 269-275.
Cato, C., Olson, D., and Studer, M. (1989) Incidence, prevalence, and variables
associated with low back pain in staff nurses. American Association of Occupational
Health Nurses Journal, 37 (8), 321-327.
Chaffin, D., Herrin, G., Keyserling, W., and Garg, A. (1977). A method for evaluating
stresses resulting from manual material handling jobs. American Industrial Hygiene
Association Journal, 38, 662-675.

91
Chaffin, D.B., Gallay, L.S., Woolley, C.B., and Kuciemba, S.R. (1986). An evaluation of
the effect of a training program on worker lifting postures. International Journal of
Industrial Ergonomics, 1, 127-136.
Chaffin, D.B., and Andersson, G.B.J. (1991). Occupational Biomechanics (2nd ed.) New
York: John Wiley and Sons, Inc.
Corlett, E.N., Lloyd, P.V., Tarling, C., Troup, J.D., and Wright, B. (1994). The Guide to
the Handling of Patients. Minnesota: IMPACC Co.
Daltroy, L., Iversen, M., Larson, M., Lew, R., Wright, E., Ryan, J., Zwerling, C., Fossel,
A., and Liang, M. (1997). A controlled trial of an educational program to prevent low
back injuries. The New England Journal of Medicine, 337 (5), 322-328.
Dehlin O., Hedenrud, B., Horal, J. (1976). Back symptoms in nursing aides in a geriatric
hospital. Scandinavian Journal of Rehabilitation Medicine, 8, 47-53.
Dick, W., and Carey L. (1996) The Systematic Design of Instruction (4th ed.) New York:
Harper Collins Publishers Inc.
Feldstein, A., Valanis, B., Vollmer, W., Stevens, N., and Overton, C. (1993). The back
injury prevention project pilot study: assessing the effectiveness of back attack, and
injury prevention program among nurses, aides, orderlies. Journal of Occupational
Medicine, 35, 114-120.
Frymoyer, J. (1997). Cost and control of industrial musculoskeletal injuries. In Nordin,
M., Anderson, G., and Pope, M. (Eds.), Musculoskeletal Disorders of the Workplace:
Principles and Practice (pp. 62-71). St. Louis, Missouri: Mosby-Year Book, Inc.
Gambergale, F. (1985). The perception of exertion. Ergonomics, 28 (1), 299-308.
Garg, A., Owen, B., Beller, D., and Banaaag, J. (1991a). A biomechanical and ergonomic
evaluation of patient transferring tasks: bed to wheelchair and wheelchair to bed.
Ergonomics, 34 (3), 289-312.
Garg, A., Owen, B., Beller, D., and Banaag, J. (1991b). A biomechanical and ergonomic
evaluation of patient transferring tasks: wheelchair to showerchair and showerchair to
wheelchair. Ergonomics, 34 (4), 407-419.
Garg, A., and Owen, B. (1992). Reducing back stress to nursing personnel: an ergonomic
intervention in a nursing home. Ergonomics, 33 (11), 1353-1375.

92
Garg, A. (1997). Manual material handling: the science in musculoskeletal disorders in
the workplace: principles and practice. In Nordin, M., Anderson, G., and Pope, M.
(Eds.), Musculoskeletal Disorders of the Workplace: Principles and Practice (pp. 85-
119). St. Louis, Missouri: Mosby-Year Book, Inc.
Goldenhar, L.M., and Schulte, P.A. (1994). Intervention research in occupational health
and safety. Journal of Occupational Medicine, 36 (7), 763-774.
Goldstein, I. (1993). Training in Organizations. California: Brooks/Cole Publishing Co.
Harber, P., Billet E., Gutowski, M., SooHoo, K., Lew, M., and Roman, A. (1985).
Occupational low back pain in hospital nurses. Journal of Occupational Medicine, 27
(7), 518-524.
Hellsing, A., Linton, S., Andershed, B., Bergman, C., and Liew, M. (1993). Ergonomic
education for nursing students. International Journal of Nursing Studies, 30 (6), 499-
510.
Herrin, G.D., Jaraiedi, M., and Anderson, C.K. (1986). Prediction of overexertion injuries
using biomechanical and psychophysical models. American Industrial Hygiene
Journal, 47 (6), 322-330.
Hignett, S. (1996a). Postural analysis of nursing work. Applied Ergonomics, 27 (3),171-
176.
Hignett, S. (1996b). Work-related back pain in nurses. Journal of Advanced Nursing, 23,
1238-1246.
Hilyer, J., Brown, K., Sirles, A., and Peoples L. (1990). A flexibility intervention to
reduce the incidence and severity of joint injuries among municipal firefighters.
Journal of Occupational Medicine, 32, 361-637.
Jensen, R.C. (1985). Events that trigger back pain among nurses. In Proceedings of the
Human Factors Society 29th Annual Meeting (pp.799-801). Santa Monica, CA:
Human Factors Society.
Karas, B.E., and Conrad, K.M. (1996). Back injury prevention interventions in the
workplace. American Association of Occupational Health Nurses Journal, 44 (4),
189-196.
Karhu, O., Kansi, P., and Kuorinka, I. (1977). Correcting working postures in industry: a
practical method for analysis. Applied Ergonomics, 8 (4), 199-201.

93
Karhu, O., Härkönen, R., Sorvali, P., and Vepsäläinen, P. (1981). Observing working
postures in industry: examples of OWAS application. Applied Ergonomics, 3, 13-18.
Karwowski, W. (1991). Psychophysical acceptability and perception of load heaviness by
females. Ergonomics, 34 (4), 487-496.
Keyserling, W. and Willig, S. (1988). An analysis of experts’ ratings of ergonomic
stresses. Ergonomics, 2, 291-304.
King, P.M., Fisher, J.C., and Garg, A. (1997). Evaluation of the impact of employee
ergonomics training in industry. Applied Ergonomics, 28 (4), 249-256.
Klein, B.P., Jensen, R.C., and Sanderson, L.M. (1984). Assessment of workers'
compensation claims for back strains/sprains. Journal of Occupational Medicine, 26
(6), 443-448.
Krawczyk, S. (1996). Psychophysical methodology and the evaluation of manual material
handing and upper extremity intensive work. In Bhattacharya, A., and McGlothlin, J.
(Eds.) Occupational Ergonomics: Theory and Practice (pp. 137-164). New York:
Marcel Dekker, Inc.
Kroemer, K.H.E. (1992). Personnel training for safer material handling. Ergonomics, 35
(9), 1119-1134.
Kroemer, K.H.E., Kroemer, H.J., and Kroemer-Elbert, K.E. (1994). Ergonomics: how to
design for ease and efficiency. Englewood Cliffs, NJ: Prentice Hall.
Lagerström, M., and Hagberg, M. (1997). Evaluation of a 3 year education and training
program. American Association of Occupational Health Nurses Journal, 45 (2), 83-
92.
Ljungberg, A., Kilbom, A., and Hägg, G. (1989). Occupational lifting aides and
warehouse workers. Ergonomics, 32 (1), 59-78.
Long, A. F. (1992). A computerized system for OWAS field collection and analysis. In
Mattila, M., and Karwowski, W. (eds) Computer Applications in Ergonomics,
Occupational Safety and Health (pp.353-358).
Marras, W., Lavender, S., Leurgans, S., Fathallah, F., Ferfuson, S., Allread, W., and
Rajulu, S. (1995). Biomechanical risk factors for occupationally related low back
disorders. Ergonomics, 38 (2), 377-410.

94
NIOSH (1997). Musculoskeletal disorders (MSDs) and workplace factors: a critical
review of epidemiologic evidence for work-related musculoskeletal disorders of the
neck, upper extremity, and low back (2nd Printing). Cincinnati, OH: U.S. Department
Of Health and Human Services Public Health Service.
Nordin, M. (1997). Education and training. In Nordin, M., Anderson, G., and Pope, M.
(Eds.), Musculoskeletal Disorders of the Workplace: Principles and Practice (pp. 234-
241). St. Louis, Missouri: Mosby-Year Book, Inc.
Owen, B.D., and Garg, A. (1989). Patient handling tasks perceived to be most stressful by
nursing assistants. In Proceedings of the International Industrial Ergonomics and
Safety Conference Advances in Industrial Ergonomics and Safety I. (pp.775-781).
Cincinnati, Ohio.
Ryden, L.A., Molgaard, C.A., Bobbitt, S., and Conway, J. (1989). Occupational Low
back pain in a hospital employee population: a epidemiological analysis of multiple
risk factors of a high-risk occupational group. Spine, 14 (3), 315-320.
Saldaña, N. (1996). Active surveillance of work-related musculoskeletal disorders: an
essential component in ergonomic problems. In Bhattacharya, A., and McGlothlin, J.
(Eds.) Occupational Ergonomics: Theory and Practice (pp. 489-500). New York:
Marcel Dekker, Inc.
Stubbs, D.A., Buckle, P.W., Hudson, M.P., Rivers P.M., and Worringham C. J. (1983a).
Back pain in the nursing profession I. Epidemiology and pilot methodology.
Ergonomics, 26, 755-765.
Stubbs, D. A., Buckle, P.W., Hudson, P., Rivers, P.M., and Worringham, C.J. (1983b).
Back pain in the nursing profession: II. The effectiveness of training Ergonomics, 26,
755-779
St.-Vincent, M., Tellier, C., and Lortie, M. (1989). Training in handling: an evaluative
study. Ergonomics, 32 (2), 191-210.
Takala, E.P., and Kukkonen, R. (1987). The handling of patients on geriatric wards.
Applied Ergonomics, 18, 17-22.
Three Dimensional Static Strength Prediction Program, version 4.02 (3D SSPP™).
Regents of The University of Michigan, 1997.
95
Troup, J.D.G., and Rauhala, H.H. (1987). Ergonomics and training. International Journal
of Nursing Studies, 24 (4), 325-330.
Ulin, S., Patellos, C., Chaffin, D.B., Blitz, S. G., Emerick, C. A. Lundy, F., and Misher, L.
(1997). A biomechanical analysis of methods used for transferring totally dependent
patients. SciNursing, 14 (1), 19- 27.
Venning, P.J., Walter, S.D., and Stitt, L.W. (1987). Personal and job-related factors as
determinants of incidence of back injuries among nursing personnel. Journal of
Occupational Medicine, 29 (10), 820-825.
Videman, T., Rauhala, H., Asp, S., Lindstrom, K., Cedercreutz, G., Kamppi, M., Tola, S.,
and Troup, J.D.G. (1989). Patient-handling skill, back injuries, and back pain. Spine,
14 (2), 148-156.
Warner, C. (1994) Lifting and moving patients. San Bruno, California: Krames
Communications.
Waters, T.R., and Putz-Anderson, V. (1996). Manual material handling. In Bhattacharya,
A., and McGlothlin, J. (Eds.), Occupational Ergonomics: Theory and Practice (pp.
329-350). New York: Marcel Dekker, Inc.
Winer, B., Brown, D., and Michels, K. (1991) Statistical Principles in Experimental
Design (3rd ed.) New York: McGraw-Hill, Inc.
Winkelmolen, G. H. M., Landeweerd, J.A., and Drost, M.R. (1994) An evaluation of
patient lifting techniques. Ergonomics, 37 (5), 921-932.
Wood, D.J. (1987). Design and evaluation of a back injury prevention program within a
geriatric hospital. Spine, 12 (2), 77-82.

96
APPENDIX A

97
Topic Outline: Lecture/Practice Training Program
1. PurposeUnderstand your back.Learn proper posture and body mechanics for safer lifting.Reduce the risk of back pain and muscle injury.
2. IntroductionWorkplace injuries
– 76 % of all workplace injuries• 47% involved the back• 25% involved the neck and upper limbs
3. Introduction (cont’d)Low back pain (LBP)
– 8 out of 10 people experience LBP sometime in their lives.
– 40% of nurses LBP complaints are related to patient handling.
– 16% of the new muscle injuries (including back injuries) are related topatient handling.
4. Structure of the body◆ Musculoskeletal System
– Bones (links)
– Articulations (joints)
– Connective Issues• Muscles• Tendons• Ligaments
5. Structure of the spine◆ Vertebral Column◆ Central support structure of the trunk◆ Components
– Vertebrae– Disks– Facets– Muscles– Ligaments
◆ Curvature, Posture◆ Mobility

98
6. Causes of MSDs◆ Risk factors
– Personal factors
– Workplace factors
– Environmental factors
7. Personal factors◆ Age◆ Gender◆ Weight◆ Height◆ Fitness level◆ Previous injury◆ Education◆ Smoking
8. Workplace factors related to injuries◆ Lifting, lowering, pushing, pulling, carrying, holding◆ Weight and size of the load to be moved◆ Distance load is to be moved◆ Frequency and duration of the task
9. Environmental factors◆ Climate
– Heat– Cold
◆ Slips and falls
10. Main Causes of Back Pain◆ Acute or cumulative events◆ Physical workload◆ Postural stress◆ Unaccustomed work
11. How to prevent injuries to the muscles and the backProper posture and movementsBody mechanicsEquipment and assistive devices
12. Summary◆ Keep the object close to your body, always in front; don’t twist.◆ For lifting, keep the trunk up and the knees bent.◆ Minimize the distance through which the person must be moved.◆ All movement should be smooth and planned.
• Jerking and acceleration should be minimized

99
Topic Outline: Video Training
1. Proper Body Mechanics
1.1. Bent your knees
1.2. Keep back straight
1.3. Think twice
2. Patient Handling Demonstrations
2.1. Moving Patient in Bed
2.1.1. Lift up in Bed
2.2. Patient Transfer Techniques
2.2.1. Wheelchair to bed
2.2.2. Bed to wheelchair
2.2.3. Wheelchair to toilet
2.2.4. Toilet to wheelchair

100
APPENDIX B

101
I. Procedure for wheelchair to bed transfer using one person assistance.
STEPS
1. Explain to the patient the steps involved in the move.
2. Adjust bed height at lowest setting if adjustable.
3. Position wheelchair close and parallel to bed.
4. Lock wheelchair and remove armrest nearest the bed if possible.
5. Swing away both legs rests.
6. Slide patient to front of wheelchair, by pulling on knees and having them lean
backward.
7. Stand the patient up
a. Put arms around patient’s chest and clasp hands behind patient’s back.
b. Bend knees and keep back straight.
c. Place leg farthest to wheelchair between your legs.
d. Use body weight to lift patient by leaning back.
8. Pivot toward bed
a. Keep back straight.
b. Bend your knees.
c. Pivot patient toward bed keeping hands clasp around the patient.
9. Assist patient into sitting position in the edge of the bed.
a. Bend patient toward assistant keeping assistant’ knees bend.
b. Lower patient into the edge of the bed.
c. Slide patient into center of the bed keeping the same position.
11. Assist patient in laying down
a. Place one arm behind patient’s neck with hand supporting shoulder blade
b. Place other hand under knees
c. Swing legs up onto bed while gently lowering patient on their side.
d. Turn patient onto back.
12. Adjust wheelchair’s features
a. Replace armrest.
b. Raise patient’s legs.
c. Swing leg rest into position.

102
II. Procedure for wheelchair to bed transfer using two person assistance.
STEPS
1. Explain to the patient the steps involved in the move.
2. Adjust bed height at lowest setting if adjustable.
3. Position wheelchair close and parallel to bed.
4. Lock wheelchair
5. Remove wheelchair armrest nearest the bed if possible.
6. Swing away both legs rests.
7. Lift patient from wheelchair to bed
a. Person 1 approach patient from behind the wheelchair.
b. Person 1 place knee nearest bed on the bed.
c. Person 1 put arms around patient’s chest.
d. Person 1 grasps patient’s wrists.
e. Person 2 stands at patient’s feet.
f. Person 2 raises patient’s legs to a straight position.
g. Person 2 place arms under patient’s knees
h. Keep back straight.
i. Bend your knees.
j. Person 1 and Person 2 simultaneously lift patient.
k. Lower patient into the edge of the bed.
l. Slide patient into center of the bed keeping the same position.
8. Assist patient in laying down
a. Place one arm behind patient’s neck with hand supporting shoulder blade.
b. Place other hand under knees
c. Turn patient onto back.
9. Adjust wheelchair’s features
a. Replace armrest.
b. Raise patient’s legs.
c. Swing leg rest into position.

103
III. Procedure for moving a patient up in bed using the one person assistance.
STEPS
1. Explain to the patient the steps involved in the move.
2. Adjust bed height below your waist if adjustable.
3. Adjust bed into flat position.
4. Assume position to move patient.
a. Stand facing the head of the bed.
b. Point feet in the direction patient is to be moved.
c. Place one foot forward.
d. Flex knees.
5. Move patient up in bed.
a. Place one arm under shoulders.
b. Place the other arm under hips.
c. Ask patient to push with feet and elbows if able.
d. Slide patient toward head of bed.

104
IV. Procedure for moving a patient up in bed using the two person assistance.
STEPS
1. Explain to the patient the steps involved in the move.
2. Adjust bed height below your waist if adjustable.
3. Adjust bed into flat position.
4. Assume position to move patient.
a. Stand facing the head of the bed.
b. Point feet in the direction patient is to be moved.
c. Place one foot forward.
d. Flex knees.
5. Move patient up in bed using a draw sheet
a. Put the head of the bed down.
b. Adjust top of the bed to waist or hip level of the shorter person.
c. Person 1 and 2 simultaneously grasp the draw sheet, pointing one foot in the
direction the patient is to be moved.
d. Lean in the direction of the move, using your legs and body weight.
e. On the count of three, lift and pull the patient up.
f. Repeat step 5 if required.

105
APPENDIX C

106
HEALTH AND HISTORY QUESTIONNAIRE
NAME:_______________________________________
ADDRESS:______________________________________________________________________
TELEPHONE NUMBER:_______________________ E-MAIL :____________________
I. RESPONDENT INFORMATION
1. What is your gender? ❏ Male ❏ Female2. What is your age? _______
II. M EDICAL HISTORY: BACK OR SHOULDER PAIN
During the last month,3. Have you had back or shoulder pain lasting more than 30
minutes? ❏ Yes ❏ No4. Have you had any severe back or shoulder pain (no matter how brief) which made you stop what you were doing? ❏ Yes ❏ No5. Have you taken medication for back or shoulder discomfort? ❏ Yes ❏ No
During the last year,6. Have you suffered from any back or shoulder problems? ❏ Yes ❏ No7. Have you ever had surgery because of back or shoulder
problems? ❏ Yes ❏ No8. Have you been hospitalized because of back or shoulder
problems? ❏ Yes ❏ No9. Have you had any joint dislocations, broken bones, or other
physical injuries? ❏ Yes ❏ No10. Have you ever suffered from any musculoskeletal injuries? ❏ Yes ❏ No11. Specify if any:____________________________________
III. K NOWLEDGE ON TRAINING , ERGONOMICS, AND BIOMECHANICS
12. Have you ever received training in how to transfer or move patients?❏ Yes ❏ No
13. Have you ever had experience (more than 3 months) with lifting or handling heavy objects ormaterials?
❏ Yes ❏ No14. Have you ever received training or instructions on proper lifting techniques?
❏ Yes ❏ No15. Do you have any knowledge of or experience with ergonomics?
❏ Yes ❏ No16. Do you have any knowledge of or experience with biomechanics?
❏ Yes ❏ No17. Do you have any knowledge of or experience with back injury prevention methods?
❏ Yes ❏ No
Signature and Date_______________________________________________

107
VIRGINIA POLYTECHNIC INSTITUTE AND STATE UNIVERSITYInformed Consent for Participants of Investigative Projects
Investigator(s): Noris Torres and Dr. Maury Nussbaum, Faculty Advisor
I. Purpose of this research
The purpose of this research is to examine activities performed by nurses such asmoving, lifting, and handling patients. The study will contribute to the furtherunderstanding of how nurses perform these tasks and how forces are distributed over thebody. Twenty-four subjects will participate in the experiment.
II. Procedures
The experiment will be divided in three sessions and it will be conducted in theIndustrial Ergonomics Laboratory (Whittemore Hall) at the Virginia Polytechnic Instituteand State University. In each session, you will be observed while carrying out eightdifferent patient handling tasks and will require approximately 2 hours. After reading thisinformed consent, if you decide to participate in the experiment you will be asked to signthe form and to fill out a brief questionnaire.
In the first session, you will be able to perform the handling tasks before data iscollected to allow you to get familiarized with the tasks. You will be allowed to have restbreaks of at least 1 minute between each transfer or as much as necessary. Each transfertask will be videotaped. Immediately after each patient transfer, you will be asked to rateyour perceived level of exertion using a written scale, and this will be explained to youbefore starting the experiment. The second session will consist of the same procedures(performing eight patient handling tasks) but it will be held within 72 hours after the firstsession is completed. The third session will be conducted five weeks after completing thesecond session. As you did in sessions one and two, you will be videotaped and asked torate your perception of the level of exertion.
III. Risks
The primary risk involved with performing these manual exertions ismusculoskeletal strain or sprain. The tasks to be performed in the experiment arecomparable to real nursing tasks. The largest physical loads are expected at the shouldersand low back, and it is in these body parts that the likelihood of pain exists. The mostprobable negative outcome is localized muscle soars, probably with a 1 to 2 day delayedonset. More serious, though also much less likely is the risk of an acute back or shoulderstrain. We expect that these outcomes are unlikely. However, it is important that you takeas much rest as you feel is necessary. Further, you should report to the experimenter anypain or discomfort that you experience during the experiment.

108
IV. Benefits of this project
There are no direct benefits to you from this research, other than payment. Nopromise or guarantee of any benefits to you (other than payment) has been made toencourage you to participate in this experiment. However, you may find the experimentinteresting.
V. Extent of Anonymity and Confidentiality
The information collected in this research as well as the results will be treated asconfidential. At no time will the researchers release results that can identify a particularsubject (other than using a coding scheme as noted below) of the study to anyone otherthan individuals working on the project without your written consent. Anonymity will bestrictly enforced. After you have participated, your names will be separated from the data.A coding scheme will be employed to identify the data by a subject number only (e.g.,Subject #1).
While performing the patient handling tasks, your movements will be videotaped.The videotapes recorded will be securely stored in a filing cabinet in the IndustrialErgonomics Laboratory. Only the investigator, Noris Torres, as well as the Facultyadvisor, Dr. Maury Nussbaum, will have access to the videotapes. The videotapes will beerased shortly after completion of the research project.
VI. Compensation
You will be paid $5.00 per hour for the time you actually spend in the experiment.Payment will be made immediately after you have finished each session.
VII. Freedom to Withdraw
You are free to withdraw from this study at any time without penalty. If you choseto withdraw, you will be compensated for the portion of the time of the study in whichyou participated.
VIII. Approval of Research
This research project has been approved, as required, by the Institutional ReviewBoard for Research Involving Human Subjects at Virginia Polytechnic Institute and StateUniversity, by the Department of Industrial and Systems Engineering.
IX. Subject’s Responsibilities
I voluntarily agree to participate in this study and understand I can quit at anytime.

109
X. Subject’s Permission
I have read and understand the Informed Consent and conditions of this project. Ihave had all my questions answered. I hereby acknowledge the above and give myvoluntary consent for participation in this project.
If I participate, I may withdraw at any time without penalty. I agree to abide bythe rules of this project.
____________________________________ ______________________________ Signature Date
Should I have any questions about this research or its conducts, I may contact:
Noris Torres (540) 552-3969Investigator
Dr. Maury Nussbaum (540) 231-6053Faculty Advisor
H.T. Hurd (540) 231-5281Chair, Institutional Review Board, Research Division

110
APPENDIX D
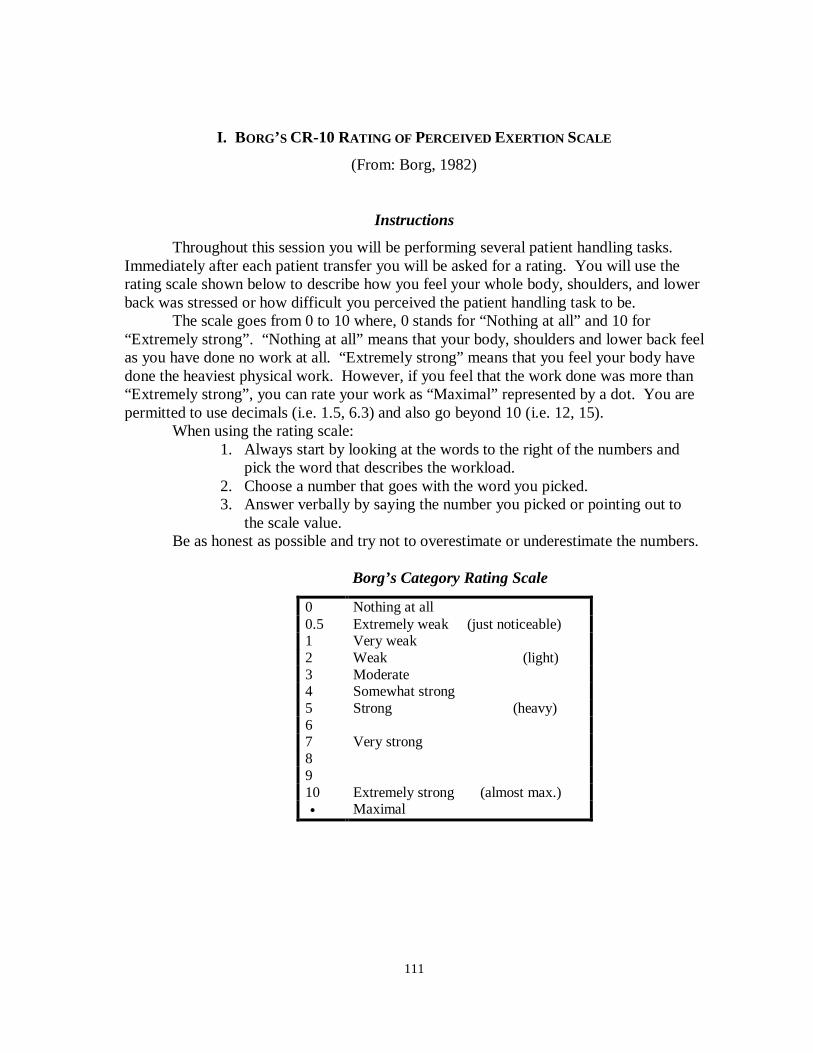
111
I. BORG’S CR-10 RATING OF PERCEIVED EXERTION SCALE
(From: Borg, 1982)
Instructions
Throughout this session you will be performing several patient handling tasks.Immediately after each patient transfer you will be asked for a rating. You will use therating scale shown below to describe how you feel your whole body, shoulders, and lowerback was stressed or how difficult you perceived the patient handling task to be.
The scale goes from 0 to 10 where, 0 stands for “Nothing at all” and 10 for“Extremely strong”. “Nothing at all” means that your body, shoulders and lower back feelas you have done no work at all. “Extremely strong” means that you feel your body havedone the heaviest physical work. However, if you feel that the work done was more than“Extremely strong”, you can rate your work as “Maximal” represented by a dot. You arepermitted to use decimals (i.e. 1.5, 6.3) and also go beyond 10 (i.e. 12, 15).
When using the rating scale:1. Always start by looking at the words to the right of the numbers and
pick the word that describes the workload.2. Choose a number that goes with the word you picked.3. Answer verbally by saying the number you picked or pointing out to
the scale value.Be as honest as possible and try not to overestimate or underestimate the numbers.
Borg’s Category Rating Scale
0 Nothing at all0.5 Extremely weak (just noticeable)1 Very weak2 Weak (light)3 Moderate4 Somewhat strong5 Strong (heavy)67 Very strong8910 Extremely strong (almost max.)• Maximal

112
VITA
NORIS TORRES (Effects of Training in Modifying Work Methods and Behaviors during
common Patient Handling Activities) was born on November 26, 1973, in Ponce, Puerto
Rico. She received her Bachelor of Science in Industrial Engineering from the University
of Puerto Rico at Mayagüez in May 1996.
Through her college years she worked in several projects regarding cost and
process analysis, facilities layout, time studies as well as ergonomic job analysis at several
companies and manufacturing plants in Puerto Rico. These experiences led her to the
understanding that most of the actual processes could be improved further more if there
were to be combined/assessed continuously with the proper human factors / ergonomics
principles.
In August 1996, she came to the Virginia Polytechnic Institute and State
University to pursue a Master of Science degree on Human Factors Engineering and
Ergonomics awarded with the Scholarship of the Economic Development of Puerto Rico.
She is a current member of the Institute of Industrial Engineers, Human Factors and
Ergonomics Society, Tau Beta Pi and Alpha Pi Mu.