Embed Size (px)
Citation preview

International Journal of Scientific & Engineering Research, Volume 6, Issue 11, November-2015 89
ISSN 2229-5518
IJSER © 2015
http://www.ijser.org
Effects of Upsurge of Human Traffic on the Quality of Service of GSM Network in Eagle Square Abuja,
Nigeria.
Ukhurebor Kingsley E, Andikara John, Azi S.O
ABSTRACT: Due to the rapid increase in the number of mobile subscribers in Abuja, Nigeria the optimization and performance evaluation of GSM
network quality is therefore a key parameter in the race for subscribers and this can only be achieved where the network is sufficiently optimized to
meet the grade of services expected from its subscribers/customers. This research is aimed at finding the panacea to the effects and defects of
GSM network especially during Human upsurge so as to improve and ensure better quality of service for the generality of the subscribers.
Keywords: BTS, GSM Network, KPI, NCC, QoS, Subscribers, Upsurge Human Traffic
1. INTRODUCTION
t was a sigh of relief for Nigerians when the Global System
for Mobile Communication (GSM) license was auctioned
by the Nigeria Communications Commission (NCC) in
February 2001, having been denied access to efficient and
quality telecommunication services for quite a long time.
However, the euphoria of the GSM launch in the country and
subsequent commencement of services was soon to give way
to a litany of complaints by subscribers to the various GSM
networks. Poor quality of service became common place and a
national issue, which had to be brought before the country`s
House of Representatives in July 18, 2007 and the NCC, [1]. To
find a lasting solution to the problem, the federal government
through the regulating body for telecommunication services in
Nigeria, the NCC, issued a benchmark on the key performance
indicators (KPIs) for ascertaining quality of service of all the
GSM networks in the country.
The network having been launched for over ten year now,
have witnessed a little improvement in terms of better
coverage and availability but the quality of service generally is
still very far from being satisfactory, especially during major
events when there is an upsurge of people for its attendance
[29].
GSM network performance and QoS evaluation are most
important steps for the mobile operator as the revenue and
customer satisfaction is directly related to network quality and
performance [15].
Network quality is therefore a key parameter in the race for
subscribers and this can only be achieved where the network is
sufficiently optimized to meet the grade of services expected
from its customers. [25], suggested that GSM is not yet
optimized and this is a motivation to trigger new research
topics in optimization and performance evaluation due to the
rapidly increased number of mobile subscribers.
The ultimate purpose of the research is to establish a baseline
that correlates network quality and performance within an
area with the upsurge of people during major events and
characterize such areas where improvement can be achieved in
terms of upgrading/optimizing the network elements
preparatory to such events taking place. In addition to finding
bottlenecks militating against optimal network performance,
this work aims to identify the cause or the limiting factor
impeding good quality of service and hence, select a
management action to remove the problems and safeguard
quality of service degradations [29].
2. REVIEW OF PREVIOUS WORKS.
Network Performance Management and Optimization is
necessary to access network performance and maintain quality
of Service (QoS) standards. It identifies inconsistencies or
limitations in current overall network design and helps to
improve processes. Thus, resulting in optimized networks and
improved quality of service due to this fact there has been
I
IJSER

International Journal of Scientific & Engineering Research, Volume 6, Issue 11, November-2015 90
ISSN 2229-5518
IJSER © 2015
http://www.ijser.org
much research concerning the quality of service (QoS) of
Global System of Mobile Communication (GSM).
An appraisal of the performance of GSM operators using
Nigeria as a case study and examined the problems facing the
industry [1]. Having evaluated the parameters that attributed
to poor quality of service by operators, they came up with
methods that are suggested towards improving network
performance. The methods suggested did not take into
consideration the nature of user demands and capacity of
channels. They only focused on improving the performance of
the network elements.
Network performance evaluation and quality of service (QoS)
improvement of mobile cellular systems in Nigeria using an
ICH as a case study [28]. In this work the important Key
Performance Indicators (KPIs) for QoS evaluation which are
used in evaluating the Mobile networks was also identified.
The result of their study show that the QoS of mobile system in
the country is not 100% reliable and still needs to be improved
upon.
In [11], the customer’s complaint method was used to
investigate performance evaluation on QoS of GSM networks
in Nigeria. They employed four assessment parameters;
network accessibility, service retainability, connection quality
and network coverage for their investigation and concluded
that the QoS and overall performance of the GSM operations in
Nigeria is poor, unreliable and unsatisfactory. The building of
more base stations to increase network coverage and ease
congestion was recommended to the service providers, for an
improved QoS and overall performance of their networks.
However [4], showed that an existing network can be
optimized using different methodologies and time parameter
tuning to offer remarkable QoS to the end users. They
recommended that all mobile operators must ensure a better
QoS up to a certain threshold and baselines in order to satisfy
official regulatory bodies by ensuring robust and continuous
optimization of their networks. Live network statistical model
was employed to arrive at their conclusions and
recommendations.
In Radio Access Network Quality Improvement Techniques
[18] used drive test statistics to estimate the coverage and
receive qualities of two GSM operators towards an improved
network.
The NCC, as reported in the Guardian Newspaper of March
22, 2005 also used the drive test method in its report on
Network Quality of Service and performance of the GSM
networks in Nigeria.
In [6], the railway environment was used in investigating
GPRS KPI measurement techniques through manual and
automated field concepts. The railway environment presents a
unique challenge for cellular radio coverage because of its
difficult terrain by the fact that the train and mobile stations
(MSs) may travel at very high speeds. They concluded that
GPRS throughput performance decreases with increased
mobility of the mobile station and recommended that the
removal of mobility effect from trial measurements on
railways would improve their comparability to stationary
measurements, which are typically used for establishing KPI
levels.
A knowledge based model can also be used to analyze the
performance of a GSM network. In [20], data records from an
operational GSM network was used to analyze network
performance by employing a subsystem hierarchy for their
data analysis. Four main components of user perceived quality
were adopted for their investigation. These are cause–effect
chains for blocking of services, call set up failures, call
dropping and hand over failures. They concluded that
knowledge of the cause effect chains generating the subscriber
perceived quality problems can be used to enhance current
radio resource usage in an operating network.
The last but not the least commonly used method to evaluate
network performance is by the network data itself. The
IJSER

International Journal of Scientific & Engineering Research, Volume 6, Issue 11, November-2015 91
ISSN 2229-5518
IJSER © 2015
http://www.ijser.org
network service providers install on their networks a Network
Management System (NMS) with an online database that is
responsible for the collection of everything that happens on its
network, in a raw data form. In order to measure network
performance and offer good quality of service for customer
satisfaction and retention, this data is analysed and evaluated
to spots events, trends, problems areas and key performance
indicators. The availability of a detailed report on these trends
and data aggregation allows for a faster and more accurate
analysis and resolutions of customer complaints towards an
efficient network with good QoS [26].
By the very nature that these reports show problem areas of
the network in raw data form, it is seriously guarded by the
network service providers. This has been the problem that
previous researchers face in the adoption of network statistics
method for performance analysis and evaluations. This
underscores why research in the area (network statistics
method), though most reliable compared to others, has not
been very robust relative to the other two, earlier mentioned. I
was able to obtain a solution that provides full visibility of the
network data of an operational GSM network by which this
research was undertaken. It is one of the best performance
monitoring and evaluation techniques or methodology.
3. CELLULAR NETWORK PERFORMANCE
The operation of a cellular network can be interpreted to
consist of a sequence of events. From network operations point
of view, certain events are closely associated with bad
performance, lack of resources or failures. The entire network
event such as call drops, call initiation, traffic channel
assignment, traffic channel release, traffic channel demand and
many more are reported to the Base Station Controller (BSC)
by the Base Transceiver Station (BTS). Therefore, different
counters are being triggered against different events. An event
either increases or decreases a specific counter value. The
counters are computed by the BSC over a measurement period
(typically one hour) and stored in the Network Management
System. But this data is in the raw form and doesn’t depict any
meaningful information until it is interpreted using some
formulation in the form of KPIs. Hence evaluation criteria use
counters and KPIs to depict network QoS as a whole. These
KPIs when taken together, forms the overall QoS report for the
entire network in terms of service accessibility, retainability
and connection quality as reported by [23].
4. SERVICE ACCESSIBILITY
This is the ease with which the service is obtained within a
specified threshold and derivable when requested by the user.
For instance, a short message service, SMS, sent by subscriber
“A” to subscriber “B” switched ON and within the service area
is set at five seconds by the regulatory authority, NCC (2009).
If the message is not delivered after five seconds as bench
marked by the regulator, the service is hence, inaccessible. The
target for SMS success rate as set by the NCC is 100%.
Accessibility is therefore the number of successful calls set up
per the total number of calls access to the network.
The most common KPIs connected to accessibility are as listed
below:
4.1. Paging success rate
The paging success rate measures the percentage of paging
attempts that have been answered, either as a result of the first
or the second repeated page.
PSR = Time of Paging Responses
Time of Paging
Possible reasons for poor Paging Performance could be
traceable to:
Paging congestion in MSC
Paging congestion in BSC
Paging congestion in Base Transceiver Station (BTS)
Poor paging strategy
Poor parameter setting
Poor coverage
High interference
The Nigerian Communications Commission, NCC, set this KPI
at 95% of attempts for the busy hour.
IJSER

International Journal of Scientific & Engineering Research, Volume 6, Issue 11, November-2015 92
ISSN 2229-5518
IJSER © 2015
http://www.ijser.org
4.2. SDCCH Access Success Rate.
SDCCH access success rate is a percentage of all SDCCH
accesses received in the BSC.
Possible reasons for poor SDCCH Access Performance could
be:
Too High Timing Advance (MHT)
Access Burst from another Co-channel, Co-BSIC Cell
Congestion
False Accesses due to High Noise Floor
Unknown Access Cause Code
The busy hour SDCCH congestion as set by the NCC to be
measured both at the BSC and cell level is 2%.
4.3. SDCCH Drop Rate
The SDCCH DROP RATE statistics compares the total number
of RF losses (while using an SDCCH), as a percentage of the
total number of call attempts for SDCCH channels. This
statistics is intended to give an indication of how good the
cell/system is at preserving calls.
SDCCH Drop Rate =
______________
SDCCH Seizures
Possible reasons for SDCCH RF Loss include:
Low Signal Strength on Down or Uplink
Poor Quality on Down or Uplink
Too High Timing Advance
Congestion on TCH
The set target for this KPI is below 1.2%.
4. 4. Call Setup Success Rate (CSSR)
The QoS of a network can also be ascertained by the user
experience in establishing a call. It can be very frustrating for
the subscriber to a network that after repeated dialing,
especially in an emergent situation, he cannot get his call
through to the call party. The Call Setup Success Rate gives the
fraction of attempts to establish a call which results in a
successful connection to the dialed number. It is the ease by
which a call is connected after a dial and measures successful
TCH assignments over the total number of TCH assignment
attempts. This KPI can be calculated using the following
expression:
CSSR = (1 - SDCCH Congestion Rate)* TCH Assignment Success
Rate
The following are some of the reasons which accounts for a
low call setup success rate in a cell;
Radio interface congestion.
Effects of Interference and fading.
Poor coverage.
Faulty hardware units.
Increase in radio traffic in inbound network.
Limitations in access network transmission path.
Low CSSR can be improved by taking the following corrective
actions:
Upgrade and enhancement of radio resources.
Expansion of the transport media to accommodate
hardware upgrades such as addition of more TRXs to
the congested cell.
Reduction of mean time to repair (MTTR) where faults
occur, to ensure resource availability.
The target for this KPI as set by the NCC is 98%.
4.5. Call Setup TCH Congestion Rate
The Call Setup TCH Congestion Rate statistics provides the
percentage of attempts to allocate a TCH call setup that were
blocked in a cell.
Call Setup TCH Congestion Rate = No of TCH Blocks (Excluding HO)
No of TCH Attempts
Possible reasons for call setup block include:
Increasing Traffic Demand
Bad Dimensioning
HW Fault & Installation Fault
High Antenna Position
High Mean Holding Time (MHT)
Low Handover Activity
Congestion in Surrounding Cells
SDCCH Drops IJSER

International Journal of Scientific & Engineering Research, Volume 6, Issue 11, November-2015 93
ISSN 2229-5518
IJSER © 2015
http://www.ijser.org
The set target for this KPI by NCC is below 2%.
5. SERVICE RETAINABILITY
Service retainability refers to the ability of the provided
service, once it has been obtained, to continue unhindered for
the requested duration. It is a measure of the probability that a
call, once it has been connected, will not be disengaged or
terminated until there is a sign off by the parties involved.
Retainability can thus be given as:
Retainability = ______________________
Total Successful Calls setup
The KPIs connected to service retainability are listed below.
5.1. Call Drop Rate
This KPI gives the rate of calls not completed successfully. This
is expressed as:
CDR = Number of TCH Drops after assignment
Total Number of TCH assignment
Possible reasons for TCH Drop Call Rate are:
Low Signal Strength on Down or Uplink
Lack of Best Server
Congestion in neighboring cells
Battery Flaw
Poor Quality on Down or Uplink
Too High Timing Advance
Antenna problems
Low BTS Output Power
Missing Neighboring Cell Definitions
Unsuccessful Outgoing Handover
Unsuccessful Incoming Handover
The busy hour drop rate as set by NCC is below 2%.
5.2. Handover Success Rate
The handover success rate shows the percentage of successful
handovers of all handover attempts. A handover attempt is
when a handover command is sent to the mobile station. Poor
handover success rate arises as a result of the following factors;
Congestion
Link Connection or HW Failure
Bad Antenna Installation
Incorrect Handover Relations
Incorrect Locating Parameter Setting
Bad Radio Coverage
High Interference, Co-channel or Adjacent.
The busy hour Handover Success Rate set by NCC at all hours
= 99%.
6. SERVICE AVAILABILITY
Availability is defined as the percentage of time that the basic
physical channels are available for use. The path used to carry
information between a Mobile station and the base transceiver
stations is known as the physical channel. It is embedded in
the air interface between the BTS and MS. The different
information carried on the physical channels is classified as
logical channels. The logical channels are divided into two
categories; the control channels and the traffic channels. The
percentage traffic channels, PTTCH available in a cell defines
the availability of the cell. Thus for a BTS that is made up of
three cells, the sum total of the PTTCH for all the cells makes
up the availability of the BTS. The BTSs in the network must be
available for that network to be accessible. The retainability of
the network is also a function of PTTCH availability because
we cannot retain what cannot be accessed. Network
availability is therefore a pedestal by which the QoS of an
operational network are measured. It is affected by faulty base
station equipment, bad transmission links or wrong
configuration parameters defined at the BSC. The target for
this KPI as set by the NCC is 99%.
Total Calls Completed
IJSER

International Journal of Scientific & Engineering Research, Volume 6, Issue 11, November-2015 94
ISSN 2229-5518
IJSER © 2015
http://www.ijser.org
With the benchmark or KPIs defined by NCC as a baseline,
juxtaposed with the data from an operating GSM network
service provider, a comparison was made using several
parametric indices of network assessment, enumerated above
to analyze the performance of the network by cell clusters
where there is mobility of people for an event and when the
event is not holding in the area.
7. RESEARCH METHODOLOGY
The research was undertaken using a comparative process
where the network statistics of an operational GSM service
provider was investigated under the following metrics; Call
Setup Success Rate (CSSR), Percentage Drop Call Rate
(PDROP), Handover Success Rate (HOSR), Percentage TCH
Congestion Rate (PCONG) and Percentage of unsuccessful
Control Channel Setup (PCTRLFAIL) which shows the control
channels that could not be setup or dropped, as an effect of
Standalone Dedicated Control Channel congestion (SDCCH).
These counters are taken together for QoS evaluations relative
to the sites/cells covering an area of event while the event is
taking place. The result is compared with the data obtained
when there is no event and hence, fewer number of people in
the same area.
Typically, since the important KPIs for QoS evaluation
describe the success/failure rates of the metrics outlined above
and all of them are affected by PTTCH availability, this metric
was also included in the analysis.
By using the network statistics, which gives a more accurate
picture of the events in the network [4] in raw data, the metrics
were investigated relative to the benchmark defined by NCC,
for the period when there was heavy mobility of people within
an area such as obtained This was done for the period while
the event was taking place and when there was no event
within the area specified.
The period and time selected for investigation were when
there was high mobility or concentration of people specifically
during the Presidential primaries of the People’s Democratic
Party, PDP, on 13th January 2011, at Eagles Square, Abuja. The
BTSs covering these areas were critically examined at cell
levels to estimate any change or patterns of behaviour when
there is less concentration of human traffic and when there is
an upsurge of crowd.
9. ANALYSIS OF DATA AND RESULT
The network data for the BTS covering the Eagle’s Square at
Abuja during the Presidential primaries of the People’s
Democratic Party, (PDP), held on the 13th of January 2011, was
analysed. Table 2, Table 3 and Table 4 in the appendix gives
the raw data corresponding to the graphs in Figure 1, Figure 2
and Figure 3 below for cell A, Cell B and Cell C of the BTS
respectively.
Figure 1: Graphical representation of results for stats, before,
during & after PDP Primaries of 13th & 14 Jan. 2011(Cell A)
Figure 2: Graphical representation of results for stats, before,
during & after PDP Primaries of 13th & 14 Jan. 2011(Cell B).
IJSER

International Journal of Scientific & Engineering Research, Volume 6, Issue 11, November-2015 95
ISSN 2229-5518
IJSER © 2015
http://www.ijser.org
Figure 3: Graphical representation of results for stats, before,
during & after PDP Primaries of 13th & 14 Jan. 2011(Cell C)
It was observed that between 1600hrs and 2200hrs on the 13th
of September, 2011 the KPIs for the cells covering the area
(Figure 1 and Figure 2) was at its worst. This was as a result of
the upsurge of crowd for the Presidential primaries and
apparently the quality of service of GSM network experienced
within this area during this period would be anything but
optimal. Consequently, the network quality and performance
within an area is seriously affected by the mobility or upsurge
of people in the locality.
As illustrated in the data analysis above, the network statistics
of the operational GSM network were pooled under a
measurement period of one hour for all hours of operation.
The results were analysed through a comparative process by
comparing the data obtained from the sample areas under a
normal day occurrence and during events (where there is an
upsurge of crowd) with the KPI targets as benchmarked by
NCC. The summary of the results are shown below:
Table1: Coverage at Eagle’s Square, Abuja.
KPIs NCC
NORMAL
DAY
OCCURENCE
%
STATISTICS
DURING
EVENTS %
PCONG ≤ 2.0% 0 1.5
PCTRLFAIL ≤ 1.2% 0.98 1.15
PDROP ≤ 2.0% 12.5 95.36
HOSR ≥ 99.0% 91.0% 61.29
CSSR ≥ 98.0% 90.2 84.72
PTTCH ≥ 98.5% 100 100
The results show that even for a normal day occurrence, that
is, without any event attracting the upsurge of a crowd, the
KPIs show a marked departure from the benchmark defined
by NCC. The situation became worse during major events with
the upsurge of people within the area. The percentage TCH
congestion increases sharply within the period of events while
the CSSR reduces. The percentage of unsuccessful control
channel setup, which shows the control channels that couldn’t
be set up or dropped, increases within the period to show that
there was high level congestion within the area as the available
network elements servicing the area was not enough to meet
up with the demand for signalling channels within the period.
Overall, the accessibility to the network within the period
reduces drastically and this explains why subscribers in that
area cannot readily get a call through with their mobile
stations.
10. CONCLUSION AND RECOMMENDATIONS
We can conclude that the quality of service of an operational
GSM network in a given area like the area under investigation
is mainly affected by the mobility or upsurge of people within
the area at any given time. Therefore, network quality and
performance within an area can be improved by a proactive
optimization of the network and provision of contingencies
like the deployment of mobile BTSs to accommodate any
upsurge of human traffic especially during major events that
attracts the mobility of people.
Poor handover success rates, low call setup success rate,
frequent call drops etc, which affects the quality of service in
an operational cellular network are pointers of an optimization
head room. Due the many defects of GSM network such as
poor handover success rates, low call setup success rate,
frequently call drops just to mention but a few as pointed out
by [26], GSM is not yet optimised. As a result of this, the
following panacea are hereby recommended to enhance better
quality of service of GSM network in Abuja in particular and
Nigeria at large:
IJSER

International Journal of Scientific & Engineering Research, Volume 6, Issue 11, November-2015 96
ISSN 2229-5518
IJSER © 2015
http://www.ijser.org
The various GSM network providers should ensure a
robust and vigorous optimization of its network for
better service delivery to its numerous subscribers.
There should not be reactive rather be proactive in the
optimization models for the GSM network providers.
This can be actualized for example before any major
event in an area, the respective and various GSM
network providers should deploy an I-site or a mobile
BTS to such areas before the commencement of the
event.
The regulatory body that is NCC should wake up to its
responsibility in the area of proper and appropriate
supervision of the GSM networks to catholicon and
ensure better quality of service for the generality of the
subscribers.
11. REFERENCES
1. Adegoke, A. S. Babalola, I.T., and Balogun, W. A.
(2008). “Performance Evaluation of GSM Mobile
System in Nigeria”, Pacific Journal of Science and
Technology, 9(2), 436- 441.
2. Akram Aburas, Prof Khalid Al Mashouq: Call Quality
Measurement and Application; Journal of Selected
Areas in Telecommunications (JSAT), April Edition, 2011.
3. Adebayo, T. L. and Edeko, F.O: “Investigation on
coverage level, accessibility index and propagation
path loss characteristics and working of power
received of GSM signal. University of Benin. (2005).
4. Bilal Haider, M. Zafarrullah Khan and M.K. Islam:
Radio Frequency Optimization and QOS in
operational GSM network on Proceedings of the
World Congress on Engineering &Comp Sci, Vol 1
WCECS 2009.
5. Cellular Networks of Present and Future Generation;
IST Mobile Summit 2001, Barcelona, Spain, 9-12
September 2001.
6. Dirk Michel and Vaidyanathan Ramasarma: “GPRS
KPI Measurement Techniques for the Railway
Environment.
Wireless Network Engineering, Nortel Networks,
Maidenhead Office Park, Westacott Way, Berkshire,
UK. (2005).
7. Ericsson GSM RBS 2000 Basics by Ericsson Radio
Systems AB © 1998.
8. Gaurav Kumar Nigam: “Technical challenges and
Constraints for Spectrum Planning in GSM
networks”, Ideal Institute of Technology, Ghaziabad
U.P. India. (IJCSE) vol. 02, No. 09, 2010, 2921-
2923.
9. GSM System Survey: “Ericsson Radio Systems AB” ©
1998.
10. Harry L. Bertoni : “Radio Propagation for Modern
Wireless Systems”. Prentice Hall © 2000.
11. J.J Popoola, I. O. Megbowon, V.S.A. Adeloye;
“Performance Evaluation and Improvement on
Quality of Service of Global System for Mobile
Communications in Nigeria”. Journal of Information
Tech Impact Vol9,No.2, pp91-106, 2009.
12. Juan Ventura Agustina, Peng Zhang, Raimo Kantola:
“Performance evaluation of GSM handover traffic in
a GPRS/GSM network”, Networking Laboratory,
Helsinki University of Technology Otakaari 5A, Espoo,
Finland.
13. Jahangir H. Sarker, Seppo J. H. and Mika Rinne
“Performance Analysis of GSM Traffic Channel
IJSER

International Journal of Scientific & Engineering Research, Volume 6, Issue 11, November-2015 97
ISSN 2229-5518
IJSER © 2015
http://www.ijser.org
Capacity with(out) High Speed Circuit, Switched
Data Communications Laboratory, Helsinki
University of Technology Finland.
14. Jahangir Khan: “Handover management in GSM
cellular system”; School of computer science ,
Pakistan Air Force Base Korangi Creek Karachi 75190,
International Journal of Computer Applications (0975 –
8887) Vol. 8, N0. 12, (Oct. 2010).
15. Journal Media and Communication Studies Vol. 2(5),
pp. 122-126, (2010).
16. Kuboye Bamidele M: Optimization models for
minimizing Congestion in Global System for
Mobile Communications (GSM) in Nigeria. Federal
University of Technology, Akure, Ondo State, Nigeria.
(April 2010).
17. Kuboye B, M., Alese, B. K., and Fajuyigbe, O:
“Congestion Analysis on the Nigerian Global
System for Mobile Communications (GSM)
Network. The Pacific Journal of Science and
Technology, 10(1), 262-271. (2009).
18. Mudassar Ali, Asim Shehzad, Dr, M. Adeel Akram;
“Radio Access Network Quality Improvement
Techniques”; Radio Access Network Audit and
Optimization in GSM. International Journal of
Engineering and Technology IJET-IJENS Vol: 10, 01.
19. Pasi Lehtimaki and Kimmo Raivio. “A Knowledge-
Based Model for Analyzing GSM Network
Performance”.
Helsinki University of Technology Laboratory of Computer
and Information Science. FIN-02015 HUT, Finland.
20. Pasi Lehtimaki and Kimmo Raivio. “A SOM based
approach for visualization of GSM network
performance data.
Proceedings of the 18th International Conference on
Industrial and Engineering Applications of Artificial
Intelligence and Expert Systems, 2005.
21. Proceedings of the World Congress on Engineering
and Computer Science. Vol. 1 WCECS 2009, October
20-22, 2009, San Francisco, USA.
22. P.C. Bassey and M. A. Raheem: “Dynamic Control
Ontology for Efficient GSM Quality of Service”,
Nigerian Computer Society: 10th International Conference,
July 25-26, 2011.
23. Pipikakis, M. (2004). “Evaluating and Improving the
Quality of Service of Second-Generation Cellular
Systems”,
Bechtel Telecommunications Technical Journal, 2(2), 1-8.
24. R.C.V. Macario: “Cellular Radio Principles and
Design”, Macmillan Press Ltd. Second Edition 1997.
25. Sofoklis A. Kyriazakos and George T. Karetos.
“Practical Radio Resource Management in
Wireless Systems. Artech House, Inc., 2004.
26. S. Kyriazakos, N. Papaoulakis, D. Nikitopoulos, E.
Gkroustiotis, C, Kechagias, C, Karambalis and G.
Karetsos: “A Comprehensive Study and Performance
Evaluation of Operational GSM and GPRS Systems
under Varying Traffic Conditions”.
Telecommunications Laboratory National Technical
University of Athens, Heroon Polytechniou 9, Greece.
27. Trevor Manning: “Microwave Radio Transmission
Design Guide”, Artech House Books. © 1999.
28. 3GPP TS 23.107, “Quality of Service (QoS) Concept
and Architecture”, V.3.9.0, September 2002.
IJSER
International Journal of Scientific & Engineering Research, Volume 6, Issue 11, November-2015 98
ISSN 2229-5518
IJSER © 2015
http://www.ijser.org
29. Ukhurebor K. E, Awodu O.M, Abiodun I.C and Azi
S.O: A Comparative Study of the Quality of service
of GSM Network During Crowd Upsurge in
University of Benin, Nigeria. International Journal of
Science and Engineering, Volume 6 Issue 10 October, 2015.
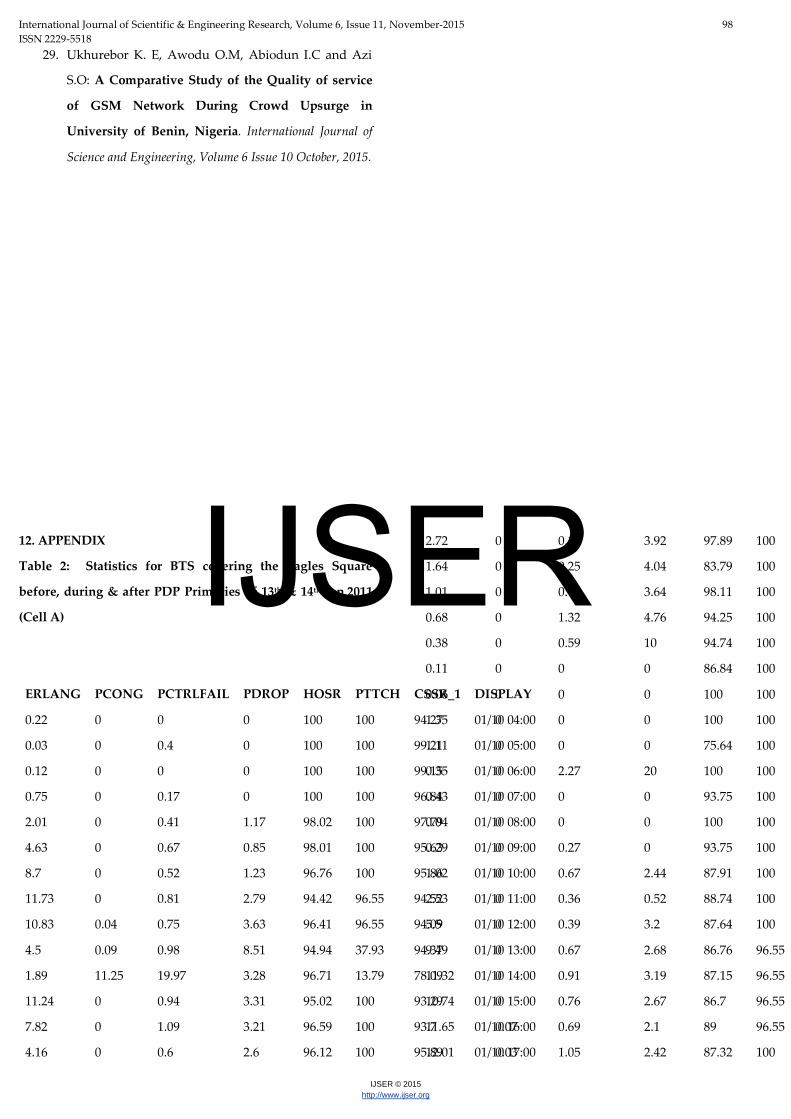
12. APPENDIX
Table 2: Statistics for BTS covering the Eagles Square
before, during & after PDP Primaries of 13th & 14th Jan.2011
(Cell A)
ERLANG PCONG PCTRLFAIL PDROP HOSR PTTCH CSSR_1 DISPLAY
0.22 0 0 0 100 100 94.27 01/10 04:00
0.03 0 0.4 0 100 100 99.21 01/10 05:00
0.12 0 0 0 100 100 99.15 01/10 06:00
0.75 0 0.17 0 100 100 96.84 01/10 07:00
2.01 0 0.41 1.17 98.02 100 97.79 01/10 08:00
4.63 0 0.67 0.85 98.01 100 95.63 01/10 09:00
8.7 0 0.52 1.23 96.76 100 95.86 01/10 10:00
11.73 0 0.81 2.79 94.42 96.55 94.52 01/10 11:00
10.83 0.04 0.75 3.63 96.41 96.55 94.09 01/10 12:00
4.5 0.09 0.98 8.51 94.94 37.93 94.37 01/10 13:00
1.89 11.25 19.97 3.28 96.71 13.79 78.09 01/10 14:00
11.24 0 0.94 3.31 95.02 100 93.29 01/10 15:00
7.82 0 1.09 3.21 96.59 100 93.7 01/10 16:00
4.16 0 0.6 2.6 96.12 100 95.89 01/10 17:00
2.72 0 0.17 3.92 97.89 100 96.14 01/10 18:00
1.64 0 0.25 4.04 83.79 100 94.39 01/10 19:00
1.01 0 0.99 3.64 98.11 100 96.27 01/10 20:00
0.68 0 1.32 4.76 94.25 100 95.11 01/10 21:00
0.38 0 0.59 10 94.74 100 94.11 01/10 22:00
0.11 0 0 0 86.84 100 96.84 01/10 23:00
0.06 0 0 0 100 100 92.84 01/11 00:00
1.35 0 0 0 100 100 99.98 01/11 01:00
1.11 0 0 0 75.64 100 99.98 01/11 02:00
0.35 0 2.27 20 100 100 97.71 01/11 03:00
0.43 0 0 0 93.75 100 99.99 01/11 04:00
0.04 0 0 0 100 100 100 01/11 05:00
0.29 0 0.27 0 93.75 100 97.67 01/11 06:00
1.02 0 0.67 2.44 87.91 100 97.48 01/11 07:00
2.53 0 0.36 0.52 88.74 100 98.38 01/11 08:00
5.5 0 0.39 3.2 87.64 100 96.19 01/11 09:00
9.49 0 0.67 2.68 86.76 96.55 96.65 01/11 10:00
11.32 0 0.91 3.19 87.15 96.55 95.52 01/11 11:00
10.74 0 0.76 2.67 86.7 96.55 95.17 01/11 12:00
11.65 0.07 0.69 2.1 89 96.55 96.26 01/11 13:00
12.01 0.03 1.05 2.42 87.32 100 94.77 01/11 14:00
IJSER

International Journal of Scientific & Engineering Research, Volume 6, Issue 11, November-2015 99
ISSN 2229-5518
IJSER © 2015
http://www.ijser.org
10.2 0 0.73 3.88 85.95 100 94.96 01/11 15:00
7.27 0 0.72 2.04 90.36 100 95.54 01/11 16:00
4.01 0 0.82 2.12 85.36 100 94.79 01/11 17:00
1.89 0 0.4 2.84 86.47 100 94.39 01/11 18:00
1.35 0.27 1.25 2.83 86.74 100 91.17 01/11 19:00
1.13 0 0.3 5 84.46 100 95.03 01/11 20:00
0.89 0 0.22 5.26 64.22 100 96.06 01/11 21:00
0.3 0 0.42 0 87.1 100 93.23 01/11 22:00
0.19 0 0.69 0 76.67 100 97.93 01/11 23:00
0.32 0 0 0 79.49 100 99.99 01/12 00:00
0.58 0 1.22 12.5 85.42 100 91.54 01/12 01:00
0.51 0 1.43 0 97.62 100 97.15 01/12 02:00
0.12 0 0 0 96.3 100 98.52 01/12 03:00
0.03 0 0 0 100 100 99.99 01/12 04:00
0.11 0 0 0 100 100 98.13 01/12 05:00
0.37 0 0.13 0 76.67 100 94.61 01/12 06:00
1.08 0 0.16 3.17 90.96 100 99.38 01/12 07:00
2.59 0 0.34 2.91 86.44 100 97.97 01/12 08:00
5.59 0 0.52 1.75 89.08 100 96.1 01/12 09:00
8.12 0 0.64 2.21 89.17 100 96.61 01/12 10:00
10.91 0 0.88 2.65 87.11 96.55 95.07 01/12 11:00
12.87 0.03 1.11 3.76 86.05 96.55 93.31 01/12 12:00
11.6 0 1.07 3.02 87.44 100 94.48 01/12 13:00
12.04 0.03 0.66 3.23 91.11 96.55 94.77 01/12 14:00
10.62 0 0.76 3.37 96.02 96.55 94.86 01/12 15:00
7.5 0 0.65 3.67 95.28 100 94.22 01/12 16:00
4.26 0 1.02 2.8 96.9 100 94.02 01/12 17:00
2.25 0 0.48 1.91 97.99 100 95.05 01/12 18:00
1.11 0 0.93 1.79 96.26 100 90.96 01/12 19:00
0.81 0 1.35 1.33 98.11 100 92.27 01/12 20:00
0.57 0 1.4 0 98.04 100 86.82 01/12 21:00
0.34 0 0.9 0 97.4 100 95.08 01/12 22:00
0.11 0 1.6 0 100 100 98.39 01/12 23:00
0.52 0 0 0 93.75 100 90 01/13 00:00
0.26 0 6.54 0 100 100 87.34 01/13 01:00
0.58 0 2.94 12.5 97.37 100 87.54 01/13 02:00
0.13 0 1.85 0 100 100 98.13 01/13 03:00
0.83 0 0 0 97.44 100 93.81 01/13 04:00
0.09 0 0.49 0 100 100 96.61 01/13 05:00
0.34 0 0.44 0 98.31 100 98.69 01/13 06:00
0.72 0 0.15 0 97.69 100 97.8 01/13 07:00
1.24 0 0.41 0.98 98.19 100 97.39 01/13 08:00
1.55 0 0.36 2.99 98.94 100 95.62 01/13 09:00
1.98 0 0.33 0 98.76 100 96.27 01/13 10:00
2.1 0 0.25 2.17 98.49 100 96.37 01/13 11:00
1.34 0 1.52 0 97.14 100 94.94 01/13 12:00
1.25 0 0.39 0.91 98.39 100 92.5 01/13 13:00
1.44 0 1.04 5.36 97.89 100 89.71 01/13 14:00
1.53 0 0.72 1.43 97.6 100 93.61 01/13 15:00
1.53 0 0.93 5.3 97.32 100 93.22 01/13 16:00
6.2 0.46 1.2 36.16 80.59 100 92.7 01/13 17:00
11.89 0.35 0.57 56.15 70.69 100 91.16 01/13 18:00
15.29 0.11 1.15 85.51 67.92 100 86.21 01/13 19:00
21.24 0.08 0.53 83.77 61.29 100 85.07 01/13 20:00
12.23 1.5 1.17 95.36 63.94 100 84.72 01/13 21:00
2.78 0.14 0.44 44.55 78.21 100 89.63 01/13 22:00
0.25 0 0 0 97.96 100 99.12 01/13 23:00
0.35 0 0.43 2.33 99.11 100 97.45 01/14 00:00
0.63 0 0 0 99.14 100 99.42 01/14 01:00
0.51 0 0 0 100 100 97.59 01/14 02:00
0.57 0 0 0 100 100 99.04 01/14 03:00
0.19 0 0 0 100 100 98.41 01/14 04:00
1.03 0 29.66 2.78 94.44 75.86 70.23 01/14 06:00
0.97 0 0.21 0 99.39 100 99.69 01/14 07:00
1.59 0 0.67 2.24 97.71 100 96.76 01/14 08:00
3.17 0 0.38 2.48 98.19 100 96.36 01/14 09:00
5.86 0 0.58 3.49 95.33 100 96.04 01/14 10:00
7.65 0 0.68 2.62 96.97 96.55 97.3 01/14 11:00
8.74 0.05 0.7 10.45 96.25 100 95.53 01/14 12:00
6.98 0 0.58 4.5 97.14 100 97.1 01/14 13:00
3.95 0 0.85 2.56 96.42 100 94.07 01/14 14:00
3.16 0 0.58 1.43 98.32 100 96.52 01/14 15:00
2.84 0 0.61 3.57 96.03 100 95.1 01/14 16:00
1.64 0 0.48 1.12 97.92 100 97.03 01/14 17:00
0.87 0 0.31 4.35 95.82 100 97.45 01/14 18:00
0.88 0 0.82 8.06 96.06 100 94.27 01/14 19:00
0.65 0 0.42 3.45 97.58 100 98.54 01/14 20:00
0.39 0 0.49 0 100 100 97.58 01/14 21:00
0.13 0 0 0 81.25 100 96.32 01/14 22:00
0.03 0 0 0 100 100 98.83 01/14 23:00
IJSER

International Journal of Scientific & Engineering Research, Volume 6, Issue 11, November-2015 100
ISSN 2229-5518
IJSER © 2015
http://www.ijser.org
0.09 0 2.86 0 92.31 100 97.13 01/15 00:00
0.23 0 0 0 100 100 99.99 01/15 01:00
0.53 0 0 5.26 100 100 98.47 01/15 02:00
0.48 0 0 0 100 100 97.32 01/15 03:00
0.44 0 0 0 95.83 100 99.99 01/15 04:00
0.04 0 0 100 100 100 99.03 01/15 05:00
0.11 0 0 6.67 94.12 100 97.54 01/15 06:00
0.19 0 0 0 93.48 100 93.43 01/15 07:00
0.35 0 0 2.94 95.83 100 92.33 01/15 08:00
0.49 0 0.35 23.08 92.68 100 88.85 01/15 09:00
0.73 0 0 9.52 90.42 100 90.54 01/15 10:00
0.54 0 0.18 4.26 95.07 100 89.58 01/15 11:00
0.39 0 0.22 2.56 97.44 100 93.96 01/15 12:00
0.51 0 0.16 0 96.55 100 96.44 01/15 13:00
0.54 0 0.54 0 97.8 100 98.2 01/15 14:00
0.49 0 0.19 2.38 98.17 100 95.84 01/15 15:00
0.54 0 0 0 98.6 100 95.76 01/15 16:00
0.53 0 0.41 1.61 96.13 100 97.48 01/15 17:00
0.95 0 0.62 0 95.49 100 98.75 01/15 18:00
1.16 0 0.32 0.61 94.59 100 92.86 01/15 19:00
1.74 0 2.27 1.25 90.15 100 94.38 01/15 20:00
Table 3: Statistics for BTS covering the Eagles Square
before, during & after PDP Primaries of 13th & 14th
Jan.2011 (Cell B)
ERLANG PCONG PCTRLFAIL PDROP HOSR PTTCH CSSR_1 DISPLAY
0.06 0 0 0 100 100 99.98 01/10 04:00
0.03 0 0 0 100 100 99.66 01/10 05:00
0.21 0 1.07 0 96.3 100 98.75 01/10 06:00
1.14 0 0.38 1.89 96.39 100 98.1 01/10 07:00
3.02 0 0.72 0 96.77 100 97.39 01/10 08:00
5.08 0 1.13 2.82 97.27 96.55 95.91 01/10 09:00
8.33 0 0.86 3.13 95.69 96.55 96.16 01/10 10:00
12.64 0 1.17 4.65 94.13 96.55 94.12 01/10 11:00
14.15 0 1.4 4.76 93.87 96.55 94.71 01/10 12:00
4.72 0.16 1.21 7.72 93.79 37.93 94.6 01/10 13:00
1.75 11.76 12.3 4 90.8 13.79 80.78 01/10 14:00
10.63 0 1.14 3.9 94.49 96.55 95.11 01/10 15:00
6.69 0 1.29 2.62 96.23 96.55 95.17 01/10 16:00
4.33 0 1.53 4.29 97.29 100 93.9 01/10 17:00
1.9 0 1.48 3.38 96.2 100 94.76 01/10 18:00
1.14 0 0.95 4.82 93.06 100 97.63 01/10 19:00
0.59 0 2 4.65 96.97 100 94.95 01/10 20:00
0.56 0 0.42 15.15 97.46 100 96.19 01/10 21:00
0.35 0 0.96 0 100 100 97.78 01/10 22:00
0.25 0 1.01 0 100 100 97.99 01/10 23:00
0.21 0 0.79 6.25 95.65 100 91.9 01/11 00:00
0.57 0 0 0 100 100 98.49 01/11 01:00
0.46 0 0 0 100 100 99.98 01/11 02:00
0.1 0 0 0 100 100 99.98 01/11 03:00
0.23 0 0 0 91.67 100 99.99 01/11 04:00
0.26 0 0 0 100 100 99.37 01/11 05:00
0.32 0 1.7 2.63 95.59 100 97.73 01/11 06:00
1.26 0 0.16 1.5 97.44 100 98.4 01/11 07:00
3.18 0 0.67 1.92 96.74 100 98.45 01/11 08:00
6.09 0 0.99 3.76 96.06 100 96.89 01/11 09:00
10.72 0.04 1.34 3.78 92.32 96.55 95.43 01/11 10:00
12.6 0.03 1.02 5.52 92.58 96.55 95.08 01/11 11:00
12.89 0.06 1.26 3.7 91.56 96.55 94.92 01/11 12:00
12.29 0 1.17 4.59 94.23 96.55 95.17 01/11 13:00
13.64 0.03 1.15 5.51 92.39 96.55 94.32 01/11 14:00
12.23 0 1.18 4.17 93.55 96.55 94.99 01/11 15:00
8.4 0 1.29 2.87 94.77 96.55 95.57 01/11 16:00
4.27 0 0.54 1.26 97.08 100 97.76 01/11 17:00
2.5 0 0.62 0.96 98.52 100 97.81 01/11 18:00
2.26 0 0.52 5.13 96.46 100 95.27 01/11 19:00
1.01 0 0.68 1.49 97.98 100 96.35 01/11 20:00
0.78 0 0.31 6.25 95.29 100 97.81 01/11 21:00
0.64 0 0.76 0 99.08 100 95.7 01/11 22:00
0.4 0 0.37 0 100 100 92.7 01/11 23:00
0.14 0 0 0 100 100 93.71 01/12 00:00
0.22 0 0 25 92.98 100 99.37 01/12 01:00
1.04 0 0 0 97.7 100 99.99 01/12 02:00
0.28 0 0 0 100 100 99.99 01/12 03:00
0.01 0 0.87 0 100 100 99.12 01/12 04:00
0.04 0 0 0 100 100 100 01/12 05:00
0.32 0 1.37 0 100 100 98.27 01/12 06:00
1.29 0 0.38 1.96 99.62 100 97.04 01/12 07:00
3.33 0 0.54 1.49 98.21 100 98.02 01/12 08:00
6.25 0 0.94 3.31 96.32 100 95.23 01/12 09:00
10.69 0 0.99 3.02 93.64 96.55 96.13 01/12 10:00
13.18 0 1.5 2.89 93.57 96.55 94.57 01/12 11:00
13.89 0.05 1.25 3.28 91.48 96.55 94.7 01/12 12:00
13.24 0 1.27 3.91 92.33 96.55 94.99 01/12 13:00
13.08 0 1.26 4.19 92.79 96.55 94.86 01/12 14:00
11.52 0 1.41 3.3 92.89 96.55 95.24 01/12 15:00
8.27 0 0.99 2.69 94.79 100 96.7 01/12 16:00
4.3 0 1.65 2.23 95.31 100 94.85 01/12 17:00
IJSER

International Journal of Scientific & Engineering Research, Volume 6, Issue 11, November-2015 101
ISSN 2229-5518
IJSER © 2015
http://www.ijser.org
2.22 0 0.99 3.24 96.54 100 97.14 01/12 18:00
1.65 0 1.14 1.32 95.56 100 96.18 01/12 19:00
1.04 0 0.77 9.89 95.53 100 97.25 01/12 20:00
0.72 0 0.9 4 98.68 100 97.85 01/12 21:00
0.58 0 0.94 3.7 93.85 100 95.78 01/12 22:00
0.2 0 0 0 100 100 98.36 01/12 23:00
0.37 0 0 0 100 100 95.55 01/13 00:00
0.2 0 0.51 0 100 100 91.98 01/13 01:00
0.48 0 0.52 0 95.83 100 98.44 01/13 02:00
0.48 0 0.86 0 100 100 98.27 01/13 03:00
0.13 0 0 0 100 100 99.27 01/13 04:00
0.07 0 0 0 100 100 99.64 01/13 05:00
0.59 0 0.27 0 100 100 99.46 01/13 06:00
0.81 0 0.33 0.77 93.94 100 98.5 01/13 07:00
1.64 0 0.79 1.44 97.35 100 98.09 01/13 08:00
2.72 0 0.99 0.73 95.41 100 96.91 01/13 09:00
2.49 0 1.28 1.7 94.89 100 97.24 01/13 10:00
3.04 0 1.3 2.18 97.01 100 96.13 01/13 11:00
2.91 0 0.99 1.78 95.35 100 97.38 01/13 12:00
2.8 0 0.88 0.3 97.11 100 98.2 01/13 13:00
3.24 0 1.03 0.76 97.08 100 96.88 01/13 14:00
3.23 0 0.75 1.16 95.91 100 98.02 01/13 15:00
3.7 0 0.65 1.06 96.58 100 98.07 01/13 16:00
5.61 5.13 2.82 13.1 92.28 100 92.95 01/13 17:00
6.56 3.22 1.23 17.35 94.38 100 82.87 01/13 18:00
7.33 0 0
0 100 34.31 01/13 19:00
11.99 47.06 0
0 100 48.09 01/13 20:00
8.45 18.18 1.65 47.83 83.54 100 45.31 01/13 21:00
2.64 0 0 0 94.99 100 94.35 01/13 22:00
1.09 0 0.23 0 99.14 100 99.18 01/13 23:00
1.25 0 0 0 98.1 100 98.54 01/14 00:00
1.33 0 0.31 0.75 97.94 100 97.28 01/14 01:00
0.84 0 0.21 1.09 97.48 100 99.38 01/14 02:00
0.48 0 0 0 93.64 100 100 01/14 03:00
0.28 0 0 0 99.07 100 99.56 01/14 04:00
2.44 0 17.57 3.66 88.62 72.41 81.12 01/14 06:00
1.52 0 0.91 0.4 94.12 100 98.23 01/14 07:00
2.79 0 0.53 0.73 97.48 100 97.75 01/14 08:00
4.28 0 0.76 3.27 94.56 100 97.88 01/14 09:00
6.47 0 1.12 3.04 96.68 100 96.89 01/14 10:00
8.74 0 0.99 2.61 95.93 96.55 96.68 01/14 11:00
6.53 0 0.94 3.81 94.94 100 96.37 01/14 12:00
4.86 0 0.92 3.12 95.54 100 96.27 01/14 13:00
3.1 0 1.22 4.04 96.59 100 95.62 01/14 14:00
3.45 0 0.98 3.36 95.13 100 96.29 01/14 15:00
2.19 0 1.17 3.03 97.24 100 94.69 01/14 16:00
1.58 0 1.06 5.11 97.21 100 96.2 01/14 17:00
0.93 0 0.73 1.83 92.63 100 98.18 01/14 18:00
1.1 0 0.2 0 97.14 100 97.33 01/14 19:00
0.69 0 0.29 3.77 96.24 100 98.28 01/14 20:00
0.51 0 0.63 2.56 92.38 100 96.54 01/14 21:00
0.54 0 0.92 0 96.7 100 98.62 01/14 22:00
0.12 0 1.53 0 100 100 98.47 01/14 23:00
0.06 0 1.02 0 100 100 97.96 01/15 00:00
0.14 0 0 0 97.87 100 99.99 01/15 01:00
0.11 0 0 0 100 100 99.98 01/15 02:00
0.36 0 1.45 0 98.33 100 98.54 01/15 03:00
0.27 0 0 0 95 100 99.99 01/15 04:00
0.01 0 0 0 100 100 99.99 01/15 05:00
0.15 0 0 0 97.14 100 95.94 01/15 06:00
0.28 0 0.41 0 94.87 100 94.93 01/15 07:00
0.35 0 0.19 7.69 93 100 95.04 01/15 08:00
0.47 0 0.3 2.86 95.48 100 96.35 01/15 09:00
0.91 0 0.23 0 91.1 100 96.81 01/15 10:00
1.11 0 0.22 4.4 95.63 100 92.33 01/15 11:00
0.55 0 0 0 98.14 100 96.41 01/15 12:00
0.62 0 0.38 0 97.37 100 98.24 01/15 13:00
0.73 0 0.11 0 99.12 100 99.26 01/15 14:00
0.79 0 0.55 0.77 90.42 100 97.7 01/15 15:00
0.87 0 0.09 0 98.32 100 99.06 01/15 16:00
1.45 0 0.33 0.35 88.07 100 98.51 01/15 17:00
1.99 0 0.46 0.54 92.96 100 98.59 01/15 18:00
3.16 0 0.47 1.91 96.45 100 98.52 01/15 19:00
5.79 0 9.09 1.76 92.88 100 90.14 01/15 20:00
3.31 0 0.26 1.13 95.51 100 98.1 01/15 21:00
1.92 0 0.2 0.55 97.22 100 99.12 01/15 22:00
0.91 0 0 0 99.09 100 99.15 01/15 23:00
0.92 0 0.18 1.13 91 100 95.08 01/16 00:00
0.55 0 0.24 0 98.95 100 97.23 01/16 01:00
0.52 0 0.26 0 96.67 100 98.71 01/16 02:00
0.64 0 0.32 0 91.07 100 99.04 01/16 03:00
0.32 0 0 0 99.14 100 97.22 01/16 04:00
Table 4: Statistics for BTS covering the Eagles Square
before, during & after PDP Primaries of 13th & 14th
Jan.2011 (Cell C)
ERLANG PCONG PCTRLFAIL PDROP HOSR PTTCH CSSR_1 DISPLAY
0 0 0 0 0 100 99.94
01/10
04:00
0 0 1.85 0 100 100 98.13
01/10
05:00
0.06 0 1.93 0 100 100 98.07
01/10
06:00
0.53 0 0.39 7.27 96.67 100 96.88
01/10
07:00
1.37 0 0.56 2.19 97.73 100 95.74
01/10
08:00
2.43 0 1.05 3.91 90.34 100 96.53
01/10
09:00
3.51 0 0.58 4.26 94.3 100 97.66
01/10
10:00
4.42 0 1.03 2.86 94.57 100 96.39
01/10
11:00
4.97 0 1.2 3.74 93.02 100 95.95
01/10
12:00
1.87 0.9 0.95 4.35 92.62 37.93 96.46
01/10
13:00
0.75 10 5.57 8.47 93.51 13.79 89.33
01/10
14:00
4.51 0 1.64 3.25 93.13 100 96.22
01/10
15:00
3.24 0 1.5 4.04 92.7 100 95.81
01/10
16:00
2.41 0 1.64 5.41 93.54 100 95.81
01/10
17:00
1.05 0 1.75 3.06 96.5 100 96.19
01/10
18:00
0.65 0 2.77 6 95.03 100 96.26
01/10
19:00
IJSER

International Journal of Scientific & Engineering Research, Volume 6, Issue 11, November-2015 102
ISSN 2229-5518
IJSER © 2015
http://www.ijser.org
0.37 0 3.23 0 98.99 100 90.31
01/10
20:00
0.26 0 3.83 9.52 96 100 91.16
01/10
21:00
0.09 0 2.47 33.33 91.3 100 71.85
01/10
22:00
0.01 0 6.09 0 100 100 93.9
01/10
23:00
0.04 0 4.17 16.67 100 100 95.82
01/11
00:00
0.14 0 13.04 0 50 100 86.94
01/11
01:00
0.12 0 0 0 57.14 100 99.97
01/11
02:00
0.07 0 3.33 0 100 100 96.63
01/11
03:00
0.11 0 3.45 0 96 100 84.47
01/11
04:00
0.01 0 0 0 100 100 99.98
01/11
05:00
0.15 0 2.17 0 91.67 100 97.82
01/11
06:00
0.51 0 4.42 2.56 94.26 100 95.39
01/11
07:00
1.51 0 1.29 1.4 91.67 100 97.34
01/11
08:00
2.98 0 1.65 3.33 90.44 100 95.79
01/11
09:00
3.88 0.08 1.06 3.77 88.74 100 95.62
01/11
10:00
4.21 0 1.25 5.61 83.38 100 96.34
01/11
11:00
4.94 0 1.17 4.35 85.06 100 95.11
01/11
12:00
5.7 0 1.18 6.49 85.92 100 95.68
01/11
13:00
5.54 0 1.11 4.75 84.72 100 96.34
01/11
14:00
4.81 0 0.82 4.87 86.3 100 97.84
01/11
15:00
3.78 0 1 4.05 87.96 100 95.96
01/11
16:00
2.1 0 1.58 3.76 86.44 100 95.92
01/11
17:00
1.48 0 1.82 4.32 90.1 100 95.92
01/11
18:00
0.7 0 2.56 9.72 90.45 100 94.56
01/11
19:00
0.45 0 2.64 17.14 92.19 100 94.35
01/11
20:00
0.32 0 2.13 19.23 92.68 100 96.98
01/11
21:00
0.18 0 5.8 18.75 81.82 100 86.28
01/11
22:00
0.12 0 8.2 0 95.65 100 91.04
01/11
23:00
0.01 0 2.25 0 66.67 100 77.98
01/12
00:00
0.05 0 2.7 0 91.67 100 84.13
01/12
01:00
0.29 0 3.45 0 80.56 100 48.5
01/12
02:00
0.07 0 3.85 0 100 100 96.12
01/12
03:00
0.07 0 0 200 83.33 100 96.52
01/12
04:00
0 0 1.2 0 100 100 98.78
01/12
05:00
0.08 0 1.01 5.56 85 100 92.51
01/12
06:00
0.59 0 1.34 0 92.86 100 98.09
01/12
07:00
1.56 0 1.28 2.05 91.51 100 96.3
01/12
08:00
2.88 0 1.22 4.25 84.95 100 95.66
01/12
09:00
4.25 0 0.78 4.32 85.24 100 94.99
01/12
10:00
5.09 0 0.68 3.88 85.24 100 96.5
01/12
11:00
5.19 0 0.95 5.24 83.59 100 96.21
01/12
12:00
4.89 0 1.06 4.06 86.32 100 97.04
01/12
13:00
5 0 1.39 5.41 89.54 100 95.07
01/12
14:00
4.27 0 1.13 2.68 94.54 100 96.46
01/12
15:00
3.66 0 1.11 3.3 94.64 100 96.51
01/12
16:00
2.02 0 1.06 7.94 94.31 100 96.08
01/12
17:00
1.31 0 1.02 5.03 97.34 100 97.66
01/12
18:00
0.75 0 2.83 7.14 94.87 100 92.06
01/12
19:00
0.33 0 2.14 22.58 94.44 100 97.63
01/12
20:00
0.21 0 2.9 3.03 95.08 100 97.1
01/12
21:00
0.16 0 5.65 40 85.37 100 89.83
01/12
22:00
0.05 0 6.8 50 66.67 100 90.66
01/12
23:00
0.04 0 9.48 10 83.33 100 90.51
01/13
00:00
0.04 0 9.09 20 81.25 100 90.9
01/13
01:00
0.29 0 2 0 94.44 100 92.1
01/13
02:00
0.01 0 4 0 100 100 95.98
01/13
03:00
0.02 0 6.67 0 50 100 93.32
01/13
04:00
0.01 0 1.18 0 100 100 98.81
01/13
05:00
0.11 0 4.47 3.45 94.74 100 95.2
01/13
06:00
0.39 0 2.77 5.36 96.19 100 94.39
01/13
07:00
IJSER

International Journal of Scientific & Engineering Research, Volume 6, Issue 11, November-2015 103
ISSN 2229-5518
IJSER © 2015
http://www.ijser.org
1.12 0 2.86 2.5 97.23 100 94.18
01/13
08:00
2.06 0 1.85 1.22 95.98 100 95.83
01/13
09:00
2.81 0 1.97 5.88 94.01 100 95.06
01/13
10:00
2.77 0 1.79 1.51 94.31 100 97.04
01/13
11:00
2.65 0 1.7 2.02 93.87 100 95.99
01/13
12:00
2.44 0 2.36 3.89 94.07 100 94.25
01/13
13:00
2.75 0 2.25 2.76 94.43 100 93.33
01/13
14:00
2.52 0 1.71 4.43 93.72 100 97.1
01/13
15:00
1.89 0 1.96 3.82 95.38 100 95.71
01/13
16:00
1.84 0 1.76 21.49 84.12 100 93.58
01/13
17:00
1.89 0 0.69 29.79 75 100 91.33
01/13
18:00
1.53 0 0 26.47 73.18 100 91.42
01/13
19:00
2.23 0 1.32 50.59 65.51 100 90.83
01/13
20:00
1.97 0 1.29 71.43 73.36 100 83.9
01/13
21:00
0.49 0 4.17 37.04 77.88 100 82.25
01/13
22:00
0.06 0 4.8 0 94.12 100 93.67
01/13
23:00
0.07 0 4 0 100 100 95.99
01/14
00:00
0.06 0 1.89 0 100 100 98.09
01/14
01:00
0.04 0 5.13 0 100 100 94.85
01/14
02:00
0.05 0 5.71 0 100 100 94.26
01/14
03:00
0.06 0 2.17 0 100 100 93.55
01/14
04:00
0.6 0 15.65 0 82.93 75.86 84.21
01/14
06:00
0.34 0 1.24 0 100 100 98.76
01/14
07:00
1.24 0 1.23 3.81 97.73 100 95.78
01/14
08:00
1.73 0 1.4 4.94 96.32 100 97.06
01/14
09:00
2.88 0 1.04 2.61 95.45 100 97.21
01/14
10:00
3.45 0 0.52 3.82 94.09 100 96.91
01/14
11:00
4.14 0 0.69 1.43 93.26 100 93.6
01/14
12:00
3.4 0 0.89 3.07 95.02 100 96.55
01/14
13:00
2.51 0 0.88 0.84 96.29 100 97.27
01/14
14:00
2.71 0 0.8 3.83 94.79 100 97.22
01/14
15:00
2.54 0 0.95 3.46 95.01 100 97.16
01/14
16:00
1.57 0 1.06 3.43 96.91 100 97.21
01/14
17:00
0.78 0 1.12 4.6 92.24 100 98.02
01/14
18:00
0.52 0 2.58 2.08 99.22 100 95.75
01/14
19:00
0.39 0 3.73 8 98.78 100 95.31
01/14
20:00
0.2 0 3.5 4.55 100 100 91.44
01/14
21:00
0.1 0 6.83 0 100 100 91.35
01/14
22:00
0.08 0 6.06 25 100 100 62.67
01/14
23:00
0.01 0 3.45
100 100 96.54
01/15
00:00
0.04 0 4.26 50 100 100 95.72
01/15
01:00
0.01 0 2.86 0 100 100 64.85
01/15
02:00
0.19 0 1.85 0 100 100 98.13
01/15
03:00
0.15 0 2.38 0 100 100 95.27
01/15
04:00
0 0 0
100 100 99.98
01/15
05:00
0.03 0 0.53 0 100 100 97.09
01/15
06:00
0.11 0 0.15 0 96.67 100 95.88
01/15
07:00
0.17 0 0.47 7.14 96.23 100 97.21
01/15
08:00
0.17 0 0.22 4 97.92 100 96.73
01/15
09:00
0.3 0 0.75 6.25 96.2 100 86.51
01/15
10:00
0.3 0 1.88 2.63 97.47 100 88.65
01/15
11:00
0.63 0 2.78 2.44 94.83 100 90.52
01/15
12:00
0.3 0 1.73 6 97.94 100 96.57
01/15
13:00
0.39 0 1.73 1.92 98.28 100 96.94
01/15
14:00
0.42 0 2.22 1.64 96.75 100 94.03
01/15
15:00
0.48 0 1.9 3.75 96.77 100 96.42
01/15
16:00
0.33 0 2.02 0 97.39 100 93.86
01/15
17:00
0.52 0 2.15 6.94 97.12 100 97.25
01/15
18:00
0.49 0 1.96 0 99.28 100 96.88
01/15
19:00
0.5 0 2.51 1.28 95.81 100 97.09
01/15
20:00
IJSER

International Journal of Scientific & Engineering Research, Volume 6, Issue 11, November-2015 104
ISSN 2229-5518
IJSER © 2015
http://www.ijser.org
0.46 0 0.92 2.78 95.97 100 95.93
01/15
21:00
0.19 0 0.46 0 97.1 100 99.08
01/15
22:00
0.09 0 2.78 5 89.47 100 97.22
01/15
23:00
0.1 0 0.78 4.55 100 100 95.34
01/16
00:00
0.12 0 0 0 100 100 99.99
01/16
01:00
0.16 0 1.41 0 100 100 98.58
01/16
02:00
0.12 0 2.11 0 95.24 100 97.88
01/16
03:00
0.1 0 2.8 0 74.29 100 97.19
01/16
04:00
IJSER