Embed Size (px)
DESCRIPTION
Effects of Urbanization on the Water Resources of Atlanta. Kate Marney. Outline. Background Objectives Methods Results Conclusions. Background. Atlanta Capital of Georgia “Poster Child for Sprawl” 25% growth since 2006. Atlanta. Atlanta. Georgia. Georgia. Objective. - PowerPoint PPT Presentation
Citation preview

EFFECTS OF URBANIZATION ON THE WATER RESOURCES OF ATLANTA
Kate Marney

Outline
Background Objectives Methods Results Conclusions
Background
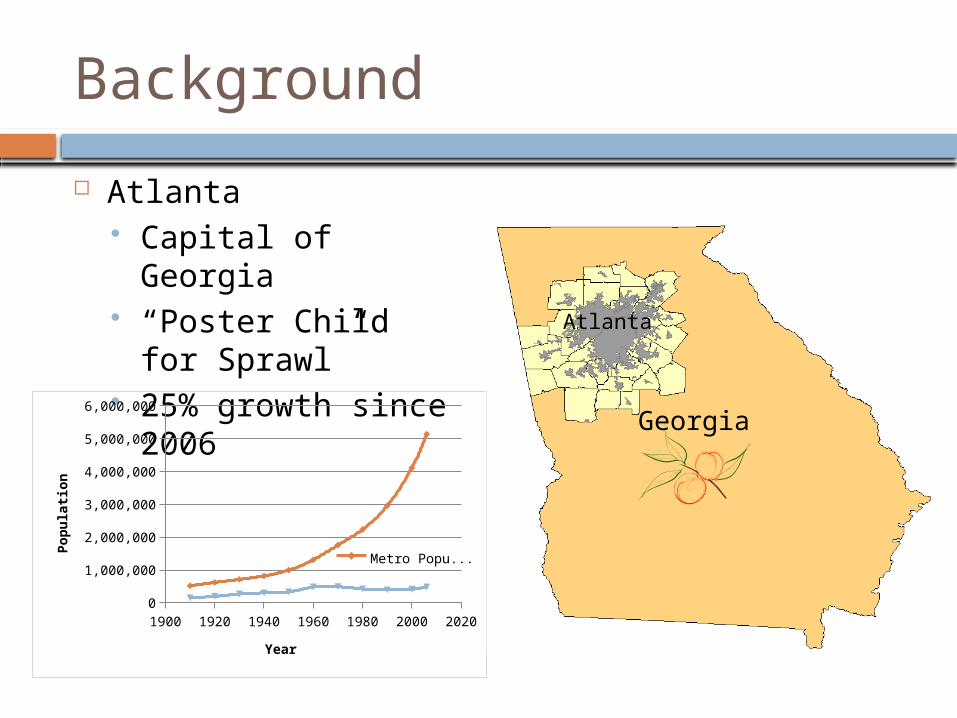
Atlanta Capital of Georgia “Poster Child for
Sprawl” 25% growth since
2006
1900 1920 1940 1960 1980 2000 20200
1,000,000
2,000,000
3,000,000
4,000,000
5,000,000
6,000,000
Metro PopulationCity Population
Year
Popula
tion
Georgia
Atlanta
Georgia
Atlanta

Objective
Understand some of the effects of urban sprawl
Correlate urbanization with: Streamflow Water temperature Contaminant levels
Photo: Atlanta Skyline, Wikipedia.org
Photo: Chattahoochee River in Atlanta (alternate title: Chattaewwchee), Georgia.org

ArcMap Data

Streamflow Analysis
Peak flow data from USGS
Graph results 5 sites out of 20
increasing 5 show evidence
of channelization or regulation

Streamflow Results
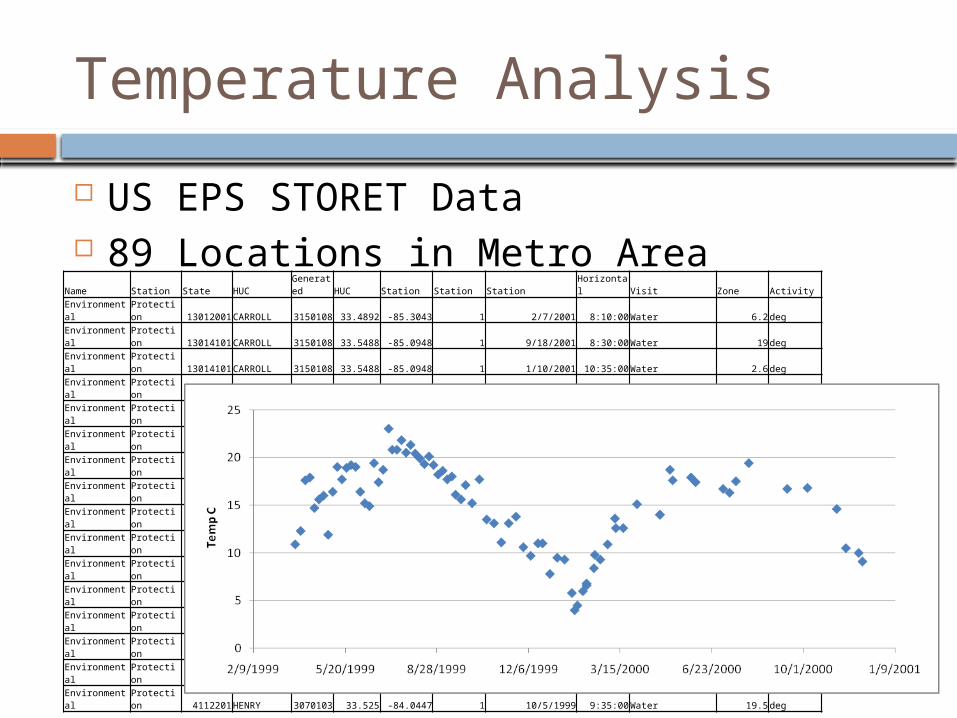
Temperature Analysis
US EPS STORET Data 89 Locations in Metro Area
Name Station State HUCGenerated HUC Station Station Station Horizontal Visit Zone Activity
Environmental Protection 13012001CARROLL
3150108 33.4892 -85.3043 1 2/7/2001 8:10:00Water 6.2deg
Environmental Protection 13014101CARROLL
3150108 33.5488 -85.0948 1 9/18/2001 8:30:00Water 19deg
Environmental Protection 13014101CARROLL
3150108 33.5488 -85.0948 1 1/10/2001 10:35:00Water 2.6deg
Environmental Protection 4112151ROCKDALE
3070103 33.5797 -84.0642 1 9/7/1999 9:55:00Water 22deg
Environmental Protection 4181001GWINNETT
3070103 33.9139 -84.0986 1 5/6/1999 10:10:00Water 18.5deg
Environmental Protection 4181001GWINNETT
3070103 33.9139 -84.0986 1 2/12/1999 13:10:00Water 14deg
Environmental Protection 4112401HENRY
3070103 33.5694 -84.2331 1 12/8/1999 8:20:00Water 8deg
Environmental Protection 4310001NEWTON
3070103 33.4494 -83.8283 1 2/11/2003 7:20:00Water 7.1deg
Environmental Protection 3036401WALTON
3070101 33.8067 -83.6636 1 1/5/1999 11:10:00Field deg C
Environmental Protection 4140001HENRY
3070103 33.4532 -83.9286 1 8/3/1999 8:20:00Water 27deg
Environmental Protection 4207501GWINNETT
3070103 33.7781 -84.0381 1 11/3/1999 12:45:00Water 12.6deg
Environmental Protection 13012001CARROLL
3150108 33.4892 -85.3043 1 8/7/2001 7:20:00Water 23.9deg
Environmental Protection 4140001HENRY
3070103 33.4532 -83.9286 1 9/7/1999 8:30:00Water 24deg
Environmental Protection 4112151ROCKDALE
3070103 33.5797 -84.0642 1 6/8/1999 9:40:00Water 21deg
Environmental Protection 4207501GWINNETT
3070103 33.7781 -84.0381 1 4/6/1999 12:00:00Water 17.3deg
Environmental Protection 4112201HENRY
3070103 33.525 -84.0447 1 10/5/1999 9:35:00Water 19.5deg

Temperature Results
Lowest Average (9.49)Lowest Max Temp (11.8)
Highest Average (19.41)Highest Max Temp (31)

Temperature Results
0.00
5.00
10.00
15.00
20.00
25.00
30.00
35.00
Chattahoochee River Temperature Profile
Average TempLinear (Average Temp)Max TempLinear (Max Temp)
Tem
pera
ture
(C
)

Contaminant Levels
Nitrogen, Phosphorus, Bacteria Data not readily available for long time
periods Data Sources:

Contaminant Results

Conclusions
Urbanization has a marked, detrimental effect on water resources
Streamflow, temperature, and contaminant levels are likely to increase as urbanization occurs
Understanding the effects and their magnitudes can aid in mitigation efforts
Questions