Embed Size (px)
Citation preview

Geoinformaticahttps://doi.org/10.1007/s10707-018-0319-4
Efficient CPS model based online opinion governancemodeling and evaluation for emergency accidents
Xiao Long Deng1 ·Yin Luan Yu2 ·Dan Huai Guo3 ·Ying Tong Dou1
Received: 25 January 2017 / Revised: 5 January 2018 / Accepted: 19 March 2018© Springer Science+Business Media, LLC, part of Springer Nature 2018
Abstract In the last decades, there have been much more public crisis accidents in theworld such as H1N1, H7N9 and Ebola outbreak. It has been proved that our world hascome into the time while public crisis accidents number was growing fast. Furthermore, cri-sis response to these public emergency accidents is always involved in a complex systemconsisting of cyber, physics and society domains (CPS Model). In order to collect and ana-lyze these emergency accidents with higher efficiency, we need to design and adopt somenew tools and models to analysis the online opinion. In this paper, we have proposed a newCPSModel based Online Opinion Governance system which constructed on cellphone APPfor data collection including GIS information and online opinion and decision making inthe back end. Our contributions include the graded risk classification method and accidentclassification method. Besides, we propose the group opinion polarization analysis methodconsisting two models and make promotion of the relative conditional entropy based contextkey word extraction method. Basing on these, we have built an efficient CPS Model basedsimulated emergency accident replying and handling system. It has been proved useful foremergency response in some real accidents in China such as Tianjin Explode accident andHaiyan Typhoon in recent years with detailed and vivid analysis result.
Keywords Mobile data · CPS model · Online opinion analysis · Emergency disaster ·Situation analysis and evaluation
� Xiao Long [email protected]
� Yin Luan [email protected]
1 Key Lab of Trustworthy Distributed Computing and Service of Education Ministry,Beijing University of Posts and Telecommunications, Beijing, 100876, China
2 China Academy of Social Management, Beijing Normal University Beijing, Beijing, China
3 China Scientific Data Center, Computer Network Information Center, Chinese Academyof Sciences Beijing, Beijing, China

Geoinformatica
1 Introduction
There has been much more public crisis and accidents around the world in the past decade(i.e. H1N1, Ebola and Typhoon Haiyan). Emergency accidents with severe effect like Explo-sion of Tianjin Port have lead a huge fluctuation of online opinion in China. And it has madethe evolution of online opinion about emergency accidents becomes a vital factor in crisismanagement for our government [1, 2].
In this article, in order to get the more comprehensive information from all round sidein Cyber Domain, Social Domain and Physical Domain, we have promoted a CPS modelbased online opinion governance system and evaluation methods of emergency accidents.At first, our system would collect the online opinion from three-dimension space (cyber,physical and society) which was proposed by professor Zhang in 2014 [3–5]. In the physicalspace, we collect some physical information like the data about damages and deaths. For thecyber space, with the aid of distributed data mining system, we collect and analyze onlineopinion from Sina Micro blog, Baidu News, Tianya BBS and Twitter. In the society space,we analyze the trend of online opinion from social network. According to the informationcollected from several spaces, the calculation and analysis will be applied for emergencyhandling. At last, the decision will be made based on different situations to deal with variouskinds of emergencies according to our simulation computing. In detail, our contributionscan be found in the following:
1. We propose and implement a CPS Model based Online Opinion Governance systemwhich constructed on cellphone APP for data collection and decision make in the backend and it has some very good performance;
2. In addition,we propose our UNPE and DNPE model to analyze Group OpinionPolarization Process and has evaluated it on real data of Tianjin Explosion Accident;
3. We propose a detailed risk classification result with five layered risk. Furthermore,we propose the accident types classification method. They are useful for emergencyaccident risk assessment;
4. We put forward and supply a detailed analysis of Tianjin Explosion in 2015 and TyphoonHaiyan in 2013 which combing the cyber information, physical information and societyinformation together and it can provide vivid demonstration of the two accidents;
The outline of this paper is as follows: In Section 1, the research background is intro-duced. In Section 2, the related work on CPSModel and online opinion ming for emergencyhandling will be described. In Section 3, we offer detailed information of CPS model basedanalysis system and our APP based system framework. In Section 4, more detailed demon-stration of key technology in our CPS model analysis system can be found. Furthermore,the detailed risk classification result and accident types classification will be found in Section 5.Then, we offered the opinion mining result of 2015 Tianjin Explosion Accident and 2013Typhoon Haiyan in Section 6. And Section 7 gives a conclusion.
2 Related work
2.1 CPS model
The CPS model [4] has three main steps. The first step is the collection of online opinion.The second step is the calculation and analysis of collected data and the last step is decisionmaking and feedback. Here we will introduce the details of CPS model (Fig. 1).

Geoinformatica
Fig. 1 CPS model based risk reply
The basic way to evaluate the model is analyzing the event data that have been inputto the model. The conclusion of event will be compared with the actual process and verifywhether they are similar or not.
Crisis response is involved in a complex system consisting of cyber, physics and societydomains. Different domains are closely coupled and dynamically evolved. Cross domainanalysis is applied for better response of natural disasters and other emergency accidents. Adata-model integration method is proposed by us to support situation awareness and emer-gency response planning. Models are used for the prediction of crisis scales and its impacton infrastructure system and local society. Data mining is used to sense sentiment of affectedcitizens in society. The integration of cross-domain data mining and emergency modelingis essential for supporting scientific decision-making (including planning and response) [3–5].But the current research results of CPS Model is still in the theoretical level and not beenapplied to the real accidents.
2.2 Online opinion ming for emergency handling
Online opinion ming is useful for emergency accident reaction in emergency accidentsespecially in disasters. There are some famous software and developing teams concen-trated on this such as SAFRR (Science Application for Risk Reduction) (https://www2.usgs.gov/natural hazards/safrr/contact.asp). The SAFRR Project is the continued evolutionof the successful Multi-Hazards Demonstration Project (MHDP), started in 2006 and lastedfor only five years. The SAFRR team helps to build resilience to natural hazards such asearthquakes, floods, wildfires, landslides, tsunamis, and coastal erosion by working withdecision making and emergency response efforts across different nations including onlineopinion data handling. But the SAFRR team has not apply it to China and other developingcountries. The another one is Open Source Disaster Management Software named Sahana(https://sahanafoundation.org/) to solve concrete problem and bring efficiency to disasterresponse coordination between government, civil society and the victims themselves by

Geoinformatica
using mobile phone APP. Sahana’s open-source codebase has provided a flexible, modularplatform for rapidly deploying information management systems for disaster managementand humanitarian use cases. In 2008, IBM has used Sahana to save lives in the WenChuanearthquake. The WHO group(World Health Organization) (http://www.who.int/entity/en/)also has played an important role in emergency handling including many projects to helppeople to survive in disasters by mobile phone APPs. But the related work mentioned abovehas no Chinese Edition and has no efficient opinion data processing tool in the back endand we need to develop some useful Chinese APPs and softwares to help Chinese people tosave their lives in emergency accidents.
2.3 Summary
For the reason that CPSModel is very new in the decade and Online opinion Ming for emer-gency Handling is a crossing interdisciplinary researching area, there is not much relatedwork of it and the common practice is to apply the traditional text ming method to analysisthe emergency online opinion and short tweets. So it very necessary for us to propose a newintegrated extracting and analysis framework for emergency online information handling.
Fig. 2 APP GUI

Geoinformatica
3 CPS model based online opinion governance structure
3.1 Opinion collection APP
To collect the online opinion, we combine mobile APPs and web crawlers together. Ourmobile APP collects the information of events happened in the real world (i.e. photos, loca-tions, time and so on). The web crawler gets the online opinion in the web. The APP-basedinformation collection is a user-driven information pushing mechanism (i.e. the client-serverstructure). Users send information (including longitude and latitude information) of emer-gency accidents via our specific APP like which can be found in Fig. 2 to the server wherecan store and analyze the accident data.
3.2 System framework
It can be found from Fig. 2 that user can send out the accident information in emergency andthis is a demo GUI for emergency report for our university campus (www.bupt.edu.cn) forsimple demonstration and can be used in many other areas to send information by users. Inour system, user can send out text information, photo information and location information(including latitude and longitude information).After the information was sent to back endserver, it can be extracted and helpful for further data ming in Fig. 3.
The web crawler is a server-based online information collection process. The webcrawler can runs 7*24 hours on the server to collect the online information about theemergencies from BBS, micro-blogging and others websites. Besides, the crawler can alsocollect information from news website and other online libraries according to the specific
Fig. 3 Opinion collection system framework

Geoinformatica
emergency accident such as Sina Micro Blog, BBS, Twitter, and Facebook. As a result,we can offer some suggestions to the government to handle opinion situation in theseemergency accidents [6–9].
4 Key technology in our CPS model analysis system
4.1 Relative conditional entropy based context key word extraction
The word frequency method is the simplest method for extracting the key words, takingthe frequency scale of key words as a criterion to choose the feature words while consid-ering that a word with increasing frequency of occurrence in text is more representative.In our System, mutual information entropy based method and relative conditional entropybased method are implemented to extract the main key words of some special emergencyaccidents.
1) Mutual information entropy method: The mutual information entropy based method isto measure the relevance between the feature item and a particular category at the timeof extracting feature words. If the calculated value of mutual information in formula(1) is greater, the relevance between the corresponding feature item and the particularcategory is higher.
I (X; Y ) = H(X) + H(Y) − H(X, Y )
= H(X) + H(Y)+∑
p (x, y) log2 (p (x, y))
= ∑
x∈X
∑
y∈Y
p (x, y)log2(p(x,y)
p(x)p(y))
(1)
In formula (1), p (x, y) stands for the joint distribution of two random variables (X, Y )
and the marginal distribution is p (x) p (y). The mutual information I (X;Y ) is the rel-ative entropy of the joint distribution p (x, y)with the marginal distribution p (x) p (y).H(X, Y ) is the joint entropy. The mutual information entropy based method is mainlyused to calculate the relativity of analyzed short text sent by online social network usersuch as Facebook and our Opinion Collection APP, with some topic recognized arti-cles of emergency accidents. And the relativity can be shown by the calculated resultof information quantity. In case of hot discussion on some accidents, the informationquantity would reach climax peak to show the intensive attention of social network onthe accident.
2) Relative conditional entropy based context key word extraction method: In informationtheory, the entropy is to measure the expected value of a random variable. The entropyvalue H of a random variable X in range of {x1, ...xn} is defined as H(x) = E(I (X)).And I (X) is the self-information of random variable X. At the same time, anotherexpression form of entropy H can be defined in formula (2) according to the definitionof expectation and self-information I (X):
H(X) =n∑
i=1
p(xi)I (xi) = −n∑
i=1
p (xi)logp (xi) (2)
The main idea of Relative Conditional Entropy based Context Key Word Extractionmethod is to extract several key words or phrases which can stands for the main topic ofthe analyzed article. The result of this method can be used to refined reading, semanticquery and fast topic match.

Geoinformatica
The main process of this method can be described in the followings:Firstly, based on some scale of corpus, several FocusWords [10] would be selected which
can cover the most scope of the target article for key words extraction. Then the wordson the m position before and behind each Focus Word would be selected to compose the“Focus Word Context Matrix”. W stands for the Focus Words Set and CW is the Words Setof Context Words. The “Focus Word Context Matrix” can be defined as:
Mw = [wi,j ]n×(2×m+1)i = 1, 2, ..., n; j = 1, 2, ..., (2 × m + 1);wi,(m+1) ∈ W,wi,j ∈ CW, j �= m + 1.
(3)
In formula (3), n = ∑w∈W f re(w) stands for the word frequency of all FocusWordw ∈ W
in the corpus library. wi,1:m are the nearest m words before Focus Word w in the ith contextparagraph and wi,m+1:2×m+1are nearest mwords behind Focus Word w in the ith contextparagraph.
Secondly, the Matrix Mw of all Focus Words Set would be transmitted into a system ofsymbols. Corpus Focus Words set w ∈ W and the context word distance to Focus Word w
will be formalized separately formalized to the information source and information sink ofinformation system. And then, the provided information gain by each position of differentcontext words will be calculated precisely to the whole formalized information system. Theinformation gain will be calculated as follows:
IGp = H(W) − H(W |Vp) (4)
In formula (4), IGp is the information quantity of context position p and IGp stands forthe decrement of information entropy H(W) from whole system to H(W |Vp) which standsfor the relative conditional entropy.
H(W) can be calculated as the information entropy of the Corpus Focus Words which isdefined as the information source in formula (5):
H(W) = −∑
ω∈W
p(ω) × log2 p(ω) (5)
p(ω) is the counted word frequency of Focus Word ω and p(ω) is defined as:
p(ω)=f re(ω)
n(6)
And H(W |Vp) in formula (4) is the relative conditional entropy of context position Vp
which is defined as:
H(W |Vp)=∑
cω∈Vp
p(cω) × H(W |cω) (7)
In formula (7), p(cω)is the counted word frequency of context words cω in context posi-tion p. H(W |cω) is the conditional entropy where the distribution of context words cω isattained and can be defined as:
H(W |cω)= −∑
ω∈W
p(ω|cω) × log2p(ω|cω) (8)
After calculation the values of parameters from formula (2) to (8), the information quantitygained of each word in the context position to the all Focus Word w ∈ W can be found out.Besides the main idea of our relative conditional entropy based context key word extractionmethod, this algorithm can extract the representative words or phrases with high precisenesson behalf of the main soul of the whole article in fast speed. In handling short text of socialnetwork, it has been proved of good efficiency.

Geoinformatica
4.2 Group opinion polarization analysis in social network structure
The group opinion polarization process is always influenced by the user structure of socialnetwork. Among the well-known network models such as ER Random Network Model[11], Small World Network Model [12] and Scale-Free Network Model [13], the Scale-Free Network Model has been proved as the most suitable model for the structure of onlinesocial network [14] in 2010. And the Local World Evolving Network Model was proposedby Li and Chen in 2003 to simulate the local network evolving mechanism and it can beused to research on the group opinion polarization process of social network [15]. Besidesthese models, the Hopfield model is often cited as the classical model for group opinionpolarization process [16–19] which rest assure that the changing process of single personwould always be dominated by the opinion pressure of other people in the same group.
Basing on the related work of group opinion polarization mechanism and Hopfieldmodel, we propose the UNPE Model (Undirected Network Polarization Evolution) andDNPE Model (Directed Network Polarization Evolution) for group opinion polarizationprocess of online social network group.
In our experiment, the UNPE, DNPE model and group polarization model are integratedto study in a given social environment while how social networks lead to group polariza-tion and how to control the network polarization phenomenon by controlling the variousparameters of social network in case of emergency for public opinion governance.
The UNPE Model is constructed to simulate the network polarization phenomenon onundirected networks.(e.g. Renren.com and Facebook) while the DNPEModel focus on clas-sical directed social network such as Sina Micro-Blog and Twitter. Both of them adoptedthe method of nonlinear preferential selection to describe the structure and evolution modeof online social network more accurately.
The nonlinear preferential selection probability of UNPEmodel can be found in formula(9), P(i) is the possible being linked probability of node ki and N stands for the nodenumber in the whole model. As for the directed DNPE Model, ki out is the out degree ofnode ki and ki in is the in degree of node ki need to be calculated separately to UNPEmodel,as shown in formula (10) and (11).
P(i) = k1+0.5lg(ki )
i
N∑
j=1k1+0.5lg(kj )
j
(9)
Pin(i) = k1+0.5lg(ki in)
i in
N∑
j=1k1+0.5lg(kj in)
j in
(10)
Pout (i) = k1+0.5lg(ki out )
i out
N∑
j=1k1+0.5 lg(kj out )
j out
(11)
4.2.1 Network evolution model
The whole evolution process of the UNPE model and DNPE model includes three steps:the joining of new nodes, the generation and the disappearance of new links. Meanwhile,compared with the relevant classic theories of ER RandomNetworkModel and Small World

Geoinformatica
NetworkModel, the generation of new links in UNPE and DNPE are more likely to establishbetween the new node and the “nodes with more related links”, so the whole evolutionprocess is as follows:
(1) Network initialization: The initial network is a stochastic network withm0 nodes (withthe maximum node number M), e0 edges, which ensures that each node has at leastone link connection and there is no isolated node in the network.
(2) Network evolution: Within each time step, select 1/M of the whole network as a localtarget network randomly, and repeat the following procedure:
1) New nodes joining: According to an experienced probability p1(always p1 =0.5), add the new generated node to the selected local target network and connectthe new node to the existing m1 nodes by higher probability to the nodes ”withmore related links”. Then the node connection matrix of the whole network willbe updated automatically.
2) Mechanism I of new link generation: With probability p2, m2 new links will begenerated in the network while each of these links will select a node and its neigh-bor’s neighbor to connect within the network randomly. New link generation ofMechanism I will be repeated for m2 times, and then the node connection matrixof the whole network will be updated automatically.
3) Mechanism II of new link generation: With probability p3, m2 new links will begenerated in the network. As it for ttogetherhe UNPE model, each of these m2links will select a node and another node with larger Pin(i) to connect togetherwithin the network randomly according to formula (9). As it for the DNPE model,we will select a node as a followers (e.g. in Twitter) with larger Pin(i) accord-ing to the formula (10), and select another node with larger Pout (i) according tothe formula (11) to be the one which is be followed. Then it would generate m2directed links.
4) The disappearance of new links: With probability p4 we remove an edge from thenetwork randomly. If the death of this edge results in isolated nodes, the isolatednode will be connected by the above step 2 and step 3. If death of this edge resultsmake the network turn into several disconnected small group, the remove of thisedge will be abandoned.
4.2.2 Group opinion polarization process
According to the classical theory of group polarization, priority of being access of socialnetwork user can be expressed by PageRank value to evaluate the felt pressure of eachuser [20]. According to the connection matrix AN×N , the PageRank matrix RN×N can beachieved. Basing on some society comparing theory, the distance between two nodes caninfluenced the ”credit” [21]. Therefore , the distance of shortest path dij (matrix is Dij )
between two nodes can be used to stands for the ”distance” and it is assumed to be relatedwith the felt pressure of each node.
In the group polarization model, the felt pressure of user i from another node j is directlyproportional to the influence ability of node j (expressed by PageRank value Rj ), andinversely proportional to dij . The felt pressure of node i can be presented as Iij which canbe calculated in matrix IN×N in formula (12).
Iij = Rj/Dij(12)

Geoinformatica
The average cumulative felt pressure of node i in group network towards some public eventcan be found as Pi in formula (13). It comes from the Hopfield network model [16, 22].
Pi =
N∑
j=1Iij Sj
N(13)
N is the total number of nodes in the network, Sj is the emotional tendency flag of nodej and can be assigned value of 1(stands for “support”), -1(stands for “not support”) or0(stands for “indifferent”). Sj of all nodes will compose the group emotional tendencymatrix S1×N . The final stable group emotional tendency is not only related to the groupaverage cumulative pressure, but also depends on the initial perspective emotional tendency.Si is the initial emotional tendency of node i, and the perspective tendency change of nodei is also related to the parameter βSi + (1−β)Pi in which β is the adjustable parameters of0 < β < 1 and always be assign with β=0.5 in our simulation experiment. Our simulationexperiment can be divided into two parts. The first part is to generate the network datasetusing model in Section 4.2.1. The second part is group opinion polarization process withthe random threshold value πthresh. When βSi + (1− β)Pi > πthresh, the initial emotionaltendency value Si of node i would be updated to 1 while βSi + (1 − β)Pi < −πthresh, Si
would be updated to -1 otherwise value of Si would remain unchanged. The second part ofour experiment will be carried iteratively until the emotional tendency status of the wholenetwork comes to the final stable status.
Based on the above theory, we can get the simulation results of the UNPE and DNPEgroup polarization model based on the network simulation of the Tianjin explosion events,and compare it with the true twittering relation graph of Tianjin explosion in Section 6.1.
5 Graded risk list for emergency accident handling
5.1 Risk classification
According to the accumulated emergency accidents by our research team in recent years,we have proposed a detailed risk classification method with five layered risk which can befound in Table 1.
Risk grade judgment is based on content analysis. An important step in the content anal-ysis is to extract and quantify information entropy of twittered text. The extracted contentbuilds an identifiable vector relating to the key words of risk grade in the content of SinaMicro Blog and WeChat at the initialization of pre-judgment model. Furthermore, we havehas been constructed a method combining the word frequency method, the mutual informa-tion entropy method and the relative conditional entropy based context key word extractionmethod together. We use them to extract and identify content sentiment eigenvector andfinally transfer the eigenvector to judge the risk grade in the content of Sina Micro Blog andWeChat [6, 9].
Using the above three methods, it can carry out the extraction and identification to someparticular content key words when searching, and then calculate the oriented risk grade. Ifthere is a basic conformity, a primary early- warning can be launched for government; ifnot, other operations could be continued. For example, in the primary risk judgment proce-dure, key words, such as ’great’, ’bad’, ’injuries and deaths’, can be marked when buildingthe identifiable vector of key words of Sina Micro Blog content, using the word frequencymethod to decrease the data dimension, to abolish the noisy data and to reduce the scope. To

Geoinformatica
Table1
Gradedem
ergencyaccident
risk
Riskgradeandcharacteristics
Eventstypes
Eventsexam
ples
Prim
aryrisk
Characteristic
s:events
that
cannot
beprejudgedandcon-
trolledby
humankind
andthat
are
unexpected
andgreatly
harm
fulto
thesafety
oflifeandproperty
aswellasextrem
elybedeffectson
the
stability
ofcountryandsociety.
Natural
disaster,
Geologic
and
meteorologicaldisasters,
Ecolog-
ical
disaster,Violence
and
terror
incidents
TyphoonHaiYan
in2013,Hagupit
Typhoonin
2014,W
enchuanearth-
quakein
2008,SA
RS
in2003
,KunMingRailway
Stationterrorist
attack
in2014.
Second
ary
risk
Characteristic
s:unexpected
mega-events
due
tohuman
factor,resulting
incertain
damageto
thesafety
oflifeand
property
andto
theeconom
yand
society.
Safety
accidents,Traffic
accidents,
Environmentalpollu
tionin
alarge
scaleandso
on
FireinHarbinin2016,E
xplosion
atTianjin
Portin
2015.
Tertiary
risk
Characteristic
s:events
that
hasno
threat
tosafety
oflife
andproperty,butagreatinfluence
onthesocial
stability
andpublic
opinionguidance
Issue
oflaw
about
livelihood,
Implem
entatio
nof
policy
and
soon,N
ationaland
even
globalevents
caused
bytechnologicaleconomy
Delayed
Retirem
entAct
inChina
in2015,A
nticorruptionActinCCP
launched
in2014,The
crash
ofstock
marketin
China
in2015,
Globalfinancialcrisisin
2013.
Quaternary
risk
Characteristic
s:events
that
hasno
threat
tosafety
oflifeandproperty,butacertain
influenceon
thesocialstability
and
publicopinionguidance
Dom
estic
and
foreign
policy,
Diplomaticincidents
American
presidentia
lelectio
nin
2016,TPP
launched
byObamain
2015
,XiJinping
visitUSA
in2015,th
e2015
China
Victory
Day
Parade
ofCounter-Japanese
War
(1937-1945).
Others
Characteristic
s:inform
a-tio
nalevents
that
hasno
threat
tosafety
oflifeandproperty
andno
significantinfluenceon
thesocial
stability
andpublic
opinionguid-
ance
Event
ofordinary
public
figures,
Eventslik
etypicalphenom
enon
ofsocietyandso
on
Attack
onagirl
inYitelHotel
inBeijin
gin
2016.
Geoinformatica
confirm the relevance between the Sina Micro Blog content and ’the primary risk category’,the mutual information method and the relative conditional entropy based context keyword extraction method can be used to calculate the mutual information value (i.e. rela-tive entropy) of feature quantity from key words, while finally to confirm the contributiondegree of the Sina Micro Blog content to the entire ’primary risk category’ for choosing theselected situation of the feature quantity [7, 14, 23–25].
Basing on the collected online public opinion data of hot accidents in the past decade,we calculate and attain the graded risk list in Table 1 which divided into five types of riskand it may be useful for government to make decision in case of emergency. In addition, thehot accidents are classified into five different types which can be found in Table 2.
5.2 Accident types
Depending on the type of network public opinion of hot event, it can be divided into fiveareas, political, society, the people’s livelihood, natural or man-made disasters and other.
6 Case evaluation with CPS model
The efficient CPS model based online opinion governance modeling and evaluation sys-tem proposed in this article has been applied into some real emergency accidents suchas Typhoon HaiYan in 2013, Typhoon Hagupit in 2014 and Explosion at Tianjin Port in2015.Our system has been proved useful and helpful for government officers to makedecisions in facing emergency accidents and disasters.
6.1 Explosion at Tianjin port in 2015
The 2015 Tianjin explosion accident composed of a series of explosions which killed overone hundred people at a chemicals storage company in Tianjin Port on Wednesday, August12 2015. It has been regarded as the most harmful and dangerous explosion accident afterthe foundation of PR China since 1949. The first two explosions occurred within 30 secondsat the chemicals storage company, which located in the BinHai New Distric of Tianjin. Thesecond explosion was much larger and caused by about 800 tons of ammonium nitrate. Firescaused by the initial explosions continued to burn out of control throughout the weekend,
Table 2 Accident types
The type of event Instructions
Political The events involving diplomatic or political incidents happened at homeland
and abroad.
People’s livelihood The events involving the livelihood of people, such as laws enacted
and implementation of policy.
Society The events involving the public safety, social celebrities and social phenomenon etc.
Natural/Man-madedisasters
Natural disasters, accidents, transportation accidents and environment pollution etc.
Other The events triggered by the science, technology and economic factors.

Geoinformatica
Fig. 4 Word frequency of SINA micro blog
repeatedly causing some secondary explosions. On 12 September 2015, the governmentreported 173 deaths, 8 missing, and 797 non-fatal injuries in this accident.
6.1.1 Cyber domain
Figure 4 demonstrates the key word frequency calculated by our system from August 12 toAugust 31 by Sina Micro Blog data. And we can found that the calculation result preciselyshows the attention focus of social network user. The circled focus Chinese word stands forthe explosion location and the explosion event can be found in the central area in Fig. 4.And the calculated word frequency result has been proved useful to find out focus of onlineopinion.
We can get event data area of physical domain and the initial situation. Our system(in adjustable intervals) can collect the online information from social network in each 5minutes, and the user can monitor events status in real-time development, according tometeorological situation, hydrological situation, mass evacuation routes and deployment offirefighters’ disposal program.
Tables 3 and 4 shows the Word Frequency Rank in the early stage and the later stage. Itcan be found that public opinion focus on the accident victims when the incident occurred.Lately, people become concerned about conducting a thorough investigation and showrespect to the sacrifices of the heroes of fire fighter. All the words in Column ”Word”of Tables 3 and 4 has been translated from Chinese characters to English words for thecomprehensive convenience of English speakers.
We use a method for automatic summarization based on LDA model and informationentropy for Chinese document. It uses LDA model to do shallow semantic analysis work ondocuments and gets the distribution of topics under each document. Through analyzing thetopics of document, we get the topic which has the best expression of central idea for doc-ument. Meanwhile, our paper has proposed a new method to compute the sentence weightand extract the most important sentence based on measuring the information entropy foreach sentence. It treats the sentence as a random variable and calculates the information

Geoinformatica
Table 3 Word frequency rank in the early stage
Words Part of speech Weights Word Frequency
Explosion Verb,Noun 5.68 2753
Occur Verb 5.82 874
Tianjin BinHai New Area New Noun 6.52 599
Explosion New Noun 10.07 463
Clifford Verb 6.24 457
Dangerous goods stores New Noun 3.81 338
Hope Verb 6.7 300
Tianjin Binhai New Noun 4.49 280
Accident Noun 6.71 271
Victims Intransitive Verb 4.95 269
Hospital Noun 6.7 260
Help Verb,Noun 6.75 246
Know Verb 5.78 232
Store Noun 3.67 227
Injured Intransitive Verb 4.86 218
Blessing Verb 7.06 191
Binhai New Area New Noun 7.89 191
entropy for every random variable. Experimental results show that this method can pick outthe most important sentence in the document.
By the mentioned above table, it can be found that, at the beginning of the TianjinExplosion event, people greatly concerned about the incident itself. And lately people haveexpressed concern about the injured persons while focus has changed.
6.1.2 Society domain
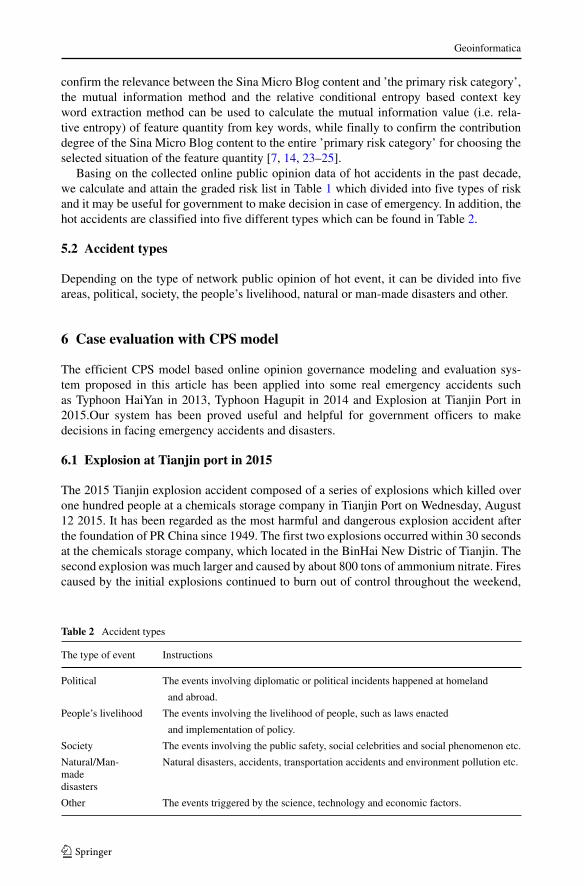
In Fig. 5, it can be found that the hot search distribution of Tianjin Explosion Event whichhas demonstrated the human behavior of paying attention from the society domain. Andwe can found that the ”Topic heat” is focus on ”Tianjin” and ”Explosion” while the fastestrising search words is the location of the Tianjin Explosion Event which is ”Changchengjistreet”. Furthermore, another very clear district of Tianjin to the explosion point whichnamed ”Dagang” is found in the list to show that the people also care about the the neigh-bors to the explosion event. Figure 5 has shown us the online searching hot words and itsdistribution to reflect the attention focus of people.
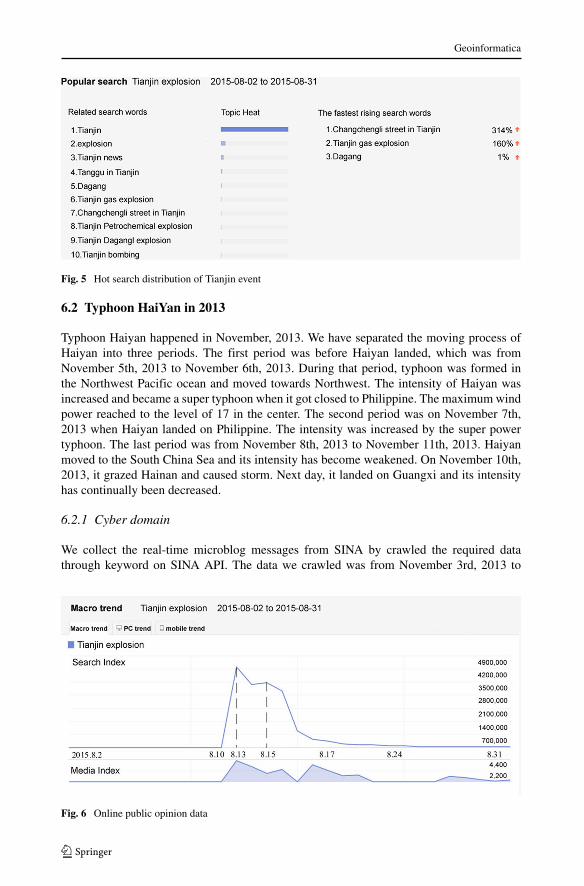
Figure 6 is the overall trend line which based on the result of Baidu index when “Tianjinexplosion” as the search keyword. As it can be seen from the chart, the incident search indexon day of August 13 has reached its peak while in the next two days to August 15 the searchindex reached a valley. And before August 17, the search index has more moderate ups anddowns while finally has dropped down in 8 days after August 24.
We have found that more than 3,210,000 points of Baidu search results and Baidu newsover 3,050,000 articles by keywords of ”Tianjin explosion” by September 9, 2015. And thenews has been broadcasted over 66,962,864 times by Sina Weibo and over 519,465 timesby Tencent Micro Blog. We have collected the data and analyzed the case by some usefulmethods [26, 27].

Geoinformatica
Table 4 Word frequency rank in the late stage
Word Part of speech Weights Word Frequency
Explosion Verb,Noun 6.23 7306
Tianjin Noun 8.78 4942
Explosion New Noun 8.23 1409
Occur Verb 7.36 1176
Victims New Noun 8.73 1020
Accidents Noun 8.63 973
Tianjin harbor ns 6.76 881
Tianjin Binhai New Area New Noun 8.29 861
Ruihai company New Noun 9.3 695
News Noun 7.97 674
Government Noun 9.09 582
Hope Verb 7.69 528
Clifford Verb 7.01 518
Disaster Noun 7.45 486
Marina Noun 7.09 470
The company Noun 8.65 469
Life Noun 7.56 446
Know Verb 6.7 437
Help Verb,Noun 8.03 419
Survey Verb 6.47 419
Warehouse Noun 6.07 404
Binhai New Area New Noun 9.21 391
Country Noun 8.52 386
Hero Noun 6.82 377
Jobs Verb,Noun 7.53 369
6.1.3 Group opinion polarization analysis
Based on the Group Opinion Polarization Analysis simulation method mentioned above, weget the simulation results of the UNPE group polarization model based on the network sim-ulation of the Tianjin explosion events, and compare it with the Barabasi group polarizationModel [28] and the true Twittering relation graph of Tianjin explosion from the crawledSina Micro Blog data. The true Twittering relation graph includes 55 focus vertex and 200edges which stand for the very active people in the discussion towards the explosion.
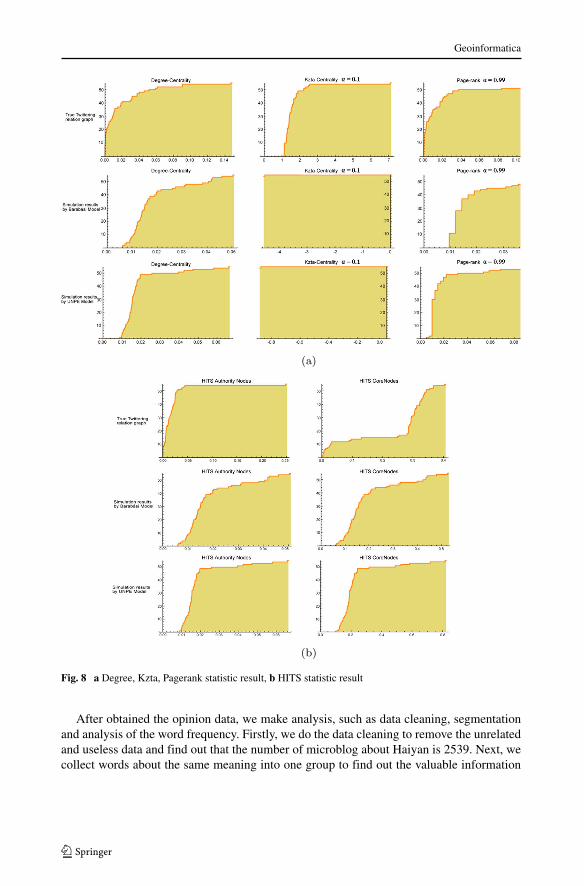
It could be seen from Figs. 7 and 8 in the experiment result that in the simulation ofgroup polarization network, the UNPE model conforms to the actual situation more in thePapeRank index and HITS (Hyperlink Induced Topic Search) index of group polarizationeffect, but shows inconformity with the actual network in Katz centrality index. Through theresearch and predicting of the polarization phenomenon of mass viewpoint of public onlineopinion, we can make a pre judgment and conduct early screening and management towardsthe tendency of public opinion in different social networks in cyber domain. And UNPEmodel is useful to prevent the spread of rumor information, to promote the dissemination ofeffective information on the aspect.
Geoinformatica
Fig. 5 Hot search distribution of Tianjin event
6.2 Typhoon HaiYan in 2013
Typhoon Haiyan happened in November, 2013. We have separated the moving process ofHaiyan into three periods. The first period was before Haiyan landed, which was fromNovember 5th, 2013 to November 6th, 2013. During that period, typhoon was formed inthe Northwest Pacific ocean and moved towards Northwest. The intensity of Haiyan wasincreased and became a super typhoon when it got closed to Philippine. The maximum windpower reached to the level of 17 in the center. The second period was on November 7th,2013 when Haiyan landed on Philippine. The intensity was increased by the super powertyphoon. The last period was from November 8th, 2013 to November 11th, 2013. Haiyanmoved to the South China Sea and its intensity has become weakened. On November 10th,2013, it grazed Hainan and caused storm. Next day, it landed on Guangxi and its intensityhas continually been decreased.
6.2.1 Cyber domain
We collect the real-time microblog messages from SINA by crawled the required datathrough keyword on SINA API. The data we crawled was from November 3rd, 2013 to
Fig. 6 Online public opinion data

Geoinformatica
Fig. 7 Group polarization graph
November 15th, 2013. We found that the number of the microblog was changed accordingto different situation changes in Haiyan and the related measures taken by the government.For example, in Fig. 9, it is clear that the number of microblog posts was increased to 1200on November 11th 2013, which was also the date when typhoon Haiyan landed on Guangxi.When the number reached to the maximum value, it decreased dramatically because duringthose days, government had taken some related measures to handle this emergency accident.And from Fig. 9, we can see that measures worked and have efficiently made the discussionless hot.
Since Haiyan was only landed in Hainan and grazed in Guangxi, the following datamining such as the word frequency analysis and other related analysis based on the cyberinformation space is only executed in Hainan and Guangxi.
Geoinformatica
Fig. 8 a Degree, Kzta, Pagerank statistic result, b HITS statistic result
After obtained the opinion data, we make analysis, such as data cleaning, segmentationand analysis of the word frequency. Firstly, we do the data cleaning to remove the unrelatedand useless data and find out that the number of microblog about Haiyan is 2539. Next, wecollect words about the same meaning into one group to find out the valuable information

Geoinformatica
Fig. 9 Opinion development timeline of Haiyan
given by microblog. After that, we have ranked these words and conducted the wordfrequency analysis. The outcomes are showed in Tables 5 and 6.
From Table 5, we can clearly find out the high frequency words posted by Hainan citi-zens. These hottest discussion words include ”power outage”, ”Ledong County”, ”WanquanRiver”, ”rescue” and ”without water”. It tell us that citizens in Hainan pay their attentionmuch on the damage of the infrastructure, such as power, water, food supply, affected loca-tion and the recovery plan. From Table 6, the hottest discussion words are ”rain storm”,”umbrella”, ”attend class”, ”go to work” and ”power recovery”, which indicates that citizensin Guangxi province focus on the storm caused by typhoon Haiyan.
Comparing with Tables 5 and 6, we can discover that citizens in Hainan have muchmore concern on their basic needs, such as rescue, food, water, power. However, people inGuangxi concerns much about the coming storm, recovery and they also want to go outsoon. It has a reason because the damage in Hainan is much more severe than the damagein Guangxi by using the Maslow’s Theory of the Level Demand. Interestingly, it is Guangxirather than Hainan that the typhoon Haiyan landed.
6.2.2 Society domain
From Fig. 10, we can see that most of the Chinese citizens hold the negative emotionstowards Haiyan especially on the day when it landed on Guangxi. It made Chinese peoplebecome much fear because it is so close to their real-life.

Geoinformatica
Table 5 High frequency wordsposted by Hainan citizen Number Keywords Frequency
1 Haiyan 142
2 strong typhoon 94
3 power outage 88
4 Hainan 74
5 @News Head 7
6 distance 7
7 you 7
8 @Daily 6
International 6
Tourism
9 Ledong County 6
10 @CCTV 6
11 16 o’clock 6
12 about (‘’) 6
13 Kilometer 6
14 Cry 5
15 trapped (‘’) 4
16 Wanquan River 4
17 Rain&wind 4
18 village 4
19 rescue 4
20 without water 2
Table 6 High frequency wordsposted by Guangxi citizen Number Keywords Frequency
1 Haiyan 111
2 typhoon 86
3 @News Head 51
4 Guangxi 47
5 morning 43
6 domestic (jingnei) 41
7 enter 41
8 cry 15
9 go out 14
10 rain storm 11
11 Ledong County 10
12 attend class 10
13 go to work 7
14 shocked (chi jing) 6
15 candle 6
16 umbrella 6
17 recovery 6
18 attack 4
19 power recovery 4
20 affected (shouzai) 4

Geoinformatica
Fig. 10 Sentiment analysis on typhoon Haiyan
7 Conclusion
In this paper, we have proposed a new CPSModel based Online Opinion Governance systemwhich constructed on cellphone APP for data collection and decision make in the back end.Our contributions are as followed: we propose the new graded risk classification methodand new accident classification method. We propose the new group opinion polarizationanalysis method and have made very good promotion of the relative conditional entropybased context key word extraction method. Based on our contribution, we have built anefficient CPS Model based simulated emergency accident replying and handling system.It has been proved that integrated data from cyber domain, physical domain, and societydomain will help us to make the final management decision. Furthermore, we proposed thedetailed analysis of 2015 Tianjin Explode accident and Haiyan Typhoon in 2013.
Acknowledgments Thanks to Philosophy and Social Science Project of Education Ministry (No.15JZD027), National Culture Support Foundation Project of China (2013BAH43F01), and National 973 Pro-gram Foundation Project of China (2013CB329600) in social network analysis. We appreciate direction fromprofessor Hui Zhang andhis aid form Joint-Operated project from National Natural Science Foundation ofChina (NSFC) (Grants No. 91224008-14) from Tsinghua University.
References
1. Joseph K, Landwehr PM, Carley KM (2014) An approach to selecting keywords to track on twit-ter during a disaster. In: Proceedings of the 11th International ISC. Conference – University Park.https://doi.org/10.1037/0003-066X.36.4.343RAM
2. Slavkovikj V, Verstockt S, Hoecke SV et al (2014) Review of wild fire detection using social media. FireSafe J 68:109–118. https://doi.org/10.1016/j.firesaf.2014.05.021

Geoinformatica
3. Deng Q, Liu Y, Zhang H et al (2016) A new crowdsourcing model to assess disaster using microblogdata in typhoon Haiyan[J]. Nat Hazards J Int Soc Prevent Mitigation Nat Hazards 84(2):1–16.https://doi.org/10.1007/s11069-016-2484-9
4. Ma YF, Deng Q, Wang XZ, Liu JQ, Zhang H (2014) Keyword-based semantic analysis of microblog forpublic opinion study in online collective behaviors, web-age information management lecture notes incomputer science 2014, pp 44–55. https://doi.org/10.1007/978-3-319-11538-2 5
5. German N, Leonie R, Astrid M et al (2014) Psychosocial functions of socialmedia usage in a disaster situation: amulti-methodological approach. Comput HumBehav 34:28–38. https://doi.org/10.1016/j.chb.2014.01.021
6. Onorati T, Malizia A, Diaz P, Aedo I (2014) Modeling an ontology on accessible evacuation routes foremergencies. Exp Syst Appl 41:7124–7134. https://doi.org/10.1016/j.eswa.2014.05.039
7. Hadiguna RA, Kamil I, Delati S, Reed R (2014) Implementing a web-based decision support system fordisaster logistics: a case study of an evacuation location assessment for Indonesia. Int J Disaster RiskReduct 9:38–47. https://doi.org/10.1016/j.ijdrr.2014.02.004
8. Campos V, Bandeira R, Bandeira A (2012) A method for evacuation route planning in disaster situations.Procedia - Soc Behav Sci 54:503–512. https://doi.org/10.1016/j.sbspro.2012.09.768
9. Ndiaye IA, Neron E, Linot A, Monmarche N, Goerigk M (2014) A new model for macroscopicpedestrian evacuation planning with safety and duration criteria. Transport Res Procedia 2:486–494.https://doi.org/10.1016/j.trpro.2014.09.064
10. Li R, Zhang H-p, Zhao Y-p, Shang J-y (2014) Automatic text summarization research based on topicmodel and information entropy[J]. Comput Sci 41(11a):298–332
11. Erdos P, Renyi A (1960) On the evolution of random graphs [J]. Publ Math Inst Hung Acad Sci Ser A5:17–61. 05C80
12. Watts DJ, Strogatz SH (1998) Collective dynamics of “small world” networks [J]. Nature 393(4):440–442. https://doi.org/10.1038/30918
13. Bababasi AL, Albertr (2512) Emergence of scaling in random networks [J]. Science 286(509):1999.https://doi.org/10.1126/science.286.5439.509
14. HaiBo H (2010) Research on the structure, evolution and dynamics of online social networks [D].Shanghai Jiao Tong University, Doctoral dissertation
15. Li X, Chen G (2003) A local world evolving network model [J]. Phys A 323:274–286.https://doi.org/10.1016/S0378-4371(03)00604-6
16. Macy MW, Kitts JA, Andreas F (2003) Polarization in dynamic networks: a Hopfield model of emergentstructure [J]. The National Academies Press, (163)
17. Maria MC, Neville AS, Ioannis M (2015) The concept of risk situation awareness provision: towardsa new approach for assessing the DSA about the threats and vulnerabilities of complex socio-technicalsystems. Saf Sci 79:126–138. https://doi.org/10.1016/j.ssci.2015.05.012
18. NewmanMEJ, Clauset A (1863) Structure and inference in annotated networks. Nat Commun 7(1):2016.https://doi.org/10.1038/ncomms11863
19. Xiao Z, Travis M, Newman MEJ (2015) Identification of core-peripherystructure in networks. Phys RevE 91:032803. https://doi.org/10.1103/PhysRevE.91.032803
20. Wang L (2009) Amelioration of PageRank Algorithm [D]. Shanghai Jiao Tong University, Unpublishedmaster’s thesis
21. Latane B (1981) The psychology of social impact [J]. Amer Psychol 36:343–365. https://doi.org/10.1037/0003-066X.36.4.343
22. Hopfield JJ (1982) Neural networks and physical systems with emergent collective computationalabilities [J]. Proc Nat Acad Sci 79:2554–2558. https://doi.org/10.1073/pnas.79.8.2554
23. Sun D, Zhang LH, Chen FX (2013) Comparative study on simulation performances of CORSIM and VISSIMfor urban street network. SimulModel PractTheory 37:18–29. https://doi.org/10.1016/j.simpat.2013.05.007
24. Wilensky H (2014) Twitter as a navigator for stranded commuters during the great East JapanEarthquake. In: Proceedings of the 11th International ISCRAM conference. University Park
25. Seppanen H, Virrantaus K (2015) Shared situational awareness and information quality in disastermanagement. Saf Sci 77:112–122. https://doi.org/10.1016/j.ssci.2015.03.018
26. Mora K, Chang J, Beatson A, Morahan C (2015) Public perceptions of building seismic safety followingthe Canterbury earthquakes: a qualitative analysis using Twitter and focus groups. Int J Disaster RiskReduct 13:1–9. https://doi.org/10.1016/j.ijdrr.2015.03.008
27. Gaspar R, Pedroc C et al (2016) Beyond positive or negative: qualitative sentiment analysis of socialmedia reactions to unexpected stressful events. Comput Hum Behav 56:179–191. https://doi.org/10.1016/j.chb.2015.11.040
28. Barabasi A-L, Albert R (1999) Emergence of scaling in random networks [J]. Science 286:509–512

Geoinformatica
Xiao Long Deng, born in 1977, PHD, is interested in data mining from Beijing University of Post andTelecommunication(BUPT). His research interests include data mining and emergency management.
Yin Luan Yu, born in 1974, a professor in China Academy of Social Management, Beijing NormalUniversity Beijing. Her research interests include social computing and emergency management.
Dan Huai Guo, born in 1975, an associate professor in Computer Network Information Center of ChineseAcademy of Sciences. His research interests include social network analysis and data science.

Geoinformatica
Ying Tong Dou, born in 1994, a senior student majoring in Telecommunication Engineering with Man-agement at BUPT International School. He is a research assistant at the Key Laboratory of TrustworthyDistributed Computing and Service and interested in social network analysis and data science.


![18-4masglp.olemiss.edu/Water Log PDF/18-4.pdfcob-qoza_T ZApg1J cg1crqgg1JB cps cps aorupgw glgccgq co nag g rg4 cps cps g aorupgw co pgbgug]lxgq upla ÀggL' cps cowbg1JÀ pgcaug cps](https://img.pdfslide.net/doc/110x75/5e2f59f63318b957b5481e92/18-log-pdf18-4pdf-cob-qozat-zapg1j-cg1crqgg1jb-cps-cps-aorupgw-glgccgq-co-nag.jpg)