Embed Size (px)
Citation preview
34
ISSN 2070-6103
17–20 September 2012Bilbao, Spain
FAOFISHERIES ANDAQUACULTUREPROCEEDINGS
Effort rights in fisheries managementGeneral principles and case studiesfrom around the world

Cover photograph:Canoe on rocks. Courtesy of Patrick McConney, Centre for Resource Management and Environmental Studies (CERMES), Barbados.
Effort rights in fisheries managementGeneral principles and case studies from around the world
FOOD AND AGRICULTURE ORGANIZATION OF THE UNITED NATIONS Rome, 2016
17–20 September 2012 Bilbao, Spain
FAOFISHERIES ANDAQUACULTUREPROCEEDINGS
34
Dale SquiresSenior Scientist NOAA Fisheries, La Jolla, the United States of America
Mark MaunderInter-American Tropical Tuna Commission, La Jolla, the United States of America
Niels Vestergaard Department of Environmental and Business Economics, University of Southern Denmark, Denmark
Victor RestrepoInternational Seafood Sustainability Foundation, McLean, the United States of America
Rebecca MetznerFood and Agriculture Organization of the United Nations, Rome, Italy
Samuel Herrick, Jr.NOAA Fisheries, La Jolla, the United States of America
Rögnvaldur HannessonNorwegian School of Economics and Business Administration, Bergen, Norway
Ikerne del ValleUniversity of the Basque Country, Bilbao, Spain
Peder AndersenInstitute of Food and Resource Economics, University of Copenhagen, Denmark
The designations employed and the presentation of material in this information product do not imply the expression of any opinion whatsoever on the part of the Food and Agriculture Organization of the United Nations (FAO) concerning the legal or development status of any country, territory, city or area or of its authorities, or concerning the delimitation of its frontiers or boundaries. The mention of specific companies or products of manufacturers, whether or not these have been patented, does not imply that these have been endorsed or recommended by FAO in preference to others of a similar nature that are not mentioned.
The views expressed in this information product are those of the author(s) and do not necessarily reflect the views or policies of FAO.
ISBN 978-92-5-109280-4© FAO, 2016
FAO encourages the use, reproduction and dissemination of material in this information product. Except where otherwise indicated, material may be copied, downloaded and printed for private study, research and teaching purposes, or for use in non-commercial products or services, provided that appropriate acknowledgement of FAO as the source and copyright holder is given and that FAO’s endorsement of users’ views, products or services is not implied in any way.
All requests for translation and adaptation rights, and for resale and other commercial use rights should be made via www.fao.org/contact-us/licence-request or addressed to [email protected].
FAO information products are available on the FAO website (www.fao.org/publications) and can be purchased through [email protected].
iii
Preparation of this document
The origin of these Proceedings lies in the presentations to a workshop and subsequent discussion on management of marine fisheries by fishing effort and effort rights-based management held in Bilbao, Spain, in September 2012. This document includes an overview and introduction, synthesis of the workshop results, several overview and conceptual papers, and a number of case studies. The presentations and contributed papers are reproduced as submitted.
All workshop participants acted in their individual capacity as scientists and not as official representatives of any government or institution, and all results represent their views and findings in this capacity and do not necessarily represent the positions of any of their employers, funders or sponsors. Funding for this publication was provided by FAO, and workshop sponsorship and funding was provided by the University of the Basque Country, the Research Council of Norway, the Institute for Global Cooperation and Conflict of the University of California, the Center for Environmental Economics University of California San Diego, NOAA Fisheries, and the International Seafood Sustainability Foundation.
iv
Abstract
This publication reports on a multidisciplinary workshop that evaluated rights-based conservation and management of marine fisheries by fishing effort, and more broadly management by regulating effort rather than catch. This publication includes a synthesis of the workshop results and conclusions, workshop presentations on conceptual issues and case studies, and a chapter commissioned after the workshop to assess individual and collective rights-based management approaches to fisheries.
The workshop surveyed and discussed the actual practice and issues associated with effort rights-based management and, more broadly, effort management in general. As rights-based management of catch or effort necessarily requires a total allowable catch (TAC) or total allowable effort (TAE), the workshop discussed rights-based management in conjunction with issues in assessing fish populations and providing TACs or TAEs. The interdisciplinary workshop included economists, population biologists, political economists, and fisheries managers, many of whom provided interdisciplinary background papers and presentations.
The workshop focused on comparing the advantages and disadvantages of effort rights-based management with catch rights-based management and trade-offs between the two. Although clear conditions may sometimes exist, favouring one approach over another, the workshop participants recognized that various circumstances may favour a different approach in practice and that hybrid approaches of both catch and effort systems are increasingly found.
The workshop found that effort rights-based management might be more effective at managing fishing mortality where uncertainty in biomass and TAC estimates is more important than uncertainty in the estimates of the catchability coefficient. Catch rights-based management generates stronger incentives to reduce effort and costs as well as increase price and, thereby, revenues through improved quality or smoothing out seasonality of production. However, whereas effort rights-based management creates incentives to maximize revenue and catch, and in the process creates incentives to expand input use and costs. Thus, the latter form of management requires continued adjustment in the TAE and input controls to counter ongoing increases in uncontrolled inputs, including vessel size, increased productivity (fishing power) due to technological change and more-efficient fishers replacing less-efficient ones, and monitoring increases in productivity. It also creates weak incentives to shed capacity. Catch rights-based management requires monitoring of the population and catches, control of catches, and dealing with catches beyond quotas.
In a narrow economic sense, catch rights are superior, but once the costs of research to improve stock assessments and the associated risks of determining the quota and costs of monitoring, control, surveillance, and enforcement are taken into consideration, the choice between the two forms of management becomes more complex and less clear. The results will be case specific. Hybrid systems of both catch and effort are increasingly employed to manage marine fisheries in order to capture the advantages of both approaches, with one approach forming the dominant management system.
Squires, D., Maunder, M., Vestergaard, N., Restrepo, V., Metzner, R., Herrick, S., Hannesson, R., del Valle, I. & Andersen, P. 2014.Effort rights in fisheries management: general principles and case studies from around the world, 17–20 September 2012, Bilbao, Spain. FAO Fisheries and Aquaculture Proceedings No. 34. Rome, FAO. 260pp.
v
Contents
Preparation of this document iiiAbstract ivAcknowledgements viiAbbreviations and acronyms viiiWorkshop summary xi
1 Effort rights in fisheries management: general principles and case studies from around the world 1
2 Synthesis of Workshop Results: pros and cons of effort-based management; Dale Squires and Mark Maunder 112.1 Introduction 11
2.2 Global effort programmes 13
2.3 Microeconomics of vessel harvesting, economic incentives, law and economics of property rights 15
2.4 Technical change and effort productivity differences: effort creep and effective effort 17
2.5 Bycatch 18
2.6 Denomination of catch and effort rights 19
2.7 Allocation and “over-allocation” 19
2.8 Transition from one system to another and hybrid systems 19
2.9 Nationality restrictions 20
2.10 Multispecies and protected species issues 21
2.11 Spatial management 21
2.12 Management costs 21
2.13 Political economy 21
2.14 Estimating fish stocks, total allowable catch, and total allowable effort 22
2.15 Bioeconomic perspective 23
2.16 Conclusions 23
References 27
Appendix 1 – List of presentations 29
Appendix 2 – List of participants 30
Appendix 2 – Agenda 32
vi
CONTRIBUTED PAPERS 35
Effort rights-based management 37
Is there a Case for Effort Control? 79
Effort versus quota control when stocks cannot be targeted 87
On Fisheries and Property Rights 99
Effort management in the Danish fishery for blue mussels 107
From effort control to an ITQ system in the Grand Sole Fishing Grounds: Evolution and new evidence from a case study 123
Hawaii Pelagic Longline Fishery and Sea Turtle Bycatch – the use of set certificates as an allocation solution 135
The transferable effort system in Faroe Islands 151
The Vessel Day Scheme: Rights-based management and economic and environmental change in the Western and Central Pacific Ocean tuna fishery 163
Management of Demersal Fisheries in the Faroese Fishing Zone, FFZ 181
Input-based rights – The Falkland Islands Loligo squid fishery 199
Rights-based fisheries management in a developing country: a case study of Malaysia 207
The Effort Control Programme in the Northeast United States Groundfish Fishery 215
Tradable Traps in the Northeast U.S. American Lobster Fishery 235
Collective Approaches to Fisheries Management 251
vii
Acknowledgements
The following are all thanked: the University of the Basque Country (the host), all workshop participants and all sponsors, including: the University of the Basque Country, the Research Council of Norway, the Institute for Global Cooperation and Conflict of the University of California, the Center for Environmental Economics University of California San Diego, NOAA Fisheries, and the International Seafood Sustainability Foundation. Stephanie Flores is thanked for careful editorial work, and the Food and Agriculture Organization of the United Nations is thanked for financial support in making this publication possible.
viii
Abbreviations and acronyms
ACFCMA Atlantic Coastal Fisheries Cooperative Management ActACP African and Pacific countriesAFMA Australian Fisheries Management AuthorityASMFC Atlantic States Marine Fisheries CommissionB stock size in biomassBMSY biomass at maximum sustainable yieldBiOp biological opinion (BiOp)BOE Boletín Oficial del Estado: Official State GazetteBSAI Bering Sea and Aleutian Islandsc catchCCL collective-choice level (i.e. the right of management, the right of exclusion
and the right of alienation)C(e) cost per unit of effortCE catch entitlementCouncil Western Pacific Fishery Management Council or New England Fishery
Management CouncilCPR common pool resourcesCPUE catch per unit of effortd marginal external social costDAS days at seaDG Director-General of FisheriesDoF Department of FisheriesDTU Aqua-National Institute of Aquatic Resourcesε random variablee nominal effortE nominal effortEBIT earnings before interest and taxesEEC European Economic CommunityEEZ exclusive economic zoneESA Endangered Species ActEU European UnionF fishing mortalityFMSY fishing mortality at maximum sustainable yieldFAD floating aggregator deviceFFA Pacific Islands Forum Fisheries AgencyFICZ Falkland Islands Fishing ZoneFIDC Falkland Islands Development CorporationFIG Falkland Islands GovernmentFKA transferable vessel quota sharesFMP Fishery Management PlanFSM Federated States of MicronesiaFSMA Federated States of Micronesia ArrangementFWC Florida Fish and Wildlife Conservation Commission f(z) unit cost of fishingGDP gross domestic productGRT gross register tonnage
ix
GT gross tonh harvest amounth̅ individual vessel harvest quotaH̅ aggregate (total) harvestHLA Hawaii Longline AssociationHp horsepowerICES International Council for the Exploration of the SeaICNAF International Commission for the Northwest Atlantic FisheriesIFQ individual fishing quota IMBS individual market based systemsIPQ individual processor quotaISFMP Interstate Fishery Management PlanITE individual transferable effort ITEQ individual transferable effort quotaITQ individual transferable quotaITT individual tradable trapsKg kilogramKw kilowattLb pound (unit of weight)LBD learning by doingLCMA Lobster Conservation Management AreasLCMT Lobster Conservation Management TeamsLKIM Fisheries Development Authority of MalaysiaMCS monitoring, control, and surveillanceMEY maximum economic yieldMMEA Malaysian Maritime Enforcement AgencyMSY maximum sustained yieldNEAFC Northeast Atlantic Fisheries CommissionNEFMC New England Fishery Management CouncilNGO non-governmental organizationsNm nautical mileNMFS National Marine Fisheries ServiceNPFMC North Pacific Fisheries Management CouncilNWGG North Western Working GroupOCC Outer Cape CodOECD Organisation for Economic Cooperation and DevelopmentOL operational level (i.e. the rights of access and the right of withdrawal)P price of fish or price of daysPFMP Pelagic Fisheries Management PlanPFMP Pelagics Fisheries Management PlanPIFSC Pacific Islands Fisheries Science CenterPNA Parties to the Nauru AgreementPNG Papua New GuineaPQ provisional quotaPSZ protected species zone PZJA protected zone joint authorityπ profitQ quota or quantity of daysq catchability coefficientQMS quota management system R Stock size in biomass at beginning of fishing period or recruitment of
fish at beginning of periodRFMO Regional Fisheries Management Organization
x
RM Malaysian Ringgit (currency)s target rate of exploitationS stock size in biomassSAP special access programmesSPC Secretariat of the Pacific CommunitySSB spawning stock biomasst time period or landings taxTAC total allowable catchTAE total allowable effortTTAC target total allowable catchesTURF territorial use rights fisheriesTURTSIM Sea turtle simulation modelUNCLOS United Nations Convention on the Law of the SeaUNFSA United Nations Fish Stocks Agreementv common rate of exploitationVDS vessel day schemeVMS vessel monitoring systemWCPFC Western and Central Pacific Fisheries CommissionWCPO Western and Central Pacific OceanWGBEAC Working Group on joint Biological and Economic Assessments of
Conservation ActionsX stock size in biomassY yield or catchYPR yield per recruitz exploited stock
xi
Workshop summary
This publication reports on a multidisciplinary workshop that evaluated rights-based management of marine fisheries using rights over fishing effort, and more broadly management by regulating effort rather than catch. The workshop and this publication found that the choice between catch or effort rights-based management essentially comes down to two factors: economics, and biological information. Effort rights-based management may be more effective at managing fishing mortality where there is uncertainty in the estimates of biomass and total allowable catches (TACs), and catch rights-based management is more effective where there is uncertainty in the estimates of the catchability coefficient. Catch rights-based management generates stronger incentives to reduce effort and costs and to increase price and revenue through improved quality or smoothing out seasonality of production, whereas effort rights-based management creates incentives to maximize revenue and catch, and in the process creates incentives to expand input use and costs and difficulty in shedding capacity. Effort rights-based management thereby requires continued adjustment in the TAE and input controls to counter ongoing increases in uncontrolled inputs, including vessel size, increased productivity (fishing power) due to technological change, and more-efficient fishers replacing less-efficient ones. Effort rights-based management requires monitoring increases in productivity and creates weak incentives to shed capacity. Catch rights-based management requires monitoring the population and catches, control of catches, and dealing with catches beyond quotas.In a narrow economic sense, catch rights are superior, but once the costs of research to improve stock assessments and the associated risks of determining the quota and costs of monitoring, control, surveillance, and enforcement are taken into consideration, the choice between catch or effort rights-based management becomes more complex and less clear. The results will be case-specific. Catch rights programmes that have emerged from effort rights programmes often retain many features of the latter, forming in effect hybrid systems. Hybrid systems of both catch and effort are increasingly employed to manage marine fisheries to capture the advantages of both approaches, with one approach forming the dominant management system. The form of rights-based management cannot be separated from the choice of TAC or total allowable effort (TAE) management.

1
Dale Squires, NOAA Fisheries, Southwest Fisheries Science CenterE-mail: [email protected] Maunder, Inter-American Tropical Tuna CommissionE-mail: [email protected] Vestergaard, Department of Environmental and Business Economics, University of Southern DenmarkE-mail: [email protected] Restrepo, International Seafood Sustainability FoundationE-mail: [email protected] Metzner, Food and Agriculture Organization of the United NationsE-mail: [email protected] Herrick, Jr., NOAA Fisheries, Southwest Fisheries Science CenterE-mail: [email protected]ögnvaldur Hannesson, Norwegian School of Economics and Business AdministrationE-mail: [email protected] Ikerne del Valle, University of the Basque CountryE-mail: [email protected] Andersen, Institute of Food and Resource Economics, University of CopenhagenE-mail: [email protected]
OVERVIEW AND INTRODUCTIONManagement and conservation of marine fisheries by rights-based management for fishing effort and, more broadly, management by regulating effort rather than catch are applied throughout the world in a variety of fisheries. The most widely applied and analysed form of rights-based management is individual or group quotas over catches, which has received considerable discussion and analysis in the literature, whereas effort-based management has not received comparable conceptual or empirical attention.
The intent of the workshop was to close this information and analysis gap. The workshop surveyed and discussed the actual practice and issues associated with effort rights-based management and, more broadly, effort management in general. Because rights-based management on catch or effort necessarily requires a total allowable catch (TAC) or total allowable effort (TAE), the workshop discussed rights-based management in conjunction with issues in assessing populations and providing TACs or TAEs. The interdisciplinary workshop included economists, population biologists, political economists, and fisheries managers, who provided interdisciplinary background papers and presentations.
1. Effort rights in fisheries management: general principles and case studies from around the world
2 Effort rights in fisheries management – General principles and case studies from around the world
The discussion and conclusions, presented below and more extensively in Chapter 2, were grouped by five categories:
• characteristics of the fishery – numbers of gear and species plus the biological starting point (sustainable equilibrium, overfishing, overfished), initial economic conditions (capacity, profitability, etc.);
• biology – (i) biology of the species and its ecosystem, (ii) data availability and uncertainty, and (iii) issues in population assessments and determining a TAC and TAE;
• economics – (i) law and economics of property rights, (ii) microeconomics of effort and catch controls, and (iii) economic incentives;
• costs of monitoring, compliance, enforcement, population assessment, data collection, and other management and governance costs;
• political economy and governance – the politics and feasibility of reaching and sustaining agreement on rights-based management and subsequent management of the fishery, which would take into consideration past management, objectives of management and the distribution of the costs and benefits among the actual and potential participants.
The workshop focused on comparing the advantages and disadvantages of effort rights-based management in general and in comparison with catch rights-based management. The workshop also focused on overall catch versus effort management in general. Both focal points were evaluated according to the above five broad categories. The workshop also evaluated trade-offs, recognizing that there is not always a clear-cut choice between catch and effort approaches, requiring evaluation of the alternatives. Although clear conditions may sometimes exist, favouring one approach over another, the workshop participants recognized that various circumstances might favour a different approach in practice. Nonetheless, some workshop participants favoured one approach over the other in most circumstances, and there was a range of opinions.
Reflecting the limitations of pure effort and catch systems, hybrid programmes are increasingly implemented, with the property and use right focused on either catch or effort but accompanied by supplementary catch or effort limits. The complexity of ecosystem-based management and its emerging importance may be the driving force behind the growing importance of hybrid systems.
The workshop also aimed to establish general conditions favouring catch- or effort-based management. The workshop recognized that fisheries management by catch or effort property rights simultaneously requires estimation of, and management under, a TAC or TAE, but that fisheries might simply be managed by TACs or TAEs without catch or effort property rights. Hence, the workshop necessarily discussed catch and effort management as general approaches, and rights-based management can in this sense be viewed as a special case of these two approaches. Nonetheless, catch or effort management without property rights was not the workshop’s focus.
All forms of rights-based management reorient the economic incentives motivating fisher behaviour from the “race to fish” under open access or regulated open access (for example, open access with a TAC or TAE and other command-and-control regulations) to incentives that more closely align the private behaviour of fishers with society’s desired social–economic–ecological objectives of harvests or effort satisfying a sustainable yield or effort target and sustainable socio-economic benefits. Although limited access (limited entry) is a widely used form of effort management, this workshop largely focused upon some measure of time or gear (particularly pots and traps) as effort rather than the vessel itself.
Effort rights-based management programmes represent a major step forward from open access or regulated open access and limited entry by providing a more completely structured right that confers stronger exclusive use of the right by individuals, firms, vessels or groups. Effort rights-based management programmes set an annual TAE
3Report of the workshop
for the fishery; typically denominated in nominal units of effort such as days at sea, number of sets of gear, or units of gear, such as numbers of hooks or traps. When the TAE is allocated to individuals and explicit transferability of effort rights is allowed between individuals, flexibility and economic efficiency increase.
The purpose of this publication is to present the results from the workshop and thereby to review and update knowledge on the global experience with effort rights-based management to develop insights for:
• elucidating strengths and weaknesses of effort rights-based management programmes;
• when to use effort rights-based management programmes, and their overall position in fishery management tools;
• establishing principles of effort rights-based management designed to satisfy conservation and management goals for fisheries;
• designing effort rights-based management programmes to achieve these goals in the most economically efficient manner possible;
• reviewing potential issues for effort rights-based management programmes for vessels and licences on the high seas and harvesting transboundary resources;
• effort rights-based management programmes for the preservation of public goods such as non-market ecosystem services and marine biodiversity in the expectation that rights-based management will increasingly be used in the future for public-good benefits in addition to traditional capacity reduction objectives.
PRESENTATIONS/PAPERSThe presentations were grouped together to first provide overview and concepts of fisheries management, economics, population assessment, and ecology, and then were followed by case studies. The presentations formed the basis this publication. A synopsis of each follows. The final paper in this publication was not presented at the workshop, but was subsequently commissioned owing to the importance of a topic not discussed at the workshop – individual and collective rights. While the workshop recognized that both individual and collective rights-based management could be applied, the workshop did not consider the topic further, and this paper fills this important knowledge gap.
CHAPTER 2. SYNTHESIS OF WORKSHOP RESULTS: PROS AND CONS OF EFFORT-BASED MANAGEMENT; DALE SQUIRES AND MARK MAUNDERIn Chapter 2, Squires and Maunder synthesize the workshop results that recognize that effort forms of rights-based fisheries management have received considerably less conceptual and empirical attention in the literature than the more widely employed transferable catch quota approaches. In this context, they summarize the focus for the workshop by reflecting on the strengths and weaknesses of both effort and catch rights-based management in terms of biological, ecological, economic, social, political, administrative and operational factors. The choice between catch and effort approaches to managing a fishery is likely to be determined on a case-by-case basis. Effort rights-based management tends to be found in pot and trap fisheries and where there is substantial uncertainty over the resource stock, such as squid fisheries. Catch rights-based management under a TAC requires an estimate of the absolute level of biomass and forecast of the TAC, while effort rights-based management under a TAE requires an estimate of the catchability coefficient and forecast of the TAE.
As a general rule, effort rights-based management has clear advantages: in complex multispecies fisheries in developing countries (especially with complex tropical multispecies ecosystems); in artisanal fisheries; where TAC-based management is more difficult and expensive and stock assessments are difficult; where data for stock assessments and close monitoring of catches are largely unavailable or of low
4 Effort rights in fisheries management – General principles and case studies from around the world
quality; where monitoring, control and surveillance (MCS) costs for catch systems are prohibitive; and where uncertainty over biomass estimates is paramount (catch rights-based management under a TAC requires an estimate of the absolute level of biomass).
Effort rights-based management may be more effective at managing fishing mortality where there is uncertainty in the estimates of biomass, and catch rights-based management is more effective where there is uncertainty in the estimates of the catchability coefficient. Catch rights-based management generates stronger incentives to reduce effort and costs and to increase price and revenue through higher quality and smoothing the timing of production. Effort rights-based management creates incentives to maximize revenue and catch, and in the process creates incentives to expand input use and costs and can face difficulty in shedding capacity and countering technological change. The difficulty of appropriately defining and measuring effort and the incentives to expand uncontrolled dimensions of effort mean that effort management requires continued adjustment in the TAE and input controls. Such adjustment is necessary to counter ongoing increases in uncontrolled inputs, including vessel size, increased productivity (fishing power) due to technological change, and more-efficient fishers replacing less-efficient ones. Catch management requires monitoring of populations and catches, control of catches, and dealing with catches beyond quotas.
In a narrow economic sense, catch rights are superior, but once the costs of research to improve stock assessments and the associated risks of determining the quota and costs of MCS and enforcement are taken into consideration, the choice between effort and catch rights-based management becomes more complex and less clear. The results will be case-specific. Hybrid systems of both catch and effort controls are increasingly employed to manage marine fisheries in order to capture the advantages of both approaches, with one approach forming the dominant management system. Catch rights programmes that emerged from effort rights programmes often retain many features of the latter, forming, in effect, hybrid systems. The form of rights-based management cannot be separated from the choice of TAC or TAE management.
The workshop results are intended to guide informed choices between catch and effort rights-based management systems and to evaluate the trade-offs involved. Both have the potential to be applied under unique circumstances as well as in conjunction with one another through hybrid programmes. These latter are increasingly predominating owing to the limitations of both approaches in their pure forms.
EFFORT RIGHTS-BASED MANAGEMENT; DALE SQUIRES, MARK MAUNDER, SAMUEL HERRICK, JR., MARK HELVEY AND RAYMOND CLARKESquires et al. survey practices and discuss issues concerning transferable effort rights-based management and effort management in general. They draw from effort-based management programmes worldwide with an emphasis upon individual transferable effort programmes as a form of rights-based management. The review encompasses four perspectives: (i) law and economics and the characteristics of property rights; (ii) the individual firm or vessel and its production process and resulting secondary market after trade of the transferable effort right; (iii) the overall fishery through the lens of bioeconomics; and (iv) population dynamics and management strategy evaluation.
Effort-based approaches appear best suited in the following cases: complex multispecies fisheries in developing countries (especially where there are complex tropical multispecies ecosystems); where TAC-based management is more difficult expensive and stock assessments difficult; in pot fisheries where effort management is pervasive; and in fisheries with highly variable stock recruitment and subsequent high stochastic variation in the resource stock, such as shrimp and squid and perhaps some small pelagic species; and where escapement is important such as salmon.
5Report of the workshop
IS THERE A CASE FOR EFFORT CONTROL? RÖGNVALDUR HANNESSONHannesson notes that effort rights-based management is complicated by the need to directly control two “effort” variables if the aim is to maximize the economic value of the fishery. One is the capacity of the fishing fleet (number of boats of appropriate design), and the other is the utilization of the fleet; fishing effort is the product of fleet capacity and the time fishing. Capacity is decided on the basis of the variability of the fish stocks, expected fish prices and costs, and it could be controlled by fishing licences. Utilization is decided on the basis of the status of the fish stocks in each period and the fleet capacity at hand, and it could be controlled through a temporal measure such as days fishing. A problem with controlling capacity utilization using this measure is that actual fishing effort can be intensified through input substitution and by incentives to overinvest. Compared with catch rights-based management, this can mean a significant trade-off in efficiency gains, as one of the advantages of transferable catch quotas is that they go a long way towards providing incentives to invest optimally in fishing boats and also use them optimally.
EFFORT VERSUS QUOTA CONTROL WHEN STOCKS CANNOT BE TARGETED; RÖGNVALDUR HANNESSONHannesson addresses two arguments in favour of effort control over quota control: (i) that quotas are set on the basis of imprecise stock assessments; and (ii) that when two or more fish stocks are caught indiscriminately, fish quotas could lead to overfishing of some stocks. The study examines the validity of these arguments with a simple model of two fish stocks. It is shown that effort control does indeed perform better than quota control when the exploitation rate is proportional to effort, but the difference does not appear to be great. The hypothesis that quota control can be ineffective when two or more stocks are fished indiscriminately is also confirmed by the modelling exercise. If catches are not monitored at sea, the quota regime will result in discards of fish, leading to overfishing of stocks. The effects of effort control are not without their own problems. Comprehensive effort controls are needed to quell the incentives to invest in larger and better-equipped boats for the sole purpose of taking a larger share of a fish catch.
ON FISHERIES AND PROPERTY RIGHTS; IKERNE DEL VALLE AND KEPA ASTORKIZADel Valle and Astorkiza discuss the common pool resource (CPR) problem in the case of fisheries resources. The origin of the problem is the lack of a complete system of property rights guaranteeing exclusive use of the resource, which ultimately leads to excessive fishing capital and fishing effort, reduced fish stocks, dissipation of economic rents, and social welfare losses. Del Valle and Astorkiza go on to discuss the nature of fishing rights and how they can be denominated, either in terms of outputs, where right holders are allowed to harvest a specific amount of fish each year or season, or in terms of inputs, where the rights holder is authorized to use certain inputs or fishing gear. They note that it stands to reason that the more rights the resource-user holds, the more encouraged she/he is to achieve efficient and conservationist solutions to the CPR problem.
EFFORT MANAGEMENT IN THE DANISH FISHERY FOR BLUE MUSSELS; PEDER ANDERSEN, HANS FROST AND NIELS VESTERGAARDSince the late 1980s, access to the Danish mussel fishery has been limited by individual non-transferable vessel licences. A licensed vessel also has specific fishing restrictions in terms of outputs (weekly and daily vessel quotas) and inputs (maximum engine power, maximum gross registered tonnage). These privileges vary by fishing area. Anderson
6 Effort rights in fisheries management – General principles and case studies from around the world
et al. identify the economic benefits of making the existing licences transferable in the Limfjord fishing area by calculating and comparing the economic profit of mussels before and after the licences become tradable.
Anderson et al. find that the economic surplus from the mussel fishery in Limfjord will increase if the licences become transferable. This is due in part to the fishery in Limfjord being kept at a low level over several decades, which has meant that there are relatively few vessels with relatively large individual fishing opportunities to harvest on a sustainable basis.
FROM EFFORT CONTROL TO AN ITQ SYSTEM IN THE GRAND SOLE FISHING GROUNDS: EVOLUTION AND NEW EVIDENCE FROM A CASE STUDY; GONZALO CABALLERO, MARÍA DOLORES GARZA AND MANUEL VARELA Caballero et al. present an institutional analysis of the dynamics of the “Spanish 300 Fleet” on the Gran Sol fishing grounds. The analysis addresses: (i) some of the theoretical foundations of the New Institutional Economics on institutions, institutional change and governance; (ii) the evolution and importance of the Spanish fishing sector; (iii) the case of the Spanish fleet of 300 vessels on the Gran Sol fishing grounds; and (iv) the legal framework and institutional aspects of governing the fleet of 300 vessels. Today, the Spanish 300 Fleet of 1986 is down to about 100 vessels, due in large part to the introduction of a hybrid individual transferable quota – individual transferable effort (ITQ-ITE) programme in the Gran Sol fishery in 2007. Although there are fewer vessels, these vessels have larger individual quotas and produce more fishing effort, and the catch volumes of these vessels will be notably higher than the 300 vessels that fished in 1986.
HAWAII PELAGIC LONGLINE FISHERY AND SEA TURTLE BYCATCH – THE USE OF SET CERTIFICATES AS AN ALLOCATION SOLUTION; RAYMOND CLARKE, PAUL DALZELL AND WALTER IKEHARAClarke et al. present a case history of a fishing effort allocation system for the Hawaii shallow-set (swordfish) longline fishery that ran from 2004 until it was abolished in 2010. In 2004, the TAE in the fishery was fixed at 2 120 transferable longline sets in an overall effort to reduce sea turtle interactions in the fishery; it served as a transferable effort programme based on a bycatch species.
Some issues with the effort allocation programme were related to distribution of sets and “effort creep”. Set certificates were issued annually in equal shares to all Hawaii longline permit holders who requested them, with the final distribution being left to the free market. This resulted in a brisk trade in certificates and encouraged those who had permits, but no interest in swordfishing, to obtain certificates solely for trading purposes, raising concerns among permit holders who did not receive enough certificates in the annual distribution to cover their fishing needs. Although the total number of allowable sets was fixed, the number of hooks per set was not. Consequently, there was an increase in the total number of hooks per set deployed in the fishery.
THE TRANSFERABLE EFFORT SYSTEM IN FAROE ISLANDS; HANS ELLEFSONEllefson describes the collapse of the main demersal stocks around Faroe Islands in the early 1990s and the conservation and management actions that followed. Initially, a catch quota system was introduced, but this was relatively short-lived because of political resistance and the increase in discards as quotas were approached. This system was replaced by one based on fishing effort denominated in fishing days. Fishing days were allocated and transferable among vessels categorized by engine horsepower or vessel gross register tonnage.
7Report of the workshop
Ellefson concludes that, based on a number of biological and economic performance factors, the Faroese fishing days system has not been an overwhelming success. Significant in this regard was that the number of fishing days initially allocated was higher than recommended, resulting in chronic overcapacity of the fishing fleet. Moreover, the fishing days system does not explicitly take into account the technological advances in the fishing fleet, which have resulted in effort creep.
THE VESSEL DAY SCHEME: RIGHTS-BASED MANAGEMENT AND ECONOMIC AND ENVIRONMENTAL CHANGE IN THE WESTERN AND CENTRAL PACIFIC OCEAN TUNA FISHERY; ELIZABETH HAVICEIn 2007, the eight Pacific island countries that are Parties to the Nauru Agreement (PNA) implemented the Vessel Day Scheme (VDS), thereby limiting the number of fishing days for the shared purse seine tuna fishery occurring within their collective exclusive economic zones (EEZs). Havice describes the development of this programme and its performance to date.
The PNA countries implemented the VDS to strengthen their rights over the fishery in order to achieve economic and biological goals. The overarching goal of the VDS has been to promote optimal conservation of tuna resources, with the primary objective being to increase economic opportunities for and returns to the resource-owning PNA countries. On the biological front, the VDS has improved data provision, enabling the refinement of biological and bioeconomic models. However, with no firm cap on overall effort, there has been a significant increase in capacity utilization. With the VDS, as in all effort-based management schemes, clarifying the technical components and commitment to a firm effort cap are critical to achieving economic and biological goals.
MANAGEMENT OF DEMERSAL FISHERIES IN THE FAROESE FISHING ZONE, FFZ; KJARTAN HOYDALHoydal discusses the inherent problem in using TAEs to manage fisheries through the case of the Faroe Islands mixed demersal fishery. He notes that, while it is easy to understand the appeal of catch-based fisheries for a number of reasons, in demersal fisheries, which are multispecies by nature, effort-based management has some advantages.
Compared with catch-based management, effort-based fishery management minimizes the risk of discards and misreported catches. It also makes it unnecessary to set annual quotas for single stocks, which can allow for more diversity in terms of a vessel’s fishing activities. The drawback is that a one-dimensional TAE encourages overinvestment and more intensive use of unregulated inputs, and faces growing productivity of effort from technological progress.
INPUT-BASED RIGHTS – THE FALKLAND ISLANDS LOLIGO SQUID FISHERY; VISHWANIE MAHARAJMaharaj describes the experience with rights-based effort management of the Loligo squid fishery of the Falkland Islands (Malvinas). Squid are short lived, have a poor stock-recruitment relationship, and high variability in mortality owing to variability in environmental conditions. For these reasons, resource conservation is addressed through an escapement target to ensure that a sustainable spawning stock biomass remains at the end of each fishing season. The fishery is managed under a system of individual transferable effort quotas (ITEQs) where adjustments are built into the system to control for effort creep. While the objective of the ITEQ programme was to improve the economic performance of the fisheries, the programme was also designed to encourage the long-term ownership and control of rights to the fisheries resources of the Falkland Islands (Malvinas) by locally owned and controlled fishing companies.
8 Effort rights in fisheries management – General principles and case studies from around the world
Largely owing to its system of conservation and management, this Loligo squid fishery has consistently generated substantial rents. It was recently reported that the rent from the squid fisheries of the Falkland Islands (Malvinas) amounted to about 67 percent of the total gross revenues and 80 percent of net revenue. However, rent is highly variable over time depending on the condition of the stock, catches, and input and output prices. Nonetheless, social welfare is a high priority in the Falkland Islands (Malvinas), and it is expected that there will be improvements to the conservation and management system designed to foster enhanced economic performance and increased rents.
RIGHTS-BASED FISHERIES MANAGEMENT IN A DEVELOPING COUNTRY: A CASE STUDY OF MALAYSIA; SHAUFIQUE F. SIDIQUE, KUSAIRI MOHD NOH AND KUPERAN VISNAWATHANSidique et al. report that current extraction rates of Malaysian fishery resources are higher than their biological replenishment rates. The problem is compounded where excessive fishing capacity has also damaged the marine habitat and has altered the marine ecosystem, further threatening the survival and sustainability of Malaysian marine resources. Except for relatively effective fishery zoning, there is virtually no fishery conservation and management policy in Malaysia to address these problems.
Sidique et al. discuss the potential for expanded effort rights-based management in Malaysian fisheries, recognizing that the main objective of fisheries conservation and management is to ensure sustainable economically viable fisheries in the long run. However, as with countries that have established fisheries conservation and management, conservation and management for a developing country such as Malaysia address multiple objectives in the sense that they need to account for not only fishing rights, but more importantly the human rights of fishers.
THE EFFORT CONTROL PROGRAMME IN THE NORTHEAST UNITED STATES GROUNDFISH FISHERY; ERIC THUNBERG AND MIN-YANG LEEThunberg and Lee discuss the development and performance of the days at sea (DAS) effort control programme for the multispecies northeast United States groundfish fishery. The DAS programme was adopted at a time when groundfish resources were at record-low abundance. Output-based controls were rejected at the outset, as prior experience with quota management in the early 1980s had yielded poor economic and biological outcomes. This also meant that ITQs were never considered.
Because the initial allocation of DAS in 1994 far exceeded the actual number that had been used in the fishery, the propensity to substitute unregulated effort components resulted in substantial overcapacity in the fishery. Under these conditions, the effort control programme was unable to meet biological targets for a number of groundfish stocks. The DAS allocations were subsequently revised to become more closely aligned with resource conditions; and more recently, target catch levels have generally not been exceeded. Once reasonably calibrated to resource conditions, effort controls have eventually proved to be an effective way to meet biological targets.
The economic performance of the fishery was similarly compromised when initial allocations of DAS were far in excess of sustainable levels. Exemptions were granted to various fleet segments from DAS, myriad indirect effort controls were also enacted, and substitution of unrestricted for restricted effort undermined the potential economic gains of the DAS programme.
From this experience, it is critical that an effort control programme be calibrated to resource conditions from the outset. Otherwise, problems will abound and management objectives will probably not be met.
9Report of the workshop
TRADABLE TRAPS IN THE NORTHEAST U.S. AMERICAN LOBSTER FISHERY; ERIC THUNBERGThunberg describes the progress of effort-based management in the northeast United States American lobster fishery. An extensive survey of crustacean fisheries management reveals a general progression from initial reliance on technical and input controls to limited entry, trap limits, tradable traps, and then to ITQs. The inability to control increases in effective effort without imposing measures that create economic inefficiencies has been the main reason for transitioning to an ITQ.
Trying to harmonize development of a comprehensive tradable trap programme in the Northeast United States American Lobster Fishery has been complicated by the need to reconcile conservation and management across the geopolitical range of the resource. Nonetheless, a number of specific features of a transferrable trap programme have been established, which include: vessel licensing; individual trap allocations; permanent transfer of licences and/or traps, but no permit leasing; and passive reductions in total traps through a “conservation tax” on all trap transfers. The prohibition on leasing reflects a desire to ensure that the primary benefits from transferability accrue to active participants. Thunberg concludes that, based on the experience of crustacean fisheries elsewhere, the evolution of the transferable trap programme in the lobster fishery of the United States of America warrants close attention.
COLLECTIVE APPROACHES TO FISHERIES MANAGEMENT; KATHLEEN SEGERSONSegerson considers rights-based management that grants property rights collectively to a group of individuals rather than directly to the individuals themselves. A key question is whether collective approaches are likely to be more (or less) effective in fisheries management than approaches that rely on regulating or assigning rights to individual harvesters or vessels. This study provides a discussion of collective approaches from an economic perspective. Rather than describing any specific fishery, it highlights some general issues that arise in the use of a collective approach and their implications for improved management. In addition, it presents a simple stylized model that can be used to illustrate some incentive issues that may arise in the use of collective approaches, and ways in which potential negative effects can be offset. Segerson finds that the ultimate success or failure of a collective approach will hinge on a combination of: the ecological, economic and social features of the fisheries; the way in which the group organizes itself (including the internal “rules” it imposes on its members); and the design and nature of the collective rights that are granted (including any government-imposed restrictions and/or responses if the group does not meet specified objectives).

11
2. Synthesis of workshop results: pros and cons of effort based management
Dale Squires, NOAA Fisheries, Southwest Fisheries Science CenterE- mail: [email protected]
Mark Maunder, Inter-American Tropical Tuna CommissionE-mail: [email protected]
2.1 INTRODUCTIONEffort rights-based fisheries management is an important form of rights-based management, even if less widely used than catch rights for groups or individuals (ITQs).1 Both rights systems were established to address the problems that arise with target species, notably the resource stock externality and accompanying overcapacity and overcapitalization, overfishing, and overfished stocks.2,3 Neither rights approach was established for the broader goal of ecosystem-based fisheries management or biodiversity conservation, although they have potential in this regard.
Effort forms of rights-based management have received considerably less conceptual and empirical attention in the literature than have transferable catch quota approaches, and the intention of the workshop was to close this gap. The main focus of the workshop was rights-based management for “target” species, although ecosystem and biodiversity issues necessarily entered into the discussion. The workshop did not consider the characteristics and design of a particular property right, such as duration, divisibility, transferability, etc., methods of allocation, and other issues that arise in the design of rights-based management. It surveyed the practice and discussed issues associated with transferable effort rights-based management and effort management in general.
1 ITQ stands for individual transferable quota. Other forms of rights-based management include sector allocations of catch rights and voluntary agreements, licence limitation, area and territorial use rights in fisheries (TURFs), and common property. Catch quota rights-based management is sometimes known as catch shares.
2 An externality is an unintended and uncompensated consequence of one economic agent’s actions upon another economic agent’s well-being or profitability. The resource stock externality arises most notably owing to ill-structured or incomplete property rights. The resource stock externality has two components: a contemporaneous one, in which there is over allocation of resources as everyone rushes to exploit the resource stock before others; and an intertemporal component in which overexploitation reduces the resource stock and thereby diminishes future profits from exploitation.
3 Overcapacity refers to a level of potential catch that exceeds a sustainable target and involves excess usage of both variable and fixed inputs compared with the amount required to catch the target. Overcapitalization refers to excess usage of the physical capital stock compared with the optimum amount. Overfishing refers to a level of fishing mortality exceeding that of maximum sustainable yield (MSY), and overfished stocks refer to a stock level below that corresponding to MSY. These definitions might differ among management organizations. For example, overfished may be based on biomass levels below a limit reference point other than the level below that corresponding to MSY.
12 Effort rights in fisheries management – General principles and case studies from around the world
All forms of rights-based management reorient the economic incentives motivating fisher behaviour from the open-access “race to fish” to incentives that more closely align the private behaviour of fishers with society’s desired social, economic and ecological objectives of harvests satisfying a sustainable yield or effort target and sustainable social and economic benefits. Some forms of rights-based management perform more effectively than others under different conditions, and some forms are more effective at some issues than others. The workshop aimed to compare catch and effort forms of rights-based management, evaluating their strengths, weaknesses, trade-offs, and conditions under which each might be preferred to the other. Although limited (vessel) access, including licence limitation and limited entry, is a widely used form of effort management, this workshop focused upon some unit of time or gear (particularly pots and traps) as effort.
Effort rights-based management programmes represent a major step forward from open access and limited entry by providing a more completely structured right through stronger exclusive use of the right by individual firms, vessels or groups. Effort rights-based management programmes set an annual TAE for the fishery, typically denominated in nominal units of effort such as days at sea, or number of sets of gear, or number of gear, such as pots, traps or hooks. Flexibility and economic efficiency increase when the TAE is allocated to individuals and explicit transferability of effort rights is allowed between individuals – enabling individual transferable effort (ITE). Group rights with effective management can give comparable efficiency gains depending upon their intragroup coordination and organization and other factors (Ostrom, 1990; Baland and Platteau, 1996; and Segerson, 2011). This workshop did not favour individual or group rights for effort or catch, realizing that the choice between the two depends upon the circumstances.
Effort can be area-denominated (as in Faroe Islands or Malaysia) to preclude local stock depletion, to protect sensitive areas, or to protect particular groups (such as artisanal fishers in Malaysia), resulting in economic, ecological and social gains through more spatially efficient allocation of effort. Area denomination allows area closures. Effort can be further denominated and thereby allocated across species and/or gear combinations to realize efficiency gains and stock conservation by reducing unwanted bycatch or from separating different methods of fishing or different groups. Effort rights can also be supplemented by restrictions on gear or fishing practices.
The workshop recognized that fisheries management by catch or effort property rights simultaneously requires estimation of, and management under, a TAC or TAE, but that fisheries might simply be managed by TACs or TAEs without catch or effort property rights. The workshop necessarily discussed catch and effort management under TACs or TAEs as general approaches, and rights-based management can in this sense be viewed as special cases of these two approaches. Nonetheless, catch or effort management without property rights was not the workshop’s focus, but rights-based management cannot be separated from TAC and TAE management.
Both effort and catch rights-based management have strengths and weaknesses, and both have the potential to be applied in different circumstances as well as in conjunction with each other through hybrid programmes. Reflecting the limitations of pure effort and catch systems, hybrid programmes are increasingly found, with the property and use right focused on either catch or effort, but accompanied by supplementary catch or effort limits. Coupling a catch or effort right with a specified area creates another type of hybrid right. With both effort and catch quota rights-based
13Report of the workshop
management, individuals or groups can hold the rights4. The choice between catch and effort approaches to managing a fishery is likely to be determined on a case-by-case basis. The workshop results are intended to guide informed choices between catch and effort rights-based management systems and to evaluate the trade-offs involved.
The balance of this main results section is organized as follows. Section 2.2 briefly surveys global effort programmes. Section 2.3 discusses the microeconomics of the vessel’s harvesting process, economic incentives, and law and economics of property rights and implications for catch and effort rights. Section 2.4 considers technical change, catchability, and effort productivity (fishing power) differences. Section 2.5 briefly discusses bycatch. Section 2.6 considers denomination of catch and effort right. Section 2.7 discusses allocation. Section 2.8 discusses the transition from one system to another and hybrid systems. Section 2.9 considers nationality restrictions. Section 2.10 considers multispecies and protected species issues. Section 2.11 discusses spatial management. Section 2.12 briefly considers management costs. Section 2.13 discusses issues of political economy. Section 2.14 considers the stock assessments and estimation of TACs and TAEs. Section 2.15 summarizes the implications from bioeconomics. Section 2.16 presents summary conclusions.
2.2 GLOBAL EFFORT PROGRAMMESIndividual non-transferable effort (hereafter individual effort) and ITE programmes have been applied in:
• the United States New England groundfish fishery for tradable fishing days;• tradable days for the United States Atlantic sea scallop fishery;• a system of tradable fishing days by fleet for the demersal gadoid fishery of the
Faeroe Islands since 1996;• the Hawaiian pelagic shallow-set longline fishery for swordfish (this provision
was recently disbanded);• the squid fishery of the Falkland Islands (Malvinas);• the Australian eastern tuna and billfish fishery (until 2010 when it transitioned
to ITQs);• transferable traps in the commercial lobster fisheries in lobster conservation
management areas of Outer Cape Cod and Southern New England;• a federal waters transferable trap programme in New England;• individual transferable trap programmes for spiny lobsters and stone crabs in
Florida;• fleet capacity and individual effort in Sweden;• salmon netting in the United Kingdom of Great Britain and Northern Ireland;• the coastal fishery for plaice, perch, salmon and herring in Estonia;• transferable fishing days in the Torres Strait prawn fishery;• transferable vessel days in the Area H Johnstone Strait chum salmon
demonstration fishery in Canada;• the Australian southern zone rock lobster fishery (which transitioned to ITQs);• the Western Australia Pilbara trap fishery;• the Western Australia rock lobster pot fishery (which transitioned to ITQs);• transferable days for Spanish trawl and longline vessels operating in waters
(the “300 Fleet”) that transitioned to ITQs;
4 Transferability is explicit with individual rights and often through markets but also through informal bilateral exchanges. Transferability with group rights can be made between groups or occur solely within the group, with a number of arrangements ranging from informal exchanges to formal exchanges with legally binding contracts.
14 Effort rights in fisheries management – General principles and case studies from around the world
• the Latvian coastal fishery regulated by non-transferable days at sea that supplement individual quotas that in fact have transferability because it is possible to buy companies that have quota and/or to sell or rent vessels with unused quota.
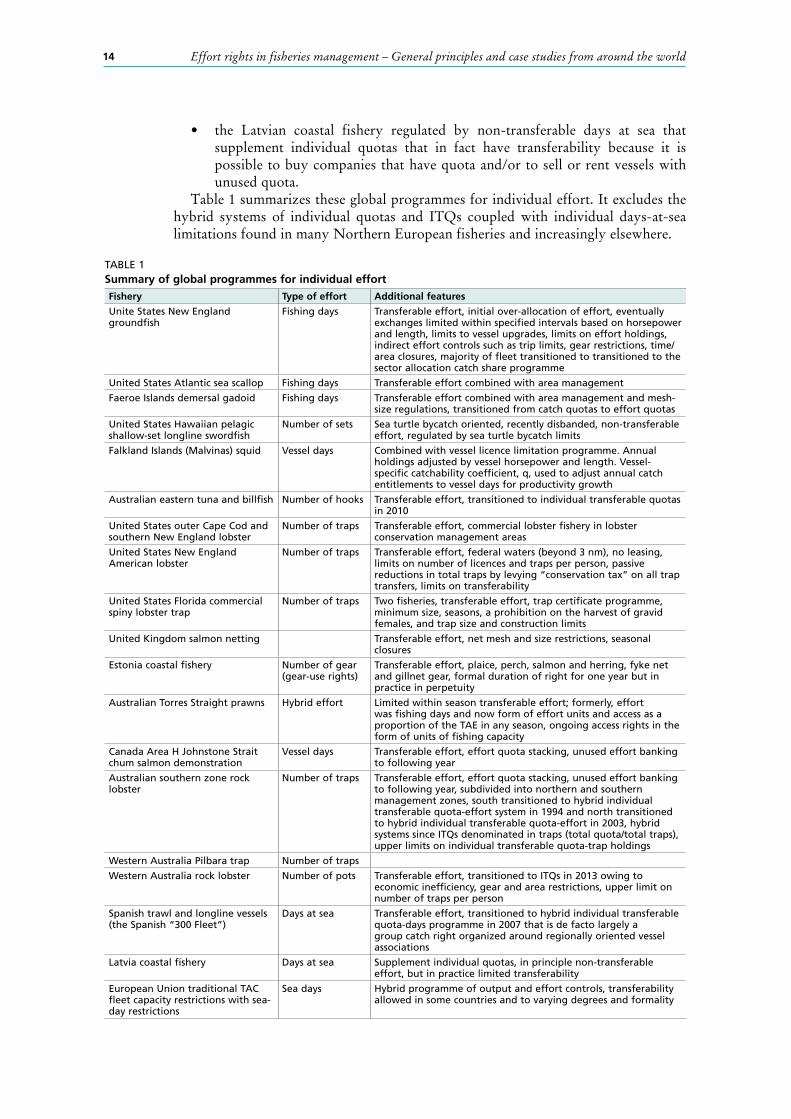
Table 1 summarizes these global programmes for individual effort. It excludes the hybrid systems of individual quotas and ITQs coupled with individual days-at-sea limitations found in many Northern European fisheries and increasingly elsewhere.
TABLE 1Summary of global programmes for individual effortFishery Type of effort Additional features
Unite States New England groundfish
Fishing days Transferable effort, initial over-allocation of effort, eventually exchanges limited within specified intervals based on horsepower and length, limits to vessel upgrades, limits on effort holdings, indirect effort controls such as trip limits, gear restrictions, time/area closures, majority of fleet transitioned to transitioned to the sector allocation catch share programme
United States Atlantic sea scallop Fishing days Transferable effort combined with area management
Faeroe Islands demersal gadoid Fishing days Transferable effort combined with area management and mesh-size regulations, transitioned from catch quotas to effort quotas
United States Hawaiian pelagic shallow-set longline swordfish
Number of sets Sea turtle bycatch oriented, recently disbanded, non-transferable effort, regulated by sea turtle bycatch limits
Falkland Islands (Malvinas) squid Vessel days Combined with vessel licence limitation programme. Annual holdings adjusted by vessel horsepower and length. Vessel-specific catchability coefficient, q, used to adjust annual catch entitlements to vessel days for productivity growth
Australian eastern tuna and billfish Number of hooks Transferable effort, transitioned to individual transferable quotas in 2010
United States outer Cape Cod and southern New England lobster
Number of traps Transferable effort, commercial lobster fishery in lobster conservation management areas
United States New England American lobster
Number of traps Transferable effort, federal waters (beyond 3 nm), no leasing, limits on number of licences and traps per person, passive reductions in total traps by levying “conservation tax” on all trap transfers, limits on transferability
United States Florida commercial spiny lobster trap
Number of traps Two fisheries, transferable effort, trap certificate programme, minimum size, seasons, a prohibition on the harvest of gravid females, and trap size and construction limits
United Kingdom salmon netting Transferable effort, net mesh and size restrictions, seasonal closures
Estonia coastal fishery Number of gear (gear-use rights)
Transferable effort, plaice, perch, salmon and herring, fyke net and gillnet gear, formal duration of right for one year but in practice in perpetuity
Australian Torres Straight prawns Hybrid effort Limited within season transferable effort; formerly, effort was fishing days and now form of effort units and access as a proportion of the TAE in any season, ongoing access rights in the form of units of fishing capacity
Canada Area H Johnstone Strait chum salmon demonstration
Vessel days Transferable effort, effort quota stacking, unused effort banking to following year
Australian southern zone rock lobster
Number of traps Transferable effort, effort quota stacking, unused effort banking to following year, subdivided into northern and southern management zones, south transitioned to hybrid individual transferable quota-effort system in 1994 and north transitioned to hybrid individual transferable quota-effort in 2003, hybrid systems since ITQs denominated in traps (total quota/total traps), upper limits on individual transferable quota-trap holdings
Western Australia Pilbara trap Number of traps
Western Australia rock lobster Number of pots Transferable effort, transitioned to ITQs in 2013 owing to economic inefficiency, gear and area restrictions, upper limit on number of traps per person
Spanish trawl and longline vessels (the Spanish “300 Fleet”)
Days at sea Transferable effort, transitioned to hybrid individual transferable quota-days programme in 2007 that is de facto largely a group catch right organized around regionally oriented vessel associations
Latvia coastal fishery Days at sea Supplement individual quotas, in principle non-transferable effort, but in practice limited transferability
European Union traditional TAC fleet capacity restrictions with sea-day restrictions
Sea days Hybrid programme of output and effort controls, transferability allowed in some countries and to varying degrees and formality
15Report of the workshop
2.3 MICROECONOMICS OF VESSEL HARVESTING, ECONOMIC INCENTIVES, LAW AND ECONOMICS OF PROPERTY RIGHTSCatch rights programmes are largely preferred from the perspective of the microeconomics of the vessel’s production process and the law and economics of property rights owing their more comprehensive and stronger characteristics as a right and the superior economic incentives that are created, leading to economic efficiency, minimizing effort usage and costs, and matching catches with TACs. Individual transferable quotas and group catch rights with TACs, reflecting their antecedents in the environmental economics literature aimed at controlling pollution externalities, were explicitly designed to overcome the common resource stock externality.
Effort is less well defined and homogenous as an input than catch is as an output.5 Ideally, effort is a composite input, comprised of all the various components such as various capital stocks, labour, fuel or fishing time, skipper skill, etc. In practice, effort is typically defined as just one of these inputs, often a measure of fishing time such as days, or one element of the capital stock, usually the vessel or gear such as pot or trap. Controlling a single dimension of effort, say days, leaves unregulated dimensions that can be expanded to increase catch. The input days is also not homogeneous, with effectiveness varying by vessels according to vessel size, levels of investment, productivity (fishing power) differences across vessels, skipper skill that varies between vessels, and other factors6. The length of time actually fished during a day can also vary considerably, an issue that affects the PNA VDS, for example. Pot and trap size and design, number and frequency of hauls, and soak time are also heterogeneous, so that simply regulating the number of pots or traps does not fully control effort7. Skipper skill can be viewed as one of other unmeasurable inputs that cannot be regulated in effort management.
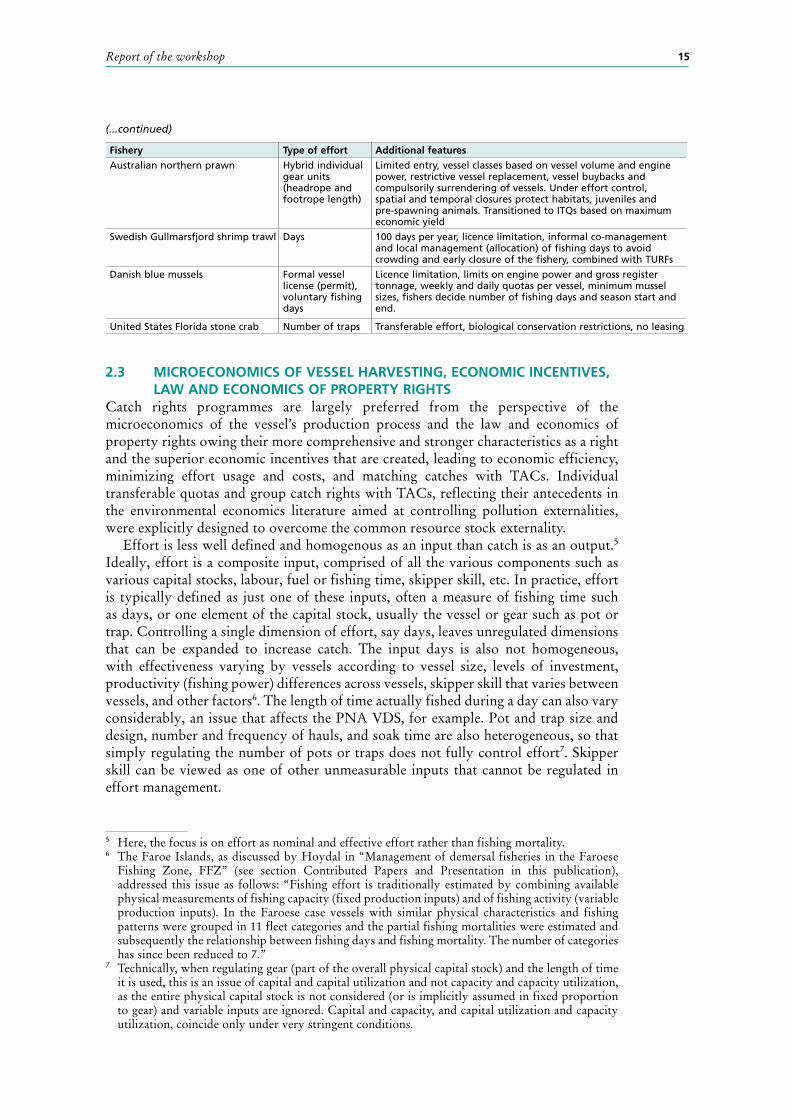
Fishery Type of effort Additional features
Australian northern prawn Hybrid individual gear units (headrope and footrope length)
Limited entry, vessel classes based on vessel volume and engine power, restrictive vessel replacement, vessel buybacks and compulsorily surrendering of vessels. Under effort control, spatial and temporal closures protect habitats, juveniles and pre-spawning animals. Transitioned to ITQs based on maximum economic yield
Swedish Gullmarsfjord shrimp trawl Days 100 days per year, licence limitation, informal co-management and local management (allocation) of fishing days to avoid crowding and early closure of the fishery, combined with TURFs
Danish blue mussels Formal vessel license (permit), voluntary fishing days
Licence limitation, limits on engine power and gross register tonnage, weekly and daily quotas per vessel, minimum mussel sizes, fishers decide number of fishing days and season start and end.
United States Florida stone crab Number of traps Transferable effort, biological conservation restrictions, no leasing
5 Here, the focus is on effort as nominal and effective effort rather than fishing mortality.6 The Faroe Islands, as discussed by Hoydal in “Management of demersal fisheries in the Faroese
Fishing Zone, FFZ” (see section Contributed Papers and Presentation in this publication), addressed this issue as follows: “Fishing effort is traditionally estimated by combining available physical measurements of fishing capacity (fixed production inputs) and of fishing activity (variable production inputs). In the Faroese case vessels with similar physical characteristics and fishing patterns were grouped in 11 fleet categories and the partial fishing mortalities were estimated and subsequently the relationship between fishing days and fishing mortality. The number of categories has since been reduced to 7.”
7 Technically, when regulating gear (part of the overall physical capital stock) and the length of time it is used, this is an issue of capital and capital utilization and not capacity and capacity utilization, as the entire physical capital stock is not considered (or is implicitly assumed in fixed proportion to gear) and variable inputs are ignored. Capital and capacity, and capital utilization and capacity utilization, coincide only under very stringent conditions.
(...continued)
16 Effort rights in fisheries management – General principles and case studies from around the world
Economic incentivesEffort rights (both individual and group) are weaker than catch rights from the legal and economic perspectives, as effort is less clearly defined. Effort is an input with possibilities for substitution between inputs that are and are not denominated and regulated in the effort definition (“capital stuffing”) and increasing effectiveness of effort owing to technological progress and investment in physical capital, both leading to “effort creep”.
Effort rights-based management, in contrast to catch rights, creates incentives to increase input use and costs in an attempt to maximize individual vessel catches and revenues8. In contrast to catch rights, incentives are not created to overcome biological overfishing or to minimize costs. For many vessels, trading through markets or informal exchanges with ITEs or within a group for rights commonly held can be expected to lead to increases in effective effort, and thereby increased catches and fishing mortality, as more rights gravitate towards more-efficient vessels and less-efficient vessels drop out of the fishery. Particularly under conditions favouring effort approaches to management, such as when effort and fishing mortality are proportional (see below), fish stocks can be maintained, but weaker incentives are created to maximize economic resource rents compared with catch rights programmes.
Expanding input use raises costs of harvesting a fixed TAE and for a vessel’s holding of an effort right. Assuming binding TAEs and initial excessive effort, some incentives are created for vessels to exit the fishery and thereby reduce the fishery’s fixed costs9. A vessel’s holding of the effort right may be insufficient to yield revenues that cover costs, or a vessel may sell the right and exit the fishery for other reasons. In contrast, the stronger incentives to minimize input usage and costs under catch rights lead to comparatively more shedding of effort as individual vessels attempt to minimize variable (operating) costs, and in the industry as a whole for fixed cost savings through vessel exit from what is invariably an overcapitalized fishery. Broadly put, catch rights create incentives toward minimizing cost and effort use at the individual vessel level as part of maximizing profits and fishery resource rents, whereas effort rights create incentives toward maximizing revenue and catch, for example by expanding input use.
The effectiveness of economic incentives depends not just on whether the right is defined as effort or catch, but on the composition of the rights holders. Rights-based management will align incentives, but in practice the incentives depend on who holds the rights, who the harvesters are, and who establishes the rules. For example, PNA property rights holders are multiple governments, and use rights holders are multiple nations that hold the use right for limited duration. All parties’ interests are to stretch vessel days and create or maintain overcapacity to increase demand for vessel days, where receipts from this programme are often major sources of government revenues. In contrast, in the squid fishery of the Falkland Islands (Malvinas), a single government
8 Given effort (a bundle of inputs), the individual vessel’s simple incentive (under certainty) is in the direction of maximizing catch or revenue. The point is that the incentive is far more toward maximizing output and revenue than toward minimizing effort and costs. Adding in uncertainty, skipper preferences, etc. may complicate the incentive, but the major thrust of the incentive created by effort rights-based management remains toward maximizing catch and revenue, and thereby input usage and costs, at least collectively for a fleet as a whole.
9 Variable costs are those that vary with the amount of variable input use over the short run, in which one or more inputs (e.g. vessel) are fixed. Variable inputs and costs increase the more a vessel fishes. Variable inputs and costs typically correspond to fuel, oil, bait, etc. Fixed costs pertain to fixed inputs, where fixed inputs cannot be altered in the short run. Examples include the vessel and engine. Labour, gear and equipment, and repairs and maintenance can be either variable or fixed, depending upon the length of time considered and the situation.
17Report of the workshop
holds the property right, and the use rights holders are a limited number of vessels (individuals or companies). Here, all parties strive to maximize profits, in the process maximizing the fishery’s resource rents.
Substitution of unregulated for regulated inputsEffort rights create incentives to expand input use by expanding along unregulated dimensions of effort through substituting unregulated inputs for regulated inputs (“capital stuffing”), increasing input utilization (fishing time), replacing inefficient vessels with efficient ones, and investment that augments the capital stock (such as more effective gear, electronics, etc.) that raise productivity (fishing power) and catchability10. An effort programme may require limits on vessel size and other forms of capital stock (e.g. gear) to limit input usage, accommodate replacement of old by new vessels or gear and other upgrades, and to accommodate transfers of effort rights across gear types. An effort programme limiting time (e.g. days) restricts capital utilization. In effort programmes, supplementary restrictions on gear types used, vessel numbers for each gear type, and real-time seasonal and area closures may also be required in order to maintain fishing mortality levels and species mixes. For example, the United States Atlantic sea scallop fishery has been highly successful, not solely owing to an ITE system, but also because it is area-based. Over time, restrictions on one or more dimensions of effort can induce a long-run response through technical change.
2.4 TECHNICAL CHANGE AND EFFORT PRODUCTIVITY DIFFERENCES: EFFORT CREEP AND EFFECTIVE EFFORTTechnical change expands effective effort through increasing the productivity (fishing power) of nominal effort. It thereby increases effective effort and fishing mortality (collectively called “effort creep”), compounding the difficulties of effort management. Technical change can be implemented through investment that augments the capital stock (i.e. embodied technical change) or disembodied (technical change not embodied in the capital stock) through learning by doing and using11. Controlling expanding effort due to technical progress is made more difficult because rates of technical progress vary across rights holders. Accounting for increases in effective effort due to technical progress can penalize those who have not been as effective in adopting new technology and becoming more productive.
Effort also varies by the state of technology, where changes in technology are not typically smooth and constant, but instead occur in fits and starts and depend upon the current state of technology. The effectiveness (productivity/fishing power) of effort grows under technological change (effort creep, increases in catchability) even where the nominal units of effort (e.g. days, number of pots) may remain constant.
10 Comparable incentives exist to expand catches of unregulated species or to discard under catch quotas (catch is not homogeneous over species, sizes, ages, locations, susceptibility to different gears, etc.).
11 Learning by doing (LBD) describes how unit production costs tend to fall and efficiency rises as producers gain production experience. It is disembodied in that it arises from increases in the stock of knowledge, independently of the characteristics of inputs used, and explains differences across vessels in the productivity of the same input levels and types. It includes routinization of tasks, organizational learning such as matching tasks with individuals, skipper and crew learning, experience gained with information technology-embodied capital such as electronics, finding fish, navigation, gear handling, and knowledge of environment and resource conditions, e.g. currents, weather conditions, water temperature breaks, and resource stock densities. Learning by using, a concept closely related to LBD, occurs during utilization of a product. Designers of new technologies, or even improvements in well-known technologies, are rarely able to anticipate all issues arising in actual use or new opportunities that users often find.
18 Effort rights in fisheries management – General principles and case studies from around the world
When effort rights are defined as levels or nominal units (days, number of gear) rather than shares of TAE, programme design requires a built-in way to reduce nominal units of effort to match effort holdings with the TAE. When effort is denominated in days, progressive reductions in TAE lead to a growing excess capacity problem, in which there are progressively fewer days available for existing vessels that grow increasingly productive over time through technical progress. Across-the-board reductions affect vessels differentially, as vessels differ by their state of technology and effectiveness of effort and by productivity growth (effort creep). The squid fishery of the Falkland Islands (Malvinas) is an exception because of the limited number of vessels.
In contrast, catch rights systems more directly allow vessels to deal with increasingly productive effort12. A vessel’s economic incentive is to reduce costs when meeting a quota holding; hence, a vessel has the economic incentive to shed variable inputs or even to exit the fishery, thereby reducing fixed costs.
Both TAC and TAE require acquisition of additional quota as fishing effort becomes more efficient. However, they differ in that with TAC the need for additional quota is related to the increase in efficiency of the individual vessel (i.e. as the vessel catches its portion of the TAC more quickly, the vessel needs more quota to fully utilize the vessel), while with TAE the need for additional quota is related to the efficiency of all the vessels as a group. That is to say, as the group of vessels increases its efficiency, the total amount of effort is reduced and an individual vessel’s effort also decreases and thus has to obtain more quota to fully utilize the vessel.
Estimates of TAE and TAC both require accounting for increases in catchability from technological progress (growth in fishing power/productivity).
Effort regulation faces the difficulty of different productivities, effectiveness of effort, and fishing mortalities by gear, vessel class, area fished, etc. This problem becomes more acute when nominal effort is defined by fishing time as opposed to the number of pots or traps. A day fished by a vessel of one gear type can vary considerably in effectiveness from another gear type or even within a vessel class and gear type, as different levels of fishing technology lead to different effectiveness between vessels. The PNA VDS distinguishes purse seine vessel days by vessel size class, and effective effort between gear types can be standardized. Units of exchange other than one-to-one can be imposed between different gear–vessel size classes. Exchange can also be prohibited, although this runs the risk of a limited number of buyers and sellers or thin effort markets and monopoly powers, thereby increasing economic inefficiency.
2.5 BYCATCHBoth catch and effort rights systems can be used to address “bycatch” (incidental catch) and ecosystem issues. Transferable bycatch rights directly address bycatch issues. Transferable effort through a limit on sets was part of an integrated package, along with caps on total turtle takes for leatherback and loggerhead sea turtles, in the Hawaiian shallow-set pelagic longline fishery for swordfish. The effort limit was eventually dropped, after it was considered redundant to the turtle caps. Hybrid programmes of effort and bycatch rights, effort and area rights, or time–area restrictions are possible. Bycatch rights become more complex where the bycatch is a rare event, such as some species of sea turtles (Segerson, 2011). Bycatch may become more influential where the target catch rates are low (e.g. for high-value species such as bluefin tuna), and effort limits may need to be added in addition to target species catch limits to limit bycatch, thus forming a hybrid programme.
12 However, catch rights and TAC management are not unaffected by technical change, as while technical change does not directly show up as in effort, it indirectly shows up in stock assessments and TAC forecasts.
19Report of the workshop
2.6 DENOMINATION OF CATCH AND EFFORT RIGHTSBoth catch and effort rights systems can specify rights as shares (proportions) of the TAC or TAE rather than in nominal units, such as kilograms or tonnes of allowable catch or kilowatt-days of allowable effort. When catch and effort are denominated in shares, multiplying each right holder’s TAC or TAE share by the TAC or TAE gives the catch or effort quota in nominal units. Changes in TAC or TAE then automatically lead to changes in each right holder’s amount that can be fished in each period. When rights are denominated in nominal units rather than shares or proportions of TAC or TAE, the total catch or effort rights sum to the TAC or TAE. The total amount of excessive rights must be bought or adjusted by some other means to match changes in TAC or TAE. Catch rights programmes are now universally defined as shares of the TAC, allowing for automatic adjustments in individual vessel or group levels of catches with changes in the TAC, as units of catch are readily defined and divisible into small units. Effort rights programmes have always been in nominal units. The reason may in part be the limited divisibility of nominal units of effort, where units of capital, such as pots or traps, are lumpy and inherently defined in terms of units of lumpy capital. In contrast, effort defined as days or number of sets lends itself to a right defined as a share given the divisibility of effort. Effort defined not as shares but instead as nominal units is susceptible to continual increases in effective effort and initial over-allocation.
2.7 ALLOCATION AND “OVER-ALLOCATION”Both effort and catch rights programmes face the issue of “over-allocating” individual or group rights. The tendency is to assign each right’s recipient the share that corresponds to that recipient’s maximum catch or effort, as long as: rights are denominated in shares; the rights programme is cooperatively entered into rather than imposed from above; and rights are allocated on the basis of the usual approach of historical participation (“grandfathering”). A major reason is that to achieve cooperation among all participants, no individual party (individual or group) or coalition of parties can be made worse off, and counting the maximum historical participation facilitates this perception.
When nominal units of effort, not shares, are allocated through grandfathering, the conditions for cooperation typically lead to an actual “over-allocation” of effort, in which the total amount of allocated effort exceeds the TAE, and the TAE may not be based upon fishing mortality. This over-allocation arises because, in an initially overcapitalized fishery, the only way that all parties and coalitions of parties can gain is to borrow fish from the future, where higher discount rates aggravate the problem as the future is valued less than the present. With either approach to allocating effort (or catch) – through shares or levels based upon grandfathering – there is difficulty in achieving effectiveness at establishing the desired incentives of reducing fishing mortality and gaining economic efficiency.
2.8 TRANSITION FROM ONE SYSTEM TO ANOTHER AND HYBRID SYSTEMSA rights system may start out as an effort right and transition into a catch right, or vice versa. It could also transition into a hybrid system. The Australian northern prawn fishery transitioned from a limited entry programme with vessel size limits to a transferable effort rights programme and finally into an ITQ programme to counter continued expansions in effective effort. The United States New England groundfishery is transitioning from an effort system to a catch quota system that includes group rights (sector allocations). Four Australian rock lobster fisheries have transitioned from tradable traps to an ITQ system. The tendency in the tradable trap systems was for the quota unit to be denominated on a per-trap basis (by dividing total quota by total number of traps), so that the system becomes a hybrid ITQ-effort system that creates incentives to shed traps and counter expansions in effective effort that otherwise occur.
20 Effort rights in fisheries management – General principles and case studies from around the world
The transition to an ITQ system in the Australian rock lobster fisheries was to reduce the economic inefficiencies associated with the mounting number of input restrictions needed to maintain objectives of biological sustainability rather than inability to control effort or achieve sustainable harvest levels (see “Tradable traps in the northeast United States American lobster fishery” in the section Contributed Papers and Presentation in this publication). The Spanish “300 fleet” harvesting groundfish on the Gran Sol fishing grounds transitioned from an individual days at sea programme with limited transferability to a hybrid ITQ-days programme, with days denominated in kilowatts, that is de facto largely a group catch right organized around regionally oriented vessel associations. The Faroe Islands effort rights systems transitioned from a catch rights system, due in part to difficulties in forecasting TACs and managing a multispecies fisheries by catch quotas on individual species.
Hybrid systems are individual and group rights complemented by effort restrictions, and vice versa, i.e. effort rights systems supplemented by catch quotas, notably for bycatch, or catch rights systems supplemented by effort limits. A number of the transferable effort programmes that have transitioned to ITQs have effectively become hybrid systems by retaining elements of previous effort management regimes or even denominating quotas on a per-effort basis.
The workshop recognized that a single policy instrument, such as catch or quotas, might be insufficient to address all policy concerns. As noted, catch rights were a response to the resource stock externality that arises from absent or incomplete property rights, and as such, they do not solve growth or ecosystem externalities. Effort restrictions have been introduced as a complementary measure to limit bycatch, discarding and quota overages, thereby creating hybrid systems. Effort rights, while not addressing the resource stock externality as directly as catch rights, by their very bluntness and focus upon fishing mortality, may be superior at addressing part of ecosystem externalities13. Nonetheless, neither right is designed as an instrument of conservation per se. The complexity of ecosystem-based fisheries management may also lead to hybrid systems of catch and effort, with either catch or effort being the paramount approach that is supplemented by the other.
Effort rights may also combine with territorial rights to form a hybrid system. In some sense, the VDS is such a system, in which shares of overall Western and Central Pacific Ocean tuna TAE are allocated to PNA States, where TAE share amounts are a weighted combination of historical catch and biomass in the individual PNA EEZs. In turn, the PNA States lease vessel day use rights to distant-water fishing nations. Hybrid effort–territorial rights systems are also found for pot, trap and shellfish fisheries, such as management of pots and traps in the northeast United States of America, where informal territorial units emerged. The Atlantic scallop days-at-sea programme was combined with area management, as was the Faroe Islands groundfish effort programme.
2.9 NATIONALITY RESTRICTIONSSome type of nationality restriction is common to virtually all rights-based management programmes. When rights-based management is extended to the international arena, the issue of sovereign rights that can be obtained by non-nationals becomes a very important issue. The catch or effort right is implicitly bundled with a national right of access to an EEZ. Although PNA VDS is an effort rights-based management programme in an international fishery, it still allocates effort to national EEZs, where
13 Both the ecosystem externality created by the target species along with impacts from reduced catches of all species.
21Report of the workshop
the TAE shares are allocated to PNA States and in turn to individual vessels. In the squid fishery of the Falkland Islands (Malvinas), effort rights are allocated to companies owned by local residents.
2.10 MULTISPECIES AND PROTECTED SPECIES ISSUESBoth effort and catch quota management become more complicated and difficult in multispecies fisheries (here, catch is not homogeneous). Multispecies fisheries under multiple quotas face the well-known problem of matching TACs with stock productivities and the potential for under- or over-harvesting one or more species, discards at sea, and misreporting. Individual transferable quota programmes have developed a number of approaches to address this issue (Sanchirico et al., 2006). Individual transferable efforts, such as transferable days, face difficulties in matching overall TAE with sustainable catch rates, again with the potential for under- or over-harvesting one or more species, leading to supplementary regulations such as area management and gear restrictions, as discussed elsewhere.
Bycatch of protected species such as sea turtles, birds and sharks is likely to be independent of either system, and is one reason why hybrid systems are emerging.
2.11 SPATIAL MANAGEMENTAlthough time–area restrictions and closures or spatial management can contribute to both catch and effort rights-based management, they may be especially important in effort management because there are not any direct controls upon catches. Area management can be important to separate gear types and vessel classes, to preclude local stock depletion, to protect sensitive habitat, to protect or favour groups of fishers deemed socially desirable, and to protect species for both target catch and bycatch and effort management. Area management may be even more important in effort rights-based management compared with catch rights-based management, as the control over catch species is more indirect and indefinite. Both the Atlantic sea scallop and the Faeroe Islands programmes combine days with area management. Incentives could also be applied to attract effort to particular areas. The Faroe Islands’ individual transferable effort quota system provides incentives for vessels to fish in offshore areas by allowing each quota day to equal three fishing days in these areas (Jákupsstovu et al., 2007).
2.12 MANAGEMENT COSTSThere may be fisheries where catch quota management may be preferred on biological and economic efficiency grounds, yielding the greatest economic net benefits compared with controlling fishing mortality at the desired level. The overall costs of MCS, enforcement, data collection, stock assessments and other governance may be sufficiently high so that net economic benefits are lower than what they would be under effort management. Where overall net benefits from catch rights-based management are lower than effort rights-based management, the latter may then be preferred on broad economic efficiency grounds.
2.13 POLITICAL ECONOMYThere may be fisheries in which either effort or catch quota management is suitable on the basis of biology, economic efficiency, or management costs. However, the political economy of reaching and sustaining agreement among participants and governance of the fishery favour the alternative rights-based management approach. Governance is likely to be easier and less expensive in effort rights-based management, as there are generally fewer detailed and/or less expensive restrictions. For example, ITQs require more comprehensive and generally expensive MCS requirements for each TAC-regulated species, whereas effort MCS is more readily confined to inspections of gear and/or electronic vessel monitoring systems. One reason for effort rights in the squid
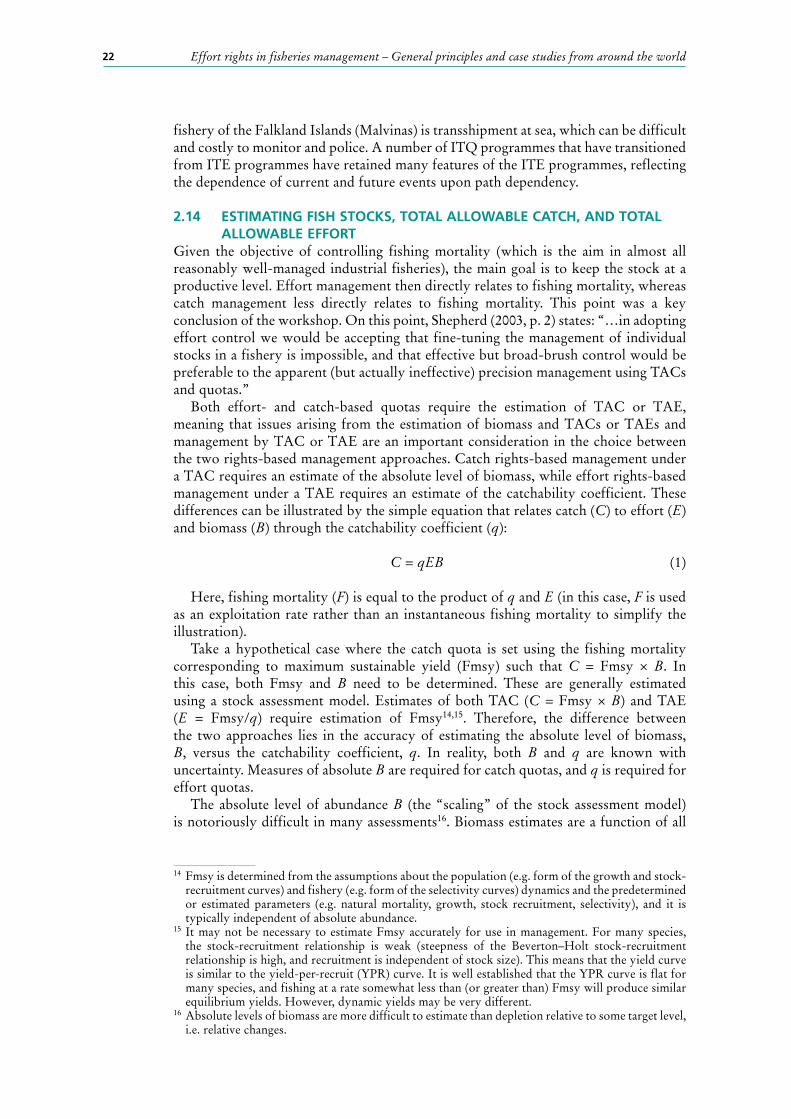
22 Effort rights in fisheries management – General principles and case studies from around the world
fishery of the Falkland Islands (Malvinas) is transshipment at sea, which can be difficult and costly to monitor and police. A number of ITQ programmes that have transitioned from ITE programmes have retained many features of the ITE programmes, reflecting the dependence of current and future events upon path dependency.
2.14 ESTIMATING FISH STOCKS, TOTAL ALLOWABLE CATCH, AND TOTAL ALLOWABLE EFFORTGiven the objective of controlling fishing mortality (which is the aim in almost all reasonably well-managed industrial fisheries), the main goal is to keep the stock at a productive level. Effort management then directly relates to fishing mortality, whereas catch management less directly relates to fishing mortality. This point was a key conclusion of the workshop. On this point, Shepherd (2003, p. 2) states: “…in adopting effort control we would be accepting that fine-tuning the management of individual stocks in a fishery is impossible, and that effective but broad-brush control would be preferable to the apparent (but actually ineffective) precision management using TACs and quotas.”
Both effort- and catch-based quotas require the estimation of TAC or TAE, meaning that issues arising from the estimation of biomass and TACs or TAEs and management by TAC or TAE are an important consideration in the choice between the two rights-based management approaches. Catch rights-based management under a TAC requires an estimate of the absolute level of biomass, while effort rights-based management under a TAE requires an estimate of the catchability coefficient. These differences can be illustrated by the simple equation that relates catch (C) to effort (E) and biomass (B) through the catchability coefficient (q):
C = qEB (1)
Here, fishing mortality (F) is equal to the product of q and E (in this case, F is used as an exploitation rate rather than an instantaneous fishing mortality to simplify the illustration).
Take a hypothetical case where the catch quota is set using the fishing mortality corresponding to maximum sustainable yield (Fmsy) such that C = Fmsy × B. In this case, both Fmsy and B need to be determined. These are generally estimated using a stock assessment model. Estimates of both TAC (C = Fmsy × B) and TAE (E = Fmsy/q) require estimation of Fmsy14,15. Therefore, the difference between the two approaches lies in the accuracy of estimating the absolute level of biomass, B, versus the catchability coefficient, q. In reality, both B and q are known with uncertainty. Measures of absolute B are required for catch quotas, and q is required for effort quotas.
The absolute level of abundance B (the “scaling” of the stock assessment model) is notoriously difficult in many assessments16. Biomass estimates are a function of all
14 Fmsy is determined from the assumptions about the population (e.g. form of the growth and stock-recruitment curves) and fishery (e.g. form of the selectivity curves) dynamics and the predetermined or estimated parameters (e.g. natural mortality, growth, stock recruitment, selectivity), and it is typically independent of absolute abundance.
15 It may not be necessary to estimate Fmsy accurately for use in management. For many species, the stock-recruitment relationship is weak (steepness of the Beverton–Holt stock-recruitment relationship is high, and recruitment is independent of stock size). This means that the yield curve is similar to the yield-per-recruit (YPR) curve. It is well established that the YPR curve is flat for many species, and fishing at a rate somewhat less than (or greater than) Fmsy will produce similar equilibrium yields. However, dynamic yields may be very different.
16 Absolute levels of biomass are more difficult to estimate than depletion relative to some target level, i.e. relative changes.
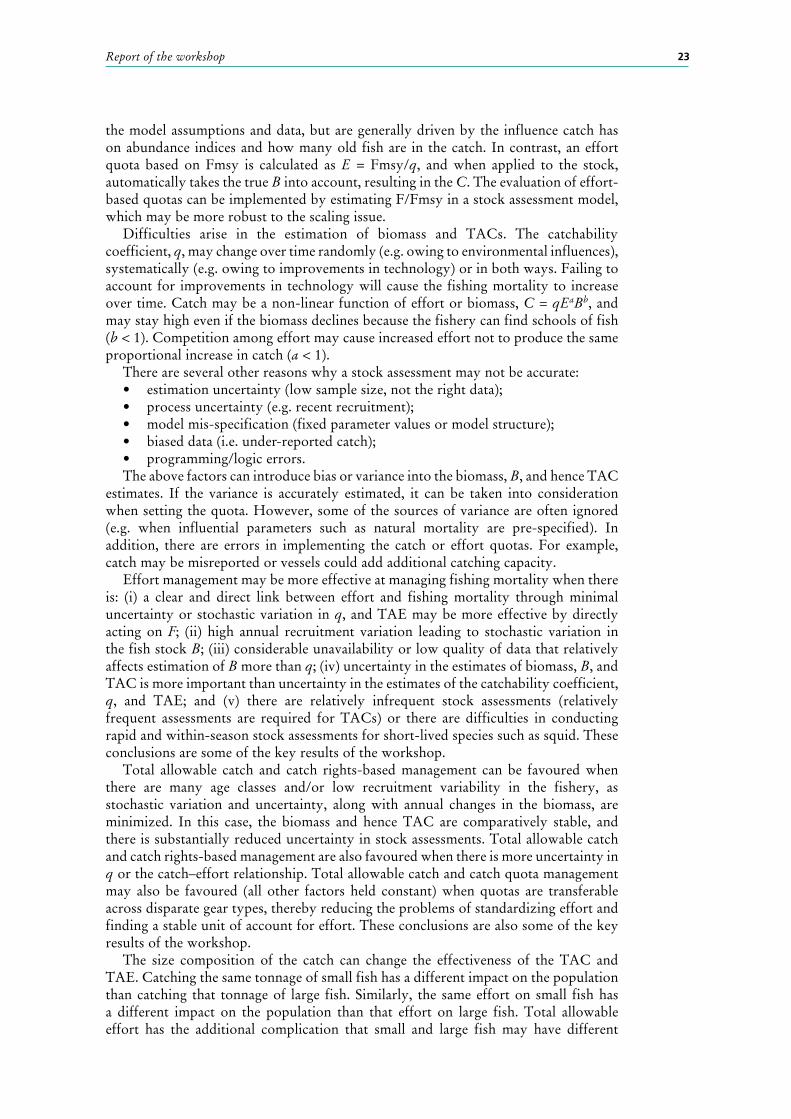
23Report of the workshop
the model assumptions and data, but are generally driven by the influence catch has on abundance indices and how many old fish are in the catch. In contrast, an effort quota based on Fmsy is calculated as E = Fmsy/q, and when applied to the stock, automatically takes the true B into account, resulting in the C. The evaluation of effort-based quotas can be implemented by estimating F/Fmsy in a stock assessment model, which may be more robust to the scaling issue.
Difficulties arise in the estimation of biomass and TACs. The catchability coefficient, q, may change over time randomly (e.g. owing to environmental influences), systematically (e.g. owing to improvements in technology) or in both ways. Failing to account for improvements in technology will cause the fishing mortality to increase over time. Catch may be a non-linear function of effort or biomass, C = qEaBb, and may stay high even if the biomass declines because the fishery can find schools of fish (b < 1). Competition among effort may cause increased effort not to produce the same proportional increase in catch (a < 1).
There are several other reasons why a stock assessment may not be accurate:• estimation uncertainty (low sample size, not the right data);• process uncertainty (e.g. recent recruitment);• model mis-specification (fixed parameter values or model structure);• biased data (i.e. under-reported catch);• programming/logic errors.The above factors can introduce bias or variance into the biomass, B, and hence TAC
estimates. If the variance is accurately estimated, it can be taken into consideration when setting the quota. However, some of the sources of variance are often ignored (e.g. when influential parameters such as natural mortality are pre-specified). In addition, there are errors in implementing the catch or effort quotas. For example, catch may be misreported or vessels could add additional catching capacity.
Effort management may be more effective at managing fishing mortality when there is: (i) a clear and direct link between effort and fishing mortality through minimal uncertainty or stochastic variation in q, and TAE may be more effective by directly acting on F; (ii) high annual recruitment variation leading to stochastic variation in the fish stock B; (iii) considerable unavailability or low quality of data that relatively affects estimation of B more than q; (iv) uncertainty in the estimates of biomass, B, and TAC is more important than uncertainty in the estimates of the catchability coefficient, q, and TAE; and (v) there are relatively infrequent stock assessments (relatively frequent assessments are required for TACs) or there are difficulties in conducting rapid and within-season stock assessments for short-lived species such as squid. These conclusions are some of the key results of the workshop.
Total allowable catch and catch rights-based management can be favoured when there are many age classes and/or low recruitment variability in the fishery, as stochastic variation and uncertainty, along with annual changes in the biomass, are minimized. In this case, the biomass and hence TAC are comparatively stable, and there is substantially reduced uncertainty in stock assessments. Total allowable catch and catch rights-based management are also favoured when there is more uncertainty in q or the catch–effort relationship. Total allowable catch and catch quota management may also be favoured (all other factors held constant) when quotas are transferable across disparate gear types, thereby reducing the problems of standardizing effort and finding a stable unit of account for effort. These conclusions are also some of the key results of the workshop.
The size composition of the catch can change the effectiveness of the TAC and TAE. Catching the same tonnage of small fish has a different impact on the population than catching that tonnage of large fish. Similarly, the same effort on small fish has a different impact on the population than that effort on large fish. Total allowable effort has the additional complication that small and large fish may have different
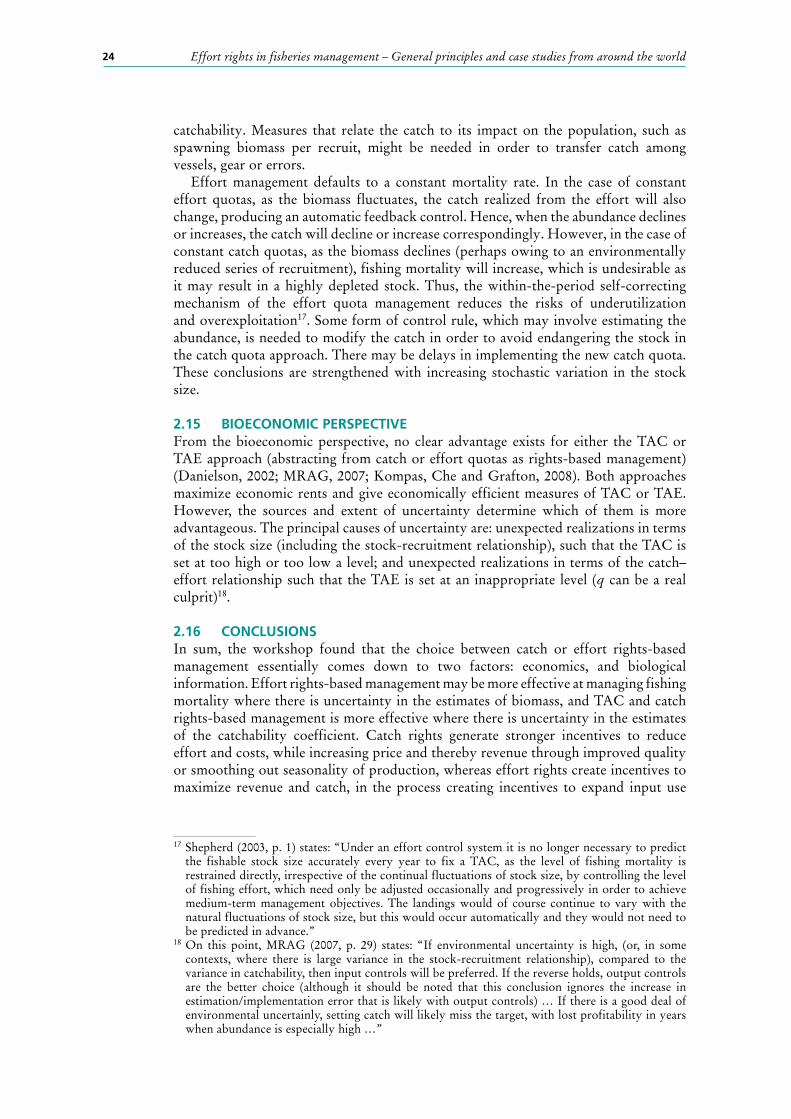
24 Effort rights in fisheries management – General principles and case studies from around the world
catchability. Measures that relate the catch to its impact on the population, such as spawning biomass per recruit, might be needed in order to transfer catch among vessels, gear or errors.
Effort management defaults to a constant mortality rate. In the case of constant effort quotas, as the biomass fluctuates, the catch realized from the effort will also change, producing an automatic feedback control. Hence, when the abundance declines or increases, the catch will decline or increase correspondingly. However, in the case of constant catch quotas, as the biomass declines (perhaps owing to an environmentally reduced series of recruitment), fishing mortality will increase, which is undesirable as it may result in a highly depleted stock. Thus, the within-the-period self-correcting mechanism of the effort quota management reduces the risks of underutilization and overexploitation17. Some form of control rule, which may involve estimating the abundance, is needed to modify the catch in order to avoid endangering the stock in the catch quota approach. There may be delays in implementing the new catch quota. These conclusions are strengthened with increasing stochastic variation in the stock size.
2.15 BIOECONOMIC PERSPECTIVEFrom the bioeconomic perspective, no clear advantage exists for either the TAC or TAE approach (abstracting from catch or effort quotas as rights-based management) (Danielson, 2002; MRAG, 2007; Kompas, Che and Grafton, 2008). Both approaches maximize economic rents and give economically efficient measures of TAC or TAE. However, the sources and extent of uncertainty determine which of them is more advantageous. The principal causes of uncertainty are: unexpected realizations in terms of the stock size (including the stock-recruitment relationship), such that the TAC is set at too high or too low a level; and unexpected realizations in terms of the catch–effort relationship such that the TAE is set at an inappropriate level (q can be a real culprit)18.
2.16 CONCLUSIONSIn sum, the workshop found that the choice between catch or effort rights-based management essentially comes down to two factors: economics, and biological information. Effort rights-based management may be more effective at managing fishing mortality where there is uncertainty in the estimates of biomass, and TAC and catch rights-based management is more effective where there is uncertainty in the estimates of the catchability coefficient. Catch rights generate stronger incentives to reduce effort and costs, while increasing price and thereby revenue through improved quality or smoothing out seasonality of production, whereas effort rights create incentives to maximize revenue and catch, in the process creating incentives to expand input use
17 Shepherd (2003, p. 1) states: “Under an effort control system it is no longer necessary to predict the fishable stock size accurately every year to fix a TAC, as the level of fishing mortality is restrained directly, irrespective of the continual fluctuations of stock size, by controlling the level of fishing effort, which need only be adjusted occasionally and progressively in order to achieve medium-term management objectives. The landings would of course continue to vary with the natural fluctuations of stock size, but this would occur automatically and they would not need to be predicted in advance.”
18 On this point, MRAG (2007, p. 29) states: “If environmental uncertainty is high, (or, in some contexts, where there is large variance in the stock-recruitment relationship), compared to the variance in catchability, then input controls will be preferred. If the reverse holds, output controls are the better choice (although it should be noted that this conclusion ignores the increase in estimation/implementation error that is likely with output controls) … If there is a good deal of environmental uncertainly, setting catch will likely miss the target, with lost profitability in years when abundance is especially high …”
25Report of the workshop
and costs. Effort rights-based management thereby requires continued adjustment in the TAE and input controls to counter ongoing increases in uncontrolled inputs, including vessel size, increased productivity (fishing power) owing to technological change, and more-efficient fishers replacing less-efficient ones, monitoring increases in productivity, and it creates weak incentives to shed capacity. Catch rights-based management requires monitoring of the population and catches, control of catches, and dealing with catches beyond quotas.
In a narrow economic sense, catch rights-based management is superior owing to the incentives it creates. However, once the costs of research to improve stock assessments and the associated risks of determining the quota and costs of MCS and enforcement are taken into consideration, the choice between catch and effort controls and rights becomes more complex and indeterminate. The results will be case-specific. Hybrid systems of both catch and effort rights and controls are increasingly employed to manage marine fisheries to capture the advantages of both approaches, with one approach forming the dominant management system. The form of rights-based management cannot be separated from the choice of TAC or TAE management.
Effort rights-based management has clear advantages in complex multispecies fisheries in developing countries (especially with complex tropical multispecies ecosystems), in artisanal fisheries, where TAC-based management is more difficult and expensive and stock assessments are difficult, where data for stock assessments and close monitoring of catches are largely unavailable or of low quality, where MCS costs for catch systems prohibitive, and where uncertainty over biomass estimates is paramount.
Effort management is widely applied in pot and trap fisheries, where the link between effort (number of pots and soak time) and mortality is relatively direct,19 managing pots and traps can be more cost-effective than managing catches, and incentives can be clear to fishers given the importance of territoriality (where fishers deploy their pots and traps). Pot and trap fisheries are typically used for benthic and demersal species. There may also be elements of fisher territoriality in these fisheries, which favours effort management as fishers can readily monitor and control the numbers and locations of pots and traps, and the relatively clear spatial dimension and number of gear confer a relatively strong sense of exclusivity of the right20. Effort management, perhaps in a hybrid system with territorial rights, may also be favoured with shellfish fisheries, such as molluscs, for the same fundamental reasons as pot and trap fisheries. Effort management also has advantages in fisheries with highly variable stock-recruitment relationships and subsequent high stochastic variation and uncertainty in resource stock, such as shrimp, squid, and some small pelagic species. Effort management is also applied where escapement is important, such as with salmon, and as with salmon where the river of origin is important and effort can be targeted to specific rivers and regions but catch at sea is difficult to directly relate to the river of origin – unless catch quotas are applied to each river.
In some situations, it may not be possible to calculate MSY-related quantities or the current stock status, such that optimal management may not be possible. In these cases, if everyone is satisfied with the current state of the fishery, it may be reasonable to keep things as they are. The use of TAEs would be less risky, as they have automatic feedback with respect to changes in abundance. Management may only need to keep an eye on effort creep or monitor relative fishing mortality, which is easier to estimate than absolute fishing mortality.
19 In this case, capital utilization and capacity utilization are also comparatively directly linked.20 In this case, there can be a close relationship between effort management and territorial use rights
for fisheries (TURFs). See Acheson (1975) for a classic discussion in the context of the United States Maine lobster fishery.
26 Effort rights in fisheries management – General principles and case studies from around the world
Catch rights programmes provide advantages from the perspective of the microeconomics of the vessel’s production process and the law and economics of property rights due to the superior economic incentives they create for greater economic efficiency from minimizing costs and effort and to match catches with TACs. A related factor is the difficulty in defining and measuring effort compared to catch that contributes to “effort creep” in which regulated effort expands due to substitution of unregulated inputs for regulated inputs and technology grows. Catch rights programmes do not face the need for continued reductions in TAE and tightening of input controls, or even implementation of new ones to counter increased input usage and technological progress. Total allowable catch and catch rights-based management can provide advantages where there are many age classes and/or low recruitment variability in the fishery as stochastic variation, uncertainty, and annual changes in the biomass are minimized. The biomass and, hence, TAC are consequently comparatively stable, and there is substantially reduced uncertainty in stock assessments and TAC forecasts.
The critical issues for other fisheries outside of MCS, enforcement, and stock assessment costs and political economy may be: (i) a standardized and agreed measure for the relationship between fishing effort and fishing mortality, reflecting the two principal sources of uncertainty, including technical change,21 and for effort itself; (ii) the greater difficulty of effort systems to inherently address overcapacity growing through investment, input substitution, increased input utilization (fishing time) owing to substantially weaker effective incentives to minimize effort and costs than catch quota systems, and increasingly productive capital and effort owing to technical change; (iii) discards of target species under catch quotas; and (iv) the feasibility of fine-tuning the management of individual stocks in a fishery, and the validity that effective but broad-brush control could be preferable to the apparent precision management using TACs and quotas.
Maintaining an underlying licence limitation scheme can safeguard against pressures to expand the TAE or TAC in either effort- or catch-based management systems.
The workshop recognized that both individual or group effort and catch rights can achieve target fishing mortality, can improve economic efficiency, are clear improvements over open-access and simple limited entry, and can have associated issues of political economy and governance. The workshop recognized that transferability of either catch or effort rights enhances economic efficiency, allows matching quota holdings with catches and reducing discarding in catch quota systems, and confers flexibility to vessels to respond to changes in environmental and market conditions. Nonetheless, there can be concerns over quota concentration and the distribution among groups in society of the net benefits over time.
The workshop aimed to establish the strengths and weakness of each approach, the trade-offs that are entailed by choices between effort and catch rights (including accompanying TAE and TAC management), and potential conditions under which one approach or another may be favoured. Some workshop participants gave greater weight to advantages or disadvantages of one system over another than did other participants, leading to some variation in preferences for one system over the other. The emergence of a catch or effort rights programme is also path-dependent. This means that the particular initial conditions, political economy, and history can play an important and ultimately idiosyncratic role in the choice and even success of one approach over another. Successful catch or effort rights programmes require that the TAE or TAC be set according to the stock status.
21 The two sources of unexpected change are: (i) unexpected realizations in terms of the stock size such that the TAC is set at too high or too low a level; and (ii) unexpected realizations in terms of the catch–effort relationship such that the TAE is set at an inappropriate level.

27Report of the workshop
The workshop did not explicitly address the application of rights-based management to ecosystem-based fisheries management or biodiversity conservation. Instead, it primarily (although not exclusively) concentrated on rights applied to fishing on target species. The workshop did not further pursue the choice of one approach or the other, recognizing that: (i) the choice depends upon the specific fishery; (ii) many fisheries transitioning from ITE rights to ITQ in fact retained many effort programme features, thereby forming hybrid systems; and (iii) hybrid systems are emerging that combine features of both catch and effort rights and/or area rights22.
REFERENCESAcheson, J. 1975. The lobster fiefs: economic and ecological effects of territoriality in the
Marine lobster industry. Human Ecology, 3: 183–207.Baland, J.M. & Platteau, J.P. 1996. Halting degradation of natural resources: Is there a
role for rural communities? Rome, FAO. (also available at www.fao.org/docrep/x5316e/x5316e00.htm).
Danielsson, A. 2002. Efficiency of catch and effort quotas in the presence of risk. Journal of Environmental Economics and Management, 43: 20–33.
Jákupsstovu, S. H. í, Cruz, L. R., Maguire, J.J., & Reinert, J. 2007. Effort regulation of the demersal fisheries at the Faroe Islands: a 10-year appraisal. ICES Journal of Marine Science, 64(4): 730–737.
Kompas, T., Che, T.N., & Grafton, R.Q. 2008. Fisheries instrument choice under uncertainty. Land Economics, 84: 652–666.
MRAG. 2007. Assessment of alternative approaches to implementing individual transferable quotas (ITQs) in the Australian Northern Prawn Fishery (NPF) and identification of the impacts on the fishery of those approaches. Final Report to AFMA and NORMA. 112 pp.
Ostrom, E. 1990. Governing the commons: the evolution of institutions for collective action. Cambridge, UK, Cambridge University Press.
Sanchirico, J., Holland, D., Quigley, K. & Fina, M. 2006. Catch-quota balancing in multispecies individual fishing quotas. Marine Policy, 30(6): 767–785.
Segerson, K. 2011. Policies to reduce stochastic sea turtle bycatch: an economic efficiency analysis. In P. Dutton, D. Squires & M. Ahmed, eds. Conservation of Pacific sea turtles, pp. 371–395. Honolulu, USA, University of Hawaii Press.
Shepherd, J.G. 2003. Fishing effort control: Could it work under the Common Fisheries Policy? Fisheries Research, 63(2): 149–153.
22 These hybrid systems in part address the emerging ecosystems and biodiversity issues and in part address the limitations inherent in either approach. A number of the transferable effort programmes that have transitioned to ITQs have effectively become hybrid systems by retaining elements of previous effort management regimes.

29
Appendix 1 – List of presentations
The presentations were grouped together to first provide overview and concepts of fisheries management, economics, population assessment and ecology, and were then followed by case studies.
1. Overview and survey – Dale Squires2. Is there a case for effort control? – Rögnvaldur Hannesson3. Effort versus quota control when stocks cannot be targeted – Rögnvaldur
Hannesson4. Microeconomics and effort management – Niels Vestergaard5. On fisheries and property rights – Ikerne del Valle6. Management strategy evaluation – Douglas Butterworth7. Population assessment, data availability, and uncertainty – Ana Parma8. Developing country perspective – Shaufique Sidique9. Effort control through the Vessel Day Scheme (VDS): rights-based management
in the Western and Central Pacific Ocean tuna fishery – Elizabeth Havice10. Effort based rights: Falkland Islands Loligo squid fishery – Vishwanie Maharaj11. Fisheries in the Faroe Islands – Hans Ellefson12. The effort control program in the northeast United States groundfish fishery –
Eric Thunberg13. Management of demersal fisheries in the Faroese Fishing Zone – Kjartan Hoydal14. Effort allocation and the Hawaii longline shallow-set (swordfish) certificate
program – Raymond Clarke15. Tradable traps in the northeast U.S. American lobster fishery – Eric Thunberg
30 Effort rights in fisheries management – General principles and case studies from around the world
Appendix 2 – List of participants
Allen, RobinFisheries management and population biologyScientific Advisory Committee, International Seafood Sustainability Foundation, and Former Director Inter-American Tropical Tuna Commission New ZealandE-mail: [email protected]
Andersen, PederFisheries economicsProfessor of Economics, University of Copenhagen, and former Director of the Danish Economic Council DenmarkE-mail: [email protected]
Astorkiza, KepaFisheries economicsProfessor of Economics, University of the Basque CountryBilbao, SpainE-mail: [email protected]
Butterworth, DouglasPopulation biologyProfessor of Mathematics, University of Cape TownSouth AfricaE-mail: Doug. [email protected]
Caballero, Gonzalo Fisheries economicsProfessor of Economics, University of VigoSpainE-mail: [email protected]
Clarke, RaymondFisheries managementPacific Island Regional Office, NOAA FisheriesHonolulu, Hawaii, the United States of AmericaE-mail: [email protected]
Del Valle, IkerneFisheries economicsProfessor of Economics, University of the Basque CountryBilbao, SpainE-mail: [email protected]
Ellefson, HansFisheries economicsUniversity of Faroe IslandsFaroe islandsE-mail: [email protected]
Guillotreau, PatriceFisheries economicsProfessor of Economics, University of NantesFranceE-mail: Patrice. [email protected]
Hampton, JohnPopulation biologySecretariat of the Pacific CommunityNoumea, New CaledoniaE-mail: [email protected]
Hannesson, RögnvaldurFisheries economicsProfessor of Economics, Norwegian School of Economics and Business AdministrationBergen, NorwayE-mail: [email protected]
Havice, ElizabethPolitical economy of natural resource useAssistant Professor, Department of Geography, University of North CarolinaChapel Hill, the United States of AmericaE-mail: [email protected]
Helvey, MarkFisheries managementSouthwest Regional Office, NOAA Fisheries, Long BeachCalifornia, the United States of AmericaE-mail: [email protected]
31 Appendix 2 – List of participants
Herrick, Samuel, JrFisheries economicsConsultant and former Industry Economist, Southwest Fisheries Science Center, NOAA FisheriesLa Jolla, California, the United States of AmericaE-mail: [email protected]
Hoydal, KjartanFisheries management and population biologyFormer Director of Fisheries, Government of Faroe Islands, and Former Director of Northeast Atlantic Fisheries CommissionE-mail: [email protected]
Maharaj, VishwanieFisheries economicsSenior Program Economist, World Wildlife Fund – FisheriesWashington, DC, the United States of AmericaE-mail: [email protected]
Metzner, RebeccaFisheries managementFood and Agriculture Organization of the United NationsRome, ItalyE-mail: [email protected]
Mosqueira, IagoPopulation biologyJoint Research Center, European UnionE-mail: [email protected]
Parma, AnaPopulation biologyResearch Scientist, Centro Nacional Patagonico9120 Puerto MadrynChubut, ArgentinaE-mail: [email protected]
Prieto-Bowen, IvanFisheries economics and managementConsultant and former Under-Secretary of Fisheries, Government of EcuadorE-mail: [email protected], Shaufique FahimiFisheries economicsAssistant Professor of Economics, Universiti PutraMalaysiaE-mail: [email protected]
Squires, DaleFisheries economicsSenior Scientist, NOAA Fisheries, Southwest Fisheries Science CenterLa Jolla, California, the United States of AmericaE-mail: [email protected]
Steinsham, Stein IvarFisheries economicsProfessor of Economics, Norwegian School of Economics and Business AdministrationBergen, NorwayE-mail: [email protected]
Thunberg, EricFisheries economicsEconomic and Social Analysis Division, Office of Science and Technology, NOAA FisheriesSilver Springs, Maryland, the United States of AmericaE-mail: [email protected]
Vestergaard, NielsFisheries economicsProfessor of Economics, University of Southern DenmarkEsberg, DenmarkE-mail: [email protected]
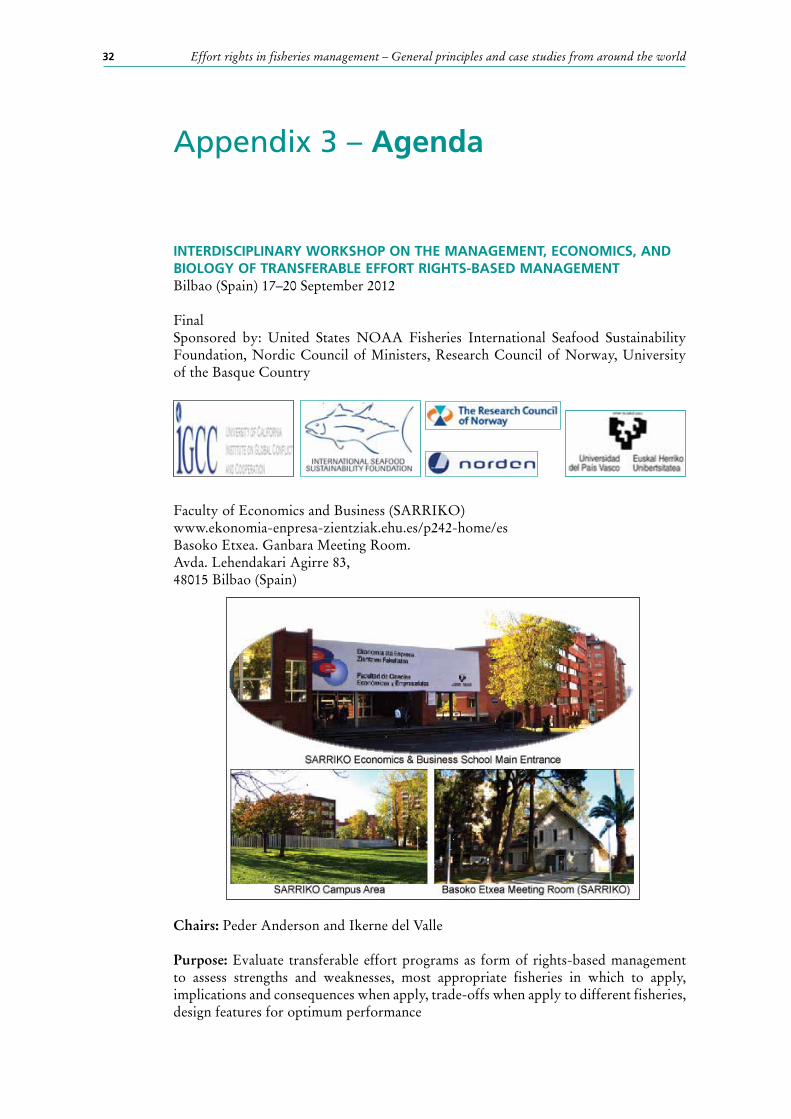
32 Effort rights in fisheries management – General principles and case studies from around the world
Appendix 3 – Agenda
INTERDISCIPLINARY WORKSHOP ON THE MANAGEMENT, ECONOMICS, AND BIOLOGY OF TRANSFERABLE EFFORT RIGHTS-BASED MANAGEMENTBilbao (Spain) 17–20 September 2012
FinalSponsored by: United States NOAA Fisheries International Seafood Sustainability Foundation, Nordic Council of Ministers, Research Council of Norway, University of the Basque Country
Faculty of Economics and Business (SARRIKO)www.ekonomia-enpresa-zientziak.ehu.es/p242-home/esBasoko Etxea. Ganbara Meeting Room.Avda. Lehendakari Agirre 83,48015 Bilbao (Spain)
Chairs: Peder Anderson and Ikerne del Valle
Purpose: Evaluate transferable effort programs as form of rights-based management to assess strengths and weaknesses, most appropriate fisheries in which to apply, implications and consequences when apply, trade-offs when apply to different fisheries, design features for optimum performance
33 Appendix 2 – List of participants
Steering Committee: Peder Andersen, University of Copenhagen, Røgnvaldur Hannesson, Norwegian School of Economics and Management, Sam Herrick and Dale Squires, NOAA Fisheries, Southwest Fisheries Science Center, La Jolla, Niels Vestergaard, University of Southern Denmark, Ikerne del Valle, University of the Basque Country, Mark Maunder, Inter-American Tropical Tuna Commission, Victor Restrepo, International Seafood Sustainability Foundation
Expected Outcomes: (1) journal paper (e.g. Fish and Fisheries), (2) FAO Fisheries Technical Paper. Each presentation will form a chapter in FAO Fisheries Technical Paper and synthesis paper from meeting forms another chapter and (after some changes) journal paper.
Rapporteur: Squires, Helvey
DAY 1 17TH SEPTEMBER, MONDAY
9:45 Introductions, purpose, key issues, etc. - Peder Anderson and Ikerne del Valle9:45 Overview and survey - Dale Squires10:30 Coffee11:00 Is There a Case for Effort Control? - Røgnvaldur Hannesson
Effort Versus Quota Control When Stocks Cannot be Targeted - HannessonDiscussant (Squires/Hannesson papers): Vestergaard
12:30 Microeconomics of Effort and Output Controls - VestergaardDiscussant: Squires/Hannesson
13:00 Lunch14:00 Property Rights- del Valle
Discussant: Peder Anderson14:45 Management Strategy Evaluation - Dough Butterworth
Discussant: Ana Parma15:45 Coffee16:15 Developing Country Perspective - Shaufique Fahmi
Discussant: Ivan Prieto
17:15 Overview and wrap-up for day and schedule for next day
DAY 2 18TH SEPTEMBER, TUESDAY
9:00 Falklands/Malvinas Squid - Vishwanie MaharajDiscussant: Sam Herrick
9:45 New England Groundfish - Eric ThunbergDiscussant: Mark Helvey
10:30 Coffee11:15 Effort and Output Controls - Ana Parma and Doug Butterworth13:00 Lunch14:30 Faeroe Islands - Hans Ellefson
Discussant: Rognvaldur Hannesson15:15 Faeroe Islands - Kjartan Hoydal
Discussant: Stein Ivar Steinshamn
Appendix 3 – Agenda

34 Effort rights in fisheries management – General principles and case studies from around the world
16:00 Coffee16:30 Hawaii Pelagic Longline Survey Fishery and Sea Turtle Bycatch - Ray Clarke
Discussant: Mark Helvey17:15 Summary, Themes to Discuss, Begin Discussion
18:00 Overview and wrap-up for day and schedule for next day
DAY 3 19TH SEPTEMBER, WEDNESDAY
9:00 Spanish 300 Fleet - Gonzalo CaballeroDiscussion includes EU use of both ITQ’s and effort controlsDiscussant: Ikerne del ValleDiscussant: Patric Guillotreau
9:50 PNA Vessel Day Scheme - Elizabeth HaviceDiscussant: John Hampton (Implications for assessments)Discussant: Rognvaldur Hannesson (Economics)
10:50 Coffee
11:20 New England Pot and Trap - Eric ThunbergDiscussant: Vishwanie Maharaj
12:10 Danish Case Study - Peder AndersenDiscussant: Stein Ivar Steinshamn
13:00 Lunch
DAY 4 20TH SEPTEMBER, THURSDAY
9:00 Discussion and Wrap Up - Peder AndersenRapporteur - Squires
10:30 Coffee13:00 Lunch
CONTRIBUTED PAPERS AND PRESENTATIONS

37
Effort rights-based management
Dale Squires, NOAA Fisheries, Southwest Fisheries Science CenterE-mail: [email protected]
Mark Maunder, Inter-American Tropical Tuna CommissionE-mail: [email protected]
Samuel Herrick, Jr., NOAA Fisheries, Southwest Fisheries Science CenterE-mail: [email protected]
Mark Helvey, NOAA FisheriesE-mail: [email protected]
Raymond Clarke, NOAA FisheriesE-mail: [email protected]
Discussions with Joe Horwood, Erik Lindebo, John Shepherd, and John Walden are gratefully acknowledged. Any errors remain the responsibility of the authors. The results are not necessarily those of NOAA Fisheries.
INTRODUCTIONIndividual effort fisheries management programmes are an important, albeit less widely used, form of rights-based management, most notably transferable catch quotas for groups or individuals (ITQs)1.All forms of rights-based management reorient the economic incentives motivating fisher behaviour from the perverse race to fish to incentives that more closely align the private behaviour of fishers with desired economic-ecological objectives, although some rights may be more effective than others. Individual transferable effort programmes have been less extensively used than other forms of rights-based management such as ITQs (Baudron et al., 2010; Bishop et al., 2002; Nielsen et al., 2006; OECD, 2006; Harte and Barton, 2007; Pope, 2009; Allen et al., 2010; Jákupsstovuet al., 2007; Løkkegaardet al., 2007; MRAG, 2007; Squires, 2010). Limited access can also be considered a form of effort management, but here we focus upon gear or some measure of time, such as days, as effort.
Individual effort rights-based management programmes represent a major step forward from open access and limited entry and provide a more completely structured right than either, due in particular to the stronger exclusive use of the right by individual firms, vessels, or groups. Individual effort programmes set an annual Total Allowable Effort (TAE) for the fishery, typically denominated in nominal units of effort, such as days at sea or number of sets of gear, although other units such as numbers of hooks or traps can also be used. When transferability is allowed, thereby increasing flexibility and economic efficiency, the programmes are for individual transferable effort (ITE) and/or between groups. Effort can be area-denominated (as in the Faroe Islands) to preclude local stock depletion, or to protect sensitive areas resulting in economic gains
1 Other forms of rights-based management include sector allocations and voluntary agreements, license limitation, area and territorial use rights, and common property.
38 Effort rights in fisheries management – General principles and case studies from around the world
through more spatially efficient allocation of effort. Effort can be further allocated across species and/or gear combinations to realize efficiency gains by reducing unwanted bycatch or from separating different methods of fishing or different income groups and small and large-scale fishers. An economically efficient allocation of effort would equalize the marginal net benefits across gear, vessel groups, and area.
Individual effort forms of rights-based management have received considerably less attention in the literature than transferable catch quota approaches, and the intent of this paper is to begin filling the gap. This paper surveys the practice and discusses issues associated with transferable effort rights-based management and effort management in general. The focus is on ITEs, i.e. transferable effort rights in Exclusive Economic Zones (EEZs) and for the high seas through international fisheries commissions held by states, individual firms, or vessels. Individual effort can also be non-transferable and typically specified as a weaker form of use right. The term “(individual) transferable effort quotas” is also sometimes used in the fisheries literature.
A group or fishing sector can also hold effort as a property right, in which there are collective limits with collective decisions. Evidence on group rights in general (thereby including output quotas) is accumulating to show that rights held by groups can lead to efficiency gains that are comparable to those held by individuals when there is effective group management (Ostrom, 1990; Baland and Platteau, 1996; Deacon, 2012; Zhou and Segerson, 2013).
The paper is organized as follows. Section 2 reviews individual effort programmes around the world with an emphasis upon ITE programmes as a form of rights-based management. Section 3 examines potential economic benefits. Section 4 evaluates effort programmes from the perspective of law and economics and the characteristics of property rights following Scott (2000, 2008). Section 5 evaluates effort programmes from the perspective of the individual firm or vessel and its production process and resulting secondary market after trade of the transferable effort right. Section 6 considers monitoring, control, surveillance, enforcement, and costs with effort programmes. Section 7 evaluates transferable effort programmes from the bioeconomics perspective, which evaluates on the basis of the fishery’s economic rents. Section 8 evaluates transferable effort programmes from the stock assessment perspective. Section 9 considers hybrid systems of individual transferable catch quotas or group catch quotas and individual transferable effort or group effort programmes, which are becoming increasingly prevalent. Section 10 discusses unique issues that arise in international fisheries with transferable effort programmes of rights-based management. The final section, Section 11, provides concluding remarks.
INDIVIDUAL EFFORT AND INDIVIDUAL TRANSFERABLE EFFORT PROGRAMMES AROUND THE GLOBEIndividual non-transferable effort (hereafter individual effort) and individual transferable effort programmes have been applied in the United States New England groundfish fishery for tradable fishing days (Demarest, 2002), tradable days for the U.S. Atlantic sea scallop fishery, a system of tradable fishing days by fleet for the demersal gadoid fishery of the Faeroe Islands since 1996 (Reinert n.d., Thomsen, 2005; Nielson et al., 2006; Løkkegaard et al., 2007; Baudron, 2010), the Hawaiian pelagic shallow set longline fishery for swordfish (this provision was recently disbanded), the Falkland/ Malvinas Islands squid fishery (Barton, 2002; MRAG, 2007; Harte and Barton, 2007ab), the Basque trawl fishery that is part of the “Spanish 300” fleet (MRAG et al., 2009), the Australian Eastern tuna and billfish fishery until 2010 managed by the number of hooks per vessel and overall (Pascoe et al., 2010), transferable traps in the commercial lobster fisheries in Lobster Conservation Management Areas of Outer Cape Cod and Southern New England (Massachusetts, 2010), a federal waters transferable trap

39Effort rights-based management
programme in New England, two individual transferable trap programmes in Florida (Larkin and Millon, 2002), fleet capacity in Sweden through a license limitation and co-management system in the vendace (roe) fishery and 100 days per year for trawlers in Gullmarsfjord with license limitation and informal co-management and local management (allocation) of fishing days to avoid crowding and early closure of the fishery (MRAG et al., 2009), salmon netting in the United Kingdom (MRAG et al., 2009), the coastal fishery using fyke nets and gillnets and effort denominated in number of gear (gear-use rights) for plaice, perch, salmon and herring in Estonia (Vetemaa et al., 2002; MRAG et al., 2009; OECD, 2009), transferable fishing days in the Torres Strait prawn fishery, transferable vessel days in the Area H Johnson Strait chum salmon demonstration fishery in Canada (DFO Canada, 2012), the Australian Southern zone rock lobster fishery, Western Australian Pilbara trap fishery (Borg and Metzner, 2001), the Western Australia rock lobster pot fishery (Morgan, 2001, Fletcher et al., 2005), and transferable days for Spanish trawl and longline vessels operating in waters (the “300 Fleet”) (OECD, 2006: Garza-Gil et al., 2008; MRAG et al., 2009). The Australian northern prawn fishery was for many years managed by non-transferable effort with a hybrid measure of effort, although it is now managed by ITQs (Kompas et al., 2004; Nielsen et al., 2006; MRAG, 2007). The Atlantic sea scallop fishery has been managed by non-transferable effort. The Latvian coastal fishery regulated by non-transferable days at sea that supplement individual quotas in fact have transferability because it is possible to buy companies that have quota and/or to sell or rent vessels with unused quota (MRAG et al., 2009). The Danish blue mussel fishery is formally regulated by a license limitation programme with limits on engine power and gross registered tonnes and minimum mussel size and informally and voluntarily regulated by self-imposed number of fishing days and start and ending dates for the season (Andersen et al., 2014).
The state of Florida has managed the Trap Certificate Programme trap fishery using a tradable effort permit programme since 1992 (Larkin and Milon, 2002; EDF DCTF, 2010). Numerous regulations protect the stock and standardize effort, including minimum size, seasons, a prohibition on the harvest of gravid females, and trap size and construction limits. Responding to increasing numbers of traps, falling yield per trap and catch levels, and fall profits, the total number of traps was regulated in 1992 with implementation of the Trap Certificate Programme (TCP). The mandated goal of the TCP was essentially an economic one. Under the TCP, licensed commercial fishers own certificates which allow the use of an equivalent number of traps. Certificates are transferable, all or in part, among fishers provided they are exchanged at a “fair market value” and the applicable transfer fees are paid ($2 per certificate plus a 25 percent surcharge on original transfers to non-family members). No person, firm, corporation, or other business entity may control, directly or indirectly, more than 1.5 percent of the total number of certificates available in any license year. The Florida Fish and Wildlife Conservation Commission determines the total number of certificates available (TAE) and can lower the total number of certificates by reducing each individuals holdings by no more than ten percent per year. The commission is not required to authorize any reductions, but cannot issue new certificates. The total number of certificates – and, therefore, the maximum number of legal traps in the commercial sector– has decreased since the initial allocation due to four mandated ten percent reductions. A management target of 400 000 traps was set in 2001. The transferable trap programme reduced the total number of traps from well over 825 000 to fewer than 500 000 while maintaining the trap sector’s overall catch. The Florida TCP has suffered due to a lack of a clear definition of programme objectives, specification of a terminal effort level, and the structure of administrative costs to fund the programme.

40 Effort rights in fisheries management – General principles and case studies from around the world
Since 2008, an Area H Johnson Strait chum salmon troll full fleet share-based demonstration troll fishery has been in place involving transferable boat days (DFO Canada, 2012). This fishery has been managed on an effort basis with good compliance since 2002 because the tools have not been developed to estimate run size (Pinfold, 2009). The initial allocation of boat days was based on Area H’s share of the allowable troll exploitation rate. The fishery was divided into two fishing periods with a short break in between. Boat days may be fished at any time during the fishing period Boat days were transferable between Area H vessels within each fishing period but not between periods. Quotas can be stacked from two or three vessels on one vessel. A maximum of one-third of the total number of boat days held could be carried over from fishing period one to fishing period two provided that that the day(s) was/were not fished. The carry-over will be rounded down to the nearest whole number if required. The ITE programme has resulted in fewer vessels due to ITE stacking and quota transfers.
Since 2003, the European Union (EU) has employed a hybrid programme of both management systems by supplementing the traditional TAC fleet capacity restrictions with sea-day restrictions from 2003 (Daan and Rijnsdorp, 2006; Nielsen et al., 2007; MRAG et al., 2009; Cotter, 2010; Khalilian, 2010). In the United Kingdom, days at sea allocations do not correspond to quota allocations, but are allocated on a separate basis (MRAG et al., 2009). If a vessel fished in the cod recovery box or the sole recovery box during the reference period (2001–2005), a days-at-sea allocation can be claimed. Vessels can transfer days at sea to other vessels subject to a limit. Days are pro-rated when days are transferred to a vessel with different engine kilowatts (kw). The Netherlands days at sea programme allows transferability between vessels. Spain also combines an individual quota and individual effort programme for its trawlers.
The Spanish “300 fleet “fishing on the Grand Sole grounds was originally controlled through days at sea and individual quotas that were introduced in 2007 (Gonzallo-Miguez et al., 2014). The entry of Spain into the EEC established a list of 300 vessels with rights to fish in the area, giving the name Spanish “300 fleet”, although only 150 vessels could operate simultaneously until the end of 2002. This fleet is predominately trawl but also includes some bottom longline gear and fishes in the ICES zones Vb, VI, VII, and VIIIa, b, d. The fishing rights conferred included an annual system of limited days per fishing zone. If fishing rights were transferred, fishing days were conserved but with adjustment of rights. Prior to 1997 rights were not transferable, but by 1997 a limit to accumulation of rights was established, with a lower limit of 210 fishing days per vessel in all areas to ensure profitability and an upper limit of 315 days to limit accumulation. Fishing effort was defined as the combined main engine kilowatts multiplied by the number of fishing days. Both the fishing association and the vessel owner could now transfer rights, and by 2007 there was a maximum limit of 30 percent of the fleet and a minimum of 0.5 of the rights. In 2007, Individual Transferable Quotas were introduced, shifting the approach from right of access that tried to control the fishing effort to vessels. The ITQs were distributed based on the previous fishing rights of each vessel in the fishing zone, quotas were allocated to the companies owning these vessels. Individual vessel owners or by the Vessel Owners Association can managed the ITQs, although in practice the Association management has dominated. When vessels change Associations, the vessels carry its corresponding catch quota to the next Association in which it becomes a member. ITQs are transferrable only within the original “300 fleet”. The ITQ programme retains a hybrid of ITQs and effort management in that it also distributes access rights measured in effort by combining catch quotas and an allocation of kilowatts by vessel (where the number of days was converted to kilowatts), and the key factor is the catch quota.
41Effort rights-based management
In the Torres Strait prawn fishery on 3 November 2005, the Protected Zone Joint Authority (PZJA) agreed to introduce a total cap of 9 197 days (via a 31.8 percent pro-rata effort reduction) (Cocking et al., 2012). License holders must hold a minimum number of rights (days) to operate in the fishery. Prior to the 2006 season, the minimum number required was 50 days. A voluntary buyback followed but substantial unused effort remained. The system, formalized in the Torres Strait Prawn Fishery Management Plan 2009, moved from the existing system of fishing days to the new system involving: (1) a form of effort units and access as a proportion of the TAE in any season and (2) the introduction of a formal system to allow operators to temporarily transfer unused fishing effort within a season. Under the Plan, the PZJA has allocated long-term ongoing access rights in the form of units of fishing capacity (UFCs). The fishery has been divided into 9 200 UFCs, which have been issued to the holders of boat licenses. These UFCs are valid for the life of the Plan and one UFC was issued for each fishing day held by a license holder immediately before the commencement of the Plan (allocations did not include temporarily allocated fishing days including Papua New Guinea days). For example, 230 fishing days pre-Plan became 230 UFCs under the Plan. When a holder had multiple licenses in the same name, the fishing days from these were pooled together and converted to UFCs in the same holder’s name. The pooled amount can be utilized in any proportion by any of the licenses held in the same name as the UFCs. Each season, these units of fishing capacity will be transferred into an annual use entitlement in the form of fishing days. The Plan allows license holders to temporarily transfer unused UFCs to another holder of a boat license by applying to the PZJA to register a transfer of a specific number of UFCs. The recipient can only use these units for the season in which they are transferred. The recipient cannot further transfer any temporarily transferred units. The system automatically transfers any temporarily transferred units back to the transferor before the commencement of the following season. There are also limits on boat length, net size, mesh size, and mandatory use of turtle excluder devices.
The Falklands-Malvinas squid fishery first implemented ITEs in July 2006 for Loligo squid with 25-year duration for the right (Barton, 2002; MRAG, 2007: Harte and Barton, 2007ab). The TAE is calculated from stock assessment and allocated among companies according to their ITEs that applied equally to both the first and second fishing seasons. The Western Australia rock lobster fishery, which is managed under a transferable effort system, is also divided into three zones that distribute effort across the fishery and enables managers and fishery representatives to effectively address zone-specific issues (EDF DCTF, 2010). The Australian northern prawn fishery was managed by non-transferable effort through input controls and season and area closures (Kompas et al., 2004; MRAG, 2007). Input controls limited the number of vessels operating in the fishery at any given time, and initially the below deck volume and engine capacity of boats operating in the fishery were regulated to restrict fishing effort. This was subsequently replaced with gear unit management that regulates the length of headrope, and thus the size of the net, that may be towed by vessels in the fishery. The total amount of gear in the fishery was capped and effort reductions were implemented through reducing the total amount of gear with each operator reducing the gear proportionally. Other input controls include extensive spatial and temporal closures to protect habitats, juveniles and pre-spawning animals. This programme was converted in 2010 to an individual transferable quota fishery.
An important transferable effort programme called the Vessel Day Scheme (VDS) recently emerged in the Western and Central Pacific Ocean for tuna purse seine vessels (Aqorau, 2009; Havice, 2010, 2012; Shanks, 2010). Beginning 1 January 2011, the Parties to the Nauru Agreement (PNA) began a trial longline vessel day scheme.
42 Effort rights in fisheries management – General principles and case studies from around the world
The Faeroe Islands’ ITE system regulating demersal species on the Faroe Plateau grew out of the 1994 catch quota management system that led to substantial discarding and misreporting of catches and was discontinued from 31 May 1996 in the face of industry opposition (Reinert and Thomsen, 2005; Nielson et al., 2006; Løkkegaard et al., 2007; Baudron, 2010). In close co-operation with the fishing industry, the Faroese government developed ‘fleet category individual transferable effort quotas’, measured in days that began on 1 June 1996 and with a ten year right duration. The ITEs apply to pair trawlers above 400 HP, long-line vessels above 110 GT, and coastal fishing vessels below 110 GT. Single trawlers greater than 400 HP do not have effort limitations, but they are not allowed to fish within the 12 nautical mile limit and are subject to bycatch quotas. The number of days is regulated each year in a process including both scientific (ICES) and industry advice. There is an exchange rate between days of different gear: one fishing day by longliners less than 100 GRT is considered equivalent to two fishing days for jiggers in the same gear category, thereby accounting for productivity differentials. The effort quotas are transferable within gear categories with either permanent (as a share of TAE) or temporary transfer (as days). These effort transferability restrictions help limit mortality on more vulnerable species and to protect fleet segments with particular social value, such as the smallest coastal fishing vessels in vessel group five to other vessel groups. Transfers between groups are allowed during the last three months of the fishing year to insure full exploitation of TAE. Technical measures such as area closures during the spawning periods to protect juveniles and young fish, area restrictions for larger vessels, and mesh size regulations remain in effect. The ITE programme incorporates area closures to protect juveniles, temporarily prohibiting fishing for one to two weeks in areas with small cod, haddock and saithe exceed thirty percent of the catch, other technical measures (minimum mesh size for example), and past banning of new licenses and buyback of licences. Importantly, there is also a unique spatial component: a typical one-day allowance inside 12 nm of the islands is worth 3 days outside of that area to spatially regulate effort to protect inshore stocks, with an exchange rate in days between areas. Fleet structure has remained relatively unchanged, with days transferred from small to large long-line vessels. The TAE is not adjusted downwards for productivity growth or capital accumulation. The initial effort agreed in 1996 was set at a high level, which only prevented the effort exerted increasing but did not actually limit it. Vessels continuously submit their position through VMS except for coastal vessels below 15 GT in group 5, which is through sales receipts.
In Iceland, ITEs were employed alongside and as an alternative to ITQs, and fishing effort continued to expand due to increased capitalization of the fleet (Runolfsson and Anderson, 2002; Pascoe et al. 2002). The Australian Eastern tuna and billfish fishery was previously managed through an input quota system based on individual transferable effort units (the number of hooks) and a total allowable effort level (i.e. total number of hooks) (Pascoe et al. 2010). A spatial management policy based on a series of differential hook-penalties had been proposed as a flexible tool to discourage vessels from operating in certain areas (e.g. those with high bycatch potential) and encourage operating in other areas (e.g. with less bycatch potential). This incentive-based approach to affect the spatial distribution of effort effectively varies the value per hook employed2. These transferable quotas allowed vessels to adjust their fishing activities to minimize their imposed damage. Fishers consume their quota based on where and when they fish, with the penalty system providing incentives to either
2 The hook decrements approach is similar to that of the individual habitat quota (Holland and Schnier, 2006) as spatial management instruments where different effort penalties are applied to different areas based on the level of damage created by fishing in those areas (Pascoe et al., 2010).
43Effort rights-based management
operate in areas where less damage will be incurred, or adopt fishing gear that will have a lower impact. Since 2011, the fishery is managed under TAC for each of five species (albacore, bigeye, yellowfin tunas, broadbill swordfish, and striped marlin) and ITQs.
Days at sea were limited for individual licensed vessels in the U.S. Atlantic sea scallop fishery on 1 March 1994 (Georgiana and Shrader, 2008). The fishery allocated days at sea and special access area trips based on permit categories that are based on historical fishing records and gear type. Amendments to the Scallop Fishery Management Plan initially limited scalloping to 204 days at sea in 1994, to 182 days at sea the next year, to 142 days at sea in 1998, and to 120 days at sea in 1999. Additional restrictions were placed on crew size (to limit on-board shucking and hence catch rates) and gear, and large fishing areas were closed to scallop vessels. Amendment 13 allowed vessels to purchase days at sea from similar vessels. Since 2010 and to limit mortality, individual catch quotas with limited transferability and a limited access days-at-sea vessel permit regulate a general category, which is about five percent of the fishery. The rest of the fishery continues with days at sea coupled with areas that are closed and opened on a rotating basis to maximize yield. When days-at-sea regulated vessels fish outside of allowed areas, their days still contribute toward their total days-at-sea allocation. Access areas are closed to fishing by individual quota vessels when the allocated number of trips to the access area is projected to have been taken3.
All fishing rights in Estonia are based on historic usage principle and are fully transferable (Vetemaa et al., 2002; MRAG et al., 2009; OECD, 2009). The primary management measures are ITQs in the open water fisheries (both Baltic and Atlantic trawling) and gear usage quotas for gillnets and fyke nets in the Baltic coastal and inland fisheries. Because the NAFO distributes some fishing rights in the form of fishing days, fishing day quotas are also used in this segment. All Estonian fishing rights are fully transferable inside the country (i.e. between license owners).
DENOMINATION OF EFFORT AND EFFORT SHARESShares or proportions of the TAE can be allocated as property and use rights, which are subsequently transformed into units of nominal or effective effort after multiplying the share by that period’s TAE, or as an unchanging absolute quantity. There is no difference in the two approaches if the TAE is constant over time. Otherwise, proportional denomination of quota can vary year by year depending upon the TAE. Because TAE does vary in most fisheries over time due to changes in abundance and biological assessments, instability and uncertainty become the issues.
When units of transferable effort are denominated in absolute quantities, such as days or number of traps or hooks, the effort authority must allocate more units of effort when TAE increases and withdraw effort when TAE declines. Over long time periods, the use of market forces to adjust TAE should balance expenses of purchase with receipts from sales for the quota authority (Moloney and Pearse, 1992). However, if the price of quotas is not independent of the quantity caught, the fishery manager faces the problem of accumulating deficits or surpluses: deficits if the quota price is high when TAE is small and surpluses when a small TAE implies a low quota price (Hannesson, 1989). In contrast, proportional denomination does not require direct market intervention by the authority because quota owners may harvest a specified fraction of available TAE.
3 Vessels with an individual catch quota are subject to ownership cap restrictions. The individual catch quota programme includes a provision that allows the owners of individual catch quota scallop vessels to form voluntary sectors that could manage their ownfishing activity as a group. To create a Sector, a group (two or more) of individual quota permit holders must agree to cooperate and submit a binding plan for the management of that Sector’s combined quota allocation.
44 Effort rights in fisheries management – General principles and case studies from around the world
Proportional denomination of quota has two significant disadvantages over absolute quantities (Pearse, 1992). First, it is a less valuable property right because of the increased uncertainty, which may also reduce efficiency gains. Second, although the responsibility for making TAE adjustments is placed on the quota authority, the costs and benefits of adjustments are borne by transferable effort holders, meaning that the risk is transferred from the quota authority to the quota holders.
RIGHTS OF EFFORT AND ACCESSDifferent legal bodies can own the property right, and these bodies can in turn allocate use rights (or “privileges”) to fishing entities4. These use rights can implicitly contain a right of access and explicitly some units of fishing effort or an access right (license) may be issued and required separately. In national programmes, the property right is held by the state and use rights are allocated to individual fishers, firms, or vessels or to groups of vessel owners, sectors, cooperatives, communities, or some other well-defined group such as a tribe, who in turn collectively manage their units of effort. On the high seas, Regional Fishery Management Organizations, a Corporation, or other institutions can conceivably hold property rights and effectively create a form of common property or the rights can be allocated to states that in turn allocate to individual users (Allen et al., 2010). Thus transferable effort programmes can be defined in terms of individual private property (individual transferable effort or ITE) or as group or common property (Ostrom, 1990; Baland and Platteau, 1996).
POTENTIAL ECONOMIC BENEFITS – GAINS IN ECONOMIC EFFICIENCYEconomic benefits can be expected to grow and become more sustainable, in large part through the establishment of property and use rights that reorient economic incentives from those under (regulated) open access – the race to fish – to those that more closely align with economic-ecological objectives embodied in the TAE and resource conservation5. With incompletely defined and enforced property rights, private decision makers do not account for costs that are external to the vessel but nonetheless impact all other vessels in the fishery (i.e. the external costs are not internalised). Furthermore, when fishers own some of the resulting greater economic benefits, they have greater incentives to comply, to police one another, and potentially, invest in the stock (Scott, 2000; Libecap, 2009b.) Economic gains also follow from simply establishing an overall limit to the total allowable effort where before there was not a limit. Gross economic benefits can also grow due to any increased MCS and enforcement accompanying rights-based management.
Economic efficiency gains are potentially possible at both the level of the individual vessel and at the level of the overall industry. These gains have been more extensively evaluated with individual transferable quotas, where the gains are most pronounced at the industry level, whereas transferable effort programmes have yet to receive such an evaluation, and as a consequence, the following discussion is largely conceptual6.
4 The legal body (e.g. state) owns the property right of total allowable effort (e.g. days) and allocates to the fisher rights to use some amount of effort. The resource stock is owned by typically the same legal body and the fisher has a right to the fish, a fugitive resource, they catch through the rule of first possession, according to which the first party to use an unowned resource acquires a claim to it.
5 Transferable effort programmes compared with Individual ITQ and other catch-based forms of rights-based management, such as sector allocations, could conceivably be less likely to provide as much of an incentive because the less complete effort property right less fully militates against the perverse incentives of open access so long as alternative inputs can be purchased at a lower cost per unit of fish caught than buying or leasing units of transferable effort (Grafton and McIlgorm, 2000).
6 See Squires, Allen, and Restrepo (in press) for a comprehensive analysis and literature survey of the economic gains from all forms of rights-based management.
45Effort rights-based management
Nonetheless, some broad generalizations are possible, focusing on:(1) lower overall industry costs through industry rationalization as vessels exit
the fishery;(2) improved product quality, changes in product form, and timing of landings
and extended seasons (so that landings are spread throughout the year rather than flooding the market in a compressed period);
(3) lower operating costs per vessel as lower-cost vessels purchase quota from higher-cost vessels and the latter exit the fishery or reduce their scale of fishing;
(4) cost savings through economies of scale and scope as unit costs decline when vessel fixed costs are spread out over a larger catch and the optimum size of vessels adjusts, and as costs decline through a more efficient catch mix;
(5) increased capacity utilization (that lowers short-run costs for a given capital stock);
(6) the more skilled skippers remaining in the fishery (thereby increasing technical efficiency, which also lowers costs);
(7) potentially lower costs of monitoring, compliance, and surveillance through fewer vessel numbers and vessel owners-skippers with a more committed conservation focus;
(8) equating marginal costs across vessels (the equi-marginal principle); (9) potential induced technical change; (10) the impact upon processors; and (11) the impact upon employment and coastal communities. These effects lower costs and/or raise revenues, thereby increasing profits and
creating capital where there was none before through the capitalized value of the expected rents over the life of the right. We discuss these in turn.
(1) The largest gains in economic efficiency that might be realized through lower costs probably come not from productivity gains at the level of the individual vessel but from the lower industry fixed costs of vessel, insurance, etc., labour, and operation that follow from exit of now superfluous vessels and improved utilization of reduced fishing capacity at the industry level. That is, these gains come from reduced fixed and operating costs from fewer vessels in the fishery.
(2) Another potentially large gain in economic efficiency at the industry level can occur through changes in the timing of landings throughout the year that in turn can lead to higher ex-vessel prices. Transferable effort programmes can potentially increase the value added of fish through spreading harvests out over a longer time period (both through a concomitant increase in season length and allowing vessels greater flexibility in their timing of production) and facilitating shifts in product form such as from frozen to fresh, much as with ITQs in the British Columbia halibut fishery (Grafton et al., 2000). Safety may also improve because producers have more flexibility of where and when to fish and can avoid more dangerous situations.
(3) Through the informal or formal secondary markets that develop, in which transferable effort rights are exchanged, lower cost vessels can purchase effort rights from higher cost vessels and industry overcapacity declines through market forces as vessels exit the fishery and overall effort matches the TAE, all factors that lower harvest costs (this topic is discussed in greater detail below in a separate section). Moreover, when fishers receive a share of the catch instead of a fixed wage this system will fall somewhat short of full optimality, but still be a great improvement over open access (Hannesson, 2000).
46 Effort rights in fisheries management – General principles and case studies from around the world
(4) Transferable effort also provides incentives for vessels to efficiently utilize available multiproduct economies of scale in production7. If there are increasing returns to scale in the fishery and the firm’s effort holdings are insufficient for a vessel of an optimal size, it could either purchase additional effort rights from other firms that desire to exit the fishery or sell its effort to some other firm that intends to increase its effort holdings for a vessel of an appropriate size. The impact upon economies of scope (costs savings from catch mix) is less clear, and depends upon the change in species mix through timing and area fished.
(5) Rights-based management has the potential to reduce fishing capacity and thereby increase capacity utilization for the remaining vessels8. Vessels can adjust their rates of capacity utilization to a more cost or profit-efficient level. When groups hold effort rights, lower-cost vessels can cease fishing and share in the profits, so that economies are realized within the group institution rather than through the market institution.
(6) Vessel exit is likely to leave the remaining vessels skippered by the most capable, which in turn can be expected to increase revenues and/or reduce costs. Technical efficiencies may correspondingly be realised.
(7) Potential cost savings are possible if transferable effort programmes lead to lower-cost monitoring, control, surveillance, and enforcement than alternative management approaches. These cost savings can come through fewer vessel numbers and greater commitment to the regulatory system and to conservation from the remaining vessel owners-skippers.
(8) Rights-based management is more cost-effective than traditional command-and-control fisheries regulation that relies on quotas, time and area closures, etc. This cost-effectiveness comes because it allows vessel participation and activity of participating vessels to adjust so that their marginal costs of harvesting equalize. Thus, lower-cost vessels tend to acquire rights and higher-cost vessels tend to reduce their holdings of rights or even exit the fishery altogether, until in principle the marginal costs of harvesting equalize, giving the least-cost equilibrium for the given TAE.
(9) The impact of effort rights-based management upon disembodied and embodied technological change is unknown9. Some technological progress through learning-by-doing and learning-by-using can be expected as skippers and crews learn how to better exploit the new conditions. The impact of a switch to an effort rights-based management regime upon technological change that is embodied in the capital stock (embodied technological change or investment-specific technical change) is unknown.
(10) Rights-based management can help provide sustainable and more stable sources of raw material to processors. After initial allocation, rights can provide the industry with stability and ability to adjust quota holdings, so allowing both fishers and processors to make better operational decisions and investments. Rights- based management can also insure stable, year-
7 Increasing (decreasing) returns to scale occur when unit costs of production decline (rise) with higher production levels.
8 In the short run, capacity utilization may drop with the reduced availability of days. Only with vessels exiting the fishery over the longer run will the capacity utilization rise.
9 Embodied technological change occurs when the technological progress is embodied in one of the inputs, usually the capital stock, such as advances in gear and electronics. Disembodied technological change occurs as captain and crew learn how to use the inputs now embodied with technological progress and through on-going learning how to fish more effectively, etc.
47Effort rights-based management
round employment at sustainable levels because measures such as time and area closures are no longer necessary except for factors such as protection of spawning.
(11) Reduced employment and other adjustment costs following the introduction of rights-based management can be an important concern. The impact on employment depends on the extent to which the fishery initially faces overcapacity and overexploitation (Grafton et al., 2006). When rights reduce employment, as might be expected in fisheries characterized by poor returns and overcapacity, the adjustment costs should be weighed against the possibility of declining returns, ongoing problems with traditional input controls, and the probability that current employment levels under existing regulations are unsustainable (Grafton et al., 2006). The evidence points to fewer vessels and crewmembers, but with these remaining vessels and crew fishing longer than before.
INDUSTRY EXIT AND FLEET RESTRUCTURINGCompared with ITQ programmes, it is not known whether transferable effort programmes induce less industry exit and instead allow more vessels to remain in the industry, albeit at lower profitability. Effort rights without accompanying catch limits on individual vessels may not constrain production as much as ITQs, and especially not on the most profitable species. The presence of sunk costs that allow vessels to more readily continue operation (Vestergaard et al., 2005) and the absence of capitalization of profits into catch rights (and instead into days and likely more remaining in capital stock). Overall effort may, or may not, remain higher and profitability lower in fisheries regulated by transferable effort compared with ITQs. Little evidence is available in the empirical record to shed light on ITE programmes’ inducement of capacity reduction, but several of the programmes have been accompanied by vessel buybacks.
Accommodating new entrants into national and international ITE fisheries invariably becomes a sticky issue. New entrants can purchase units of effort through secondary markets for the rights, providing a decentralized market institution that replaces a centralized bureaucratic institution (the fishery authority) for entry. Other options for new entrants are also possible, such as through limiting the duration of rights, whereby each year every rights holder returns a small proportion of their current right to a central authority such as a Regional Fishery Management Organization for re-distribution (Butterworth and Penny, 2004). In effect, a tax in kind rather than by value is levied on rights holders and used to finance new entrants. A tax by value, either an annual license fee or a landings tax, performs an equivalent function and can be used to subsidize targeted new entrants entry through purchases of rights in the secondary market, such as Small Island Developing States in international tuna fisheries.
Economic rents are capitalized into the price of effort rights, where the more successful the transferable effort programme and the longer the duration of the right, the larger the economic benefits that are capitalized. The value of a transferable effort right that is valid forever is equal to the present value of the difference between revenues and costs in all future years, and can be expected to rise or fall over time as economic and biological conditions improve or decline. In a competitive secondary market for quotas, the market price for a right of a comparable lifetime might come close to reflecting this value.
TRANSFERABLE EFFORT AND LICENSE LIMITATIONBoth transferable catch and effort quota programmes unaccompanied by license limitation programmes can generate incentives and pressures to increase the TAC or TAE. Should vessels purchase days to enter the fishery but the number of days is
48 Effort rights in fisheries management – General principles and case studies from around the world
insufficient for profitability due to an excessive number of vessels, pressures can be generated to increase the TAE or to multiply the actual fishing time of a unit of effort. As such, transferable effort programmes that retain limited entry (license limitation) programmes as a concomitant policy instrument can buttress against expansions in the TAE and subsequent expansions in fishing capacity. To some extent, and especially with small numbers of homogeneous participants (and even more so if participants live near the resource), stewardship and conservation social norms develop that can yield counter-veiling pressures and greater self-enforcement (and enforcement through social processes) to reduce the TAE as evidenced in the New Zealand ITQ programme (Baland and Platteau, 1996; 2005, Ostrom 1990, Scott 2000, 2008).
MONOPOLY PRICING AND MARKET POWEREffort rights are can be allocated without charge, but they can also be sold in a market. When the state is the single seller of the right, it has a monopoly and can exercise market power and mark-up pricing if it wishes. A substantial share of market power profits derive from transfers of consumer surplus and producer surplus from vessels and other producers throughout the value chain. When the sellers are a small group, this group is an oligopoly that also has market power. This section examines such a situation where there are many buyers and a single seller, which can potentially occur with the Falklands-Malvinas Illex (Illex argentinus) squid by a jigger fleet from Asian countries and the PNA Vessel Day Scheme, and in general could be applied by a coastal state with foreign fishing agreements10.
Economic benefits can be measured by the consumer surplus triangle in the market (such as the secondary market for vessel days) or in an initial market for rights for an input essential in production (Just, Hueth, and Schmitz, 2005)11,12,13,14. We note that budgetary outlays (i.e. the cost to vessels) for effort do not equal the economic opportunity costs when these outlays cause a change in consumer or producer surplus in the market for effort when the effort price changes, meaning that the private or financial cost to vessels does not equal the economic cost to society under these circumstances. We also note that the value of the marginal product of effort quota is the difference between the market price and marginal cost. This difference represents the rent to which an additional pound of effort quota entitles a vessel.
10 It might be argued that the PNA Vessel Day Scheme is either an oligopoly or a monopolistic competition situation, where for the latter there are a reasonable number of sellers with some product differentiation, where this differentiation occurs because a day of effort is not uniform in all fishing grounds(i.e. some grounds are more productive than others).
11 Consumer surplus is the area under a demand curve and above the price line and corresponds to quasi-rent or profit from the fishery. This is consumer surplus in the sense that vessels are consumers of vessel days, but to avoid confusion, we use the term producer benefit. Moreover, we use producer benefit rather than quasi-rent, economic rent, profit, or producer surplus with the derived demand (marginal revenue product) curve and vessel days, although if vessel days accurately captures effort, and effort in turn is the only variable input and an essential input, then producer benefit is quasi-rent. This surplus includes both the returns to capital and economic rent to the resource stocks.
12 As long as an input is essential to production, an exact measure of producer welfare is given by the consumer surplus in the input market, with equivalent and compensating production equal to one another (Just Hueth Schmitz, 2005). When the derived demand curve for vessel days is general equilibrium, the benefits include all producer and consumer benefits throughout the value chain, including those of the final consumer.
13 We assume a competitive secondary market that clears (no minimum or maximum prices are imposed) without transactions and information costs and the absence of distortions due to taxes, subsidies, vessel-level quotas or other quantitative restrictions, or foreign exchange or trade distortions (which would require shadow pricing). For simplicity, we also assume linear demand and supply curves.
14 An input is essential if the vessel or firm is unable to produce positive amounts of output without the input in question(i.e. production requires positive use of the input). If the input under consideration is not essential, then the vessel can simply switch to some other input and the producer benefit cannot be completely recovered.
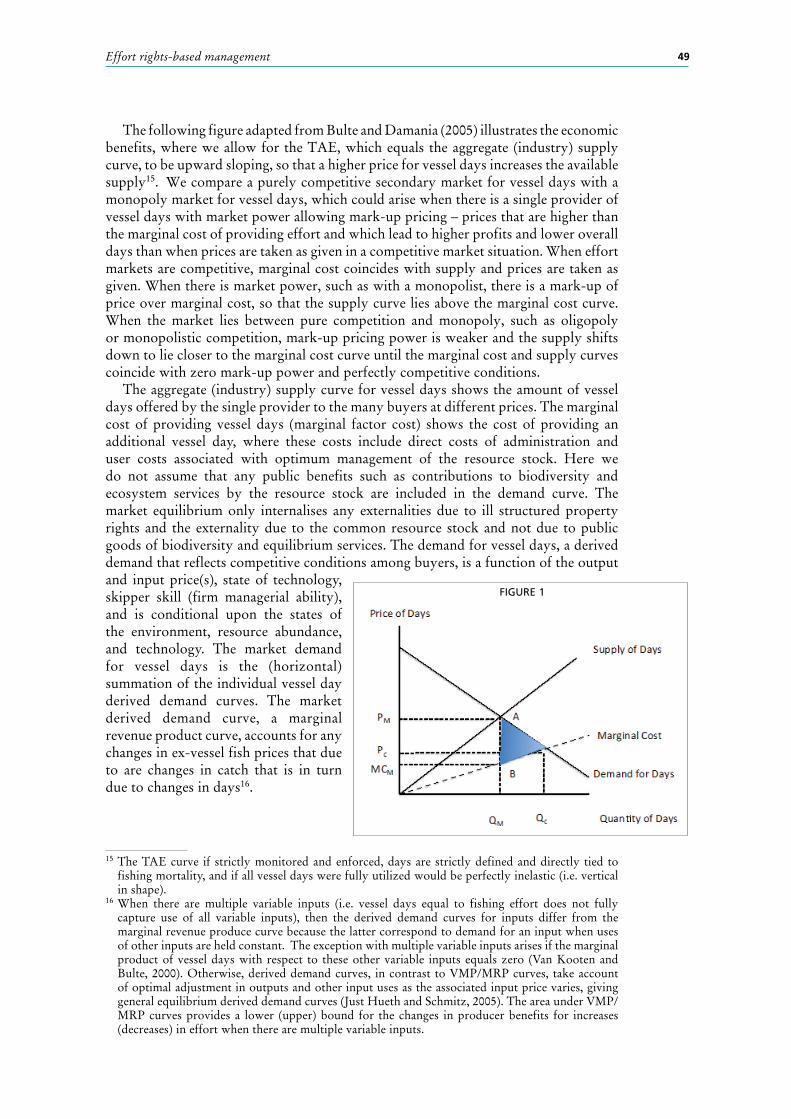
49Effort rights-based management
The following figure adapted from Bulte and Damania (2005) illustrates the economic benefits, where we allow for the TAE, which equals the aggregate (industry) supply curve, to be upward sloping, so that a higher price for vessel days increases the available supply15. We compare a purely competitive secondary market for vessel days with a monopoly market for vessel days, which could arise when there is a single provider of vessel days with market power allowing mark-up pricing – prices that are higher than the marginal cost of providing effort and which lead to higher profits and lower overall days than when prices are taken as given in a competitive market situation. When effort markets are competitive, marginal cost coincides with supply and prices are taken as given. When there is market power, such as with a monopolist, there is a mark-up of price over marginal cost, so that the supply curve lies above the marginal cost curve. When the market lies between pure competition and monopoly, such as oligopoly or monopolistic competition, mark-up pricing power is weaker and the supply shifts down to lie closer to the marginal cost curve until the marginal cost and supply curves coincide with zero mark-up power and perfectly competitive conditions.
The aggregate (industry) supply curve for vessel days shows the amount of vessel days offered by the single provider to the many buyers at different prices. The marginal cost of providing vessel days (marginal factor cost) shows the cost of providing an additional vessel day, where these costs include direct costs of administration and user costs associated with optimum management of the resource stock. Here we do not assume that any public benefits such as contributions to biodiversity and ecosystem services by the resource stock are included in the demand curve. The market equilibrium only internalises any externalities due to ill structured property rights and the externality due to the common resource stock and not due to public goods of biodiversity and equilibrium services. The demand for vessel days, a derived demand that reflects competitive conditions among buyers, is a function of the output and input price(s), state of technology, skipper skill (firm managerial ability), and is conditional upon the states of the environment, resource abundance, and technology. The market demand for vessel days is the (horizontal) summation of the individual vessel day derived demand curves. The market derived demand curve, a marginal revenue product curve, accounts for any changes in ex-vessel fish prices that due to are changes in catch that is in turn due to changes in days16.
15 The TAE curve if strictly monitored and enforced, days are strictly defined and directly tied to fishing mortality, and if all vessel days were fully utilized would be perfectly inelastic (i.e. vertical in shape).
16 When there are multiple variable inputs (i.e. vessel days equal to fishing effort does not fully capture use of all variable inputs), then the derived demand curves for inputs differ from the marginal revenue produce curve because the latter correspond to demand for an input when uses of other inputs are held constant. The exception with multiple variable inputs arises if the marginal product of vessel days with respect to these other variable inputs equals zero (Van Kooten and Bulte, 2000). Otherwise, derived demand curves, in contrast to VMP/MRP curves, take account of optimal adjustment in outputs and other input uses as the associated input price varies, giving general equilibrium derived demand curves (Just Hueth and Schmitz, 2005). The area under VMP/MRP curves provides a lower (upper) bound for the changes in producer benefits for increases (decreases) in effort when there are multiple variable inputs.
FIGURE 1
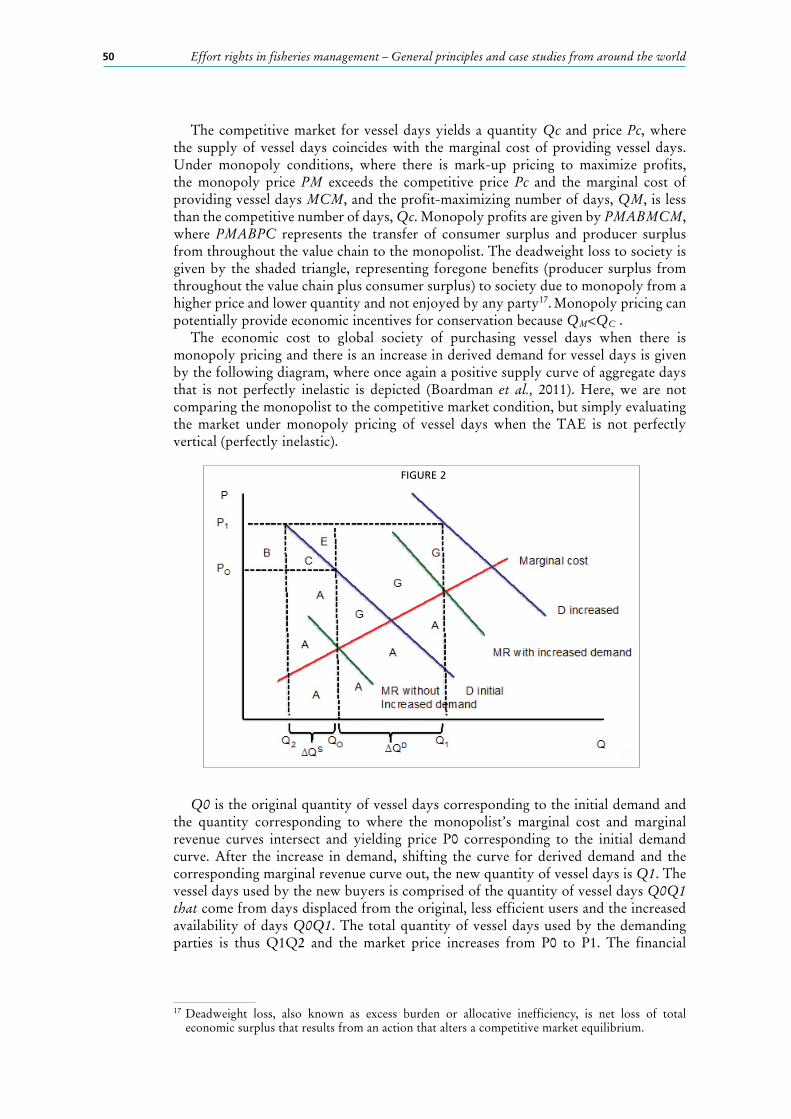
50 Effort rights in fisheries management – General principles and case studies from around the world
The competitive market for vessel days yields a quantity Qc and price Pc, where the supply of vessel days coincides with the marginal cost of providing vessel days. Under monopoly conditions, where there is mark-up pricing to maximize profits, the monopoly price PM exceeds the competitive price Pc and the marginal cost of providing vessel days MCM, and the profit-maximizing number of days, QM, is less than the competitive number of days, Qc. Monopoly profits are given by PMABMCM, where PMABPC represents the transfer of consumer surplus and producer surplus from throughout the value chain to the monopolist. The deadweight loss to society is given by the shaded triangle, representing foregone benefits (producer surplus from throughout the value chain plus consumer surplus) to society due to monopoly from a higher price and lower quantity and not enjoyed by any party17. Monopoly pricing can potentially provide economic incentives for conservation because QM<QC .
The economic cost to global society of purchasing vessel days when there is monopoly pricing and there is an increase in derived demand for vessel days is given by the following diagram, where once again a positive supply curve of aggregate days that is not perfectly inelastic is depicted (Boardman et al., 2011). Here, we are not comparing the monopolist to the competitive market condition, but simply evaluating the market under monopoly pricing of vessel days when the TAE is not perfectly vertical (perfectly inelastic).
Q0 is the original quantity of vessel days corresponding to the initial demand and the quantity corresponding to where the monopolist’s marginal cost and marginal revenue curves intersect and yielding price P0 corresponding to the initial demand curve. After the increase in demand, shifting the curve for derived demand and the corresponding marginal revenue curve out, the new quantity of vessel days is Q1. The vessel days used by the new buyers is comprised of the quantity of vessel days Q0Q1 that come from days displaced from the original, less efficient users and the increased availability of days Q0Q1. The total quantity of vessel days used by the demanding parties is thus Q1Q2 and the market price increases from P0 to P1. The financial
17 Deadweight loss, also known as excess burden or allocative inefficiency, is net loss of total economic surplus that results from an action that alters a competitive market equilibrium.
FIGURE 2
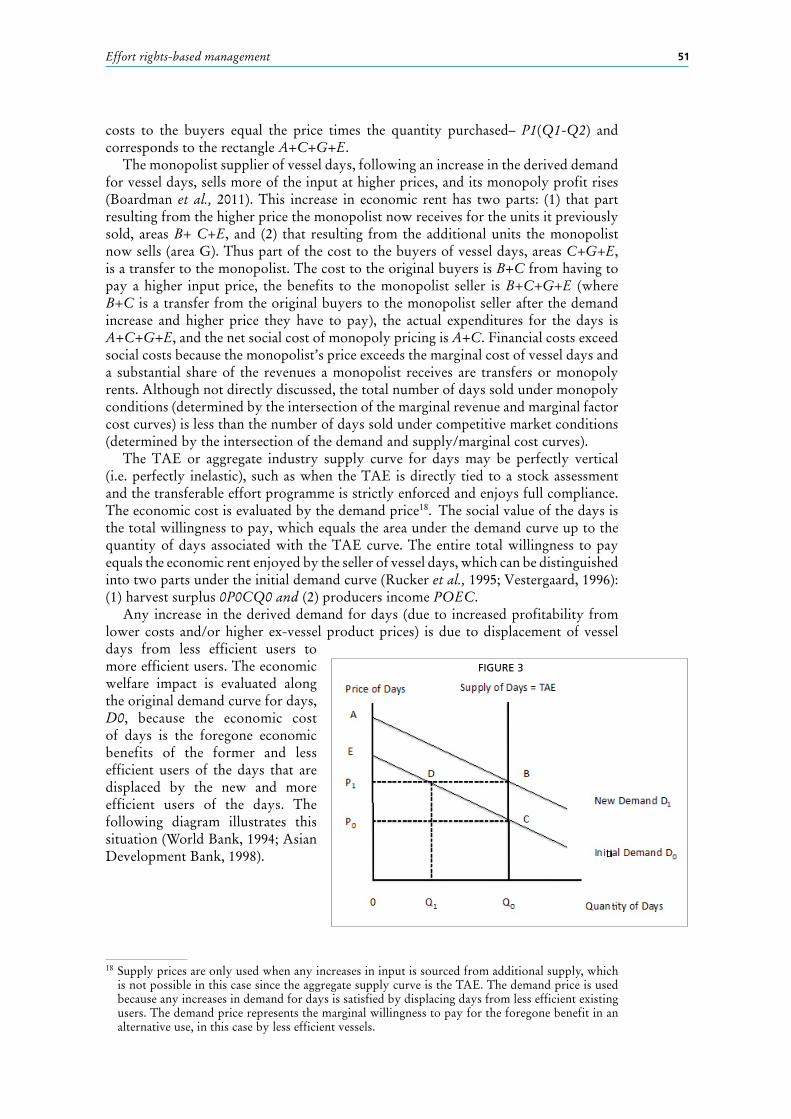
51Effort rights-based management
costs to the buyers equal the price times the quantity purchased– P1(Q1-Q2) and corresponds to the rectangle A+C+G+E.
The monopolist supplier of vessel days, following an increase in the derived demand for vessel days, sells more of the input at higher prices, and its monopoly profit rises (Boardman et al., 2011). This increase in economic rent has two parts: (1) that part resulting from the higher price the monopolist now receives for the units it previously sold, areas B+ C+E, and (2) that resulting from the additional units the monopolist now sells (area G). Thus part of the cost to the buyers of vessel days, areas C+G+E, is a transfer to the monopolist. The cost to the original buyers is B+C from having to pay a higher input price, the benefits to the monopolist seller is B+C+G+E (where B+C is a transfer from the original buyers to the monopolist seller after the demand increase and higher price they have to pay), the actual expenditures for the days is A+C+G+E, and the net social cost of monopoly pricing is A+C. Financial costs exceed social costs because the monopolist’s price exceeds the marginal cost of vessel days and a substantial share of the revenues a monopolist receives are transfers or monopoly rents. Although not directly discussed, the total number of days sold under monopoly conditions (determined by the intersection of the marginal revenue and marginal factor cost curves) is less than the number of days sold under competitive market conditions (determined by the intersection of the demand and supply/marginal cost curves).
The TAE or aggregate industry supply curve for days may be perfectly vertical (i.e. perfectly inelastic), such as when the TAE is directly tied to a stock assessment and the transferable effort programme is strictly enforced and enjoys full compliance. The economic cost is evaluated by the demand price18. The social value of the days is the total willingness to pay, which equals the area under the demand curve up to the quantity of days associated with the TAE curve. The entire total willingness to pay equals the economic rent enjoyed by the seller of vessel days, which can be distinguished into two parts under the initial demand curve (Rucker et al., 1995; Vestergaard, 1996): (1) harvest surplus 0P0CQ0 and (2) producers income POEC.
Any increase in the derived demand for days (due to increased profitability from lower costs and/or higher ex-vessel product prices) is due to displacement of vessel days from less efficient users to more efficient users. The economic welfare impact is evaluated along the original demand curve for days, D0, because the economic cost of days is the foregone economic benefits of the former and less efficient users of the days that are displaced by the new and more efficient users of the days. The following diagram illustrates this situation (World Bank, 1994; Asian Development Bank, 1998).
18 Supply prices are only used when any increases in input is sourced from additional supply, which is not possible in this case since the aggregate supply curve is the TAE. The demand price is used because any increases in demand for days is satisfied by displacing days from less efficient existing users. The demand price represents the marginal willingness to pay for the foregone benefit in an alternative use, in this case by less efficient vessels.
FIGURE 3
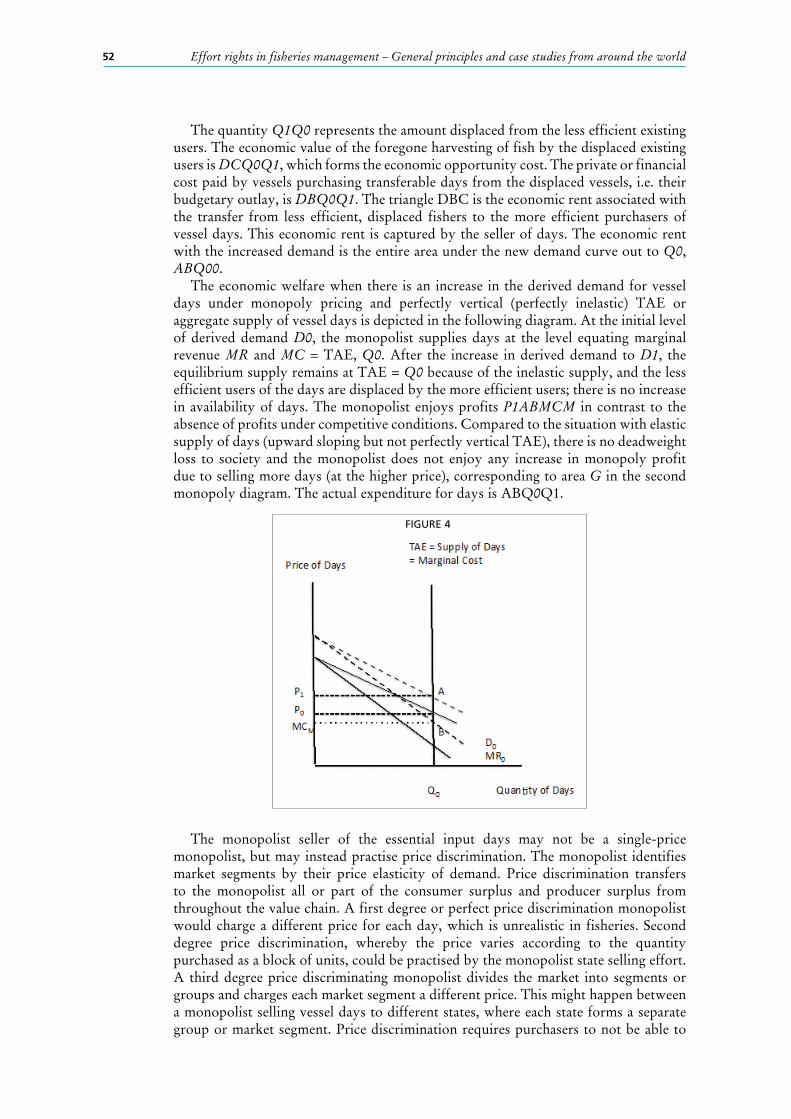
52 Effort rights in fisheries management – General principles and case studies from around the world
The quantity Q1Q0 represents the amount displaced from the less efficient existing users. The economic value of the foregone harvesting of fish by the displaced existing users is DCQ0Q1, which forms the economic opportunity cost. The private or financial cost paid by vessels purchasing transferable days from the displaced vessels, i.e. their budgetary outlay, is DBQ0Q1. The triangle DBC is the economic rent associated with the transfer from less efficient, displaced fishers to the more efficient purchasers of vessel days. This economic rent is captured by the seller of days. The economic rent with the increased demand is the entire area under the new demand curve out to Q0, ABQ00.
The economic welfare when there is an increase in the derived demand for vessel days under monopoly pricing and perfectly vertical (perfectly inelastic) TAE or aggregate supply of vessel days is depicted in the following diagram. At the initial level of derived demand D0, the monopolist supplies days at the level equating marginal revenue MR and MC = TAE, Q0. After the increase in derived demand to D1, the equilibrium supply remains at TAE = Q0 because of the inelastic supply, and the less efficient users of the days are displaced by the more efficient users; there is no increase in availability of days. The monopolist enjoys profits P1ABMCM in contrast to the absence of profits under competitive conditions. Compared to the situation with elastic supply of days (upward sloping but not perfectly vertical TAE), there is no deadweight loss to society and the monopolist does not enjoy any increase in monopoly profit due to selling more days (at the higher price), corresponding to area G in the second monopoly diagram. The actual expenditure for days is ABQ0Q1.
The monopolist seller of the essential input days may not be a single-price monopolist, but may instead practise price discrimination. The monopolist identifies market segments by their price elasticity of demand. Price discrimination transfers to the monopolist all or part of the consumer surplus and producer surplus from throughout the value chain. A first degree or perfect price discrimination monopolist would charge a different price for each day, which is unrealistic in fisheries. Second degree price discrimination, whereby the price varies according to the quantity purchased as a block of units, could be practised by the monopolist state selling effort. A third degree price discriminating monopolist divides the market into segments or groups and charges each market segment a different price. This might happen between a monopolist selling vessel days to different states, where each state forms a separate group or market segment. Price discrimination requires purchasers to not be able to
FIGURE 4
53Effort rights-based management
resale (arbitrage) Price discrimination is ineffective if trade among groups is possible because those buyers that would be charged a higher price could simply purchase the good from those who purchased it at a lower price. The inability of purchasing states to resale effort is clearly the case with price discrimination over effort, where states have purchased effort from a monopolist state providing the vessel days and the purchasing states cannot freely resale the effort to another state.
Sellers of vessel days can also charge a two-part tariff. A two-part tariff is another form of price discrimination in which the price is comprised of two parts – a lump sum fee and a per-unit charge. The average price paid decreases as more units are purchased, so that larger buyers pay less per unit than smaller buyers. The fixed fee represents a fixed cost for the buyer who trades according to a two-part tariff. The fixed fee does not determine how many units the buyer will purchase, but only whether the buyer will enter into this trading transaction or not. The volume purchased will depend only on the marginal price (charge). These two features of a two-part tariff represent the main reasons why such a pricing arrangement can be used.
Here, the seller of effort charges an initial fee, such as a license fee, and then a secondary fee, for use of the input, here effort or vessel days. This pricing strategy under an oligopolistic or monopolistic competitive industry structure shifts the derived demand curve for vessel days outward or to the right, because after paying for the license it is cheaper to purchase days than to shift to another seller and pay for both the license fee and the days.
Under a more general multi-part tariff, the charge for each additional unit would be allowed to change according to the number of units purchased, such as with second degree price discrimination, with the marginal price being constant for a range of units and increasing or decreasing when a larger quantity of units are purchased. Under an even more general non-linear pricing scheme, such as first-degree price discrimination, the marginal price could be continuously changing for each unit purchased.
To summarize the various situations and figures, monopoly sales and pricing of days leads to a market price that is higher than a competitive market price and a quantity that is less than a competitive market quantity when the TAE is partially elastic (not perfectly vertical). The monopolist receives monopoly profit through the mark-up pricing and global economic welfare is reduced through deadweight losses. Subsidies to the parties that demand vessel days increases the demand for vessel days, and under monopoly pricing, the part of the subsidy is transferred to the monopolist through the existing users of vessel days having to pay a higher price for their existing vessel days.
EVALUATING TRANSFERABLE EFFORT PROGRAMMES FROM THE PROPERTY RIGHTS PERSPECTIVEProperty rights can be characterized along six dimensions: universality, exclusivity, duration, flexibility, quality of title, transferability, and divisibility (Scott, 2008).Universality refers to all resources or assets are privately or collectively owned and all entitlements must be completely specified and effectively enforced. Exclusive use of the resource by an individual, group, or state, also means excluding others from using or benefiting from the resource. Exclusivity may include the right of access and enjoyment, the right of withdrawal, and the right to prevent interference. Duration is the length of time the right’s powers or “ownership” may be held. Divisibility indicates the ability of the holder of the right to divide up the environmental asset or the flow of benefits from the asset into smaller amounts. Quality of title (security) represents how well the property right is specified, and includes the notion of possession and ownership (de facto and de jure). It refers to the extent that the right is recognized in law, such as a title or certificate of ownership. It refers to the certainty, security, and enforceability of the property right. Transferability refers to the ease of transferring ownership or use of the right from one party to another through selling, leasing, renting, or trading.
54 Effort rights in fisheries management – General principles and case studies from around the world
Transferability facilitates increases in economic efficiency and flexibility to adjust to changing circumstances. Rights are said to be flexible when they readily accommodate or adapt to a changing world, including climate, ecosystems, markets, and economic systems in general. Rights should allow adaptability of user groups for economic and social benefits and sustainable resource use. Excessive rigidity of the right can lower economic efficiency or limit the accommodation of the fishery sector.
The stronger a property right fulfils a characteristic, the more well-structured is the property right (Ridgeway and Schmidt, 2010). In general, the stronger a right is on all of the characteristics, the more the right might be expected to deliver conservation outcomes and economic returns more efficiently. Rights in practice vary in their strength of characteristics through attenuation to gain social control over markets.
EXCLUSIVITYExclusive use is provided for the units of effort held. Transferability of effort can face few limitations, as in the Hawaiian programme, or can be more attenuated as with the VDS of the PNA. Duration of use can range from limited periods of time to perpetuity, with a single year’s duration for the Hawaiian programme, and in the Western and Central Pacific Ocean (WCPO) rights are also limited in duration to one year. Divisibility can be finely structured down to a single day or even smaller units of time or individual units of gear, such as traps or pots, although questions of MCS come into play. Quality of title and security are similar to ITQs.
TRANSFERABILITYTransferability of effort can help reduce overcapacity and restructure industry to more closely align with a profitable fishery. Transferability potentially allows more economically efficient vessels to purchase units of effort from less economically efficient vessels, thereby increasing the overall net economic benefits in the fishery. For example, the transfer of fishing day rights between companies made it possible to reduce the Spanish “300 Fleet” from 350 to less than 200 vessels over 100 GRT (OECD, 2003), where the right is attenuated to allow a maximum of 315 fishing days and a minimum of 210 days per year (days are kw-days) (Garza-Gil and Varela-Lafuente, 2008). Transferability also helps vessels to find and use their optimum scale of production. Transferability, in principle, potentially allows fishing industries to restructure and reduce fishing capacity through market forces, with less efficient vessels exiting the fishery. In fisheries with low or even negative profitability, transferability facilitates vessel exit because they can exit without losing everything (Harte and Barton, 2007).Vessels can also pool vessel days to allow a single vessel to fish and distribute the proceeds. In some instances, vessel buybacks have been implemented either prior or after the introduction of rights-based management to either facilitate the transition to rights-based management or to facilitate further reductions in capacity (Curtis and Squires, 2007; Squires, 2010). However, industry restructuring is hampered if vessel groups allocated units of transferable effort are limited in numbers within a group, so that there is limited scope for trade, or if the TAE is set so high that each vessel receives enough effort to continue fishing if not becoming profitable; a factor weighing in is the opportunity cost or alternative if a vessel sells all of its effort and there are no employment alternatives for members of the owner’s family or crew. Transferability in a very general sense allows fishing industries the flexibility to adapt and adjust to changing circumstances as they occur. As discussed above, transferability provides an orderly means of entry into the fishery through purchase of effort rights in primary or secondary markets for effort rights.
Transferability includes outright sale of the use right or leases as well as leasing, renting, bartering, or loaning the right for various lengths of time. Leasing raises issues of its own (Pinkerton and Edwards, 2009). Sale and leasing can be attenuated
55Effort rights-based management
by restrictions that determine eligibility and duration of transfer and provide social control over the market by constraining who has standing, such as preventing absentee owners in favour of active owner-operators, limits on concentration of ownership and operatorship, preservation or creation of socially desired geographic structures, preferential access by current crew members, desired vessel-gear categories, and so forth.
Transferability, including stacking or consolidation of effort on fewer vessels by the same owner, raises the issue of effort standardization (which is discussed elsewhere in the paper, Section 5.6).
DURATIONThe duration of rights can range from comparatively short periods of time to perpetuity, where duration of a sufficient number of years supports investments and allows fishers to not only recoup their investment costs but to make an expected rate of return. The duration of effort rights can be staggered to allow flexibility of new entrants. For example, in Chile, ITQs were initially allocated according to historical fishing performance. But each year 10 percent of quota is recovered from firms and is sold at auction. Namibia’s allocation system included elements designed to achieve socio-political goals, such as increased domestic ownership, as well economic efficiency. In Sweden, the duration of rights extends up to five years (OECD, 2006). Rights of relatively short duration generate economic incentives to focus on maximizing short-term profits by catch as much fish as possible, rather than focusing on longer-term value-added activities such as product development and marketing (Harte and Barton, 2002a).
QUALITY OF TITLE (SECURITY)Quality of title (security) increases under transferable effort programmes compared with (regulated) open access, but is lower than ITQ programmes. This follows because a unit of transferable effort only represents a share of days, hooks, or other unit of effort in the fishery that can be used to catch fish while an ITQ represents a share of the allowable harvest independent of the relationship between catch and effort. Because the property right is not fully specified, an incentive exists to under-report fishing effort used (Nielsen et al., 2006). Greater security can lead to more investment in research and development and diversification into processing because greater security (coupled with sufficient duration) allows firms to benefit from investments that have longer-term pay-off periods (Harte and Barton 2007a).
DIVISIBILITYDivisibility is more complicated than with catch quota rights based management. Effort, when specified as time, is often denominated in vessel or fishing days, to facilitate MCS. Total time absent from port can be readily monitored or electronic vessel monitoring systems can similarly track time spent out of port. In principle shorter periods of time, such as the 4 to 6 hours to set on a floating aggregator device, are possible but MCS issues arise.
FLEXIBILITYFlexibility in this context accounts for the degree to which the holder of rights to units of effort can utilize that effort in a manner which best achieves the holder’s private use objectives. In this sense, by alleviating the race to fish ITE holders can adjust their rates of fishing capacity utilization to more cost or profit-efficient levels. As discussed above, greater flexibility in the timing of production can potentially increase the value added to landings through a more consistent supply and improvements in product
56 Effort rights in fisheries management – General principles and case studies from around the world
quality and diversity. More flexibility in terms of where and when to fish and can also reduce risk associated with potentially dangerous operating situations posed by the race to fish.
UNIVERSALITYUniversality refers to the limitations and obligations over the use of the rights not covered by the other characteristics. More specifically, transferable catch quotas are a stronger and better defined form of property right than effort due to the problems of defining the unobserved composite input effort and the opportunity for input substitution, investment, and technical progress that continuously changes the balance between nominal and effective effort. In contrast, a kg or ton of a species of fish is clearly defined under the universality characteristic of property rights.
EVALUATING TRANSFERABLE EFFORT PROGRAMMES FROM THE VESSEL (FIRM) PERSPECTIVE WHAT IS EFFORT?Transferable effort programmes are based on a composite input, fishing effort, that is (to an economist) ambiguous, difficult to measure, and potentially has a nonlinear and perhaps stochastic and discontinuous relationship with catch (which is further complicated in multispecies and multigear fisheries). Hence, we first turn to a brief review of fishing effort.
The fisheries literature distinguishes between nominal and effective effort (Cunningham and Whitmarsh, 1980; Maunder and Punt, 2004; McCluskey and Lewison, 2008). Nominal effort refers to the economic inputs devoted to fishing measured in either physical or economic value. Effective effort can refer to fishing mortality, i.e. the biomass of fish extracted by fishing expressed as a proportion of the mean population size (Cunningham and Whitmarsh, 1980). Effective effort can also refer to standardized effort, which defines the efficiency of a fishing vessel as its “fishing power” relative to that of a standard vessel and to thereby account for such as differences in skipper skill or technological differences among vessels or fleets (Maudner and Punt, 2004; McCluskey and Lewison, 2008). A standard equation representing fishing effort is F = qf, where F denotes fishing mortality, f is nominal fishing effort, and q denotes the catchability coefficient. Important but largely unanswered questions are how to create a composite index for f or find a suitable proxy variable for f and how to best measure the index or proxy for f.
Nominal effort is typically defined in one of three ways: (1) as the stock of physical capital (‘capacity’); (2) time or activity that the vessel operates; or (3), capital services or the product of the capital stock and the time it is in service. Capital services are measured in units corresponding to the stock of capital of concern, such as vessel numbers or kilowatt for engine power), giving vessel-days, kilowatt-days (kw-days), GT-days, trap-days, hook-days, etc. Denominating effort as capital services should provide a more accurate measure than simply a measure of time (activity) or a measure of capital stock, because it contains more information. (Capital stock does not allow for variations in its utilization/activity and utilization/activity does not allow for variations productivity of capital stock, and neither approach accounts for all other inputs.)
Because effort is actually an unobserved composite of all inputs, issues arise as to how to aggregate the inputs into the composite, how to address the effects of technical change on effort, and how well and under what conditions the conventional measures of effort represent the theoretical construct. This in turn raises the issue of separability, aggregation, and economic index numbers, to which we now turn.
57Effort rights-based management
Effort as a Composite Input: SeparabilityNominal fishing effort can be viewed as an unobserved composite of all economic inputs (in fact, it is simply an intellectual construct), and thus is a separable intermediate output in a two-stage production process, where in the first stage of production inputs are combined to create a composite input, fishing effort, and in the second stage of production the composite index fishing effort is applied to the resource stock to produce a flow of output or catch (Hannesson, 1983; Squires, 1987). This economics definition is more comprehensive than the fisheries definition of nominal or effective effort, because it considers all economic inputs and accounts for the states of the environment, technology, and technical efficiency as well as stocks and flows (utilization) of inputs. (This paper abstracts from the form of the aggregator function, i.e. of the function that aggregates all inputs into the composite input, effort; see Squires, 1987 for a discussion.) The Leontief-Sono separability principles for a consistent composite input index are complex and not easily satisfied (Squires, 1987)19.
Effort and its aggregation into total effort in a fishery must therefore be regarded as approximate, or as applying in exact form only under exceptional circumstances.
Nominal fishing effort can also be viewed as the result of Leontief aggregation, in which all inputs remain in fixed proportions, allowing formation of an aggregate input represented by either the capital stock (‘capacity’) or time or activity20.
Assuming an aggregate production function with fixed technological coefficients: Y = g(q, K, X, S) = qmin {AK, BX} S, where Y denotes catch, K is the capital stock, X denotes the variable inputs (sometimes called effort itself in the fisheries literature) and captured by time such as days, S is the resource stock, q is the catchability coefficient, and A and B are the fixed coefficients. Under this technology, producing a unit of output requires 1/A units of capital and 1/B units of variable inputs; if either input falls short of this minimum requirement, there is no way to compensate by substituting the other input (Aghion and Howitt, 2009). With a fixed-coefficient technology, there will be either surplus capital or surplus variable inputs (time or days), depending on whether the given supply of capital exceeds or is less than (B/A) times the exogenous variable inputs (time or days). When AK<BX, capital is the limiting factor and firms will produce the amount Y = qAKS and employ the amount (1/B)Y = (1/B) AK < X of variable inputs. Of course, there is no substitution between capital and the variable inputs. Should a point be reached at which capital stock is no longer the limiting factor in the production function (i.e. K/X eventually exceeds the limit B/A above which variable inputs become the limiting factor), then the production function becomes Y = qBXS and harvest occurs at the same rate as X.
Aggregation of Effort from Vessels to FleetIn principle, even if these separability conditions were somehow satisfied to form a consistent composite input effort variable for an individual vessel, there is no guarantee that an aggregate effort variable and an aggregate harvest function (aggregated over all vessels) exists for the entire fishing industry. Further conditions are required for
19 A consistent composite effort index requires weak homothetic input separability, so that the level sets or isoquants of the inputs comprising effort are invariant to changes in outputs and resource stock abundance (Leontief-Sono separability), and the expansion path is a straight line (homotheticity). In fact, the conditions are even more stringent because linear homogeneity or constant returns to scale for the effort aggregator function are required in order to pass Fisher’s factor reversal test so that the product of effort and the price of effort (or cost per unit of effort) equals total cost. Often strong rather than weak separability is required in order to achieve input-output separability and with a Schaefer type harvest function the aggregator function of all inputs forming the composite input must be a second-order form, the translog. When these stringent conditions are not satisfied, a consistent index cannot be formed.
20 Another form of aggregation that we do not consider is Hicks aggregation in which input prices remain in fixed proportions over time.
58 Effort rights in fisheries management – General principles and case studies from around the world
aggregation over vessels, such as the Gormon conditions or conditions on capital vintages (Fisher, 1965), and these are extremely restrictive. Again, effort and its aggregation into total effort in a fishery must therefore be regarded as approximate, or as applying in exact form only under exceptional circumstances.
Effort as an Unobserved InputMeasurement issues comparable to those encountered with regression analysis issues also arise when measuring the unobserved and separable product of a two-stage production process, fishing effort. Consider the linear aggregator function for unobserved fishing effort, ft = ß0 + ß1X1t + ß2X2t + ß3X3t + ß4X4t + εt, where t indexes time, X denotes input i in time t (e.g. flows of capital and labour services, fuel consumption or days, etc.), and &t is an IID error term. The parameters ß0, ß1 are unknown (which is why ft is not observed). For observation i, ft = ß0 + ß1X1t + ß2X2t + ß3X3t + ß4 X4t + εt, effectively estimates the generated regressor ft, where ˆ denotes an estimated parameter. Replacing ft with ft
in the second stage ft = qft or the Schaefer harvest function ln Yt - α0lnq + α1lnft + α2lnSt should produce consistent estimates of all parameters, but the standard errors and test statistics ignore the sampling variation in the vector of parameters ß. One advantage of the aggregator function is that ft becomes an instrumental variable predetermined in the effort model that avoids endogeneity issues and reduces multicollinearity when estimating the second-stage regression (Fuss, 1977). (Nominal effort f is a choice or endogenous variable that depends upon market prices, resource stock abundance, environment, etc., which if not accounted for can yield inconsistent parameter estimates in the second stage regression.)
Measurement Issues: Proxy Variables and Heterogeneity in Seemingly Uniform Measures of EffortEven assuming the existence of the unobserved consistent effort index through either Leontief-Sono or Leontief aggregation, the measurement of this index poses considerable problems because it is unobserved as discussed above. Fishing effort, which is a composite flow of services from all inputs (except in the unlikely circumstances of Leontief aggregation), is invariably measured by a proxy variable, often a measure of time such as days at sea, which like all proxy variables give an incomplete and biased and inconsistent measure. There may be problems of accurately and consistently measuring the proxy variable itself. (See Maunder and Punt, 2004, and McClauskey and Lewison, 2008, for a comprehensive survey of the issues and an advocacy for multiple metrics of effort). For example, the PNA VDS specifies the proxy variable of a fishing day, but a day in practise in the Western and Central Pacific Ocean purse seine fishery can be as finely tuned as four or eight-hour periods actually spent fishing according to anecdotal evidence. As another example, in the Faeroe Island fishery, average tow length increased, allowing longer fishing time and less gear-handling time during a 24 hour period, and the swept area had increased through towing faster (Thomsen, 2005). Thus, a day at sea differs considerably from a day or a portion of a day actually spent harvesting fish, a day in transit differs from a day spent searching, a day or perhaps more accurately part of a day spent waiting and then fishing on a floating aggregator device differs from a day or part of a day fishing on an unassociated school of fish, there may be varying number and lengths of tows or sets of the net during a single day, and so on. Even further, a day spent searching in one area or time period differs from another because fish abundance and availability differs by area and time as well as by changes in the state of the environment, such as weather and seasons. Trans-shipment is also an issue, that is, whether or not there are only days fishing or if days-at-sea includes transit time to deliver catches to land-based processors or trans-
^
^ ^ ^ ^ ^ ^̂ ^
59Effort rights-based management
shipment vessels at sea. In sum, time measures of the flow of services from the stock of inputs – fishing time – faces heterogeneity across vessels and time periods, so that it is not a uniform measure.
When effort is viewed in full or in part as a stock of capital, such as number of vessels or gear (e.g. number of hooks or traps), stock-flow problems emerge when a unit of the heterogeneous capital stock, such as gear, measures effort (for example, the number of hooks), because the stock of capital does not capture the flow of services or utilization (activity). For example, the number of hooks is a stock of capital that does not capture the flow of services that depends on the amount of “soak time” as well as search and transit time. (A further source of heterogeneity is variability in measures of time as discussed elsewhere.) When transferable effort programmes are denominated in units of capital stock, such as in the Western Australian Pilbara trap fishery, the introduction of transferability led to an increase in fishing effort (Borg and Metzner, 2001). Although not explicitly stated, with the total number of traps capped this increase could only come from an increase in fishing time leading to an increase in the flow of capital services. Even measuring the flow of capital services, such as hook-days or kw-days, its utilization differs from the amount of fishing capacity because all inputs and their services are overlooked.
Effort measured as either the stock of capital (numbers and sizes of vessels, engine power, or gear) or the flow of capital services (vessel-days, kw-days, trap-hauls) faces heterogeneity of units of effort on a different margin, the age or vintage of the capital stock. Different vintages of capital embody different states of technology and efficiency (Solow, 1960; Hutten, 1998). One basic issue that arises involves the conditions under which different vintages of capital and technology can be collapsed into an aggregate production function defined with respect to an aggregate measure of capital (Solow, 1960; Fisher, 1965), or one of the issues in the existence of an aggregate harvest function discussed above. A second basic issue is that different vintages of capital stock, such as different vintages of fishing-finding electronics or engines or hull designs, differ in their productivity, so that a seemingly homogeneous and uniform measure of effort such as vessel-days can vary considerably in its productivity across vessels. Without care in crafting the programme, a day held by an older vessel can differ markedly from a day held by a new vessel even if they are of the same size.
The capital stock is heterogeneous in its composition, including the hull, engine(s), equipment, and gear, and the entirety of the capital stock as opposed to a single component may provide a more comprehensive and accurate measure. Instead, due to data limitations, the capital stock is invariably measured by one or two components, such as the numbers and/or sizes of vessels, engines, and gear.
The capital stock is heterogeneous along yet another margin, its size, and hence its productivity and impact on fishing mortality (the fraction fisheries fleets remove from the fish stock) and catch rates. For example, a Class 6 tuna purse seine vessel in the Eastern Pacific Ocean compared with a Class 5 purse seine vessel. Gears are not always homogeneous across vessels, such as mesh sizes, so that a day with one gear specification can differ from another. Simply put, a unit of capital services flow is not homogenous and constant over time, space, vessel size, and gear.
Units of Exchange and Standardization Issues: Standard Units of EffortIn principle, units of effort can be expressed as standardized or effective effort, attempting to account for differences in productivity (fishing power) across different and unique production technologies (such as gear types, national fleets, vessel size classes, etc.) (Maunder and Punt, 2004).
Transferability of effort between vessels with heterogeneous sizes and productivity (“fishing power”), whether in the same fleet or between fleets, or that harvest in different geographical areas, or that use different gear types, or that have differential
60 Effort rights in fisheries management – General principles and case studies from around the world
impact on mortality of different species, raises the issue of comparability of units of effort – the standardization issue. Europe, for example, has multispecies and multigear fisheries such that setting up a big market of tradable efforts rights is tricky because a kw-day in gillnetting for cod is not the same as a kw-day in trawling and its impact on fishing mortality, making standardization to units of effective effort required. The coefficients resulting from standardization in principle establish comparable fishing mortality across species and gears, so that transfers made across species and gears yield the same impact on fishing mortality. A trade-off may exist between gains from trade of transferable effort and uneven impacts on fishing mortality. Transferable effort can be specified by area, gear, and to accommodate varying productivity for different-sized vessels by vessel size class or by the product of vessel size and time (Shepherd n.d.).
The Falklands specifies effort conversion keys detailed in governmental orders, for example stating that one large longliner sea day equals 1.33 trawl sea days for a medium sized trawler (Nielsen et al., 2006). Fishery Inspectors, who convert sea days across different vessel sizes and types (fleets), must approve effort sales transactions in terms of sea day compatibility between buyers and sellers. Transferability is attenuated in that days are transferable within vessel size classes except for the largest vessels (Pope, 2009). Moreover, different vessel groups are restricted to different fishing areas. In the PNA VDS, a fishing day for purse seine vessels has been apportioned based on vessel length (Shanks, 2010). Specifically, fishing days for vessels with overall lengths of less than 50, 50–80 m, and more than 80m are equated to deductions of 0.5, 1.0, and 1.5 fishing days, respectively. With each transfer of traps in the proposed transferable trap programme in the New England lobster trap fishery in federal waters, a percentage of the total traps transferred ranging from 10 to 20 percent would be permanently eliminated as a resource conservation tax.
In contrast to measuring fishing effort, a unit of fish caught as measured under a catch share form of rights-based management is far more accurately defined and enumerated (although issues still arise, such as weight or numbers of fish, whole or processed fish, etc.).
Multispecies Fisheries and BycatchTransferable effort and catch quota programmes generate different incentives for targeting, bycatch, and discards in multispecies fisheries. The incentives for the choice of quality standards, species mixes, and for the use of various inputs (oil, gear, etc.) are also different in a catch quota system compared with an effort quota system. Transferable effort programmes do not control species catch composition and levels, including bycatch, whereas transferable catch quota programmes focus upon harvest and bycatch quantities21. Catch controls face the problem of mismatch of TACs and individual quota holdings with catch rates, which can generate incentives for bycatch.
In multispecies fisheries, issues of discarding, overfishing and underfishing various species arise for both catch and effort regulation, but appear in different guises and with different incentives and implications. In both effort and quota managed fisheries some stocks and species may be excessively exploited (through discards with catch quotas and excess landings with effort quotas) and others under-exploited (through setting of the TAC with catch quotas and low catches with effort quotas). Effort quotas may require supplementary regulations, including area and real-time season restrictions and
21 Squires et al. (1998) and Sanchirico et al. (2006) discuss multispecies issues with ITQ-regulated fisheries.
61Effort rights-based management
perhaps stock-specific and gear-specific measures to insure some control of fishing mortality across species and areas (Rossiter and Stead, 2003; Shepherd n.d., 2003; MARG, 2006; Baudron et al., 2010)22.
Catch quotas lead to discards while effort quotas do not, with the latter having less direct control over catch and fishing mortality rates on individual species. Some incentive programmes to reduce discards and handle quota overages (e.g. deemed value programmes) exist for quota-managed fisheries.
Shepherd (2003, p. 2) states, “…in adopting effort control we would be accepting that fine-tuning the management of individual stocks in a fishery is impossible, and that effective but broad-brush control would be preferable to the apparent (but actually ineffective) precision management using TACs and quotas.” Bycatch of protected species such as sea turtles, sea birds, and sharks plague both management systems.
The absence of species quotas does not stop individual species from overexploitation as it simply eliminates quota overage discards. Effort regulation precludes incentives for fish discards due to quota limits, especially when not linked to quotas as well as bycatch and target species regulations. Effort regulation changes the incentive to evade the regulations, because number and use of days at sea rather than catches is the regulatory focal point.
Incentives to unmarketable fish (those of low value, or smaller than the minimum landing size) should largely be unaffected by either approach, because market conditions are paramount23. Highgrading, in which higher-valued fish replace lower-valued fish, might be expected to decline (but not stop) in comparison with catch-quota managed fisheries. When transferable effort programmes are supplemented by bycatch or catch limits and observers, the argument strengthens to simply shift to catch quota rights based management.
Most fisheries are subject to some form of seasonality. If a restriction on total days fished is imposed, fishers will reduce their individual effort in the off-season periods, balancing when the expected catch is lower, with prices that may be higher as a result, with distance travelled, and with fishing alternatives (opportunity cost). The reduction in total catch is likely to be less than the reduction in the allowable effort.
Substitution between Unregulated and Regulated Inputs (“Capital Stuffing”) and Technical InefficiencyTransferable effort programmes can be subject to substitution of unregulated inputs for regulated inputs (“capital stuffing”), part of the nonlinear and varying relationship between effort and catch, and which reduces economic efficiency and raises costs (Wilen, 1979; Dupont, 1991; Squires, 1994, 2012; Kompas et al., 2008). (In contrast, ITQ programmes generate incentives for harvest cost minimization, including technical efficiency). Limiting one input contributing to total effort creates incentives to expand the unregulated inputs comprising total effort, thereby thwarting effort reduction. Utilization of existing capital is also possible through fishing harder (longer tows, more tows per day, etc.). Input regulation can also induce vessels to become less technically efficient (reduce the catch per unit of effort for a given bundle of inputs and state of technology) (Kompas et al., 2004).
22 Some stocks in multispecies fisheries can become very underutilized if effort is capped to safeguard the most vulnerable (weakest or winker link) stock, an issue that emerged in the New England days at sea scheme for groundfish trawlers. The transferable days at sea programme in the Faroe Islands creates an incentive to reorient catches away from cod and haddock by allocating additional days to vessels fishing other species (Pope 2009).
23 Nonetheless, there may some interactions with quota-regulated fisheries, in which the choice of quota-discarded fish or high-graded fish interact.
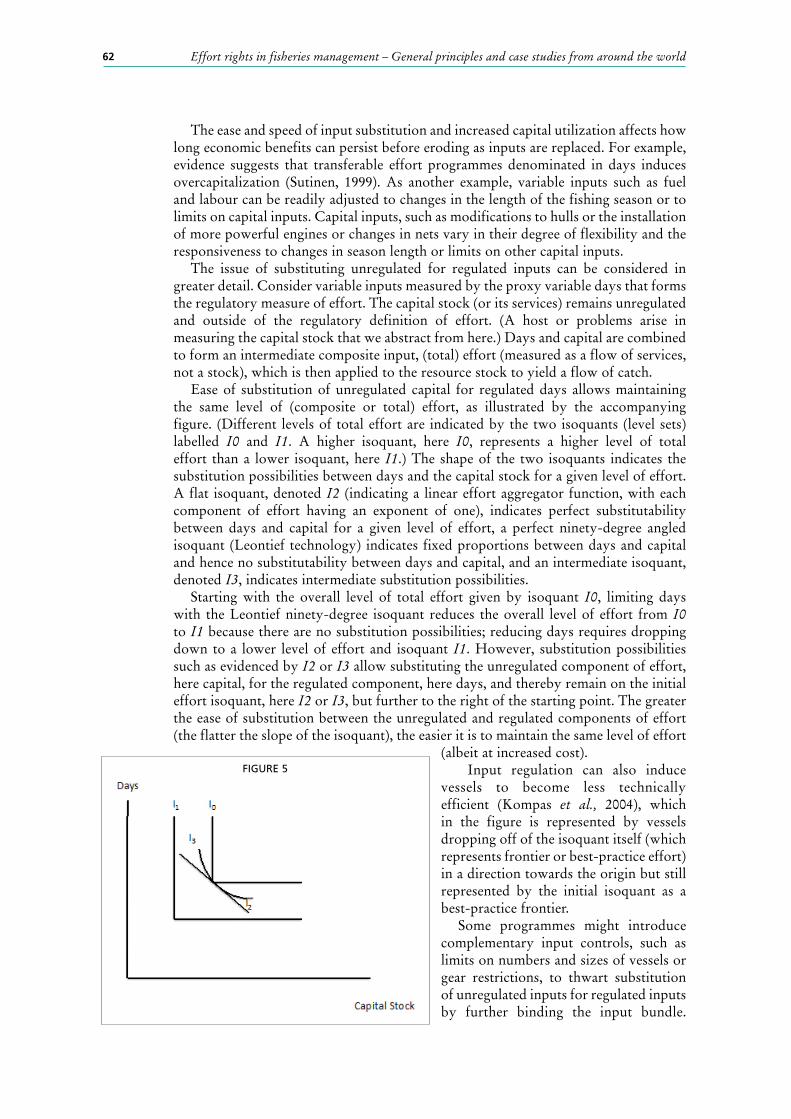
62 Effort rights in fisheries management – General principles and case studies from around the world
The ease and speed of input substitution and increased capital utilization affects how long economic benefits can persist before eroding as inputs are replaced. For example, evidence suggests that transferable effort programmes denominated in days induces overcapitalization (Sutinen, 1999). As another example, variable inputs such as fuel and labour can be readily adjusted to changes in the length of the fishing season or to limits on capital inputs. Capital inputs, such as modifications to hulls or the installation of more powerful engines or changes in nets vary in their degree of flexibility and the responsiveness to changes in season length or limits on other capital inputs.
The issue of substituting unregulated for regulated inputs can be considered in greater detail. Consider variable inputs measured by the proxy variable days that forms the regulatory measure of effort. The capital stock (or its services) remains unregulated and outside of the regulatory definition of effort. (A host or problems arise in measuring the capital stock that we abstract from here.) Days and capital are combined to form an intermediate composite input, (total) effort (measured as a flow of services, not a stock), which is then applied to the resource stock to yield a flow of catch.
Ease of substitution of unregulated capital for regulated days allows maintaining the same level of (composite or total) effort, as illustrated by the accompanying figure. (Different levels of total effort are indicated by the two isoquants (level sets) labelled I0 and I1. A higher isoquant, here I0, represents a higher level of total effort than a lower isoquant, here I1.) The shape of the two isoquants indicates the substitution possibilities between days and the capital stock for a given level of effort. A flat isoquant, denoted I2 (indicating a linear effort aggregator function, with each component of effort having an exponent of one), indicates perfect substitutability between days and capital for a given level of effort, a perfect ninety-degree angled isoquant (Leontief technology) indicates fixed proportions between days and capital and hence no substitutability between days and capital, and an intermediate isoquant, denoted I3, indicates intermediate substitution possibilities.
Starting with the overall level of total effort given by isoquant I0, limiting days with the Leontief ninety-degree isoquant reduces the overall level of effort from I0 to I1 because there are no substitution possibilities; reducing days requires dropping down to a lower level of effort and isoquant I1. However, substitution possibilities such as evidenced by I2 or I3 allow substituting the unregulated component of effort, here capital, for the regulated component, here days, and thereby remain on the initial effort isoquant, here I2 or I3, but further to the right of the starting point. The greater the ease of substitution between the unregulated and regulated components of effort (the flatter the slope of the isoquant), the easier it is to maintain the same level of effort
(albeit at increased cost). Input regulation can also induce
vessels to become less technically efficient (Kompas et al., 2004), which in the figure is represented by vessels dropping off of the isoquant itself (which represents frontier or best-practice effort) in a direction towards the origin but still represented by the initial isoquant as a best-practice frontier.
Some programmes might introduce complementary input controls, such as limits on numbers and sizes of vessels or gear restrictions, to thwart substitution of unregulated inputs for regulated inputs by further binding the input bundle.
FIGURE 5
63Effort rights-based management
Limits on time, areas, and seasons restrict capital utilization and can induce technical inefficiency. Input regulations will tend to reduce the ease of substitution from regulated to unregulated inputs and among unregulated inputs compared with an unregulated industry due to what is called a Le Chatelier effect (Dupont, 1991; Squires, 1994, 2012). Empirical estimates of pure substitution elasticities between inputs tend to show inelastic substitution possibilities, i.e. that vessels do but not readily substitute unregulated inputs for regulated inputs or unregulated inputs for unregulated inputs (Jensen, 2002)24.
Productivity Growth (‘Effort Creep’)Transferable effort programmes are vulnerable to on-going growth in productivity – “fishing power” or increases in catchability, including technological progress through process innovations and improvements in technical efficiency. Productivity growth – crudely defined as the growth in catch per unit effort and sometimes called growth in fishing power or effective effort-- means that each day of fishing, although denominated in nominal days or units of gear, is more productive each year. For example, after the introduction and diffusion of the process innovation drifting floating aggregator devices (FADs) in international tuna fisheries, fewer days were required to find and harvest tunas. Conversely, the same number of days could harvest more fish.
Technical change through process innovations can either be disembodied (i.e. not embodied in the capital stock) and generally attributed to learning by doing or embodied in the capital stock, where new innovations are adopted through investment, such as vessel electronics or FADs. Technical change can also be regulatory induced in which process innovations are developed and adopted in response to input controls, and could happen with transferable effort programmes. For example, incentives are created for innovations and methods of fishing (including gears) that use the least amount of time, which may land larger volumes of lower valued or younger species and which may be more ecologically detrimental (Khallian et al., 2010).
Should measures of annual productivity growth in fisheries range from about one to three percent, then “effective” effort grows by this amount even if “nominal” effort remains constant. Transferable effort programmes typically require periodic reductions in TAEs to counter the on-going productivity growth. The Western Australia Pilabara trap fishery faced such a problem due to productivity growth.
The concern over “effort creep” in fact does not disappear with catch quota rights. Instead, the issue is subsumed in the stock assessment and the subsequent TAC. That is, the issue must still be faced but is faced in a different venue and different means. Under individual transferable and group catch quotas, the fleet voluntarily reduces capacity or fishes but TAE reductions under effort management based on uniform pro rata adjustments to individual vessel entitlements to fishing effort are made by the regulator with accompanying problems in political economy.
The impact of disembodied Hick’s neutral but time-varying technical change and output-oriented technical efficiency can be illustrated with a Schaefer harvest function: Yt = qSt ft eλt + yt2 - µ(t), where Yt denotes catch in time t, St denotes resource abundance in time t, λt are parameters measuring the rate of technical progress, and µ(t) denotes a non-positive, half-sided error term that introduces deviations from the best-practice frontier or technical inefficiency (Squires and Vestergaard, in press). The term fteλt + yt2 - µ(t) represents effective effort and can be seen as a decomposition of the catchability coefficient q. If the Leontief-Sono weakly separable effort aggregator
24 Hicksian or input-compensated elasticities show substitution along a given isoquant and these substitution possibilities are largely inelastic. Marshallian elasticities include both pure substitution possibilities along a given isoquant and an expansion effect through movement to a new isoquant. The empirical literature indicates more elastic Marshallian elasticities (Jensen, 2002).
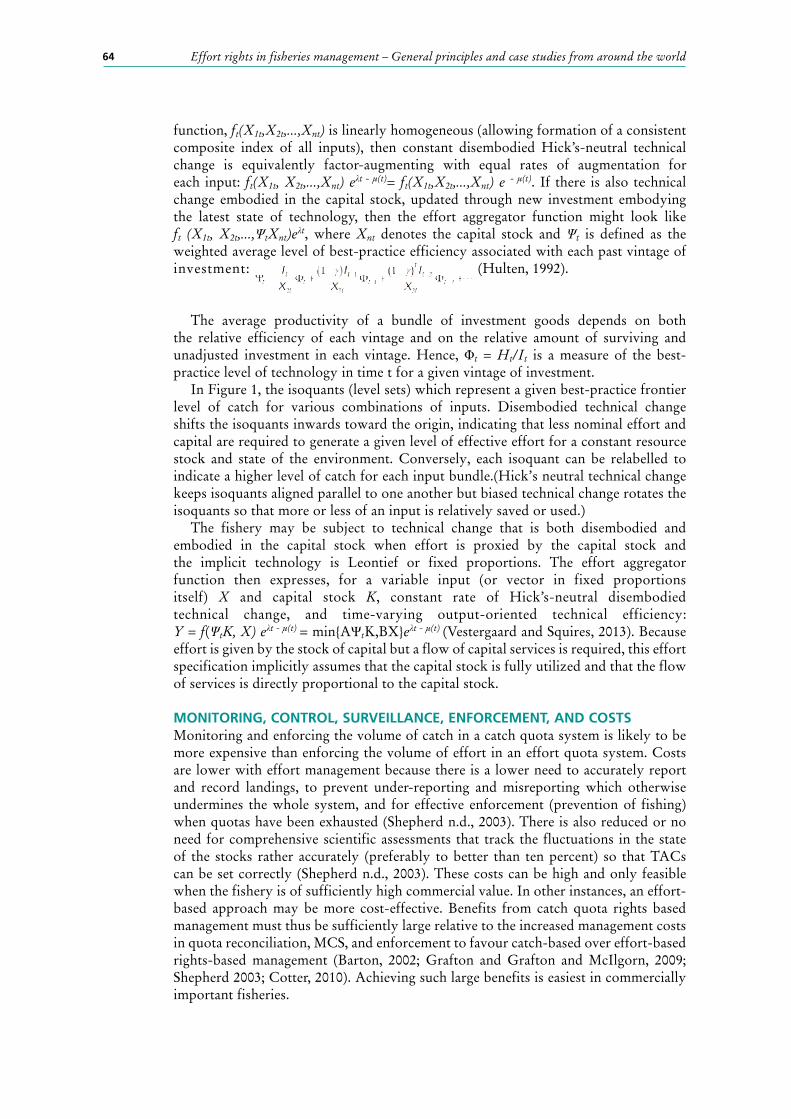
64 Effort rights in fisheries management – General principles and case studies from around the world
function, ft(X1t,X2t,...,Xnt) is linearly homogeneous (allowing formation of a consistent composite index of all inputs), then constant disembodied Hick’s-neutral technical change is equivalently factor-augmenting with equal rates of augmentation for each input: ft(X1t, X2t,...,Xnt) eλt - µ(t)= ft(X1t,X2t,...,Xnt) e - µ(t). If there is also technical change embodied in the capital stock, updated through new investment embodying the latest state of technology, then the effort aggregator function might look like ft (X1t, X2t,...,ΨtXnt)eλt, where Xnt denotes the capital stock and Ψt is defined as the weighted average level of best-practice efficiency associated with each past vintage of investment: (Hulten, 1992).
The average productivity of a bundle of investment goods depends on both the relative efficiency of each vintage and on the relative amount of surviving and unadjusted investment in each vintage. Hence, Φt = Ht/It is a measure of the best-practice level of technology in time t for a given vintage of investment.
In Figure 1, the isoquants (level sets) which represent a given best-practice frontier level of catch for various combinations of inputs. Disembodied technical change shifts the isoquants inwards toward the origin, indicating that less nominal effort and capital are required to generate a given level of effective effort for a constant resource stock and state of the environment. Conversely, each isoquant can be relabelled to indicate a higher level of catch for each input bundle.(Hick’s neutral technical change keeps isoquants aligned parallel to one another but biased technical change rotates the isoquants so that more or less of an input is relatively saved or used.)
The fishery may be subject to technical change that is both disembodied and embodied in the capital stock when effort is proxied by the capital stock and the implicit technology is Leontief or fixed proportions. The effort aggregator function then expresses, for a variable input (or vector in fixed proportions itself) X and capital stock K, constant rate of Hick’s-neutral disembodied technical change, and time-varying output-oriented technical efficiency: Y = f(ΨtK, X) eλt - µ(t) = min{AΨtK,BX}eλt - µ(t) (Vestergaard and Squires, 2013). Because effort is given by the stock of capital but a flow of capital services is required, this effort specification implicitly assumes that the capital stock is fully utilized and that the flow of services is directly proportional to the capital stock.
MONITORING, CONTROL, SURVEILLANCE, ENFORCEMENT, AND COSTSMonitoring and enforcing the volume of catch in a catch quota system is likely to be more expensive than enforcing the volume of effort in an effort quota system. Costs are lower with effort management because there is a lower need to accurately report and record landings, to prevent under-reporting and misreporting which otherwise undermines the whole system, and for effective enforcement (prevention of fishing) when quotas have been exhausted (Shepherd n.d., 2003). There is also reduced or no need for comprehensive scientific assessments that track the fluctuations in the state of the stocks rather accurately (preferably to better than ten percent) so that TACs can be set correctly (Shepherd n.d., 2003). These costs can be high and only feasible when the fishery is of sufficiently high commercial value. In other instances, an effort-based approach may be more cost-effective. Benefits from catch quota rights based management must thus be sufficiently large relative to the increased management costs in quota reconciliation, MCS, and enforcement to favour catch-based over effort-based rights-based management (Barton, 2002; Grafton and Grafton and McIlgorn, 2009; Shepherd 2003; Cotter, 2010). Achieving such large benefits is easiest in commercially important fisheries.
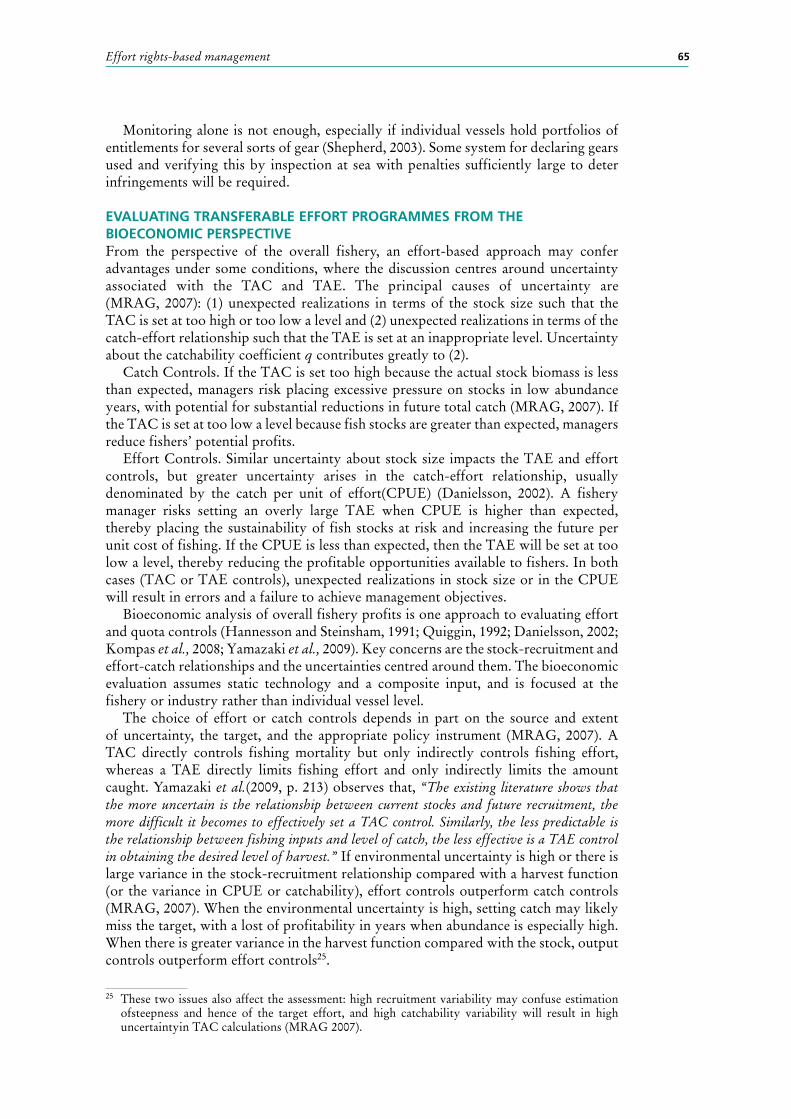
65Effort rights-based management
Monitoring alone is not enough, especially if individual vessels hold portfolios of entitlements for several sorts of gear (Shepherd, 2003). Some system for declaring gears used and verifying this by inspection at sea with penalties sufficiently large to deter infringements will be required.
EVALUATING TRANSFERABLE EFFORT PROGRAMMES FROM THE BIOECONOMIC PERSPECTIVEFrom the perspective of the overall fishery, an effort-based approach may confer advantages under some conditions, where the discussion centres around uncertainty associated with the TAC and TAE. The principal causes of uncertainty are (MRAG, 2007): (1) unexpected realizations in terms of the stock size such that the TAC is set at too high or too low a level and (2) unexpected realizations in terms of the catch-effort relationship such that the TAE is set at an inappropriate level. Uncertainty about the catchability coefficient q contributes greatly to (2).
Catch Controls. If the TAC is set too high because the actual stock biomass is less than expected, managers risk placing excessive pressure on stocks in low abundance years, with potential for substantial reductions in future total catch (MRAG, 2007). If the TAC is set at too low a level because fish stocks are greater than expected, managers reduce fishers’ potential profits.
Effort Controls. Similar uncertainty about stock size impacts the TAE and effort controls, but greater uncertainty arises in the catch-effort relationship, usually denominated by the catch per unit of effort(CPUE) (Danielsson, 2002). A fishery manager risks setting an overly large TAE when CPUE is higher than expected, thereby placing the sustainability of fish stocks at risk and increasing the future per unit cost of fishing. If the CPUE is less than expected, then the TAE will be set at too low a level, thereby reducing the profitable opportunities available to fishers. In both cases (TAC or TAE controls), unexpected realizations in stock size or in the CPUE will result in errors and a failure to achieve management objectives.
Bioeconomic analysis of overall fishery profits is one approach to evaluating effort and quota controls (Hannesson and Steinsham, 1991; Quiggin, 1992; Danielsson, 2002; Kompas et al., 2008; Yamazaki et al., 2009). Key concerns are the stock-recruitment and effort-catch relationships and the uncertainties centred around them. The bioeconomic evaluation assumes static technology and a composite input, and is focused at the fishery or industry rather than individual vessel level.
The choice of effort or catch controls depends in part on the source and extent of uncertainty, the target, and the appropriate policy instrument (MRAG, 2007). A TAC directly controls fishing mortality but only indirectly controls fishing effort, whereas a TAE directly limits fishing effort and only indirectly limits the amount caught. Yamazaki et al.(2009, p. 213) observes that, “The existing literature shows that the more uncertain is the relationship between current stocks and future recruitment, the more difficult it becomes to effectively set a TAC control. Similarly, the less predictable is the relationship between fishing inputs and level of catch, the less effective is a TAE control in obtaining the desired level of harvest.” If environmental uncertainty is high or there is large variance in the stock-recruitment relationship compared with a harvest function (or the variance in CPUE or catchability), effort controls outperform catch controls (MRAG, 2007). When the environmental uncertainty is high, setting catch may likely miss the target, with a lost of profitability in years when abundance is especially high. When there is greater variance in the harvest function compared with the stock, output controls outperform effort controls25.
25 These two issues also affect the assessment: high recruitment variability may confuse estimation ofsteepness and hence of the target effort, and high catchability variability will result in high uncertaintyin TAC calculations (MRAG 2007).
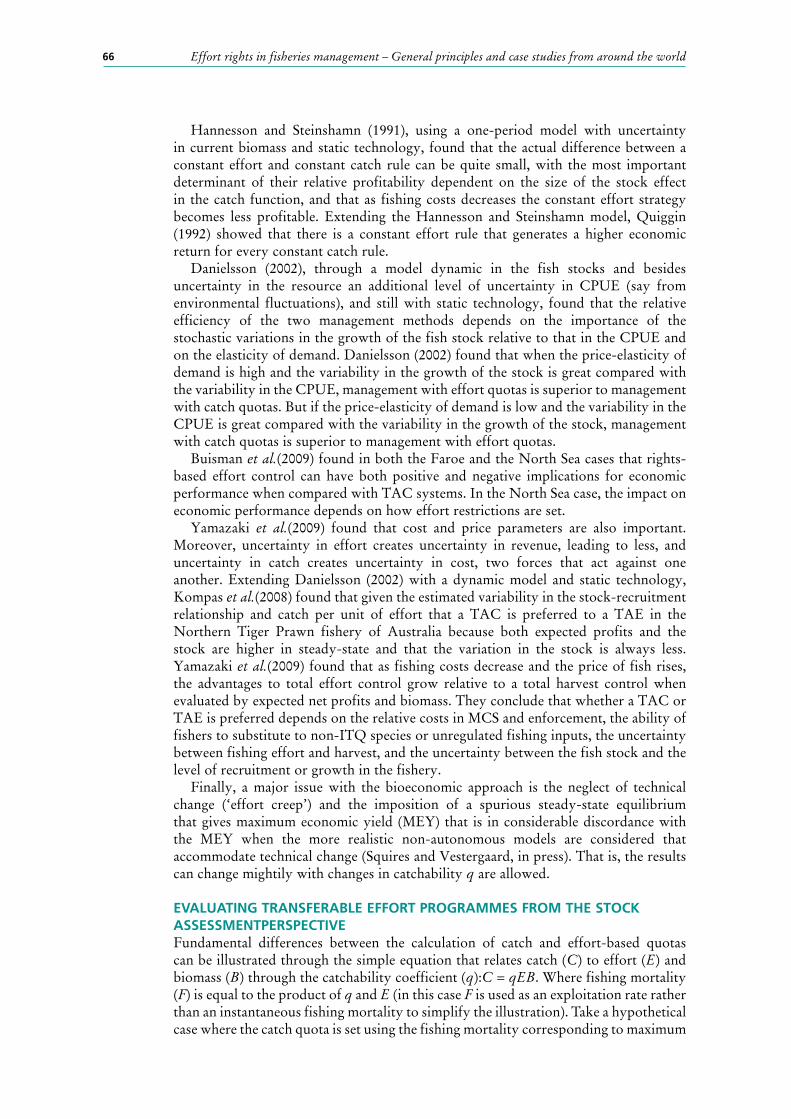
66 Effort rights in fisheries management – General principles and case studies from around the world
Hannesson and Steinshamn (1991), using a one-period model with uncertainty in current biomass and static technology, found that the actual difference between a constant effort and constant catch rule can be quite small, with the most important determinant of their relative profitability dependent on the size of the stock effect in the catch function, and that as fishing costs decreases the constant effort strategy becomes less profitable. Extending the Hannesson and Steinshamn model, Quiggin (1992) showed that there is a constant effort rule that generates a higher economic return for every constant catch rule.
Danielsson (2002), through a model dynamic in the fish stocks and besides uncertainty in the resource an additional level of uncertainty in CPUE (say from environmental fluctuations), and still with static technology, found that the relative efficiency of the two management methods depends on the importance of the stochastic variations in the growth of the fish stock relative to that in the CPUE and on the elasticity of demand. Danielsson (2002) found that when the price-elasticity of demand is high and the variability in the growth of the stock is great compared with the variability in the CPUE, management with effort quotas is superior to management with catch quotas. But if the price-elasticity of demand is low and the variability in the CPUE is great compared with the variability in the growth of the stock, management with catch quotas is superior to management with effort quotas.
Buisman et al.(2009) found in both the Faroe and the North Sea cases that rights-based effort control can have both positive and negative implications for economic performance when compared with TAC systems. In the North Sea case, the impact on economic performance depends on how effort restrictions are set.
Yamazaki et al.(2009) found that cost and price parameters are also important. Moreover, uncertainty in effort creates uncertainty in revenue, leading to less, and uncertainty in catch creates uncertainty in cost, two forces that act against one another. Extending Danielsson (2002) with a dynamic model and static technology, Kompas et al.(2008) found that given the estimated variability in the stock-recruitment relationship and catch per unit of effort that a TAC is preferred to a TAE in the Northern Tiger Prawn fishery of Australia because both expected profits and the stock are higher in steady-state and that the variation in the stock is always less. Yamazaki et al.(2009) found that as fishing costs decrease and the price of fish rises, the advantages to total effort control grow relative to a total harvest control when evaluated by expected net profits and biomass. They conclude that whether a TAC or TAE is preferred depends on the relative costs in MCS and enforcement, the ability of fishers to substitute to non-ITQ species or unregulated fishing inputs, the uncertainty between fishing effort and harvest, and the uncertainty between the fish stock and the level of recruitment or growth in the fishery.
Finally, a major issue with the bioeconomic approach is the neglect of technical change (‘effort creep’) and the imposition of a spurious steady-state equilibrium that gives maximum economic yield (MEY) that is in considerable discordance with the MEY when the more realistic non-autonomous models are considered that accommodate technical change (Squires and Vestergaard, in press). That is, the results can change mightily with changes in catchability q are allowed.
EVALUATING TRANSFERABLE EFFORT PROGRAMMES FROM THE STOCK ASSESSMENTPERSPECTIVEFundamental differences between the calculation of catch and effort-based quotas can be illustrated through the simple equation that relates catch (C) to effort (E) and biomass (B) through the catchability coefficient (q):C = qEB. Where fishing mortality (F) is equal to the product of q and E (in this case F is used as an exploitation rate rather than an instantaneous fishing mortality to simplify the illustration). Take a hypothetical case where the catch quota is set using the fishing mortality corresponding to maximum
67Effort rights-based management
sustainable yield (Fmsy) such that C=Fmsy × B. In this case both Fmsy and B need to be determined. These are generally estimated using a stock assessment model. Fmsy is determined from the assumptions about the population (e.g. form of the growth and stock-recruitment curves) and fishery (e.g. form of the selectivity curves) dynamics and the pre-determined or estimated parameters (e.g. natural mortality, growth, stock-recruitment, selectivity) and is typically independent of absolute abundance. Biomass estimates are a function of all the model assumptions and data, but are generally driven by the influence catch has on abundance indices and how many old fish are in the catch. In contrast, an effort quota based on Fmsy is calculated as E = Fmsy/q and when applied to the stock automatically takes the true B into account resulting in the C. Effort based quotas require the estimation of Fmsy and q.
Both effort and catch based quotas require the estimation of Fmsy and therefore the difference between the two approaches lies in the accuracy of estimating B versus q. In any particular year:
Bt = Ct/qEt .If C and E are known, this implies that estimating either q or B is equivalent. The
absolute level of abundance (the “scaling” of the stock assessment model) is notoriously difficult in many assessments. However, the evaluation of effort-based quotas can be implemented by estimating F/Fmsy in a stock assessment model, which may be more robust to the scaling issue. Management strategy evaluation is needed to determine under which stock assessment uncertainties catch or effort quotas are more robust.
More complex decision rules are often used to add more precaution to the management. These decision rules are often based on reducing the fishing mortality rate when the biomass declines below a particular biomass level, possibly as a function of biomass, and therefore require the estimation of biomass even if effort quotas are implemented. Given that most yield curves are flat, a better approach may be to base an effort quota on a single fishing mortality rate that is somewhat less than Fmsy.
An alternative approach to estimating the optimal fishing mortality is to consider that the current situation is reasonable and manage the system based on keeping the system around the current level. For this approach, natural fluctuations in the biomass should be taken into consideration. In the case of constant effort quotas, as the biomass fluctuates, the catch realized from the effort will also change. So when the abundance declines, the catch will also decline. However, in the case of constant catch quotas, as the biomass declines (perhaps due to an environmentally reduced series of recruitment), the catch stays the same so that the fishing mortality will increase, which is not desirable because it may result in a highly depleted stock. Some form of control rule, which may involve estimating the abundance, is needed to modify the catch to avoid endangering the stock. There may be delays in implementing the new catch quota.
There are several issues that need to be considered that may reduce the robustness of effort quotas. Does q change over time randomly (e.g. due to environmental influences) or systematically (e.g. due to improvements in technology) or both? Failing to account for improvements in technology will cause the fishing mortality to increase over time. Catch may be a nonlinear function of effort or biomass, C = qEaBb, and may stay high even if the biomass reduces because the fishery can find schools of fish (b<1). Competition among effort may cause increased effort to not produce the same proportional increase in catch (a<1).
There are several reasons why a stock assessment may not be accurate:•Estimation uncertainty (low sample size, not the right data)•Process uncertainty (e.g. recent recruitment)•Model misspecification (fixed parameter values or model structure)•Biased data (i.e. under-reported catch)• Programming/logic errors
68 Effort rights in fisheries management – General principles and case studies from around the world
The above can introduce bias or variance into the estimates. If the variance is accurately estimated, it can be taken into consideration when setting the quota. However, some of the sources of variance are often ignored (e.g. when influential parameters like natural mortality are pre-specified). In addition, there are errors in implementing the catch or effort quotas. For example, catch may be miss-reported or vessels could add additional catching capacity.
For example, the absolute biomass levels and Fs for many tuna assessments that fit to length composition data are highly sensitive to the average size of old individuals assumed in the stock assessment. If the average size is much smaller than the largest sizes in the length composition data, then the population is large and exploitation rates are low. If the average size is larger than the largest size in the length composition data, then the population is small and the fishing mortality high. Unfortunately, for many stock the average size of old individuals is very uncertain.
It may not be necessary to accurately estimate Fmsy for use in management. For many species the stock recruitment relationship is weak (steepness of the Beverton-Holt stock-recruitment relationship is high and recruitment is independent of stock size). This means that the yield curve is similar to the yield-per-recruit (YPR) curve. It is well established that the YPR curve is flat for many species and fishing at a rate somewhat less than (or greater than) Fmsy will produce similar equilibrium yields. However, dynamic yields may be very different.
Ceq = Beq × 0.9 Fmsy aprox = Bmsy × Fmsy = MSYWhere Beq is the equilibrium yield fishing under 0.9 FmsyBut0.9 Fmsy × Bt <Fmsy × Bt.This suggests that in an equilibrium sense, fishing at Fmsy by using effort quotas
may be more robust to errors in the estimates of Fmsy than fishing at Fmsy using catch quotas.
The simple case of one fleet gives the solution, Emsy = Fmsy/q. That solution will gives the same effort for species A and B only if Fmsy(Species A) /q(SpeciesA) = Fmsy(Species B)/q(Species B), which implies that the population dynamics are similar (Fmsy is the same) and vulnerability to the fishery is the same (q is the same) . That will usually not be the case for any combination of species and stocks (e.g. Fmsy will not be the same for long lived and short lived species).Accordingly, harvest control rules must specify the trade-off of reaching Fmsy for only one species or to compromise between Fmsy for different species in the mixed species fishery. One simple approach would be to apply the same factor to all efforts (of all fleets), so that the inequality is met and equality is achieved for only one species. In the following section we introduce another approach.
HYBRID SYSTEMS OF INDIVIDUAL TRANSFERABLE QUOTAS AND INDIVIDUAL TRANSFERABLE EFFORTThe European Union has started to use both catch and effort quota management systems in parallel by supplementing the traditional TAC fleet capacity restrictions with sea-day restrictions from 2003 (Nielson, 2006; MRAG et al., 2009; Emery et al., 2012). Catch quotas are the key instrument used to manage these fisheries, and effort restrictions have been introduced as a complementary measure to minimize bycatches, discarding, quota overages, and other related ecosystem issues. The choice of having an effort regulation system on top of the traditional catch quota system may also be a political choice in relation to the need for further restrictions on the fleet, especially in relation to stock recovery plans (Nielsen et al., 2006).The Hawaii shallow set pelagic longline fishery for swordfish instituted a system of bycatch quotas for
69Effort rights-based management
two species of sea turtles and an industry-wide effort limit established on an annual basis. The superimposition of effort restrictions on a quota-based system may result in reductions in economic efficiency.
TRANSFERABLE EFFORT RIGHTS-BASED MANAGEMENT IN INTERNATIONAL FISHERIESSeveral issues are paramount for effort rights-based management of international fisheries and create differences with such programmes for individual states that do not have transboundary or shared resource stocks. First, self-enforcing agreements among nations (multinational cooperation) through the auspices of a Regional Fisheries Management Organization (RFMO) is required (Barrett, 2003). Second, there are two rights involved, not one as in national programmes. National programmes have only an effort right with an implicit access right to that country’s Exclusive Economic Zone through a license to fish. International fisheries on transboundary and shared resource stocks include not only the effort right, but a new explicit right, the right of access to national Exclusive Economic Zones, reflecting the sovereignty of individual states, or to fish on the high seas under the auspices of a RFMO. Vessels now require a license (place on the regional vessel register) of the RFMO to fish with the management area. The vessel will also require a license and corresponding flag from a flag state that is a member or cooperating non-member of the RFMO. Transfers of vessels from one flag to another may not be accompanied by the effort right if states exert sovereignty over these effort rights, unless the state allows the effort right to accompany the vessel with change of flag (and license). Effort rights can be allocated to states and then to individuals or groups or directly to individuals or groups.
TAKING STOCK OF TRANSFERABLE EFFORT RIGHTS-BASED MANAGEMENTBoth transferable effort and catch control approaches to rights-based management have strengths and weaknesses, where in both cases individuals or groups can hold the rights. Catch quota programmes are largely preferred from the perspective of the economics of the vessel’s production process due to the difficulties of defining and measuring unobserved (nominal and effective) effort and the incentives to expand unregulated dimensions of effort through input substitution, input utilization (fishing time), and investment (especially the capital stock through investment and capital utilization through fishing longer), although comparable incentives exist to expand catches of unregulated species or to discard under catch quotas. An effort programme may require limits on vessel size and other forms of capital stock (e.g. gear) to limit substitution of unregulated for regulated inputs plus accommodate replacement of old by new vessels and other upgrades and transfers of effort rights across gear types26. An effort programme limiting time (e.g. days) restricts, but not completely, capital utilization. Supplementary restrictions on gear types used, vessel numbers in a gear type, and real-time seasonal and area closures may also be required to maintain fishing mortality levels and species mixes.
Continual technical change (‘effort creep’) affects both effort and quota approaches, directly with effort controls and indirectly with catch controls by biomass and TAC assessments and fleet adjustments through market mechanisms. Effort regulation requires periodically reducing the TAE based on uniform pro rata adjustments to individual vessel entitlements to fishing effort to accommodate growth in productivity (change in q or ‘effort creep’) and capital investment that over time make each day or trip more productive, whereas under TAC and transferable catch quota management industry makes these reductions itself.
26 Much technical change is embodied in the capital stock (e.g. electronics, gear, FADs), so that many limits on capital usage will not affect this form of technical change.
70 Effort rights in fisheries management – General principles and case studies from around the world
When effort is denominated in days, progressive reductions in TAE lead to a growing excess capacity problem in which there are progressively fewer days available for existing vessels that grow increasingly productive over time. The political economy of explicit and periodic TAE reductions by the regulator may be more difficult than fleet restructuring by vessels under individual transferable and group catch quotas.
Transferability of effort or catch rights is critical to increased economic efficiency, flexibility to respond to changes in conditions for markets, the environment, and resource stocks, and industry restructuring that includes vessel exit in fisheries with overcapacity. Reductions in vessel numbers under TAE programmes may be more difficult than under TAC programmes because effort is not well defined and subject to input substitution, investment, and technical progress. The global experience with capacity reduction under effort control programmes is unclear, while global experience shows that individual transferable and group catch quota programmes can lead to desired capacity reduction through fleet restructuring. Several individual effort programmes have required vessel buybacks to facilitate capacity reduction, although the same has been true for some catch quota programmes (Squires, 2010)27.
Transferability of effort rights may need to be limited between gear types and even vessel classes if effort migrates so that fishing mortality for certain species does not increase beyond a sustainable target. A robust unit of account is required for transfers between gears and vessel size classes, although transfers may be restricted. The unit of account for catch quotas is clear.
Transferable catch quotas are preferred from the law and economics approach to property rights because transferable catch quotas are a stronger and more well defined form of property right than effort due to the problems of defining the unobserved composite input effort and the opportunity for input substitution, investment, and technical progress that continuously changes the balance between nominal and effective effort. In contrast, a kg or ton of a species of fish is clearly defined under the universality characteristic of property rights.
Area and real-time season restrictions may be required for both approaches, with a greater need with effort management to insure mortality rates for certain species. Area and real-time season restrictions in both cases serve to separate gear groups and vessel size classes and protect species during vulnerable periods such as spawning and when large concentrations of juveniles are present.
In multispecies fisheries, issues of discarding, overfishing and underfishing various species arise for both catch and effort regulation, but appear in different guises and with different incentives. In both effort and quota managed fisheries some stocks and species may be excessively exploited (through discards with catch quotas and excess landings with effort quotas) and others under-exploited (through setting of the TAC with catch quotas and low catches with effort quotas). Effort quotas may require supplementary regulations, including area and real-time season restrictions and perhaps stock-and gear-specific measures (e.g. mesh sizes) to insure some control of fishing mortality across species and areas. Catch quotas lead to discards while effort quotas do not, with the latter ostensibly having less direct control over catch and fishing mortality rates on individual species. Some incentive programmes to reduce discards and handle quota overages (e.g. deemed value programmes) exist for quota-managed fisheries (Squires et al., 1998; Sanchirico et al., 2006). Shepherd (2003, p. 2) states, “…in adopting effort control we would be accepting that fine-tuning the management of individual stocks in a fishery is impossible, and that effective but broad-brush control would be preferable
27 Global experience shows that catch quotas allocated to multi-vessel companies or groups of companies voluntarily working together leads to vessel reductions as companies retain only the most efficient vessels for harvesting.
71Effort rights-based management
to the apparent (but actually ineffective) precision management using TACs and quotas.” Bycatch of protected species such as sea turtles, sea birds, and sharks plague both management systems, and effort controls may be insufficient for endangered species with low populations at risk of extinction28.
From the bioeconomic perspective, no clear advantage exists for either TAC or TAE approaches (abstracting from catch or effort quotas as rights based management). Instead, the sources and extent of uncertainty determine which is more advantageous. The principal causes of uncertainty are: unexpected realizations in terms of the stock size (including stock-recruitment relationship) such that the TAC is set at too high or too low a level, and unexpected realizations in terms of the catch-effort relationship such that the TAE is set at an inappropriate level (q can be a real culprit).
From the population dynamics perspective, an effort-based approach has certain advantages. Shepherd (2003, p. 1) states, “Under an effort control system it is no longer necessary to predict the fishable stock size accurately every year to fix a TAC, as the level of fishing mortality is restrained directly, irrespective of the continual fluctuations of stock size, by controlling the level of fishing effort, which need only be adjusted occasionally and progressively in order to achieve medium-term management objectives. The landings would of course continue to vary with the natural fluctuations of stock size, but this would occur automatically and they would not need to be predicted in advance.”29 . Thus depending on the uncertainty regarding realization of stock size and catch-effort relationship, fisheries under effort management may be less likely to be overfished during poor years because overall limits are set on effort rather than catch. Thus poor years will result in lower catches for a given amount of effort. However, in the case of constant catch quotas, as the biomass declines, the catch stays the same so that the fishing mortality will increase, which may result in a highly depleted stock. Some form of control rule, which may involve estimating the abundance, is needed to modify the catch to avoid endangering the stock under catch quotas. These conclusions are strengthened the weaker or the more variable is the stock-recruitment relationship relative to the harvest-effort relationship.
Both effort and catch based quotas require the estimation of Fmsy and therefore the difference between the two approaches lies in the accuracy of estimating B versus q. Precise estimates of Fmsy may not be necessary due to the flat nature of the yield curve, particularly when recruitment is weak or even independent of stock size. Moreover, in an equilibrium sense, fishing at Fmsy by using effort quotas may be more robust to errors in the estimates of Fmsy than fishing at Fmsy using catch quotas. The total effect is that scientific advice based on effort regulation may be expected to be relatively more robust than with catch regulation.
Practical and cost issues of implementation, including MCS, and enforcement, along with the political economy of achieving cooperation to actually implement a programme, can be important factors. Monitoring and enforcing the volume of catch
28 This may require supplemental measures that are technical (e.g. circle instead of J hooks, FAD design, sorting grids), spatial such as MPAs, and economic (biodiversity offsets, biodiversity markets such as payments for ecosystem services, incentive programmes).
29 Danielsson (2002, p. 21) states, “When biological dynamics is introduced, the catch in the present period affects negatively the availability of fish in future periods. In this case it is to be expected that the within-the-period self-correcting mechanism of the effort quota management reduces the risks of under-utilization and over-exploitation, contributing to the superiority of effort quota management. These conclusions change when the CPUE is made stochastic. In this case it is reasonable to expect that management with effort quotas will make under-utilisationand over-fishing more probable, favouring management with catch quotas. Thefinal outcome concerning the relative superiority of the two types of managementwill therefore depend on the relative importance of the stochastic variations in thegrowth of the stock and the stochastic variations in the CPUE”17
72 Effort rights in fisheries management – General principles and case studies from around the world
in a catch quota system is likely to be more expensive than enforcing the volume of effort in an effort quota system, especially with VMS that tracks days, hours, and areas fished and transited. Costs are lower with effort management because there is a reduced need to accurately report and record landings and to prevent under-reporting and misreporting, which otherwise undermine the whole system, and for effective enforcement (prevention of fishing) when quotas have been exhausted (Shepherd, 2003). There is also reduced or no need for comprehensive scientific assessments that track the fluctuations in the state of the stocks rather accurately (preferably to better than ten percent) so that TACs can be set correctly (Shepherd 2003, n.d.).These costs can be high and only feasible when the fishery is of sufficiently high commercial value; in other instances, an effort-based approach may be more cost-effective. Benefits from catch quota rights-based management must thus be sufficiently large relative to the increased management costs in quota reconciliation, MCS, and enforcement to favour catch-based over effort-based rights-based management (Barton, 2002; Grafton and McIlgorn, 2009; Shepherd, 2003; Cotter, 2010). Achieving such large benefits is easiest in commercially important fisheries that are within national waters and with limited species complexity.
The issue is likely to be settled on a fishery-by-fishery basis, with a clear nod to effort-based approaches in: complex multispecies fisheries in developing countries (especially when there are complex tropical multispecies ecosystems) where TAC-based management is more difficult and expensive and stock assessments difficult; in pot fisheries where effort management is pervasive; and in fisheries with highly variable stock-recruitment and subsequent high stochastic variation in resource stock, such as shrimp and squid and perhaps some small pelagic species, and when escapement is important such as salmon. The critical issues for other fisheries outside of MCS, enforcement, and stock assessment costs and political economy may be: a standardized and agreed measure for the relationship between fishing effort and fishing mortality, reflecting the two principal sources of uncertainty including technical change30, and for effort itself; the greater difficulty of effort systems to inherently address overcapacity growing through investment, input substitution, and increasingly productive capital and effort due to technical change; discards under catch quotas; and the feasibility of fine-tuning the management of individual stocks in a fishery and the validity that effective but broad-brush control would be preferable to the apparent precision management using TACs and quotas.
Bycatch of protected species such as sea turtles, birds, and sharks are likely independent of either system. Maintaining an underlying license limitation scheme can safeguard against pressures to expand the TAE or TAC. The above discussion does not address broader concerns of ecosystem management.
REFERENCESAghion, P. & Howitt, P. 2009. The economics of growth. Cambridge, Massachusetts. MIT
Press, 494 pp.Aqorau, T. 2009. Recent developments in Pacific tuna fisheries: the Palau Arrangement
and the Vessel Day Scheme. The International Journal of Marine and Coastal Law, 24:557–81.
Allen, R., Bayliff, W., Joseph J., & Squires, D. 2009. Rights-based management in transnational tuna fisheries. In R. Allen, J. Joseph, & D. Squires, eds. Conservation and management of transnational fisheries. Ames, Iowa: Wiley-Blackwell.
30 (1) Unexpected realizations in terms of the stock size such that the TAC is set at too high or too low a level and (2) Unexpected realizations in terms of the catch-effort relationship such that the TAE is set at an inappropriate level.
73Effort rights-based management
Allen, R., Joseph, J. & Squires, D. 2010. Managing world tuna fisheries with emphasis on rights-based management. In: R.Q. Grafton, R. Hilborn, D. Squires, M. Tait, & M. Williams, eds. Handbook of marine fisheries conservation and management. Oxford: Oxford University Press. Pp. 698-712.
Andersen, P., Frost, H. & Vestergaard, N. 2014. Effort management in the Danish fishery for blue mussels. Chapter 7 in this volume.
Baland, J.M. & Platteau, J.P.1996.Halting degradation of natural resources: is there a role for rural communities? Oxford: Oxford University Press.
Barrett, S. 2003. Environment and statecraft: The strategy of environmental treating making. Oxford: Oxford University Press, 446 pp.
Barton, J. 2002. Fisheries and fisheries management in Falkland Islands Conservation Zones. Aquatic Conservation: Marine and Freshwater Ecosystems,12: 127-135.
Baudron, A. 2007. Evaluation of effort-based management in the Faroe Plateau cod fishery: comparison with TAC management using FLR. Mémoire de fin d’études, Pour l’obtention du Diplôme d’Agronomie Approfondie (DAA) Spécialisation Halieutique. Agrocampus Rennes, France, 48 pages.
Baudron, A., Ulrich, C., Nielsen, J.R. & Boje, J. 2010. Comparative evaluation of a mixed-fisheries effort-management system based on the Faroe Islands example. ICES Journal of Marine Science, 67: 1036–1050.
Bishop, M., O’Brien, V. & Pond, P.1992. Future management of the Torres Strait prawn fishery - A discussion paper. Australian Fisheries Management Authority and Queensland Fisheries Management Authority, Torres Strait Prawn Task Force.
Blackorby, C., Primont, D. &Russell, R. 1978.Duality, separability, and functional structure: theory and economic applications. New York: North-Holland.
Boardman, A., Greenberg, D., Vining, A. & Weimer, D. 2011. Cost-benefit analysis: concepts and practice. New Jersey: Prentice-Hall.
Borg, N. & Metzner, R. 2001. Effect of tradeable property rights on fleet capacity and licence concentration in the Western Australian Pilbara trap fishery. In R. Schotten, eds., Case studies on the effects of transferable fishing rights on fleet capacity and concentration of quota ownership. FAO Fisheries Technical Paper No. 412. Rome: Food and Agriculture Organization of the United Nations, pp. 59-69.
Branch, T.A., Hilborn, R., Haynie, A.C., Fay, G., Flynn, L., Griffiths, J., Marshall, K.N., Randal, J.K., Scheuerell, J.M., Ward, E.J., &Young, M.2006. Fleet dynamics and fishermen behaviour: lessons for fisheries managers. Can. J. Fish. and Aquatic Sciences, 63(7): 1647-1668.
Buisman, E., Frost, H., Hoff, A., Murillas, A, & Powell, J. 2009. Evaluating economic efficiency of innovative management regimes. In K.H. Haugen and D.C. Wilson, eds., Comparative evaluations of innovative fisheries management: Global experiences and European prospects. London: Springer, Chapter 7, pp. 143-162.
Butterworth, D. S. &Penney, A.J.2004. Allocation in high seas fisheries: avoiding meltdown. Management of shared fish stocks. International approaches to management of shared stocks - problems and future directions, Centre for Environment, Fisheries and Aquaculture Science (CEFAS), Lowestoft, UK, July 2002, pp. 165-189.
Bulte, E. & Damania, R. 2005. An economic assessment of wildlife farming and conservation. Con. Bio., 19(4): 1222-1233.
Caballero-Miguez, G., Varela-Lafuente, M. & Garza-Gil, M.D. 2014. Institutional change, fishing rights and governance mechanisms: The dynamics of the Spanish 300 fleet on the Grand Sole fishing grounds. Marine Policy, 44: 465-472.
Cocking, L., Turnbull, C., Jacobsen, I. & Sachs, P. 2012. Torres Strait prawn fishery handbook 2012. Canberra, Australia: Australian Fisheries Management Authority.
Cotter, J.2010. Reforming the European common fisheries policy: a case for capacity and effort controls. Fish and Fisheries, 11(2): 210-219.
74 Effort rights in fisheries management – General principles and case studies from around the world
Curtis, R. & Squires, D., eds. 2007. Fisheries Buybacks. Wiley-Blackwell.Daan, N. & Rijnsdorp, A. 2006. Effort management for mixed fisheries in EU waters: a
viable alternative for failing TAC management? ICES CM, 2006/R:09Danielsson, A.2002. Efficiency of catch and effort quotas in the presence of risk. J. Environ.
Econ. Man.43: 20–33.Deacon, R. 2012. Fishery management by harvester cooperatives. Rev. Environ. Econ.
Policy, 6(2): 258-277.Demarest, C.2002. Tradable fishing effort in the New England groundfish fishery. Program
in Environmental Studies, Brown University. (MA Thesis).Department of Fisheries and Oceans Canada. 2012. Integrated fisheries management plan
salmon southern B.C. June 1, 2012 to May 31, 2013, 277 pages.Dupont, D. 1991. Testing for input substitution in a fishery. Am. J. Agr. Econ., 73(1):
155–164.Elliston, L. & Cao, L. 2004. Managing Effort Creep in Australian Fisheries: An Economic
Perspective. Australian Bureau of Agriculture and Resource Economics, ABARE Report 04.5.
Emery, T., Green, B., Gardner, C., &Tisdell, J. 2012. Are input controls required in individual transferable quota fisheries to address ecosystem based fisheries management objectives? Marine Policy, 36: 122-131.
Environmental Defence Fund (EDF). n.d. Catch Shares Design Manual: A Guide for Fishermen and Managers.
Environmental Defence Fund (EDF).Dungeness Crab Task Force (EDF DCTF). March 2, 2010. DCTF Environmental Defence Fund Memo. (also available at http://www.opc.ca.gov/webmaster/ftp/project_pages/dctf/memoDCTF_EDF_FINAL.pdf)
Fisher, F. 1965. Embodied Technical Change and the Existence of an Aggregate Capital Stock. Review of Economic Studies, 32: 263-88.
Fletcher, W., Chubb, C., McCrea, J., Caputi, N., Webster, F., Gould, R. & Bray, T. 2005. Western Rock Lobster Fishery. ESD Report Series No. 4Department of Fisheries, Western Australian Fisheries and Marine Research Laboratories, North Beach, Western Australia, 112 pp.
Fuss, M.1977. The demand for energy in Canadian manufacturing: An example of the estimation of production structures with many inputs. Journal of Econometrics, 5:89-116.
Garza-Gil, M.D. & Varela-Lafuente, M.M. 2008. The self-governance in the Celtic Sea Spanish fishery, Chapter 6. In R. Townsend, R. Shotten, and H. Uchida, eds, Case Studies in Fisheries Self-Governance, FAO Fisheries Technical Paper 504. Rome: Food and Agriculture Organization of the United Nations, pp 67-76.
Georgeanna, D. & Shrader, D. 2008. The Effects of Days at Sea on Employment, Income and Hours of Work: Some Preliminary Evidence. Human Ecology Review, 15(2): 185-193.
Grafton, RQ, Hannesson, R. Shallard, B., Sykes, D. & Terry, J. 2009.The economics of allocation in tuna regional fisheries management organizations. InR. Allen, J. Joseph, R.Q. Grafton &A. McIlgorm. Ex ante evaluation of the costs and benefits of individual transferable quotas: A case-study of seven Australian commonwealth fisheries. Marine Policy, 33(4) 714–719.
Grafton, RQ, Squires, D. & Fox, K.2000. Private property and economic efficiency: A study of a common-pool resource. Journal of Law and Economics, 43(2): 679-713.
Griffin, R.M. 2007. Transferable Days-At-Sea Allowances in the Gulf of Maine Herring Fishery: An Experimental Analysis. Environmental and Natural Resource Economics, University of Rhode Island. (M.Sc. Thesis)
Hannesson, R.1983. The Bioeconomic Production Function in Fisheries: A Theoretical and Empirical Analysis. Canadian Journal of Fisheries and Aquatic Sciences, 40(7):968–982.
Hannesson, R.1987. Optimal catch capacity and fishing effort in deterministic and stochastic fishery models. Fisheries Research, 5:1–21.
75Effort rights-based management
Hannesson, R. & Steinshamn, S. 1991. How to set catch quotas: constant effort or constant catch? Journal of Environmental Economics and Management, 20: 71–91.
Hannesson, R.1989. Catch quotas and the variability of allowable catch. In P. Neher, R. Arnason & N. Mollett, eds. Rights Based Fishing. Dordrecht: Kluwer Academic Publishers.
Hannesson, R. 2010. Privatization of the oceans. In R.Q. Grafton, R. Hilborn, D. Squires, M. Tait& M. Williams, eds. Handbook of Marine Fisheries Conservation and Management. Oxford: Oxford University Press. Pp. 666-674.
Harte, M. & Barton, J. 2007a. Reforming management of commercial fisheries in a small island territory. Marine Policy, 31: 371-378.
Harte, M. & Barton, J. 2007b. Balancing local ownership with foreign investment in a small island fishery. Ocean & Coastal Management, 50: 523-537.
Havice, E. 2010. The structure of tuna access agreements in the Western and Central Pacific Ocean: Lessons for Vessel Day Scheme planning. Marine Policy, 34(5): 979-987.
Havice, E. 2012. Effort Control through the Vessel Day Scheme: Rights-based Management in the Western and Central Pacific Ocean Tuna Fishery. Paper presented to workshop on transferable effort fisheries management, Bilbao, 17-20 September, 2012.
Holland, D. & Schnier, K.E. 2006. Individual habitat quotas for fisheries, Journal of Environmental Economics and Management, 51: 72-92.
Hulten, C. 1992. Growth accounting when technical change is embodied in capital. American Economic Review, 82(4): 964-980.
Jákupsstovu, S.H.I., Cruz, L. R., Maguire, J.J. & Reinert, J. 2007. Effort regulation of the demersal fisheries at the Faroe Islands: a 10-year appraisal. ICES Journal of Marine Science, 64(4): 730–737.
Jensen, C. 2002. Applications of dual theory in fisheries: A survey. Marine Resource Economics, 17: 319-334.
Just, R., Hueth, D., Schmitz, A. 2005. The Welfare Economics of Public Policy: A Practical Approach to Project and Policy Evaluation. Edward Elgar Publishing.
Khalilian, S., Froese, R., Proelss, A. & T. Requate. 2010. Designed for failure: A critique of the Common Fisheries Policy of the European Union. Marine Policy, 34(6): 1178-1182.
Kompas, T., Che, T.N. & Grafton, R.Q. 2004. Technical efficiency effects of input controls: evidence from Australia’s banana prawn fishery. Applied Economics, 36(15): 1631-1641.
Kompas, T., Che, T.N. & Grafton, R.Q.2008. Fisheries instrument choice under uncertainty. Land Economics, 84: 652–666.
Larkin, S. & Millon, W. 2000. Tradable effort permits: A case study of the Florida Spiny Lobster trap certificate programme. IIFET Proceedings.
Lau, L.1978. Applications of profit functions, in Production Economics: A Dual Approach to Theory and Applications (M. Fuss and D. McFadden, Eds.), Vol. 1.Amsterdam: North-Holland.
Løkkegaard, J., Andersen, J., Boje, J., Frost, H. & Hovgård, H. 2007.Report on the Faroese Fisheries Regulation: The Faroe Model. Report. No. 193, Institute of Food and Resource Economics, University of Copenhagen. 155 pp.
Massachusetts Division of Marine Fisheries. 2010. Lobster Permit & Trap Transfer Policies for 2010 (and beyond) consistent with ASMFC Interstate Lobster Plan Addendum XII, 2 pp.
Maunder, M.N. & Punt, A.E.2004. Standardizing catch and effort data: a review of recent approaches. Fisheries Research, 70(2-3), 141–159.
McCluskey, S.H. & Lewison, R.L.2008. Quantifying fishing effort: a synthesis of current methods and their applications. Fish and Fisheries, 9(2): 188-200.
Moloney, D. & Pearse, P. 1979. Quantitative rights as an instrument for regulating commercial fisheries. Journal of the Fisheries Research Board of Canada, 36: 859-866.
Morgan, G. 2001. Initial allocation of harvest rights in the rock lobster fishery of Western Australia. In R. Schotten, eds., Case Studies on the Effects of Transferable Fishing Rights
76 Effort rights in fisheries management – General principles and case studies from around the world
on Fleet Capacity and Concentration of Quota Ownership. FAO Fisheries Technical Paper, No. 412. Rome: Food and Agriculture Organization of the United Nations. Pp. 136-143.
MRAG, Marine Resources Assessment Group.2006. Allocation issues for WCPFC tuna resources. Report prepared for the WCPFC Secretariat. 88 pp.
MRAG, Marine Resources Assessment Group.2007. Assessment of alternative approaches to implementing Individual Transferable Quotas (ITQs) in the Australian Northern Prawn Fishery (NPF) and identification of the impacts on the fishery of those approaches. Final report to AFMA and NORMAC. 102 pp.
MRAG, IFM, CEFAS, AZTI Tecnalia & PolEM. 2009. An analysis of existing Rights Based Management (RBM) instruments in Member States and on setting up best practices in the EU. Final Report. London: MRAG Ltd. 117 pages.
Nielsen, J.R., Sparre, P.J., Hovgard, H., Frost, H. & Tserpes, G. 2006. Effort and capacity-based fisheries management. Developments in Aquaculture and Fisheries Science, 36: 163-216.
OECD, Organisation for Economic Development and Cooperation.2003. Country note on national fisheries management systems: Spain. Agr/fi/rd(2003)10. (also available at www.oecd.org/dataoecd/10/7/34431325).
OECD, Organisation for Economic Development and Cooperation. 2006. Using Market Mechanisms to Manage Fisheries: Smoothing the Path. Paris.
OECD, Organisation for Economic Development and Cooperation. 2009. Estonia Fisheries and Aquaculture Sector.
Ostrom, E. 1990.Governing the Commons: The Evolution of Institutions for Collective Action. New York: Cambridge University Press.
Pascoe, S., Tingley, D. & Mardle, S. 2002. Appraisal of Alternative Policy Instruments to Regulate Fishing Capacity. Report for the U.K. Department of Environment, Food, and Rural Affairs. Accessed August 10th 2007. (also available at http://statistics.defra.gov.uk/esg/reports/capman/finalrep.pdf).
Pascoe, S., Wilcox, C., Dowling, N., & Taranto, T. 2010. Can incentive-based spatial management work in the Eastern tuna and billfish fishery? Paper presented at the 54th Annual AARES National Conference Adelaide, South Australia, February 10-12, 2010
Pearse, P. From open access to private property: recent innovations in fishing rights as instruments of fisheries policy. Ocean Development and International Law, 23: 71-83, 1992.
Pinfold, G. 2009. A Review of Five Demonstration Projects from the 2008 Salmon Season. Report prepared for Fisheries and Oceans Canada. (also available at http://www.pac.dfo-mpo.gc.ca/fm-gp/species-especes/salmon-saumon/pol/docs/2008-demo-rep-rapp.pdf)
Pope, J.G.2009. Input and output controls: The practice of fishing effort and catch management in responsible fisheries. In K. Cochrane& S. Garcia, eds. A Fishery Manager’s Guidebook, second edition. Ames, Iowa: Wiley-Blackwell. Pp. 220-252.
Quiggin, J. 1992. How to set catch quotas: a note on the superiority of constant effort rules. Journal of Environmental Economics and Management, 22: 199–203.
Reinert, J. n.d. Faroese Waters: Environment, Biology, Fisheries and Management. Faroe Islands: Environment and Fisheries, pp. 110-125.
Ridgeway, L. & Schmidt, C.C. 2010. Economic instruments in OECD fisheries issues and implementation. In R.Q. Grafton, R. Hilbron, D. Squires, M. Tait, &M. Williams, eds. Handbook of Fisheries Conservation and Management. Oxford: Oxford University Press. Pp. 310-323.
Rossiter, T. & Stead, S. 2003. Days at sea: from the fishers’ mouths. Marine Policy, 27(3): 281-288.
Rucker, R., Thurman, W. & Summer, D. 1995. Restricting the market for quota: An analysis of tobacco production rights with corroboration from congressional testimony. Journal of Political Economy, 103(1): 142-175.
77Effort rights-based management
Runolfsson, B., & Arnason, R. 1999. Changes in Fleet Capacity and Ownership of Harvesting Rights in the Icelandic Fisheries. In FAO Case Studies of the Effects of Introduction of Transferable Property Rights on Fleet Capacity and Concentration of Ownership in Marine Fisheries. Rome.
Sanchirico, J., Holland, D., Quigley, K. & Fina, M. 2006. Catch-quota balancing in multispecies individual fishing quotas. Marine Policy, 30(6): 767-785.
Scott, A. 2008. The Evolution of Resource Property Rights. Oxford: Oxford University Press. Pp. 537.
Shanks S. Introducing a transferable fishing day management regime for Pacific Island countries. Marine Policy ,2010; 34(5): 988-994
Shepherd, JG. 2003 Fishing effort control: Could it work under the Common Fisheries Policy? Fisheries Research, 63(2): 149-153.
Shepherd, JG. n.d. Working paper. Fisheries Management : Breaking the Deadlock. School of Ocean and Earth Science, University of Southampton.
Solow, R.M. 1960. Investment and Technical Progress. In K. Arrow, S. Karlin & P. Suppes, eds. Mathematical Methods in the Social Sciences, 1959. Stanford, Calif.: Stanford University Press.
Squires, D. 1994. Firm behaviour under input rationing. Journal of Econometrics, 61:235–57.
Squires, D., Campbell, H., Cunningham, S., DeWees, C., Grafton, R.Q., Herrick, S.F., Kirkley, J., Pascoe, S., Salvanes, K., Shallard, B., Turris, B. & Vestergaard, N. 1998. Individual transferable quotas in multispecies fisheries. Marine Policy, 22 (2): 135-159.
Squires D. 1987. Fishing effort: Its testing, specification, and internal structure in fisheries economics and management. Journal of Environmental Economics and Management, 14(3): 262-282.
Squires, D. 2010. Fisheries Buybacks: A Review and Guidelines. Fish and Fisheries, 11: 366-387.
Squires, D. & Vestergaard, N. In Press. Technical change and the commons. Review of Economics and Statistics.
Squires, D. 2012. Firm Behaviour under Quantity Controls: The Theory of Virtual Quantities. La Jolla, California, National Marine Fisheries Service.
Sutinen, J.1999. What works well and why: evidence from fishery-management experiences in OECD countries. ICES Journal of Marine Science, 56: 1051–1058.
Thomsen, B. 2005. Efficiency changes in the Faeroese pair-trawler fleet. In U. Tietze, W. Thiele, R. Lasch, B. Thomsen, & D. Rihan, eds. Economic performance and fishing efficiency of marine capture fisheries, FAO Fisheries Technical Paper 482. Rome: Food and Agriculture Organization of the United Nations. Pp. 33-43.
Van Kooten, C. & Bulte, E.H. 2000. The Economics of Nature: Managing Biological Assets. Oxford: Blackwell Publishers, 512 pp.
Vestergaard, N. 1999. Multiproduct industries: The case of multispecies individual quota fisheries. Canadian Journal of Economics, 32(3): 729-743.
Vestergaard, N., Jensen, F., & Jorgensen, H.P. 2005. Sunk cost and entry-exit decisions under individual transferable quotas: Why industry restructuring is delayed. Land Economics, 81 (3): 363-378.
Vetemaa, M., Eero, M, & Hannesson, R. 2002. The Estonia fisheries: from the Soviet system to ITQs and quota auctions. Marine Policy, 26(2): 95-102.
Wilen J.1979. Regulatory implications of alternative models of fishermen behaviour. Journal of the Fisheries Research Board of Canada,36(7):855–858.
Yamazaki, S., Kompas, T. & Grafton, R.Q. 2009. Output versus input controls under uncertainty: the case of a fishery. Natural Resource Modelling, 22: 212-236.

79
Is there a case for effort control?
Rögnvaldur Hannesson, Norwegian School of EconomicsE-mail: [email protected]
DIRECT VERSUS INDIRECT CONTROLSFew doubt the need to control fisheries, but how to go about this is more controversial. There are two principal approaches. One is indirect and relies on economic instruments such as a tax on effort or landings to induce fishers to achieve the desired rate of exploitation. The other is one of two direct quantitative controls: output control, which limits the amount of fish to be caught, and input control, which limits the number of boats in the fishery and their use.
Economists have tended to recommend indirect controls for dealing with environmental problems such as pollution. There are two basic reasons for this. First, indirect control through taxes or fees on harmful activities tends to minimize the cost of achieving the target one is trying to achieve. Second, quantitative controls that totally ignore economic incentives can be costly and even self-defeating; firms have no incentives to minimize costs, but every incentive to circumvent quantitative controls that cut into their profits.
Indirect and quantitative controls are not totally at odds, however. Quantitative controls can be combined with incentive mechanisms in such a way that costs are minimized for a given target to be achieved and technological progress accommodated. The best known case is probably the tradable sulphur dioxide emission quotas imposed on American power plants1. Originally, taxes and quotas on sulphur dioxide emissions were posed as two separate ways of dealing with the emission programme. In the end, the emission problem was dealt with by imposing quotas, but the quotas were made tradable so that cost-minimization was achieved. Tradability promoted technological progress that reduced emissions, because it gave the firms a quota surplus that they could sell or bank for later use. This solution has since been emulated for carbon dioxide emission quotas. Despite enthusiastic advocacy from many economists and others, we have not yet seen an application of a carbon tax, an indirect method of controlling carbon dioxide emissions with the potential advantages of such controls.
Quantitative regulation with appropriate incentives has also been widely adopted in the fishing industry in the form of fish catch quotas that have been made tradable. The result has been similar to what has happened as a result of tradable sulphur emission quotas; the value of the permitted fish catches has been maximized. This value has been maximized partly through cost-minimization such as in the power industry, but also through enhanced product value, which is not an issue with the sulphur emission quotas.
To the best of my knowledge, indirect control of fisheries through taxes on fish landings or taxes on fishing effort is not applied anywhere. One main reason for this could be that such controls would not be welcomed by the fishing industry, as they would make the industry less profitable. This, by itself, is not a valid argument against such controls; however, the fact remains that industries always have an influence on the design of regulations to be imposed. Often, this is quite a decisive influence. For
1 See Schmalensee et al., 1998. Ellerman (2012) maintains that these are now almost defunct, owing to a verdict in the United States Supreme Court than restricts transferability.
80 Effort rights in fisheries management – General principles and case studies from around the world
the fishing industry it is much better to be given fish quotas that can be bought and sold; the profits will be less affected than those restricted by taxes designed to reduce fishing, thereby reducing profitability. Unused quotas can always be rented out or sold permanently. Such considerations undoubtedly played a role in setting up the tradable sulphur emission quotas in the American power industry2.
However, indirect control of the fishing industry by taxes on fish landings or fishing effort has its own problems. Weitzman (2002) made a case for indirect control through a tax on landings. He argued that fish stocks fluctuate for environmental reasons, with fish quotas typically being set before the state of the environment and the size of the fish stock in the next fishing season is revealed. Nevertheless, industry operates in real time and captures its fish in whatever state of the environment and from whatever abundance of fish that prevails, factors typically known only in hindsight. It is also possible to interpret Weitzman to argue that the industry agents observe the abundance of the stocks they are fishing, but this is definitely not the case in the real world3. Fishers observe the amount of fish they catch with whatever effort they exert, and this is what they react to in Weitzman’s model.
The process of the landings tax solution can be summed up in the following way. Fisheries managers want a certain target stock to be left after fishing in order to ensure future growth and recruitment of the stock. This will be called level S. At the beginning of the fishing period the stock abundance is R, which is determined by what was left after fishing in the previous period and the state of the environment in the present period. Management by quota (Q) would set Q = R – S, for simplicity ignoring growth and mortality of the stock during the fishing period. But this will not work, because R is unknown at the time the quota is set. This problem could be avoided by having the fishers stop fishing when the stock has been depleted to the desired level S. This can be accomplished by the landings tax.
The flow of profit over the fishing period will be
(1)
where p is the price of fish, t is the landings tax, and f(z) is the unit cost of fish, which may depend on size of the exploited stock (z). If this is to work, the unit cost of fish must depend on the size of the remaining stock in a predictable way, so that the fishing stops when f(S) = p – t. If this function varies in an unpredictable way between fishing periods this will not work any better than fish quotas set under uncertainty. The unit cost of fish may also be insensitive to the size of the stock, so any error in setting the landings tax correctly would produce a large deviation between the actual S and the target. Furthermore, the price could change during the season. Lastly, the cost relevant in this context is variable cost; that is, such cost as can be avoided by not fishing. Fixed and quasi-fixed costs would not be relevant, calling for some good judgment by fisheries managers of what the relevant costs could be.
Given these uncertainties, it is not unlikely that quantitative controls, despite their attendant problems, would be preferable to indirect controls by taxes, particularly when they can be combined with measures aligning private and social economic incentives, such as the above-mentioned sulphur emission quotas.
2 “Allowances were given to utilities rather than sold because there was no way that a sales-based programme could have passed congress” (Schmalensee et al., 1998, p. 56).
3 “[T]he fishermen react after they have observed the realization of the state of the environment in the form of Rt = F(St-1|εt)” (Weitzman, 2002, p. 328). R is the stock at the beginning of period t, St-1 is the stock left after fishing the previous period, and εt is the state of the environment in period t.
( ) ( )
S
R
p t f z dz− − − ∫
81Is there a case for effort control?
DIRECT CONTROLSAs already mentioned, there are two kinds of direct controls to choose from, output controls and input controls. Output controls have been widely applied and in a manner that goes a long way towards maximizing the benefits from controlling fisheries. This paper focuses on input control, so we will not discuss output control except by comparison with effort control, looking at their comparative advantages and disadvantages.
Note that “fishing effort,” the input we want to control, has two basic dimensions, a capacity dimension and a time dimension. The capacity dimension is related to the size of the fishing fleet while the time dimension is related to how intensely it is used. Fishing effort is the product of fleet capacity and the time fishing; when the fleet is used to its full capacity it generates maximum fishing effort. But fish stocks fluctuate on a shorter time scale than corresponds to the economic lifetime of a fishing boat, and so the fishing fleet, even if optimally sized for “normal” conditions, is likely to not have the appropriate fishing capacity under all circumstances. An example of such would occur in years when the fish stock is in a poor condition and there would be a surplus of boats, whereas in better years there might be too few. Hence there are two “effort” variables we need to control if we want to maximize the economic value of the fishery. One is the capacity of the fishing fleet (number of boats of appropriate design), and the other is the utilization of the fleet. The former needs to be decided on the basis of the variability of the fish stocks, expected fish prices and costs. The latter needs to be decided on the status of the fish stocks in each period and the fleet capacity at hand.
Fishing capacity could be controlled by fishing licenses. To be effective, these licenses would have to be denominated in capacity units coming as close as possible to reflecting the capacity to generate fishing mortality. This is a tall order. Feasibility requires that capacity be defined as easily observed and measurable units. Capacity measures actually used are gross tonnage and kilowatts of engine power. Neither of these is a good proxy of the capacity to be measured. By changing the design of fishing boats it is often possible to increase the fishing power of a boat of a given tonnage; this has given rise to the concept of “paragraph boats” (boats that satisfy certain paragraphs in fisheries regulations), which is well known in Norway, and similar phrases probably exist elsewhere (the raisons d’être certainly do).
Similarly, the fishing power of a boat of certain physical dimension can be changed by various types of equipment installed on board; a more powerful engine, better navigational instruments, fish-finding equipment, etc. Eigaard (2009) describes how Danish boats of a similar size and shape vary with respect to the equipment installed, as does their fishing power. Defining and measuring fishing capacity is quite complicated, and controlling fishing mortality by fleet capacity and its use is a cumbersome and imprecise approach.
The use of capacity can be controlled by time limits such as fishing days. To set these appropriately, one would need to know the capacity of the fleet in terms of fishing mortality, given that the purpose is to leave a certain amount of fish to grow and breed. Transferability of fishing days would maximize the profits generated by the number of days available within a fishing season, but there would be problems if the trade in fishing days occurs because some can catch more fish per day than others, as this would run afoul of the management motive to leave behind a certain amount of fish.
A problem with controlling the use of fishing fleets by a temporal measure such as days fishing is that actual fishing effort can be increased by variable factors of production. In the Faeroe Islands fishing days are used to control fishing effort. Eigaard et al. (2011) describe how this has been rendered ineffective through increasing the number of hooks used per day in the longline fishery.

82 Effort rights in fisheries management – General principles and case studies from around the world
EFFORT VERSUS QUOTA: TECHNICAL PROGRESSOne of the advantages of transferable catch quotas is that they go a long way towards providing incentives to invest and use fishing boats to their most optimal advantage. Catch quotas for fluctuating fish stocks are usually determined as shares of the permitted catch; a quota holder has a certain share of the total permitted catch from a specific fish stock each year. If the setting of catch quotas follows clear rules, a fish quota holder can form expectations about future catch possibilities based on the best available knowledge of the underlying fish stock and invest in a fishing boat of an appropriate size and shape. Should one find that their boat is too small, given the economies of scale, one could buy the necessary additional quota if the quota shares are transferable. In years when the quotas are too small to allow all boats to be fully used, some boat owners could rent out their quotas to those who believe they can use them more effectively. In this case, the variability of fish caught per day would not be an issue, thereby thwarting the conservation objective of fisheries control. Of course, this is only efficient if the quotas can be effectively controlled. We shall return to the quota control problem below.
One of the most serious disadvantages of effort control, compared with quota control, is the way technical progress plays out. With effort control, technological progress augments the efficiency of existing boats or makes it possible to build new ones with greater fishing power within the given specifications (gross tonnage, kilowatts, length, etc.). This makes it more difficult to attain the desired conservation goals. Indeed, one sometimes hears fisheries managers talk about technical progress as a problem, because it makes it more difficult to attain the conservation goals. If technical progress is an ongoing phenomenon, it would be necessary to steadily adjust the number of boats and their use to allow for the increase in efficiency. It is not easy, of course, to predict technical progress; it is usually not known until after it has occurred, and it has a certain tendency to occur by leaps and bounds. Quota control, on the other hand, automatically accommodates technical progress. Boat owners install new equipment only to the extent it makes it cheaper for them to catch the fish they are allowed to take. If they want to buy new and more powerful boats, they must ensure that they have sufficient quota to justify the cost.
In contrast to transferability of quotas, transferability of fishing licenses could actually make technical progress a problem for fisheries managers. If somebody buys a fishing license from another and invests in a better boat, the total fishing effort would increase, making it necessary to tighten the effort controls to prevent too many fish from being caught.
Substantial technical progress can result from apparently mundane changes in technology. Eigaard et al. (2011) describe how this has played out in the Faeroese longline fishery. Over a short period in the 1990s, swivel lines, skewed hooks and stabilization tanks were introduced in this fishery. This apparently increased productivity quite considerably, by 72 and 154 percent for cod and haddock, respectively, over the period 1986-2002, at an annual rate of increase of 4.3 and 9 percent. An attempt has been made to deal with the effects of technical progress by reducing the number of fishing days. However, at only by 1.5 percent per year compared with the productivity rates, this attempt seems relatively insufficient.
EFFORT VERSUS QUOTA: ENFORCEMENTSo far the arguments have been solidly on the side of catch quota control and against effort control. Is there, then, nothing to be said in favour of effort controls? Two things come to mind. One is enforcement; the other has to do with indiscriminate fishing of several stocks simultaneously.
Consider, first, enforcement. The effectiveness of quota control depends critically on enforcement; any fish landing that is not reported and subtracted from the allotted
83Is there a case for effort control?
quota is a license to catch fish above quota legally. Then there is the problem of throwing away fish at sea. Quotas are usually specified as tonnages of fish without further specification, but some size classes of fish are more valuable than others. It could be profitable, therefore, to throw away less valuable fish to make room for legal landings of more valuable fish. A similar problem can arise when more than one species of fish are caught indiscriminately. The fisher might not have quota for both, and could be tempted to throw away the fish without a quota. We return to this problem below. It may be noted, however, that there is a limit to how far people would go in this type of activity. No fisher has ever earned a living by throwing fish overboard.
The quota control is thus critical, but it is also problematic because it is costly. Fish landings have to be inspected regularly, although not necessarily continuously, and supported by suitable punishment to make violations unattractive. Quota control at sea is particularly problematic, but is practised in the United States, such as in the practice of placing observers aboard fishing boats. Clearly the boats must be above a certain size to make this feasible. A fleet of small craft could also be problematic for monitoring fish landings; these often occur under informal circumstances, and effective monitoring could demand so large and expensive an army of inspectors that it would not be worthwhile.
On the other hand, fishing effort is easy and cheap to control. Fishing boats can be counted and measured and their engine power monitored. Their activities can be observed. To a degree, this can be accomplished even while far out at sea by monitoring systems connected via satellite; the path of navigation can be tracked, and the inferred speed of the vessel providing information about its activity. Such systems are now widely used for relatively large ocean going boats, but this would not be practicable for small boats.
Hence, effort controls provide the ease of monitoring information that is not very relevant, while quota control provides highly relevant information, but the process is fraught with difficulties. We thus face a choice between control variables that in principle are the right ones to focus on but which are difficult to observe and control variables that are easy to observe but not necessarily very relevant. The choice is between two systems, each imperfect in its own way, and it is not clear which is preferable; this is indeed likely to depend on the specifics of each fishery.
THE PROBLEM OF INDISCRIMINATE FISHINGThe problem of indiscriminate fishing of stocks is considered in some detail in a technical companion paper. The problem involves stocks that vary independently. The quotas have to be set before it is fully known how large each stock is, and so the quotas will almost certainly be wrong, some perhaps widely so. The target is to achieve a certain exploitation rate (s). Ignoring fish growth and mortality during the fishing period, the fish quota set for a given period t will be
(2)
where is the stock estimated to be available at the beginning of period t. If the estimated stock is larger than the actual stock, the quota will be too large, and the exploitation rate will exceed the target rate. This could be avoided if instead we use effort control, provided the exploitation rate is proportional to the effort. The efficacy of this rests on several very strong assumptions. First, there is the proportionality between effort and the exploitation rate. This requires that the stock always be evenly distributed over a given area, so that its density is directly proportional to its biomass. Each unit of effort will then remove a constant proportion of the stock, and the total effort will be proportional to the exploitation rate. Second, one needs to know how large an exploitation rate is produced by each level of effort. Third, one must be able
ˆt tQ sX=
ˆtX
84 Effort rights in fisheries management – General principles and case studies from around the world
to measure and control effort in such a way that it is in fact proportional to the fishing mortality it produces. Measures such as engine power or gross tonnage multiplied by days fishing are not likely to be adequate for this.
Now suppose that several stocks are fished indiscriminately; that is, a unit of effort will remove a certain share of all stocks simultaneously. The catch flow from stock i (Yi) will be
Yi = EXi (3)
where E is some given level of effort. With an ideal effort control, E would be equal to the target exploitation rate, assumed to be the same for all stocks4. If all stocks were correctly estimated, quota control would also result in realization of the optimal exploitation rate. But some stocks will be overestimated, and provided that those quotas are caught, the exploitation rate will be too high. But all stocks are, by assumption, fished indiscriminately, so the exploitation rate must be the same for all. What, then, will determine the realized exploitation rate? If the quota control at sea is weak or nonexistent, it is likely that the realized exploitation rate will be determined by the stock that is most overestimated (or least underestimated). This leads to two losses of efficiency. First, the most overestimated stock will be exploited beyond the target rate. This, however, would not happen if all stocks are underestimated, which could occur. Second, if there is no monitoring at sea, fishing will not stop until the quotas for all stocks have been reached, with the catches from those which quotas have been reached being discarded. Alternatively, if there is monitoring at sea, the fishing would stop when the first quota limit has been reached, which could give some stocks unwarranted protection.
The quota control could result in a very substantial waste of fish. Under the assumptions made, effort control would be preferable to quota control. But these assumptions are restrictive. One is that effort control is precise, while stock assessment is not. If we allow for randomness in effort control on a scale comparable with stock assessment the difference between the two is reduced and possibly eliminated. The worst case for effort control occurs if it is believed erroneously that the exploitation rate is proportional to effort. If the catch per unit of effort falls less than proportionally with the stock biomass, the effort control could be way off target, resulting in a severe decline of stock biomass and catches. These results are discussed in greater detail in the companion paper.
CONCLUSIONSome quantitative regulations of fisheries are probably unavoidable; indirect controls via taxes on landings or effort are unlikely to work well, primarily because of uncertainty about how the unit cost of fish caught varies with the exploited stock. The main argument against quota control is its costliness; effort control is easier and cheaper. There are also technical conditions that could make effort control preferable. Such conditions have to do with indiscriminate fishing of different species together with quotas being set on the basis of erroneous stock assessment.
One argument against effort control is its loose relation to what we actually want to control. We want to control the exploitation rate of fish stocks, but the effort exerted need not be closely related to this. The reason is the difficulty of appropriately defining and measuring effort, which in turn provides opportunities to circumvent the regulation.
In contrast to quota control, transferability could make fisheries management more difficult. Investing in more efficient boats accommodated within the given
4 The matter is slightly more complicated, as explained in a footnote in the accompanying paper.
85Is there a case for effort control?
effort licenses would make it necessary to tighten the overall control. Transferability of fishing days within a given season could increase the amount of fish caught and so make the overall control less effective.
REFERENCESEigaard, O.R., Thomsen, B., Hovgaard, H., Nielsen, A. & Rijnsdorp, A.D. 2011. Fishing
Power Increases from Technological Development in the Faroe Islands Longline Fishery. Canadian Journal of Fisheries and Aquaculture Science, 68(11): 1970-1982.
Eigaard, O.R. 2009. A Bottom-up Approach to Technological Development and its Management Implications in a Commercial Fishery. ICES Journal of Marine Science, 66: 916-927.
Ellerman, D. 2012. Is Conflating Climate with Energy Policy a Good Idea? Economics of Energy & Environmental Policy, 1(1): 11-23.
Schmalensee, R., Joskow, P.L., Ellerman, A.D., Montero, J.P. & Bailey, E.M. 1998. An Interim Evaluation of Sulfur Dioxide Emissions Trading. Journal of Economic Perspectives, 12: 53-68.
Weitzman, M. 2002. Landing Fees vs. Harvest Quotas with Uncertain Fish Stocks. Journal of Environmental Economics and Management, 43: 325-338.

87
Effort versus quota control when stocks cannot be targeted
Rögnvaldur Hannesson, Norwegian School of EconomicsE-mail: [email protected]
INTRODUCTIONIt has been argued that effort control is better than quota control because quotas are set on the basis of imprecise stock assessments. An unduly large quota will be set for a stock that is assessed as being more plentiful than it really is, and hence the stock will be depleted more than is desirable. This would not happen with an effort control, provided that the rate of exploitation is proportional to effort and the latter is set appropriately. Hence, the rate of exploitation of the stock would be self-regulating under effort control. Effort control would thus seem much preferable, given that stock assessments can never be precise.
The assumption that the rate of exploitation is proportional to fishing effort is, however, crucial for the validity of this argument. This in turn implies that the stock is evenly distributed over a given area. This assumption does not hold if the distribution of the fish stock depends on its size. Furthermore, there is the “problem” of technological progress in the fishing industry. The effort produced by a new or a better equipped boat will not be the same as the effort produced by a similar but less effective boat. Therefore, to make effort control precise, we need a satisfactory way of measuring technological progress.
A further argument put forward in favour of effort control is that when two or more fish stocks are caught indiscriminately, fish quotas could lead to overexploitation of some stocks. The argument is that the rate of exploitation, common for the jointly fished stocks, would be set by the quota constituting the largest share of the stocks in question and which would likely have been set too optimistically. This would result in fishing over quota for the other stocks. With an effective control of landings but no control at sea, this would result in throwing away fish captured from stocks which quotas have been exceeded. This is waste twice over; first, because marketable fish are thrown away, and second, because some stocks would be overexploited (note, however, that if the quota is set too conservatively because of erroneous stock assessment we would not necessarily have waste of the latter kind; only throwing away of marketable fish). With effort control this situation would be self-correcting; an appropriate level of effort would automatically result in an appropriate share of the stocks being fished. Note again that this argument assumes that the stocks are always evenly distributed over a given area so that a given level of effort results in a certain exploitation rate.
In this paper we examine the validity of these arguments with a simple model of two fish stocks. We allow for erroneous estimation of stocks and the resultant overfishing of one of the stocks in certain periods. It is shown that effort control does indeed perform better than quota control when the exploitation rate is proportional to effort, but the difference does not appear to be great. It is also shown that quota control performs better when the exploitation rate is not proportional to effort but rises when the stock declines, for any given level of effort. This is the case where the catch per unit of effort falls less than proportionally with the stock, which occurs when the area occupied by a stock shrinks as the stock becomes smaller.
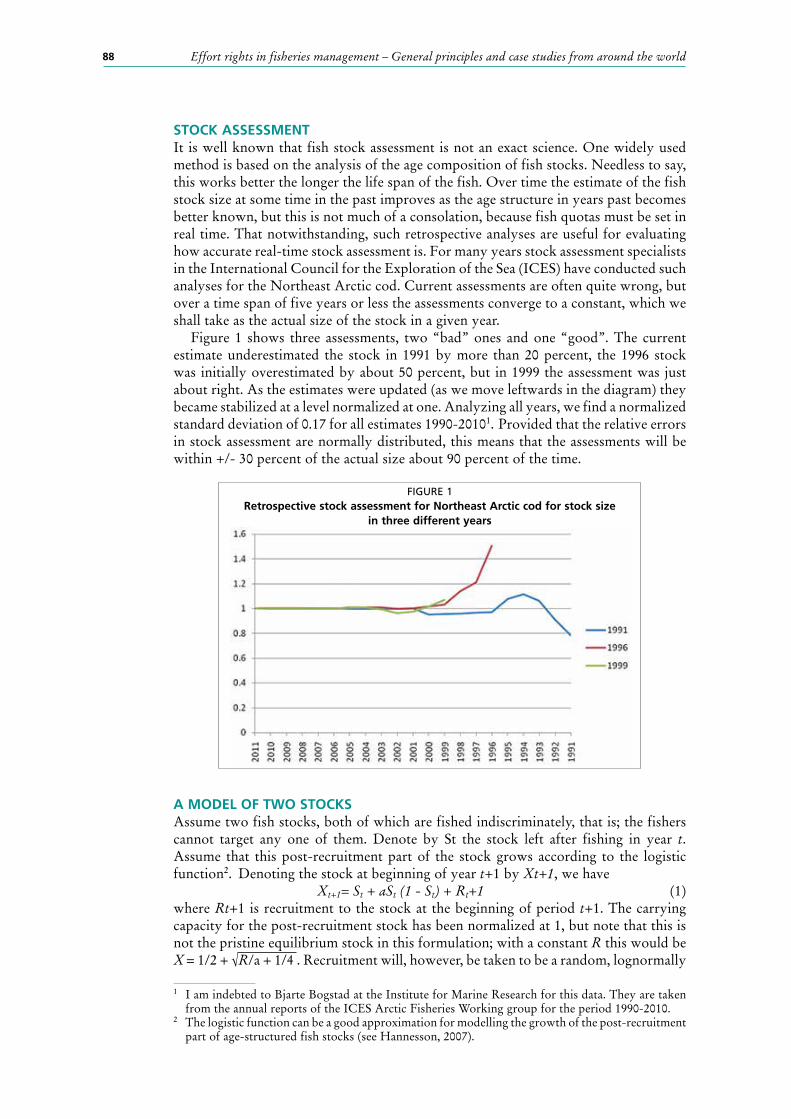
88 Effort rights in fisheries management – General principles and case studies from around the world
STOCK ASSESSMENTIt is well known that fish stock assessment is not an exact science. One widely used method is based on the analysis of the age composition of fish stocks. Needless to say, this works better the longer the life span of the fish. Over time the estimate of the fish stock size at some time in the past improves as the age structure in years past becomes better known, but this is not much of a consolation, because fish quotas must be set in real time. That notwithstanding, such retrospective analyses are useful for evaluating how accurate real-time stock assessment is. For many years stock assessment specialists in the International Council for the Exploration of the Sea (ICES) have conducted such analyses for the Northeast Arctic cod. Current assessments are often quite wrong, but over a time span of five years or less the assessments converge to a constant, which we shall take as the actual size of the stock in a given year.
Figure 1 shows three assessments, two “bad” ones and one “good”. The current estimate underestimated the stock in 1991 by more than 20 percent, the 1996 stock was initially overestimated by about 50 percent, but in 1999 the assessment was just about right. As the estimates were updated (as we move leftwards in the diagram) they became stabilized at a level normalized at one. Analyzing all years, we find a normalized standard deviation of 0.17 for all estimates 1990-20101. Provided that the relative errors in stock assessment are normally distributed, this means that the assessments will be within +/- 30 percent of the actual size about 90 percent of the time.
A MODEL OF TWO STOCKSAssume two fish stocks, both of which are fished indiscriminately, that is; the fishers cannot target any one of them. Denote by St the stock left after fishing in year t. Assume that this post-recruitment part of the stock grows according to the logistic function2. Denoting the stock at beginning of year t+1 by Xt+1, we have Xt+1= St + aSt (1 - St) + Rt+1 (1)where Rt+1 is recruitment to the stock at the beginning of period t+1. The carrying capacity for the post-recruitment stock has been normalized at 1, but note that this is not the pristine equilibrium stock in this formulation; with a constant R this would be X = 1/2 + √R/a + 1/4 . Recruitment will, however, be taken to be a random, lognormally
1 I am indebted to Bjarte Bogstad at the Institute for Marine Research for this data. They are taken from the annual reports of the ICES Arctic Fisheries Working group for the period 1990-2010.
2 The logistic function can be a good approximation for modelling the growth of the post-recruitment part of age-structured fish stocks (see Hannesson, 2007).
FIGURE 1Retrospective stock assessment for Northeast Arctic cod for stock size
in three different years
89Effort versus quota control when stocks cannot be targeted
distributed variable, as the variability in recruitment is the major driver of fluctuations in fish stocks, so the stock would not be in equilibrium even in the absence of fishing, but would fluctuate around a mean value.
We shall compare a quota control regime with an effort control regime under three conditions. First, we take the effort control as being fully deterministic; that is, a given level of effort always results in a given exploitation rate of the stock being fished. This is perhaps an unjust comparison; the impact that a given effort may have on the fish stock to which it is applied is likely to vary randomly, just as the accuracy of stock assessment. Such variations in the impact of effort could be due to factors such as the weather, the location of the fish, and generally to variations in the accessibility of the stock for whatever reason. We therefore also investigate an effort control where the impact of effort is random with the same standard deviation as the stock assessment, with the expected impact of effort set as one. We refer to this as stochastic effort control, not because effort cannot be controlled precisely but because the effect of effort on the fish catch is to some extent random.
As it will turn out and is generally acknowledged; if effort control is to result in a given target rate of exploitation, fishing effort must be proportional to fishing mortality (here we abstract from the randomness in the impact of effort). This would obtain under somewhat special circumstances, namely when the exploited fish stock is always evenly distributed in a given area, irrespective of the size of the stock. This means that the density of the fish is always proportional to the size of the stock. This would not happen when a smaller stock occupies a smaller area so that its density falls less than proportionally with its size. The final effort regime we will consider takes this non-linear density relationship into account, but abstracts from any randomness in the effect of effort.
The quota control regimeUnder quota control, fish quotas are based on stock assessment. We shall assume that the relative deviation from the true stock size is normally distributed with a constant variance. The fish quota for each stock is assumed to be set equal to
(2)
where s is the target rate of exploitation and is the estimated size of stock i.Because the stock estimates will not be precise, the target exploitation rate will rarely
be realized for both stocks. Both are, however, assumed to be fished indiscriminately, in line with the discussion in the Introduction. We shall assume, also in line with the Introduction, that there is an effective control of landings but no control at sea. The fishers will therefore be constrained in their fishing by the quota that it takes longer to catch, with the catches in excess of quota of the other stock being discarded. This means that the common rate of exploitation (v) will be
v = max (Q1 / X1,Q2 /X2) (3)
Hence the actual rate of exploitation will be set by the stock with the highest ratio, that is, by the stock that is most overestimated (or least underestimated). This will lead to two types of inefficiency. First, one or both stocks could be exploited beyond the target rate. Second, catches of fish from the stock where the quota is first exceeded would be thrown away. We can distinguish between the following three types of cases:
• Both stocks are overestimated. Hence, the quotas for both stocks would be set too high. The actual exploitation rate would be determined by the most overestimated stock, and both would be overexploited. Fish from the least overestimated stock would be discarded.
ˆi iQ sX=
ˆiX
ˆ /X X
90 Effort rights in fisheries management – General principles and case studies from around the world
• One stock is overestimated and the other underestimated. The quota would be set too high for the overestimated stock and too low for the underestimated stock. The actual exploitation rate would be determined by the overestimated stock, and both stocks would be overexploited. Fish from the underestimated stock would be discarded even if the quota for it was set too low.
• Both stocks are underestimated. The quota would be set too low for both stocks. The actual exploitation rate would be determined by the least underestimated stock. Both stocks would be underexploited, but fish from the most underestimated stock would be discarded even if the quota was set too low.
The effort control regimeIn the deterministic effort control regime, the effort will always be proportional to the target exploitation rate, so we measure it as the exploitation rate3. Hence, the catch (Y) from each stock will be determined as
Yi = sXi (4)
In the stochastic effort control regime we assume that the impact of effort will vary randomly with a constant expected value and a given variance. Hence, the actual exploitation rate will be random and normally distributed, for an effort that is held constant.
In the third effort control regime the catch per unit of effort is no longer proportional to the stock size. With fishing and fish growth being regarded as two processes separate in time, as we do here for simplicity, the starting point is to note that the decline rate of the fish stock will in this case be given by
(5)
where b is a parameter related to how sensitive the catch per unit of effort is to the size of the stock. When b< 1 the catch per unit of effort (rate of stock change divided by effort) falls less than proportionally with the stock.
To find the catch of fish over a time interval, we integrate (5):
(6)
where K is an arbitrary constant determined by the stock level at the beginning of each period (S0). The stock at the end of the exploitation period of length T will therefore be
(7)
with the catch of fish during the period being simply Y = S0 – ST.The effort exerted (ET; note that effort has a capacity and a time dimension) will be
assumed to be determined so that it would result in the desired rate of exploitation if the catch per unit of effort were proportional to the stock:
bdS ESdt
= −
111
btS Et K
b− = − +
−
( ) 1/(1 )101
bbTS b ET S
−− = − − +
3 The matter is slightly more complicated. Fish catch over a fishing period of a non-trivial length will be, the integral of the catch flow. With stock growth for simplicity assumed to occur after the fishing is over, the catch flow would be , where E is fishing effort, proportional to fishing mortality. The catch over a period of length ∆t would be S0(1 – e-E∆t), and the rate of exploitation (with reference to the initial stock, S0) would be (1 – e-E∆t), which is a deterministic (but not quite linear) function of E and approaches E∆t as this product becomes smaller.
dS ESdt
− =
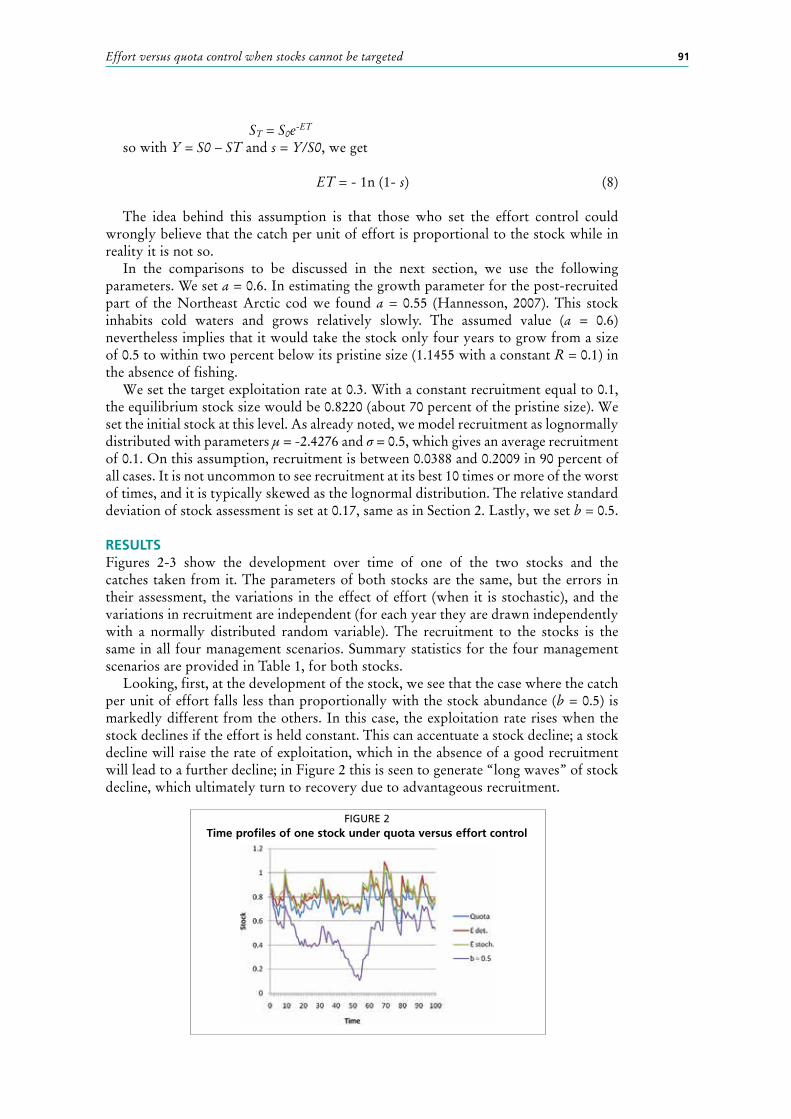
91Effort versus quota control when stocks cannot be targeted
ST = S0e-ET so with Y = S0 – ST and s = Y/S0, we get
ET = - 1n (1- s) (8)
The idea behind this assumption is that those who set the effort control could wrongly believe that the catch per unit of effort is proportional to the stock while in reality it is not so.
In the comparisons to be discussed in the next section, we use the following parameters. We set a = 0.6. In estimating the growth parameter for the post-recruited part of the Northeast Arctic cod we found a = 0.55 (Hannesson, 2007). This stock inhabits cold waters and grows relatively slowly. The assumed value (a = 0.6) nevertheless implies that it would take the stock only four years to grow from a size of 0.5 to within two percent below its pristine size (1.1455 with a constant R = 0.1) in the absence of fishing.
We set the target exploitation rate at 0.3. With a constant recruitment equal to 0.1, the equilibrium stock size would be 0.8220 (about 70 percent of the pristine size). We set the initial stock at this level. As already noted, we model recruitment as lognormally distributed with parameters μ = -2.4276 and σ = 0.5, which gives an average recruitment of 0.1. On this assumption, recruitment is between 0.0388 and 0.2009 in 90 percent of all cases. It is not uncommon to see recruitment at its best 10 times or more of the worst of times, and it is typically skewed as the lognormal distribution. The relative standard deviation of stock assessment is set at 0.17, same as in Section 2. Lastly, we set b = 0.5.
RESULTSFigures 2-3 show the development over time of one of the two stocks and the catches taken from it. The parameters of both stocks are the same, but the errors in their assessment, the variations in the effect of effort (when it is stochastic), and the variations in recruitment are independent (for each year they are drawn independently with a normally distributed random variable). The recruitment to the stocks is the same in all four management scenarios. Summary statistics for the four management scenarios are provided in Table 1, for both stocks.
Looking, first, at the development of the stock, we see that the case where the catch per unit of effort falls less than proportionally with the stock abundance (b = 0.5) is markedly different from the others. In this case, the exploitation rate rises when the stock declines if the effort is held constant. This can accentuate a stock decline; a stock decline will raise the rate of exploitation, which in the absence of a good recruitment will lead to a further decline; in Figure 2 this is seen to generate “long waves” of stock decline, which ultimately turn to recovery due to advantageous recruitment.
FIGURE 2Time profiles of one stock under quota versus effort control
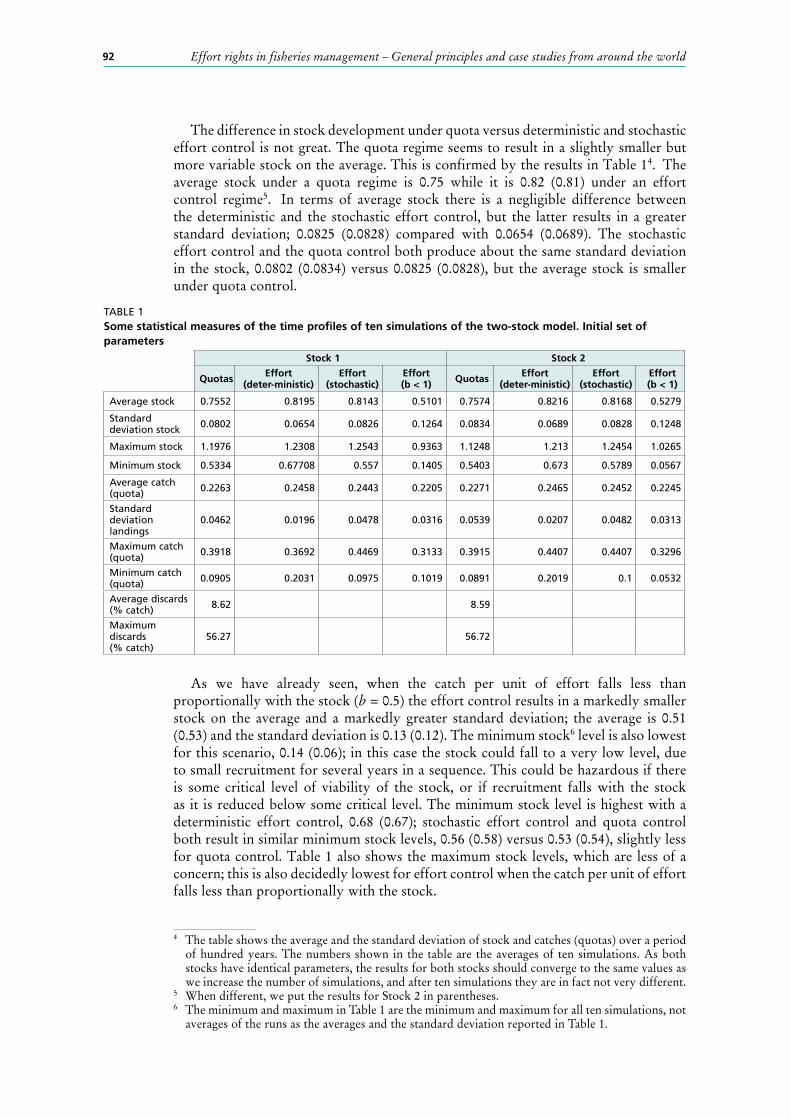
92 Effort rights in fisheries management – General principles and case studies from around the world
The difference in stock development under quota versus deterministic and stochastic effort control is not great. The quota regime seems to result in a slightly smaller but more variable stock on the average. This is confirmed by the results in Table 14. The average stock under a quota regime is 0.75 while it is 0.82 (0.81) under an effort control regime5. In terms of average stock there is a negligible difference between the deterministic and the stochastic effort control, but the latter results in a greater standard deviation; 0.0825 (0.0828) compared with 0.0654 (0.0689). The stochastic effort control and the quota control both produce about the same standard deviation in the stock, 0.0802 (0.0834) versus 0.0825 (0.0828), but the average stock is smaller under quota control.
As we have already seen, when the catch per unit of effort falls less than proportionally with the stock (b = 0.5) the effort control results in a markedly smaller stock on the average and a markedly greater standard deviation; the average is 0.51 (0.53) and the standard deviation is 0.13 (0.12). The minimum stock6 level is also lowest for this scenario, 0.14 (0.06); in this case the stock could fall to a very low level, due to small recruitment for several years in a sequence. This could be hazardous if there is some critical level of viability of the stock, or if recruitment falls with the stock as it is reduced below some critical level. The minimum stock level is highest with a deterministic effort control, 0.68 (0.67); stochastic effort control and quota control both result in similar minimum stock levels, 0.56 (0.58) versus 0.53 (0.54), slightly less for quota control. Table 1 also shows the maximum stock levels, which are less of a concern; this is also decidedly lowest for effort control when the catch per unit of effort falls less than proportionally with the stock.
4 The table shows the average and the standard deviation of stock and catches (quotas) over a period of hundred years. The numbers shown in the table are the averages of ten simulations. As both stocks have identical parameters, the results for both stocks should converge to the same values as we increase the number of simulations, and after ten simulations they are in fact not very different.
5 When different, we put the results for Stock 2 in parentheses.6 The minimum and maximum in Table 1 are the minimum and maximum for all ten simulations, not
averages of the runs as the averages and the standard deviation reported in Table 1.
TABLE 1Some statistical measures of the time profiles of ten simulations of the two-stock model. Initial set of parameters
Stock 1 Stock 2
Quotas Effort (deter-ministic)
Effort (stochastic)
Effort (b < 1) Quotas Effort
(deter-ministic)Effort
(stochastic)Effort (b < 1)
Average stock 0.7552 0.8195 0.8143 0.5101 0.7574 0.8216 0.8168 0.5279
Standard deviation stock 0.0802 0.0654 0.0826 0.1264 0.0834 0.0689 0.0828 0.1248
Maximum stock 1.1976 1.2308 1.2543 0.9363 1.1248 1.213 1.2454 1.0265
Minimum stock 0.5334 0.67708 0.557 0.1405 0.5403 0.673 0.5789 0.0567
Average catch (quota) 0.2263 0.2458 0.2443 0.2205 0.2271 0.2465 0.2452 0.2245
Standard deviation landings
0.0462 0.0196 0.0478 0.0316 0.0539 0.0207 0.0482 0.0313
Maximum catch (quota) 0.3918 0.3692 0.4469 0.3133 0.3915 0.4407 0.4407 0.3296
Minimum catch (quota) 0.0905 0.2031 0.0975 0.1019 0.0891 0.2019 0.1 0.0532
Average discards (% catch) 8.62 8.59
Maximum discards (% catch)
56.27 56.72

93Effort versus quota control when stocks cannot be targeted
Figure 3 shows the time profile of catch quotas under the quota control regime and the catches under the three effort control regimes. There is less difference between these than is the case for the stock level. As we might expect, the average catch is lowest for effort control when the catch per unit of effort falls less than proportionately with the stock, 0.22. But the average quota is not much higher under quota control, 0.23. Deterministic effort control results in a slightly greater catch on the average, or 0.25, and stochastic effort control almost the same 0.24 (0.25).
Stochastic effort control and quota control result in about the same variability of fish landings; the standard deviation of catch quotas is 0.0462 (0.0539) and 0.0478 (0.0482) for catches with stochastic effort control. The standard deviation of catches with effort control and b = 0.5 is lower, 0.0316 (0.0313), which may seem surprising, given that the variability of the stock is greatest under this regime. The explanation lies in the less sensitivity of the catch per unit of effort to the stock; the catch is relatively stable with a constant effort despite the variation in the stock, which in turn amplifies the variability of the stock. The standard deviation is lowest for deterministic effort control, 0.0196 (0.0207).
One major difference between the effort regime and the quota regime is the discards that would occur under the quota regime in the absence of controls at sea. As already discussed, what would then presumably happen is that all catches above quota for one stock would be thrown away as long as there is any quota remaining for the other stock. Figure 4 shows the discards this would result in. We see that the catches above quota are almost 50 percent at their highest and certainly quite significant on the average; in Table 1 we see that the average for the ten simulations is 8.6 percent, and the highest discards in any simulation are 56 (57) percent of the quota. This certainly is a major waste. According to the above results, the consequences for the stock are not very great; the average stock is lower under quota control, but not nearly as low as with effort control when the catch per unit of effort falls less than proportionally with the stock. The average quota and its standard deviation are not very different from the average catch and its standard deviation under effort control.
FIGURE 3Time profile of landings from one stock under
quota versus effort controls
FIGURE 4Discards under the quota regime
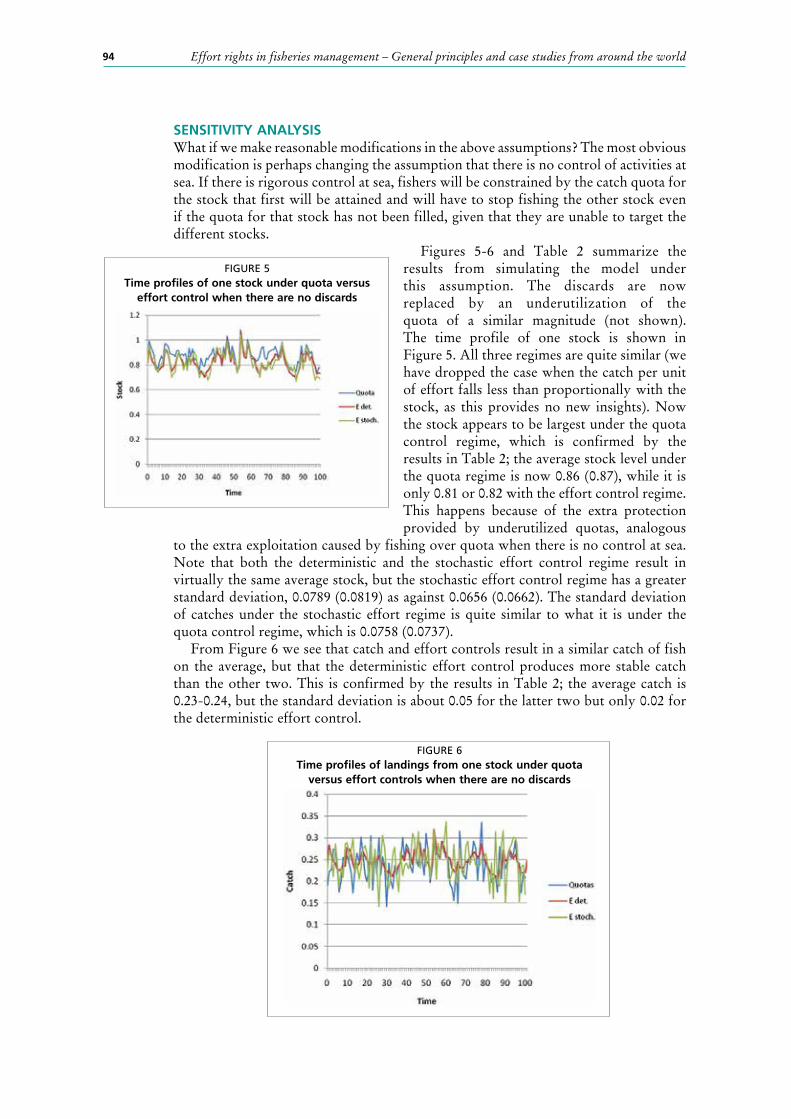
94 Effort rights in fisheries management – General principles and case studies from around the world
SENSITIVITY ANALYSISWhat if we make reasonable modifications in the above assumptions? The most obvious modification is perhaps changing the assumption that there is no control of activities at sea. If there is rigorous control at sea, fishers will be constrained by the catch quota for the stock that first will be attained and will have to stop fishing the other stock even if the quota for that stock has not been filled, given that they are unable to target the different stocks.
Figures 5-6 and Table 2 summarize the results from simulating the model under this assumption. The discards are now replaced by an underutilization of the quota of a similar magnitude (not shown). The time profile of one stock is shown in Figure 5. All three regimes are quite similar (we have dropped the case when the catch per unit of effort falls less than proportionally with the stock, as this provides no new insights). Now the stock appears to be largest under the quota control regime, which is confirmed by the results in Table 2; the average stock level under the quota regime is now 0.86 (0.87), while it is only 0.81 or 0.82 with the effort control regime. This happens because of the extra protection provided by underutilized quotas, analogous
to the extra exploitation caused by fishing over quota when there is no control at sea. Note that both the deterministic and the stochastic effort control regime result in virtually the same average stock, but the stochastic effort control regime has a greater standard deviation, 0.0789 (0.0819) as against 0.0656 (0.0662). The standard deviation of catches under the stochastic effort regime is quite similar to what it is under the quota control regime, which is 0.0758 (0.0737).
From Figure 6 we see that catch and effort controls result in a similar catch of fish on the average, but that the deterministic effort control produces more stable catch than the other two. This is confirmed by the results in Table 2; the average catch is 0.23-0.24, but the standard deviation is about 0.05 for the latter two but only 0.02 for the deterministic effort control.
FIGURE 6Time profiles of landings from one stock under quota
versus effort controls when there are no discards
FIGURE 5Time profiles of one stock under quota versus
effort control when there are no discards
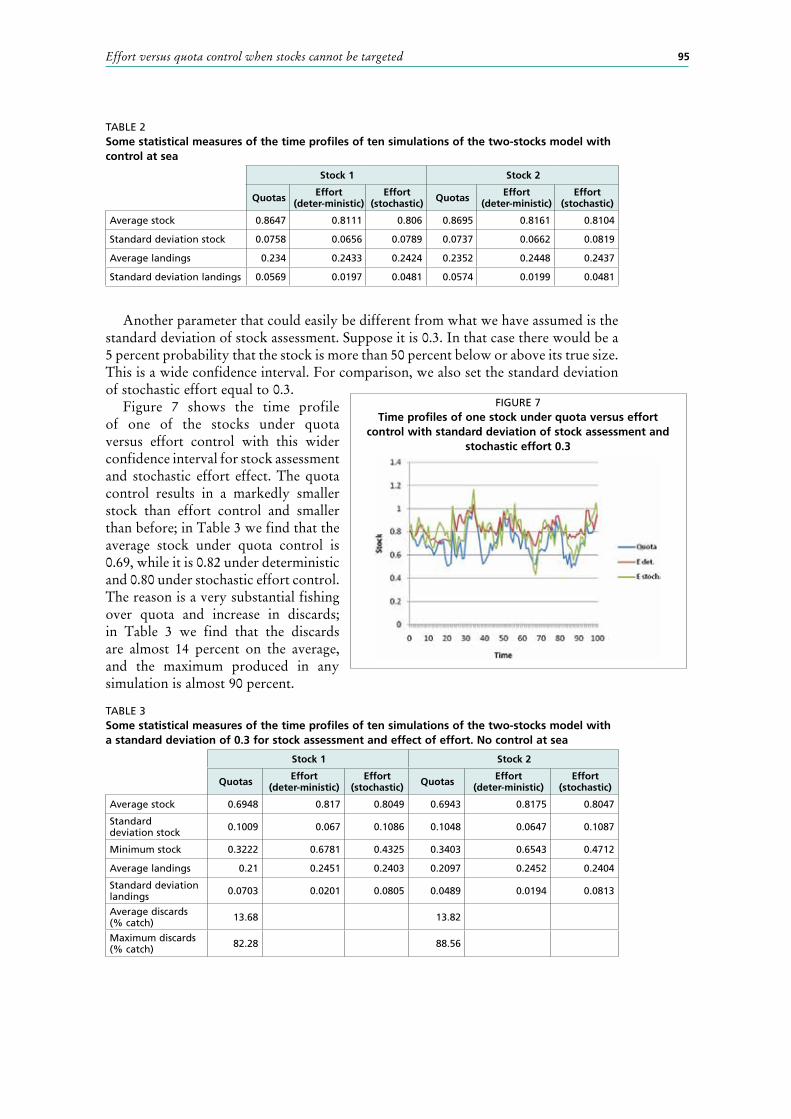
95Effort versus quota control when stocks cannot be targeted
TABLE 2Some statistical measures of the time profiles of ten simulations of the two-stocks model with control at sea
Stock 1 Stock 2
Quotas Effort (deter-ministic)
Effort (stochastic) Quotas Effort
(deter-ministic)Effort
(stochastic)
Average stock 0.8647 0.8111 0.806 0.8695 0.8161 0.8104
Standard deviation stock 0.0758 0.0656 0.0789 0.0737 0.0662 0.0819
Average landings 0.234 0.2433 0.2424 0.2352 0.2448 0.2437
Standard deviation landings 0.0569 0.0197 0.0481 0.0574 0.0199 0.0481
Another parameter that could easily be different from what we have assumed is the standard deviation of stock assessment. Suppose it is 0.3. In that case there would be a 5 percent probability that the stock is more than 50 percent below or above its true size. This is a wide confidence interval. For comparison, we also set the standard deviation of stochastic effort equal to 0.3.
Figure 7 shows the time profile of one of the stocks under quota versus effort control with this wider confidence interval for stock assessment and stochastic effort effect. The quota control results in a markedly smaller stock than effort control and smaller than before; in Table 3 we find that the average stock under quota control is 0.69, while it is 0.82 under deterministic and 0.80 under stochastic effort control. The reason is a very substantial fishing over quota and increase in discards; in Table 3 we find that the discards are almost 14 percent on the average, and the maximum produced in any simulation is almost 90 percent.
TABLE 3Some statistical measures of the time profiles of ten simulations of the two-stocks model with a standard deviation of 0.3 for stock assessment and effect of effort. No control at sea Stock 1 Stock 2
Quotas Effort (deter-ministic)
Effort (stochastic) Quotas Effort
(deter-ministic)Effort
(stochastic)
Average stock 0.6948 0.817 0.8049 0.6943 0.8175 0.8047
Standard deviation stock 0.1009 0.067 0.1086 0.1048 0.0647 0.1087
Minimum stock 0.3222 0.6781 0.4325 0.3403 0.6543 0.4712
Average landings 0.21 0.2451 0.2403 0.2097 0.2452 0.2404
Standard deviation landings 0.0703 0.0201 0.0805 0.0489 0.0194 0.0813
Average discards (% catch) 13.68 13.82
Maximum discards (% catch) 82.28 88.56
FIGURE 7Time profiles of one stock under quota versus effort
control with standard deviation of stock assessment and stochastic effort 0.3
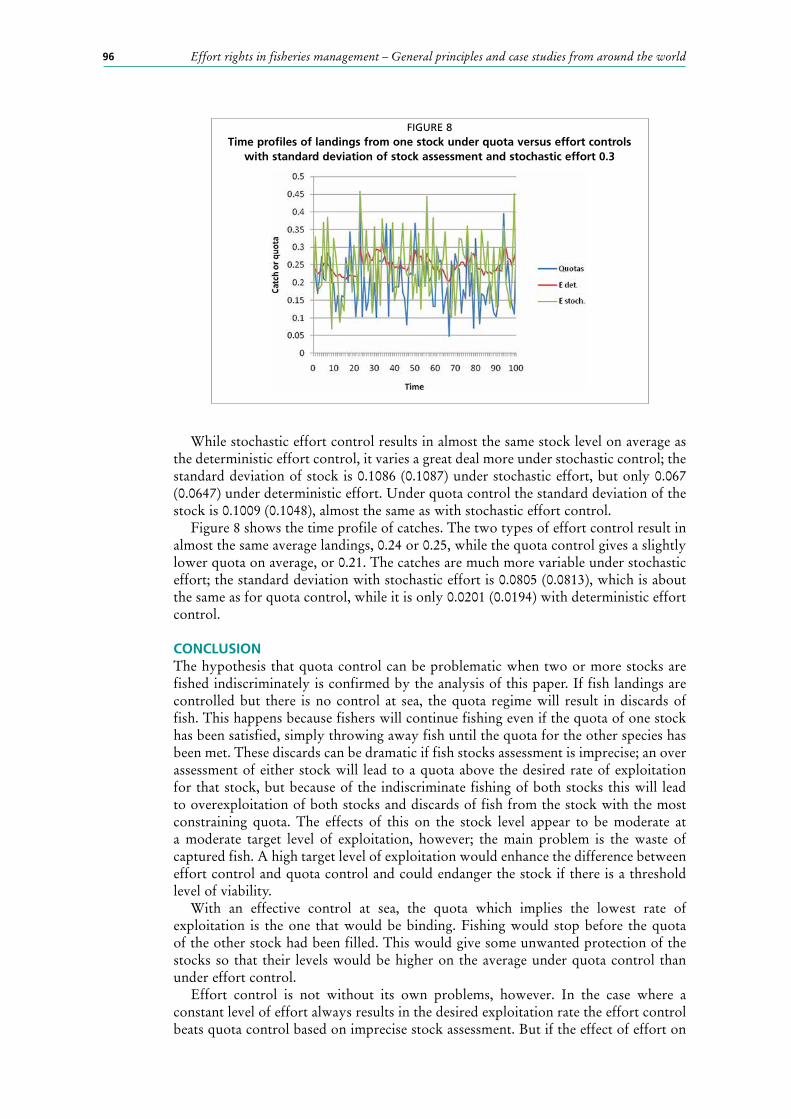
96 Effort rights in fisheries management – General principles and case studies from around the world
While stochastic effort control results in almost the same stock level on average as the deterministic effort control, it varies a great deal more under stochastic control; the standard deviation of stock is 0.1086 (0.1087) under stochastic effort, but only 0.067 (0.0647) under deterministic effort. Under quota control the standard deviation of the stock is 0.1009 (0.1048), almost the same as with stochastic effort control.
Figure 8 shows the time profile of catches. The two types of effort control result in almost the same average landings, 0.24 or 0.25, while the quota control gives a slightly lower quota on average, or 0.21. The catches are much more variable under stochastic effort; the standard deviation with stochastic effort is 0.0805 (0.0813), which is about the same as for quota control, while it is only 0.0201 (0.0194) with deterministic effort control.
CONCLUSIONThe hypothesis that quota control can be problematic when two or more stocks are fished indiscriminately is confirmed by the analysis of this paper. If fish landings are controlled but there is no control at sea, the quota regime will result in discards of fish. This happens because fishers will continue fishing even if the quota of one stock has been satisfied, simply throwing away fish until the quota for the other species has been met. These discards can be dramatic if fish stocks assessment is imprecise; an over assessment of either stock will lead to a quota above the desired rate of exploitation for that stock, but because of the indiscriminate fishing of both stocks this will lead to overexploitation of both stocks and discards of fish from the stock with the most constraining quota. The effects of this on the stock level appear to be moderate at a moderate target level of exploitation, however; the main problem is the waste of captured fish. A high target level of exploitation would enhance the difference between effort control and quota control and could endanger the stock if there is a threshold level of viability.
With an effective control at sea, the quota which implies the lowest rate of exploitation is the one that would be binding. Fishing would stop before the quota of the other stock had been filled. This would give some unwanted protection of the stocks so that their levels would be higher on the average under quota control than under effort control.
Effort control is not without its own problems, however. In the case where a constant level of effort always results in the desired exploitation rate the effort control beats quota control based on imprecise stock assessment. But if the effect of effort on
FIGURE 8Time profiles of landings from one stock under quota versus effort controls
with standard deviation of stock assessment and stochastic effort 0.3
97Effort versus quota control when stocks cannot be targeted
the rate of exploitation is itself stochastic with the same variance as stock assessment, the results are less clear cut. In this case effort will not automatically result in the desired rate of exploitation. It will, however, provide a greater stock on the average than quota control, but it will be about as variable as with quota control with discards. The most problematic case with effort control is when the catch per unit of effort is erroneously believed to be proportional to the stock while it in fact is less sensitive to the stock. Here effort control would result in a substantially smaller and more variable stock than quota control. The average landings would however not be much different, because of the large discards under quota control.
Important issues of effort control are not addressed in this paper. The most important of these are technological progress, input substitution, and incentives to overinvest. Technological progress will increase the exploitation rate for a given level of effort, unless a way has been found to take into account the effort-enhancing effects of technological progress. Effort controls are for practical reasons unlikely to include all components of effort; for practical reasons effort is likely to be defined in some easy-to-measure way, such as fishing corrected for vessel size, engine power, or some other technical variable. This will leave out more subtle technical variables such as fish-finding equipment, navigational instruments, and fishing gear design. Lastly, effort controls do not address the incentives to invest in bigger and better equipped boats for the sole purpose of getting a larger share of a fish catch that in the long term is determined by the productivity of the fish stocks.
REFERENCESHannesson, R. 2007. Cheating about the cod. Marine Policy, 31:698-705.

99
On fisheries and property rights
Ikerne del Valle Erkiaga, University of the Basque Country (UPV-EHU), Department of Applied Economics VE-mail: [email protected]
Kepa Astorkiza Ikazuriaga, University of the Basque Country (UPV-EHU), Department of Applied Economics VE-mail: [email protected]
INTRODUCTION: THE FISHERIES PROBLEM & PROPERTY RIGHTS Open access fisheries (like some forests, irrigation districts, groundwater basins, clean air, etc.) are common pool resources (CPRs). Two particular features distinguish CPRs from conventional private economic goods that can be purchased and traded within a conventional market: rivalry and non-excludability. Rivalry means that one’s catches reduces the resource availability for other fishers. Non-excludability implies that it is impossible, infeasible and/or extremely costly to exclude other fishers from harvesting.
The above mentioned two characteristics lead to a number of different derived problems or negative externalities, which following Ostrom et al. (1994) can be grouped in appropriation and provision problems. Appropriation problems include appropriation, congestion, technology and spatial externalities arising when beneficiaries are presented with a dilemma of how to exclude others and allocate a subtractable flow of the resource. Provision problems result when beneficiaries are faced with the problem of maintaining or developing a resource and preventing it from depletion. Provision problems can emerge both from the demand and supply side.
Any commercial fishery may exhibit several types of the above-mentioned externalities (Munro & Scott, 1985; Boyce, 1992; Ostromet al., 1994; Danielson, 2000). Nevertheless, the fundamental one is the appropriation externality derived from the resource base itself. The stock is a limited and free input in each firm’s production function. Thus, each firm, by fishing, reduces the harvesting possibilities of others. Demand side provision problems resulting from the excess demand of harvesters fishing at a rate greater than the rate of reproduction are also a common matter of commercial fisheries. Extracting at such rates may have a net negative effect on future populations and thereby reduce the available catch in future years.
Externalities that generate the so-called fisheries problem, manifests itself as excessive fishing capital and fishing effort, reduced fish stocks, dissipation of economic rents and social welfare losses. As everybody can take freely from valuable stocks (leaving less to others) first come first served strategies will be generally adopted, resulting in capital stuffing and efficiency losses. The origin of the problem is the inexistence of a complete system of property rights guarantying exclusion. With property rights in place, taking would be permissible only for those owning the right to do so; non-excludability would then be overcome.
It follows that the fisheries problem would disappear if the appropriate property rights could be defined, imposed and enforced. But things are not as easy as that. There may be substantial biological, economical, technical, social and political specifications to defining, imposing and enforcing sufficiently good private or communal (or group) property rights above the fishing resources. So, let us first define what do property rights in fisheries are.
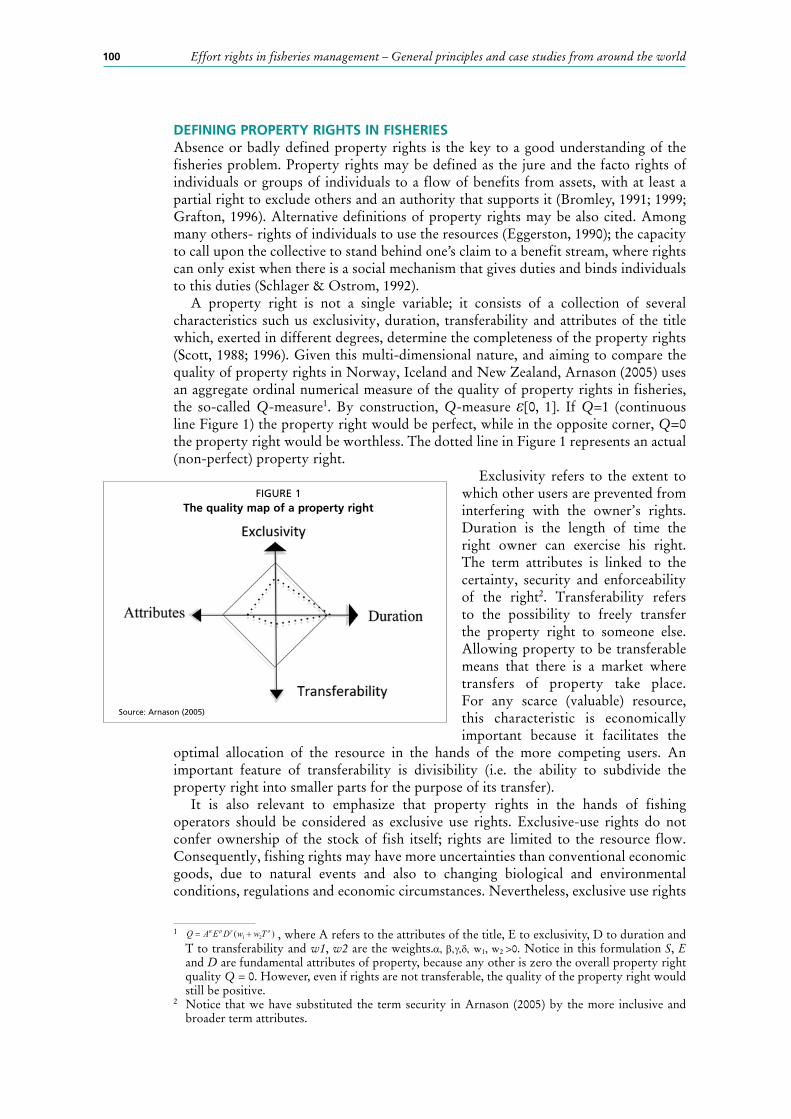
100 Effort rights in fisheries management – General principles and case studies from around the world
DEFINING PROPERTY RIGHTS IN FISHERIESAbsence or badly defined property rights is the key to a good understanding of the fisheries problem. Property rights may be defined as the jure and the facto rights of individuals or groups of individuals to a flow of benefits from assets, with at least a partial right to exclude others and an authority that supports it (Bromley, 1991; 1999; Grafton, 1996). Alternative definitions of property rights may be also cited. Among many others- rights of individuals to use the resources (Eggerston, 1990); the capacity to call upon the collective to stand behind one’s claim to a benefit stream, where rights can only exist when there is a social mechanism that gives duties and binds individuals to this duties (Schlager & Ostrom, 1992).
A property right is not a single variable; it consists of a collection of several characteristics such us exclusivity, duration, transferability and attributes of the title which, exerted in different degrees, determine the completeness of the property rights (Scott, 1988; 1996). Given this multi-dimensional nature, and aiming to compare the quality of property rights in Norway, Iceland and New Zealand, Arnason (2005) uses an aggregate ordinal numerical measure of the quality of property rights in fisheries, the so-called Q-measure1. By construction, Q-measure ε[0, 1]. If Q=1 (continuous line Figure 1) the property right would be perfect, while in the opposite corner, Q=0 the property right would be worthless. The dotted line in Figure 1 represents an actual (non-perfect) property right.
Exclusivity refers to the extent to which other users are prevented from interfering with the owner’s rights. Duration is the length of time the right owner can exercise his right. The term attributes is linked to the certainty, security and enforceability of the right2. Transferability refers to the possibility to freely transfer the property right to someone else. Allowing property to be transferable means that there is a market where transfers of property take place. For any scarce (valuable) resource, this characteristic is economically important because it facilitates the
optimal allocation of the resource in the hands of the more competing users. An important feature of transferability is divisibility (i.e. the ability to subdivide the property right into smaller parts for the purpose of its transfer).
It is also relevant to emphasize that property rights in the hands of fishing operators should be considered as exclusive use rights. Exclusive-use rights do not confer ownership of the stock of fish itself; rights are limited to the resource flow. Consequently, fishing rights may have more uncertainties than conventional economic goods, due to natural events and also to changing biological and environmental conditions, regulations and economic circumstances. Nevertheless, exclusive use rights
1 , where A refers to the attributes of the title, E to exclusivity, D to duration and T to transferability and w1, w2 are the weights.a,b,g,d, w1, w2 >0. Notice in this formulation S, E and D are fundamental attributes of property, because any other is zero the overall property right quality Q = 0. However, even if rights are not transferable, the quality of the property right would still be positive.
2 Notice that we have substituted the term security in Arnason (2005) by the more inclusive and broader term attributes.
FIGURE 1The quality map of a property right
Source: Arnason (2005)
)( 21δγβα TwwDEAQ +=
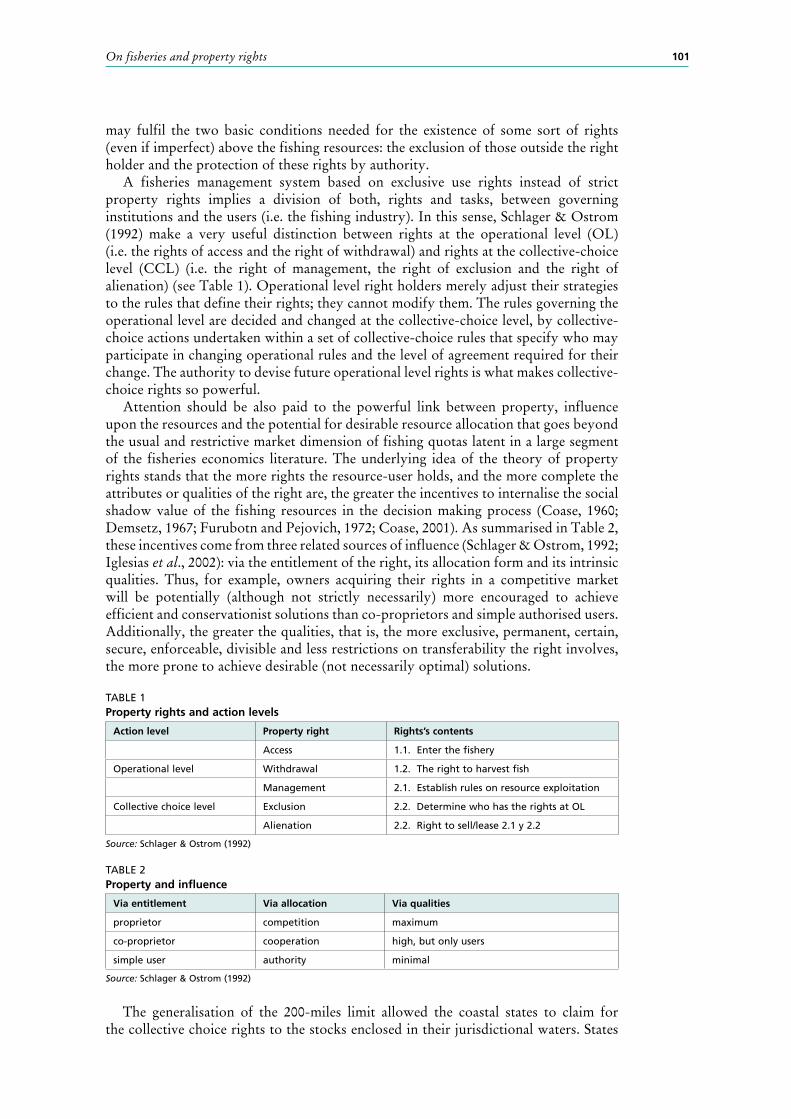
101On fisheries and property rights
may fulfil the two basic conditions needed for the existence of some sort of rights (even if imperfect) above the fishing resources: the exclusion of those outside the right holder and the protection of these rights by authority.
A fisheries management system based on exclusive use rights instead of strict property rights implies a division of both, rights and tasks, between governing institutions and the users (i.e. the fishing industry). In this sense, Schlager & Ostrom (1992) make a very useful distinction between rights at the operational level (OL) (i.e. the rights of access and the right of withdrawal) and rights at the collective-choice level (CCL) (i.e. the right of management, the right of exclusion and the right of alienation) (see Table 1). Operational level right holders merely adjust their strategies to the rules that define their rights; they cannot modify them. The rules governing the operational level are decided and changed at the collective-choice level, by collective-choice actions undertaken within a set of collective-choice rules that specify who may participate in changing operational rules and the level of agreement required for their change. The authority to devise future operational level rights is what makes collective-choice rights so powerful.
Attention should be also paid to the powerful link between property, influence upon the resources and the potential for desirable resource allocation that goes beyond the usual and restrictive market dimension of fishing quotas latent in a large segment of the fisheries economics literature. The underlying idea of the theory of property rights stands that the more rights the resource-user holds, and the more complete the attributes or qualities of the right are, the greater the incentives to internalise the social shadow value of the fishing resources in the decision making process (Coase, 1960; Demsetz, 1967; Furubotn and Pejovich, 1972; Coase, 2001). As summarised in Table 2, these incentives come from three related sources of influence (Schlager & Ostrom, 1992; Iglesias et al., 2002): via the entitlement of the right, its allocation form and its intrinsic qualities. Thus, for example, owners acquiring their rights in a competitive market will be potentially (although not strictly necessarily) more encouraged to achieve efficient and conservationist solutions than co-proprietors and simple authorised users. Additionally, the greater the qualities, that is, the more exclusive, permanent, certain, secure, enforceable, divisible and less restrictions on transferability the right involves, the more prone to achieve desirable (not necessarily optimal) solutions.
TABLE 1Property rights and action levels
Action level Property right Rights’s contents
Access 1.1. Enter the fishery
Operational level Withdrawal 1.2. The right to harvest fish
Management 2.1. Establish rules on resource exploitation
Collective choice level Exclusion 2.2. Determine who has the rights at OL
Alienation 2.2. Right to sell/lease 2.1 y 2.2
Source: Schlager & Ostrom (1992)
TABLE 2Property and influence
Via entitlement Via allocation Via qualities
proprietor competition maximum
co-proprietor cooperation high, but only users
simple user authority minimal
Source: Schlager & Ostrom (1992)
The generalisation of the 200-miles limit allowed the coastal states to claim for the collective choice rights to the stocks enclosed in their jurisdictional waters. States
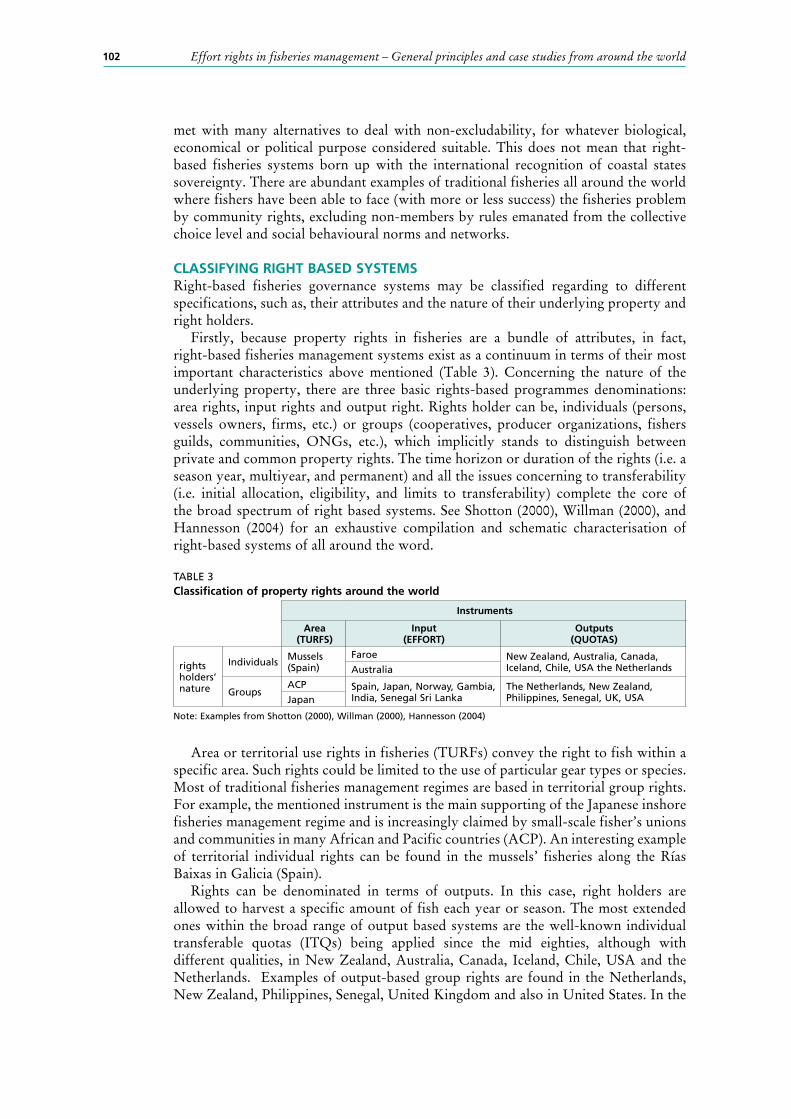
102 Effort rights in fisheries management – General principles and case studies from around the world
met with many alternatives to deal with non-excludability, for whatever biological, economical or political purpose considered suitable. This does not mean that right-based fisheries systems born up with the international recognition of coastal states sovereignty. There are abundant examples of traditional fisheries all around the world where fishers have been able to face (with more or less success) the fisheries problem by community rights, excluding non-members by rules emanated from the collective choice level and social behavioural norms and networks.
CLASSIFYING RIGHT BASED SYSTEMSRight-based fisheries governance systems may be classified regarding to different specifications, such as, their attributes and the nature of their underlying property and right holders.
Firstly, because property rights in fisheries are a bundle of attributes, in fact, right-based fisheries management systems exist as a continuum in terms of their most important characteristics above mentioned (Table 3). Concerning the nature of the underlying property, there are three basic rights-based programmes denominations: area rights, input rights and output right. Rights holder can be, individuals (persons, vessels owners, firms, etc.) or groups (cooperatives, producer organizations, fishers guilds, communities, ONGs, etc.), which implicitly stands to distinguish between private and common property rights. The time horizon or duration of the rights (i.e. a season year, multiyear, and permanent) and all the issues concerning to transferability (i.e. initial allocation, eligibility, and limits to transferability) complete the core of the broad spectrum of right based systems. See Shotton (2000), Willman (2000), and Hannesson (2004) for an exhaustive compilation and schematic characterisation of right-based systems of all around the word.
TABLE 3Classification of property rights around the world
Instruments
Area (TURFS)
Input (EFFORT)
Outputs (QUOTAS)
rights holders’ nature
Individuals Mussels (Spain)
Faroe New Zealand, Australia, Canada, Iceland, Chile, USA the NetherlandsAustralia
GroupsACP Spain, Japan, Norway, Gambia,
India, Senegal Sri LankaThe Netherlands, New Zealand, Philippines, Senegal, UK, USAJapan
Note: Examples from Shotton (2000), Willman (2000), Hannesson (2004)
Area or territorial use rights in fisheries (TURFs) convey the right to fish within a specific area. Such rights could be limited to the use of particular gear types or species. Most of traditional fisheries management regimes are based in territorial group rights. For example, the mentioned instrument is the main supporting of the Japanese inshore fisheries management regime and is increasingly claimed by small-scale fisher’s unions and communities in many African and Pacific countries (ACP). An interesting example of territorial individual rights can be found in the mussels’ fisheries along the Rías Baixas in Galicia (Spain).
Rights can be denominated in terms of outputs. In this case, right holders are allowed to harvest a specific amount of fish each year or season. The most extended ones within the broad range of output based systems are the well-known individual transferable quotas (ITQs) being applied since the mid eighties, although with different qualities, in New Zealand, Australia, Canada, Iceland, Chile, USA and the Netherlands. Examples of output-based group rights are found in the Netherlands, New Zealand, Philippines, Senegal, United Kingdom and also in United States. In the
103On fisheries and property rights
case of Netherlands and United Kingdom, producer organizations have been given the right to distribute quotas among their members. In New Zealand Maoris have been assigned both territorial and quota based fishing rights. In the Atlantic coast of United States, community development quotas have been allocated as part of an ITQ regime.
Fishing inputs rights (effort rights) granted the holder the right to use certain inputs or fishing gears, frequently in selected areas and/or fisheries and at specified times. The right is based on physical harvesting capacity and is measured in terms of number of licensed boats and/or attributes of boats such as units of traps, boat days, etc. Because stocks may vary over time due to environmental fluctuations, it is also convenient to control the use of any licensed fleet from time to time. Particular well-known examples are the Faroe Islands system of individual tradable fishing days, the western Australia lobster fishery (where the unit of ownership is the individual lobster trap) and also the Australian northern prawn fishery. Group input rights are found in, Japan, Norway, Gambia, India, Senegal and Sri Lanka. Limits on the number of vessels and fishing-trips and hours fished are common management measures for Japanese cooperatives. In the Norwegian Lofoten fishery, fisheries cooperatives undertake various regulatory functions, primarily based on input-limitations as well as technical management measures such as closed seasons and areas.
DISCUSSIONAs there is no ironclad rule that a rights-based management system will achieve the management objectives of a particular fishery better than one of the traditional types of management, similarly, there are no ironclad rules about which type of denomination (area, input or output) or eligible right holder (individual, group) will work best when developing a rights-based system. This depends upon the nature of the fishery, the objectives of management and the institutional framework surrounding the fishery.
Area rights may work very well in sedentary fisheries but will have many drawbacks in migratory fishing stocks. In choosing between input and output based rights, the second has two important advantages. Quota regimes are TAC based; therefore they have the potential to directly achieve biological objectives. Nevertheless the control of fleet capacity and effort only offers an indirect control of the catches. In addition, quota programs provide incentives to choose the cost minimising input combination, while input controls can provide incentives to use non-restricted inputs if these will increase harvest, resulting in higher costs. Furthermore, because technological progress may increase the capacity of the fleet beyond optimal levels in a relative short time, it stands that paradoxically the more successfully the fishing capacity is controlled the more the industry may be locked preventing the gains of technological progress. However, these advantages of the quota systems are mitigated with increasing incentives to discard fish, difficulties to set credible TACs as a result of opportunistic TAC setting behaviour (del Valle and Astorkiza, 2007), or the complexity to monitor the individual harvest of many participants landing fish over widely dispersed areas.
When comparing between individual and group rights, a fundamental advantage of group fisheries management systems lie in the potential of lower transaction costs related to management (i.e. savings in information, monitoring and enforcement costs through the use of information held privately by fishers and the use of social-capital embedded in local and professional organizations and institutions). Furthermore, the best knowledge of the individual and collective preferences facilitates achieving mutually satisfactory management objectives. Consequently, there is greater likelihood that rights holders respect and comply with management rules that were designed and agreed upon by them in a more participatory framework (Astorkiza et al, 2006). The breakdowns of group right systems frequently derive from insufficiently specified, exclusive and protected group rights, which are not recognized in formal law and
104 Effort rights in fisheries management – General principles and case studies from around the world
are inadequately protected from external threats that erode long-term stewardship and legitimacy. But sometimes group rights simply may fail as a result of weakness in internal governance and usual agency problems. When management rules are not able to accommodate technological progress, natural population growth, or market constraints, the pressure of the growing group can drive to open access allocations, especially where there is a lack of alternative livelihoods in other sectors of the local economy.
Among the fundamental issues to be addressed when designing a right- based system (i.e. the management units, the initial allocation, transferability rules, monitoring of enforcement design, the potential need of other regulation, rent extraction and cost recovery) the criteria for the initial allocation and the transferability and duration rules may be especially controversial. The initial allocation establishes the initial participants in the fishery, while the rules for transferability and the duration of the ownership rights determine the future participants (i.e. who gets the gains from the fishery in the long run). Hence, the distributional short and long-term implications and also the potential efficiency gains are to a large degree determined by the decisions taken at this stage.
Albeit there are many initial allocation options, usually historical catches and the current level of investment (i.e. the size of the vessels) form the basis for quota allocations, almost as a rule directed to the vessel owners and given away free. Arguments against transferability lie on the fact that certain individuals are obtaining wealth from a public resource, while opinion in favour of free transferability is linked with maximum potential efficiency gains. Limiting transferability in more or less degree is the general practice in the real experiences. Limits are established to prevent distributional effects and also to avoid excessive concentration of shares.
Depending on the overall objectives the specific management system would like to achieve (i.e. resource conservation goals, economic efficiency goals, certain redistributive goals, etc.) different criteria and rules are to be adopted to fit the biological conditions of the resources and the broader socio-economic, political and institutional frameworks. The initial allocation and transferability rules will determine the final structure and characteristics of the fishing sector, which should be previously agreed based on social welfare preferences. The fisheries policy objectives and the hierarchical structuring among these objectives (trade-offs cannot be avoided) constitute the main determinants and restrictions of the system configuration (del Valle et al, 2006).
Finally, individual market based systems (IMBS) deserve a specific attention. IMBS are specific right-based formulations, which, following Coase’s foundations, rely on the market forces to internalise the externalities found in fisheries resources. Accordingly, IMBS require transferability and the existence of an explicit and transparent market where (quota/effort/area) rights are transferred. IMBS fit very well into the neo-liberal economic thought sowed by A. Smith in his The Wealth of the Nations (1776), when wrote: “the invisible hand of the marketplace guides selfish agents into promoting general economic well-being. Thus, individuals are best left to their own devices, without the heavy hand of government guiding their actions.”
That philosophy was supported by Debreu’s (1951) formalisation of the invisible hand argument, known as the first fundamental theorem of welfare economics; which stands that under certain conditions the market mechanism is able to generate an efficient allocation. Moreover, the second fundamental theorem of welfare economics (Debreu, 1954) shows that the market can reach any efficient allocation by redistributing the endowments or initial allocations of the resources. Normatively the welfare theorems advice: use the competitive mechanism, use the free market; do not use prices to attain distributive goals, use the endowments.
105On fisheries and property rights
But, how does invisible hand help to avoid the fisheries problem? Individual transferable (effort/quota) rights face externalities arising from non-excludability by introducing a system of exclusive use rights above individual shares of the overall effort/quota/area established by the institution holding the collective choice rights. This overall effort/TAC/space is divided into individual/group allocations, which give its holder the right to catch a specific quantity of fish or exercise a specific effort from a given stock within a given time period.
With no limits on transferability, operators are free to optimise the scale of their operations by buying or selling quota. The price mechanism governing the quota market (i.e. the invisible hand) will lead to an efficient redistribution of quotas whatever the initial allocation is. In the long term quotas would be consolidated in the hands of the most efficient operators. Divisibility of quotas would promote short-term rationalisation.
The longer the time horizon of the quotas the most probably optimal investment strategies (affecting both the fleet capacity and the resource conservation) would be adopted. With a quota allocation that is valid for a sufficiently long time (at least the lifetime of a fishing vessel) the quota holder can make rational predictions about future catches and determine the fishing capacity accordingly. Long-term tenure of quotas is also important for taking on resource conservation strategies. Long-term quotas reach higher market values than short-term ones, especially if the resource is properly managed, which strengthens the dependence between quota values and the expected future productivity of the stock.
It is also compulsory to conclude remembering that, not only further developments in economic theory, but also, the empirical evidence in real fisheries around the world supports that the second Adam Smith’s hand (let us say Smith’s left hand) may provoke the emergence of both expected and unexpected phenomenon, such as, windfall gains derived by free initial allocations, changes in the bargaining power between owner and crew, modified attitudes of the stakeholders, concentration of quotas, structural changes in fleets, weakening of the fisheries dependent communities, changes in the power relations between harvesters and buyers, developments in the conventional profit sharing regimes and, last but not least, increasing transaction cost.
REFERENCESAstorkiza, K., del Valle, I., Astorkiza, I., Hegland, T.J. & Pascoe, S. 2006. Participation. In
L. Motos & D.C. Wilson The Knowledge Base for Fisheries Management, pp. 239-264. Developments in Aquaculture and Fisheries Science, Vol. 36. The Netherlands, Elsevier. 454 pp.
Arnason, R. 2005. Property Rights in Fisheries: Iceland’s Experience with ITQs. Reviews in Fish Biology and Fisheries, 15: 243-264.
Arsason, R. & Gissurarson, H. 1999. Individual Transferrable Quotas in Theory and Practice. Reykjavic, University of Iceland Press.
Boyce, J.R. 1992. Individual Transferable Quotas and Production Externalities in a Fishery. Natural Resource Modelling, 6(4): 385-407.
Bromley, D.W. 1991. Environment and Economy. Cambridge, Massachusetts; Blackwell Publishers.
Bromley. D.W. 1999. Property Regimes in Environmental Economics. In H. Folmer & T. Titenberg, eds. The International Yearbook of Environmental and Resource Economics, 1997-1998: A survey of current issues. The University of Michigan, E. Elgar.
Coase, R. 1960. The Problem of Social Cost. Journal of Law and Economics, 3: 1-44. Coase, R. 2001. The New Institutional Economics. American Economic Review, 88(2),
72-74. Danielson, A. 2000. Efficiency of ITQs in the Presence of Production Externalities. Marine
Resource Economics, 15: 37-43.
106 Effort rights in fisheries management – General principles and case studies from around the world
Debreau, G. 1959. The theory of value. New Haven, Yale University Press.Demsetz, H. 1967. Toward a Theory of Property Rights. American Economic Review,
57(2): 347-359. del Valle, I., Hoefnagel, E., Astorkiza, K. & Astorkiza, I. 2006. Right-based Fisheries
Management. In Motos, L., Wilson, D.C., eds. The Knowledge Base for Fisheries Management. Developments in Aquaculture and Fisheries Science- 36, ELSEVIER, pp 55-83.
del Valle, I. & Astorkiza K. 2007. Institutional Designs to Face the Dark Side of Total Allowable Catches. ICES Journal of Marine Science, 64(4): 851–857.
Edwards, M. 2000. The Administration of Fisheries Managed by Property Rights. In R. Shotton, eds. Use of property rights in fisheries management. Rome, FAO. (also available at http://www.fao.org/docrep/003/x7579e/x7579e00.HTM)
Eggerston, T. 1990. Economic Behaviour and the Institutions. New York, Cambridge University Press.
Furubotn, E. & Pejovich, S. 1972. Property Rights and Economic Theory: A Survey of the Recent Literature. Journal of Economic Literature, 9(4): 1137-1162.
Grafton, R.Q. 1996. Individual Transferable Quotas: Theory and practice. Review in Fish Biology and Fisheries, 6: 5-20.
Hannesson, R. 2004. The Privatisation of the Ocean. Massachusetts, Massachusetts Institute of Technology.
Iglesias, C., Garza, D. & Varela, M. 2002. Management Systems in the EU Fisheries. Marine Policy, 26(6): 403-413.
Munro, G.R. & Scott, A. 1985. The Economics of Fisheries Management. In A.V. Kneese, & J.L. Sweeney, Handbook of Natural Resources and Energy Economics, Volume II. Amsterdam, North-Holland.
Ostrom, E., Gardner, R. & Walker, J. 1994. Rules, Games and Common Pool Resources. Ann Arbor, Michigan: University of Michigan Press.
Scott, A.D. 1988. Development of Property in the Fishery. Marine Resource Economics, 5: 289-311.
Scott, A.D. 1996. Conceptual origins of right based fishing. In P.A. Neher, R. Arnason, N.M. Springer, eds. Rights Based Fishing. Dordrecht, Kluwer Academic Publishers.
Schlager E. & Ostrom, E. 1992. Property right regimes and natural resources: A conceptual analysis. Land Economics, 68(3): 251-262.
Shotton, R. 2000. Current Property Rights Systems in Fisheries Management. In R. Shotton, eds. Use of property rights in fisheries management. FAO Fisheries Technical Paper No. 404/1. (also available at http://www.fao.org/docrep/003/x7579e/x7579e00.HTM).
Smith, A. 1776. An Inquiry into the Nature and Causes of the Wealth of Nations Published: London: Methuen and Co., Ltd., ed. Edwin Cannan, 1904. Fifth edition. First published: 1776.
Willman, R. 2000. Group and Community-based Fishing Rights. In R. Shotton, eds. Use of property rights in fisheries management. FAO Fisheries Technical Paper No. 404/1. (also available at http://www.fao.org/docrep/003/x7579e/x7579e00.HTM).
107
Effort management in the Danish fishery for blue mussels
Peder Andersen, Institute of Food and Resource Economics, University of CopenhagenE-mail: [email protected]
Hans Frost, Institute of Food and Resource Economics, University of Copenhagen E-mail: [email protected]
Niels Vestergaard, Department of Environmental and Business Economics, University of Southern DenmarkE-mail: [email protected]
THE PROBLEMThe Danish fishery has, since the introduction of the European Union’s Common Fisheries Policy in 1983, been subject to access restrictions. The purpose of this access limitation has been partly to protect fish stocks from overfishing and to ensure fishers a reasonable income.
Danish fishing for blue mussels has been subject to the general system, but since the late 1980s access to the mussel fishery has been regulated in a special way, partly in the form of a limited number of vessel permits (licenses) and partly in the form of specific requirements on how large vessels may be with respect to load capacity and power. Apart from the brown shrimp fishery in the Wadden Sea, such specific rules have not been used in the rest of Danish fisheries where vessels could move between different fisheries only taking into account the overall regulatory measures. The total number of permits (vessels) in the mussel fishery has, since the late 1980s until today, remained at around 62 in total and with 51 permits in the Limfjord, which is the main fishing area for blue mussels in Denmark. The other areas are the Kattegat/Little Belt area, the Isefjord, and the Wadden Sea. The latter area is of minor importance.
Compared with a situation of free access to insert vessels into the mussels fishery, the entry restrictions have led to improved profitability and high salaries to the crew compared with other Danish fisheries. Had there not been a particularly restricted access to the mussel fishery, other vessels from the Danish fisheries would have established themselves there. Permits to operate in the mussel fishery could not be transferred between fishers until after the change of the rules in 2009 (Executive order no. 371 of 15/0572009).
The relatively favourable earnings in the blue mussels fishery, which this special access limitation allowed, have entailed that there has been no further reduction in the number of vessels since the late 1980s. This outcome must also be seen in light of the fishing opportunities that have been favourable up to and including 2004, after which followed a decline in landings of nearly 50 percent in the subsequent years up till now. The consequence is that the profitability of the mussels fishery has been severely impaired since 2004. The fishers have been able to mitigate some of the negative effects through increased fishing for oysters and through slightly higher prices, which, however. is not likely to continue because of the international competition in the mussels’ market. Finally, it should be noted that demands for greater protection of habitat (Nature, 2000) create uncertainty about the size of future fishing opportunities.
108 Effort rights in fisheries management – General principles and case studies from around the world
This development has led to two questions: What can be done in an adaptation of the number of vessels to catch future opportunities? Will this adaptation lead to an outcome that some fishers will have huge economic gains that may be considered unacceptable from a societal point of view?
It is suggested that, based on the system of transferable vessel quota shares (FKA), introduced in the Danish fishery in 2007, could establish a similar system for mussel fishing. That outcome will mean that some existing vessels in the scallop fishery can be bought out. The problem which is illustrated: How large an economic benefit can be expected by introducing tradability of licenses in the mussel fishery compared with what the remuneration of labour and capital are on average in other industries? What is the optimal number of vessels (permits)?
BACKGROUND AND PURPOSEAccess to the Danish mussel fishery has since the late 1980s been limited by individual non-transferable vessel licenses. This has meant that there has been little change in the industry with very few transfers of vessels and licenses. All have been under management by the Directorate of Fisheries. Since 2000, landings of mussels declined, especially in the Limfjord, where landings have declined from approximately 85 000 tonnes to approximately 30 000 tonnes. These developments have severely worsened the economic situation. Along with a fear in the industry that the landings may not increase in the future because of increased environmental demands, this decline has led to a desire by fishers for a more automated method of transfer of vessels and licenses. Based on the introduction of ITQs in 2003 to some parts of the fishery and vessel quota shares in 2007 (another name for ITQs) in other parts of the Danish fishery, it was proposed that the existing individual licenses in the blue mussel fishery be made tradable.
In connection with this investigation, an assessment by National Institute of Aquatic Resources (DTU Aqua (formerly the Danish Institute for Fisheries Research) showed that the population of blue mussels in both the fjords and the Wadden Sea has been decreasing over the last 10 years. In the Limfjord, where the majority of the blue mussels are fished, the stock was around 800 000 tonnes in the areas open to fishing in the early 1990s. In the last few years, the stock has stabilized at between 150 000 and 275 000 tonnes. With this situation, the mussel fishers voluntarily reduced their allowable daily and weekly catches, which has led to the annual landings falling to below 40 000 tonnes per year in recent years. Wadden Sea catches of blue mussel in the last 2 years have been closed, since the calculated abundance of blue mussels has not been large enough for the mussel-eating birds to find sufficient mussels as food. Permits were withdrawn because of new information about the birds’ food needs, and it would require extensive studies before it can be decided whether to allow the fishery to open again. DTU Aqua has no knowledge of the stock sizes on the Jutland coast or in the fiord. Stock sizes in all Danish fishing areas for blue mussels are very volatile. Periods of oxygen depletion in the Limfjord or lack of recruitment affects population size in the fishing areas. Also other factors, such as changes in phytoplankton composition, climate change and fisheries removal of substrate, may be of importance.
In the early 1990s, there was a favourable development location in the oyster population in the Limfjord, which in recent years has led to oyster fishing in the Limfjord at around 1 000 tonnes. The favourable trend has continued, giving permission to a fishery at around 1 500 tonnes. The recruitment of oyster spat has in the last year, however, been weak. The population today consists predominantly of large oysters, which is a problem because the average size of the oysters is too high relative to market opportunities.
Limfjord fishers, in collaboration with DTU Aqua, have developed a practice of mussel removals. Here mussel spat is moved from areas with large recruitments of
109Effort management in the Danish fishery for blue mussels
small mussels and low production to areas with high production. The quality of the produced bivalves is generally higher in this production. Fishers and DTU Aqua are also in dialogue on development projects to ensure better planning of fishing activities in relation to optimal utilization of resources and in relation to Environmental Law. The goal is that both the displacement and planning adjustments would ensure continued high earnings in the fishery that can compensate for reduced landings.
Based on the industry wants and DTU Aqua’s assessments, the purpose of this note is to identify the economic benefits of making the existing licenses transferable. Transferability can be implemented in several ways, including through licenses, quotas and days at sea. This memorandum does not state how the rules of transfer should be designed specifically.
The economic gains are identified by calculating and comparing the economic profit of mussels before and after the licenses are tradable. The calculation of the current economic profits based on Statistics Denmark’s “Accounts Statistics for Fishery”, where the economic surplus, after tradability is introduced, is calculated under alternative scenarios of how many vessels and employees required to fish the sustainable amount. This is based on estimates of how much an individual vessel can catch each trip and how many trips it can carry per week and how many weeks per year.
The economic surplus of mussels indicates: “the surplus remaining in the scallop fishery for the remuneration of capital and labour, beyond that achieved in other industries,” and it is a measure of economic efficiency, but are not the same as operating profit. The economic surplus is calculated as:
Turnover (subtract) Costs excl. labour and capital (subtract), Cost of labour in alternative uses(subtract), Cost of capital in alternative uses= Profits (subtract) Cost to fishery management, such as stock assessment, administration, monitoring and control = Resource rent.
The economic surplus is the basis for the price of licenses. However, the entire economic surplus does not accrue to vessel owners and crew as profit and income tax is paid. The public authorities therefore receive a share. Fishery resources, like oil and natural gas, are considered as part of national property, where there exists an agreement for special tax on oil and natural gas extracted in the North Sea. Policy instruments can be used to integrate the economic surplus, including user fees and charges.
Under the regulation before 2009 with individual non-transferable vessel permits, expected future earnings are capitalized into the vessel value if it can be sold including fishing rights. Consequently, when the vessel is sold, it is significantly more expensive than the vessel’s physical value, as fishing privileges are sold with the vessel. The rules before 2009 are, however, that licenses are not transferable. Given that most blue mussel fishers have been active for many years, it can be argued that fishers have accumulated historical rights, although the mussel fishers have no ownership of the fishery. In this way the fishers stay in the industry, as there is no incentive for them to go out when there is economic advantage to staying. The introduction of marketability permits implies that the resource rent to society will increase due to fewer and more effective remaining vessels.
However, this is not necessarily the case for the individual fishers as the economic profit to them will not increase from the purchase of rights, and this will affect the incentive to buy more rights. The introduction of tradable licenses implies that the current vessel owners can sell their license when they stop fishing and probably retire. Through this they gain an income paid by new fishers, who buy their way into the fishery or purchase additional rights.
This paper emphasizes the Limfjord as mussel populations are localized primarily there with the highest number of licenses. It is not known from this point how high the future fishing opportunities will be for mussels in the Limfjord. The economic
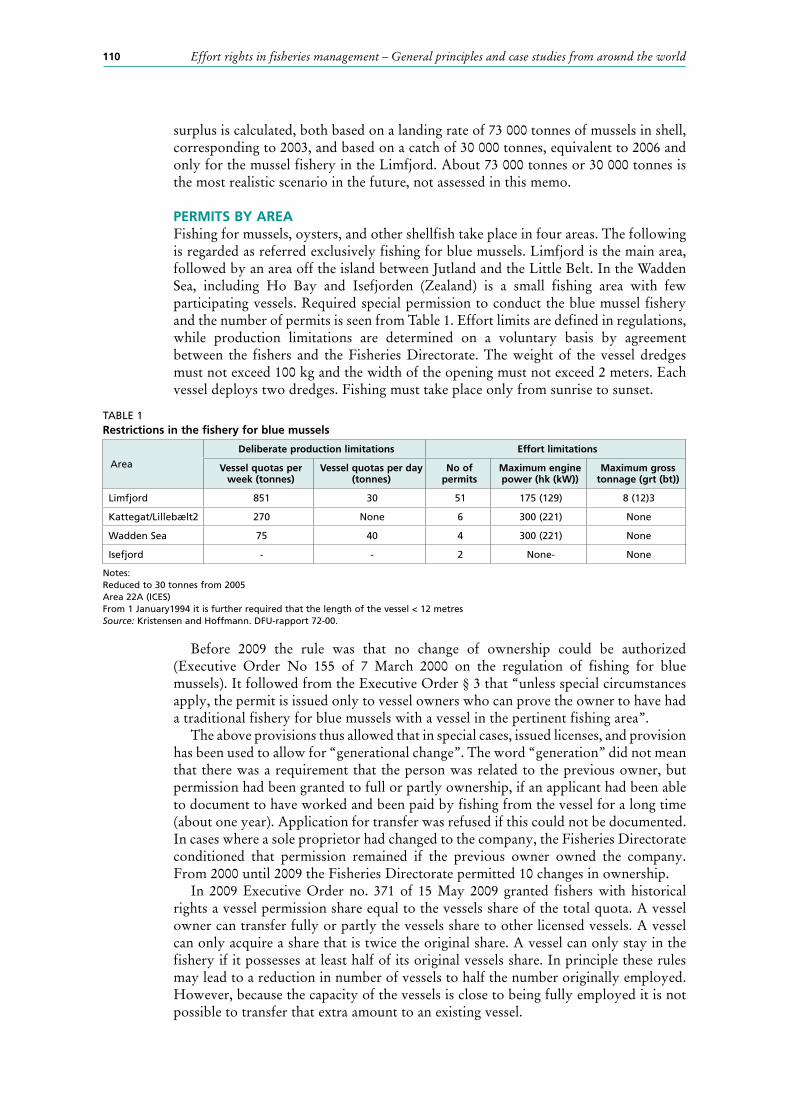
110 Effort rights in fisheries management – General principles and case studies from around the world
surplus is calculated, both based on a landing rate of 73 000 tonnes of mussels in shell, corresponding to 2003, and based on a catch of 30 000 tonnes, equivalent to 2006 and only for the mussel fishery in the Limfjord. About 73 000 tonnes or 30 000 tonnes is the most realistic scenario in the future, not assessed in this memo.
PERMITS BY AREAFishing for mussels, oysters, and other shellfish take place in four areas. The following is regarded as referred exclusively fishing for blue mussels. Limfjord is the main area, followed by an area off the island between Jutland and the Little Belt. In the Wadden Sea, including Ho Bay and Isefjorden (Zealand) is a small fishing area with few participating vessels. Required special permission to conduct the blue mussel fishery and the number of permits is seen from Table 1. Effort limits are defined in regulations, while production limitations are determined on a voluntary basis by agreement between the fishers and the Fisheries Directorate. The weight of the vessel dredges must not exceed 100 kg and the width of the opening must not exceed 2 meters. Each vessel deploys two dredges. Fishing must take place only from sunrise to sunset.
Before 2009 the rule was that no change of ownership could be authorized (Executive Order No 155 of 7 March 2000 on the regulation of fishing for blue mussels). It followed from the Executive Order § 3 that “unless special circumstances apply, the permit is issued only to vessel owners who can prove the owner to have had a traditional fishery for blue mussels with a vessel in the pertinent fishing area”.
The above provisions thus allowed that in special cases, issued licenses, and provision has been used to allow for “generational change”. The word “generation” did not mean that there was a requirement that the person was related to the previous owner, but permission had been granted to full or partly ownership, if an applicant had been able to document to have worked and been paid by fishing from the vessel for a long time (about one year). Application for transfer was refused if this could not be documented. In cases where a sole proprietor had changed to the company, the Fisheries Directorate conditioned that permission remained if the previous owner owned the company. From 2000 until 2009 the Fisheries Directorate permitted 10 changes in ownership.
In 2009 Executive Order no. 371 of 15 May 2009 granted fishers with historical rights a vessel permission share equal to the vessels share of the total quota. A vessel owner can transfer fully or partly the vessels share to other licensed vessels. A vessel can only acquire a share that is twice the original share. A vessel can only stay in the fishery if it possesses at least half of its original vessels share. In principle these rules may lead to a reduction in number of vessels to half the number originally employed. However, because the capacity of the vessels is close to being fully employed it is not possible to transfer that extra amount to an existing vessel.
TABLE 1Restrictions in the fishery for blue mussels
Area
Deliberate production limitations Effort limitations
Vessel quotas per week (tonnes)
Vessel quotas per day (tonnes)
No of permits
Maximum engine power (hk (kW))
Maximum gross tonnage (grt (bt))
Limfjord 851 30 51 175 (129) 8 (12)3
Kattegat/Lillebælt2 270 None 6 300 (221) None
Wadden Sea 75 40 4 300 (221) None
Isefjord - - 2 None- None
Notes:Reduced to 30 tonnes from 2005Area 22A (ICES)From 1 January1994 it is further required that the length of the vessel < 12 metresSource: Kristensen and Hoffmann. DFU-rapport 72-00.
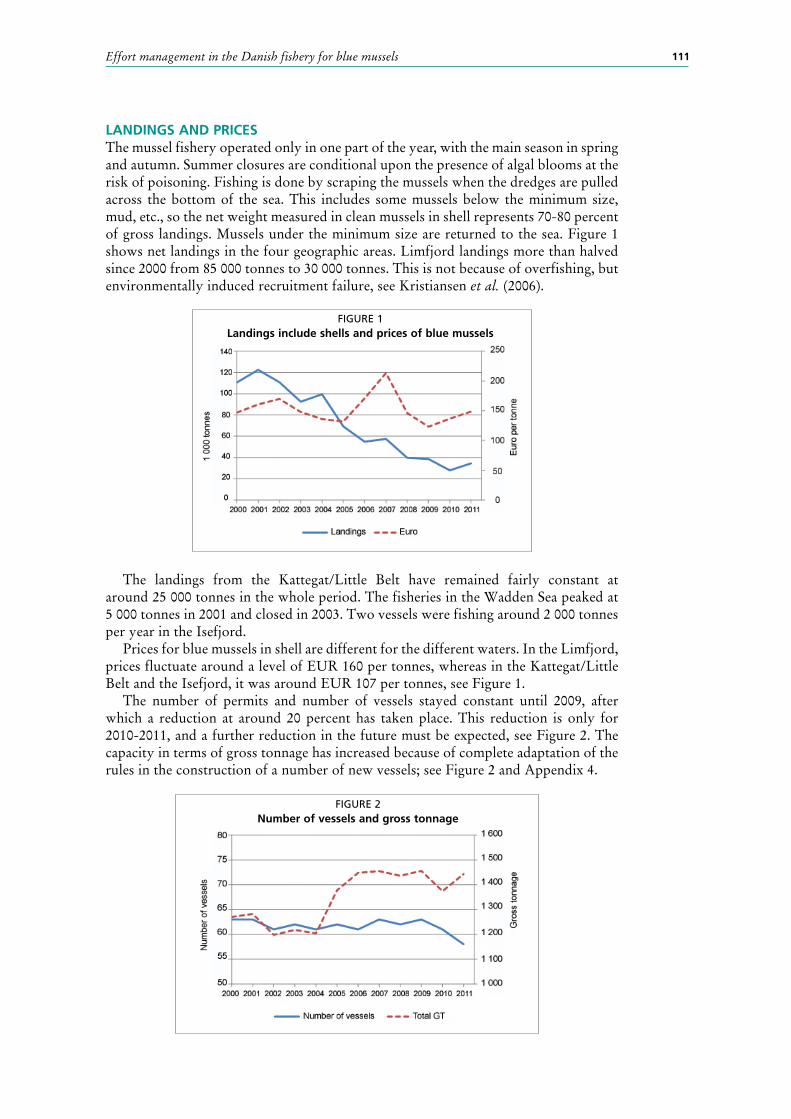
111Effort management in the Danish fishery for blue mussels
LANDINGS AND PRICESThe mussel fishery operated only in one part of the year, with the main season in spring and autumn. Summer closures are conditional upon the presence of algal blooms at the risk of poisoning. Fishing is done by scraping the mussels when the dredges are pulled across the bottom of the sea. This includes some mussels below the minimum size, mud, etc., so the net weight measured in clean mussels in shell represents 70-80 percent of gross landings. Mussels under the minimum size are returned to the sea. Figure 1 shows net landings in the four geographic areas. Limfjord landings more than halved since 2000 from 85 000 tonnes to 30 000 tonnes. This is not because of overfishing, but environmentally induced recruitment failure, see Kristiansen et al. (2006).
The landings from the Kattegat/Little Belt have remained fairly constant at around 25 000 tonnes in the whole period. The fisheries in the Wadden Sea peaked at 5 000 tonnes in 2001 and closed in 2003. Two vessels were fishing around 2 000 tonnes per year in the Isefjord.
Prices for blue mussels in shell are different for the different waters. In the Limfjord, prices fluctuate around a level of EUR 160 per tonnes, whereas in the Kattegat/Little Belt and the Isefjord, it was around EUR 107 per tonnes, see Figure 1.
The number of permits and number of vessels stayed constant until 2009, after which a reduction at around 20 percent has taken place. This reduction is only for 2010-2011, and a further reduction in the future must be expected, see Figure 2. The capacity in terms of gross tonnage has increased because of complete adaptation of the rules in the construction of a number of new vessels; see Figure 2 and Appendix 4.
FIGURE 2Number of vessels and gross tonnage
FIGURE 1Landings include shells and prices of blue mussels
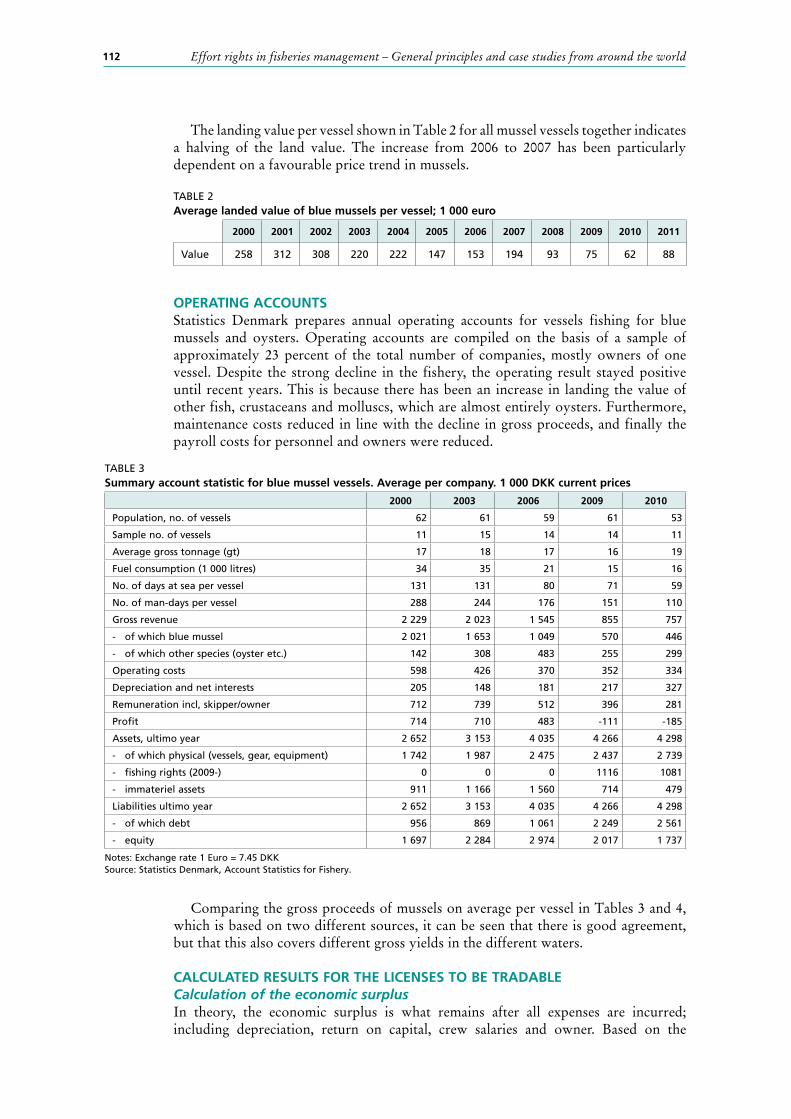
112 Effort rights in fisheries management – General principles and case studies from around the world
The landing value per vessel shown in Table 2 for all mussel vessels together indicates a halving of the land value. The increase from 2006 to 2007 has been particularly dependent on a favourable price trend in mussels.
TABLE 2 Average landed value of blue mussels per vessel; 1 000 euro
2000 2001 2002 2003 2004 2005 2006 2007 2008 2009 2010 2011
Value 258 312 308 220 222 147 153 194 93 75 62 88
OPERATING ACCOUNTSStatistics Denmark prepares annual operating accounts for vessels fishing for blue mussels and oysters. Operating accounts are compiled on the basis of a sample of approximately 23 percent of the total number of companies, mostly owners of one vessel. Despite the strong decline in the fishery, the operating result stayed positive until recent years. This is because there has been an increase in landing the value of other fish, crustaceans and molluscs, which are almost entirely oysters. Furthermore, maintenance costs reduced in line with the decline in gross proceeds, and finally the payroll costs for personnel and owners were reduced.
Comparing the gross proceeds of mussels on average per vessel in Tables 3 and 4, which is based on two different sources, it can be seen that there is good agreement, but that this also covers different gross yields in the different waters.
CALCULATED RESULTS FOR THE LICENSES TO BE TRADABLECalculation of the economic surplusIn theory, the economic surplus is what remains after all expenses are incurred; including depreciation, return on capital, crew salaries and owner. Based on the
TABLE 3Summary account statistic for blue mussel vessels. Average per company. 1 000 DKK current prices
2000 2003 2006 2009 2010
Population, no. of vessels 62 61 59 61 53
Sample no. of vessels 11 15 14 14 11
Average gross tonnage (gt) 17 18 17 16 19
Fuel consumption (1 000 litres) 34 35 21 15 16
No. of days at sea per vessel 131 131 80 71 59
No. of man-days per vessel 288 244 176 151 110
Gross revenue 2 229 2 023 1 545 855 757
- of which blue mussel 2 021 1 653 1 049 570 446
- of which other species (oyster etc.) 142 308 483 255 299
Operating costs 598 426 370 352 334
Depreciation and net interests 205 148 181 217 327
Remuneration incl, skipper/owner 712 739 512 396 281
Profit 714 710 483 -111 -185
Assets, ultimo year 2 652 3 153 4 035 4 266 4 298
- of which physical (vessels, gear, equipment) 1 742 1 987 2 475 2 437 2 739
- fishing rights (2009-) 0 0 0 1116 1081
- immateriel assets 911 1 166 1 560 714 479
Liabilities ultimo year 2 652 3 153 4 035 4 266 4 298
- of which debt 956 869 1 061 2 249 2 561
- equity 1 697 2 284 2 974 2 017 1 737
Notes: Exchange rate 1 Euro = 7.45 DKKSource: Statistics Denmark, Account Statistics for Fishery.
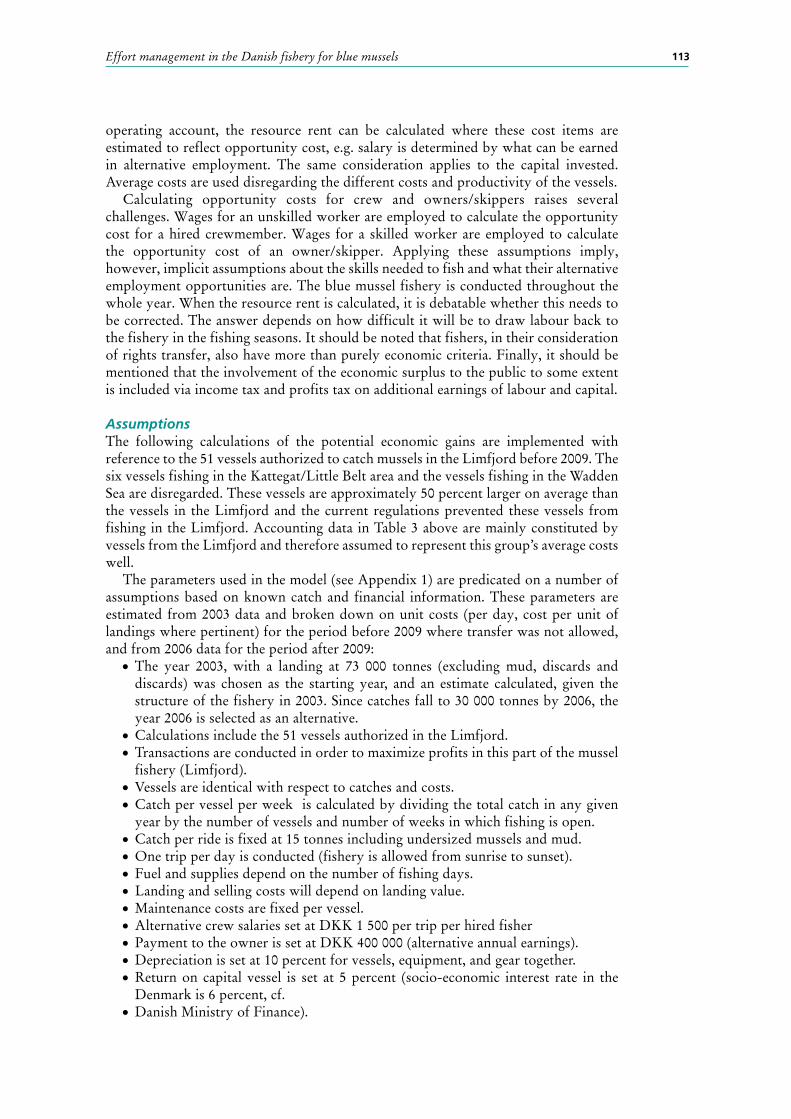
113Effort management in the Danish fishery for blue mussels
operating account, the resource rent can be calculated where these cost items are estimated to reflect opportunity cost, e.g. salary is determined by what can be earned in alternative employment. The same consideration applies to the capital invested. Average costs are used disregarding the different costs and productivity of the vessels.
Calculating opportunity costs for crew and owners/skippers raises several challenges. Wages for an unskilled worker are employed to calculate the opportunity cost for a hired crewmember. Wages for a skilled worker are employed to calculate the opportunity cost of an owner/skipper. Applying these assumptions imply, however, implicit assumptions about the skills needed to fish and what their alternative employment opportunities are. The blue mussel fishery is conducted throughout the whole year. When the resource rent is calculated, it is debatable whether this needs to be corrected. The answer depends on how difficult it will be to draw labour back to the fishery in the fishing seasons. It should be noted that fishers, in their consideration of rights transfer, also have more than purely economic criteria. Finally, it should be mentioned that the involvement of the economic surplus to the public to some extent is included via income tax and profits tax on additional earnings of labour and capital.
AssumptionsThe following calculations of the potential economic gains are implemented with reference to the 51 vessels authorized to catch mussels in the Limfjord before 2009. The six vessels fishing in the Kattegat/Little Belt area and the vessels fishing in the Wadden Sea are disregarded. These vessels are approximately 50 percent larger on average than the vessels in the Limfjord and the current regulations prevented these vessels from fishing in the Limfjord. Accounting data in Table 3 above are mainly constituted by vessels from the Limfjord and therefore assumed to represent this group’s average costs well.
The parameters used in the model (see Appendix 1) are predicated on a number of assumptions based on known catch and financial information. These parameters are estimated from 2003 data and broken down on unit costs (per day, cost per unit of landings where pertinent) for the period before 2009 where transfer was not allowed, and from 2006 data for the period after 2009:
•The year 2003, with a landing at 73 000 tonnes (excluding mud, discards and discards) was chosen as the starting year, and an estimate calculated, given the structure of the fishery in 2003. Since catches fall to 30 000 tonnes by 2006, the year 2006 is selected as an alternative.
•Calculations include the 51 vessels authorized in the Limfjord.•Transactions are conducted in order to maximize profits in this part of the mussel
fishery (Limfjord).•Vessels are identical with respect to catches and costs.•Catch per vessel per week is calculated by dividing the total catch in any given
year by the number of vessels and number of weeks in which fishing is open.•Catch per ride is fixed at 15 tonnes including undersized mussels and mud.•One trip per day is conducted (fishery is allowed from sunrise to sunset).•Fuel and supplies depend on the number of fishing days.•Landing and selling costs will depend on landing value.•Maintenance costs are fixed per vessel.•Alternative crew salaries set at DKK 1 500 per trip per hired fisher•Payment to the owner is set at DKK 400 000 (alternative annual earnings).•Depreciation is set at 10 percent for vessels, equipment, and gear together.•Return on capital vessel is set at 5 percent (socio-economic interest rate in the
Denmark is 6 percent, cf. •Danish Ministry of Finance).
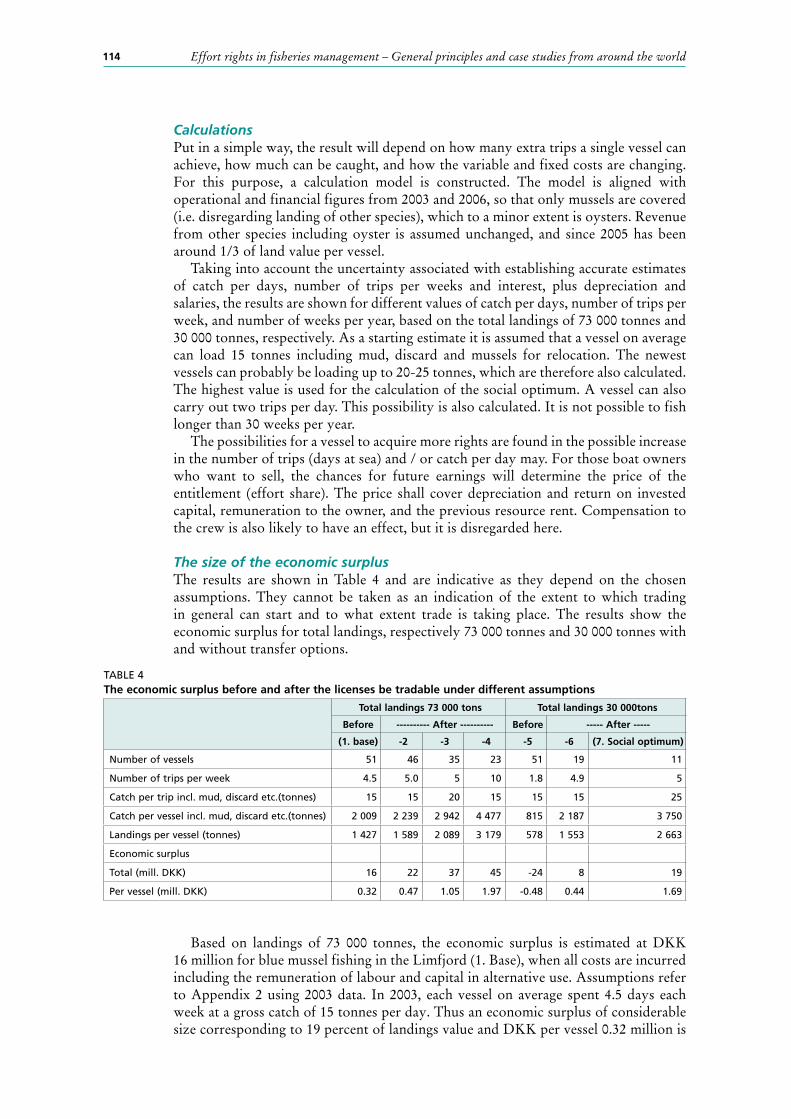
114 Effort rights in fisheries management – General principles and case studies from around the world
CalculationsPut in a simple way, the result will depend on how many extra trips a single vessel can achieve, how much can be caught, and how the variable and fixed costs are changing. For this purpose, a calculation model is constructed. The model is aligned with operational and financial figures from 2003 and 2006, so that only mussels are covered (i.e. disregarding landing of other species), which to a minor extent is oysters. Revenue from other species including oyster is assumed unchanged, and since 2005 has been around 1/3 of land value per vessel.
Taking into account the uncertainty associated with establishing accurate estimates of catch per days, number of trips per weeks and interest, plus depreciation and salaries, the results are shown for different values of catch per days, number of trips per week, and number of weeks per year, based on the total landings of 73 000 tonnes and 30 000 tonnes, respectively. As a starting estimate it is assumed that a vessel on average can load 15 tonnes including mud, discard and mussels for relocation. The newest vessels can probably be loading up to 20-25 tonnes, which are therefore also calculated. The highest value is used for the calculation of the social optimum. A vessel can also carry out two trips per day. This possibility is also calculated. It is not possible to fish longer than 30 weeks per year.
The possibilities for a vessel to acquire more rights are found in the possible increase in the number of trips (days at sea) and / or catch per day may. For those boat owners who want to sell, the chances for future earnings will determine the price of the entitlement (effort share). The price shall cover depreciation and return on invested capital, remuneration to the owner, and the previous resource rent. Compensation to the crew is also likely to have an effect, but it is disregarded here.
The size of the economic surplusThe results are shown in Table 4 and are indicative as they depend on the chosen assumptions. They cannot be taken as an indication of the extent to which trading in general can start and to what extent trade is taking place. The results show the economic surplus for total landings, respectively 73 000 tonnes and 30 000 tonnes with and without transfer options.
Based on landings of 73 000 tonnes, the economic surplus is estimated at DKK 16 million for blue mussel fishing in the Limfjord (1. Base), when all costs are incurred including the remuneration of labour and capital in alternative use. Assumptions refer to Appendix 2 using 2003 data. In 2003, each vessel on average spent 4.5 days each week at a gross catch of 15 tonnes per day. Thus an economic surplus of considerable size corresponding to 19 percent of landings value and DKK per vessel 0.32 million is
TABLE 4 The economic surplus before and after the licenses be tradable under different assumptions
Total landings 73 000 tons Total landings 30 000tons
Before ---------- After ---------- Before ----- After -----
(1. base) -2 -3 -4 -5 -6 (7. Social optimum)
Number of vessels 51 46 35 23 51 19 11
Number of trips per week 4.5 5.0 5 10 1.8 4.9 5
Catch per trip incl. mud, discard etc.(tonnes) 15 15 20 15 15 15 25
Catch per vessel incl. mud, discard etc.(tonnes) 2 009 2 239 2 942 4 477 815 2 187 3 750
Landings per vessel (tonnes) 1 427 1 589 2 089 3 179 578 1 553 2 663
Economic surplus
Total (mill. DKK) 16 22 37 45 -24 8 19
Per vessel (mill. DKK) 0.32 0.47 1.05 1.97 -0.48 0.44 1.69
115Effort management in the Danish fishery for blue mussels
obtained. The good performance is partly because fishing for mussels in the Limfjord over several decades has been kept at a low level, which has meant that there are relatively few vessels with relatively large individual fishing opportunities to fish the sustainable amount.
At full utilization of days per weeks, the number of vessels is reduced by 5 to 46, and the economic profit rises by DKK 6 million to DKK 22 million (2) if the 5 vessels are removed without compensation (assuming sunk costs). If the five vessels which are deleted shall be compensated the economic profit decreases to DKK 17 million in total for the remaining vessels amounting to DKK 0.36 million per remaining vessel.
If it is possible to catch 20 tonnes per trip (3), or two trips per days with 15 tonnes per trip (4) the number of vessels is reduced to 35 and 23, and the economic profit will then increase to DKK 37 and 45 million. These cases are estimated to be the lower limit on the number of vessels with the current limitations in GT and kW (see Table 1).
Table 4 also shows the landings of mussels. If the number of vessels is reduced to 23, each vessel must land well over twice what each vessel landed in 2003. This amount per vessel is roughly equivalent to what the larger vessels are fishing off the coast of Jutland landed and this is not possible. Therefore, at a total quota at 73 000 tones it is unlikely that the fleet is reduced by more than 16 vessels (approximately 30 percent). But as the profit even with 51 vessels are very high no change is the number of vessels is likely even with transferability introduced.
In terms of employment it is assumed that two fishers are employed by each vessel in the fishery. This means that the overall employment will decrease from approximately 102 persons in the initial situation (1) for approximately 46 people in situation (4) with 23 vessels, but rather to 70 persons at 35 vessels.
Based on landings at 30 000 tonnes, the economic surplus before licenses be tradable is calculated to be equal to minus DKK 24 million in the Limfjord (5). Assumptions refer to Appendix 3 using 2006 data. It should be noted that the fishing year statistics for 2006 show a surplus, see Table 4. The economic surplus on this basis is underestimated because it is assumed that the oyster catch is maintained at 2003 level where they actually have increased. At the same time, the calculation is solely based on landings equal to 2006 levels, given the structure in 2003. This means that no provision was made for fishers that adapted to declining fishing opportunities. A negative economic profit means that interest and wage rates under the assumptions given here is smaller than in other industries. Thus, there is obviously significant difference in the economic surplus of mussel fishery in the Limfjord by total landings of 73 000 tonnes and 30 000 tonnes. The economic surplus is so high during the previous year’s favourable biological situation, but negative during the last years of deteriorating stock situation.
When the calculation is based on total landings of 30 000 tonnes, the number of vessels is reduced to 19 in (6) when the licenses will be tradable, and the result is an economic profit of DKK 8 million. Employment is expected to fall approximately to 38 people assuming that landings cannot be increased and that there is full adaptation to 19 vessels.
The final scenario (7) is an estimate of the social optimum at landing at 30 000 tonnes. Full use of capacity is assumed (i.e. catch per day is 25 tonnes including mud, discard and relocation of small mussels). The number of vessels can be reduced to 11 and the economic surplus increases to DKK 19 million equal to approximately 56 percent of the landing value.
The question of how small proportions licenses can be broken down to can also be illustrated by Table 4. One vessel landings per year almost doubled if it is to acquire another vessel rights hero. If the vessels expand to the maximum number of days per week compared with 2003, the number of days increase by over 10 percent (from 4.5 to 5 per week on average) and 5 vessels could be deleted, see Table 4 (1) and (2). Each
116 Effort rights in fisheries management – General principles and case studies from around the world
of the remaining vessels can then on average catch 230 tonnes more or about 10 percent more under the same conditions as in 2003 with just a few more days at sea. It suggests that the licenses must be divided into small units.
Distribution of economic surplusThe economic surplus accrues in the first place boat owners in the form of profits and the crew in the form of a higher salary than they could have earned if they had been employed in other industries. However, paid corporation tax and income tax implies that the government also gets a share of the economic surplus. Thus, corporate tax at 38 percent of the profits now reduced to 25 percent and the marginal income tax rate is around 64 percent, as mussel fishers typically must pay the highest marginal rate as they earn more than they could have earned in other low income professions. Conversely, the public also have management costs related to the mussel fishing, for example to enforcement and control, biological studies and grants in general. These should be offset in the public share of the economic surplus because it is a cost to society. Instruments that can be used to rent capture from the fishers can be divided into user fees and charges. User charges include for example the sale of licenses at auction, where tax instruments include taxes on landings, ownership and sale of licenses.
EFFORT MANAGEMENT: A PRELIMINARY ASSESSMENTAccording to Libecap (1989), agreements on new institutional structure in natural resource exploitation depend on:
• size of the aggregate gains to be share;• the number and heterogeneity of the involved parties;• extent of limited and asymmetric information;• distribution issues;• physical characteristic of the resource.An institutional structure defines the property right system and the quality of the
system. As shown, the mussel fishery in Limfjord has been valuable, and the fishery can be characterized by a stationary fish stock with basically one fishing technique applied (i.e. a homogenous user-group). Therefore, in general there have been no information problems. It also seems like that distributional issues have played some role, because every vessel more or less the same size has the same access to the fish stock. When the regulation of this fishery developed the management paradigm was input regulation, and because of the characteristics of the fishery it has worked from both a biological and economic point of view (i.e. the quality of institutional structure has been relatively good). However, in the recent years where the fishing opportunities have fallen by around 60 percent, the current management system has shown sign of weakness. The economic surplus has been negative and the adjustment in the number of vessels has been slow, and therefore some fishers suggested implementing a new institutional structure based on ITQs. The property right quality of the ITQ-system might be better, but it will depend on the actual implementation (“the devil is in the details”). We can only speculate about whether the change will happen, but it probably depends mainly on (i) size of the gain and (ii) distributional issues.
117Effort management in the Danish fishery for blue mussels
The input regulation approach can be seen as a second best policy1. This approach is often characterized by the use of several instruments (licenses, restriction on vessel size, season limits, etc.). As observed by Bennear and Stavins (2007), the use of multiple policy instruments in fisheries management is in practice more the norm than the exception. However, most of the research has been concentrated on comparative analysis of single policy instruments (e.g. output quotas versus effort regulation or quantity versus prices). If there are constraints (e.g. technical or political) that cannot be removed, then first-best policies are not relevant anymore; instead the task is to find the best of the second-best policies. If we accept that ITQs are the first-best solution but at the same time it cannot be used due to political constraints, then the set of applied policy instruments in the mussel fishery can be considered as a second best policy (Kronbak, Squires and Vestergaard, 2014). This second-best policy can be improved, because there is a need for reduction in the number of vessels in the fishery, which the current policy does not induce.
CONCLUSIONBased on the foregoing, it can be concluded that:
• The economic surplus of mussel fishery in the Limfjord is DKK 16 million and 19 percent of the landing value with total landings of 73 000 tonnes. Under these conditions, blue mussel fishers earn more than in other industries.
• The economic surplus of the Limfjord mussel fishery is DKK -24 million, with total landings of 30 000 tonnes and the current (before permits were made transferable) number of vessels is 51. Under these conditions, blue mussel fishers earn less than in other professions.
• The economic surplus of the Limfjord mussel fishery will increase if the licenses be tradable. Based on a total catch of 73 000 tonnes the economic surplus is estimated to rise from DKK 16 million to DKK 22-45 million under alternative assumptions.
• Based on a total catch of 30 000 tonnes, the economic surplus is estimated to rise from being negative DKK24 million to a profit at DKK 8 million. In the social optimum the number of vessels should be reduced to 11 with an economic surplus at DKK 19 million equal to 56 percent of the total landing value.
Should licenses be tradable, the consequence will, based on total catch of 73 000 tonnes, be that current mussel fishers in the Limfjord given rights to fishing for a value, where the size depends on the development of the resource base. The value is determined by the economic surplus that is expected after the introduction of negotiability. This size of surplus will be significantly greater than in other parts of the Danish fishery after individual transferable quotas and vessel quota shares (FKA) were introduced there. Based on a total catch of 30 000 tonnes, the mussel fishers will economically be on equal footing with the other Danish fishers by the introduction of the vessel quota shares.
1 A perfect competitive economy (i.e. no externalities, full information, no uncertainty, many homogenous producers and consumers, etc.) will lead to a first best outcome characterized by a set of Pareto optimal conditions. Lipsey and Lancaster (1956) showed that introducing a constraint or distortion preventing attainment of one or more of the first best conditions then it is not optimal to impose the other first best conditions. The second best solution is also Pareto optimal given the constraint(s) in force, and the solution cannot in general be translated into simple relationship between prices and marginal cost (Bohm, 2008). Introducing one externality or market failure, in many cases there exist a policy that restores the conditions for the first best outcome; hence the second best problem has a first best optimal solution and this policy is called first best policy. This simple example shows that it is important to distinguish between second best problems and second best optimum solutions.
118 Effort rights in fisheries management – General principles and case studies from around the world
REFERENCESBennear, L.S. & Stavins, R.N. 2007. Second-Best Theory and the Use of Multiple Policy
Instruments. Environmental and Resource Economics, 37(1): 111-129.Bohm, P. 2008. Second best. In S.N. Durlauf, L.E. Blume & P. Macmillan, eds. The New
Palgrave Dictionary of Economics, 2nd edition. Basingstoke, Hampshire, New York, Palgrave Macmillan.
Bråten, S. & Platz, E. M. 2006. Muslingeproduktion i Limfjorden – et statusnotat til handlingsplan for Limfjorden. Nordjyllands, Ringkøbing, Viborg og Århus amter.
Christiansen, T., Christensen T. J., Markager, S., Petersen, J. K. & Mouritsen, L. T. 2006. Limfjorden i 100 år. Klima, hydrografi, næringsstoftilførsel, bundfauna og fisk i Limfjorden fra 1897 til 2003. Faglig rapport fra DMU, nr. 578.
Grafton, R.Q. 1995. Rent Capture in Right-Based Fishery. Journal of Environmental Economics and Management, 28: 48-67.
Habitatsdirektivet. Direktiv 92/43/EF af 21. maj 1992 om bevaring af naturtyper samt vilde dyr og planter.
Hoffmann, E. 2005. Fisk, fiskeri og epifauna, Limfjorden 1984 – 2004. DFU-rapport 147-05.
Kristensen. P. & Hoffmann, E. 2000. Fiskeri efter blåmuslinger i Danmark 1989 – 1999. DFU rapport nr. 72 – 00.
Kristensen. P. & Hoffmann, E. 2004. Bestanden af blåmuslinger i Limfjorden 1993 til 2003. DFU-Rapport nr. 130-04.
Kronbak, L.G., Squires, D. & Vestergaard, N. 2014. Recent Developments in Fisheries Economics Research. International Review of Environmental and Resource Economics 7 (1), 67-108.
Libecap, C. D. 1989. Contracting for property rights. New York, Cambridge University Press.
Lipsey, R.G. & Lancaster, K. 1956. The general theory of second best. The Review of Economic Studies, 24(1): 11-32.
Lov om miljømål m.v. for vandforekomster og international naturbeskyttelsesområder (miljømålsloven). Lov nr. 1150 af 17.12.2003.
Ministeriet for Fødevare Landbrug og Fiskeri. 2004. Rapport fra udvalget vedr. bæredygtig udnyttelse af muslinger i danske farvande, kapitel 9, Markedet for muslinger og de fremtidige markedsudsigter, April 2004.
Nielsen, H. 2007. Vandrammedirektivet – vejen til et bedre miljø. Det Økologiske Råd.Scott, A. 1955. The fishery: the objective of sole-ownership. Journal of Political Economy,
63(2): 116-124.Statistics Denmark. Account statistics for Fishery.Vandrammedirektivets basisanalyse del II.2006. Vurdering af vandforekomsters
tilstand og en vurdering af risikoen for, at vandforekomsterne ikke kan opfylde regionplanmålene senest 22. December 2015 for Oplandet til Limfjorden omfattende vanddistriktsmyndighed 65, 76 og 80. Ringkøbing Amt, Viborg Amt, Århus Amt og Nordjyllands Amt.
Vandrammedirektivet: Direktiv 2000/60/EF af 23. Oktober 2000 om fastlæggelse af en ramme for Fællesskabets vandpolitiske foranstaltninger.
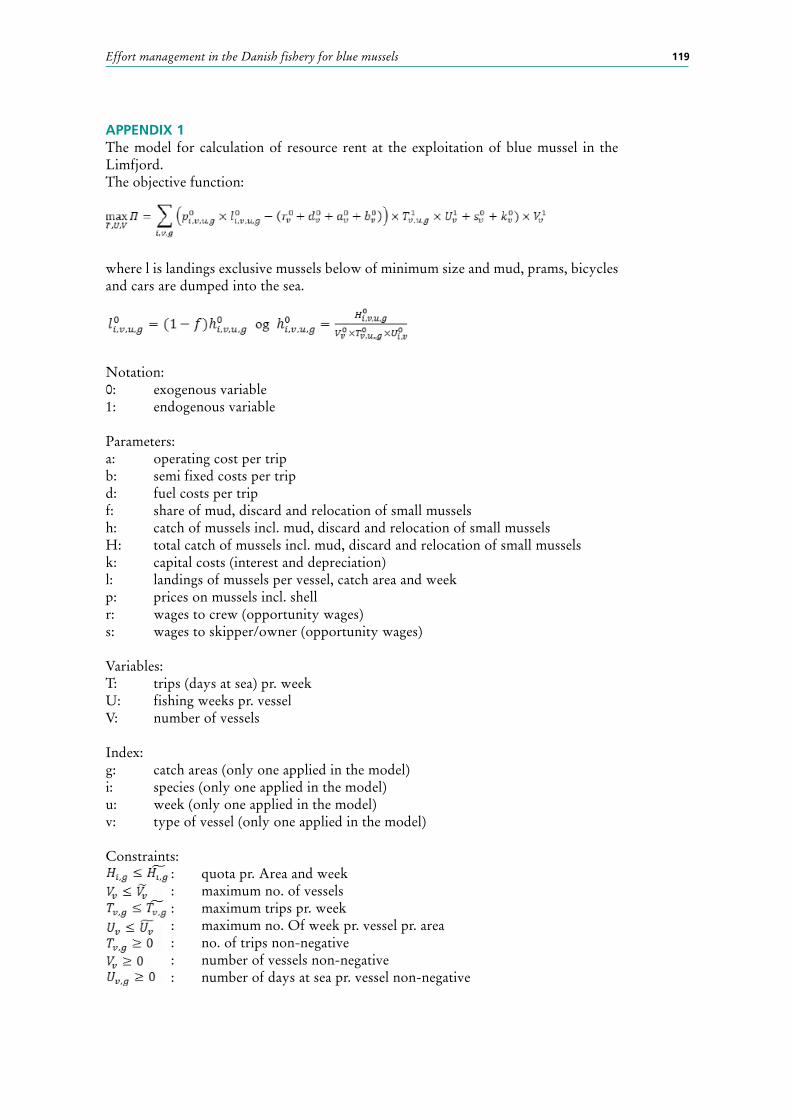
119Effort management in the Danish fishery for blue mussels
APPENDIX 1The model for calculation of resource rent at the exploitation of blue mussel in the Limfjord.The objective function:
where l is landings exclusive mussels below of minimum size and mud, prams, bicycles and cars are dumped into the sea.
Notation:0: exogenous variable1: endogenous variable
Parameters:a: operating cost per tripb: semi fixed costs per tripd: fuel costs per tripf: share of mud, discard and relocation of small musselsh: catch of mussels incl. mud, discard and relocation of small musselsH: total catch of mussels incl. mud, discard and relocation of small musselsk: capital costs (interest and depreciation)l: landings of mussels per vessel, catch area and weekp: prices on mussels incl. shellr: wages to crew (opportunity wages)s: wages to skipper/owner (opportunity wages)
Variables:T: trips (days at sea) pr. weekU: fishing weeks pr. vesselV: number of vessels
Index:g: catch areas (only one applied in the model)i: species (only one applied in the model)u: week (only one applied in the model)v: type of vessel (only one applied in the model)
Constraints: : quota pr. Area and week : maximum no. of vessels : maximum trips pr. week : maximum no. Of week pr. vessel pr. area : no. of trips non-negative : number of vessels non-negative : number of days at sea pr. vessel non-negative
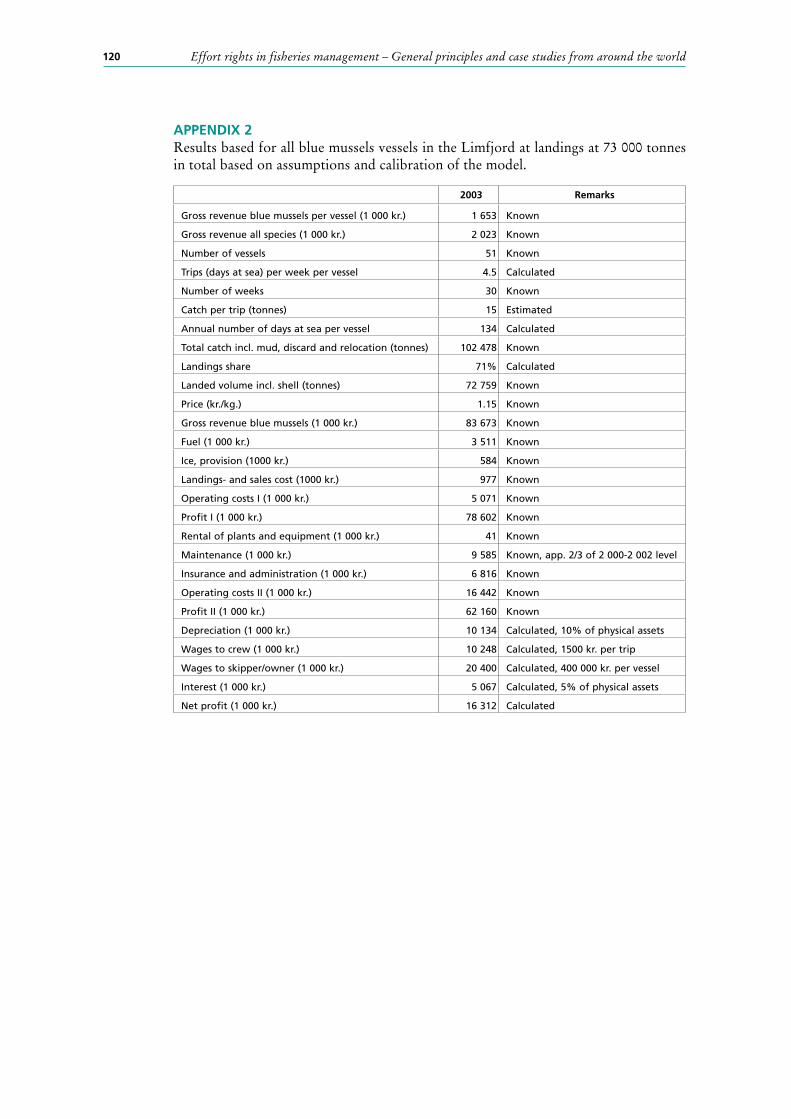
120 Effort rights in fisheries management – General principles and case studies from around the world
APPENDIX 2Results based for all blue mussels vessels in the Limfjord at landings at 73 000 tonnes in total based on assumptions and calibration of the model.
2003 Remarks
Gross revenue blue mussels per vessel (1 000 kr.) 1 653 Known
Gross revenue all species (1 000 kr.) 2 023 Known
Number of vessels 51 Known
Trips (days at sea) per week per vessel 4.5 Calculated
Number of weeks 30 Known
Catch per trip (tonnes) 15 Estimated
Annual number of days at sea per vessel 134 Calculated
Total catch incl. mud, discard and relocation (tonnes) 102 478 Known
Landings share 71% Calculated
Landed volume incl. shell (tonnes) 72 759 Known
Price (kr./kg.) 1.15 Known
Gross revenue blue mussels (1 000 kr.) 83 673 Known
Fuel (1 000 kr.) 3 511 Known
Ice, provision (1000 kr.) 584 Known
Landings- and sales cost (1000 kr.) 977 Known
Operating costs I (1 000 kr.) 5 071 Known
Profit I (1 000 kr.) 78 602 Known
Rental of plants and equipment (1 000 kr.) 41 Known
Maintenance (1 000 kr.) 9 585 Known, app. 2/3 of 2 000-2 002 level
Insurance and administration (1 000 kr.) 6 816 Known
Operating costs II (1 000 kr.) 16 442 Known
Profit II (1 000 kr.) 62 160 Known
Depreciation (1 000 kr.) 10 134 Calculated, 10% of physical assets
Wages to crew (1 000 kr.) 10 248 Calculated, 1500 kr. per trip
Wages to skipper/owner (1 000 kr.) 20 400 Calculated, 400 000 kr. per vessel
Interest (1 000 kr.) 5 067 Calculated, 5% of physical assets
Net profit (1 000 kr.) 16 312 Calculated
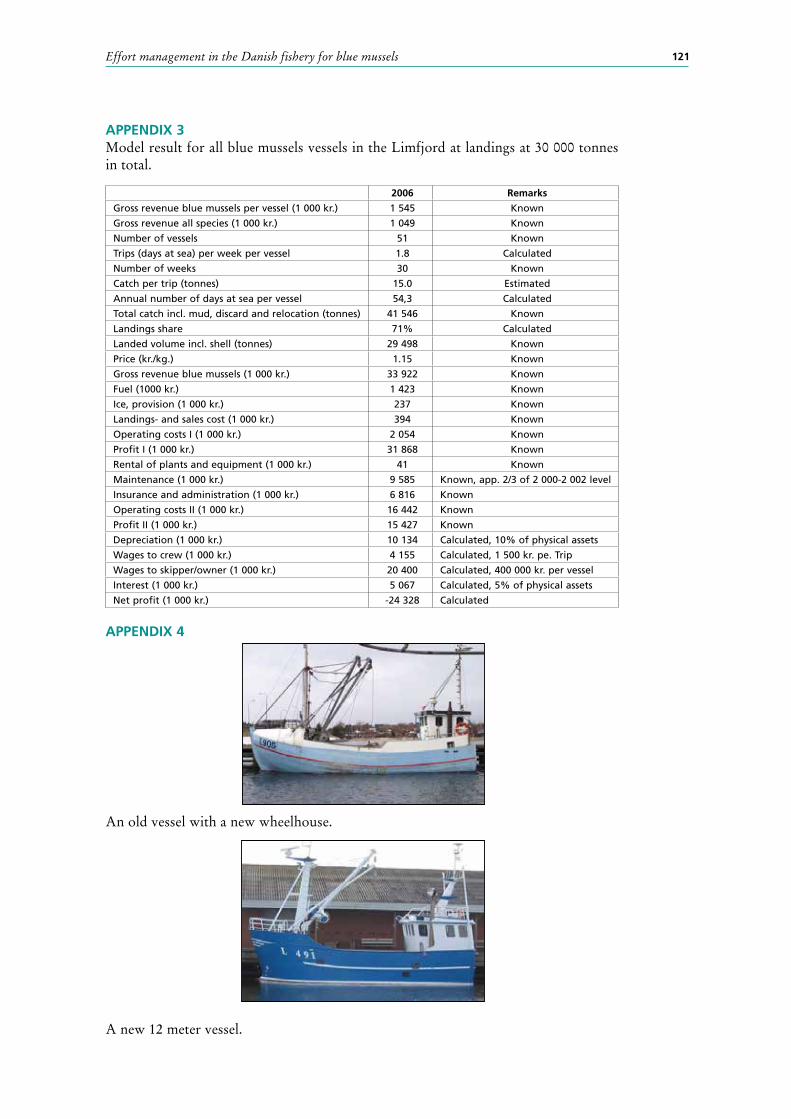
121Effort management in the Danish fishery for blue mussels
APPENDIX 3Model result for all blue mussels vessels in the Limfjord at landings at 30 000 tonnes in total.
APPENDIX 4
An old vessel with a new wheelhouse.
A new 12 meter vessel.
2006 Remarks
Gross revenue blue mussels per vessel (1 000 kr.) 1 545 Known
Gross revenue all species (1 000 kr.) 1 049 Known
Number of vessels 51 Known
Trips (days at sea) per week per vessel 1.8 Calculated
Number of weeks 30 Known
Catch per trip (tonnes) 15.0 Estimated
Annual number of days at sea per vessel 54,3 Calculated
Total catch incl. mud, discard and relocation (tonnes) 41 546 Known
Landings share 71% Calculated
Landed volume incl. shell (tonnes) 29 498 Known
Price (kr./kg.) 1.15 Known
Gross revenue blue mussels (1 000 kr.) 33 922 Known
Fuel (1000 kr.) 1 423 Known
Ice, provision (1 000 kr.) 237 Known
Landings- and sales cost (1 000 kr.) 394 Known
Operating costs I (1 000 kr.) 2 054 Known
Profit I (1 000 kr.) 31 868 Known
Rental of plants and equipment (1 000 kr.) 41 Known
Maintenance (1 000 kr.) 9 585 Known, app. 2/3 of 2 000-2 002 level
Insurance and administration (1 000 kr.) 6 816 Known
Operating costs II (1 000 kr.) 16 442 Known
Profit II (1 000 kr.) 15 427 Known
Depreciation (1 000 kr.) 10 134 Calculated, 10% of physical assets
Wages to crew (1 000 kr.) 4 155 Calculated, 1 500 kr. pe. Trip
Wages to skipper/owner (1 000 kr.) 20 400 Calculated, 400 000 kr. per vessel
Interest (1 000 kr.) 5 067 Calculated, 5% of physical assets
Net profit (1 000 kr.) -24 328 Calculated

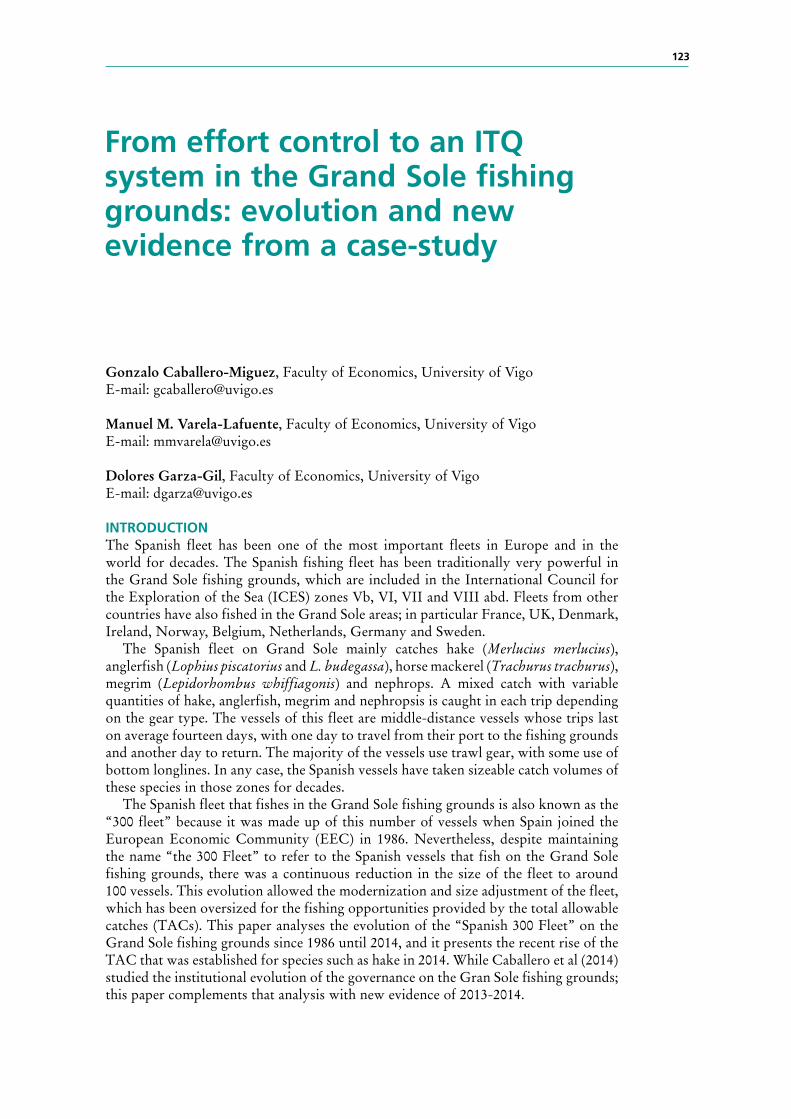
123
From effort control to an ITQ system in the Grand Sole fishing grounds: evolution and new evidence from a case-study
Gonzalo Caballero-Miguez, Faculty of Economics, University of VigoE-mail: [email protected]
Manuel M. Varela-Lafuente, Faculty of Economics, University of VigoE-mail: [email protected]
Dolores Garza-Gil, Faculty of Economics, University of VigoE-mail: [email protected]
INTRODUCTIONThe Spanish fleet has been one of the most important fleets in Europe and in the world for decades. The Spanish fishing fleet has been traditionally very powerful in the Grand Sole fishing grounds, which are included in the International Council for the Exploration of the Sea (ICES) zones Vb, VI, VII and VIII abd. Fleets from other countries have also fished in the Grand Sole areas; in particular France, UK, Denmark, Ireland, Norway, Belgium, Netherlands, Germany and Sweden.
The Spanish fleet on Grand Sole mainly catches hake (Merlucius merlucius), anglerfish (Lophius piscatorius and L. budegassa), horse mackerel (Trachurus trachurus), megrim (Lepidorhombus whiffiagonis) and nephrops. A mixed catch with variable quantities of hake, anglerfish, megrim and nephropsis is caught in each trip depending on the gear type. The vessels of this fleet are middle-distance vessels whose trips last on average fourteen days, with one day to travel from their port to the fishing grounds and another day to return. The majority of the vessels use trawl gear, with some use of bottom longlines. In any case, the Spanish vessels have taken sizeable catch volumes of these species in those zones for decades.
The Spanish fleet that fishes in the Grand Sole fishing grounds is also known as the “300 fleet” because it was made up of this number of vessels when Spain joined the European Economic Community (EEC) in 1986. Nevertheless, despite maintaining the name “the 300 Fleet” to refer to the Spanish vessels that fish on the Grand Sole fishing grounds, there was a continuous reduction in the size of the fleet to around 100 vessels. This evolution allowed the modernization and size adjustment of the fleet, which has been oversized for the fishing opportunities provided by the total allowable catches (TACs). This paper analyses the evolution of the “Spanish 300 Fleet” on the Grand Sole fishing grounds since 1986 until 2014, and it presents the recent rise of the TAC that was established for species such as hake in 2014. While Caballero et al (2014) studied the institutional evolution of the governance on the Gran Sole fishing grounds; this paper complements that analysis with new evidence of 2013-2014.
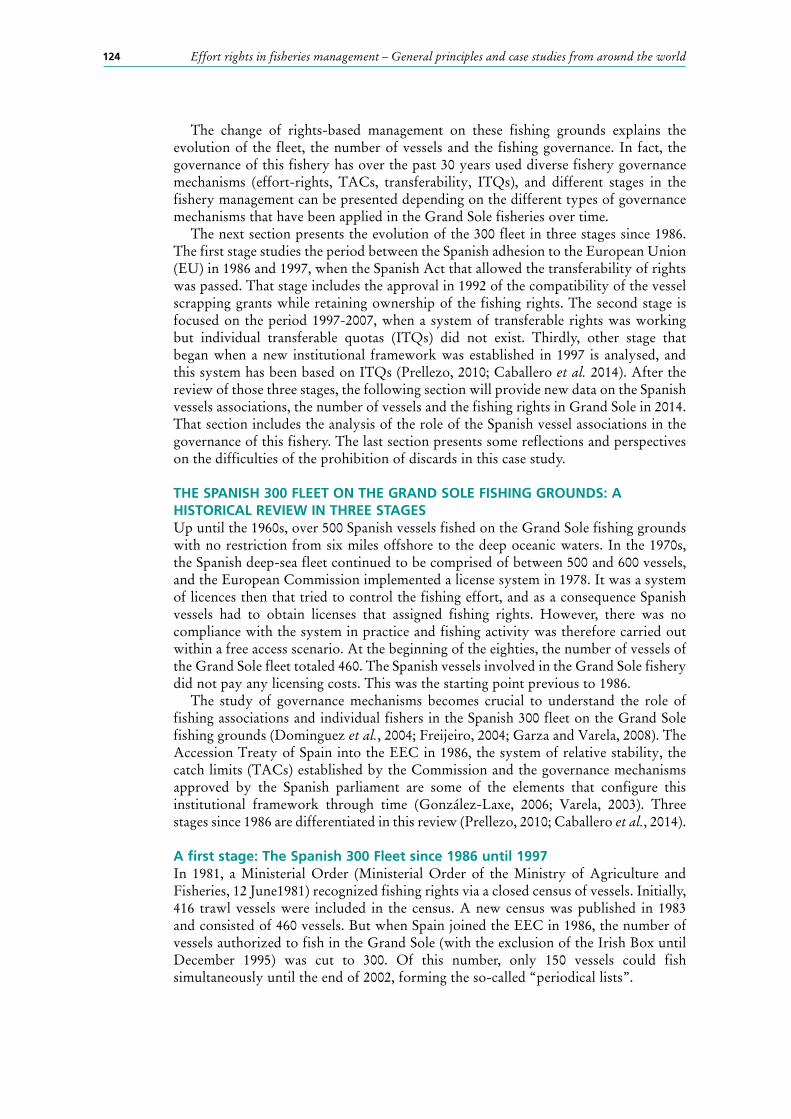
124 Effort rights in fisheries management – General principles and case studies from around the world
The change of rights-based management on these fishing grounds explains the evolution of the fleet, the number of vessels and the fishing governance. In fact, the governance of this fishery has over the past 30 years used diverse fishery governance mechanisms (effort-rights, TACs, transferability, ITQs), and different stages in the fishery management can be presented depending on the different types of governance mechanisms that have been applied in the Grand Sole fisheries over time.
The next section presents the evolution of the 300 fleet in three stages since 1986. The first stage studies the period between the Spanish adhesion to the European Union (EU) in 1986 and 1997, when the Spanish Act that allowed the transferability of rights was passed. That stage includes the approval in 1992 of the compatibility of the vessel scrapping grants while retaining ownership of the fishing rights. The second stage is focused on the period 1997-2007, when a system of transferable rights was working but individual transferable quotas (ITQs) did not exist. Thirdly, other stage that began when a new institutional framework was established in 1997 is analysed, and this system has been based on ITQs (Prellezo, 2010; Caballero et al. 2014). After the review of those three stages, the following section will provide new data on the Spanish vessels associations, the number of vessels and the fishing rights in Grand Sole in 2014. That section includes the analysis of the role of the Spanish vessel associations in the governance of this fishery. The last section presents some reflections and perspectives on the difficulties of the prohibition of discards in this case study.
THE SPANISH 300 FLEET ON THE GRAND SOLE FISHING GROUNDS: A HISTORICAL REVIEW IN THREE STAGESUp until the 1960s, over 500 Spanish vessels fished on the Grand Sole fishing grounds with no restriction from six miles offshore to the deep oceanic waters. In the 1970s, the Spanish deep-sea fleet continued to be comprised of between 500 and 600 vessels, and the European Commission implemented a license system in 1978. It was a system of licences then that tried to control the fishing effort, and as a consequence Spanish vessels had to obtain licenses that assigned fishing rights. However, there was no compliance with the system in practice and fishing activity was therefore carried out within a free access scenario. At the beginning of the eighties, the number of vessels of the Grand Sole fleet totaled 460. The Spanish vessels involved in the Grand Sole fishery did not pay any licensing costs. This was the starting point previous to 1986.
The study of governance mechanisms becomes crucial to understand the role of fishing associations and individual fishers in the Spanish 300 fleet on the Grand Sole fishing grounds (Dominguez et al., 2004; Freijeiro, 2004; Garza and Varela, 2008). The Accession Treaty of Spain into the EEC in 1986, the system of relative stability, the catch limits (TACs) established by the Commission and the governance mechanisms approved by the Spanish parliament are some of the elements that configure this institutional framework through time (González-Laxe, 2006; Varela, 2003). Three stages since 1986 are differentiated in this review (Prellezo, 2010; Caballero et al., 2014).
A first stage: The Spanish 300 Fleet since 1986 until 1997In 1981, a Ministerial Order (Ministerial Order of the Ministry of Agriculture and Fisheries, 12 June1981) recognized fishing rights via a closed census of vessels. Initially, 416 trawl vessels were included in the census. A new census was published in 1983 and consisted of 460 vessels. But when Spain joined the EEC in 1986, the number of vessels authorized to fish in the Grand Sole (with the exclusion of the Irish Box until December 1995) was cut to 300. Of this number, only 150 vessels could fish simultaneously until the end of 2002, forming the so-called “periodical lists”.
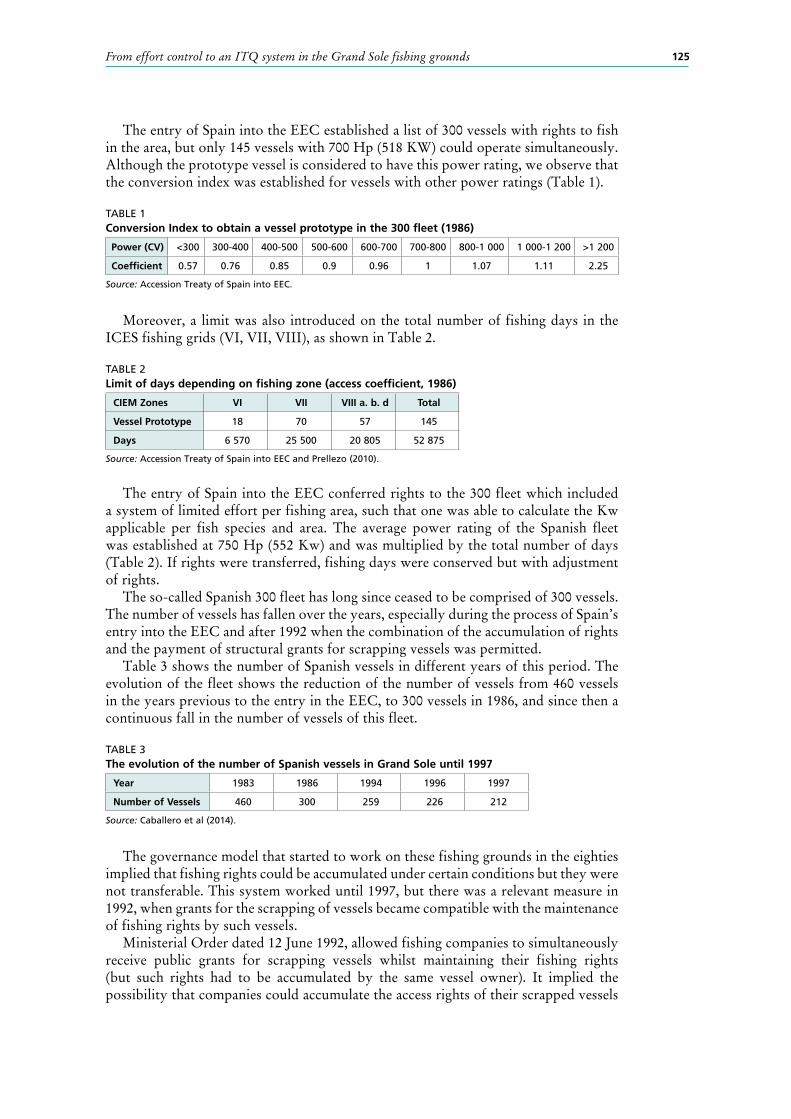
125From effort control to an ITQ system in the Grand Sole fishing grounds
The entry of Spain into the EEC established a list of 300 vessels with rights to fish in the area, but only 145 vessels with 700 Hp (518 KW) could operate simultaneously. Although the prototype vessel is considered to have this power rating, we observe that the conversion index was established for vessels with other power ratings (Table 1).
TABLE 1Conversion Index to obtain a vessel prototype in the 300 fleet (1986)
Power (CV) <300 300-400 400-500 500-600 600-700 700-800 800-1 000 1 000-1 200 >1 200
Coefficient 0.57 0.76 0.85 0.9 0.96 1 1.07 1.11 2.25
Source: Accession Treaty of Spain into EEC.
Moreover, a limit was also introduced on the total number of fishing days in the ICES fishing grids (VI, VII, VIII), as shown in Table 2.
TABLE 2Limit of days depending on fishing zone (access coefficient, 1986)
CIEM Zones VI VII VIII a. b. d Total
Vessel Prototype 18 70 57 145
Days 6 570 25 500 20 805 52 875
Source: Accession Treaty of Spain into EEC and Prellezo (2010).
The entry of Spain into the EEC conferred rights to the 300 fleet which included a system of limited effort per fishing area, such that one was able to calculate the Kw applicable per fish species and area. The average power rating of the Spanish fleet was established at 750 Hp (552 Kw) and was multiplied by the total number of days (Table 2). If rights were transferred, fishing days were conserved but with adjustment of rights.
The so-called Spanish 300 fleet has long since ceased to be comprised of 300 vessels. The number of vessels has fallen over the years, especially during the process of Spain’s entry into the EEC and after 1992 when the combination of the accumulation of rights and the payment of structural grants for scrapping vessels was permitted.
Table 3 shows the number of Spanish vessels in different years of this period. The evolution of the fleet shows the reduction of the number of vessels from 460 vessels in the years previous to the entry in the EEC, to 300 vessels in 1986, and since then a continuous fall in the number of vessels of this fleet.
TABLE 3The evolution of the number of Spanish vessels in Grand Sole until 1997
Year 1983 1986 1994 1996 1997
Number of Vessels 460 300 259 226 212
Source: Caballero et al (2014).
The governance model that started to work on these fishing grounds in the eighties implied that fishing rights could be accumulated under certain conditions but they were not transferable. This system worked until 1997, but there was a relevant measure in 1992, when grants for the scrapping of vessels became compatible with the maintenance of fishing rights by such vessels.
Ministerial Order dated 12 June 1992, allowed fishing companies to simultaneously receive public grants for scrapping vessels whilst maintaining their fishing rights (but such rights had to be accumulated by the same vessel owner). It implied the possibility that companies could accumulate the access rights of their scrapped vessels
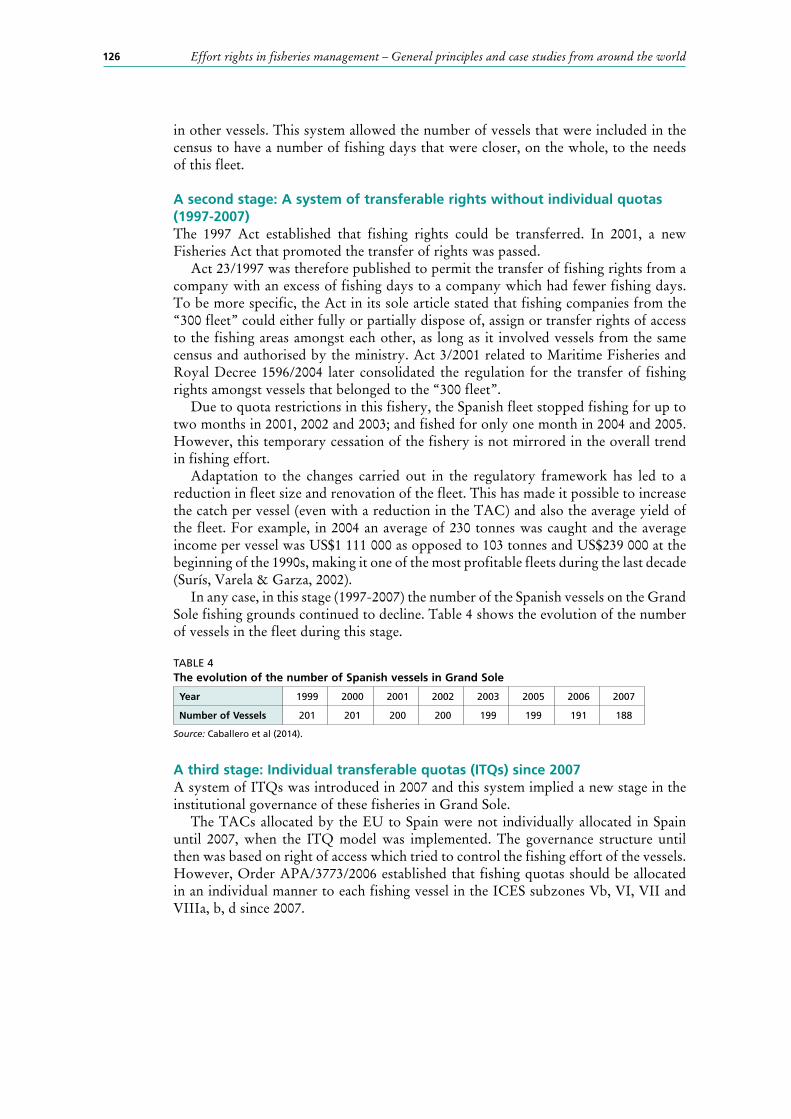
126 Effort rights in fisheries management – General principles and case studies from around the world
in other vessels. This system allowed the number of vessels that were included in the census to have a number of fishing days that were closer, on the whole, to the needs of this fleet.
A second stage: A system of transferable rights without individual quotas (1997-2007)The 1997 Act established that fishing rights could be transferred. In 2001, a new Fisheries Act that promoted the transfer of rights was passed.
Act 23/1997 was therefore published to permit the transfer of fishing rights from a company with an excess of fishing days to a company which had fewer fishing days. To be more specific, the Act in its sole article stated that fishing companies from the “300 fleet” could either fully or partially dispose of, assign or transfer rights of access to the fishing areas amongst each other, as long as it involved vessels from the same census and authorised by the ministry. Act 3/2001 related to Maritime Fisheries and Royal Decree 1596/2004 later consolidated the regulation for the transfer of fishing rights amongst vessels that belonged to the “300 fleet”.
Due to quota restrictions in this fishery, the Spanish fleet stopped fishing for up to two months in 2001, 2002 and 2003; and fished for only one month in 2004 and 2005. However, this temporary cessation of the fishery is not mirrored in the overall trend in fishing effort.
Adaptation to the changes carried out in the regulatory framework has led to a reduction in fleet size and renovation of the fleet. This has made it possible to increase the catch per vessel (even with a reduction in the TAC) and also the average yield of the fleet. For example, in 2004 an average of 230 tonnes was caught and the average income per vessel was US$1 111 000 as opposed to 103 tonnes and US$239 000 at the beginning of the 1990s, making it one of the most profitable fleets during the last decade (Surís, Varela & Garza, 2002).
In any case, in this stage (1997-2007) the number of the Spanish vessels on the Grand Sole fishing grounds continued to decline. Table 4 shows the evolution of the number of vessels in the fleet during this stage.
TABLE 4The evolution of the number of Spanish vessels in Grand Sole
Year 1999 2000 2001 2002 2003 2005 2006 2007
Number of Vessels 201 201 200 200 199 199 191 188
Source: Caballero et al (2014).
A third stage: Individual transferable quotas (ITQs) since 2007A system of ITQs was introduced in 2007 and this system implied a new stage in the institutional governance of these fisheries in Grand Sole.
The TACs allocated by the EU to Spain were not individually allocated in Spain until 2007, when the ITQ model was implemented. The governance structure until then was based on right of access which tried to control the fishing effort of the vessels. However, Order APA/3773/2006 established that fishing quotas should be allocated in an individual manner to each fishing vessel in the ICES subzones Vb, VI, VII and VIIIa, b, d since 2007.
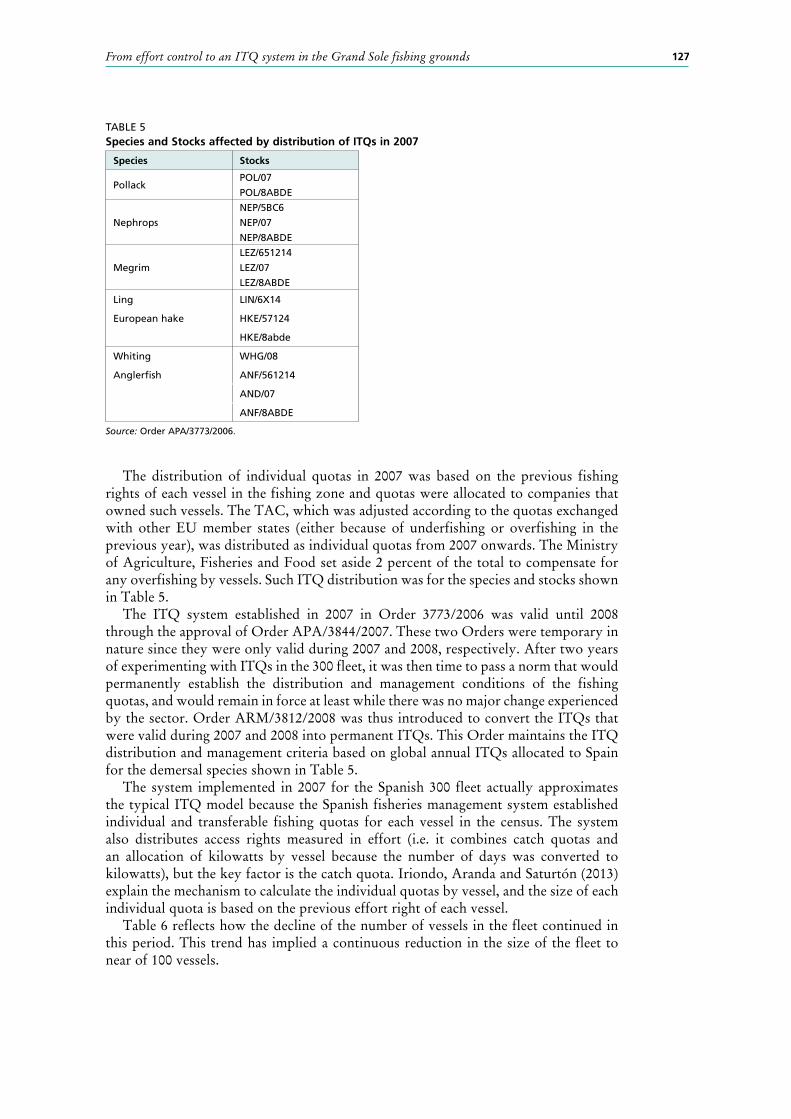
127From effort control to an ITQ system in the Grand Sole fishing grounds
TABLE 5Species and Stocks affected by distribution of ITQs in 2007
Species Stocks
PollackPOL/07
POL/8ABDE
Nephrops
NEP/5BC6
NEP/07
NEP/8ABDE
Megrim
LEZ/651214
LEZ/07
LEZ/8ABDE
Ling LIN/6X14
European hake HKE/57124
HKE/8abde
Whiting WHG/08
Anglerfish ANF/561214
AND/07
ANF/8ABDE
Source: Order APA/3773/2006.
The distribution of individual quotas in 2007 was based on the previous fishing rights of each vessel in the fishing zone and quotas were allocated to companies that owned such vessels. The TAC, which was adjusted according to the quotas exchanged with other EU member states (either because of underfishing or overfishing in the previous year), was distributed as individual quotas from 2007 onwards. The Ministry of Agriculture, Fisheries and Food set aside 2 percent of the total to compensate for any overfishing by vessels. Such ITQ distribution was for the species and stocks shown in Table 5.
The ITQ system established in 2007 in Order 3773/2006 was valid until 2008 through the approval of Order APA/3844/2007. These two Orders were temporary in nature since they were only valid during 2007 and 2008, respectively. After two years of experimenting with ITQs in the 300 fleet, it was then time to pass a norm that would permanently establish the distribution and management conditions of the fishing quotas, and would remain in force at least while there was no major change experienced by the sector. Order ARM/3812/2008 was thus introduced to convert the ITQs that were valid during 2007 and 2008 into permanent ITQs. This Order maintains the ITQ distribution and management criteria based on global annual ITQs allocated to Spain for the demersal species shown in Table 5.
The system implemented in 2007 for the Spanish 300 fleet actually approximates the typical ITQ model because the Spanish fisheries management system established individual and transferable fishing quotas for each vessel in the census. The system also distributes access rights measured in effort (i.e. it combines catch quotas and an allocation of kilowatts by vessel because the number of days was converted to kilowatts), but the key factor is the catch quota. Iriondo, Aranda and Saturtón (2013) explain the mechanism to calculate the individual quotas by vessel, and the size of each individual quota is based on the previous effort right of each vessel.
Table 6 reflects how the decline of the number of vessels in the fleet continued in this period. This trend has implied a continuous reduction in the size of the fleet to near of 100 vessels.
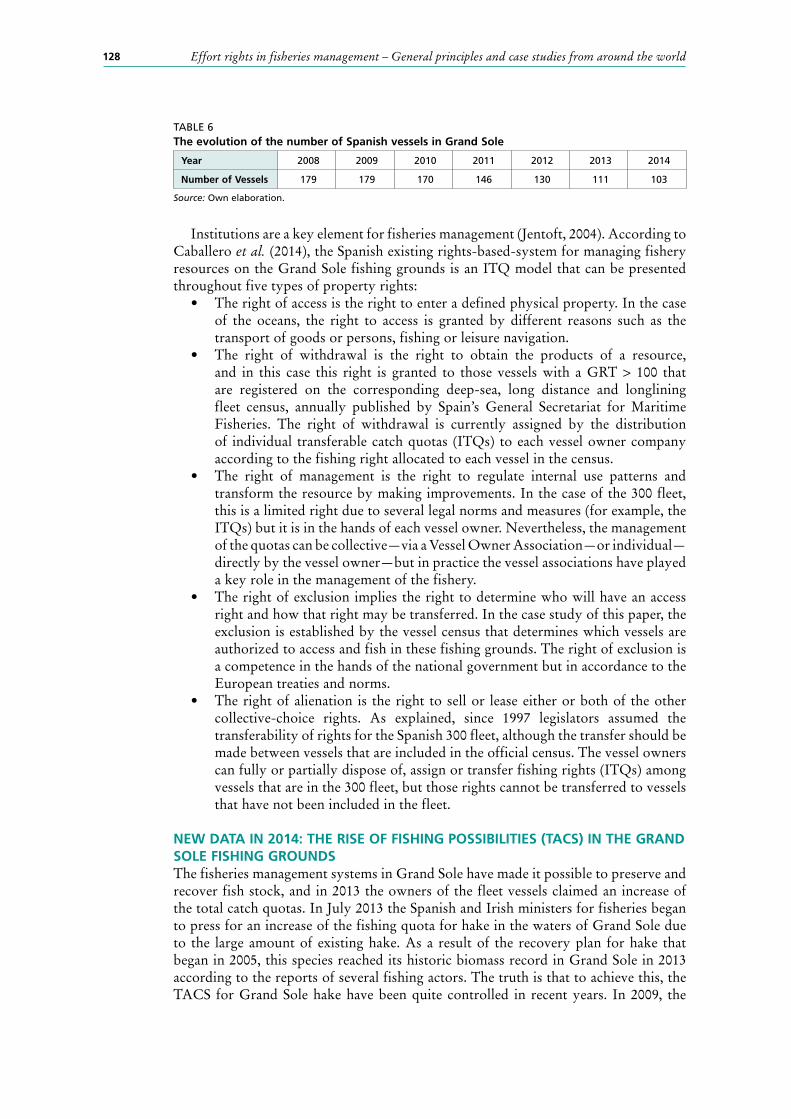
128 Effort rights in fisheries management – General principles and case studies from around the world
TABLE 6The evolution of the number of Spanish vessels in Grand Sole
Year 2008 2009 2010 2011 2012 2013 2014
Number of Vessels 179 179 170 146 130 111 103
Source: Own elaboration.
Institutions are a key element for fisheries management (Jentoft, 2004). According to Caballero et al. (2014), the Spanish existing rights-based-system for managing fishery resources on the Grand Sole fishing grounds is an ITQ model that can be presented throughout five types of property rights:
• The right of access is the right to enter a defined physical property. In the case of the oceans, the right to access is granted by different reasons such as the transport of goods or persons, fishing or leisure navigation.
• The right of withdrawal is the right to obtain the products of a resource, and in this case this right is granted to those vessels with a GRT > 100 that are registered on the corresponding deep-sea, long distance and longlining fleet census, annually published by Spain’s General Secretariat for Maritime Fisheries. The right of withdrawal is currently assigned by the distribution of individual transferable catch quotas (ITQs) to each vessel owner company according to the fishing right allocated to each vessel in the census.
• The right of management is the right to regulate internal use patterns and transform the resource by making improvements. In the case of the 300 fleet, this is a limited right due to several legal norms and measures (for example, the ITQs) but it is in the hands of each vessel owner. Nevertheless, the management of the quotas can be collective—via a Vessel Owner Association—or individual—directly by the vessel owner—but in practice the vessel associations have played a key role in the management of the fishery.
• The right of exclusion implies the right to determine who will have an access right and how that right may be transferred. In the case study of this paper, the exclusion is established by the vessel census that determines which vessels are authorized to access and fish in these fishing grounds. The right of exclusion is a competence in the hands of the national government but in accordance to the European treaties and norms.
• The right of alienation is the right to sell or lease either or both of the other collective-choice rights. As explained, since 1997 legislators assumed the transferability of rights for the Spanish 300 fleet, although the transfer should be made between vessels that are included in the official census. The vessel owners can fully or partially dispose of, assign or transfer fishing rights (ITQs) among vessels that are in the 300 fleet, but those rights cannot be transferred to vessels that have not been included in the fleet.
NEW DATA IN 2014: THE RISE OF FISHING POSSIBILITIES (TACS) IN THE GRAND SOLE FISHING GROUNDSThe fisheries management systems in Grand Sole have made it possible to preserve and recover fish stock, and in 2013 the owners of the fleet vessels claimed an increase of the total catch quotas. In July 2013 the Spanish and Irish ministers for fisheries began to press for an increase of the fishing quota for hake in the waters of Grand Sole due to the large amount of existing hake. As a result of the recovery plan for hake that began in 2005, this species reached its historic biomass record in Grand Sole in 2013 according to the reports of several fishing actors. The truth is that to achieve this, the TACS for Grand Sole hake have been quite controlled in recent years. In 2009, the
129From effort control to an ITQ system in the Grand Sole fishing grounds
TAC was reduced by 5 percent. Later, in 2010 the EU increased the TAC to 7 percent, but the TAC remained constant in 2011, 2012 and 2013. All this made it possible for the population of hake to reach the Maximum Sustainable Yield level.
This increase in hake stock was also corroborated by the International Council for the Exploration of the Sea; whereby this agency eventually recommended that the total allowable catch (TAC) for 2014 be increased.
In October 2013, most of the Spanish fleet in Grand Sole was no longer fishing. This was because many vessels had already exhausted their quotas of hake, while other vessels reserved part of their 2013 quota for the period closest to Christmas. However, the Spanish associations of vessels considered that there was an abundance of hake in Grand Sole, whereby they demanded that a higher level of catches be permitted for 2013 and also for the quotas to be immediately increased. The associations indicated that the EU could do this in the same manner as it had done in 2011, when it increased the quota for cod in the Celtic Sea.
The European Commission, following the Council of Ministers held on 17 October 2013, as an extraordinary measure, proposed a global increase of hake catches to 14 325 tonnes in northern waters for the remainder of 2013. Spain was allocated an increase of 4 019 tonnes of quota of hake for 2013, which represented a 27 percent increase over the quota for this species that was granted to Spain at the start of the year.
On 17 December 2013, the EU Council of Fisheries Ministers established the size of fishing quotas for 2014, and set an increase of 49 percent of the fishing quota for hake and 15 percent for anglerfish to the Spanish fleet at Gran Sol, whereas the share of megrim remains the same as in 2013. In this way, the highest increase corresponds to hake, which is the main species for the Spanish fleet, allowing a 7 500 tonnes increase in the fishing quota of hake compared with 2013 for the Spanish fleet. Thus, with these increases in quotas, the Spanish fleet at Gran Sol may fish up to 22 947 tonnes of hake and 2 597 tonnes of anglerfish in 2014.
The Agreement of the EU Fisheries Council made it possible to establish greater quotas than those intended by the Commission. In this regard, the Commission sought to maintain the same fishing quota for anglerfish as in 2013, without changes, but the Council increased the quota by 15 percent. The Commission wanted to reduce the quota of megrim for 2014 by 20 percent with respect to 2013, but the Fisheries Council maintained the quota. The Commission also proposed reducing the quota for nephrops in area VII by 24 percent and the Council finally only reduced it by 9 percent.
The conclusion is that 2014 took off in a scenario of widespread increase for absolute quotas for catches, which favours the Spanish fleet’s fishing opportunities. The Spanish government allocated these higher TACs throughout the system of ITQs established in 2007.
Official State Gazette (BOE) in February 8, 2014, established the ITQ for each vessel, and shows the Spanish vessel associations that group and manage the rights of the individual vessels. At this point, explaining the role of associations and individual vessels in the management of the Grand Sole fishery is relevant.
Whenever the Common Fisheries Policy establishes TACs for the different fish species and their distribution in national quotas amongst member countries, the Spanish State provides exclusive competence for maritime fisheries to the central government (article 149.1.19 of the Spanish Constitution), and so regional governments just play a simple consultative role. Both the Government of Spain and the Spanish parliament have competence to legislate and decide on the distribution of the fishing opportunities amongst the authorized Spanish vessels.
Order 3772/2006 permitted that ITQs be managed by the Associations to which the vessels were registered. It actually allowed ITQs to be managed individually by each vessel owner or by a Vessel Owner Association. The Order more precisely established
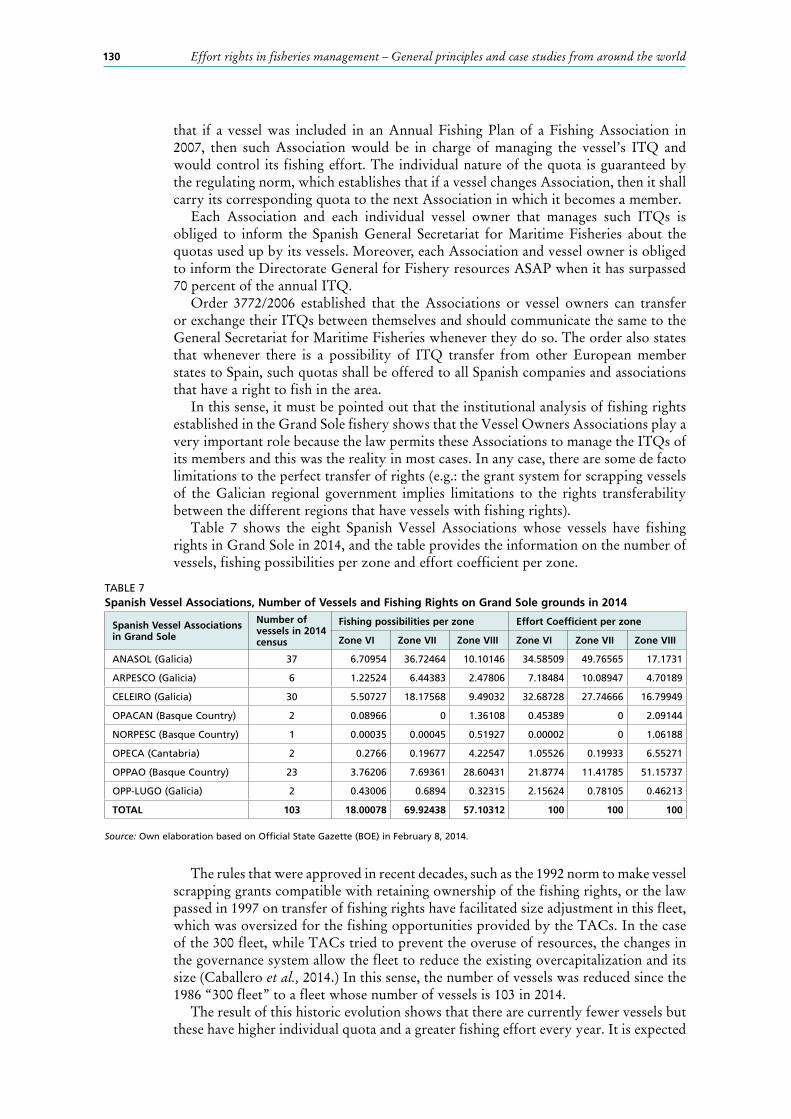
130 Effort rights in fisheries management – General principles and case studies from around the world
that if a vessel was included in an Annual Fishing Plan of a Fishing Association in 2007, then such Association would be in charge of managing the vessel’s ITQ and would control its fishing effort. The individual nature of the quota is guaranteed by the regulating norm, which establishes that if a vessel changes Association, then it shall carry its corresponding quota to the next Association in which it becomes a member.
Each Association and each individual vessel owner that manages such ITQs is obliged to inform the Spanish General Secretariat for Maritime Fisheries about the quotas used up by its vessels. Moreover, each Association and vessel owner is obliged to inform the Directorate General for Fishery resources ASAP when it has surpassed 70 percent of the annual ITQ.
Order 3772/2006 established that the Associations or vessel owners can transfer or exchange their ITQs between themselves and should communicate the same to the General Secretariat for Maritime Fisheries whenever they do so. The order also states that whenever there is a possibility of ITQ transfer from other European member states to Spain, such quotas shall be offered to all Spanish companies and associations that have a right to fish in the area.
In this sense, it must be pointed out that the institutional analysis of fishing rights established in the Grand Sole fishery shows that the Vessel Owners Associations play a very important role because the law permits these Associations to manage the ITQs of its members and this was the reality in most cases. In any case, there are some de facto limitations to the perfect transfer of rights (e.g.: the grant system for scrapping vessels of the Galician regional government implies limitations to the rights transferability between the different regions that have vessels with fishing rights).
Table 7 shows the eight Spanish Vessel Associations whose vessels have fishing rights in Grand Sole in 2014, and the table provides the information on the number of vessels, fishing possibilities per zone and effort coefficient per zone.
The rules that were approved in recent decades, such as the 1992 norm to make vessel scrapping grants compatible with retaining ownership of the fishing rights, or the law passed in 1997 on transfer of fishing rights have facilitated size adjustment in this fleet, which was oversized for the fishing opportunities provided by the TACs. In the case of the 300 fleet, while TACs tried to prevent the overuse of resources, the changes in the governance system allow the fleet to reduce the existing overcapitalization and its size (Caballero et al., 2014.) In this sense, the number of vessels was reduced since the 1986 “300 fleet” to a fleet whose number of vessels is 103 in 2014.
The result of this historic evolution shows that there are currently fewer vessels but these have higher individual quota and a greater fishing effort every year. It is expected
TABLE 7Spanish Vessel Associations, Number of Vessels and Fishing Rights on Grand Sole grounds in 2014
Spanish Vessel Associations in Grand Sole
Number of vessels in 2014 census
Fishing possibilities per zone Effort Coefficient per zone
Zone VI Zone VII Zone VIII Zone VI Zone VII Zone VIII
ANASOL (Galicia) 37 6.70954 36.72464 10.10146 34.58509 49.76565 17.1731
ARPESCO (Galicia) 6 1.22524 6.44383 2.47806 7.18484 10.08947 4.70189
CELEIRO (Galicia) 30 5.50727 18.17568 9.49032 32.68728 27.74666 16.79949
OPACAN (Basque Country) 2 0.08966 0 1.36108 0.45389 0 2.09144
NORPESC (Basque Country) 1 0.00035 0.00045 0.51927 0.00002 0 1.06188
OPECA (Cantabria) 2 0.2766 0.19677 4.22547 1.05526 0.19933 6.55271
OPPAO (Basque Country) 23 3.76206 7.69361 28.60431 21.8774 11.41785 51.15737
OPP-LUGO (Galicia) 2 0.43006 0.6894 0.32315 2.15624 0.78105 0.46213
TOTAL 103 18.00078 69.92438 57.10312 100 100 100
Source: Own elaboration based on Official State Gazette (BOE) in February 8, 2014.
131From effort control to an ITQ system in the Grand Sole fishing grounds
that the number of vessels fishing on the Grand Sole fishing grounds will reach 100; however, the catch volumes of each one of these vessels will be notably higher than the catches of each one of the 300 vessels that fished in 1986.
PERSPECTIVESA traditional debate in Fisheries Economics has been focused on the possibilities of governance structures to adequately manage the fisheries common resources. Understanding the advantages and disadvantages of effort control or ITQs requires the analysis of many case-studies around the world. The case of the Spanish fleet on the Grand Sole fishing grounds throws light on the institutional evolution of governance from a system that was based on fishing effort rights to a model that was based on ITQs. The ITQ system has been used in the Spanish fleet on the Grand Sole fishing grounds since 2007 and the ITQs were managed in most cases by the Vessel Associations that incorporate the owners of the vessels with fishing rights. The current system determines the ITQ of each vessel in base to its historical effort rights, but the quotas are the main reference instrument and they are assigned for each vessel and year in the Spanish Official State Gazette. The ITQ system propels the limitation of catch, represents an advance towards efficiency and is more precise in theory, but the previous fishing effort control systems simplified control and management (Caballero et al., 2014).
A relevant issue for the Spanish fleet on Grand Sole is the prohibition of discards that the Council of EU Fisheries Ministers agreed to apply. The way is the elimination of discards and the obligation to land all fish caught, although it can mean that quotas allocated would be used up rapidly.
Returning unwanted or unauthorized catches to the sea constitutes a problem with many faces. On the one hand, very few of the discarded animals can survive (exceptions have to do with the type of species and the type of gear used), whereby the biodiversity, the biomass of certain species and their possibilities for reproduction decrease, while returning this organic material (non-living) to the sea can alter the ecosystem (FAO, 2010; European Commission, several years). On the other hand, a significant volume of discards indicates the limited effectiveness of the technologies used (low selectivity) and problems of economic efficiency (both due to direct results, such as the medium and long-term impacts).
The European Commission has already tried to handle this situation, firstly, with technical and operational measures (European Commission, 2007), and recently, through a more comprehensive and plural approach, integrating the problem within the Reform of the Common Fisheries Policy (Green Paper and final documentation). Finally, the new European regulations contain the banning of discards, following a specific calendar (European Commission, 2011b, art. 15), that will last from 2015 to 2019; applied gradually, but already demanding a 93 percent compulsory landing rate for 2015.
Discard ban is a central issue for the future of the management of the 300 fleet in Grand Sole, and it is important to study how this prohibition will affect the fleet’s catches (species and quantities), as well as to consider the reaction of the fishers affected (for example, what is their level of conformity and what their strategies will be in this context).
In 2011 the European Commission considered that discards in this area (especially with regards to trawling) is medium-high. In fact, it estimates that it falls between 15 percent and 39 percent, and may in some cases exceed 40 percent of the catch. In the case of the Spanish fleet, discards may be particularly significant because it does not have a quota allocated for species that can enter nets naturally in these fisheries, such as cod, sole, haddock, saithe, whiting, roundnose grenadier, plaice and oreo. Skate
132 Effort rights in fisheries management – General principles and case studies from around the world
(Spain has a small quota) and pelagic species such as blue whiting, horse mackerel and mackerel can also constitute by-catches of this fleet.
With regards to the stance of fishers they concur that there is a general need to regulate the problem and to try to eliminate discards, but there are two main lines of disagreement with the policy announced by Brussels:
• Fishers believe that the process must adjust to the socio-economic circumstances, that is, that political decisions should be sensitive to the economic situation of the sector. To achieve this, they demand sensitivity towards the destruction of existing employment in the recessive phase of the economic cycle and towards the commercial fishing activity trend, and also that more specific dependence factors by certain areas regarding the fishing activity (this dependence is significant in Spanish regions such as Galicia or the Basque Country, where the Grand Sole vessels are located) be taken into account (Caballero et al., 2008).
• The Spanish Grand Sole fleet believes that the sacrifice involved in the process of adapting to the new situation is not equally distributed between the companies from the different States. It considers that the distribution of quotas by species for Spain is very unbalanced and, most important, the Spanish fleet is not allowed to fish many of the species associated to discards, because it has no quotas for many of them. Now, the discards “that can no longer be carried out” will be accounted for in the quotas for the main species, and consequently they will have to operate with less flexibility.
Regarding the ITQ system, the rigidness of the relative stability principle in the EU hinders the possibility of an ITQ system that allows quota exchanges between companies in the different EU member states. In this sense, the community restrictions to the fishing activity for the movements of fishing rights between companies from different States (even if they belong to the EU) prevent the use of the exchange procedure that it is essential for economic efficiency. Other more specific measures proposed by the Spanish sector (ARVI, 2013) have an impact on the use of specific accounting mechanisms to compensate these imbalances (following the compensatory philosophy of the “British check”).
Prohibiting discards will generate inefficiencies and cause difficulties for the Spanish fleet at Gran Sol, especially as it does not have a quota for all the species existing at that fishery and that fall incidentally into its nets. The ITQ system is what causes this problem. However, a pure system of control of the fishing effort would make it easier to put the prohibition of discards into practice, because the control would be more focused on inputs than on outputs, and each vessel could fish the different species without the need or obligation of returning any species to the sea.
REFERENCESARVI, CLUPESCA. 2013. El reparto de los sacrificios de las flotas comunitarias ante
la prohibición de los descartes. Vigo, Spain. (also available at http://www.arvi.org/publicaciones/reformaPPC/doc14.pdf).
Caballero, G., Garza, M. D. & M. M. Varela. 2008. Institutions and Management of Fishing Resources: The governance of the Galician model. Ocean & Coastal Management, 51(8-9): 625-631.
Caballero, G., Varela M.M. & Garza M. D. 2014. Institutional Change, Fishing Rights and Governance Mechanisms: The Dynamics of the Spanish 300 Fleet on the Grand Sole Fishing Grounds. Marine Policy, 44: 465-472.
Domínguez M., Freijeiro A. & Iglesias, C. 2004. Co-management proposals and their efficiency in fisheries management: The case of the Grand Sole fleet. Marine Policy, 28: 213-219.
133From effort control to an ITQ system in the Grand Sole fishing grounds
European Commission. 2002. Comunicación de la Comisión al Consejo y al Parlamento Europeo, COM (2002) 656 final, relativa a un Plan de acción comunitario para reducir los descartes. 26.11.2002.
European Commission. 2007. Comunicación de la Comisión al Consejo y al Parlamento Europeo, COM (2007) 136 final. Una política para reducir las capturas accesorias y eliminar los descartes. 28.03.2007.
European Commission. 2011a. Studies in the Field of the Common Fisheries Policy and Maritime Affairs Lot 4: Impact Assessment Studies related to CFP. Impact Assessment of Discard Reducing Policy. Draft Final Report. June 2011.
European Commission. 2011b. Propuesta de Reglamento del Parlamento y del Consejo sobre la Política Pesquera Común, COM (2011) 425 final, 13.07.2011.
FAO. 2010. Technical consultation to develop international guidelines on bycatch management and reduction of discards. FAO Fisheries and Aquaculture Report No. 957. Rome, FAO. (also available at http://www.fao.org/cofi/24783-010c9c0c7cae3b0bb7f6b70baec897306.pdf).
Freijeiro, A. B. 2004. Gran Sol, el caladero de las restricciones. Europa Azul, 84: 40-42.Garza M. D. & Varela, M. M. 2008. The self-governance in the Celtic Sea Spanish fishery.
In R. Shotton, & H. Uchida, eds. Case studies in fisheries self-governance, pp. 67-75. FAO Fisheries Technical Paper No. 504. Rome, FAO. 451 pp. (also available at http://www.fao.org/docrep/010/a1497e/a1497e00.htm).
González-Laxe F. 2006. Transferability of fishing rights: The Spanish case. Marine Policy, 30: 379-388.
Iriondo A., Aranda, M. & Santurtún, M. 2013. El reparto de las cuotas individuales de pesca por buque de la flota de altura española en aguas del Nordeste Atlántico. Revista de Investigación Marina, 20(2): 24-28.
Jentoft, S. 2004. Institutions in fisheries: what they are, what they do, and how they change? Marine Policy, 28: 137-149.
Prellezo R. 2010. La evolución de la flota de altura al fresco en el contexto del marco legislativo español. Revista de Investigación Marina, 17(3): 22-27.
Varela Lafuente, M., eds. 2003. La pesca gallega en el escenario internacional. Santiago de Compostela, Fundación Caixa Galicia.

135
Hawaii pelagic longline fishery and sea turtle bycatch – the use of set certificates as an allocation solution
Raymond Clarke, NOAA Fisheries Service, Pacific Islands Regional Office, International Fisheries DivisionE-mail: [email protected]
Paul Dalzell, Western Pacific Fishery Management CouncilE-mail: [email protected]
Walter Ikehara, NOAA Fisheries Service, Pacific Islands Regional Office, Sustainable Fisheries DivisionE-mail: [email protected]
ABSTRACT We present a case history of a fishing effort allocation system for a sub-tropical pelagic longline fishery that ran from 2004 until 2009. The effort limitation and allocation system stemmed from litigation, which closed the Hawaii shallow-set longline fishery from 2001 until 2004. When the fishery reopened in 2004, total allowable effort in the shallow-set portion of the fishery, which targeted swordfish, was set at 2 120 longline sets, half the annual average set total for the fishery from 1994 through 1999. We describe how these sets were allocated and transferred under a set certificate programme, how this programme was administered and how the Hawaii longline fishers adapted to this management regime until the set certificate programme was abolished in 2010.
INTRODUCTIONThis paper describes the management of the Hawaii shallow-set longline swordfish fishery between calendar 2004 and 2009 and its associated set certificate programme over this five-year period.
The revival of the Hawaii longline fishery in the late 1980s, on a previously untargeted swordfish resource, led to the advent of a National Marine Fisheries Service (NMFS) observer programme1. Observers were first deployed voluntarily and then required under the Pelagic Fisheries Management Plan (PFMP) developed by the Western Pacific Regional Fishery Management Council (Council) under the Magnuson-Stevens Conservation and Management Act, with regular observations beginning in 1994 (reference). Early observations under the observer programme revealed that shallow-set longline fishing was prone to catching sea turtles, particularly loggerhead and leatherback turtles.
1 The observer requirement came into being for monitoring the Protected Species Zone (PSZ) around the North Western Hawaiian Islands in May 1991 (Amendment 2 to the Fishery Management Plan). In October 1991, implementation of Amendment 3 extended the observer requirement to vessels fishing outside the PSZ.
136 Effort rights in fisheries management – General principles and case studies from around the world
In the early 1980s all species of turtles that interact with pelagic longline fishing in the vicinity of the Hawaiian Islands were listed under the United States Endangered Species Act. Currently the leatherback, loggerhead, and olive ridley are listed as “endangered” while the green turtle is listed as “threatened” (see http://www.nmfs.noaa.gov/pr/species/turtles/ for the current status of these species of turtles)2 The documentation of loggerhead, leatherback and green sea turtle interactions in the Hawaii shallow-set longline fishery meant that NMFS was required to address this problem. Initial estimates suggested that up to 1 000 turtles were being caught annually by the Hawaii longline fisheries, mostly by vessels in the swordfish-targeting shallow-set fishery. Balazs and Pooley (1993) and Balazs et al. (1995) reviewed ways to reduce the post-release mortality of turtles hooked in the longline fishery, in both the shallow-set and deep-set fisheries.
Also in the early 1990s, NMFS3 prepared biological opinions (BiOps) under Section 7 of the Endangered Species Act (ESA) to assess the risk posed to sea turtles by longline fishing. BiOps analyse the impacts of federal actions (such as proposed changes to fishery regulations) or new information regarding species listed as endangered or threatened under the ESA. The objective of a BiOp is to determine whether the federal action is likely to result in “no jeopardy” or “jeopardy” to the subject ESA-listed species”4.
These initial BiOps, prepared in 1991, 1993 and 1998 returned “no jeopardy” findings for the Hawaii longline fishery. The earliest BiOps simply estimated the likely number of interactions by the Hawaii fishery and assessed this against what was then known about the population biology of loggerhead, leatherback and green sea turtles5.The 1993 BiOp also required all operators of Hawaii-based longline vessels to carry federal observers when directed to do so by NMFS, and the PFMP was amended accordingly. This requirement became effective in April 1994. The 1998 BiOp was the first to adopt a quantitative approach to assessing population impacts to turtles using a simulation model, TURTSIM, but still returned a no-jeopardy finding. Following litigation in 1999, NMFS adopted a much more conservative approach in preparing BiOps, in essence bundling in the longline fishery interactions with the impacts of all threats to sea turtles, rather than assessing the interactions in isolation. The 2001 BiOp for the Hawaii longline fishery found that the fishery jeopardized the long-term existence of loggerhead, leatherback and green turtles, but not olive ridley turtles.
2 Another species the hawksbill is seldom seen in the fishery and it is currently listed as endangered.3 NMFS was the consulting agency (not action agency- or U.S. Fish and Wildlife Agency) in the case
of marine turtles.4 A jeopardy determination means that the action (or fishery) being analysed is likely to jeopardize
the continued existence and recovery of one or more listed species. In either case the issuing agency may include “terms and conditions” and/or “reasonable and prudent alternatives” (or “measures”) that will reduce the impact of the action (or fishery) on listed species. BiOps also include “incidental take statements” which authorize the fishery to have a specific number of protected species interactions without being prosecuted under the ESA. Incidental take statements are sometimes known as “anticipated take statements,” as they are the issuing agency’s best estimate of the number of interactions anticipated to occur each year under the requirements of the BiOp. If the take limit in the incidental take statement is exceeded, the issuing agency may choose to re-examine the action or fishery (as well as any governing terms and conditions or reasonable and prudent alternatives) to understand why actual interactions were higher than anticipated. If the interactions are found to be due to positive natural population variations, no management changes may be needed; however if they are found to be due to management measures not working as expected, changes may be required. An incidental take statement does not represent a jeopardy “threshold” and should not be regarded as such. Rather it is the issuing agency’s estimate of the number of interactions that are anticipated to occur under the BiOp’s requirements.
5 BiOps also considered hawksbill turtles, which nest in small numbers in Hawaii. No interactions have been reported since observers were first deployed on Hawaii longline vessels, and were deliberately omitted from the 2012 BiOp (NMFS, 2012).
137Hawaii pelagic longline fishery and sea turtle bycatch – the use of set certificates as an allocation solution
The reasonable and prudent measures for the fishery included a complete cessation of swordfish fishing, which remained closed from April 2001 to April 2004.
Litigation initiated by the Hawaii longline Association (HLA), a group representing almost all of the Hawaii-based longline vessel owners and operators, succeeded in reopening the swordfish shallow-set longline fishery in 2004. This reopening was achieved by requiring the use of large (18/0) circle hook and mackerel-type bait combination found to be effective in swordfish longline fishing in the Atlantic and Gulf of Mexico in reducing sea turtle interactions. In addition, the swordfish fishery was required to have 100 percent observer coverage and a yearly limit of 2 120 sets, (which was half the annual average set total for the fishery from 1994 to 1999). This level of effort was projected to result in 16 leatherback and 17 loggerhead interactions per year, on average, levels which a 2004 BiOp concluded were less than the jeopardy threshold. The BiOp also estimated that this level of effort would be expected to result in one green sea turtle and five olive ridley interactions per year, on average.
These interaction numbers were used to set the incidental or allowed takes per turtle species in the 2004 BiOp. The Council and NMFS amended the PFMP (Regulatory Amendment 3) to implement the gear modifications and set limit, as well as to establish limits on the number of leatherback (16) and loggerhead (17) turtles that may be interacted with in the swordfish fishery. Reaching either one of these “hard” limits would result in the swordfish fishery being closed for the remainder of the calendar year. The FMP amendment also established the set certificate programme risk to allocate the 2 120 longline sets for the shallow-set fishery. In 2009, after four full years of implementation of the set allocation programme, the Council drafted Amendment 18, which, among other things, modified the hard limits for loggerhead and leatherback sea turtles and removed the set limit for the fishery. Set certificates were issued in December 2009 for the 2010 calendar year, but were voided as the provisions of Amendment 18 came into effect in mid-January 2010.
Now after describing the legal and administrative events that led to the closure of the Hawaii-based swordfish fishery and its subsequent revival, the balance of this paper describes the management of the Hawaii shallow-set longline swordfish fishery between 2004 and 2009 and the set certificate programme over this five-year period. First we describe the Hawaii-based longline fishery in some detail to give the reader a full understanding of the unique management action and subsequent allocations made to ensure the fishery continued in a sustainable manner in light of the concern over by-catch in the fishery.
DESCRIPTION OF HAWAII LONGLINE FLEETS (SHALLOW AND DEEP SET)The Hawaii-based deep-set longline fishery typically operates around the main Hawaiian Islands in pelagic waters beyond 75 nm from shore in the United States Exclusive Economic Zone (EEZ) and on the high seas6. The deep-set fishery operates between 140° W and 180°W longitude and from the Equator to 35°N latitude (Figure 3).
Longline fishing employs a mainline that is deployed as the fishing vessel moves across the water. The mainline is suspended horizontally below the surface between evenly spaced floats that are clipped along the mainline. Branch lines that terminate with baited fishhooks are clipped to and suspended below the mainline when the gear is at depth. Longline deployment is typically referred to as “setting,” and the gear, once it is deployed, is typically referred to as a “set.” Longline sets are normally left drifting to “soak” for several hours before they are retrieved back aboard along with any catch.
6 The boundaries of a large-vessel closed area around the Hawaiian Islands vary in distance from shore from 25 to 75 nm depending on the location and time of year. Longline fishing in this closed area is prohibited, with limited exceptions (50 CFR 665.806).
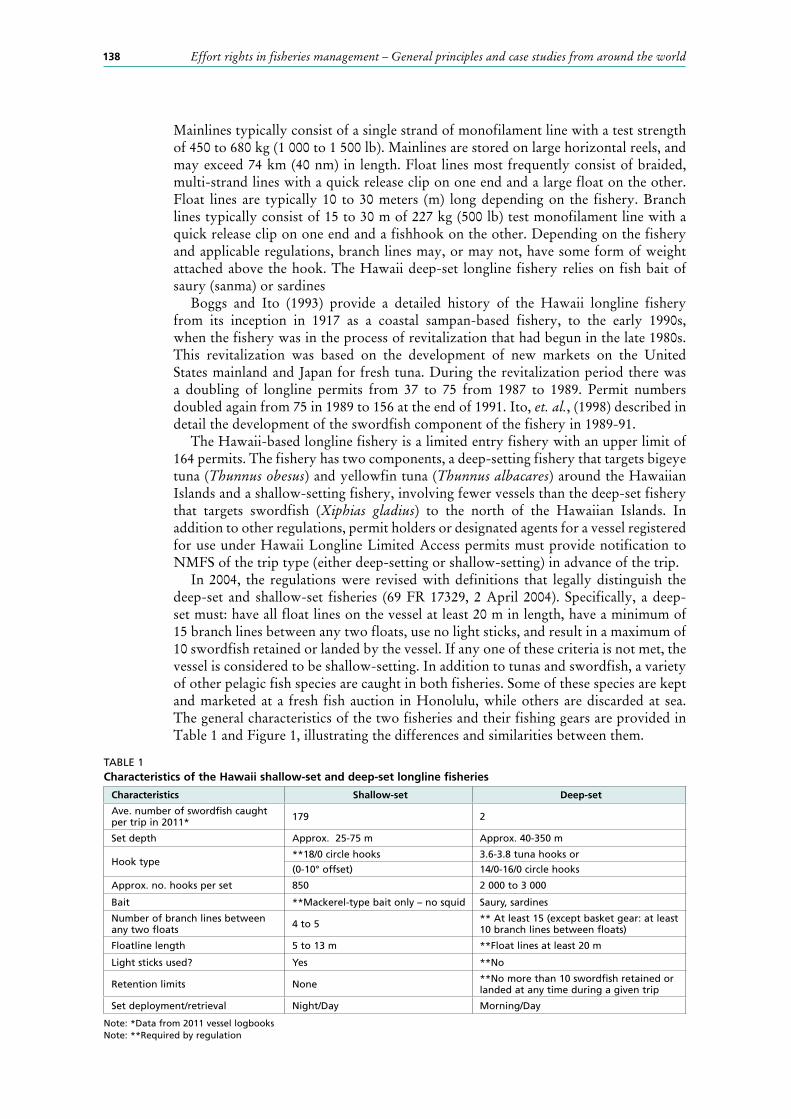
138 Effort rights in fisheries management – General principles and case studies from around the world
Mainlines typically consist of a single strand of monofilament line with a test strength of 450 to 680 kg (1 000 to 1 500 lb). Mainlines are stored on large horizontal reels, and may exceed 74 km (40 nm) in length. Float lines most frequently consist of braided, multi-strand lines with a quick release clip on one end and a large float on the other. Float lines are typically 10 to 30 meters (m) long depending on the fishery. Branch lines typically consist of 15 to 30 m of 227 kg (500 lb) test monofilament line with a quick release clip on one end and a fishhook on the other. Depending on the fishery and applicable regulations, branch lines may, or may not, have some form of weight attached above the hook. The Hawaii deep-set longline fishery relies on fish bait of saury (sanma) or sardines
Boggs and Ito (1993) provide a detailed history of the Hawaii longline fishery from its inception in 1917 as a coastal sampan-based fishery, to the early 1990s, when the fishery was in the process of revitalization that had begun in the late 1980s. This revitalization was based on the development of new markets on the United States mainland and Japan for fresh tuna. During the revitalization period there was a doubling of longline permits from 37 to 75 from 1987 to 1989. Permit numbers doubled again from 75 in 1989 to 156 at the end of 1991. Ito, et. al., (1998) described in detail the development of the swordfish component of the fishery in 1989-91.
The Hawaii-based longline fishery is a limited entry fishery with an upper limit of 164 permits. The fishery has two components, a deep-setting fishery that targets bigeye tuna (Thunnus obesus) and yellowfin tuna (Thunnus albacares) around the Hawaiian Islands and a shallow-setting fishery, involving fewer vessels than the deep-set fishery that targets swordfish (Xiphias gladius) to the north of the Hawaiian Islands. In addition to other regulations, permit holders or designated agents for a vessel registered for use under Hawaii Longline Limited Access permits must provide notification to NMFS of the trip type (either deep-setting or shallow-setting) in advance of the trip.
In 2004, the regulations were revised with definitions that legally distinguish the deep-set and shallow-set fisheries (69 FR 17329, 2 April 2004). Specifically, a deep-set must: have all float lines on the vessel at least 20 m in length, have a minimum of 15 branch lines between any two floats, use no light sticks, and result in a maximum of 10 swordfish retained or landed by the vessel. If any one of these criteria is not met, the vessel is considered to be shallow-setting. In addition to tunas and swordfish, a variety of other pelagic fish species are caught in both fisheries. Some of these species are kept and marketed at a fresh fish auction in Honolulu, while others are discarded at sea. The general characteristics of the two fisheries and their fishing gears are provided in Table 1 and Figure 1, illustrating the differences and similarities between them.
TABLE 1Characteristics of the Hawaii shallow-set and deep-set longline fisheries
Characteristics Shallow-set Deep-set
Ave. number of swordfish caught per trip in 2011* 179 2
Set depth Approx. 25-75 m Approx. 40-350 m
Hook type**18/0 circle hooks 3.6-3.8 tuna hooks or
(0-10° offset) 14/0-16/0 circle hooks
Approx. no. hooks per set 850 2 000 to 3 000
Bait **Mackerel-type bait only – no squid Saury, sardines
Number of branch lines between any two floats 4 to 5 ** At least 15 (except basket gear: at least
10 branch lines between floats)
Floatline length 5 to 13 m **Float lines at least 20 m
Light sticks used? Yes **No
Retention limits None **No more than 10 swordfish retained or landed at any time during a given trip
Set deployment/retrieval Night/Day Morning/Day
Note: *Data from 2011 vessel logbooksNote: **Required by regulation
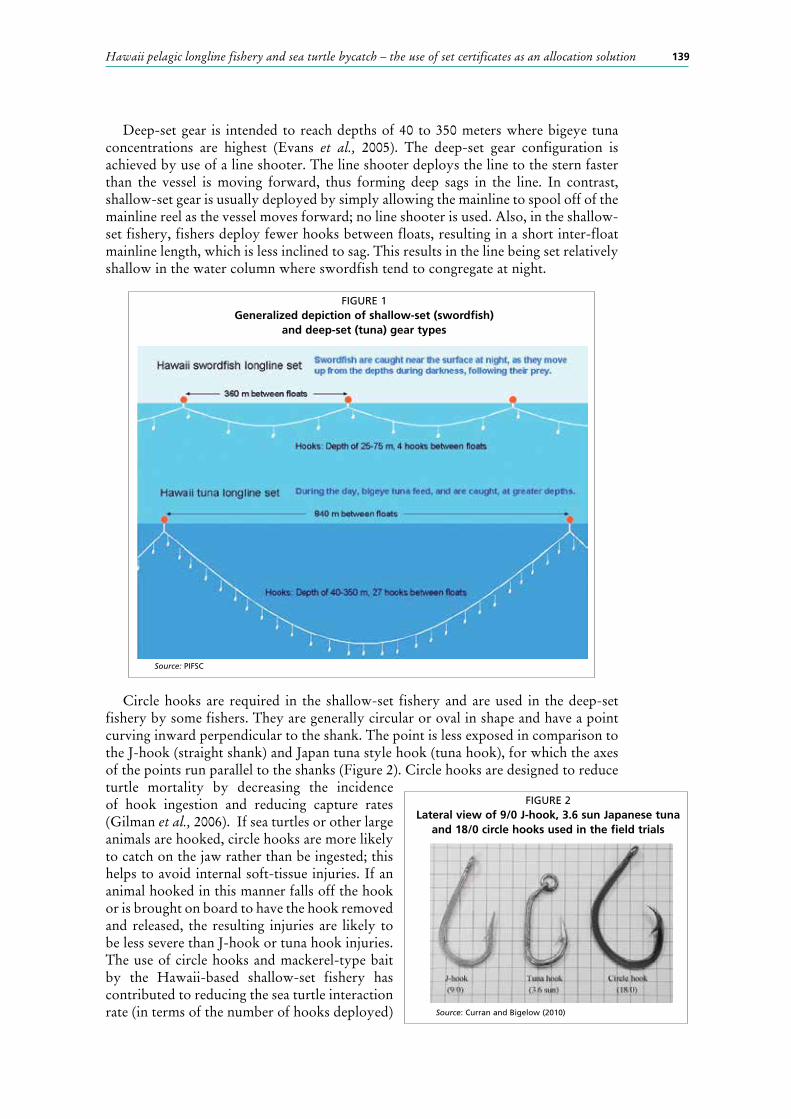
139Hawaii pelagic longline fishery and sea turtle bycatch – the use of set certificates as an allocation solution
Deep-set gear is intended to reach depths of 40 to 350 meters where bigeye tuna concentrations are highest (Evans et al., 2005). The deep-set gear configuration is achieved by use of a line shooter. The line shooter deploys the line to the stern faster than the vessel is moving forward, thus forming deep sags in the line. In contrast, shallow-set gear is usually deployed by simply allowing the mainline to spool off of the mainline reel as the vessel moves forward; no line shooter is used. Also, in the shallow-set fishery, fishers deploy fewer hooks between floats, resulting in a short inter-float mainline length, which is less inclined to sag. This results in the line being set relatively shallow in the water column where swordfish tend to congregate at night.
Circle hooks are required in the shallow-set fishery and are used in the deep-set fishery by some fishers. They are generally circular or oval in shape and have a point curving inward perpendicular to the shank. The point is less exposed in comparison to the J-hook (straight shank) and Japan tuna style hook (tuna hook), for which the axes of the points run parallel to the shanks (Figure 2). Circle hooks are designed to reduce turtle mortality by decreasing the incidence of hook ingestion and reducing capture rates (Gilman et al., 2006). If sea turtles or other large animals are hooked, circle hooks are more likely to catch on the jaw rather than be ingested; this helps to avoid internal soft-tissue injuries. If an animal hooked in this manner falls off the hook or is brought on board to have the hook removed and released, the resulting injuries are likely to be less severe than J-hook or tuna hook injuries. The use of circle hooks and mackerel-type bait by the Hawaii-based shallow-set fishery has contributed to reducing the sea turtle interaction rate (in terms of the number of hooks deployed)
FIGURE 2Lateral view of 9/0 J-hook, 3.6 sun Japanese tuna
and 18/0 circle hooks used in the field trials
Source: Curran and Bigelow (2010)
FIGURE 1Generalized depiction of shallow-set (swordfish)
and deep-set (tuna) gear types
Source: PIFSC
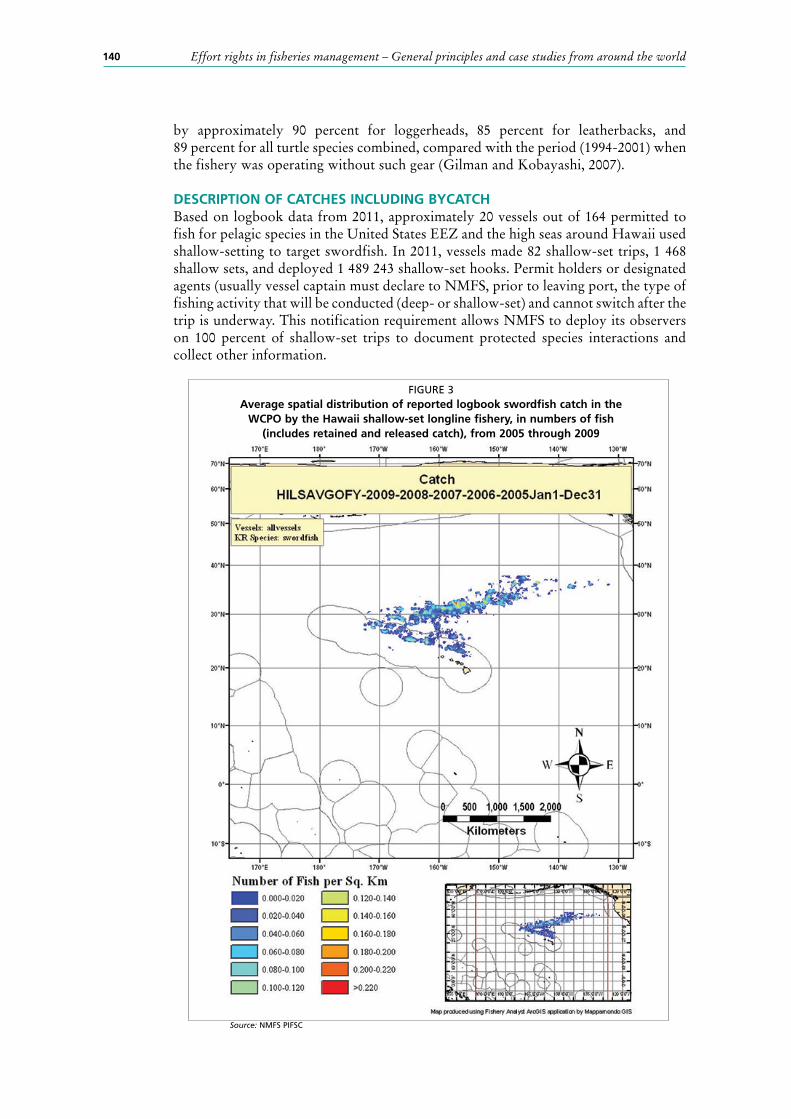
140 Effort rights in fisheries management – General principles and case studies from around the world
by approximately 90 percent for loggerheads, 85 percent for leatherbacks, and 89 percent for all turtle species combined, compared with the period (1994-2001) when the fishery was operating without such gear (Gilman and Kobayashi, 2007).
DESCRIPTION OF CATCHES INCLUDING BYCATCHBased on logbook data from 2011, approximately 20 vessels out of 164 permitted to fish for pelagic species in the United States EEZ and the high seas around Hawaii used shallow-setting to target swordfish. In 2011, vessels made 82 shallow-set trips, 1 468 shallow sets, and deployed 1 489 243 shallow-set hooks. Permit holders or designated agents (usually vessel captain must declare to NMFS, prior to leaving port, the type of fishing activity that will be conducted (deep- or shallow-set) and cannot switch after the trip is underway. This notification requirement allows NMFS to deploy its observers on 100 percent of shallow-set trips to document protected species interactions and collect other information.
FIGURE 3Average spatial distribution of reported logbook swordfish catch in the
WCPO by the Hawaii shallow-set longline fishery, in numbers of fish (includes retained and released catch), from 2005 through 2009
Source: NMFS PIFSC
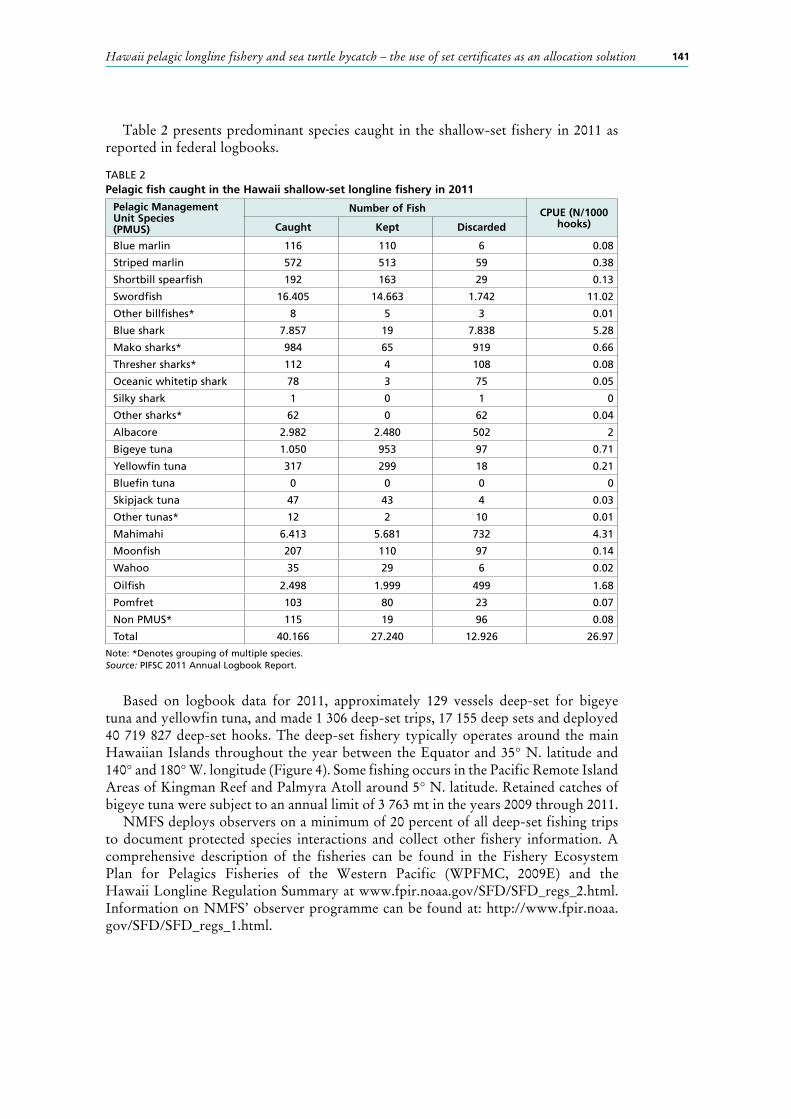
141Hawaii pelagic longline fishery and sea turtle bycatch – the use of set certificates as an allocation solution
Table 2 presents predominant species caught in the shallow-set fishery in 2011 as reported in federal logbooks.
TABLE 2Pelagic fish caught in the Hawaii shallow-set longline fishery in 2011
Pelagic Management Unit Species (PMUS)
Number of Fish CPUE (N/1000 hooks)Caught Kept Discarded
Blue marlin 116 110 6 0.08
Striped marlin 572 513 59 0.38
Shortbill spearfish 192 163 29 0.13
Swordfish 16.405 14.663 1.742 11.02
Other billfishes* 8 5 3 0.01
Blue shark 7.857 19 7.838 5.28
Mako sharks* 984 65 919 0.66
Thresher sharks* 112 4 108 0.08
Oceanic whitetip shark 78 3 75 0.05
Silky shark 1 0 1 0
Other sharks* 62 0 62 0.04
Albacore 2.982 2.480 502 2
Bigeye tuna 1.050 953 97 0.71
Yellowfin tuna 317 299 18 0.21
Bluefin tuna 0 0 0 0
Skipjack tuna 47 43 4 0.03
Other tunas* 12 2 10 0.01
Mahimahi 6.413 5.681 732 4.31
Moonfish 207 110 97 0.14
Wahoo 35 29 6 0.02
Oilfish 2.498 1.999 499 1.68
Pomfret 103 80 23 0.07
Non PMUS* 115 19 96 0.08
Total 40.166 27.240 12.926 26.97
Note: *Denotes grouping of multiple species.Source: PIFSC 2011 Annual Logbook Report.
Based on logbook data for 2011, approximately 129 vessels deep-set for bigeye tuna and yellowfin tuna, and made 1 306 deep-set trips, 17 155 deep sets and deployed 40 719 827 deep-set hooks. The deep-set fishery typically operates around the main Hawaiian Islands throughout the year between the Equator and 35° N. latitude and 140° and 180° W. longitude (Figure 4). Some fishing occurs in the Pacific Remote Island Areas of Kingman Reef and Palmyra Atoll around 5° N. latitude. Retained catches of bigeye tuna were subject to an annual limit of 3 763 mt in the years 2009 through 2011.
NMFS deploys observers on a minimum of 20 percent of all deep-set fishing trips to document protected species interactions and collect other fishery information. A comprehensive description of the fisheries can be found in the Fishery Ecosystem Plan for Pelagics Fisheries of the Western Pacific (WPFMC, 2009E) and the Hawaii Longline Regulation Summary at www.fpir.noaa.gov/SFD/SFD_regs_2.html. Information on NMFS’ observer programme can be found at: http://www.fpir.noaa.gov/SFD/SFD_regs_1.html.
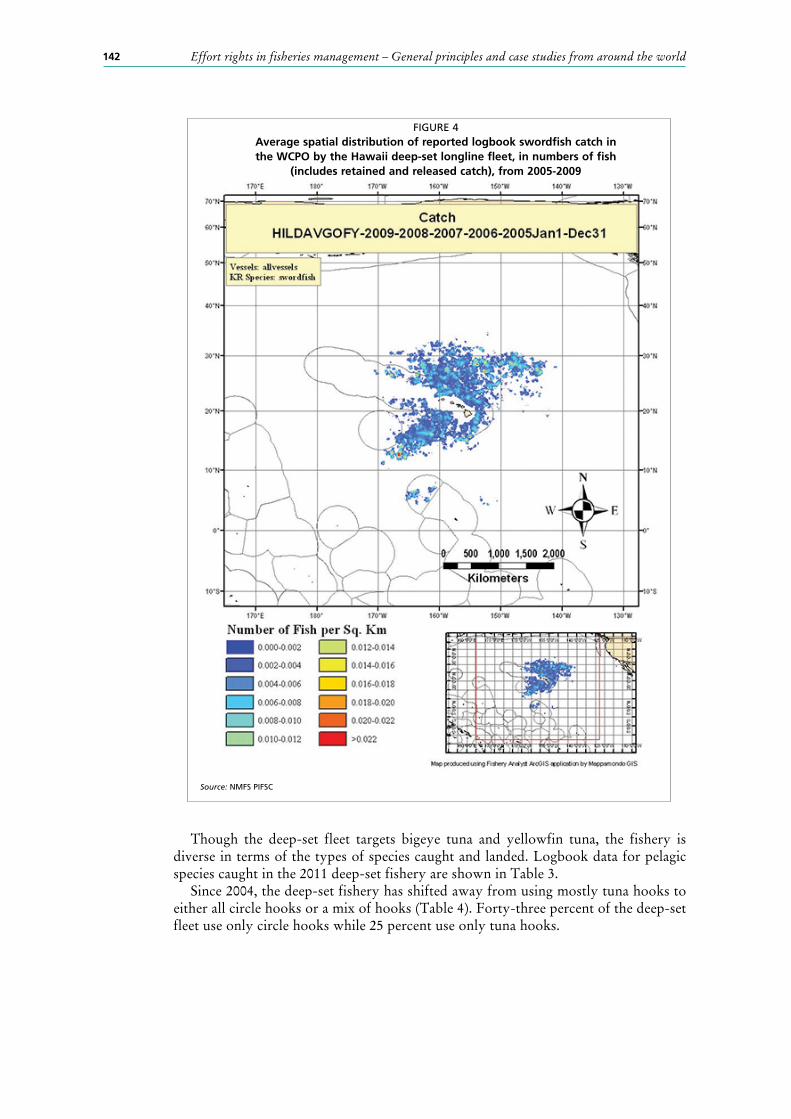
142 Effort rights in fisheries management – General principles and case studies from around the world
Though the deep-set fleet targets bigeye tuna and yellowfin tuna, the fishery is diverse in terms of the types of species caught and landed. Logbook data for pelagic species caught in the 2011 deep-set fishery are shown in Table 3.
Since 2004, the deep-set fishery has shifted away from using mostly tuna hooks to either all circle hooks or a mix of hooks (Table 4). Forty-three percent of the deep-set fleet use only circle hooks while 25 percent use only tuna hooks.
FIGURE 4Average spatial distribution of reported logbook swordfish catch in the WCPO by the Hawaii deep-set longline fleet, in numbers of fish
(includes retained and released catch), from 2005-2009
Source: NMFS PIFSC

143Hawaii pelagic longline fishery and sea turtle bycatch – the use of set certificates as an allocation solution
HISTORY OF TURTLE INTERACTIONSGilman and Kobayashi (2007) analysed NMFS’ observer information (2004-2007) from the Hawaii shallow-set fishery and found significant reductions in sea turtle interaction rates compared with the pre-2001 period, as well as reductions in the more severe types of incidental hookings (i.e., lightly hooked vs. deeply hooked—those in the mouth or swallowed) observed. The combined longline gear types (deep and shallow) sea turtle interaction rates have declined by 89 percent (Figure 5). Deep hooking rates (thought to result in higher sea turtle mortality rates than light hookings) have also declined approximately 15 percent of all loggerhead interactions and almost zero percent of leatherback interactions. Prior to the required use of circle hooks and mackerel-type bait, 51 percent of sea turtle interactions in the fishery were estimated to have involved deeply hooked turtles (Table 3). This rate was equal to, and in some cases exceeded,
TABLE 3Pelagic fishes caught in the 2011 Hawaii deep-set longline fishery
Pelagic Management Unit Species (PMUS)
Number of Fish CPUE Number Caught per 1000 hooksCaught Kept Discarded
Blue marlin 4.424 4.382 42 0.11
Striped marlin 16.181 15.982 199 0.4
Shortbill spearfish 15.531 15.354 177 0.38
Swordfish 2.906 2.502 404 0.07
Other billfishes 541 534 7 0.01
Blue shark 47.956 339 47.617 1.18
Mako sharks 2.242 711 1.531 0.06
Thresher sharks 4.535 252 4.283 0.11
Oceanic whitetip shark 791 27 764 0.02
Silky shark 232 3 229 0.01
Other sharks 388 18 370 0.01
Albacore 31.445 31.171 274 0.77
Bigeye tuna 155.121 152.457 2.664 3.81
Yellowfin tuna 31.312 30.579 733 0.77
Bluefin tuna 2 2 0 0
Skipjack tuna 25.744 24.953 791 0.63
Other tunas 18 18 0 0
Mahimahi 74.792 73.724 1.068 1.84
Moonfish 17.697 17.633 64 0.43
Wahoo 10.446 10.403 43 0.26
Oilfish 36.182 35.839 343 0.89
Pomfret 33.340 32.810 530 0.82
Non PMUS 4.261 2.531 1.730 0.1
Total 516.087 452.224 63.863 12.67
Source: PIFSC 2011 Annual Logbook Report. Note: Data are reported in numbers of fish.
TABLE 4Annual composition of hooks used in the Hawaii deep-set fishery based on NMFS observer data
YearUse of only
Japanese 3.6 or 3.8 sun tuna hooks
Use of 14/0, 15/0, or 16/0 circle
hook
Mix of circle and tuna
hooks
Use of 18/0 circle or J-hooks
2004 87% 5% 2% 6%
2005 86% 9% 2% 3%
2006 68% 11% 21% 0%
2007 50% 18% 32% 0%
2008 38% 28% 33% 1%
2009 34% 41% 24% 1%
2010 25% 43% 27% 5%
Source: NMFS unpublished data. (See also Figure 2)
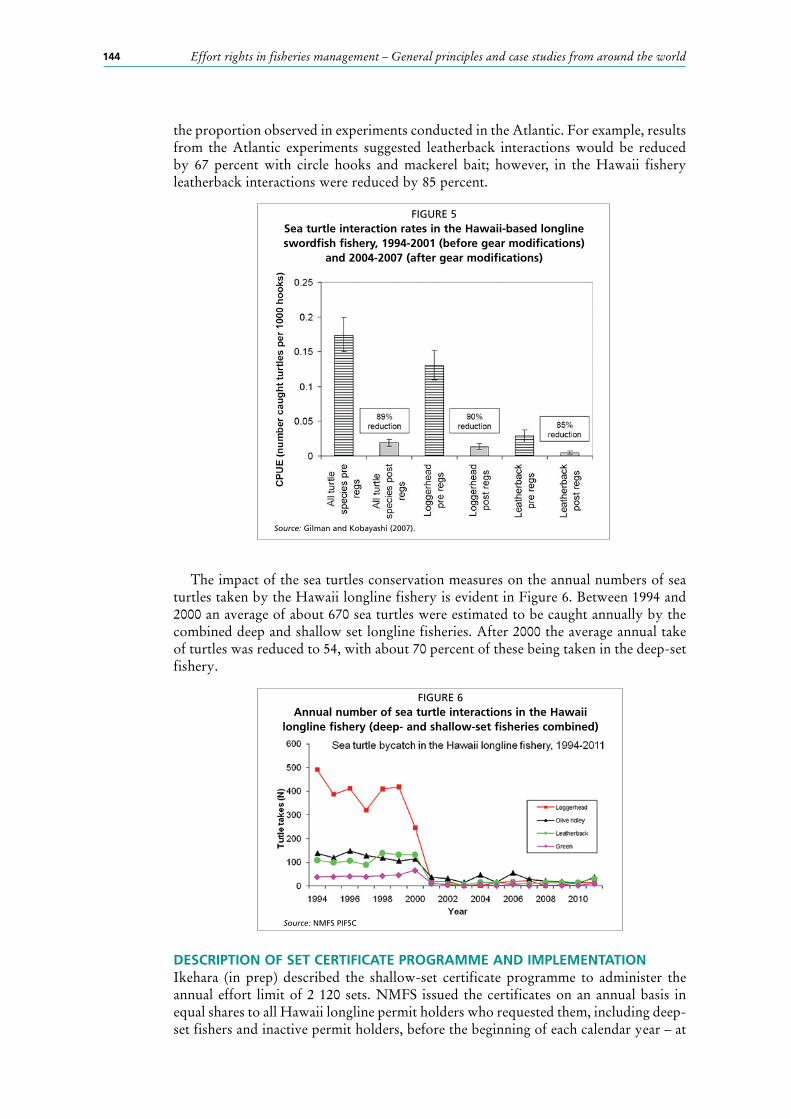
144 Effort rights in fisheries management – General principles and case studies from around the world
the proportion observed in experiments conducted in the Atlantic. For example, results from the Atlantic experiments suggested leatherback interactions would be reduced by 67 percent with circle hooks and mackerel bait; however, in the Hawaii fishery leatherback interactions were reduced by 85 percent.
The impact of the sea turtles conservation measures on the annual numbers of sea turtles taken by the Hawaii longline fishery is evident in Figure 6. Between 1994 and 2000 an average of about 670 sea turtles were estimated to be caught annually by the combined deep and shallow set longline fisheries. After 2000 the average annual take of turtles was reduced to 54, with about 70 percent of these being taken in the deep-set fishery.
DESCRIPTION OF SET CERTIFICATE PROGRAMME AND IMPLEMENTATIONIkehara (in prep) described the shallow-set certificate programme to administer the annual effort limit of 2 120 sets. NMFS issued the certificates on an annual basis in equal shares to all Hawaii longline permit holders who requested them, including deep-set fishers and inactive permit holders, before the beginning of each calendar year – at
FIGURE 5Sea turtle interaction rates in the Hawaii-based longline swordfish fishery, 1994-2001 (before gear modifications)
and 2004-2007 (after gear modifications)
Source: Gilman and Kobayashi (2007).
FIGURE 6Annual number of sea turtle interactions in the Hawaii
longline fishery (deep- and shallow-set fisheries combined)
Source: NMFS PIFSC
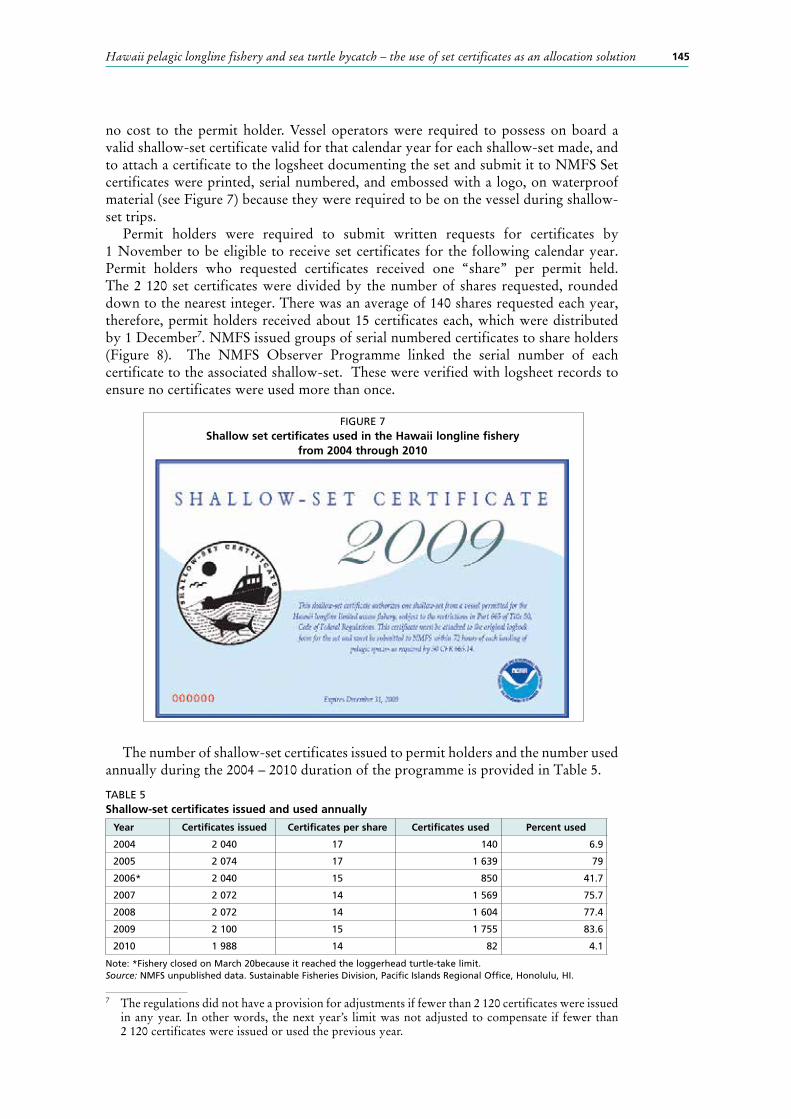
145Hawaii pelagic longline fishery and sea turtle bycatch – the use of set certificates as an allocation solution
no cost to the permit holder. Vessel operators were required to possess on board a valid shallow-set certificate valid for that calendar year for each shallow-set made, and to attach a certificate to the logsheet documenting the set and submit it to NMFS Set certificates were printed, serial numbered, and embossed with a logo, on waterproof material (see Figure 7) because they were required to be on the vessel during shallow-set trips.
Permit holders were required to submit written requests for certificates by 1 November to be eligible to receive set certificates for the following calendar year. Permit holders who requested certificates received one “share” per permit held. The 2 120 set certificates were divided by the number of shares requested, rounded down to the nearest integer. There was an average of 140 shares requested each year, therefore, permit holders received about 15 certificates each, which were distributed by 1 December7. NMFS issued groups of serial numbered certificates to share holders (Figure 8). The NMFS Observer Programme linked the serial number of each certificate to the associated shallow-set. These were verified with logsheet records to ensure no certificates were used more than once.
The number of shallow-set certificates issued to permit holders and the number used annually during the 2004 – 2010 duration of the programme is provided in Table 5.
TABLE 5Shallow-set certificates issued and used annually
Year Certificates issued Certificates per share Certificates used Percent used
2004 2 040 17 140 6.9
2005 2 074 17 1 639 79
2006* 2 040 15 850 41.7
2007 2 072 14 1 569 75.7
2008 2 072 14 1 604 77.4
2009 2 100 15 1 755 83.6
2010 1 988 14 82 4.1
Note: *Fishery closed on March 20because it reached the loggerhead turtle-take limit.Source: NMFS unpublished data. Sustainable Fisheries Division, Pacific Islands Regional Office, Honolulu, HI.
FIGURE 7Shallow set certificates used in the Hawaii longline fishery
from 2004 through 2010
7 The regulations did not have a provision for adjustments if fewer than 2 120 certificates were issued in any year. In other words, the next year’s limit was not adjusted to compensate if fewer than 2 120 certificates were issued or used the previous year.
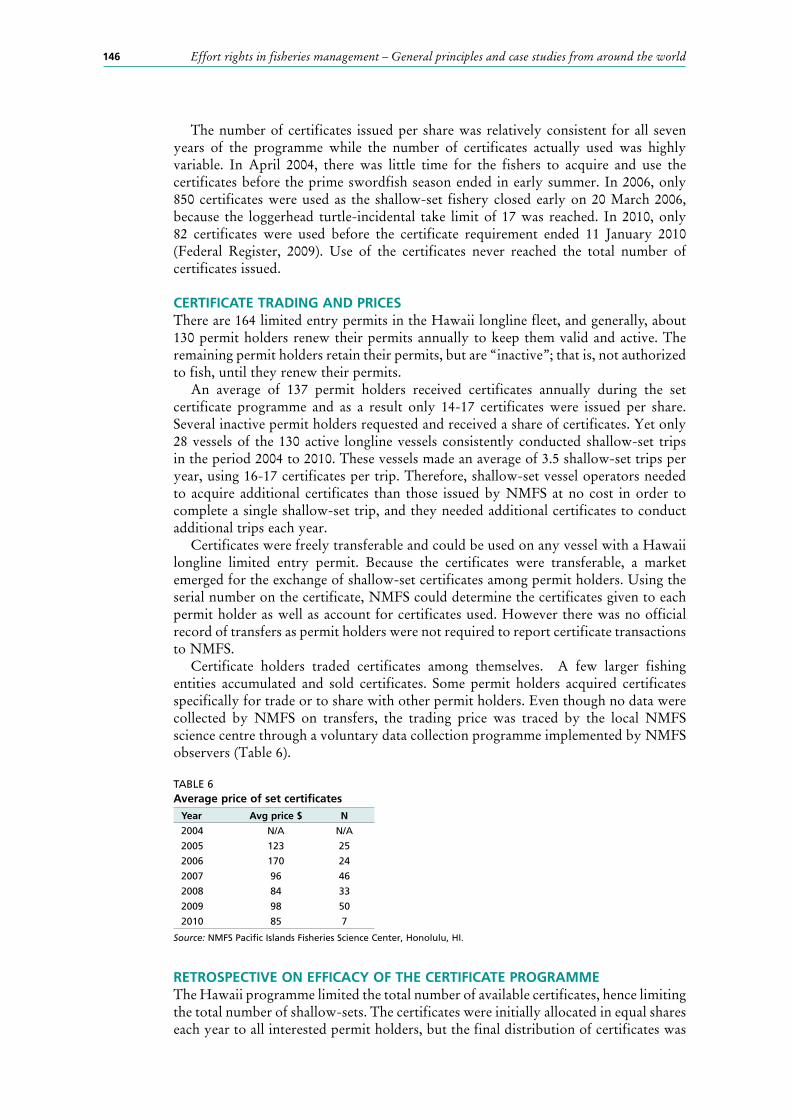
146 Effort rights in fisheries management – General principles and case studies from around the world
The number of certificates issued per share was relatively consistent for all seven years of the programme while the number of certificates actually used was highly variable. In April 2004, there was little time for the fishers to acquire and use the certificates before the prime swordfish season ended in early summer. In 2006, only 850 certificates were used as the shallow-set fishery closed early on 20 March 2006, because the loggerhead turtle-incidental take limit of 17 was reached. In 2010, only 82 certificates were used before the certificate requirement ended 11 January 2010 (Federal Register, 2009). Use of the certificates never reached the total number of certificates issued.
CERTIFICATE TRADING AND PRICESThere are 164 limited entry permits in the Hawaii longline fleet, and generally, about 130 permit holders renew their permits annually to keep them valid and active. The remaining permit holders retain their permits, but are “inactive”; that is, not authorized to fish, until they renew their permits.
An average of 137 permit holders received certificates annually during the set certificate programme and as a result only 14-17 certificates were issued per share. Several inactive permit holders requested and received a share of certificates. Yet only 28 vessels of the 130 active longline vessels consistently conducted shallow-set trips in the period 2004 to 2010. These vessels made an average of 3.5 shallow-set trips per year, using 16-17 certificates per trip. Therefore, shallow-set vessel operators needed to acquire additional certificates than those issued by NMFS at no cost in order to complete a single shallow-set trip, and they needed additional certificates to conduct additional trips each year.
Certificates were freely transferable and could be used on any vessel with a Hawaii longline limited entry permit. Because the certificates were transferable, a market emerged for the exchange of shallow-set certificates among permit holders. Using the serial number on the certificate, NMFS could determine the certificates given to each permit holder as well as account for certificates used. However there was no official record of transfers as permit holders were not required to report certificate transactions to NMFS.
Certificate holders traded certificates among themselves. A few larger fishing entities accumulated and sold certificates. Some permit holders acquired certificates specifically for trade or to share with other permit holders. Even though no data were collected by NMFS on transfers, the trading price was traced by the local NMFS science centre through a voluntary data collection programme implemented by NMFS observers (Table 6).
TABLE 6Average price of set certificates
Year Avg price $ N
2004 N/A N/A
2005 123 25
2006 170 24
2007 96 46
2008 84 33
2009 98 50
2010 85 7
Source: NMFS Pacific Islands Fisheries Science Center, Honolulu, HI.
RETROSPECTIVE ON EFFICACY OF THE CERTIFICATE PROGRAMMEThe Hawaii programme limited the total number of available certificates, hence limiting the total number of shallow-sets. The certificates were initially allocated in equal shares each year to all interested permit holders, but the final distribution of certificates was
147Hawaii pelagic longline fishery and sea turtle bycatch – the use of set certificates as an allocation solution
left to the free market, with no involvement by NMFS. However, although the total number of allowable sets was limited, the number of hooks per set was not limited by regulation, and there was a steadily increasing trend in the total number of hooks per set deployed in the shallow-set longline fishery.
Because the shallow-set effort limit was implemented using paper certificates, the programme incurred expenses for designing and printing the certificates, distribution, tracking, and administration. The certificates cost about US$1.25 to US$1.50 each to print, primarily because of the requirement to use robust waterproof material and ink and to apply serial numbers. Each certificate was embossed with a three-dimensional logo to make it more difficult to duplicate, thus requiring more processing by the printer. NMFS staff coordinated mailings of reminder notices, tracked incoming requests, had certificates designed and printed, and distributed and tracked certificates. No automated system was in place for tracking certificate usage.
The average use of certificates during the full years of the programme (2005, 2007-2009) averaged 78.9 percent. It is unknown why more of the available certificates were not used. It may have been difficult or relatively costly for the relatively small group of swordfish vessel owners, who probably operate on even thinner profit margins than the rest of the fleet (Pan, in prep), to acquire a sufficient number of certificates, and they held on to their “extra” certificates rather than transferring them to other fishers. It may be that fishers simply did not have enough time in the swordfish season, which peaks in the first two quarters of the calendar year, to conduct enough productive shallow-set trips to use the available certificates. Most of the vessels made four or fewer trips a year, and only a few vessels made as many as seven trips in one year.
The regulations did not specify a protocol to deal with lost, damaged, or stolen certificates. Therefore, some uncertainty existed about the processes for such events and solutions were determined as the need arose. Occasionally, a permit holder claimed certificates were stolen from the boat or lost in the mail and administrators improvised, treating the decision to replace certificates on a case by case basis. In a few instances, some certificates claimed “lost” were found to have been used with logsheets and the claimants did not receive replacement certificates. NMFS informed the longline fleet of lost and replaced certificates so that certificates that had been declared lost and invalid would not be reused if found later.
EPILOGUE: CURRENT MANAGEMENT AND LEGAL SITUATION WITH THE FISHERY AND TURTLES The nature of the shallow set (swordfish) certificate programme allows it to serve as a transferable effort programme based on a by-catch species that invoked some of the principles of a rights-based management, including transferable effort. The programme served as a quota management tool – not of fish, but of the effort limit. Similar to catch share management systems, the allocation of fishing effort generated much discussion among fishery managers and fishers. The fishing industry recommended dividing and distributing the certificates equally to all requesting permit holders as the fairest way to implement the programme initially because the certificates were freely transferable between permit holders. However, it resulted in a situation where a minority of permit holders used the certificates and they did not receive enough certificates in the distribution to cover their needs. That made certificates valuable and a brisk trade in certificates encouraged fishers who had no interest in swordfishing to obtain certificates solely for trading purposes.
Although there was a monitoring system in place to track certificates issued and used, there was no system to track transfers. Collecting information on these transactions would have been valuable to evaluate whether the programme was equitable and
148 Effort rights in fisheries management – General principles and case studies from around the world
beneficial to fishers. This particular programme did not allow for adjustment; however there should be a provision for adjustments in any programme so it can evolve over time to increase effectiveness.
In the event that the shallow-set or a similar certificate programme is proposed for implementation, it is critical to improve the use of technology. A substitute is needed for paper certificates, such as an electronic system to facilitate distribution and transfers. The waterproof certificates were easily lost or damaged and relatively expensive to produce and administer. Furthermore, an integrated data system should be developed to merge data from the observer and logbook records to eliminate manual integration.
The practical message to developers of rights-based management programmes is “keep it simple and short” so that administration is efficient and cost-effective. A complex programme confuses fishers and managers and is more costly to administer. The programme should not neglect key aspects but should be easily explained to stakeholders with limited need for extensive outreach and education. The use of technology where feasible will improve the ease of implementation and monitoring.
Finally, the history of the shallow-set longline fishery since 2004 provides additional insights into the management of fishing effort for protected species conservation. The 50 percent reduction in effort for the shallow-set fishery and the commensurate hard caps of 16 leatherbacks and 17 loggerhead turtles resulted from what was essentially a negotiating process between the Council and the Hawaii Longline Association on one side and the NMFS Office of Protected Resources and plaintiff environmental non-governmental organizations (NGOs), with the NMFS senior administration in the role of a broker. The discovery that large circle hooks and mackerel type bait (as opposed to squid) could severely limit interaction rates and the severity of injury to turtles, and the ability to predict interaction rates with given levels of fishing effort were instrumental in achieving an agreement that the fishery would reopen.
The removal of the set limits and a new hard cap of 46 loggerhead turtles in 2010 were expected to result in a concomitant increase in the amount of shallow set swordfish fishing. However, this did not occur. Annual effort between 20058 and 2009 ranged from 850 to 1 762 sets; the low value for 2006 stemming from a March fishery closure because the fishery reached its loggerhead hard cap. Effort in 2010 amounted to 1 833 sets. In 2011, the 2009 BiOp was remanded and the fishery operated under the 16 leatherback and 17 loggerhead hard caps but with unconstrained effort. Vessels fished for swordfish throughout most of 2011, but the fishery closed in late November after reaching the leatherback hard cap.
In summary, between 2005 and 2011 the fishery operated under the 16 leatherback and 17 loggerhead hard caps and the 2 120set effort limit. The new hard caps of 27 leatherbacks and 34 loggerheads are likely to be implemented sometime in September 2012, and the fishery continues to operate at the original 16 leatherback and 17 loggerhead hard caps9.
North Pacific loggerheads nest primarily in Japan and the nesting trend has been positive and increasing over the past decade thanks to conservation actions of Japanese turtle scientists. Leatherbacks, which the Hawaii longline fishery interacts with, nest primarily in New Guinea and the New Guinea Islands. Nesting trends as far as they can be determined have been declining but not precipitously and protection efforts are being made to conserve nesting aggregations. The impact of the Hawaii shallow-set longline fishery on turtle populations, though detectable through the models used in the 2012 BiOp, is for practical purposes negligible.
8 Although the fishery re-opened in 2004, little swordfish fishing took place that year.9 As of 1 August 2012, the fishery had taken five loggerhead and six leatherback turtles in 2012.
149Hawaii pelagic longline fishery and sea turtle bycatch – the use of set certificates as an allocation solution
In hindsight there are probably many aspects the way the shallow-set fishery was reopened, including the set certificate programme.
ACKNOWLEDGEMENTS The authors would like to thank Mr. Tom Graham and Mr. Mark Helvey for providing a thorough review of previous drafts of this document.
REFERENCESBalazs, G.H. & Pooley, S.G. 1994. Research plan to assess marine turtle hooking mortality:
results of an expert workshop held in Honolulu, Hawaii, November 16-18, 1993. In U.S. Department of Commerce, NOAA-TM-NMFS-SWFSC-201. (also available at www.sefsc.noaa.gov/turtles/TM_NMFS_SWFSC_201.pdf).
Balazs G., Pooley, S.G. & Murakawa, S. 1995. Guidelines for handling marine turtles hooked or entangled in the Hawaii longline fishery: Results of an expert workshop held in Honolulu, Hawai‘i, 15-17 March 1995. In U.S. Department of Commerce, NOAA-TM-NMFS-SWFSC-222. Honolulu, Hawaii. 27p. (also available at http://docs.lib.noaa.gov/noaa_documents/NMFS/SWFSC/TM_NMFS_SWFSC/NOAA-TM-NMFS-SWFSC-222.pdf).
Boggs, C.H. & Ito, R.Y. 1993. Hawaii’s pelagic fisheries. Marine Fisheries. Review, 55(2):69-82.
Evans, K., Langley, A., Clear, N.P., Williams, P., Patterson, T., Sibert, J., Hampton, J. & Gunn, J. 2008. Behaviour and habitat preferences of bigeye tuna (Thunnus obesus) and their influence on longline fishery catches in the western Coral Sea. Canadian Journal of Fisheries and Aquatic Sciences, 65(11), 2427-2443.
Federal Register. 74 FR 65460. International Fisheries Regulations; Fisheries in the Western Pacific; Pelagic Fisheries; Hawaii-based Shallow-set Longline Fishery. December 10, 2009.
Gilman, E., Zollett, E., Beverly, S., Nakano, H., Davis, K., Shiode, D., Dalzell, P. & Kinan, I. 2006. Reducing Sea Turtle Bycatch in Pelagic Longline Gear. Fish and Fisheries, 7: 2-23.
Gilman, E., Kobayashi, D., Swenarton, T., Brothers, N., Dalzell, P. & Kinan-Kelly, I. 2007. Reducing sea turtle interactions in the Hawaii-based longline swordfish fishery. Biological Conservation, 139: 19–28.
Ikehara, W. 2010. Hawaii Shallow-Set (Swordfish) Certificate Programme: Implementing an Effort Limit Through Certificates. In K.R. Criddle, M. Pan & K. Davidson, Marine Policy Special Edition – Hawaii Catch Shares Workshop, Honolulu, Hawaii, March 9-12, 2010. Honolulu, HI.
Ito, R. Y., Dollar, R. A. & Kawamoto, K. E. 1998. The Hawaii-based Longline Fishery for Swordfish, Xiphias gladius. In. Barrett, O. Sosa-Nishizaki, and N. Bartoo, eds. 1998. Biology and fisheries of swordfish, Xiphias gladius. Papers from the International Symposium on Pacific Swordfish, Ensenada, Mexico, 11-14 December 1994. U. S. Dept. of Commer., NOAA Tech. Rep. NMFS 142, 276 p.
NMFS. 2012. Continued operation of the Hawaii-based shallow set longline swordfish fishery-under Amendment 18 to the Fishery Management Plan for Pelagic Fisheries of the Western Pacific Region. Endangered Species Act-Section 7 Consultation, Biological Opinion, National Marine Fisheries Service, Pacific Islands Region, Honolulu, Hawaii, 162 pp.
Pan, M. in prep. Baseline Economic Information for Developing a Catch Share Programme – Economic Characteristics of the Hawaii Longline Fisheries. Marine Policy Special Edition. Hawaii Catch Shares Workshop. March 9-11, 2010. Honolulu, HI.
Watson, J.W., Epperly, S.P., Shah, A.K. & Foster, D.G. 2005. Fishing methods to reduce sea turtle mortality associated with pelagic longlines. Can. J. Fish. Aquat. Sci., 62: 965-981.

151
The transferable effort system in the Faroe Islands
Hans Ellefson, University of the Faroe IslandsE-mail: [email protected]
INTRODUCTIONIn the Faroe Islands there is currently a system of transferable fishing days regulating the effort of the fishing vessels around the islands. Before the early 1990s the fishing system in the Faroe Islands was a combination of limited licenses, area closures and mesh size limits (Jákupsstovu et al., 2007). In the early 1990s, there was a collapse in the main demersal stocks around the Faroe Islands. The main demersal stocks are cod (Gadusmorhua), haddock (Melanogrammus aeglefinus), and saithe (Pollachius virens). To reduce the fishing mortality (F) and rebuild the stocks, a quota system was introduced in 1994 as part of an agreement with the Danish government (Løkkegaard et al., 2007). However, the fishing industry and some politicians were not that happy with this arrangement. The quota system was criticized for leading to extensive discards when reaching the quota limits. Then, in 1995, the industry and the government came up with a new system based on fishing effort. More area closures and mesh size regulation were implemented. This system has been in place since 1996.
When the fishing days system was set up, there was a committee (‘skipanarnevndin’) consisting of managers, scientists, and key fishing industry representatives (Jákupsstovu et al., 2007). The main goal of the committee was to design a system such that the fishing mortality of the three key stocks were kept at 0.45 (corresponding to that approximately one-third of the stock was to be fished) as the recommendation from International Council for the Exploration of the Sea (ICES) then stipulated. A basic assumption of the system was that the effort of each of the three main stocks would change according to the relative abundance of the stocks. This does not seem to have happened though (Jákupstovu et al., 2007).
The fishing days system only regulates the demersal stocks around the Faroe Islands. There are other fisheries, in particular the pelagic fisheries, and trawling on the high seas that are regulated by quotas (ITQs). Today, as we will see later, these fisheries under ITQs accounts for more than two-thirds of the landing value of the Faroese fishing industry.
This paper will analyse how the system has been working since the introduction. First, we will look at how the system works and what restrictions there are. Next, we look at some biological indicators for the main stocks. Finally, we will look at the economic performance of the fishing vessels under the system.
THE SYSTEMWhen the fishing days system in the Faroe Islands was set up, the licenses and fishing days given were according to how the fleet was composed at the time. The licenses were split into eight groups of fishing vessels, which were believed to be homogenous (not all groups were part of the fishing days system at the start):
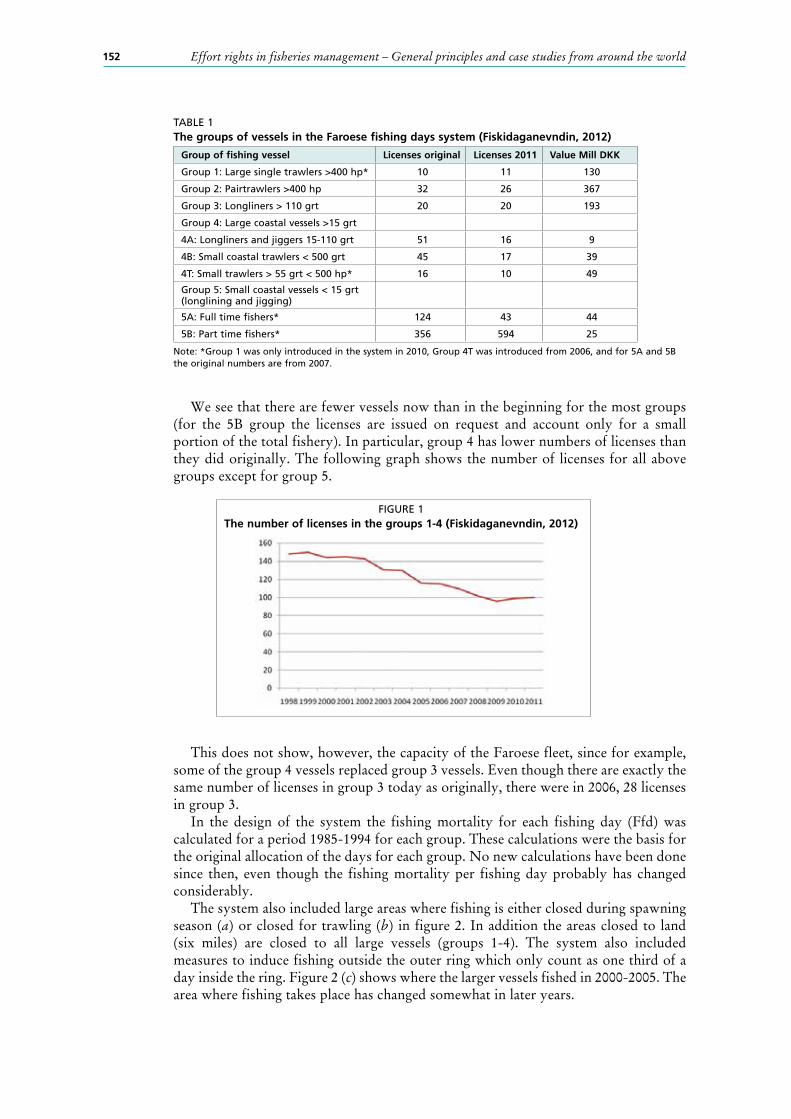
152 Effort rights in fisheries management – General principles and case studies from around the world
TABLE 1The groups of vessels in the Faroese fishing days system (Fiskidaganevndin, 2012)
Group of fishing vessel Licenses original Licenses 2011 Value Mill DKK
Group 1: Large single trawlers >400 hp* 10 11 130
Group 2: Pairtrawlers >400 hp 32 26 367
Group 3: Longliners > 110 grt 20 20 193
Group 4: Large coastal vessels >15 grt
4A: Longliners and jiggers 15-110 grt 51 16 9
4B: Small coastal trawlers < 500 grt 45 17 39
4T: Small trawlers > 55 grt < 500 hp* 16 10 49
Group 5: Small coastal vessels < 15 grt (longlining and jigging)
5A: Full time fishers* 124 43 44
5B: Part time fishers* 356 594 25
Note: *Group 1 was only introduced in the system in 2010, Group 4T was introduced from 2006, and for 5A and 5B the original numbers are from 2007.
We see that there are fewer vessels now than in the beginning for the most groups (for the 5B group the licenses are issued on request and account only for a small portion of the total fishery). In particular, group 4 has lower numbers of licenses than they did originally. The following graph shows the number of licenses for all above groups except for group 5.
This does not show, however, the capacity of the Faroese fleet, since for example, some of the group 4 vessels replaced group 3 vessels. Even though there are exactly the same number of licenses in group 3 today as originally, there were in 2006, 28 licenses in group 3.
In the design of the system the fishing mortality for each fishing day (Ffd) was calculated for a period 1985-1994 for each group. These calculations were the basis for the original allocation of the days for each group. No new calculations have been done since then, even though the fishing mortality per fishing day probably has changed considerably.
The system also included large areas where fishing is either closed during spawning season (a) or closed for trawling (b) in figure 2. In addition the areas closed to land (six miles) are closed to all large vessels (groups 1-4). The system also included measures to induce fishing outside the outer ring which only count as one third of a day inside the ring. Figure 2 (c) shows where the larger vessels fished in 2000-2005. The area where fishing takes place has changed somewhat in later years.
FIGURE 1The number of licenses in the groups 1-4 (Fiskidaganevndin, 2012)
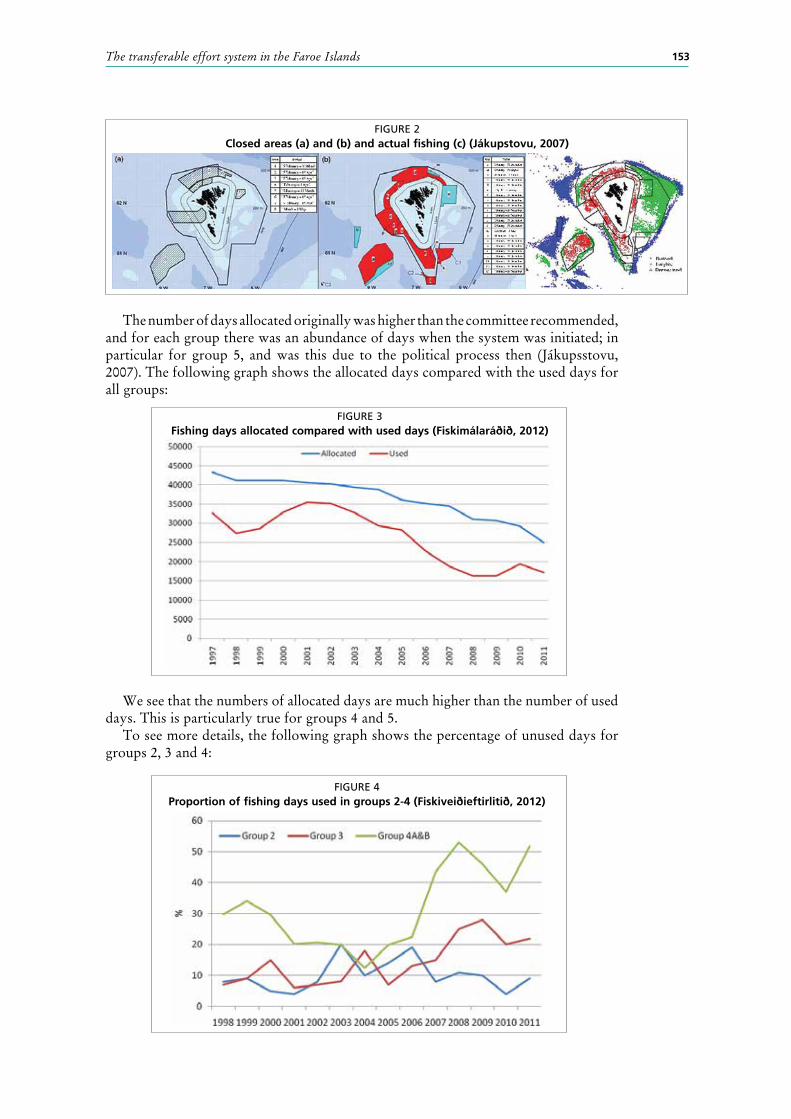
153The transferable effort system in the Faroe Islands
The number of days allocated originally was higher than the committee recommended, and for each group there was an abundance of days when the system was initiated; in particular for group 5, and was this due to the political process then (Jákupsstovu, 2007). The following graph shows the allocated days compared with the used days for all groups:
We see that the numbers of allocated days are much higher than the number of used days. This is particularly true for groups 4 and 5.
To see more details, the following graph shows the percentage of unused days for groups 2, 3 and 4:
FIGURE 2Closed areas (a) and (b) and actual fishing (c) (Jákupstovu, 2007)
FIGURE 4Proportion of fishing days used in groups 2-4 (Fiskiveiðieftirlitið, 2012)
FIGURE 3Fishing days allocated compared with used days (Fiskimálaráðið, 2012)
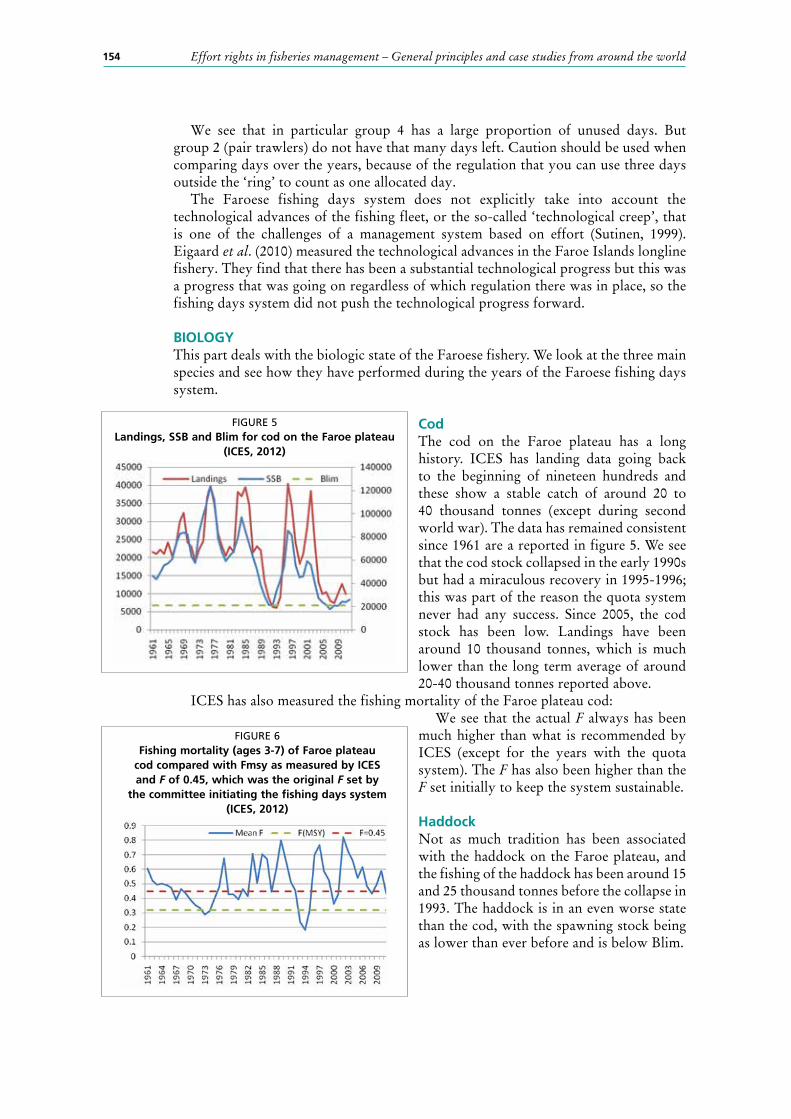
154 Effort rights in fisheries management – General principles and case studies from around the world
We see that in particular group 4 has a large proportion of unused days. But group 2 (pair trawlers) do not have that many days left. Caution should be used when comparing days over the years, because of the regulation that you can use three days outside the ‘ring’ to count as one allocated day.
The Faroese fishing days system does not explicitly take into account the technological advances of the fishing fleet, or the so-called ‘technological creep’, that is one of the challenges of a management system based on effort (Sutinen, 1999). Eigaard et al. (2010) measured the technological advances in the Faroe Islands longline fishery. They find that there has been a substantial technological progress but this was a progress that was going on regardless of which regulation there was in place, so the fishing days system did not push the technological progress forward.
BIOLOGYThis part deals with the biologic state of the Faroese fishery. We look at the three main species and see how they have performed during the years of the Faroese fishing days system.
CodThe cod on the Faroe plateau has a long history. ICES has landing data going back to the beginning of nineteen hundreds and these show a stable catch of around 20 to 40 thousand tonnes (except during second world war). The data has remained consistent since 1961 are a reported in figure 5. We see that the cod stock collapsed in the early 1990s but had a miraculous recovery in 1995-1996; this was part of the reason the quota system never had any success. Since 2005, the cod stock has been low. Landings have been around 10 thousand tonnes, which is much lower than the long term average of around 20-40 thousand tonnes reported above.
ICES has also measured the fishing mortality of the Faroe plateau cod:We see that the actual F always has been
much higher than what is recommended by ICES (except for the years with the quota system). The F has also been higher than the F set initially to keep the system sustainable.
HaddockNot as much tradition has been associated with the haddock on the Faroe plateau, and the fishing of the haddock has been around 15 and 25 thousand tonnes before the collapse in 1993. The haddock is in an even worse state than the cod, with the spawning stock being as lower than ever before and is below Blim.
FIGURE 5Landings, SSB and Blim for cod on the Faroe plateau
(ICES, 2012)
FIGURE 6Fishing mortality (ages 3-7) of Faroe plateau
cod compared with Fmsy as measured by ICES and F of 0.45, which was the original F set by
the committee initiating the fishing days system (ICES, 2012)
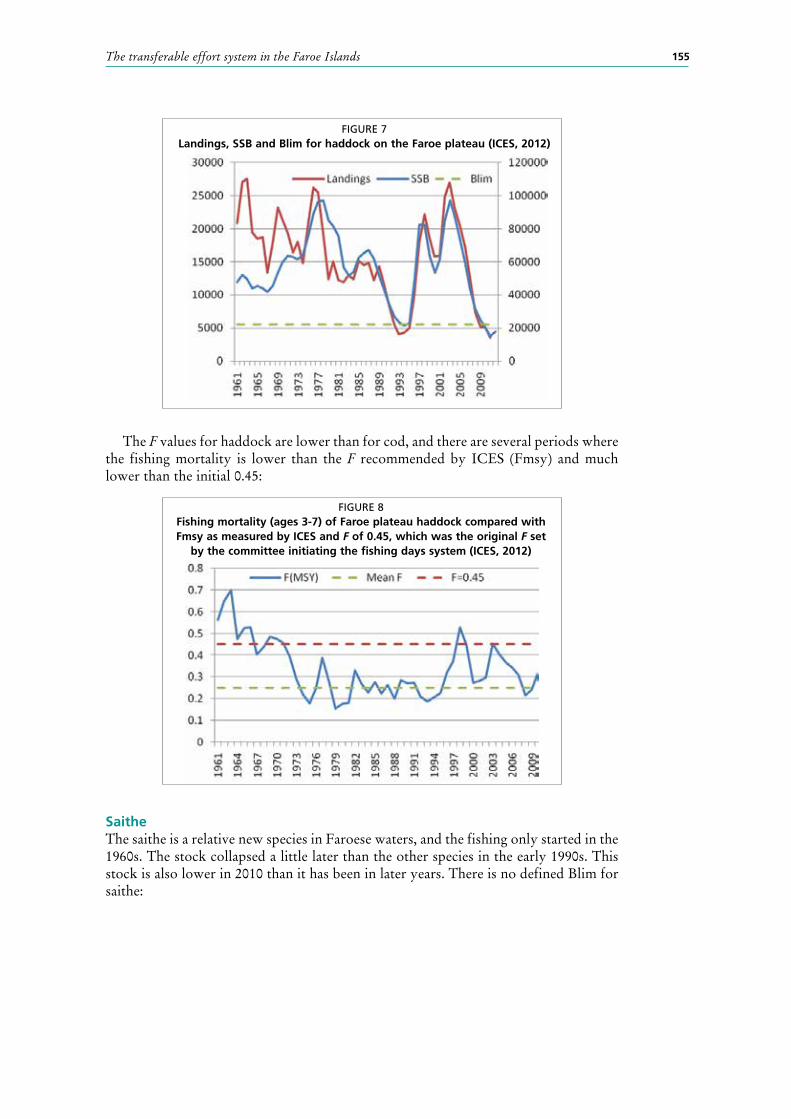
155The transferable effort system in the Faroe Islands
The F values for haddock are lower than for cod, and there are several periods where the fishing mortality is lower than the F recommended by ICES (Fmsy) and much lower than the initial 0.45:
SaitheThe saithe is a relative new species in Faroese waters, and the fishing only started in the 1960s. The stock collapsed a little later than the other species in the early 1990s. This stock is also lower in 2010 than it has been in later years. There is no defined Blim for saithe:
FIGURE 7Landings, SSB and Blim for haddock on the Faroe plateau (ICES, 2012)
FIGURE 8Fishing mortality (ages 3-7) of Faroe plateau haddock compared with Fmsy as measured by ICES and F of 0.45, which was the original F set
by the committee initiating the fishing days system (ICES, 2012)
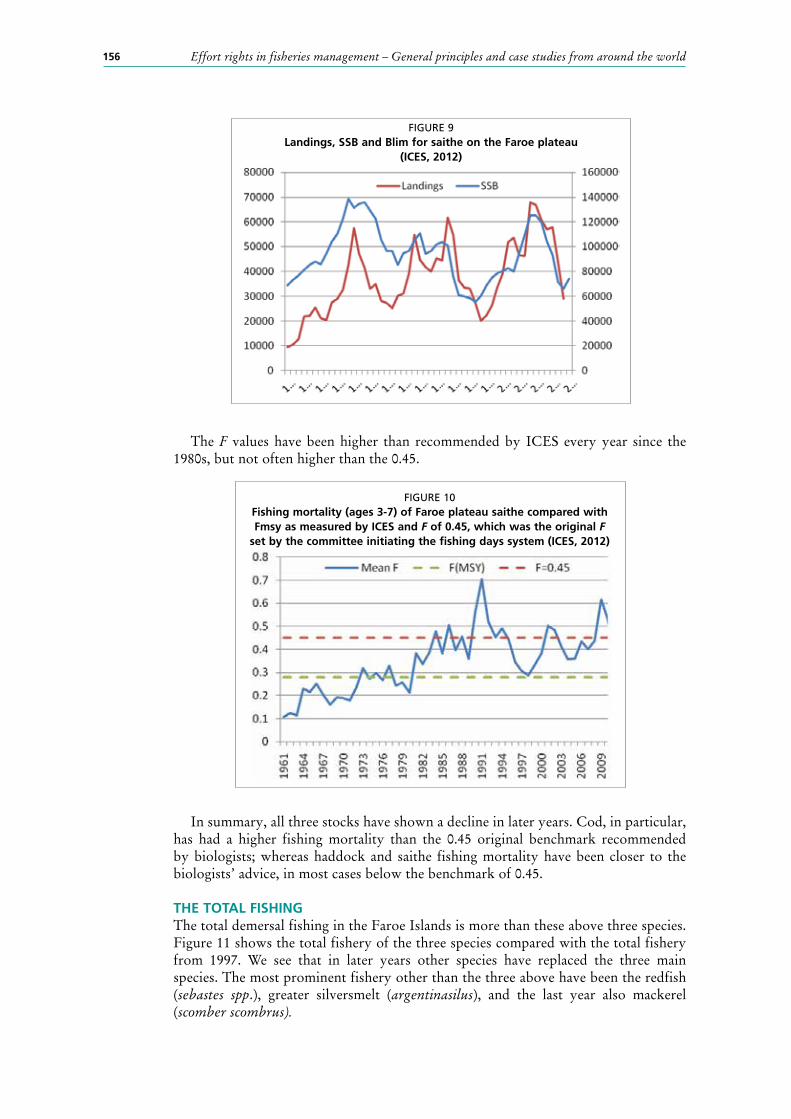
156 Effort rights in fisheries management – General principles and case studies from around the world
The F values have been higher than recommended by ICES every year since the 1980s, but not often higher than the 0.45.
In summary, all three stocks have shown a decline in later years. Cod, in particular, has had a higher fishing mortality than the 0.45 original benchmark recommended by biologists; whereas haddock and saithe fishing mortality have been closer to the biologists’ advice, in most cases below the benchmark of 0.45.
THE TOTAL FISHINGThe total demersal fishing in the Faroe Islands is more than these above three species. Figure 11 shows the total fishery of the three species compared with the total fishery from 1997. We see that in later years other species have replaced the three main species. The most prominent fishery other than the three above have been the redfish (sebastes spp.), greater silversmelt (argentinasilus), and the last year also mackerel (scomber scombrus).
FIGURE 9Landings, SSB and Blim for saithe on the Faroe plateau
(ICES, 2012)
FIGURE 10Fishing mortality (ages 3-7) of Faroe plateau saithe compared with Fmsy as measured by ICES and F of 0.45, which was the original F
set by the committee initiating the fishing days system (ICES, 2012)
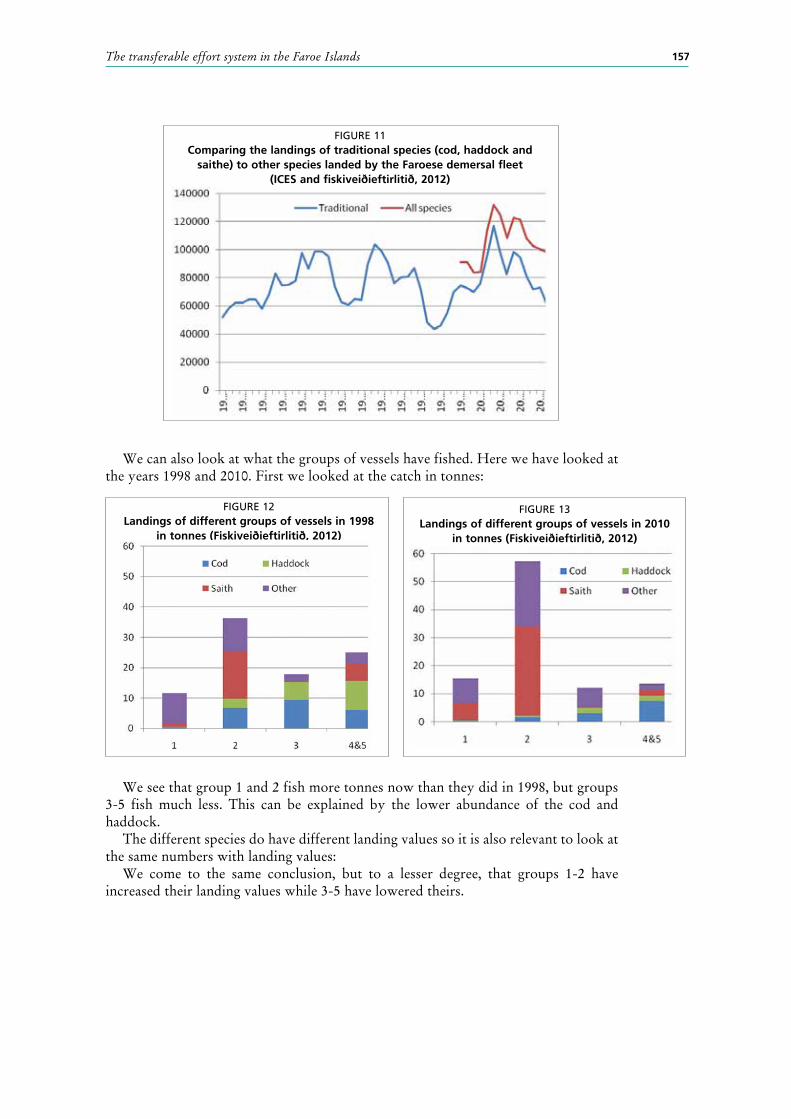
157The transferable effort system in the Faroe Islands
We can also look at what the groups of vessels have fished. Here we have looked at the years 1998 and 2010. First we looked at the catch in tonnes:
We see that group 1 and 2 fish more tonnes now than they did in 1998, but groups 3-5 fish much less. This can be explained by the lower abundance of the cod and haddock.
The different species do have different landing values so it is also relevant to look at the same numbers with landing values:
We come to the same conclusion, but to a lesser degree, that groups 1-2 have increased their landing values while 3-5 have lowered theirs.
FIGURE 11Comparing the landings of traditional species (cod, haddock and
saithe) to other species landed by the Faroese demersal fleet (ICES and fiskiveiðieftirlitið, 2012)
FIGURE 12Landings of different groups of vessels in 1998
in tonnes (Fiskiveiðieftirlitið, 2012)
FIGURE 13Landings of different groups of vessels in 2010
in tonnes (Fiskiveiðieftirlitið, 2012)
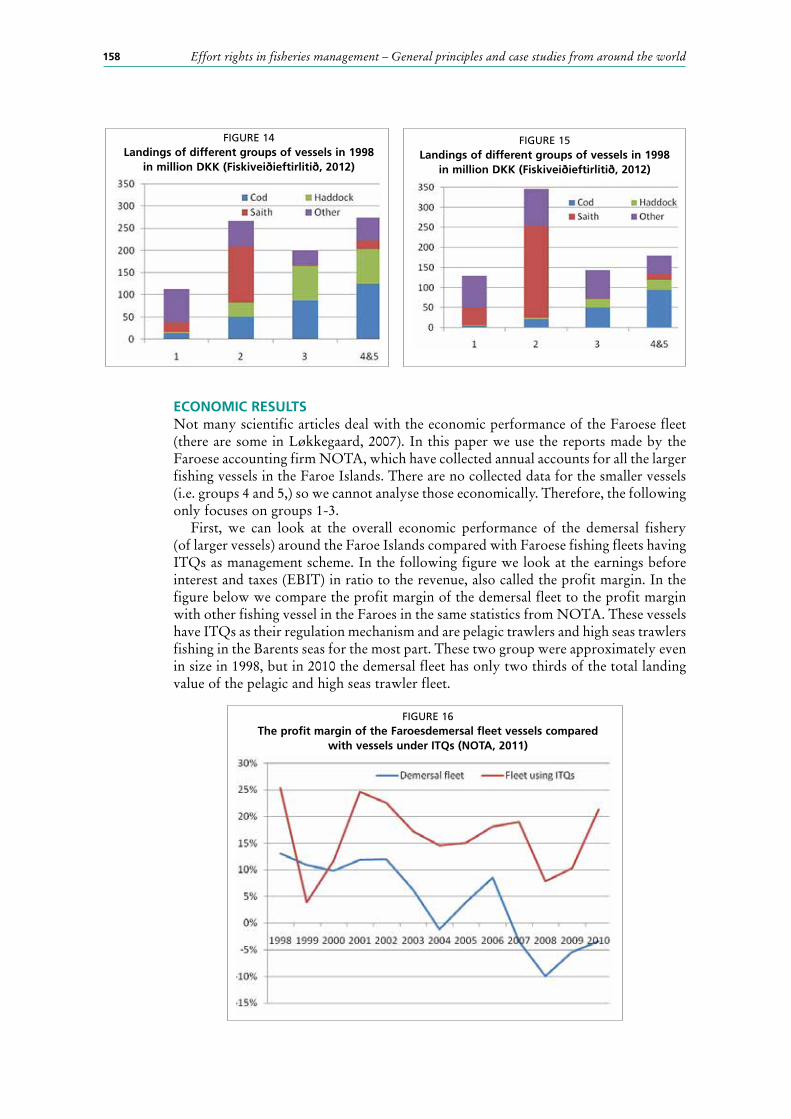
158 Effort rights in fisheries management – General principles and case studies from around the world
ECONOMIC RESULTSNot many scientific articles deal with the economic performance of the Faroese fleet (there are some in Løkkegaard, 2007). In this paper we use the reports made by the Faroese accounting firm NOTA, which have collected annual accounts for all the larger fishing vessels in the Faroe Islands. There are no collected data for the smaller vessels (i.e. groups 4 and 5,) so we cannot analyse those economically. Therefore, the following only focuses on groups 1-3.
First, we can look at the overall economic performance of the demersal fishery (of larger vessels) around the Faroe Islands compared with Faroese fishing fleets having ITQs as management scheme. In the following figure we look at the earnings before interest and taxes (EBIT) in ratio to the revenue, also called the profit margin. In the figure below we compare the profit margin of the demersal fleet to the profit margin with other fishing vessel in the Faroes in the same statistics from NOTA. These vessels have ITQs as their regulation mechanism and are pelagic trawlers and high seas trawlers fishing in the Barents seas for the most part. These two group were approximately even in size in 1998, but in 2010 the demersal fleet has only two thirds of the total landing value of the pelagic and high seas trawler fleet.
FIGURE 14Landings of different groups of vessels in 1998
in million DKK (Fiskiveiðieftirlitið, 2012)
FIGURE 15Landings of different groups of vessels in 1998
in million DKK (Fiskiveiðieftirlitið, 2012)
FIGURE 16The profit margin of the Faroesdemersal fleet vessels compared
with vessels under ITQs (NOTA, 2011)
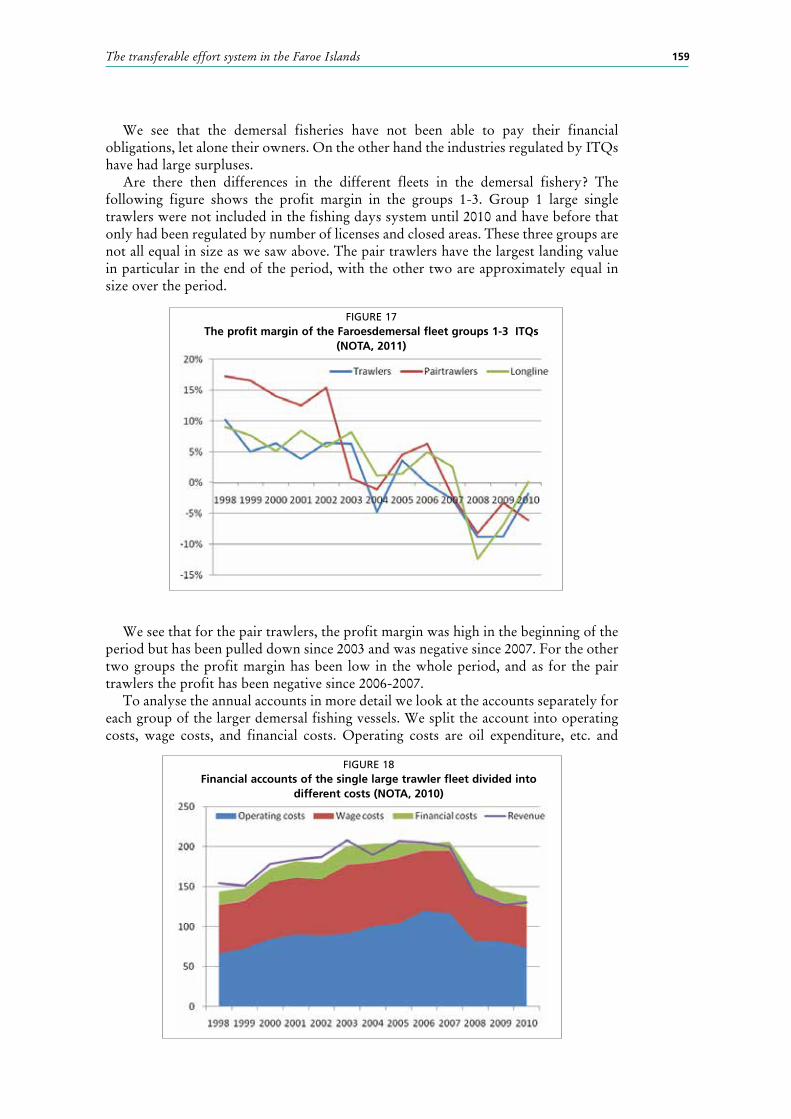
159The transferable effort system in the Faroe Islands
We see that the demersal fisheries have not been able to pay their financial obligations, let alone their owners. On the other hand the industries regulated by ITQs have had large surpluses.
Are there then differences in the different fleets in the demersal fishery? The following figure shows the profit margin in the groups 1-3. Group 1 large single trawlers were not included in the fishing days system until 2010 and have before that only had been regulated by number of licenses and closed areas. These three groups are not all equal in size as we saw above. The pair trawlers have the largest landing value in particular in the end of the period, with the other two are approximately equal in size over the period.
We see that for the pair trawlers, the profit margin was high in the beginning of the period but has been pulled down since 2003 and was negative since 2007. For the other two groups the profit margin has been low in the whole period, and as for the pair trawlers the profit has been negative since 2006-2007.
To analyse the annual accounts in more detail we look at the accounts separately for each group of the larger demersal fishing vessels. We split the account into operating costs, wage costs, and financial costs. Operating costs are oil expenditure, etc. and
FIGURE 18Financial accounts of the single large trawler fleet divided into
different costs (NOTA, 2010)
FIGURE 17The profit margin of the Faroesdemersal fleet groups 1-3 ITQs
(NOTA, 2011)
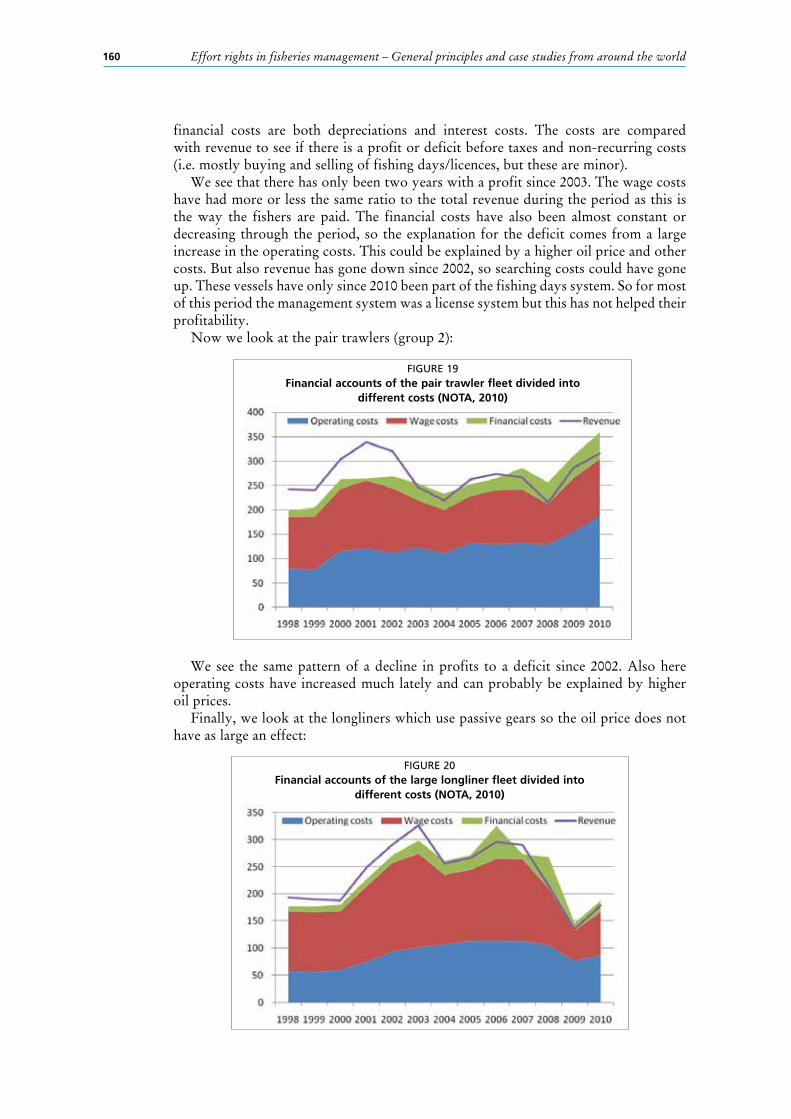
160 Effort rights in fisheries management – General principles and case studies from around the world
financial costs are both depreciations and interest costs. The costs are compared with revenue to see if there is a profit or deficit before taxes and non-recurring costs (i.e. mostly buying and selling of fishing days/licences, but these are minor).
We see that there has only been two years with a profit since 2003. The wage costs have had more or less the same ratio to the total revenue during the period as this is the way the fishers are paid. The financial costs have also been almost constant or decreasing through the period, so the explanation for the deficit comes from a large increase in the operating costs. This could be explained by a higher oil price and other costs. But also revenue has gone down since 2002, so searching costs could have gone up. These vessels have only since 2010 been part of the fishing days system. So for most of this period the management system was a license system but this has not helped their profitability.
Now we look at the pair trawlers (group 2):
We see the same pattern of a decline in profits to a deficit since 2002. Also here operating costs have increased much lately and can probably be explained by higher oil prices.
Finally, we look at the longliners which use passive gears so the oil price does not have as large an effect:
FIGURE 19Financial accounts of the pair trawler fleet divided into
different costs (NOTA, 2010)
FIGURE 20Financial accounts of the large longliner fleet divided into
different costs (NOTA, 2010)
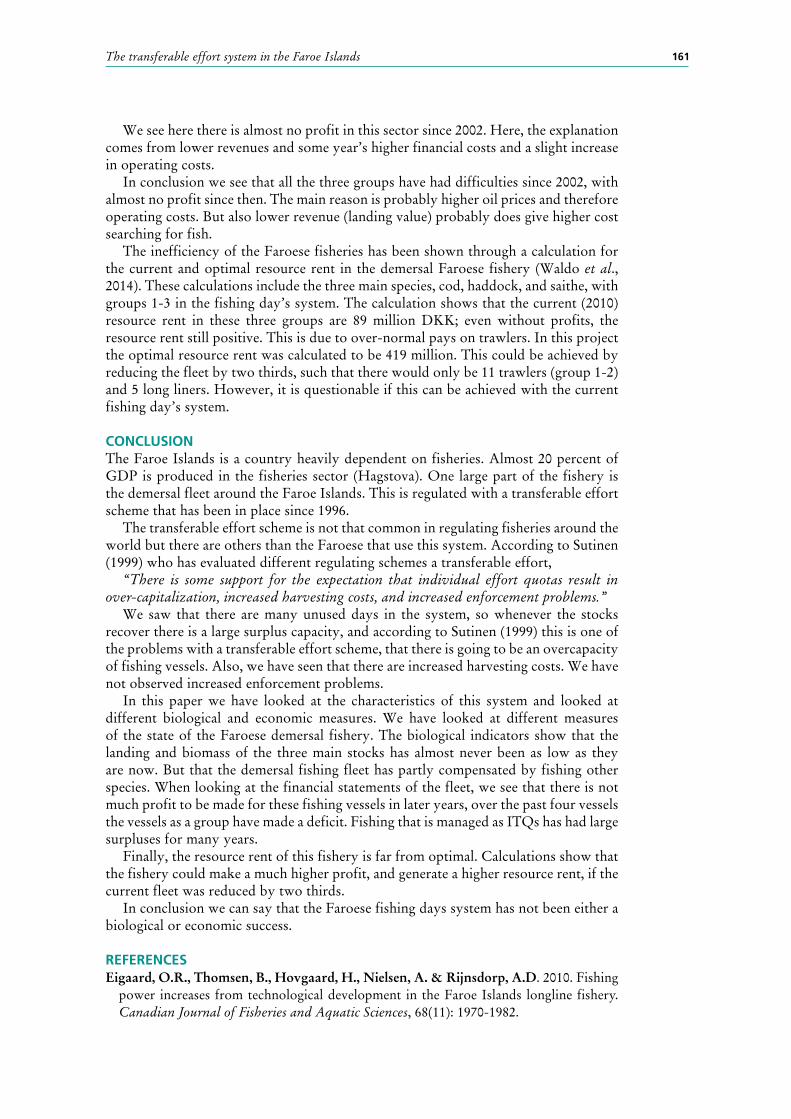
161The transferable effort system in the Faroe Islands
We see here there is almost no profit in this sector since 2002. Here, the explanation comes from lower revenues and some year’s higher financial costs and a slight increase in operating costs.
In conclusion we see that all the three groups have had difficulties since 2002, with almost no profit since then. The main reason is probably higher oil prices and therefore operating costs. But also lower revenue (landing value) probably does give higher cost searching for fish.
The inefficiency of the Faroese fisheries has been shown through a calculation for the current and optimal resource rent in the demersal Faroese fishery (Waldo et al., 2014). These calculations include the three main species, cod, haddock, and saithe, with groups 1-3 in the fishing day’s system. The calculation shows that the current (2010) resource rent in these three groups are 89 million DKK; even without profits, the resource rent still positive. This is due to over-normal pays on trawlers. In this project the optimal resource rent was calculated to be 419 million. This could be achieved by reducing the fleet by two thirds, such that there would only be 11 trawlers (group 1-2) and 5 long liners. However, it is questionable if this can be achieved with the current fishing day’s system.
CONCLUSIONThe Faroe Islands is a country heavily dependent on fisheries. Almost 20 percent of GDP is produced in the fisheries sector (Hagstova). One large part of the fishery is the demersal fleet around the Faroe Islands. This is regulated with a transferable effort scheme that has been in place since 1996.
The transferable effort scheme is not that common in regulating fisheries around the world but there are others than the Faroese that use this system. According to Sutinen (1999) who has evaluated different regulating schemes a transferable effort,
“There is some support for the expectation that individual effort quotas result in over-capitalization, increased harvesting costs, and increased enforcement problems.”
We saw that there are many unused days in the system, so whenever the stocks recover there is a large surplus capacity, and according to Sutinen (1999) this is one of the problems with a transferable effort scheme, that there is going to be an overcapacity of fishing vessels. Also, we have seen that there are increased harvesting costs. We have not observed increased enforcement problems.
In this paper we have looked at the characteristics of this system and looked at different biological and economic measures. We have looked at different measures of the state of the Faroese demersal fishery. The biological indicators show that the landing and biomass of the three main stocks has almost never been as low as they are now. But that the demersal fishing fleet has partly compensated by fishing other species. When looking at the financial statements of the fleet, we see that there is not much profit to be made for these fishing vessels in later years, over the past four vessels the vessels as a group have made a deficit. Fishing that is managed as ITQs has had large surpluses for many years.
Finally, the resource rent of this fishery is far from optimal. Calculations show that the fishery could make a much higher profit, and generate a higher resource rent, if the current fleet was reduced by two thirds.
In conclusion we can say that the Faroese fishing days system has not been either a biological or economic success.
REFERENCESEigaard, O.R., Thomsen, B., Hovgaard, H., Nielsen, A. & Rijnsdorp, A.D. 2010. Fishing
power increases from technological development in the Faroe Islands longline fishery. Canadian Journal of Fisheries and Aquatic Sciences, 68(11): 1970-1982.
162 Effort rights in fisheries management – General principles and case studies from around the world
Fiskidaganevndin. 2012. Tilmæli fráfiskidaga nevndini. Tórshavn, Faroe Islands. (also available on http://fisk.fo/Files/Billeder/Fisk/01_stjornarskrivstovan/Skjal%202-Fiskidaganevndin.pdf)
Jákupsstovu, S.H., Cruz, L.R., Maguire, J.-J., and Reinert, J. 2007. Effort regulation of the demersal fisheries at the Faroe Islands: a 10-year appraisal. ICES J. Mar. Sci., 64(4): 730–737.
Løkkegaard, J., Andersen, J.L., Boje, J., Frost, H. & Hovgård, H. 2007. Report on the Faroese fisheries regulation: the Faroe model. University of Copenhagen, Frederiksberg, Department of Economics. Report / Institute of Food and Resource Economics, no. 193.
NOTA. 2010. Rokniskapargreining (Report on accounts of Faroese fishing vessels). Tórshavn, Faroe Islands.
Sutinen, J. G. 1999. What Works Well and Why: Evidence from Fishery Management Experiences in OECD Countries. ICES Journal of Marine Science, 56: 1051-1058.
Waldo, S., Ellefsen, H., Flaaten, O., Hallgrimsson, J., Hammarlund, C., Hermansen, Ø., Isaksen, J.R., Jensen, F., Duy, N.N., Nielsen M., Paulrud, A., Salenius, F., Schütt, D. (2014) (In Press) The Impact of Abolishing Fuel Tax Concessions in Fisheries. Tema Nord
Web pages:International Council for the Exploration of the Sea (ICES). 2014. ICES [online].
Denmark. [Cited 9 September 2011]. www.ices.dkFiskimálaráðið (the fisheries ministry). 2014. Fiskimálaráðið [online]. Faroe Islands.
[Cited 9 September 2011]. www.fisk.foFiskiveiðieftirlitið (the Faroese fishing inspection) 2014. Fiskiveiðieftirlitið [online].
Faroe Islands. [Cited 9 September 2011]. www.fvg.foHagstovan (the Faroese statistical office) 2014. Hagstovan [online]. Faroe Islands. [Cited
9 September 2011]. www.hagstovan.fo
163
The Vessel Day Scheme: rights-based management and economic and environmental change in the Western and Central Pacific Ocean tuna fishery
Elizabeth Havice, Department of Geography, University of North CarolinaE-mail: [email protected]
INTRODUCTIONIn the Western and Central Pacific Ocean (WCPO), the highly migratory nature of tunas and the international dimensions of the tuna production system make the development and deployment of resource ‘rights’ particularly complex. In 2012, over 2.6 million tonnes of tuna valued at US$5.5 billion were caught in the region, over 1.8 million tonnes of which was caught by industrial purse seine vessels (FFA Database: Value of WCPO Tuna Fisheries and Catch by EEZ; WCPFC Scientific Committee 2012, 2013a). Of this, over 60 percent of total volume (1.3 million tonnes) was caught inside of the 200 mile exclusive economic zones of the eight Pacific island countries that are Parties to the Nauru Agreement (known collectively as the PNA countries): the Federated States of Micronesia, Kiribati, the Marshall Islands, Nauru, Palau, Papua New Guinea, the Solomon Islands and Tuvalu. In 2007, the PNA countries implemented the Vessel Day Scheme (VDS) for the purse seine fishery – a transferable effort programme designed to achieve specific economic and environmental goals. Given the volume, value and multi-jurisdictional nature of the fishery, the VDS is arguably the largest and most complex fishery management arrangement ever implemented.
This paper offers an overview of the opportunities and challenges of this approach to rights-based management. The Phases of Rights-Based Management in the WCPO Tuna Fishery reviews the phases of rights-based management leading to the VDS as well as the PNA’s economic and ecological management objectives. Economic and Biological Objectives of the VDS explains why the PNA countries chose a transferable effort scheme over other rights-based approaches. Technical Account of the Vessel Day Scheme offers a technical account of the VDS implementation systems and relationship with the Western and Central Pacific Fisheries Commission (WCPFC), the region’s tuna RFMO (regional fisheries management organization). VDS Outcomes draws on document analysis and interview data with industry representatives, government officials and international fisheries specialists to review VDS outcomes against PNA country and the WCPFC objectives.
The analysis reveals that the VDS has generated dramatic economic changes in favour of PNA countries and some important biological improvements, though several challenges remain; particularly around firm enforcement of the Scheme by PNA countries and the rapid ballooning of capacity in the region. This review reveals
164 Effort rights in fisheries management – General principles and case studies from around the world
that strengthening rights through effort control can generate significant economic and ecological changes, but that the structure of the fishery in question as well as the politics associated with the formation, implementation and monitoring of the management approach, shape management outcomes.
THE PHASES OF RIGHTS-BASED MANAGEMENT IN THE WCPO TUNA FISHERY
Phase 1: From Open Access to the Law of the SeaIn the 1960s, United States and Japanese fleets entered the WCPO and commenced industrial fishing. At this time, vessels fished under open access conditions without regulation or paying licensing fees. By the late 1970s, Pacific Island countries and coastal states around the world declared their 200 mile exclusive economic zones (EEZs), their first step towards rights-based tuna management. With EEZs established, Pacific Island countries deployed their nascent sovereignty over ocean resources to charge licensing fees and regulate fishing activities. Their claims were recognized in international law in 1982 upon the conclusion of the United Nations Convention on the Law of the Sea (UNCLOS).
Phase 2: The Nauru AgreementIn the early 1980s, the eight Pacific Island countries with the most tuna-rich waters – and thus, the greatest potential to collectively govern the transboundary fishery – formed a sub-regional alliance to collectively address the economic and ecological challenges associated with managing a highly migratory stock. They signed the Nauru Agreement, setting their sights on negotiating harmonized minimum terms and conditions of access for foreign vessels, which were negotiated over the following decades (Arrangement Implementing the Nauru Agreement Setting Forth Minimum Terms and Conditions of Access to the Fisheries Zones of the Parties 1983). They agreed to cooperate to improve historically weak bargaining power in fisheries access agreements to increase economic returns from activity undertaken by foreign fishing interests.
Phase 3: The Palau and FSM Arrangements and an international mandate for cooperative managementIn 1990, the PNA countries advanced their move towards regionally oriented rights-based management by initiating negotiations for the Palau Arrangement, which eventually introduced a limited entry licensing system that restricted the total number of purse seine vessels fishing in PNA waters (The Palau Arrangement for the Management of the Western Pacific Purse Seine Fishery 1992). The loosely formulated capacity control was eventually set at 205 purse seine vessels to limit access, and in turn, generate economic and environmental improvements. In addition to the vessel limit, the PNA countries committed to reducing capacity by 10 percent to improve catch rates and generate licensing scarcity that would drive fish prices higher and control pressure on resources. To fulfil socio-economic objectives, the PNA countries also negotiated the FSM Arrangement which resulted in a new class of fishing licenses. FSMA licenses require vessels to undertake economic activities in the region, such as offloading, provisioning, infrastructure investments and employment (e.g. vessel crew) in exchange for access to all eight PNA countries’ waters (The FSM Arrangement for Regional Fisheries Access 1995) (see below for more on FSMA outcomes)1.
1 Without licensing incentives, few industry members have been interested in making non-fishing investments such as building and operating tuna processing plants in PNA countries, primarily because of the very high costs of doing business there and the challenging business climate (Havice and Reed, 2012).
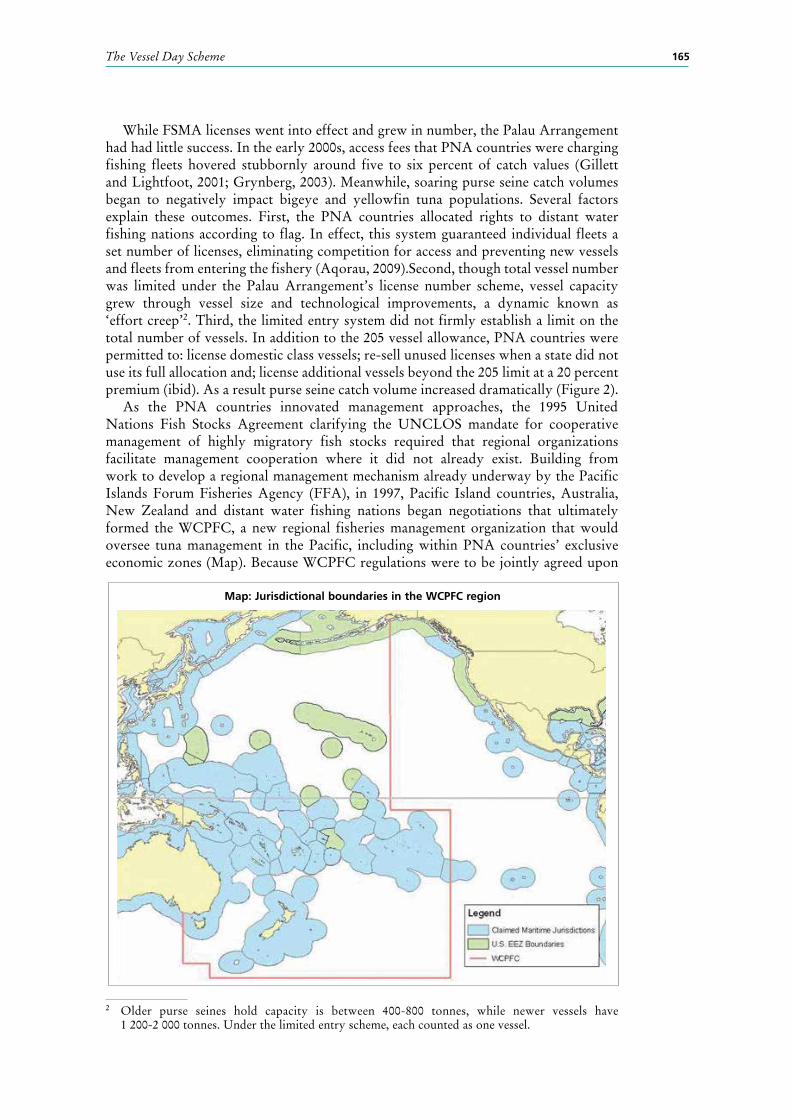
165The Vessel Day Scheme
While FSMA licenses went into effect and grew in number, the Palau Arrangement had had little success. In the early 2000s, access fees that PNA countries were charging fishing fleets hovered stubbornly around five to six percent of catch values (Gillett and Lightfoot, 2001; Grynberg, 2003). Meanwhile, soaring purse seine catch volumes began to negatively impact bigeye and yellowfin tuna populations. Several factors explain these outcomes. First, the PNA countries allocated rights to distant water fishing nations according to flag. In effect, this system guaranteed individual fleets a set number of licenses, eliminating competition for access and preventing new vessels and fleets from entering the fishery (Aqorau, 2009).Second, though total vessel number was limited under the Palau Arrangement’s license number scheme, vessel capacity grew through vessel size and technological improvements, a dynamic known as ‘effort creep’2. Third, the limited entry system did not firmly establish a limit on the total number of vessels. In addition to the 205 vessel allowance, PNA countries were permitted to: license domestic class vessels; re-sell unused licenses when a state did not use its full allocation and; license additional vessels beyond the 205 limit at a 20 percent premium (ibid). As a result purse seine catch volume increased dramatically (Figure 2).
As the PNA countries innovated management approaches, the 1995 United Nations Fish Stocks Agreement clarifying the UNCLOS mandate for cooperative management of highly migratory fish stocks required that regional organizations facilitate management cooperation where it did not already exist. Building from work to develop a regional management mechanism already underway by the Pacific Islands Forum Fisheries Agency (FFA), in 1997, Pacific Island countries, Australia, New Zealand and distant water fishing nations began negotiations that ultimately formed the WCPFC, a new regional fisheries management organization that would oversee tuna management in the Pacific, including within PNA countries’ exclusive economic zones (Map). Because WCPFC regulations were to be jointly agreed upon
Map: Jurisdictional boundaries in the WCPFC region
2 Older purse seines hold capacity is between 400-800 tonnes, while newer vessels have 1 200-2 000 tonnes. Under the limited entry scheme, each counted as one vessel.

166 Effort rights in fisheries management – General principles and case studies from around the world
by coastal states and distant water fishing interests, PNA countries had an interest in asserting rights over their EEZs to protect against WCPFC agreements that could influence – and perhaps erode – their sovereignty over in-zone resources. The WCPFC was likely negotiate conservation measures that would be applied in the high seas and in EEZs because scientific bodies were recommending controlling bigeye and yellowfin mortality, (Havice and Campling 2010).
Phase 4: The Vessel Day SchemeGiven these dynamics, the PNA countries began to explore ways to strengthen their rights over tuna resources, a move consistent with an emerging emphasis on rights-based management in fisheries (Allen et al., 2010; IATTC and World Bank, 2008; World Bank, 2011). A review of options (contracted by FFA) recommended replacing the vessel number scheme with a vessel day scheme because a day-based effort control approach would offer PNA countries flexibility to exercise rights over purse seine fishing in their EEZ (Geen, 2000). The review highlighted that monitoring the effort control scheme would be more expensive than the limited entry scheme, but manageable (Aqorau, 2009). A second option was a catch quota system that would be able to target species-specific biological concerns by creating discrete quotas for each of the three primary tuna species. The PNA countries chose the effort control because it could be monitored in real-time with already mandatory Vessel Monitoring Systems onboard vessels, while a quota scheme would require log sheet and observer data, neither of which could be reported in real-time. At the time of the decision, the PNA countries were open to shifting towards a catch quota scheme as data management systems advance (International fisheries specialist, personal communication 2012). The PNA adopted the VDS with the knowledge that it would be less effective for protecting specific stocks than a quota system, but that existing monitoring capacity in the region was inadequate to enforce a quota system.
Beyond the blunt nature of using an effort control scheme in a multi-species fishery, several potential shortcomings were clear from the outset. First, the VDS could push fishing effort into the unregulated high seas and other non-participating EEZs. Second, vessels could increase effort on fish aggregating devices (FADs) to increase catch volume per day, yielding higher catches of more vulnerable yellowfin and bigeye, including juveniles (see below). Finally, shifting to fishing days could increase the total number of vessels (and thus capacity) because days could be divided among an unlimited number of vessels; a significant concern because most fisheries are considered overcapitalized3 and increasing capacity generates pressure for managers to relax effort limits (Beddington et al., 2007).
ECONOMIC AND BIOLOGICAL OBJECTIVES OF THE VDSThe primary objective of the VDS is to increase economic returns to resource-owning PNA countries (Dunn et al., 2006). Targeted economic returns include licensing revenues and for some PNA countries, broader socio-economic opportunities such as job creation and infrastructure development, including through FSMA initiatives. Related, the PNA countries see the VDS as a tool for creating new industry norms. Under the scheme, fishing firms once confident in their Palau Arrangement allocations must annually negotiate with individual PNA countries for fishing vessels days. In addition, because days are transferable between the Parties, the PNA countries can enhance their control over the allocation of fishing effort.
3 Overcapacity in fisheries is a long run phenomenon that exists when the potential output that could exist under normal operating conditions is different from a target level of production in fishery such as maximum economic yield or maximum sustainable yield (FAO, 2002).
167The Vessel Day Scheme
The biological dimensions of the VDS are more difficult to define and measure because the effort control approach does not treat species individually and because of the relationship between the VDS and WCPFC Conservation and Management Measures. Three main stocks constitute the PNA purse seine fishery: skipjack, yellowfin and bigeye. According to the most recent stock assessments (Harley et al., 2012), current fish mortality rates for skipjack are below the fishing mortality associated with maximum sustainable yield. However, if recent catch levels continue, catch rates are likely to decline and catch should decrease as stocks are fished down to MSY levels. To limit skipjack catch rate decline, the scientific committee has recommended developing limits on purse seine fishing (ibid)4. In the Ninth Regular Session meeting of the WCPFC, members agreed to a Conservation and Management Measure that had an objective of limiting the fishing mortality rate for skipjack at a level no greater than Fmsy (WCPFC, 2012).
Yellowfin mortality has increased in recent years, but is still estimated to be below maximum sustainable yield. The stock is not considered in an overfished state; however, in the Western Equatorial Pacific where 81 percent of catch is taken, fishery impacts are much higher than general averages. In this area – Region Three of WCPFC statistical area, which includes PNA waters except for Kiribati and Tuvalu and with the additions of Indonesia and the Philippines – the stock is fully exploited with no potential for increased catches. The WCPFC Scientific Committee has reiterated early advice that there be no increase in fishing mortality in this region (Harley et al., 2012)5. Like for skipjack, in the Ninth Regular Session meeting of the WCPFC, members agreed to a Conservation and Management Measure that had an objective of limiting the fishing mortality rate for yellowfin at a level no greater than Fmsy, and members were encouraged to take measures not to increase their catch of yellowfin tuna (WCPFC, 2012).
Of most concern, bigeye mortality has increased in recent years and current levels are far in excess of maximum sustainable yield; overfishing is occurring and it is possible that bigeye is in an overfished state. The WCPFC Scientific Committee has recommended a reduction of at least 32 percent in fishing mortality from the average 2006-2009 levels (Harley et al., 2012).In the Ninth Regular Session meeting of the WCPFC, members agreed to a Conservation and Management Measure that had an objective of reducing the fishing mortality rate for bigeye to a level no greater than Fmsy through a step by step approach over the next five years (WCPFC, 2012).
Within this context, an objective of the VDS is to promote the optimal conservation of tuna resources. In practice, the sub-regional VDS management objectives are closely tied to those of the WCPFC because WCPFC jurisdiction geographically encapsulates PNA EEZs. In 2005, the WCPFC’s first tuna Conservation and Management Measure formalized the relationship between the two. The WCPFC aimed to control the purse seine fishery by limiting effort to 2004 levels and recognized the VDS as the management tool to achieve this objective within PNA waters (CMM, 2005-01, 8 and 10[i]).
4 The TAE curve if strictly monitored and enforced, days are strictly defined and directly tied to fishing mortality, and if all vessel days were fully utilized would be perfectly inelastic (i.e. vertical in shape).
5 Most of the yellowfin catch comes from this region. Catches to the north, south and east of Region Three are much lower. While tunas are highly migratory, they do not move enough to be instantaneously mixed. Improved spatial resolution in models is revealing strong local fishing effects, including in the Western Equatorial Pacific, where scientific experts do not think that higher yellowfin catches can be taken in the long term (International fisheries specialist, personal communication 2012).
168 Effort rights in fisheries management – General principles and case studies from around the world
Despite that the most recent WCPFC Conservation and Management Measures applies to skipjack, bigeye and yellowfin management, in practice, the VDS is primarily an exercise in skipjack management because skipjack is the vast majority of take. The VDS is secondarily a management measure for yellowfin, which represents 20-30 percent of purse seine take. Thus, controlling purse seine effort alone is not sufficient to address conservation objectives for yellowfin and bigeye, a challenge identified from the outset of the VDS. To more directly target conservation objectives for bigeye and yellowfin, WCPFC members and the PNA group have turned to technical measures – many initiated by the PNA countries.
For example, as part of the Third PNA Implementing Arrangement (3IA) signed in May 2008, the PNA countries introduced an annual three month closure on fishing on Fish Aggregating Devices (FADs) (later taken up in the WCPFC forum) (PNA, 2010a). The PNA countries also closed areas of the high seas and strengthened vessel reporting requirements. The measure was justified primarily on conservation grounds (to control potential illegal activity associated with transshipment), but it also pushes fishing effort into EEZs where PNA countries can charge for fishing days.
In summary, the PNA countries implemented the VDS to strengthen their rights over the fishery to achieve economic and biological goals. They selected a transferable effort scheme that limited the number of fishing days, noting that the VDS would have high, but not insurmountable implementation and monitoring costs and that there could be shortcomings to the programme particularly around the general nature of the effort control and the potential for capacity growth and effort creep.
TECHNICAL ACCOUNT OF THE VESSEL DAY SCHEMEThe PNA countries implemented the Vessel Day Scheme in December 2007 (The Palau Arrangement for the Management of the Western Pacific Purse Seine Fishery - Management Scheme [Vessel Day Scheme] 2005). Initially, the VDS was administered and monitored by the FFA; however, in 2009, the PNA formed its own secretariat based in Majuro, Marshall Islands to centralize control over the VDS and related regulatory arrangements (Havice and Campling, 2009). In the move, the PNA secretariat shifted VDS monitoring from FFA to Papua New Guinea, building from that country’s well-established vessel monitoring system. VDS parameters apply only to purse seine vessels fishing within the exclusive economic zones of the PNA countries (Map). Fishing effort is controlled through a time metric: a fishing day, defined in Article 1 (iv) of the VDS as a 24 hour period during which vessels undertake any fishing-related activity. Since implementation, the definition of a fishing day has become one of the most contentious issues in the VDS (see below).
The PNA countries set a total allowable number of fishing days (Total Allowable Effort, TAE) to be used in an individual management year within PNA waters. TAE initially limited fishing days to 2004 levels, estimated to be 33 856 days6. The 2004 fishing days of two special licensing classes, FSMA and United States Treaty vessels were estimated to be 5 387 days and deducted off of the total sum, leaving 28 469 days available for the rest of the vessels for each management year. Once TAE was set, PNA countries allocated it amongst themselves according to a formula combining a measure of EEZ productivity and effort and catch history. Initially, allocations were expressed as a percentage and calculated from a formula based 50 percent on the distribution of the assessed relative biomass of skipjack and yellowfin within the waters of the Parties (average taken over a ten year period) and 50 percent on the average of the annual distribution of the number of vessel days fishing in the waters of the Parties
6 Effort data figures and their use in management decisions can be confusing as the data is recorded through a range of different metrics and fields. In contrast to the PNA figure, SPC data estimates 2004 effort in days at 30,361 (SPC Catch and Effort Database).
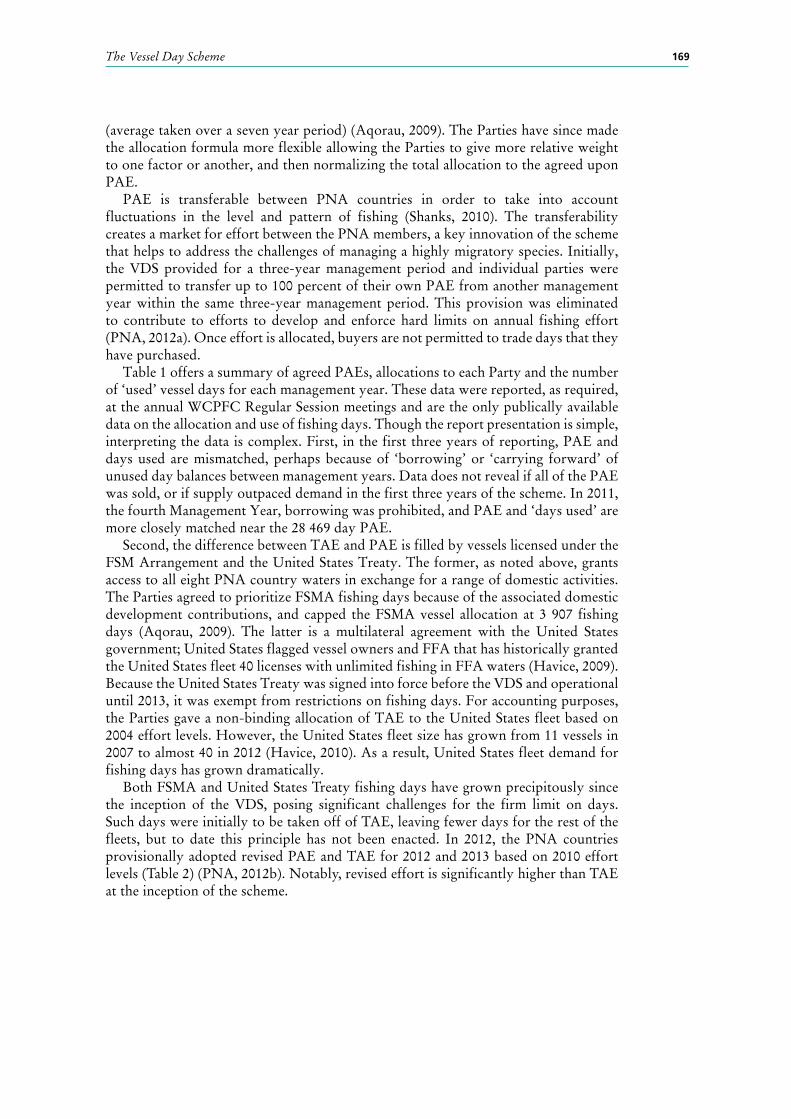
169The Vessel Day Scheme
(average taken over a seven year period) (Aqorau, 2009). The Parties have since made the allocation formula more flexible allowing the Parties to give more relative weight to one factor or another, and then normalizing the total allocation to the agreed upon PAE.
PAE is transferable between PNA countries in order to take into account fluctuations in the level and pattern of fishing (Shanks, 2010). The transferability creates a market for effort between the PNA members, a key innovation of the scheme that helps to address the challenges of managing a highly migratory species. Initially, the VDS provided for a three-year management period and individual parties were permitted to transfer up to 100 percent of their own PAE from another management year within the same three-year management period. This provision was eliminated to contribute to efforts to develop and enforce hard limits on annual fishing effort (PNA, 2012a). Once effort is allocated, buyers are not permitted to trade days that they have purchased.
Table 1 offers a summary of agreed PAEs, allocations to each Party and the number of ‘used’ vessel days for each management year. These data were reported, as required, at the annual WCPFC Regular Session meetings and are the only publically available data on the allocation and use of fishing days. Though the report presentation is simple, interpreting the data is complex. First, in the first three years of reporting, PAE and days used are mismatched, perhaps because of ‘borrowing’ or ‘carrying forward’ of unused day balances between management years. Data does not reveal if all of the PAE was sold, or if supply outpaced demand in the first three years of the scheme. In 2011, the fourth Management Year, borrowing was prohibited, and PAE and ‘days used’ are more closely matched near the 28 469 day PAE.
Second, the difference between TAE and PAE is filled by vessels licensed under the FSM Arrangement and the United States Treaty. The former, as noted above, grants access to all eight PNA country waters in exchange for a range of domestic activities. The Parties agreed to prioritize FSMA fishing days because of the associated domestic development contributions, and capped the FSMA vessel allocation at 3 907 fishing days (Aqorau, 2009). The latter is a multilateral agreement with the United States government; United States flagged vessel owners and FFA that has historically granted the United States fleet 40 licenses with unlimited fishing in FFA waters (Havice, 2009). Because the United States Treaty was signed into force before the VDS and operational until 2013, it was exempt from restrictions on fishing days. For accounting purposes, the Parties gave a non-binding allocation of TAE to the United States fleet based on 2004 effort levels. However, the United States fleet size has grown from 11 vessels in 2007 to almost 40 in 2012 (Havice, 2010). As a result, United States fleet demand for fishing days has grown dramatically.
Both FSMA and United States Treaty fishing days have grown precipitously since the inception of the VDS, posing significant challenges for the firm limit on days. Such days were initially to be taken off of TAE, leaving fewer days for the rest of the fleets, but to date this principle has not been enacted. In 2012, the PNA countries provisionally adopted revised PAE and TAE for 2012 and 2013 based on 2010 effort levels (Table 2) (PNA, 2012b). Notably, revised effort is significantly higher than TAE at the inception of the scheme.
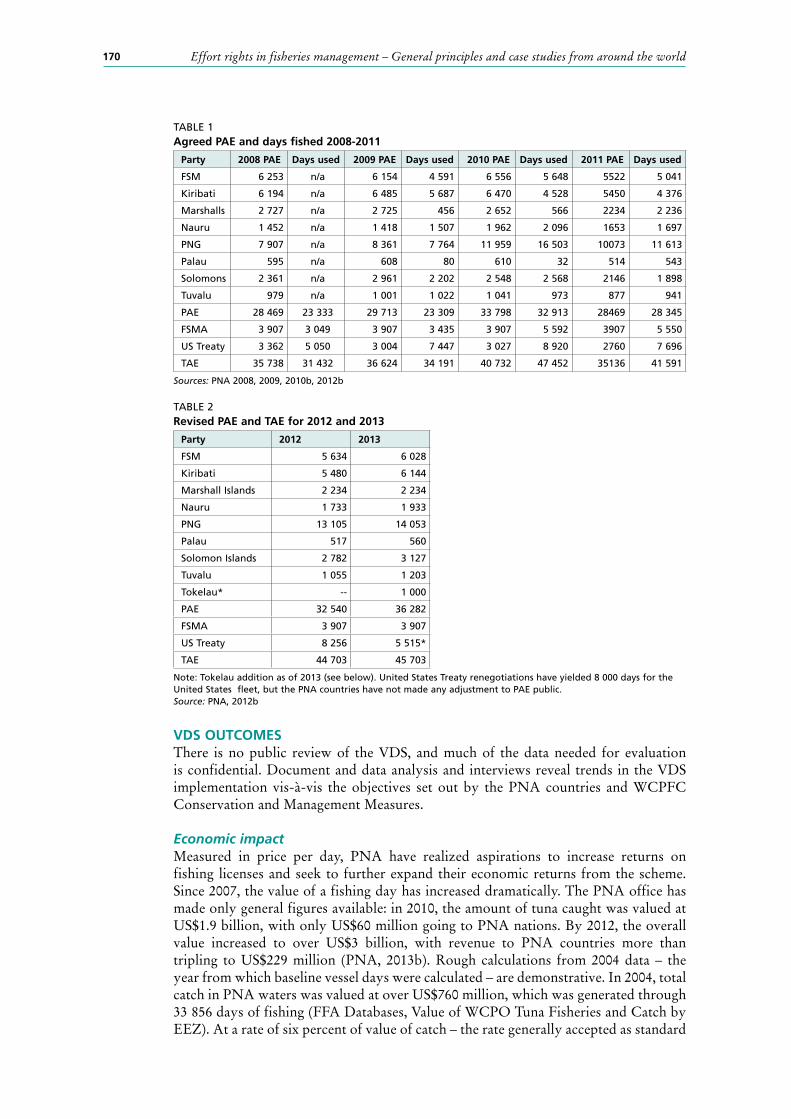
170 Effort rights in fisheries management – General principles and case studies from around the world
TABLE 1Agreed PAE and days fished 2008-2011
Party 2008 PAE Days used 2009 PAE Days used 2010 PAE Days used 2011 PAE Days used
FSM 6 253 n/a 6 154 4 591 6 556 5 648 5522 5 041
Kiribati 6 194 n/a 6 485 5 687 6 470 4 528 5450 4 376
Marshalls 2 727 n/a 2 725 456 2 652 566 2234 2 236
Nauru 1 452 n/a 1 418 1 507 1 962 2 096 1653 1 697
PNG 7 907 n/a 8 361 7 764 11 959 16 503 10073 11 613
Palau 595 n/a 608 80 610 32 514 543
Solomons 2 361 n/a 2 961 2 202 2 548 2 568 2146 1 898
Tuvalu 979 n/a 1 001 1 022 1 041 973 877 941
PAE 28 469 23 333 29 713 23 309 33 798 32 913 28469 28 345
FSMA 3 907 3 049 3 907 3 435 3 907 5 592 3907 5 550
US Treaty 3 362 5 050 3 004 7 447 3 027 8 920 2760 7 696
TAE 35 738 31 432 36 624 34 191 40 732 47 452 35136 41 591
Sources: PNA 2008, 2009, 2010b, 2012b
TABLE 2Revised PAE and TAE for 2012 and 2013
Party 2012 2013
FSM 5 634 6 028
Kiribati 5 480 6 144
Marshall Islands 2 234 2 234
Nauru 1 733 1 933
PNG 13 105 14 053
Palau 517 560
Solomon Islands 2 782 3 127
Tuvalu 1 055 1 203
Tokelau* -- 1 000
PAE 32 540 36 282
FSMA 3 907 3 907
US Treaty 8 256 5 515*
TAE 44 703 45 703
Note: Tokelau addition as of 2013 (see below). United States Treaty renegotiations have yielded 8 000 days for the United States fleet, but the PNA countries have not made any adjustment to PAE public.Source: PNA, 2012b
VDS OUTCOMESThere is no public review of the VDS, and much of the data needed for evaluation is confidential. Document and data analysis and interviews reveal trends in the VDS implementation vis-à-vis the objectives set out by the PNA countries and WCPFC Conservation and Management Measures.
Economic impact Measured in price per day, PNA have realized aspirations to increase returns on fishing licenses and seek to further expand their economic returns from the scheme. Since 2007, the value of a fishing day has increased dramatically. The PNA office has made only general figures available: in 2010, the amount of tuna caught was valued at US$1.9 billion, with only US$60 million going to PNA nations. By 2012, the overall value increased to over US$3 billion, with revenue to PNA countries more than tripling to US$229 million (PNA, 2013b). Rough calculations from 2004 data – the year from which baseline vessel days were calculated – are demonstrative. In 2004, total catch in PNA waters was valued at over US$760 million, which was generated through 33 856 days of fishing (FFA Databases, Value of WCPO Tuna Fisheries and Catch by EEZ). At a rate of six percent of value of catch – the rate generally accepted as standard
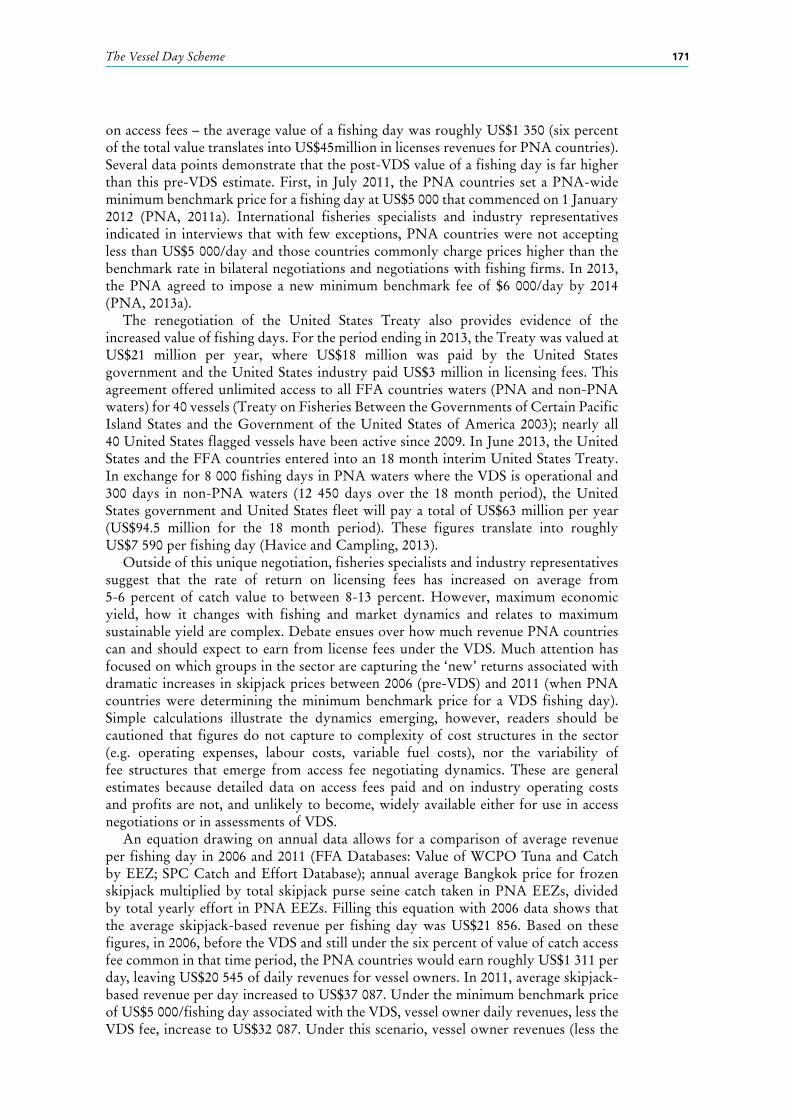
171The Vessel Day Scheme
on access fees – the average value of a fishing day was roughly US$1 350 (six percent of the total value translates into US$45million in licenses revenues for PNA countries).Several data points demonstrate that the post-VDS value of a fishing day is far higher than this pre-VDS estimate. First, in July 2011, the PNA countries set a PNA-wide minimum benchmark price for a fishing day at US$5 000 that commenced on 1 January 2012 (PNA, 2011a). International fisheries specialists and industry representatives indicated in interviews that with few exceptions, PNA countries were not accepting less than US$5 000/day and those countries commonly charge prices higher than the benchmark rate in bilateral negotiations and negotiations with fishing firms. In 2013, the PNA agreed to impose a new minimum benchmark fee of $6 000/day by 2014 (PNA, 2013a).
The renegotiation of the United States Treaty also provides evidence of the increased value of fishing days. For the period ending in 2013, the Treaty was valued at US$21 million per year, where US$18 million was paid by the United States government and the United States industry paid US$3 million in licensing fees. This agreement offered unlimited access to all FFA countries waters (PNA and non-PNA waters) for 40 vessels (Treaty on Fisheries Between the Governments of Certain Pacific Island States and the Government of the United States of America 2003); nearly all 40 United States flagged vessels have been active since 2009. In June 2013, the United States and the FFA countries entered into an 18 month interim United States Treaty. In exchange for 8 000 fishing days in PNA waters where the VDS is operational and 300 days in non-PNA waters (12 450 days over the 18 month period), the United States government and United States fleet will pay a total of US$63 million per year (US$94.5 million for the 18 month period). These figures translate into roughly US$7 590 per fishing day (Havice and Campling, 2013).
Outside of this unique negotiation, fisheries specialists and industry representatives suggest that the rate of return on licensing fees has increased on average from 5-6 percent of catch value to between 8-13 percent. However, maximum economic yield, how it changes with fishing and market dynamics and relates to maximum sustainable yield are complex. Debate ensues over how much revenue PNA countries can and should expect to earn from license fees under the VDS. Much attention has focused on which groups in the sector are capturing the ‘new’ returns associated with dramatic increases in skipjack prices between 2006 (pre-VDS) and 2011 (when PNA countries were determining the minimum benchmark price for a VDS fishing day). Simple calculations illustrate the dynamics emerging, however, readers should be cautioned that figures do not capture to complexity of cost structures in the sector (e.g. operating expenses, labour costs, variable fuel costs), nor the variability of fee structures that emerge from access fee negotiating dynamics. These are general estimates because detailed data on access fees paid and on industry operating costs and profits are not, and unlikely to become, widely available either for use in access negotiations or in assessments of VDS.
An equation drawing on annual data allows for a comparison of average revenue per fishing day in 2006 and 2011 (FFA Databases: Value of WCPO Tuna and Catch by EEZ; SPC Catch and Effort Database); annual average Bangkok price for frozen skipjack multiplied by total skipjack purse seine catch taken in PNA EEZs, divided by total yearly effort in PNA EEZs. Filling this equation with 2006 data shows that the average skipjack-based revenue per fishing day was US$21 856. Based on these figures, in 2006, before the VDS and still under the six percent of value of catch access fee common in that time period, the PNA countries would earn roughly US$1 311 per day, leaving US$20 545 of daily revenues for vessel owners. In 2011, average skipjack-based revenue per day increased to US$37 087. Under the minimum benchmark price of US$5 000/fishing day associated with the VDS, vessel owner daily revenues, less the VDS fee, increase to US$32 087. Under this scenario, vessel owner revenues (less the
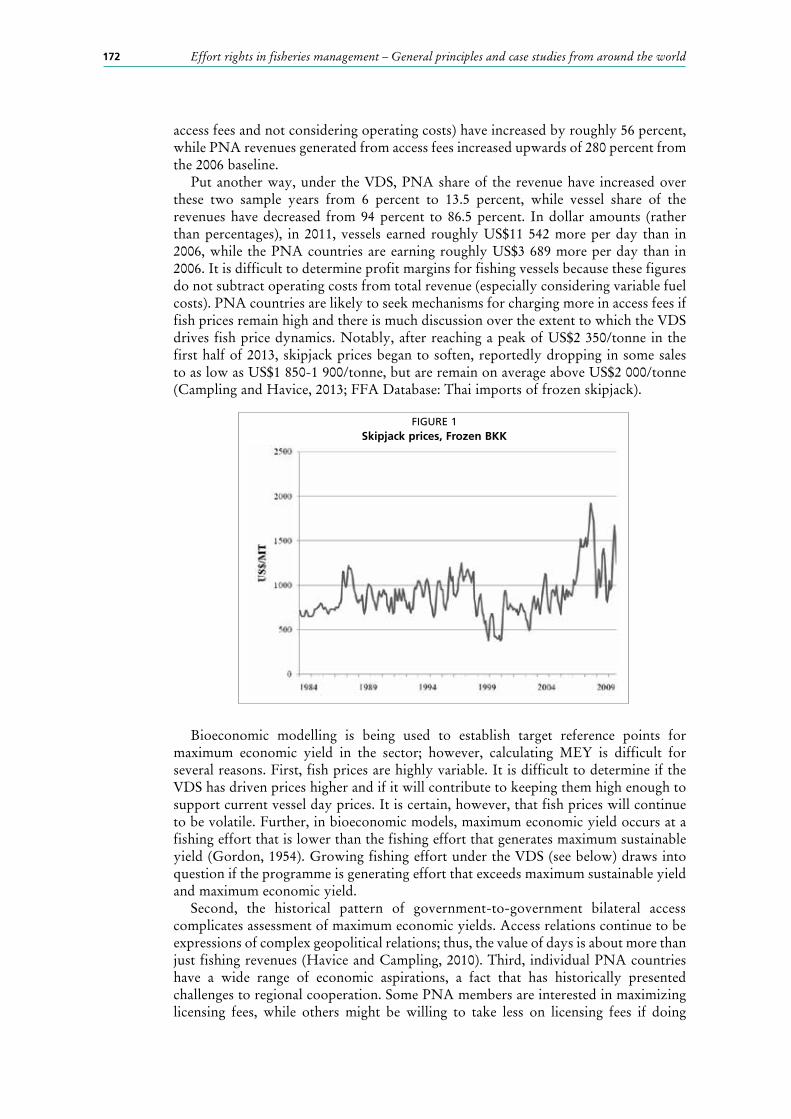
172 Effort rights in fisheries management – General principles and case studies from around the world
access fees and not considering operating costs) have increased by roughly 56 percent, while PNA revenues generated from access fees increased upwards of 280 percent from the 2006 baseline.
Put another way, under the VDS, PNA share of the revenue have increased over these two sample years from 6 percent to 13.5 percent, while vessel share of the revenues have decreased from 94 percent to 86.5 percent. In dollar amounts (rather than percentages), in 2011, vessels earned roughly US$11 542 more per day than in 2006, while the PNA countries are earning roughly US$3 689 more per day than in 2006. It is difficult to determine profit margins for fishing vessels because these figures do not subtract operating costs from total revenue (especially considering variable fuel costs). PNA countries are likely to seek mechanisms for charging more in access fees if fish prices remain high and there is much discussion over the extent to which the VDS drives fish price dynamics. Notably, after reaching a peak of US$2 350/tonne in the first half of 2013, skipjack prices began to soften, reportedly dropping in some sales to as low as US$1 850-1 900/tonne, but are remain on average above US$2 000/tonne (Campling and Havice, 2013; FFA Database: Thai imports of frozen skipjack).
Bioeconomic modelling is being used to establish target reference points for maximum economic yield in the sector; however, calculating MEY is difficult for several reasons. First, fish prices are highly variable. It is difficult to determine if the VDS has driven prices higher and if it will contribute to keeping them high enough to support current vessel day prices. It is certain, however, that fish prices will continue to be volatile. Further, in bioeconomic models, maximum economic yield occurs at a fishing effort that is lower than the fishing effort that generates maximum sustainable yield (Gordon, 1954). Growing fishing effort under the VDS (see below) draws into question if the programme is generating effort that exceeds maximum sustainable yield and maximum economic yield.
Second, the historical pattern of government-to-government bilateral access complicates assessment of maximum economic yields. Access relations continue to be expressions of complex geopolitical relations; thus, the value of days is about more than just fishing revenues (Havice and Campling, 2010). Third, individual PNA countries have a wide range of economic aspirations, a fact that has historically presented challenges to regional cooperation. Some PNA members are interested in maximizing licensing fees, while others might be willing to take less on licensing fees if doing
FIGURE 1Skipjack prices, Frozen BKK
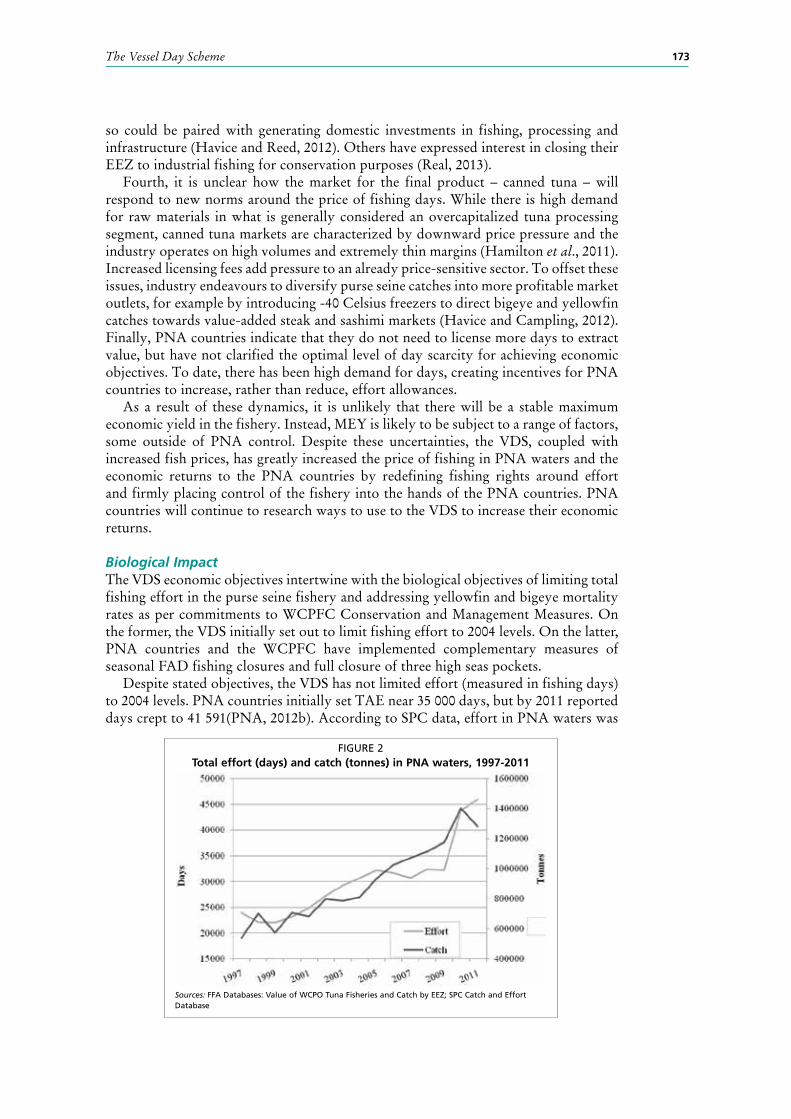
173The Vessel Day Scheme
so could be paired with generating domestic investments in fishing, processing and infrastructure (Havice and Reed, 2012). Others have expressed interest in closing their EEZ to industrial fishing for conservation purposes (Real, 2013).
Fourth, it is unclear how the market for the final product – canned tuna – will respond to new norms around the price of fishing days. While there is high demand for raw materials in what is generally considered an overcapitalized tuna processing segment, canned tuna markets are characterized by downward price pressure and the industry operates on high volumes and extremely thin margins (Hamilton et al., 2011). Increased licensing fees add pressure to an already price-sensitive sector. To offset these issues, industry endeavours to diversify purse seine catches into more profitable market outlets, for example by introducing -40 Celsius freezers to direct bigeye and yellowfin catches towards value-added steak and sashimi markets (Havice and Campling, 2012). Finally, PNA countries indicate that they do not need to license more days to extract value, but have not clarified the optimal level of day scarcity for achieving economic objectives. To date, there has been high demand for days, creating incentives for PNA countries to increase, rather than reduce, effort allowances.
As a result of these dynamics, it is unlikely that there will be a stable maximum economic yield in the fishery. Instead, MEY is likely to be subject to a range of factors, some outside of PNA control. Despite these uncertainties, the VDS, coupled with increased fish prices, has greatly increased the price of fishing in PNA waters and the economic returns to the PNA countries by redefining fishing rights around effort and firmly placing control of the fishery into the hands of the PNA countries. PNA countries will continue to research ways to use to the VDS to increase their economic returns.
Biological ImpactThe VDS economic objectives intertwine with the biological objectives of limiting total fishing effort in the purse seine fishery and addressing yellowfin and bigeye mortality rates as per commitments to WCPFC Conservation and Management Measures. On the former, the VDS initially set out to limit fishing effort to 2004 levels. On the latter, PNA countries and the WCPFC have implemented complementary measures of seasonal FAD fishing closures and full closure of three high seas pockets.
Despite stated objectives, the VDS has not limited effort (measured in fishing days) to 2004 levels. PNA countries initially set TAE near 35 000 days, but by 2011 reported days crept to 41 591(PNA, 2012b). According to SPC data, effort in PNA waters was
FIGURE 2Total effort (days) and catch (tonnes) in PNA waters, 1997-2011
Sources: FFA Databases: Value of WCPO Tuna Fisheries and Catch by EEZ; SPC Catch and Effort Database
174 Effort rights in fisheries management – General principles and case studies from around the world
higher, roughly 45 730 days (SPC Catch and Effort Database)7. Across the Pacific, fishing effort in 2011 was the highest in history (Figure 2).
The total number of purse seine vessels (and thus total fishing capacity) active across the WCPFC region (including in PNA waters) has increased dramatically in recent years from a stable 180-220 vessel from 1990-2006 under the limited entry programme, to an all-time high of 297 vessels in 2012 under the VDS (WCPFC Scientific Committee 2012, 2013a). The Pacific island fleets have increased significantly in numbers, growing to 94 vessels in 2012 (ibid). Of this, FSM Arrangement vessels have increased rapidly. In 2001 there were 16 FSMA licensed vessels, 30 in 2010, 37 in 2011. By mid-2012, the PNA countries had licensed 53 FSMA vessels (FFA Database: FSMA Vessels).As a result, 2010 effort is estimated to be approximately 18 percent higher than 2004 effort. VMS data for 2011 indicate a further increase in effort of 11 percent over 2010 and 31 percent over 2004 levels (SPC-OFP, 2012); provisional purse seine effort in 2012 was the second highest on record, only slightly less than 2011 (WCPFC Scientific Committee 2012, 2013a). Even following these dramatic increases, at the time of writing there were reports that an additional 45 purse seine vessels were under construction and looking to enter into the WCPO fishery (Radio New Zealand International, 2013).
The FAD closure – not explicitly a component of the VDS – has met with more success, though it is not yet possible to determine the ecological impact of the regulation. The incidence of reported drifting FAD-related activity was considerably lower during the FAD closure in the periods 2010-2012 (5.6, 9.6 and 3.2 percent respectively) compared with 2009 (19.2 percent). During the 2010 closure, skipjack and yellowfin catches were moderately reduced, bigeye catches were strongly reduced and the average size of individual fish caught was higher for all species, particularly yellowfin (WCPFC Scientific Committee 2012, 2013b). Overall, the reduction in purse seine FAD effort accounted for 67 percent of the overfishing that was removed in 2010 (SPC-OFP, 2012). Despite these apparent improvements, the success of the FAD closure is uncertain and varies from year to year. 2011 saw the highest number of FAD sets in the history of the fishery, a record attributed to overall increased purse seine effort (WCPFC Scientific Committee, 2013b). If the VDS has created incentives to intensify effort on FADs in order maximize take for each fishing day (a classic challenge associated with input control), then the closure is likely insufficient to address ecological challenges in the fishery.
Given the multiple factors that determine stock assessments, it is not possible to determine the biological effects of these changes. However, fishing effort and capacity have increased, posing problems for compliance with WCPFC Conservation and Management Measures. Increasing capacity and a growing number of vessels will continue to pressure PNA countries to open more fishing days and create incentives for vessels to maximize catch for each fishing day. This means that protecting yellowfin and bigeye stocks will likely require longer FAD closures, careful attention to catch patterns outside of the FAD closure period and perhaps innovation for more selective gear types and fishing methods.
STRENGTHS AND CHALLENGES ASSOCIATED WITH THE VDSIn addition to the increased value of fishing days, perhaps the biggest gain has been in data reporting. The VDS has had positive impacts on the data quality by improving
7 All figures exclude catch in archipelagic waters. The regulation of archipelagic waters is outside of the legal scope of the VDS and the WCPFC. It is instead at the discretion of individual countries because of the high level of sovereignty within these waters accorded by international law. In 2011, there were 8 117 days fished in PNA archipelagic waters, up from 5 730 days in 2010 and 6 462 days in 2009 (SPC Catch and Effort Database).
175The Vessel Day Scheme
logsheet data and requiring 100 percent observer coverage that has enabled the Scientific Committee to extend its stock assessments. Enhanced data has revealed that prior to observer coverage; vessels were over-reporting skipjack catches and under-reporting yellowfin and bigeye catches. VMS, observer and logsheet reporting has validated vessel activity and helped to interpret tag recapture data. Fleets (with the exception of Japan) have complied with PNA port-to-port reporting requirements, even for trips through the high seas (prior to the 2010 high sea closures). More complete data coverage has enabled the WCPFC Scientific Committee to statistically inflate data, model full coverage of fishing activity and correct historical errors (International fisheries specialist, personal communication 2012).
In 2011, several PNA countries traded vessel days with each other suggesting that this feature of the effort scheme is capable of reflecting seasonal abundance of fish populations and variable demand for access to PNA EEZs. PNA countries have not made details on the numbers of days traded or their price publically available. Though industry would like to be permitted to trade fishing days, such a move is unlikely since it would reduce PNA countries’ control over days. Also in 2011, Nauru, Solomon Islands and Tuvalu closed their EEZs upon the exhaustion of their allocated fishing days, evidence that these countries are enforcing their allotted PAE (PNA, 2011b). If other Parties also close their EEZ the scheme will impose the day scarcity that might drive prices higher and protect resources.
Despite these gains, major challenges remain. The lack of a firm cap and enforcement of the day limit has lead total number of fishing days to expand rapidly. For example, while some countries closed their EEZs upon exhaustion of their days in 2011, in 2012, Kiribati reportedly significantly exceeded its Party Allowable Effort by selling many more fishing days than it had been allocated; official figures should be reported in the December regular meeting of the WCPFC. In response, in 2013 all eight PNA countries signed an agreement to abide by fishing limits and agreed to contribute to work towards imposing and enforcing the hard limit on total fishing days (PNA, 2013c). However, very high and fishing pressure in 2013 will test the limits of the renewed commitment.
The technical definition of a fishing day has also proved a challenge. In the original text of the VDS, a fishing day was defined simply as a day when a vessel was not in port. The only exception for being charged a fishing day was when the vessel was in transit through a PNA country’s water – an exception primarily for the Japanese fleets that have historically been required to return to their home ports to offload catch (Campling et al., 2007). To use the exception, vessels were required to apply in advance, in writing, in a prescribed form. However, according to several industry informants and international fisheries specialists (Personal communication, 2012), shortly after the implementation of the scheme, vessels began to exploit this exception, declaring that they were in transit while they were likely searching for fish.
Noting these dynamics, the PNA countries began to redefine and specify conditions of a fishing day versus a ‘non-fishing’ day. The Parties have reportedly added exemptions to being charged for a fishing day for things like: bad weather, transit time, time in port and mechanical problems. Further, according to international fisheries specialists, several countries have reportedly begun to charge portions of fishing days. In some cases, vessels are claiming to fish only half days, or a third of a day and in turn, are debited for their ‘non-fishing’ time, despite that allocation is based on a 24 hour day. According to the Scientific Committee (Personal communication, 2012), such non-fishing/partial fishing day claims have contributed significantly to the increase in effort.
Data monitoring and enforcement ambiguity weakens the VDS, not least because it creates confusion. Industry expressed a desire for: consistency so that are clear on what they are purchasing when they buy a day; detailed prescriptions for managing
176 Effort rights in fisheries management – General principles and case studies from around the world
VMS data and outages and; uniform and transparent policies on EEZ border data. In response, the PNA committed to a new ‘day’ definition that went into effect beginning in the 2013 management year. According to the new definition, there will be no portioning into partial days, a fishing day will be based on a 24 hour period, and vessels will be charged if there is any fishing activity. To claim a non-fishing day, vessels will have to be only drifting/floating and have all gear stowed (Havice and Campling, 2012). If these criteria are enforced uniformly, ‘non-fishing’ days are expected to diminish greatly.
Other forms of ambiguity are present in the scheme. For example, fishing days charged per vessel are broken down according to vessel length. Vessels less than 50 meters in length are charged for a half of a fishing day; vessels 50-80 meters are charge for a full fishing day, and vessels greater than 80 meters are charged 1.5 fishing days. This metric is based on an analysis of the relationship between vessel length and observed catch per unit effort. However, when the PNA did their initial TAE, they did not account for the size difference in vessels. As a result, some countries captured a significant benefit from this allocation. Several small vessels fish in PNG’s waters; these vessels have a full fishing day, but PNG has to account for only a half of a fishing day, which gives it more days to sell. Arguably, well capacity regulations, such as that employed in the Inter-American Tropical Tuna Commission, are a more direct approximation of vessel capacity.
An additional challenge has recently emerged for the VDS. Non-PNA countries in the region are interested in defining fishing rights for the purse seine fishery in the same way that the PNA countries have. In mid-2012, Tokelau joined the VDS, though it is not a Party to the Nauru Agreement. Information on the procedures associated with Tokelau’s entrance into the scheme is not publically available, but Tokelau claimed 1 000 fishing days, which were added to TAE (PNA, 2012b). It does not appear that the PAE formula was used to determine Tokelau’s allocation and on average, annual effort in Tokelau’s EEZ is well below 1 000 days (SPC Catch and Effort Database). This suggests that Tokelau will not be able to sell all of its days for fishing in its own EEZ. Instead, the country’s interest joining the scheme is likely to sell its days to those PNA countries that do not have enough days to meet demand for fishing in their waters. As a result, Tokelau will earn new revenues by selling days to other PNA countries, and those PNA countries purchasing Tokelau’s days will further expand effort in their EEZs. Other Pacific Island countries are likely to be interested in earning new revenues by joining the VDS; if they join in the same manner, the addition of new vessel days will further increase effort.
In sum, the VDS has generated improvements in data collection, but faces more work in limiting total effort, creating conditions of licensing scarcity and defining the terms and conditions of the VDS in ways that are consistent and technically feasible.
CONCLUSIONSThe Parties to the Nauru Agreement have incrementally strengthened their rights over the shared fishery. Most recently, their efforts have led to the development of a transferable effort scheme. The VDS has shifted control over rights into the hands of the PNA members, reorganizing industry norms and generating significantly higher licensing fees than was the case under the limited entry programme that pre-dated the VDS. However, the value of a fishing day will continue to be influenced by multiple factors, some of which are outside of PNA countries’ control, such as: fuel and fish prices, market dynamics and the internal political will of the PNA group to enforce individual countries’ PAEs in the regional management system.
On the biological front, the reporting requirements associated with the VDS have improved data provision, enabling the WCPFC Scientific Committee to refine biological and bioeconomic models. Despite this victory, the scheme has not developed
177The Vessel Day Scheme
a firm cap on effort and has overseen significant increases in effort and capacity. The complementary seasonal FAD fishing closure has reduced catch of yellowfin and bigeye during the closure, but has not permanently diminished the overall number of FAD sets. These dynamics point to a general shortcoming of effort control systems as opposed to quota control systems; they are not capable of addressing species-specific concerns in a multi-species, multi-jurisdictional industrial fishery.
The trends associated with the VDS help to place effort control on the spectrum of right-based management approaches. It reveals that while effort control can significantly strengthen rights in fisheries systems with fewer monitoring and control capacity requirements than are needed to enforce catch quota systems, it is an ill-defined metric that is difficult to match with conservation objectives in a multi-species fishery. In addition to these technical components, political issues strongly influence the VDS: there is concern over the willingness of the PNA countries to close licensing loopholes – such as FSM Arrangement licensing, charging vessels for portions of fishing days or blatant disregard of PAEs – that have ballooned total effort. In the VDS, as in all effort-based management schemes, tightening regulations, clarifying the technical components and commitment to a firm effort cap are critical to yielding economic and biological goals.
Acknowledgements: An earlier version of this paper was presented at the Inter-disciplinary Workshop on the Management, Economics and Biology of Transferable Effort Rights-Based Management in Bilbao, Spain in September 2012. The current draft updates data published in Marine Policy (Havice, 2013). I thank James Duff, John Hampton, Patrice Guillotreau, Dale Squires and workshop participants and an anonymous reviewer for valuable comments and feedback on an earlier draft and to Amanda Henley for carefully making the map. Remaining errors are my own.
REFERENCESAllen, R., Bayliff, W., Joseph J. &, Squires, D. 2010. Rights-based management in
transnational tuna fisheries. In R. Allen, J. Joseph & D. Squires, eds. Conservation and management of transnational tuna fisheries, pp. 65-86. Ames, Wiley-Blackwell. 343 pp.
Aqorau, T. 2009. Recent developments in Pacific tuna fisheries: the Palau Arrangement and the Vessel Day Scheme. The International Journal of Marine and Coastal Law, 24(3): 557-581.
Beddington, J.R., Agnew, D.J. & Clark, C.W. 2007. Current problems in the management of marine fisheries. Science, 316 (5832): 1713-1716.
Campling, L. & Havice, E. 2013. Skipjack price volatility felt across industry segments. FFA Fisheries Trade News 6(4).
Campling L., Havice, E. & Ram-Bidesi, V. 2007. Pacific Island countries, the global tuna industry and the international trade regime - a guidebook. Honiara, Pacific Islands Forum Fisheries Agency.
CCM 2005-01. Conservation and Management Measures for Bigeye and Yellowfin Tuna in the Western and Central Pacific Ocean. Western and Central Pacific Fisheries Commission, Pohnpei, Federated States of Micronesia.
Dunn, S., Rodwell, L. & Joseph, G. 2006. The Palau Arrangement for the Management of the Western Pacific Purse Seine Fishery - Management Scheme (Vessel Day Scheme). Perth: Sharing the Fish Conference.
FAO. 2002. Report of the Expert Consultation on Catalyzing the Transition Away from Overcapacity in Marine Capture Fisheries. Rome. 90 pp. (also available at ftp://ftp.fao.org/docrep/fao/005/y8169e/y8169e00.pdf)
Geen, G. 2000. A review of tuna management arrangements in the Central Western Pacific. Honaira, South Pacific Forum Fisheries Agency.
Gillett, R. & Lightfoot, C. 2001. The contribution of fisheries to the economies of Pacific Island countries. Manila, Asian Development Bank.
178 Effort rights in fisheries management – General principles and case studies from around the world
Gordon, H.S. 1954. The economic theory of a common property resource: the fishery. Journal of Political Economy, 62(2): 124-42.
Grynberg, R. 2003. WTO fisheries subsidies negotiations: implications for fisheries access arrangements and sustainable management. Marine Policy, 27(6): 499-511.
Hamilton, A., Lewis, A., McCoy, M., Havice, E. & Campling, L. 2011. Market and industry dynamics in the global tuna supply chain. Honiara, Pacific Islands Forum Fisheries Agency.
Hardin, G. 1968. The tragedy of the commons. Science, 162 (3859): 1243-48.Harley, S., Williams, P., Nicol, S. & Hampton J. 2012. The Western and Central Pacific
Tuna Fishery: 2010 Overview and Status of Stocks. Busan, WCPFC Scientific Committee Eighth Regular Session.
Havice, E. 2009. Shifting tides: the political economy of tuna extraction in the Western and Central Pacific Ocean. Department of Economics, University of California, Berkeley. (Doctoral Dissertation).
Havice, E. 2010. The structure of tuna access agreements in the Western and Central Pacific Ocean: Lessons for vessel day scheme planning. Marine Policy, 34(5): 979-87.
Havice, E. 2013. Rights-based management in the Western and Central Pacific Ocean tuna fishery: economic and environmental change under the Vessel Day Scheme. Marine Policy, 42(November): 259-67.
Havice, E. & Campling, L. 2009. Pacific island countries seek to reframe relations with distant water fishing nations and fleets. FFA Fisheries Trade News, 2(8).
Havice, E. & Campling, L. 2010. Shifting tides in the Western Central Pacific Ocean tuna fishery: The political economy of regulation and industry responses. Global Environmental Politics, 10(1): 89-114.
Havice, E. & Campling, L. 2012. Recent developments in the Pacific Islands’ tuna fishery. FFA Fisheries Trade News, 5(4).
Havice, E. & Campling, L. 2013. Interim United States Treaty comes into effect. FFA Fisheries Trade News, 6(3).
Havice, E. & Reed, K. 2012. Fishing for development? Tuna resource access and industrial change in Papua New Guinea. Journal of Agrarian Change, 12 (2&3): 413-35.
Inter-American Tropical Tuna Commission & World Bank. 2008. Report of a workshop on rights-based management and buybacks in international tuna fisheries. La Jolla, IATTC and World Bank.
PNA. 2008. Vessel Day Scheme (VDS) report to the Fifth Regular Session of the Western and Central Pacific Fisheries Commission (WCPFC5). Busan, Western and Central Pacific Fisheries Commission Fifth Regular Session.
PNA. 2009. Vessel Day Scheme (VDS) report to the Sixth Regular Session of the Western and Central Pacific Fisheries Commission (WCPFC6). Papeete, Western and Central Pacific Fisheries Commission Sixth Regular Session.
PNA. 2010a. A Third Arrangement Implementing the Nauru Agreement Setting Forth Additional Terms and Conditions of Access to the Fisheries Zones of the Parties. Parties to the Nauru Agreement, Majuro, Marshall Islands.
PNA. 2010b. Vessel Day Scheme (VDS) report to the Seventh Regular Session of the Western and Central Pacific Fisheries Commission (WCPFC7). Honolulu, Western and Central Pacific Fisheries Commission Seventh Regular Session.
PNA. 2011a. PNA ministers decide: time for fishing nations to take their own conservation action, pay for fishing days, and for the world to celebrate tuna. Press Release.
PNA. 2011b. Three PNA countries have closed their waters to foreign tuna fleets. Press Release.
PNA. 2012a. Report of the Parties to the Nauru Agreement. Parties to the Nauru Agreement, Majuro, Marshall Islands.
179The Vessel Day Scheme
PNA. 2012b. Vessel Day Scheme (VDS) report to the Eighth Regular Session of the Western and Central Pacific Fisheries Commission (WCPFC8). Guam, Western and Central Pacific Fisheries Commission Eighth Regular Session.
PNA. 2013a. PNA’s fisheries management triples revenue to its Pacific members. Press Release.
PNA. 2013b. Outcomes from PNA annual meetings 25 Feb – 1 March. Press Release.PNA. 2013c. Resolution on renewed commitment to cooperation in fisheries management
and development. PNA Resolution 01-2013.Radio New Zealand International. 2013. Tuna commission warns of new quotas and
difficult decisions ahead of meeting. Auckland, New Zealand.Real, N. 2013. President proposes banning all commercial fishing. FIS, 18 March.SPC-OFP. 2012. Review of the implementation and effectiveness of CMM 2008-01. Bussan,
WCPFC Scientific Committee Eighth Regular Session.Shanks, S. 2010. Introducing a transferable fishing day management regime for Pacific
Island countries. Marine Policy, 34 (5): 988-94.World Bank, Scientific Committee.2012. Conservation and Management Measures for
Bigeye, Yellowfin and Skipjack in the Western and Central Pacific Ocean: CMM 2012-01. Manila, Western and Central Pacific Fisheries Commission, Ninth Regular Session.
World Bank, Scientific Committee. 2012. Overview of tuna fisheries in the Western and Central Pacific Ocean, including economic conditions – 2011. Busan, WCPFC Scientific Committee Eighth Regular Session.
World Bank, Scientific Committee. 2013a. Overview of tuna fisheries in the Western and Central Pacific Ocean, including economic conditions – 2012. Pohnpei, WCPFC Scientific Committee Ninth Regular Session.
World Bank, Scientific Committee. 2013b. Analysis of the implementation and effectiveness of key management measures for tropical tunas. Pohnpei, WCPFC Scientific Committee Ninth Regular Session.
World Bank, Scientific Committee.2011. The global programme on fisheries strategic plan of action for fisheries and aquaculture. Rome, Agriculture and Rural Development.

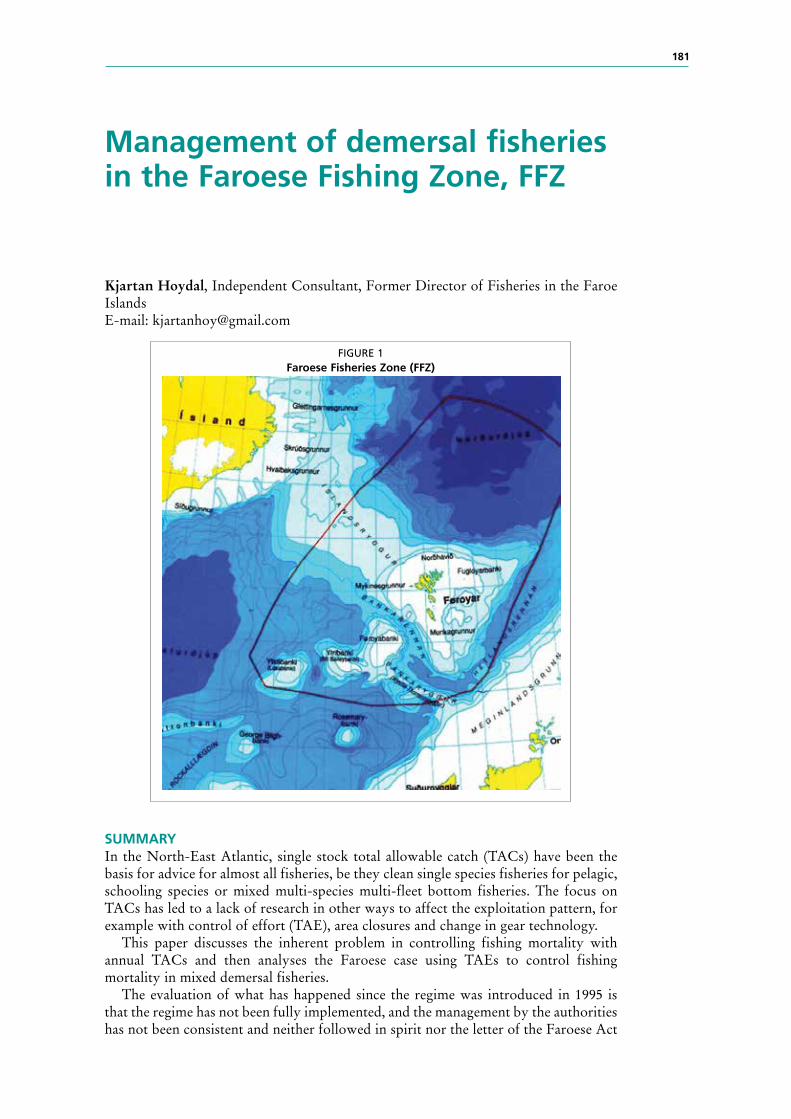
181
Management of demersal fisheries in the Faroese Fishing Zone, FFZ
Kjartan Hoydal, Independent Consultant, Former Director of Fisheries in the Faroe IslandsE-mail: [email protected]
SUMMARYIn the North-East Atlantic, single stock total allowable catch (TACs) have been the basis for advice for almost all fisheries, be they clean single species fisheries for pelagic, schooling species or mixed multi-species multi-fleet bottom fisheries. The focus on TACs has led to a lack of research in other ways to affect the exploitation pattern, for example with control of effort (TAE), area closures and change in gear technology.
This paper discusses the inherent problem in controlling fishing mortality with annual TACs and then analyses the Faroese case using TAEs to control fishing mortality in mixed demersal fisheries.
The evaluation of what has happened since the regime was introduced in 1995 is that the regime has not been fully implemented, and the management by the authorities has not been consistent and neither followed in spirit nor the letter of the Faroese Act
FIGURE 1Faroese Fisheries Zone (FFZ)
182 Effort rights in fisheries management – General principles and case studies from around the world
on Commercial Fisheries. Problems have been encountered, especially in connection with leasing or selling of licences and fishing days between fishing vessel categories and when substituting vessels in the categories. This means that the catchabilities of the vessel categories have changed significantly. This has not been taken into account in the scientific advice since 1995.
BACKGROUND1
Since the mid 1970s, managers in the North-East Atlantic requested one product from the advisory bodies: TACs, to control fishing mortality and keep it at levels deemed sustainable. In the late 1960s and early 1970s, it was by no means evident that this would be what would be required. In the 1950s and early 1960s, focus was on the fishing fleets and the fisheries (Gulland, 19562; Clayden, 19723). Gezelius and Raakjær in their book “Making Fisheries Management work - Implementation of Policies for Sustainable Fishing”,4 describe the lively debate between scientists and managers about how to control fishing mortality. A summary of Chapter 2.3 in their book, “TACs emerge as the dominant management form” is given below:
It was the discussions in the North Atlantic fisheries commissions, International Commission for the Northwest Atlantic Fisheries(ICNAF) and Northeast Atlantic Fisheries Commission(NEAFC), which focused the attention of administrators and scientists on the need to restrict fishing mortality. NEAFC was influenced by discussions in ICNAF. This was to be expected, because a number of European countries were Contracting Parties of both commissions. Both commissions had strong links to the International Council for the Exploration of the Sea (ICES)and Food and Agriculture Organization of the United Nations (FAO).
The increase in fishing effort in the late 1950s and early 1960s in the Northwest Atlantic led scientists in ICES and ICNAF to draw to the attention of managers that a technical measures regime was not sufficient to protect fish stocks against overfishing. Following discussions in ICNAF, William Templeman and John Gulland produced a scientific paper, in which they arrived at the same conclusion and suggested that fishing had to be restricted, either with limitations in effort or catch quotas.
The question of which management form to choose was addressed at the 1966 annual meetings of the two Commissions. ICNAF then established the Working Group on joint Biological and Economic Assessments of Conservation Actions (WGBEAC), which was tasked to evaluate the two management alternatives. WGBEAC was equally divided between biologists and economists, 16 people from FAO, Organisation for Economic Cooperation and Development (OECD) and national fisheries administrations, science and industry.
A system based on regulating effort directly was seen as the most rational approach from an economic point of view, but it was extremely difficult to find a reliable standardised and agreed upon measure for the relationship between fishing effort and fishing mortality. Catch limitations were not seen to entail similar problems, but it was realized that catch quotas could not include discards. The main problem, however, was perceived to be the need to adjust catch quotas annually in order to keep fishing mortality constant, requiring update of scientific data and the willingness of states and
1 Based on Hoydal, K. 2012 The TAC fallacy. Presentation at ICES ASC 2012, Theme session P.2 Clayden, A.D. 1972. Simulation of the changes in abundance of the cod (Gadus morhua L.) and
the distribution of fishing on the north Atlantic. Fish. Invest. Minist. Agric. Fish. Food G.B. (2 Sea Fish.), 271(1):58 p.
3 Gulland, J.A. 1956. On the fishing effort in English demersal fisheries. Fish. Invest. London Series II, Volume 20(5)
4 Gezelius, S.G. & Raakjær, J., eds. 2008. Making Fisheries Management Work. Springer.
183Management of demersal fisheries in the Faroese Fishing Zone, FFZ
industry to adjust. The outcome of the discussions was what came to be the system in the North Atlantic, TACs to protect fish stocks, supplemented by national limited entry licensing schemes to support economic efficiency5.
Sidney Holt has this say in a commentary: “Graham insisted, I think rightly, that controlling fishing effort was the better way to go than setting physical catch limits, and in his last writing, published posthumously, I think my old colleague Ray Beverton clinched that argument.”6
It is not difficult to understand that it is easier to allocate Total Allowable Catches (TACs), than Total Allowable Effort (TAEs), between states. However, the focus on the TACs has meant that information on fishing fleets and their activities and research on other management measures, like technical measures and closed areas, has been put on the back burner.
HOW IS FISHING MORTALITY CONTROLLED IN THE NORTH EAST ATLANTICA large number of fisheries biologists in the North East Atlantic have for the last 4 decades been feeding what has been called “the TAC machine”7 8. The Fishing authorities in Iceland, Norway, the Russian Federation and the EU, as well as Regional Fishing Management Organizations (NEAFC, NASCO) have requested annual TACs from the provider of almost all scientific advice in the region, the International Council for the Exploration of the Sea, ICES.
The only exception is the Fishing Authorities in the Faroe Islands, which since 1996 have run a TAE (Total Allowable Effort) regime for the mixed demersal fisheries for cod, haddock and saithe and other demersal species.
TAC systems can work. We have two of the foremost examples of successful TAC management in the North East Atlantic: The recovery of the Norwegian Spring Spawning (Atlanto-Scandian) herring and the rebuilding of the North East Arctic cod stock to levels even higher than just after the Second World War.
For obvious reasons effort management does not make sense in the pelagic fisheries. In these fisheries, TACs have to be used. The EU has in recent years introduced fishing days on top of the TAC regimes. ICES in its 2012 advice for next year presented options for mixed fisheries in the North Sea. This advice is based on single-stock assessments combined with knowledge on the species composition of catches in North Sea fisheries. Furthermore, ICES has provided multispecies considerations for Baltic Sea fish stocks, which incorporate knowledge on the impacts fish stocks have on each other. These considerations serve as a starting point for a dialogue between ICES and policy makers to foster the development of a multispecies approach to fisheries management in the Baltic9.
PROBLEMS USING TACS, TOTAL ALLOWABLE CATCH REGIMESRaakjær Nielsen (2004) notes “that fisheries policy is based on the assumption that processes and quantification both in biological and social systems are understood and can be predicted. Its mainstream models are based on single stock approaches and are
5 Hoydal, K. 2012 The TAC fallacy. Presentation at ICES ASC 2012, Theme session P.6 Holt, S.J. 2006. Commentary In 10.9.06 Implementing sustainability in EU fisheries through
maximum sustainable yield. Communication from the Commission to the Council and the European Parliament Document Com, 360 final, sub-titled SEC 868. Brussels.
7 Holm, P. & Nielsen, K. N. 2004. The TAC Machine, Appendix B, Working Document 1. In ICES 2004 Report of the Working Group for Fisheries Systems (WGFS) Annual Report. Copenhagen, Denmark.
8 Schwach, V., Bailly, D., Christensen, A.S., Delaney, A.E., Degnbol, P., van Densen, W.L.T., Holm, P., McLay, H.A., Nielsen, K.N., Pastoors, M.A., Reeves, S.A. & Wilson, D.C. 2007. Policy and knowledge in fisheries management: A policy brief. ICES Journal of Marine Science, 64: 798–803.
9 http://www.ices.dk/aboutus/pressrelease/20120730%20ICES_Advice_Press%20release.pdf
184 Effort rights in fisheries management – General principles and case studies from around the world
deterministic or probabilistic because of the precautionary approach. The tendency to add new regulations as new problems are encountered has led to too much focus on micromanagement. The mainstream approach has not respected the limits to precision in predictions and management requirements have bypassed what science can deliver and undermined the acceptance of science by fishermen.” He stresses the need to tackle the basic fishing capacity problems and the need for more simple, transparent and tailor-made management measures to solve specific problems10.
Controlling Fishing mortality - Two ways to use stock assessmentsEstimates of fishing mortality from stock assessments can be used in various ways to underpin management measures aimed at controlling fishing mortality levels. The most common way is to calculate TACs by forecasting the catch corresponding to desired levels of fishing mortality, TAC management. Another approach is to use historical levels of fishing mortality to estimate partial fishing mortalities and catchabilities by fishing vessel categories, link effort to fishing mortality, and allocate effort to each category. The latter approach offers a solution for managing mixed demersal fisheries. In the following two sections I will use assessments of the demersal fisheries in Faroe waters as a case study to describe these two approaches and their problems.
TAC management - the problem of forecastingThe problems in stock assessments and predictions have been discussed regularly, internally in ICES. Bertelsen and Sparholt, 2002,11 in an internal ACFM document, discussed the problem of estimating Spawning Stock Biomass, SSB, in the TAC year. They compared estimates in the year of advice with “true estimates” (i.e. estimates from years in which the estimates of SSB had converged). In their summary they conclude that “six of the most important and best monitored stocks were analysed for correlation between forecasted and realized SSB. The correlation was very low and not significant for any of the stocks.”
The stocks were: North Sea cod, North Sea Plaice, North Sea Sole, North Sea Herring, Central Baltic Cod, and North East Arctic Cod.
In the document reference is made to earlier studies by Brander (1987), Cook et al. (1991), and by Patterson et al. (2000). A study by van Beek and Pastoors (1999) showed that there was no correlation between predicted and realized fishing mortality. Actually, there is quite a literature on the problems of advising on fishing mortality and stock levels and the reasons for not getting it right.
In the ACFM document some explanations are offered, why there is a lack of correlation, but the fact remains that both stock and fishing mortality estimates that are the basis of the annual advice offered to managers, are inherently uncertain and inaccurate.
In addition, they are prone to be affected by factors not taken into account in the assessment. A famous example is reported by the Chair of ACFM in 1986, the late Øyvind Ulltang12, on the advice on North East Arctic Cod in 1986.“A disastrous prediction of golden years...In its 1986 report, ACFM presented a short and medium term prediction for North East Arctic cod, which gave a very optimistic view of the situation, leading to the following comment from ACFM: ACFM stresses again that the present situation offers the possibility to rebuild the spawning stock while increasing catch quotas and, at the same time, reducing fishing mortality gradually towards a level close to Fmax. Unfortunately, all this turned out to be completely wrong. Instead of golden
10 Nielsen, R. 2004. Farec Conference Faroe Islands.11 Bertelsen, M & Sparholt H. 2002. Quality of ACFM advice: How good have forecasts been since
1988? ICES Working Group Document ACFM.12 Hoydal K. 2014. History of ACFM. ICES Cooperative Research Report. (In Press).
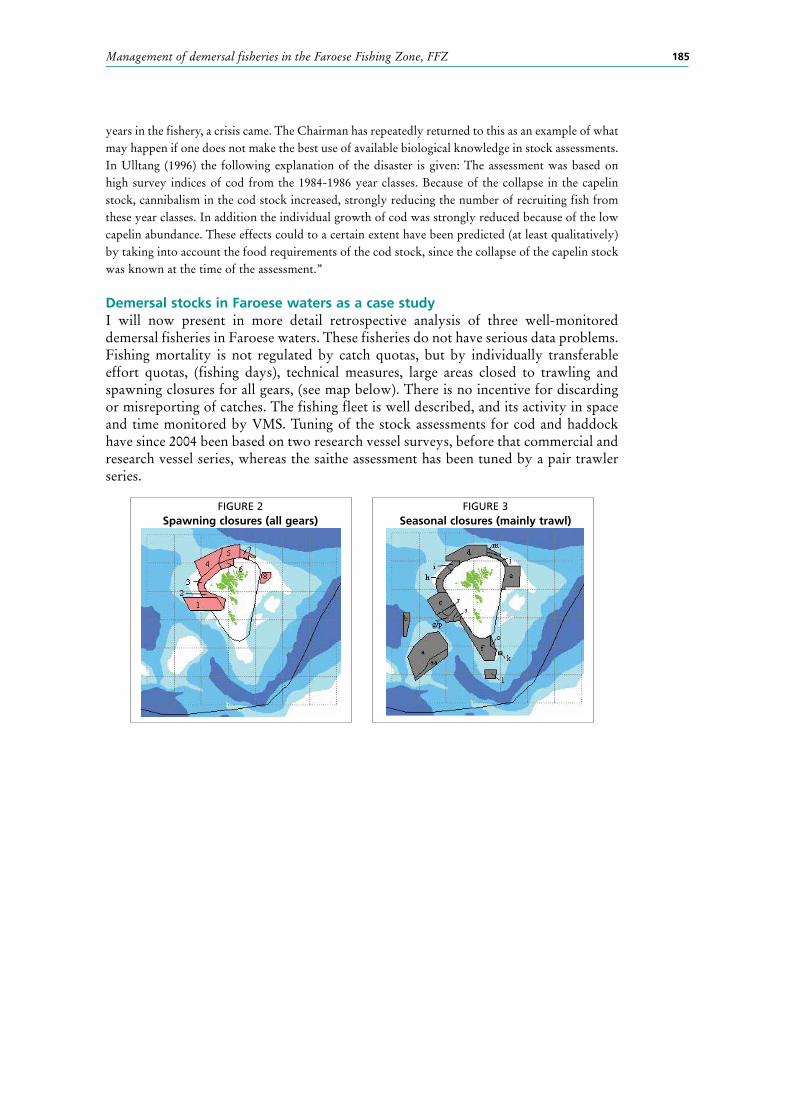
185Management of demersal fisheries in the Faroese Fishing Zone, FFZ
years in the fishery, a crisis came. The Chairman has repeatedly returned to this as an example of what may happen if one does not make the best use of available biological knowledge in stock assessments. In Ulltang (1996) the following explanation of the disaster is given: The assessment was based on high survey indices of cod from the 1984-1986 year classes. Because of the collapse in the capelin stock, cannibalism in the cod stock increased, strongly reducing the number of recruiting fish from these year classes. In addition the individual growth of cod was strongly reduced because of the low capelin abundance. These effects could to a certain extent have been predicted (at least qualitatively) by taking into account the food requirements of the cod stock, since the collapse of the capelin stock was known at the time of the assessment.”
Demersal stocks in Faroese waters as a case studyI will now present in more detail retrospective analysis of three well-monitored demersal fisheries in Faroese waters. These fisheries do not have serious data problems. Fishing mortality is not regulated by catch quotas, but by individually transferable effort quotas, (fishing days), technical measures, large areas closed to trawling and spawning closures for all gears, (see map below). There is no incentive for discarding or misreporting of catches. The fishing fleet is well described, and its activity in space and time monitored by VMS. Tuning of the stock assessments for cod and haddock have since 2004 been based on two research vessel surveys, before that commercial and research vessel series, whereas the saithe assessment has been tuned by a pair trawler series.
FIGURE 2Spawning closures (all gears)
FIGURE 3Seasonal closures (mainly trawl)
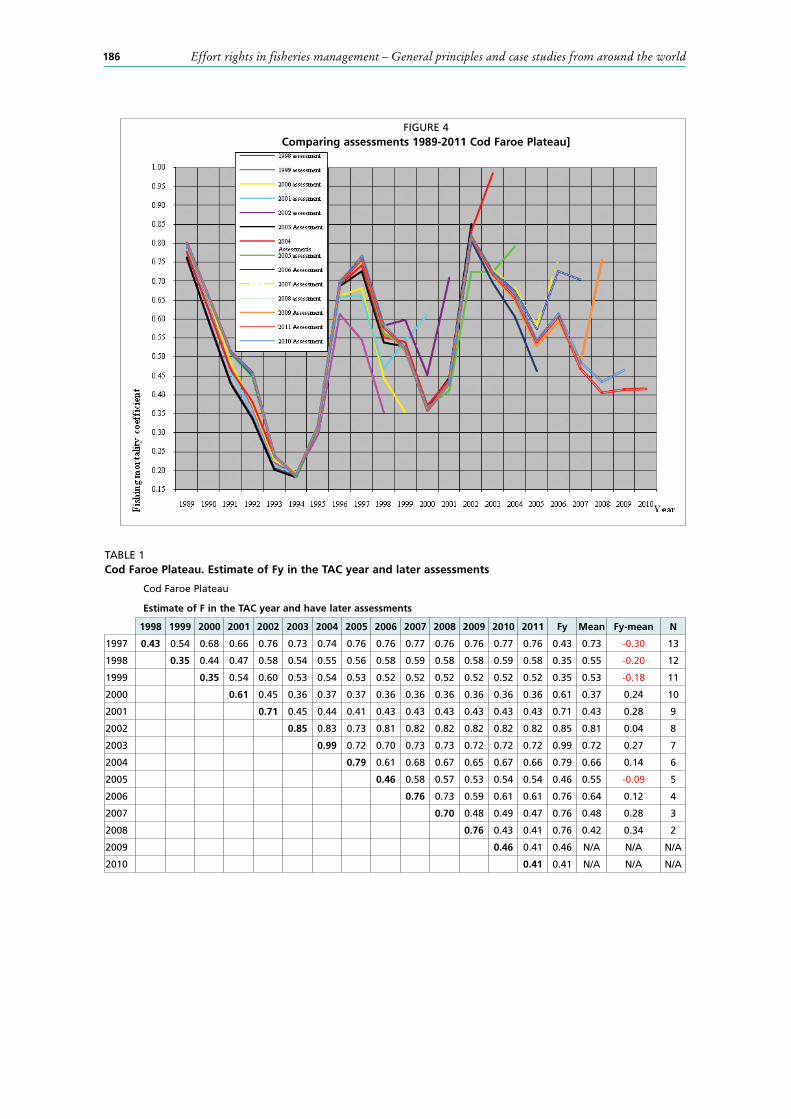
186 Effort rights in fisheries management – General principles and case studies from around the world
FIGURE 4Comparing assessments 1989-2011 Cod Faroe Plateau]
TABLE 1Cod Faroe Plateau. Estimate of Fy in the TAC year and later assessments
Cod Faroe Plateau
Estimate of F in the TAC year and have later assessments
1998 1999 2000 2001 2002 2003 2004 2005 2006 2007 2008 2009 2010 2011 Fy Mean Fy-mean N
1997 0.43 0.54 0.68 0.66 0.76 0.73 0.74 0.76 0.76 0.77 0.76 0.76 0.77 0.76 0.43 0.73 -0.30 13
1998 0.35 0.44 0.47 0.58 0.54 0.55 0.56 0.58 0.59 0.58 0.58 0.59 0.58 0.35 0.55 -0.20 12
1999 0.35 0.54 0.60 0.53 0.54 0.53 0.52 0.52 0.52 0.52 0.52 0.52 0.35 0.53 -0.18 11
2000 0.61 0.45 0.36 0.37 0.37 0.36 0.36 0.36 0.36 0.36 0.36 0.61 0.37 0.24 10
2001 0.71 0.45 0.44 0.41 0.43 0.43 0.43 0.43 0.43 0.43 0.71 0.43 0.28 9
2002 0.85 0.83 0.73 0.81 0.82 0.82 0.82 0.82 0.82 0.85 0.81 0.04 8
2003 0.99 0.72 0.70 0.73 0.73 0.72 0.72 0.72 0.99 0.72 0.27 7
2004 0.79 0.61 0.68 0.67 0.65 0.67 0.66 0.79 0.66 0.14 6
2005 0.46 0.58 0.57 0.53 0.54 0.54 0.46 0.55 -0.09 5
2006 0.76 0.73 0.59 0.61 0.61 0.76 0.64 0.12 4
2007 0.70 0.48 0.49 0.47 0.76 0.48 0.28 3
2008 0.76 0.43 0.41 0.76 0.42 0.34 2
2009 0.46 0.41 0.46 N/A N/A N/A
2010 0.41 0.41 N/A N/A N/A
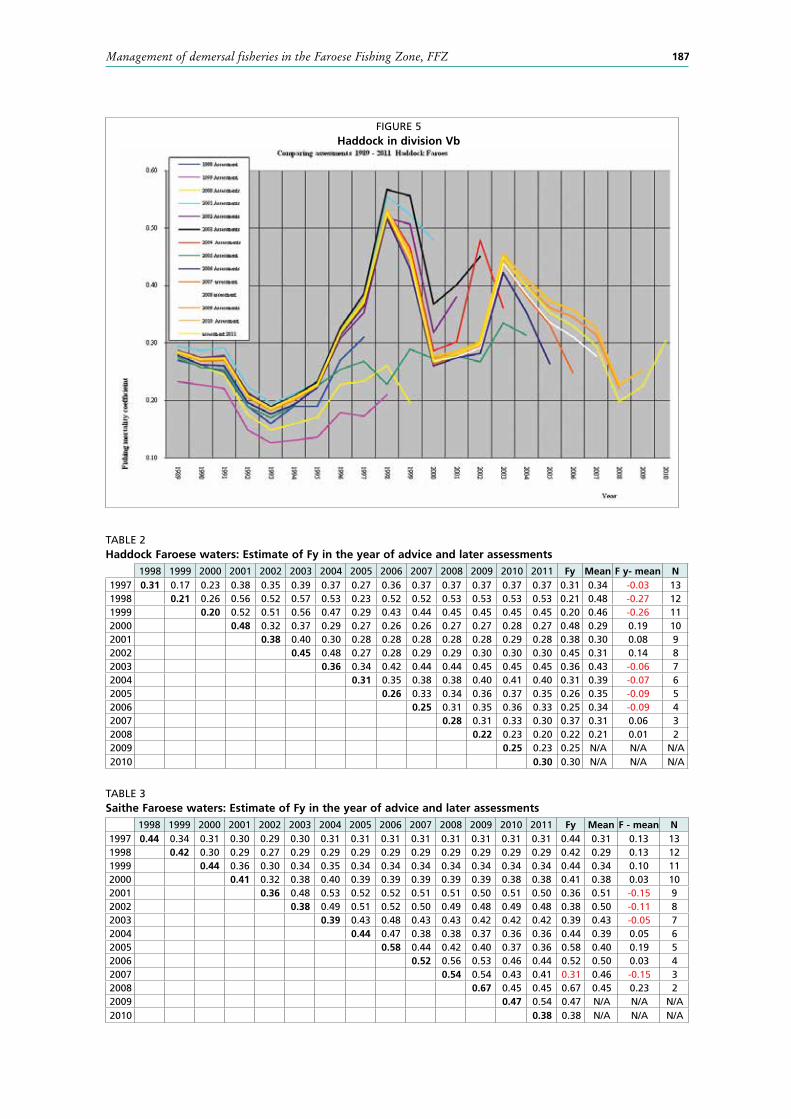
187Management of demersal fisheries in the Faroese Fishing Zone, FFZ
TABLE 2Haddock Faroese waters: Estimate of Fy in the year of advice and later assessments 1998 1999 2000 2001 2002 2003 2004 2005 2006 2007 2008 2009 2010 2011 Fy Mean F y- mean N1997 0.31 0.17 0.23 0.38 0.35 0.39 0.37 0.27 0.36 0.37 0.37 0.37 0.37 0.37 0.31 0.34 -0.03 131998 0.21 0.26 0.56 0.52 0.57 0.53 0.23 0.52 0.52 0.53 0.53 0.53 0.53 0.21 0.48 -0.27 121999 0.20 0.52 0.51 0.56 0.47 0.29 0.43 0.44 0.45 0.45 0.45 0.45 0.20 0.46 -0.26 112000 0.48 0.32 0.37 0.29 0.27 0.26 0.26 0.27 0.27 0.28 0.27 0.48 0.29 0.19 102001 0.38 0.40 0.30 0.28 0.28 0.28 0.28 0.28 0.29 0.28 0.38 0.30 0.08 92002 0.45 0.48 0.27 0.28 0.29 0.29 0.30 0.30 0.30 0.45 0.31 0.14 82003 0.36 0.34 0.42 0.44 0.44 0.45 0.45 0.45 0.36 0.43 -0.06 72004 0.31 0.35 0.38 0.38 0.40 0.41 0.40 0.31 0.39 -0.07 62005 0.26 0.33 0.34 0.36 0.37 0.35 0.26 0.35 -0.09 52006 0.25 0.31 0.35 0.36 0.33 0.25 0.34 -0.09 42007 0.28 0.31 0.33 0.30 0.37 0.31 0.06 32008 0.22 0.23 0.20 0.22 0.21 0.01 22009 0.25 0.23 0.25 N/A N/A N/A2010 0.30 0.30 N/A N/A N/A
TABLE 3Saithe Faroese waters: Estimate of Fy in the year of advice and later assessments
1998 1999 2000 2001 2002 2003 2004 2005 2006 2007 2008 2009 2010 2011 Fy Mean F - mean N1997 0.44 0.34 0.31 0.30 0.29 0.30 0.31 0.31 0.31 0.31 0.31 0.31 0.31 0.31 0.44 0.31 0.13 131998 0.42 0.30 0.29 0.27 0.29 0.29 0.29 0.29 0.29 0.29 0.29 0.29 0.29 0.42 0.29 0.13 121999 0.44 0.36 0.30 0.34 0.35 0.34 0.34 0.34 0.34 0.34 0.34 0.34 0.44 0.34 0.10 112000 0.41 0.32 0.38 0.40 0.39 0.39 0.39 0.39 0.39 0.38 0.38 0.41 0.38 0.03 102001 0.36 0.48 0.53 0.52 0.52 0.51 0.51 0.50 0.51 0.50 0.36 0.51 -0.15 92002 0.38 0.49 0.51 0.52 0.50 0.49 0.48 0.49 0.48 0.38 0.50 -0.11 82003 0.39 0.43 0.48 0.43 0.43 0.42 0.42 0.42 0.39 0.43 -0.05 72004 0.44 0.47 0.38 0.38 0.37 0.36 0.36 0.44 0.39 0.05 62005 0.58 0.44 0.42 0.40 0.37 0.36 0.58 0.40 0.19 52006 0.52 0.56 0.53 0.46 0.44 0.52 0.50 0.03 42007 0.54 0.54 0.43 0.41 0.31 0.46 -0.15 32008 0.67 0.45 0.45 0.67 0.45 0.23 22009 0.47 0.54 0.47 N/A N/A N/A2010 0.38 0.38 N/A N/A N/A
FIGURE 5Haddock in division Vb
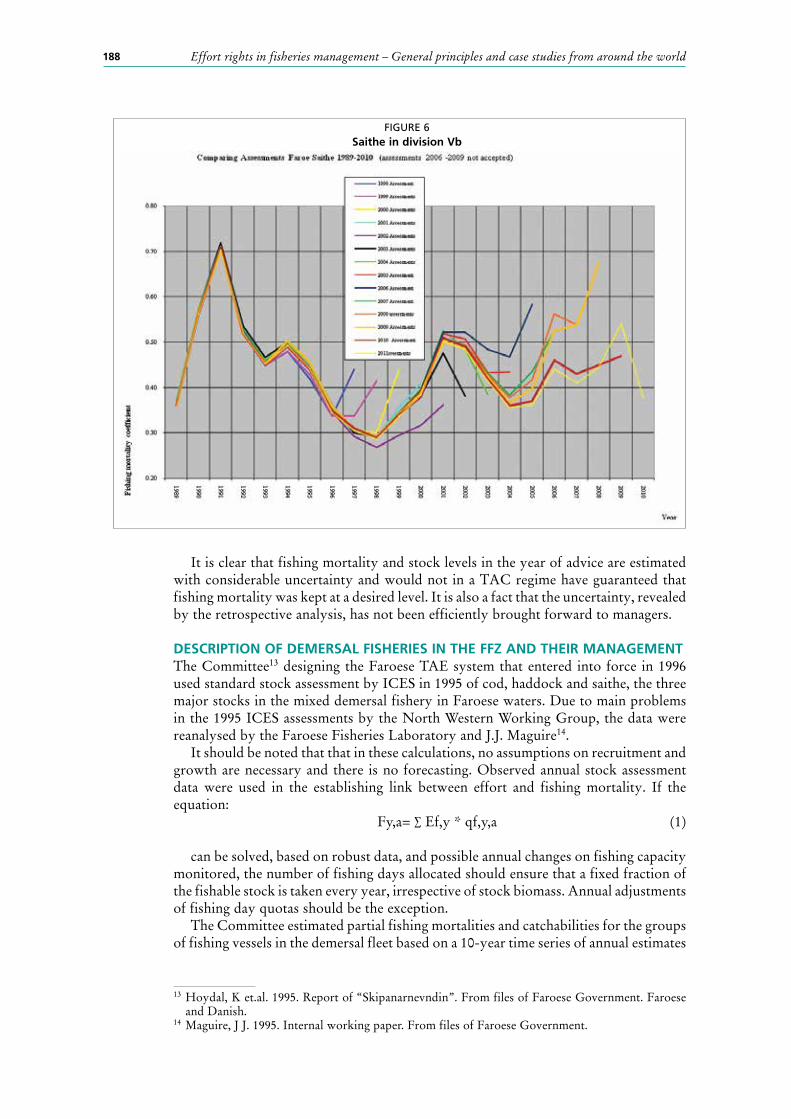
188 Effort rights in fisheries management – General principles and case studies from around the world
It is clear that fishing mortality and stock levels in the year of advice are estimated with considerable uncertainty and would not in a TAC regime have guaranteed that fishing mortality was kept at a desired level. It is also a fact that the uncertainty, revealed by the retrospective analysis, has not been efficiently brought forward to managers.
DESCRIPTION OF DEMERSAL FISHERIES IN THE FFZ AND THEIR MANAGEMENTThe Committee13 designing the Faroese TAE system that entered into force in 1996 used standard stock assessment by ICES in 1995 of cod, haddock and saithe, the three major stocks in the mixed demersal fishery in Faroese waters. Due to main problems in the 1995 ICES assessments by the North Western Working Group, the data were reanalysed by the Faroese Fisheries Laboratory and J.J. Maguire14.
It should be noted that that in these calculations, no assumptions on recruitment and growth are necessary and there is no forecasting. Observed annual stock assessment data were used in the establishing link between effort and fishing mortality. If the equation:
Fy,a= ∑ Ef,y * qf,y,a (1)
can be solved, based on robust data, and possible annual changes on fishing capacity monitored, the number of fishing days allocated should ensure that a fixed fraction of the fishable stock is taken every year, irrespective of stock biomass. Annual adjustments of fishing day quotas should be the exception.
The Committee estimated partial fishing mortalities and catchabilities for the groups of fishing vessels in the demersal fleet based on a 10-year time series of annual estimates
FIGURE 6Saithe in division Vb
13 Hoydal, K et.al. 1995. Report of “Skipanarnevndin”. From files of Faroese Government. Faroese and Danish.
14 Maguire, J J. 1995. Internal working paper. From files of Faroese Government.
189Management of demersal fisheries in the Faroese Fishing Zone, FFZ
from 1985-1994. The results were combined to estimate fishing mortality rates and catch predictions for various allocations of days fishing to fleets.
The Faroese government commissioned a review of the scientific basis for the initial allocation of fishing days and of the method to calculate probability profiles for expected fishing mortalities given the possible utilisation of the allocated fishing days. The review states that no errors were found in calculations, but lists minor concerns about the use of arithmetic means instead of geometric means in the calculations of the original allocation. “A potentially more serious effect is that the analysis assumes that catchabilities are in some sense typical over the adjustment period. It seems likely, that changes in regulations, technical efficiency and fishing practices might change catchability systematically over the averaging period. Hence, average historic levels of catchability might prove relatively poor predictors of future fleet performance”15.
The fishing mortality target set was that not more than 33 percent of the demersal stocks (in numbers) would be removed each year. Fishing effort is traditionally estimated by combining available physical measurements of fishing capacity (fixed production inputs) and of fishing activity (variable production inputs). In the Faroese case vessels with similar physical characteristics and fishing patterns were grouped in 11 fleet categories and the partial fishing mortalities were estimated and subsequently the relationship between fishing days and fishing mortality. The number of categories has since been reduced to 7.
EXPERIENCE ACQUIRED MANAGING FAROESE DEMERSAL FISHERIES WITH TAESThe Legal FrameworkFaroese authorities have full jurisdiction of all living resources in the Faroes Fisheries Zone, FFZ. The main demersal stocks in the FFZ are not shared stocks, but are fully regulated by Faroes authorities.Regulations of all fisheries in the Faroese fisheries zone (FFZ), (and Faroese fishing vessels outside the FFZ)are based on the Commercial Fishery Act, 1994.
Articles 1-3 of the Act read as follows:"§ 1.The Act encompasses all commercial exploitation of living resources in the Faroese Fisheries Zone and exploitation by fishing vessels flying the flag of the Faroe Islands in waters outside the FFZ. Excepted are living resources in rivers and lakes and whales, seals, birds and reared fish.§ 2.The living resources in the FFZ and the allocations the Government of the Faroe Islands has acquired outside the FFZ are the property of the Faroese People. In the administration of this act the aim should be to conserve the resources and exploit them in a sustainable and rational way, both in biological and economic terms, and with due concern for the relationship between stocks of plants and animals in the Sea and their abundance, in order to secure the most optimal flow of benefits for the society, constant employment and income and possibilities for commercial activities all over the country.§ 3. paragraph 2.Fishing rights allocated in accordance with this act do not transfer property rights to the licensees. The fishing rights can be withdrawn without compensation."
15 Pope, J. 2000. Internal review. From files of Faroese Government.
190 Effort rights in fisheries management – General principles and case studies from around the world
The 3 articles clearly state that all commercial fisheries by Faroese fishing vessels are regulated under the Act. Article 2 states the principles and objectives, which meet requirements in international law16 and instruments.
The operational framework in the FEZ controlling fishing mortality and exploitation pattern with total effort quotas, technical measures and close areasIn 1994 when the Act was adopted by the Faroese and allocations were ITQs. This was in 1996 changed to a regime management system of individual transferable effort quotas, described above. The reason to change was that the ITQ regime immediately led to problems with unreported catches and discards and it was not possible to finance a more efficient fisheries inspection service.
The Faroese Fisheries Authorities and the IndustryThe decision processes is shown in the figure below.
Annual review of the regulatory systemThe Committee on Fishing Days - which is made up of industry representatives - makes recommendations to the Minister of Fisheries. The Faroese Fisheries Laboratory assesses the state of the stocks and makes recommendations on that basis (since 1995 not on the number of fishing days for the vessel categories). The Minister then decides and prepares a bill to amend the Commercial Fisheries Act. This bill is reviewed by the Fisheries Advisory Body, and then presented to the Løgting, the Faroese Parliament, shortly before a new regulatory year starts 1 September every year.
Industry RepresentationThe industry is involved in the decision making through the Advisory Fisheries Council, which scrutinises all bills and executive orders related to fisheries regulations. The Committee on Fishing Days is manned by industry representatives and give independent advice to the minister.
Scientific AdviceThe core advice for the management of fisheries in the Faroese EEZ is the advice provided by the ICES Advisory Committee17.
The main commercial fish stocks in the Faroese fisheries FFZ have been assessed annually since the 1970s. The assessments are undertaken by the Faroese Fisheries Laboratory and after that go through the Working Group system and Advisory
16 United Nations Convention on the Law of the Sea of 10 December 1982, UNCLOS (entered into force 1994). http://www.un.org/Depts/los/convention_agreements/convention_overview_convention.htm
United Nations Fish Stock Agreement 1995 (entered into force 2001). http://www.un.org/Depts/los/convention_agreements/convention_overview_fish_stocks.htm
FAO. 1993. Compliance Agreement- Code of Conduct. In FAO Fisheries and Aquaculture Department [online]. Rome. http://www.fao.org/fishery/code/compliance-agreement/en
FAO. 1995. Code of Conduct for Responsible Fisheries adopted by the 28th Session of the Conference of the Food and Agriculture Organisation of the United Nations in October 1995. In FAO Fisheries and Aquaculture Department [online]. Rome. http://www.fao.org/docrep/005/v9878e/v9878e00.htm
Rio declaration and Agenda 21, 1992 and Johannesburg commitments 2002. http://iif.un.org/content/johannesburg-summit-commitment
The ecosystem approach is highlighted internationally by fishery bodies, like NEAFC and their UN cooperation partner FAO and regional Seas bodies, like OSPAR.
The Convention on Biological Diversity, CBD ( it is generally considered that the FAO Code of Conduct fulfils the requirements set out by CBD. )
17 ACOM, before 2007 ACFM.
191Management of demersal fisheries in the Faroese Fishing Zone, FFZ
Process of the International Council for Exploration of the Sea, ICES. The Working Group responsible for providing advice on fisheries in the Faroe Plateau Ecosystem is the North-Western Working Group. The Faroese assessments have been considered of high standard, benefiting from the fact that there are no incentives neither to discard fish nor underreport catches. The Committee on Fishing Days scrutinises the annual assessments and the recommendations based on those in great detail.
Advantages of the TAE regulatory systemThe main objective of the regulatory system is to provide a framework for sustainable fisheries both biologically and economically. The framework should create a level playing field and predictable conditions for the fishing industry and remove political influence from the individual allocations of fishing rights.
When the system was changed in 1995 from a system with catch quotas to a system with effort quotas all fisheries Organizations actually signed up to the system, a unique advantageous situation.
The system minimises the risk of discards and forged catch statistics. It is also seen as an advantage that it makes it unnecessary to set annual quotas on single stocks and allows certain flexibility for the fishing fleet to move between main stocks over a number of years, driven by catches and market prices.
Problems with TAE regimesThe inherent problem in a regulatory system based on effort is to monitor increases in efficiency (technical creep), which changes the catchability of the different vessel groups. Statistics on the number of licenses and number of fishing days are shown on the next page. It is clear that major changes in the fishing pattern of the vessel groups will also create problems. This is regulated by an extensive system of closed areas, seasonal of permanent closures. These closures mainly regulate the trawl fisheries.
The overall reduction in fishing days over all vessel categories is 33 percent, but as can be seen from the following tables there is a significant difference between categories, showing the shocks the system has received. These shocks are explained below.
There is also an effect from the leasing or selling of fishing days the last 3 months of the fishing year, where the capacity indicator is based on the characteristics of the vessels rather than the partial fishing mortality induced by the vessel.
A Committee, Fiskiorkunevndin18, looked at technical creep and possible changes in catchability over the years. It had the following observations:
The calculation of partial fishing mortalities in 1995 was a joint venture, involving scientists, managers and the industry. The results were understood and accepted by all parties.
There was a clear understanding that these calculations would be repeated regularly, as new stock assessments became available, thus forming the basis for estimating the number of fishing days allowed according to the rule of keeping fishing mortality at 0.45 (33 percent of the stock in numbers) for the three main stocks in the demersal fishery. This did not happen! The Faroese Marine Institute, which had been instrumental in developing the management model and estimating the original number of fishing days was not prepared, subsequently, to give the necessary annual, or multi-annual advice on the number of fishing days. They were only prepared to give “traditional” ICES single stock TAC advice. Faroese managers and politicians have not in the 17 years since 1995 demanded the Institute or asked ICES to estimate what this meant in numbers of fishing days for each vessel category.
In addition the system had received several serious shocks, all related to the administration of the system by the authorities.
18 Hoydal, K et.al. 2008. Report of “Fiskiorkunevndin”. From files of Faroese Government. Faroese.
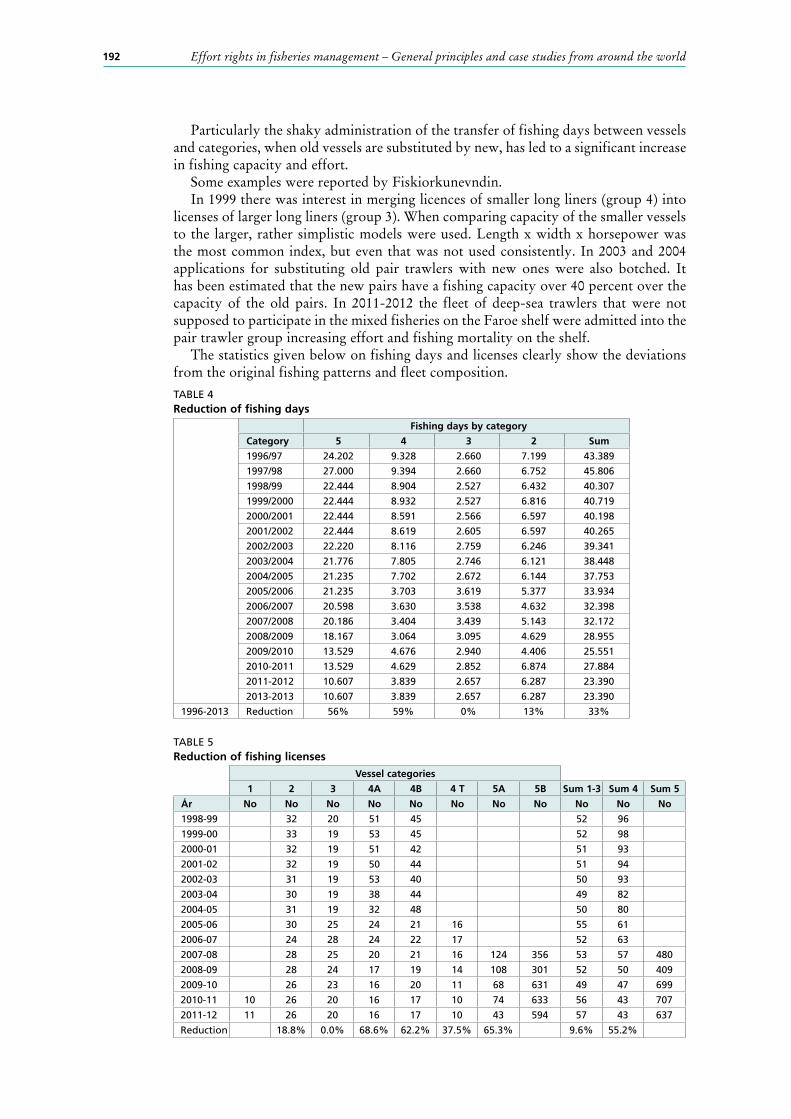
192 Effort rights in fisheries management – General principles and case studies from around the world
Particularly the shaky administration of the transfer of fishing days between vessels and categories, when old vessels are substituted by new, has led to a significant increase in fishing capacity and effort.
Some examples were reported by Fiskiorkunevndin.In 1999 there was interest in merging licences of smaller long liners (group 4) into
licenses of larger long liners (group 3). When comparing capacity of the smaller vessels to the larger, rather simplistic models were used. Length x width x horsepower was the most common index, but even that was not used consistently. In 2003 and 2004 applications for substituting old pair trawlers with new ones were also botched. It has been estimated that the new pairs have a fishing capacity over 40 percent over the capacity of the old pairs. In 2011-2012 the fleet of deep-sea trawlers that were not supposed to participate in the mixed fisheries on the Faroe shelf were admitted into the pair trawler group increasing effort and fishing mortality on the shelf.
The statistics given below on fishing days and licenses clearly show the deviations from the original fishing patterns and fleet composition.
TABLE 4Reduction of fishing days
Fishing days by category
Category 5 4 3 2 Sum
1996/97 24.202 9.328 2.660 7.199 43.389
1997/98 27.000 9.394 2.660 6.752 45.806
1998/99 22.444 8.904 2.527 6.432 40.307
1999/2000 22.444 8.932 2.527 6.816 40.719
2000/2001 22.444 8.591 2.566 6.597 40.198
2001/2002 22.444 8.619 2.605 6.597 40.265
2002/2003 22.220 8.116 2.759 6.246 39.341
2003/2004 21.776 7.805 2.746 6.121 38.448
2004/2005 21.235 7.702 2.672 6.144 37.753
2005/2006 21.235 3.703 3.619 5.377 33.934
2006/2007 20.598 3.630 3.538 4.632 32.398
2007/2008 20.186 3.404 3.439 5.143 32.172
2008/2009 18.167 3.064 3.095 4.629 28.955
2009/2010 13.529 4.676 2.940 4.406 25.551
2010-2011 13.529 4.629 2.852 6.874 27.884
2011-2012 10.607 3.839 2.657 6.287 23.390
2013-2013 10.607 3.839 2.657 6.287 23.390
1996-2013 Reduction 56% 59% 0% 13% 33%
TABLE 5Reduction of fishing licenses
Vessel categories
1 2 3 4A 4B 4 T 5A 5B Sum 1-3 Sum 4 Sum 5
Ár No No No No No No No No No No No
1998-99 32 20 51 45 52 96
1999-00 33 19 53 45 52 98
2000-01 32 19 51 42 51 93
2001-02 32 19 50 44 51 94
2002-03 31 19 53 40 50 93
2003-04 30 19 38 44 49 82
2004-05 31 19 32 48 50 80
2005-06 30 25 24 21 16 55 61
2006-07 24 28 24 22 17 52 63
2007-08 28 25 20 21 16 124 356 53 57 480
2008-09 28 24 17 19 14 108 301 52 50 409
2009-10 26 23 16 20 11 68 631 49 47 699
2010-11 10 26 20 16 17 10 74 633 56 43 707
2011-12 11 26 20 16 17 10 43 594 57 43 637
Reduction 18.8% 0.0% 68.6% 62.2% 37.5% 65.3% 9.6% 55.2%
193Management of demersal fisheries in the Faroese Fishing Zone, FFZ
Monitoring, Surveillance and ControlThe legal framework is found in the Commercial Fisheries Act Chapter 9, articles 33 to 39.
The Faroe Islands Fisheries Inspection (Fiskiveiðieftirlitið, now Vørn, http://www.fve.fo/) is responsible for the surveillance of all fisheries operations undertaken by Faroese flagged fishing vessels. It was established in 1976. It has two inspection vessels. Vessels from the Royal Danish Navy also participate in inspections at sea.
The service has the following specific tasks:• control and registration of fishing days;• control and registration of catch and by catch quotas;• observers on board of fishing vessel;• VMS message registration;• certifying weighing-in systems;• Port State Control;• control and registration of landings by Faroese flagged fishing vessels in ports
outside the Faroe Islands;• real time closures to protect juvenile fish.
Precautionary reference pointsICES in 1997 started a process to establish limit and precautionary reference points. The precautionary approach was interpreted as setting up reference points to avoid “recruitment overfishing,” that is to avoid that the spawning stock biomass is reduced to levels were the probability of good recruitment is significantly reduced. Ideally this should be derived from establishing “stock/recruitment” relationship for each stock. This is no simple task and is not possible for all stocks. Management does not manage stocks, but fishing mortality, the fraction fisheries fleets remove from the stocks.
The Faroese Løgting in 1995 decided that the target instantaneous fishing mortality for the 3 commercially important fish stocks shot be set at F=0.45 (33 percent of the stock removed in numbers).
The ICES Expert Group that assesses the Faroese demersal stocks, the North Western Working Group (NWGG), in 2007 stated that the inappropriateness of the existing reference points for Faroese stocks interfered with the credibility and usefulness of the ICES advice. Already in 2005 the Group had concluded that “the F-targets set by the Faroese authorities are sustainable and consistent with the precautionary approach under current management and environmental conditions” at the same time drawing attention to factors inherent in a TAE system and other external factors that may affect that conclusion.
It suffices to say that the setting of biological reference points for the Faroese stocks has been fraught with problems and reference points used in the most recent advice are still not well established.
This raises the question if there are other reference points than biological ones. Why not define economic reference points instead?
Profitability (or other measures like the ratio of investments to the average value of catches) could be more relevant than biological reference points, more easily measured and directly addressing the fundamental overcapacity problem in most fisheries. It is safe to say in most cases that if levels of removals from stocks and/or levels of fishing effort are linked to profitability rather than to biological precautionary reference points, economic considerations would keep fishing levels well inside precautionary biological levels19.
19 Hoydal, K. 2004. Evaluering af det nordiske fiskerisamarbejde 2001–2004, pp. 20–21. ANP 2004:744 © Nordisk Ministerråd, København.
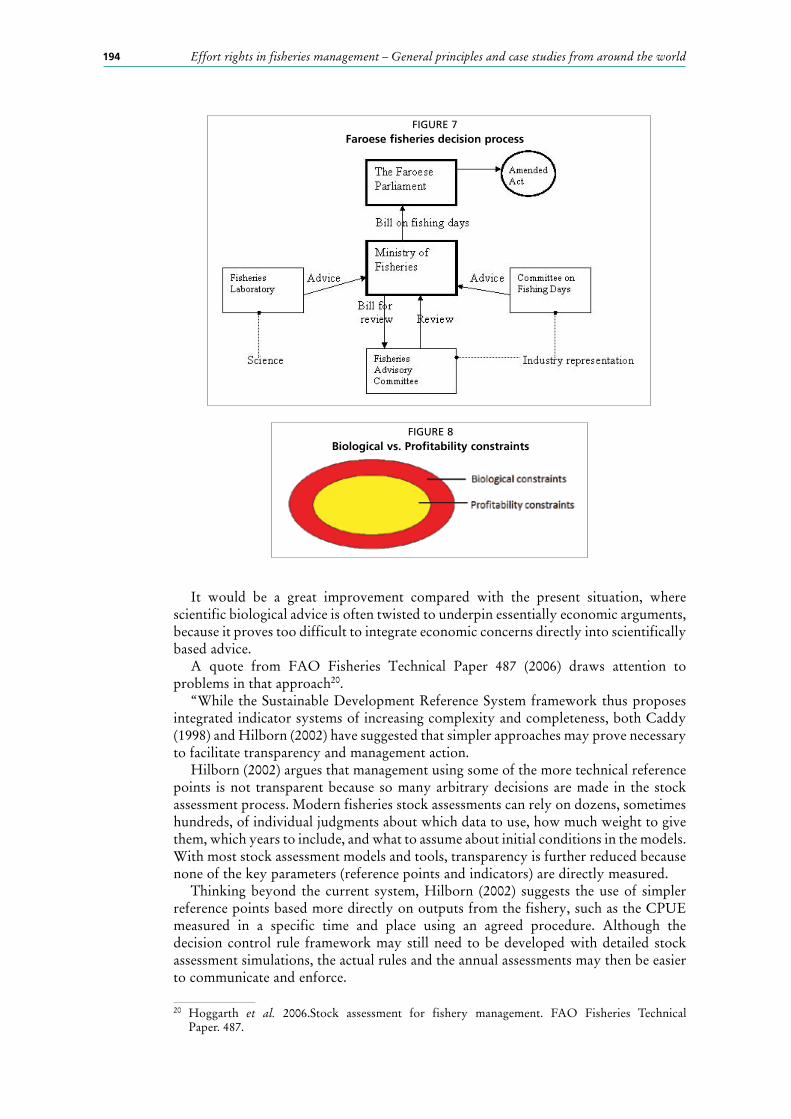
194 Effort rights in fisheries management – General principles and case studies from around the world
It would be a great improvement compared with the present situation, where scientific biological advice is often twisted to underpin essentially economic arguments, because it proves too difficult to integrate economic concerns directly into scientifically based advice.
A quote from FAO Fisheries Technical Paper 487 (2006) draws attention to problems in that approach20.
“While the Sustainable Development Reference System framework thus proposes integrated indicator systems of increasing complexity and completeness, both Caddy (1998) and Hilborn (2002) have suggested that simpler approaches may prove necessary to facilitate transparency and management action.
Hilborn (2002) argues that management using some of the more technical reference points is not transparent because so many arbitrary decisions are made in the stock assessment process. Modern fisheries stock assessments can rely on dozens, sometimes hundreds, of individual judgments about which data to use, how much weight to give them, which years to include, and what to assume about initial conditions in the models. With most stock assessment models and tools, transparency is further reduced because none of the key parameters (reference points and indicators) are directly measured.
Thinking beyond the current system, Hilborn (2002) suggests the use of simpler reference points based more directly on outputs from the fishery, such as the CPUE measured in a specific time and place using an agreed procedure. Although the decision control rule framework may still need to be developed with detailed stock assessment simulations, the actual rules and the annual assessments may then be easier to communicate and enforce.
FIGURE 7Faroese fisheries decision process
FIGURE 8Biological vs. Profitability constraints
20 Hoggarth et al. 2006.Stock assessment for fishery management. FAO Fisheries Technical Paper. 487.
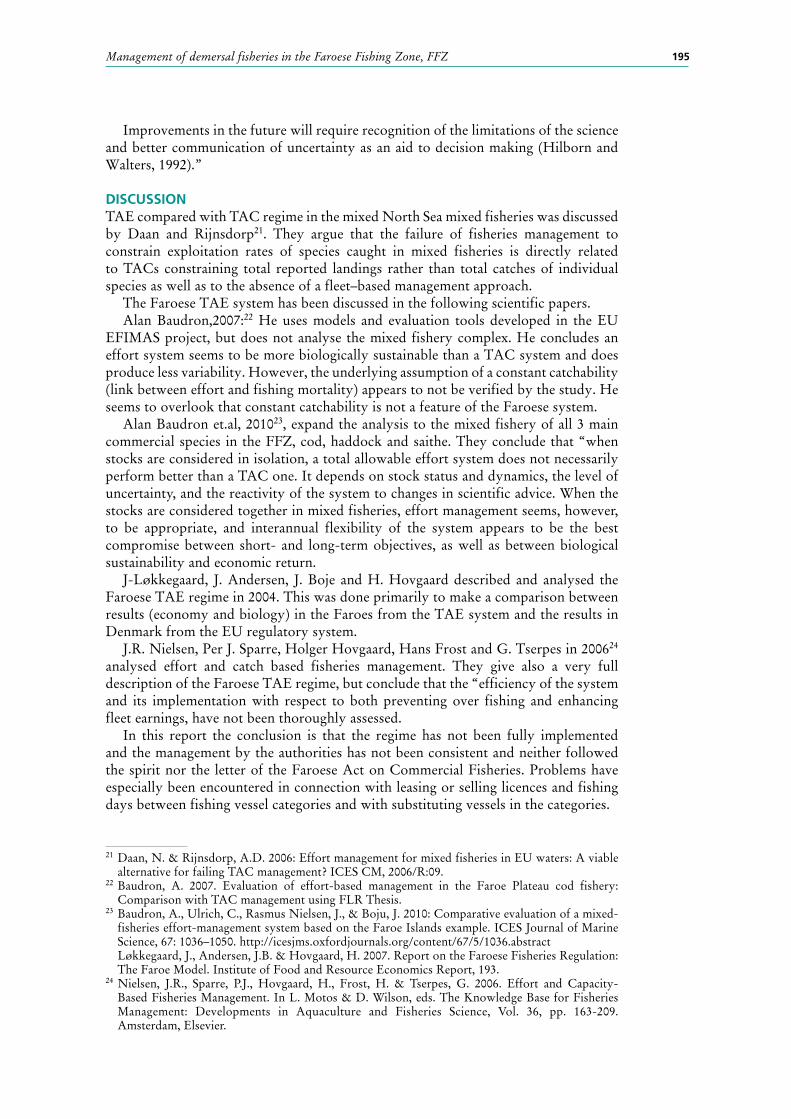
195Management of demersal fisheries in the Faroese Fishing Zone, FFZ
Improvements in the future will require recognition of the limitations of the science and better communication of uncertainty as an aid to decision making (Hilborn and Walters, 1992).”
DISCUSSIONTAE compared with TAC regime in the mixed North Sea mixed fisheries was discussed by Daan and Rijnsdorp21. They argue that the failure of fisheries management to constrain exploitation rates of species caught in mixed fisheries is directly related to TACs constraining total reported landings rather than total catches of individual species as well as to the absence of a fleet–based management approach.
The Faroese TAE system has been discussed in the following scientific papers.Alan Baudron,2007:22 He uses models and evaluation tools developed in the EU
EFIMAS project, but does not analyse the mixed fishery complex. He concludes an effort system seems to be more biologically sustainable than a TAC system and does produce less variability. However, the underlying assumption of a constant catchability (link between effort and fishing mortality) appears to not be verified by the study. He seems to overlook that constant catchability is not a feature of the Faroese system.
Alan Baudron et.al, 201023, expand the analysis to the mixed fishery of all 3 main commercial species in the FFZ, cod, haddock and saithe. They conclude that “when stocks are considered in isolation, a total allowable effort system does not necessarily perform better than a TAC one. It depends on stock status and dynamics, the level of uncertainty, and the reactivity of the system to changes in scientific advice. When the stocks are considered together in mixed fisheries, effort management seems, however, to be appropriate, and interannual flexibility of the system appears to be the best compromise between short- and long-term objectives, as well as between biological sustainability and economic return.
J-Løkkegaard, J. Andersen, J. Boje and H. Hovgaard described and analysed the Faroese TAE regime in 2004. This was done primarily to make a comparison between results (economy and biology) in the Faroes from the TAE system and the results in Denmark from the EU regulatory system.
J.R. Nielsen, Per J. Sparre, Holger Hovgaard, Hans Frost and G. Tserpes in 200624 analysed effort and catch based fisheries management. They give also a very full description of the Faroese TAE regime, but conclude that the “efficiency of the system and its implementation with respect to both preventing over fishing and enhancing fleet earnings, have not been thoroughly assessed.
In this report the conclusion is that the regime has not been fully implemented and the management by the authorities has not been consistent and neither followed the spirit nor the letter of the Faroese Act on Commercial Fisheries. Problems have especially been encountered in connection with leasing or selling licences and fishing days between fishing vessel categories and with substituting vessels in the categories.
21 Daan, N. & Rijnsdorp, A.D. 2006: Effort management for mixed fisheries in EU waters: A viable alternative for failing TAC management? ICES CM, 2006/R:09.
22 Baudron, A. 2007. Evaluation of effort-based management in the Faroe Plateau cod fishery: Comparison with TAC management using FLR Thesis.
23 Baudron, A., Ulrich, C., Rasmus Nielsen, J., & Boju, J. 2010: Comparative evaluation of a mixed-fisheries effort-management system based on the Faroe Islands example. ICES Journal of Marine Science, 67: 1036–1050. http://icesjms.oxfordjournals.org/content/67/5/1036.abstract
Løkkegaard, J., Andersen, J.B. & Hovgaard, H. 2007. Report on the Faroese Fisheries Regulation: The Faroe Model. Institute of Food and Resource Economics Report, 193.
24 Nielsen, J.R., Sparre, P.J., Hovgaard, H., Frost, H. & Tserpes, G. 2006. Effort and Capacity-Based Fisheries Management. In L. Motos & D. Wilson, eds. The Knowledge Base for Fisheries Management: Developments in Aquaculture and Fisheries Science, Vol. 36, pp. 163-209. Amsterdam, Elsevier.
196 Effort rights in fisheries management – General principles and case studies from around the world
This was not a major problem in the first years from approximately 1996 to 2002, but after that catchability, overall effort and fishing patterns of the vessel categories has changed significantly and led to higher fishing mortalities than 0.45. There has not been scientific advice to correct this since 1996.
REFERENCESAgenda 21. 1992. The United Nations Conference on Environment and Development, 3 to
14 June 1992, Rio de Janeiro, Brazil.Baudron, A. 2007: Evaluation of effort-based management in the Faroe Plateau cod
fishery : comparison with TAC management using FLR. Mémoire de fin d’études, Pour l’obtention du Diplôme d’Agronomie Approfondie (DAA), Spécialisation Halieutique. Agrocampus Rennes, France, 48 pages.
Baudron, A., Ulrich, C., Rasmus Nielsen, J., & Boju, J. 2010: Comparative evaluation of a mixed-fisheries effort-management system based on the Faroe Islands example. ICES Journal of Marine Science, 67: 1036–1050. http://icesjms.oxfordjournals.org/content/67/5/1036.abstract
Bertelsen, M & Sparholt H. 2002.Quality of ACFM advice: How good have forecasts been since 1988?ICES Working Group Document ACFM.
Clayden, A.D. 1972. Simulation of the changes in abundance of the cod (Gadus morhua L.) and the distribution of fishing on the north Atlantic. Fish. Invest. Minist. Agric. Fish. Food G.B. (2 Sea Fish.), 271(1):58 p.
FAO.1993. Compliance Agreement- Code of Conduct. In FAO Fisheries and Aquaculture Department [online]. Rome. http://www.fao.org/fishery/code/compliance-agreement/en
FAO. 1995.Code of Conduct for Responsible Fisheries adopted by the 28th Session of the Conference of the Food and Agriculture Organisation of the United Nations in October 1995. In FAO Fisheries and Aquaculture Department [online]. Rome. http://www.fao.org/docrep/005/v9878e/v9878e00.htm
Convention on Biological Diversity (CBD).CBO [online]. Canada. [Cited September 7, 2012 . http://www.cbd.int/
Gezelius, S.G. & Raakjær, J., eds. 2008.Making Fisheries Management Work. Springer.Gulland, J.A., 1961. Fishing and the stocks of fish at Iceland. Fish.Invest.Minist.Agric.Fish.
Food G.B. (2 Sea Fish.), 23(4):1–32Gulland, J.A. 1956. On the fishing effort in English demersal fisheries. Fish. Invest.,
London Series II, Volume 20(5)Hoggarth et al. 2006.Stock assessment for fishery management.FAO Fisheries Technical
Paper 487.Holm, P. & Nielsen, K. N. 2004. The TAC Machine, Appendix B, Working Document 1.In
ICES 2004 Report of the Working Group for Fisheries Systems (WGFS)Annual Report. Copenhagen, Denmark.
Holt, S.J. 2006. Commentary In 10.9.06Implementing sustainability in EU fisheries through maximum sustainable yield. Communication from the Commission to the Council and the European Parliament Document Com, 360 final, sub-titled SEC868. Brussels.
Hoydal, K et.al. 1995. Report of “Skipanarnevndin”. Government of Faroe Islands, Tórshavn, Faroe Islands, in Faroese and Danish.
Hoydal, K. 2004. Evaluering af det nordiske fiskerisamarbejde 2001–2004, pp. 20–21. ANP 2004:744 © Nordisk Ministerråd, København, Denmark.
Hoydal, K et.al. 2008. Report of “Fiskiorkunevndin”. Government of Faroe Islands, Tórshavn, Faroe Islands, in Faroese.
Hoydal, K. 2012 The TAC fallacy. Presentation at ICES ASC 2012, Theme session P.Hoydal K. 2014. History of ACFM. ICES Cooperative Research Report. (In Press).
197Management of demersal fisheries in the Faroese Fishing Zone, FFZ
ICES. 2012. Inside out No 3: Multispecies considerations in the Baltic [online]. Denmark. [Cited ---]http://www.ices.dk/news-and-events/Documents/ICES%20InsideOut/Insideout2012-No.3%20Combined.pdf
Johannesburg Summit Commitment. 2002.Johannesburg Summit on Sustainable Development, Johannesburg, Republic of South Africa. http://iif.un.org/content/johannesburg-summit-commitment.
Løkkegaard, J., Andersen, J.B. & Hovgaard, H. 2007. Report on the Faroese Fisheries Regulation: The Faroe Model. Institute of Food and Resource Economics Report, 193.
Maguire, J J.1995. Internal working paper. Government of Faroe Islands, Tórshavn, Faroe Islands
Daan, N. &Rijnsdorp, A.D.2006: Effort management for mixed fisheries in EU waters: A viable alternative for failing TAC management? ICES CM, 2006/R:09.
Nielsen, J.R., Sparre, P.J., Hovgaard, H., Frost, H. & Tserpes, G. 2006. Effort and Capacity-Based Fisheries Management. In L. Motos & D. Wilson, eds. The Knowledge Base for Fisheries Management: Developments in Aquaculture and Fisheries Science, Vol. 36, pp. 163-209. Amsterdam, Elsevier.
Pope, J. 2000. Internal review. Government of Faroe Islands, Tórshavn, Faroe Islands.Raakjær Nielsen, J. 2004. Presentation Farec Conference, Tórshavn, Faroe Islands.Rio Declaration on Environment and Development.1992. The United Nations Conference
on Environment and Development, 3 to 14 June 1992, Rio de Janeiro, Brazil.Schwach, V., Bailly, D., Christensen, A.S., Delaney, A.E., Degnbol, P., van Densen,
W.L.T., Holm, P., McLay, H.A., Nielsen, K.N., Pastoors, M.A., Reeves, S.A. & Wilson, D.C. 2007. Policy and knowledge in fisheries management: A policy brief. ICES Journal of Marine Science, 64: 798–803.
United Nations Convention on the Law of the Sea of 10 December 1982, UNCLOS (entered into force 1994). http://www.un.org/Depts/los/convention_agreements/convention_overview_convention.htm
United Nations Fish Stock Agreement 1995 (entered into force 2001). http://www.un.org/Depts/los/convention_agreements/convention_overview_fish_stocks.htm

199
Input-based rights: the Falkland Islands Loligo squid fishery
Vishwanie Maharaj, World Wildlife FundE-mail: [email protected]
INTRODUCTIONA variety of input based rights regimes have been implemented to meet fishery management objectives and mitigate ecosystem impacts. Effort rights specified as days at sea, gear units and well capacity are more frequent and adopted with varying levels of success depending on design features and applicability to addressing the problem at hand. In contrast to output based regimes, there is the tendency for participants in an input based fishery to expand the use of uncontrolled inputs, thus increasing catch per unit of the managed input. Technological progress and skill and experience of crew members also enhance the effectiveness of the managed unit of input. The incentives for overinvestment in inputs in these types of property rights regimes do not internalise the externalities generated from over exploitation of the commons. Therefore, for optimal performance, adjustments to uncontrolled inputs are required and can be applied to the overall input quota for the entire fishery or to rights held by entities in the fishery.
While input rights programmes may achieve conservation objectives, there is evidence that these programmes may be less economically efficient compared with output based programmes. For example, gear restrictions in the Northern prawn fishery in Australia decreased the technical efficiency of the fleet, thereby increasing the costs of fishing and consequently lowering the profitability of the fleet. As a result, the Australian Fisheries Management Authority (AFMA) proceeded to change its management strategy from input to output controls based on the total allowable catch (TAC) associated with maximum economic yield (MEY) and individual transferable quotas (ITQs) (Kompas and Che, 2004).
• Effort based regimes have been used to address ecological impacts such as unspecified bycatch or habitat damage. There are a number of cases where effort based regimes, such as days at sea programmes have been adopted to manage directed catch for any or all of the following reasons:
• There is no real time accurate catch monitoring and an effort based programme results in better accountability.
• Management and other compliance costs are substantially lower. • The unpredictable year-on-year catches in fisheries with highly variable
recruitment make in-season adjustments infeasible. • To reduce discards in certain multispecies fisheries where single species quota
management is not feasible and high grading is a potentially serious outcome. • It may be more political feasible to establish an effort based programme in cases
where there is strong opposition to catch quota based measures. Effort regimes can be viewed as a step towards future refinement and adoption of catch based rights.
In many effort based regimes, entities are assigned nominal effort units that are not automatically adjusted when the total allowable catch or effort for the fishery fluctuates to meet management objectives. As a result, there can be considerable opposition to
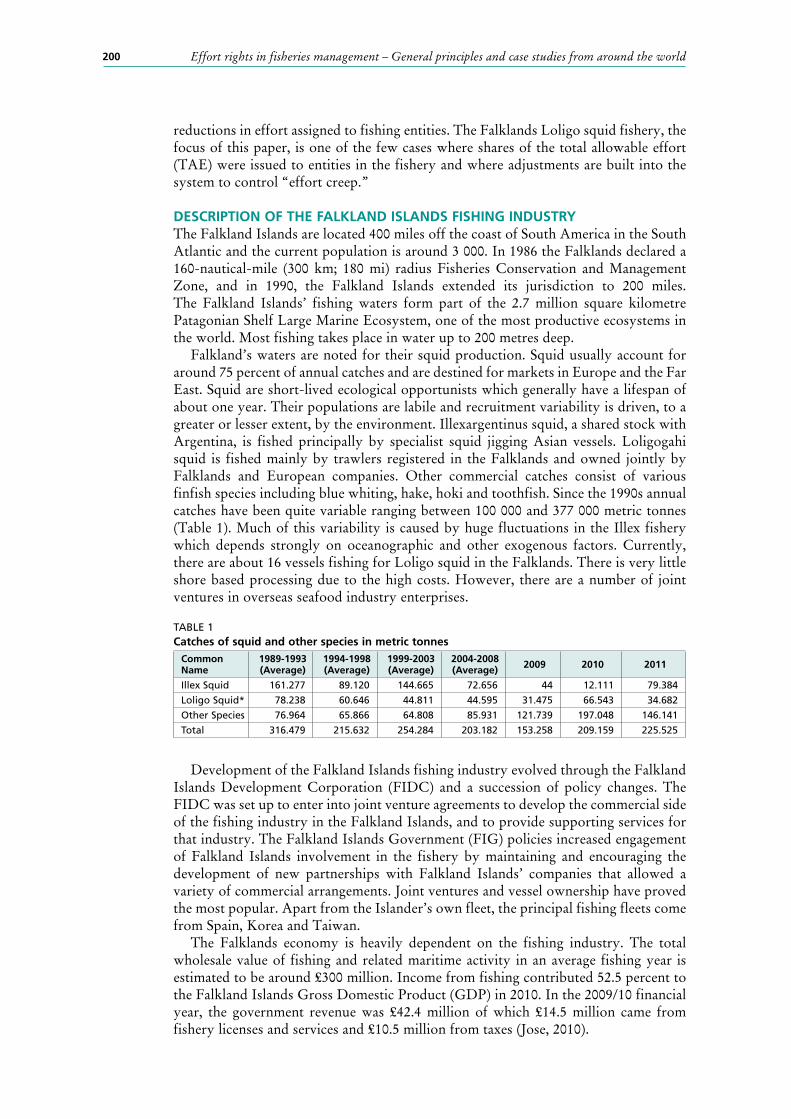
200 Effort rights in fisheries management – General principles and case studies from around the world
reductions in effort assigned to fishing entities. The Falklands Loligo squid fishery, the focus of this paper, is one of the few cases where shares of the total allowable effort (TAE) were issued to entities in the fishery and where adjustments are built into the system to control “effort creep.”
DESCRIPTION OF THE FALKLAND ISLANDS FISHING INDUSTRYThe Falkland Islands are located 400 miles off the coast of South America in the South Atlantic and the current population is around 3 000. In 1986 the Falklands declared a 160-nautical-mile (300 km; 180 mi) radius Fisheries Conservation and Management Zone, and in 1990, the Falkland Islands extended its jurisdiction to 200 miles. The Falkland Islands’ fishing waters form part of the 2.7 million square kilometre Patagonian Shelf Large Marine Ecosystem, one of the most productive ecosystems in the world. Most fishing takes place in water up to 200 metres deep.
Falkland’s waters are noted for their squid production. Squid usually account for around 75 percent of annual catches and are destined for markets in Europe and the Far East. Squid are short-lived ecological opportunists which generally have a lifespan of about one year. Their populations are labile and recruitment variability is driven, to a greater or lesser extent, by the environment. Illexargentinus squid, a shared stock with Argentina, is fished principally by specialist squid jigging Asian vessels. Loligogahi squid is fished mainly by trawlers registered in the Falklands and owned jointly by Falklands and European companies. Other commercial catches consist of various finfish species including blue whiting, hake, hoki and toothfish. Since the 1990s annual catches have been quite variable ranging between 100 000 and 377 000 metric tonnes (Table 1). Much of this variability is caused by huge fluctuations in the Illex fishery which depends strongly on oceanographic and other exogenous factors. Currently, there are about 16 vessels fishing for Loligo squid in the Falklands. There is very little shore based processing due to the high costs. However, there are a number of joint ventures in overseas seafood industry enterprises.
TABLE 1Catches of squid and other species in metric tonnes
Common Name
1989-1993 (Average)
1994-1998 (Average)
1999-2003 (Average)
2004-2008 (Average) 2009 2010 2011
Illex Squid 161.277 89.120 144.665 72.656 44 12.111 79.384
Loligo Squid* 78.238 60.646 44.811 44.595 31.475 66.543 34.682
Other Species 76.964 65.866 64.808 85.931 121.739 197.048 146.141
Total 316.479 215.632 254.284 203.182 153.258 209.159 225.525
Development of the Falkland Islands fishing industry evolved through the Falkland Islands Development Corporation (FIDC) and a succession of policy changes. The FIDC was set up to enter into joint venture agreements to develop the commercial side of the fishing industry in the Falkland Islands, and to provide supporting services for that industry. The Falkland Islands Government (FIG) policies increased engagement of Falkland Islands involvement in the fishery by maintaining and encouraging the development of new partnerships with Falkland Islands’ companies that allowed a variety of commercial arrangements. Joint ventures and vessel ownership have proved the most popular. Apart from the Islander’s own fleet, the principal fishing fleets come from Spain, Korea and Taiwan.
The Falklands economy is heavily dependent on the fishing industry. The total wholesale value of fishing and related maritime activity in an average fishing year is estimated to be around £300 million. Income from fishing contributed 52.5 percent to the Falkland Islands Gross Domestic Product (GDP) in 2010. In the 2009/10 financial year, the government revenue was £42.4 million of which £14.5 million came from fishery licenses and services and £10.5 million from taxes (Jose, 2010).
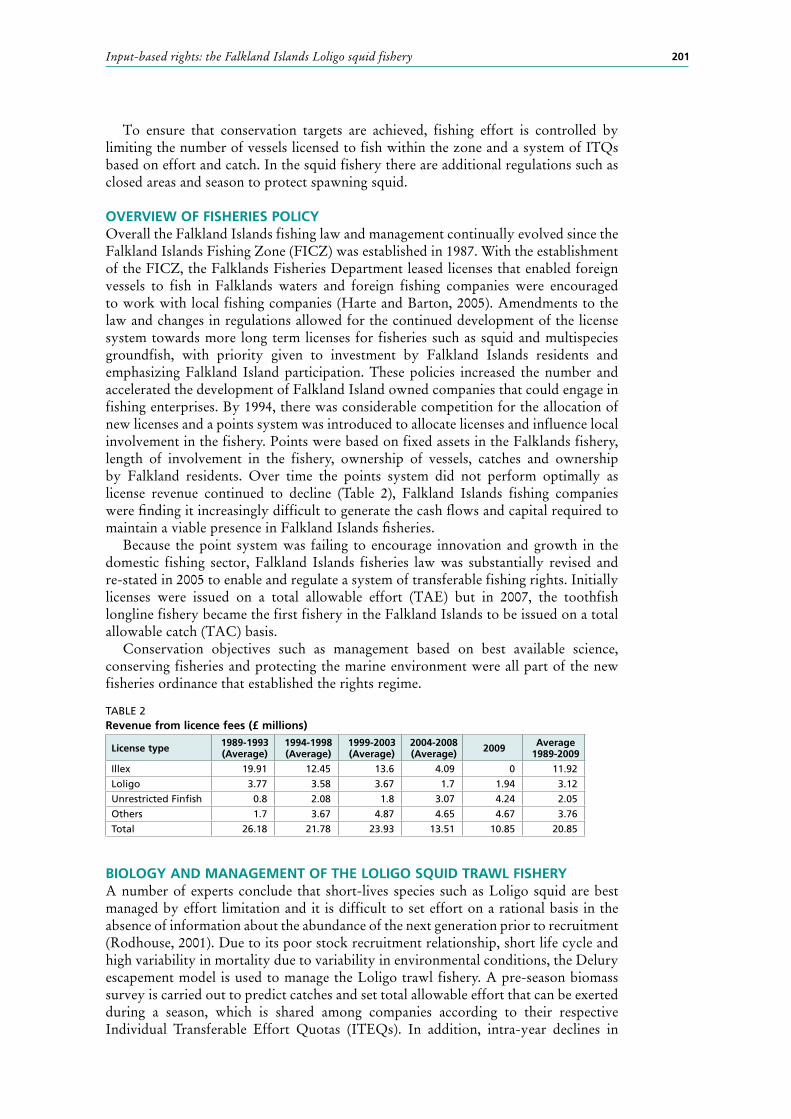
201Input-based rights: the Falkland Islands Loligo squid fishery
To ensure that conservation targets are achieved, fishing effort is controlled by limiting the number of vessels licensed to fish within the zone and a system of ITQs based on effort and catch. In the squid fishery there are additional regulations such as closed areas and season to protect spawning squid.
OVERVIEW OF FISHERIES POLICYOverall the Falkland Islands fishing law and management continually evolved since the Falkland Islands Fishing Zone (FICZ) was established in 1987. With the establishment of the FICZ, the Falklands Fisheries Department leased licenses that enabled foreign vessels to fish in Falklands waters and foreign fishing companies were encouraged to work with local fishing companies (Harte and Barton, 2005). Amendments to the law and changes in regulations allowed for the continued development of the license system towards more long term licenses for fisheries such as squid and multispecies groundfish, with priority given to investment by Falkland Islands residents and emphasizing Falkland Island participation. These policies increased the number and accelerated the development of Falkland Island owned companies that could engage in fishing enterprises. By 1994, there was considerable competition for the allocation of new licenses and a points system was introduced to allocate licenses and influence local involvement in the fishery. Points were based on fixed assets in the Falklands fishery, length of involvement in the fishery, ownership of vessels, catches and ownership by Falkland residents. Over time the points system did not perform optimally as license revenue continued to decline (Table 2), Falkland Islands fishing companies were finding it increasingly difficult to generate the cash flows and capital required to maintain a viable presence in Falkland Islands fisheries.
Because the point system was failing to encourage innovation and growth in the domestic fishing sector, Falkland Islands fisheries law was substantially revised and re-stated in 2005 to enable and regulate a system of transferable fishing rights. Initially licenses were issued on a total allowable effort (TAE) but in 2007, the toothfish longline fishery became the first fishery in the Falkland Islands to be issued on a total allowable catch (TAC) basis.
Conservation objectives such as management based on best available science, conserving fisheries and protecting the marine environment were all part of the new fisheries ordinance that established the rights regime.
TABLE 2Revenue from licence fees (£ millions)
License type 1989-1993 (Average)
1994-1998 (Average)
1999-2003 (Average)
2004-2008 (Average) 2009 Average
1989-2009
Illex 19.91 12.45 13.6 4.09 0 11.92
Loligo 3.77 3.58 3.67 1.7 1.94 3.12
Unrestricted Finfish 0.8 2.08 1.8 3.07 4.24 2.05
Others 1.7 3.67 4.87 4.65 4.67 3.76
Total 26.18 21.78 23.93 13.51 10.85 20.85
BIOLOGY AND MANAGEMENT OF THE LOLIGO SQUID TRAWL FISHERY A number of experts conclude that short-lives species such as Loligo squid are best managed by effort limitation and it is difficult to set effort on a rational basis in the absence of information about the abundance of the next generation prior to recruitment (Rodhouse, 2001). Due to its poor stock recruitment relationship, short life cycle and high variability in mortality due to variability in environmental conditions, the Delury escapement model is used to manage the Loligo trawl fishery. A pre-season biomass survey is carried out to predict catches and set total allowable effort that can be exerted during a season, which is shared among companies according to their respective Individual Transferable Effort Quotas (ITEQs). In addition, intra-year declines in
202 Effort rights in fisheries management – General principles and case studies from around the world
abundance indices are modelled and monitored. The main management goal is to ensure that a spawning stock biomass of 10 000 toms remains at the end of the season. This is equivalent to a limit reference point, above which there has historically been no apparent impact of stock size on recruitment. As observed in 2011, The Fisheries Director can close the season early when assessments predict a failure to meet the conservation target.
OBJECTIVES OF THE RBM PROGRAMMEIn 2005 the Falkland Islands Government (FIG) passed a Fisheries Bill enacting legislation to shift the Falklands fisheries to Individual Transferable Effort Quotas (ITEQs) with rights valid for 25 years. The Loligo squid fishery was the first Falkland fishery to enter the new ITEQ system in July 2006. The reasons of introducing ITEQs were to:
• improve the overall performance of the sector;• promote fishery diversification and autonomous restructuring;• provide fishing companies with additional security;• encourage investment in the industry;• promote industry funded research and development;• improve international competitiveness;• financially aid those leaving the fishery; and• increase profitability including government income from economic rents to
educe the government’s risk from reliance on fishing license revenue. While the main objectives for the effort rights regime was to increase profitability
and rents, conditions of Falkland Islands ownership and benefits to its residents would remain as criteria for design of the programme.
DESIGN OF THE EFFORT RIGHTS PROGRAMMEThe Loligo efforts rights programme is based on a total allowable effort(TAE) model expressed as vessel days assigned on a share basis and automatically adjusted when the TAE changes. Annual holdings are adjusted by measurable inputs that include vessel horsepower and length. Each vessel is assigned a catchability coefficient, q, which is used to adjust annual catch entitlements to vessel days. It is unclear how or if the system addresses technical progress and it can be speculated that changes in non measureable inputs such as technological progress and crew skill would be accounted for in the annual stock assessment and the appropriate adjustments made through changes in the TAE.
While the objectives of the programme were to improve the economic performance of the fisheries, the requirement to encourage the long-term ownership and control of rights to Falkland Islands fisheries resources by Falkland Islander owned and controlled fishing companies influenced the quota assignment process, transferability conditions and eligibility to remain in the fishery. Another key issue in initial allocation was how to ensure the long-term local ownership and control of fishing rights without unduly disrupting current successful joint ventures between local companies and foreign fishing companies, balance local ownership and control with the need for direct foreign investment and the continued involvement of foreign fishing fleets in the territory’s fisheries.
There are three classes of rights:• Individual transferable quota (ITQ) that are issued to companies 100 percent
owned by Falkland Island status holders. This allowed Falkland Islanders greater bargaining power in joint venture arrangements with foreign owned vessels owners who previously held multi-year licenses.
203Input-based rights: the Falkland Islands Loligo squid fishery
• Provisional quotas (PQ) were issued as a transition to the rights programme and owned by companies where the shareholding held by Falkland Island status holders is less than 25 percent. They are non transferable, with a duration of five years and issued to companies that met certain eligibility criteria. PQ can be transferred to ITQ at any time should the company holding the PQ become eligible to hold ITQ.
• Catch Entitlements(CE) are issued annually and there are two classes:* Es associated with ITQs can be traded freely to eligible companies. This
allows for joint venture operations to continue between foreign fishing companies and local entities. CEs can only be leased to companies that have at least a 25 percent ownership by Falkland Island Status holders.
* Es associated with PQs are not transferable. A fishing license is required and licenses are issued if the vessel operator has a
minimum threshold of CE. The fishing license is retained in the new management system to regulate fishing activity with respect to gear type and sizes and mitigation measures to limit the impact of fishing on dependent and associated fish stocks, marine mammals, seabirds, and the marine environment. It is a condition of licensing that residents own at least a 25.1 percent share of each applicant vessel.
Initial allocations were based on effort and catches associates with the firms that qualified to be on a register. To qualify for the register, companies supplied information to the Director of Fisheries on ownership structures, shareholding, any existing business arrangements and/or proposed business arrangements including marketing and financing agreements. The initial allocation of effort units was based on historical catches. It is unclear whether a formula was used to assign quotas, as initial allocations was decided after a series of meetings between the Fisheries Director and industry representatives from the companies that operated the fleet of 16 core vessels that participated continuously in the loligo fishery between 2001 and 2005. Companies are allocated an aggregated ITEQ that applies equally to both the first and second fishing seasons.
Continued participation in the quota management system (QMS) requires that firms meet the Director’s requirements to remain or enter the register. The Director must be satisfied that the company has effective control of the rights it holds, is actively involved in the seafood industry and makes efficient use of the rights. Active involvement means the company is associated with other businesses that catch, process, and market seafood. So, a company must either fish most of its CE or move to a system where it can invest in the proceeds of the CE in other parts of the value chain. In addition, company records are reviewed to determine the profitability of the enterprise, the market value of the CE and how that compares with industry standards.
It must be noted that reviews are required on an annual basis to remain on the eligibility register. If a company is removed from the register, it must dispose of its rights to a company or companies that appear on the register. Removal from the register is expected to be an extremely rare occurrence.
There are two types of transferability. Companies that “own” the right during its 25 year duration are allowed to transfer the right to Falkland citizens or companies that are owned by those with an interest. However, annual and shorter term transfers are possible. Guided by the results of Grainger and Costello (2010), it is expected that the duration limit and restrictions on transferability will depress quota share prices.
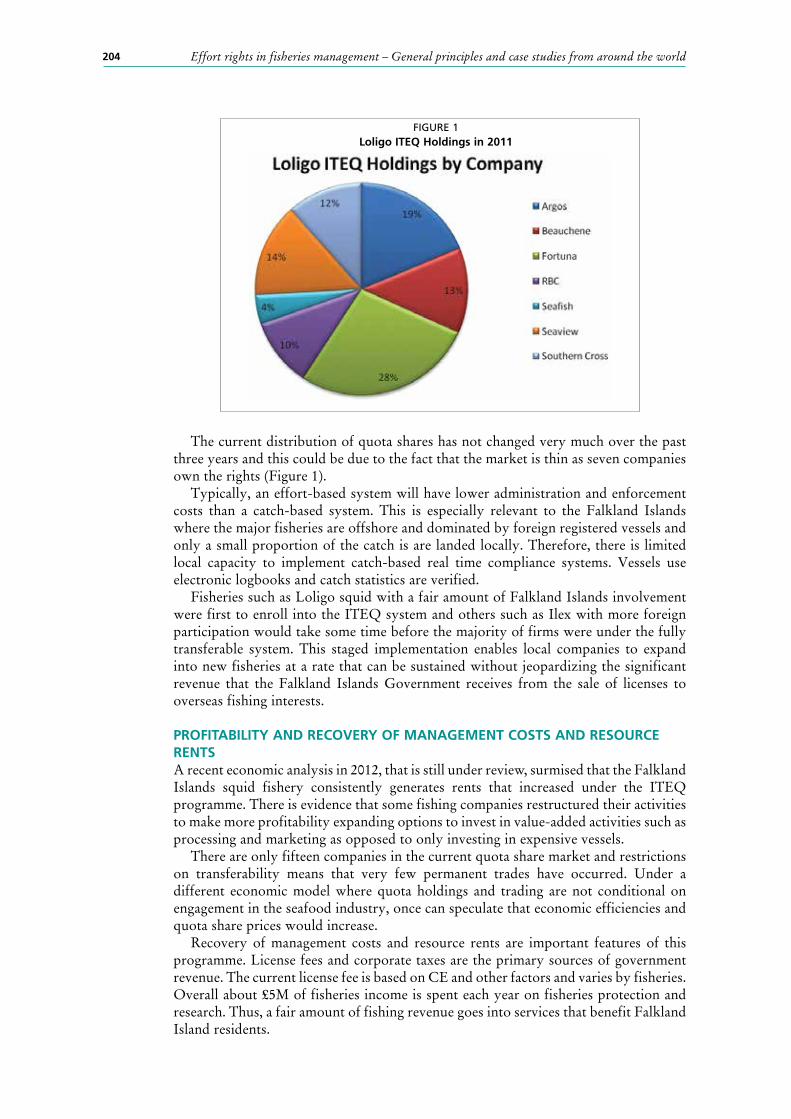
204 Effort rights in fisheries management – General principles and case studies from around the world
The current distribution of quota shares has not changed very much over the past three years and this could be due to the fact that the market is thin as seven companies own the rights (Figure 1).
Typically, an effort-based system will have lower administration and enforcement costs than a catch-based system. This is especially relevant to the Falkland Islands where the major fisheries are offshore and dominated by foreign registered vessels and only a small proportion of the catch is are landed locally. Therefore, there is limited local capacity to implement catch-based real time compliance systems. Vessels use electronic logbooks and catch statistics are verified.
Fisheries such as Loligo squid with a fair amount of Falkland Islands involvement were first to enroll into the ITEQ system and others such as Ilex with more foreign participation would take some time before the majority of firms were under the fully transferable system. This staged implementation enables local companies to expand into new fisheries at a rate that can be sustained without jeopardizing the significant revenue that the Falkland Islands Government receives from the sale of licenses to overseas fishing interests.
PROFITABILITY AND RECOVERY OF MANAGEMENT COSTS AND RESOURCE RENTS A recent economic analysis in 2012, that is still under review, surmised that the Falkland Islands squid fishery consistently generates rents that increased under the ITEQ programme. There is evidence that some fishing companies restructured their activities to make more profitability expanding options to invest in value-added activities such as processing and marketing as opposed to only investing in expensive vessels.
There are only fifteen companies in the current quota share market and restrictions on transferability means that very few permanent trades have occurred. Under a different economic model where quota holdings and trading are not conditional on engagement in the seafood industry, once can speculate that economic efficiencies and quota share prices would increase.
Recovery of management costs and resource rents are important features of this programme. License fees and corporate taxes are the primary sources of government revenue. The current license fee is based on CE and other factors and varies by fisheries. Overall about £5M of fisheries income is spent each year on fisheries protection and research. Thus, a fair amount of fishing revenue goes into services that benefit Falkland Island residents.
FIGURE 1Loligo ITEQ Holdings in 2011
205Input-based rights: the Falkland Islands Loligo squid fishery
The structure of the current fee system does not discourage fishing, but it does potentially discourage investment back into the fishery reducing the growth and long-term profitability of the sector. A study was commissioned to analyse different fee structures based on a number of criteria. Results indicate that the preferred fee option is assessed as being the option which has the least negative impact on investment propensity. The optimum fee level in absolute terms is viewed as being a complicated issue. “On the one hand, fishing fees can only reduce economic efficiency in the fishing industry and retard its productivity growth. On the other hand, fishing fees are needed to fund government expenditures which may contribute both to social well-being and future economic growth.”
The study of fundamental fee types suggests that fixed fees and fees on profits (with investment deductibility) generally score highest on the criteria specified as well as the overall preference scores. This suggests that a composite fee consisting of a fixed fee and a profits component in some proportion may be most preferable. While there is not a strong evidence for any particular combination, it appears that a 20 percent fixed fee and 80 percent profit fee may be appropriate.
Due to the profits component of the proposed composite fee and the deductibility of certain investments, it is somewhat more administratively demanding than the current fee. The additional administration in terms of administrative labour is estimated to be some 3-4 man-months per year on average. This amount is not significant compared with the estimated economic benefits of the proposed composite fee. As of June 2012 a final decisions has not been made and there was a recommendation to continue the process.
CONCLUSION Small island territories face a challenge in maintaining local ownership of fisheries resources and maximizing economic benefits along the value chain. Operating processing plants and providing dockage for a fishing fleet may not be cost effective. Joint ventures with foreign companies to operate fishing vessels, and process and market fishery products are inevitable. However there are always concerns about “local” ownership and participation and in the case the case of the Falkland Islands this was achieved through restrictions on local ownership of ITQs.
The Falkland fisheries are among the few fisheries in the word that are consistently generating substantial rents. These rents, however, differ across fisheries and are also highly variable over time depending on stocks, catches, input and output prices. Over the past few years these rents appear to have generally ranged between 10-40 percent of revenues depending on the fishery. Though a recent report summarizing an economic analysis indicates that the rent from squid revenues amount to about 67 percent of the total gross revenues and 80 percent of net revenue. Special fishery fees are relatively uncommon and largely unheard of at the levels entailed in Falkland fishing fees. Nonetheless, government income is a high priority and it is expected that there will be a reforms of the present fee structure and programme design to foster improved economic performance and increased rent extraction.
REFERENCESCorbett, G., & Costello, C. 2011. The Value of Secure Property Rights: Evidence from
Global Fisheries. Working Paper 17019. Cambridge, Massachusetts, National Bureau of Economic Research
Director of Natural Resources. 2012. Resource Rents: Consultants report & next steps. Paper number 52/12. Falkland Islands, Falkland Islands Director of Natural Resources.
Falkland Islands Government. 2003. Falkland Islands fisheries policy review: review of licensing policy. Falkland Islands, Department of Fisheries.
206 Effort rights in fisheries management – General principles and case studies from around the world
Falklands Islands Government. 2003. The fisheries policy review. Executive Council Paper 86/03. Falkland Islands, Department of Fisheries.
Falklands Islands Government. 2008. Taxes Amendment Bill. Paper No. 53/08. Report of the Company Taxation Officer. Falkland Islands, Department of Fisheries.
Falklands Islands Government. 2012. Fisheries Department Fisheries Statistics, Volume 16. Falkland Islands, Department of Fisheries.
Harte, M., & Barton, J. 2006. Reforming management of commercial fisheries in a small island territory. Marine Policy, 31: 371–378.
Harte, M., & Barton, J. 2007. Balancing local ownership with foreign investment in a small island fishery. Ocean & Coastal Management, 50: 523–537.
José, S. 2010. Economic Briefing and Forecast for the Falkland Islands. Falkland Islands, Economic and Falkland Islands Government.
Kompas, T., & Che, N. 2004. A Bioeconomic Model of the Australian Northern Prawn Fishery: Management Options under Uncertainty. Commonwealth of Australia, Canberra; ABARE (Department of Agriculture, Fisheries and Forestry.)
Newell, R., Papps, K. L., & Sanchirico, J. N. 2005. Asset Pricing in Created Markets for Fishing Quotas. Discussion Paper, Resources for the Future. RFF DP 05-46., Washington, D.C., Resources for the Future
Owen, A.D. 1998. Measurement and Collection of Economic Rent in a Managed Tuna Fishery. In Cayre, P. & Le Gall, J.Y. Tuna Prospects and Strategies for the Indian Ocean: Proceedings of the International Tuna Conference 1996, Mauritius, Maurice. COI/Orstom, Paris, collection Colloques et Séminaires, pp. 195-208.
Rodhouse, P. G., 2001. Managing squid fisheries in variable environments. Fisheries Research, 54: 3-8.
Villasante, S. & Sumaila, R. 2009. Estimating the economic benefits of cooperative and non-cooperative management of the Illex argentinus fishery in South America. LACEEP Working Paper Series No. 2009-WP14.
207
Rights-based fisheries management in a developing country: a case study of Malaysia
Shaufique F. Sidique, Universiti Putra MalaysiaE-mail: [email protected]
Kusairi Mohd Noh, Universiti Putra MalaysiaE-mail: [email protected]
Kuperan Visnawathan, Universiti Utara MalaysiaE-mail: [email protected]
INTRODUCTIONThe current trend in marine fisheries resources is a global concern today. Fish stocks have declined considerably over the past decade and this is primarily because of overfishing. The introduction of new fishing technologies have led to greater fishing capacity and efficiency. Most commercial fishing vessels are now equipped with high technology equipment such as fish-finding sonar that can accurately locate fish population and also powerful gears and factory-like on-board processing plants to haul and process their catch. The capacity and efficiency of today’s modern vessels is unmatched by the nature’s ability to replenish its marine stocks. We have also seen the increase in efficiency of small-scale fishers. Small fishing boats are now equipped with modern technologies such as GPS to boost catch efficiency. Some of these equipment and inputs are even subsidized in certain countries in the pretext of improving livelihoods of small-scale fishers. In short, the current extraction rate of our marine resources is higher than its biological replenishment rate. The problem is compounded when excessive fishing capacity has also damaged marine habitat and has altered the marine ecosystem, further threatening the survival and sustainability of our marine resources.
Malaysia faces most the above problems, and in addition, the current growth of population is putting pressure on the demand for fish. The supply of fish is currently met by landings of the commercial fisheries and also imports. Apart from commercial fisheries, this country also relies on the output from the small-scale fisheries (SSF) sector. Although SSF contributes only around 20 percent of the total marine landings in Malaysia (Annual Fisheries Statistics, 2010), the significance of the SSF sector lies on its contribution in providing employment to the coastal population and also food security to the nation as a whole. The number of vessels categorized as small-scale forms a majority (84 percent) of total vessels registered (Annual Fisheries Statistics, 2010). In view of the large presence of small-scale fishers in Malaysia, livelihood and poverty are major issues to the government. A report published by the Department of Fisheries (DoF) in 2008 indicates that 46 percent of these fishers are categorized as poor, with 8 percent considered in the extreme poverty group. In improving the livelihoods of fishers, the government has provided subsidies for diesel and gear, along with landing incentives and fisher subsistence allowances. However, these policies have unintended consequences of retaining the present fishers who are becoming highly
208 Effort rights in fisheries management – General principles and case studies from around the world
dependent on subsidies and have also attracted more people into this industry. The number of registered fishers with traditional gears has increased from 24 120 in 2000 to 44 115 in 2010.
The problems of declining fish stocks and degradation of the environment impose further challenges to fisheries management. Among the major solutions include effort control and output control. Effort control can take the form of input controls such as controlling boat and gear licenses, fishing days, and gear regulations. Examples of output controls include catch quotas and catch restrictions. Effort control is widely implemented and is also arguably more effective in implementation and monitoring than output control. However, in Malaysia, there are virtually no policies on output control and very limited policies on effort control exist. It would be difficult to implement output control because of the difficulties in obtaining accurate landing records and preventing under-reporting, along with enforcement issues. Effort control on the other hand, is a slightly more feasible alternative in managing fish stocks in Malaysia. This paper discusses rights-based fisheries management as a means for effort control in the Malaysian fisheries industry. The following section provides the background on Malaysian fisheries institutions and governance. Section 3 discusses multi-gear and multi-species fisheries in Malaysia while Section 4 discusses the effectiveness of the fisheries policy. Section 5 concludes.
MALAYSIAN FISHERIES GOVERNANCE AND INSTITUTIONSIn order to understand fisheries governance and institutions in Malaysia, one must first understand the country’s legal system by looking at the federal and state relationship in Malaysia as defined by the constitution. Malaysia practises the concept of Federalism where the 13 states unite to form a central government, allowing the central or federal government to administer certain affairs for the purpose of uniformity. Under Federalism, the states still retain independence of action in other matters. The separation of powers between the Federal and State governments in Malaysia is provided for in the supreme law of the country through the Federal Constitution. Article 74 of the Federal Constitution defines the extent of the legislative powers of the Federal and State legislations. The Federal List specifies subjects or matters where only Parliament can legislate, for example external affairs, defence, internal security and education. The State List empowers the state to regulate matters pertaining to forestry, land, riverine fisheries and agriculture.
The Malaysian fishery industry can be divided into 3 main sectors – marine capture fishery (inshore and deep sea), aquaculture (marine, brackish water, freshwater), and inland capture fishery. The laws that regulate fisheries activities in Malaysia are divided into the federal law, namely the Fisheries Act 1985 (FA, 1985) that was later revised in 1993, and the state laws. The Fisheries Act governs matters related to the administration and management of fisheries, including the conservation and development of maritime and estuarine fishing and fisheries in Malaysia waters, protection to aquatic mammals and turtles and riverine fishing in Malaysia and also matters connected to establishment of marine parks and marine reserves.
The Act defines the Malaysian fisheries waters as maritime waters under the jurisdiction of Malaysia over which exclusive fishing rights or fisheries management rights are claimed by law and also includes the internal waters of Malaysia, the territorial sea of Malaysia and the maritime waters comprised in the exclusive economic zone of Malaysia.
The authority to implement the Act in relation to Malaysian fisheries falls within the jurisdiction of the Minister of the Federal Government in charge of Fisheries, with the assistance of the Director-General of Fisheries (DG). As stipulated in the Act, some of the responsibilities of the DG include preparing and reviewing fisheries plan, approving licenses and permits for new fishing vessels and also rejecting, renewing or
209Rights-based fisheries management in a developing country: a case study of Malaysia
suspending any license if there is breech of any provision. However, the supervisory power of the DG does not extend to inland fisheries matters in the States of Malaysia. The appointment of the inland and deputy inland fisheries officers falls under the purview of the state. Although empowered to cancel or suspend licenses or permits whenever there is violation, there is no provision in Fisheries Act 1985 for the DG to prosecute fisheries offenders. The power to prosecute offenders can only be instituted with the consent of the Public Prosecutor. The DoF or state DoF officers can arrest offenders, but they need the consent of the Public Prosecutor to prosecute the offender.
The major fisheries related institutions in Malaysia are the Dof, the Malaysian Maritime Enforcement Agency (MMEA), the Fisheries Development Authority of Malaysia (LKIM), the Marine Department, Environmental Department, and the Wildlife Department. The DoF duties are to regulate the fisheries activities while LKIM regulates the needs of the fishermen and the Maritime Department issues licenses to vessels. The Environmental Department play their role in relation to regulating against the marine pollution, including ordering the EIA report for the intended aquaculture premise. Protection of the marine wildlife species and their habitats falls within the power of the Wildlife Department. The power to carry out enforcement and bring the offenders to court lies under the authorities of the MMEA. Section 6 of Malaysian Maritime Enforcement Agency Act 2004 (MMEA, 2004) lists the functions of the MMEA, which includes the function to enforce law and order under any federal law, while section 7 of the MMEA 2004 provides for MMEA’s powers. As stated above, MMEA functions are overlapping with the DoF and Environmental Department. The overlapping of powers occurs among the agencies due to the overlapping scope of functions and powers between the government agencies.
MMEA can only carry out its functions and powers within the Malaysian Maritime Zone that is the internal waters, territorial sea, continental shelf, exclusive economic zone and the Malaysian fisheries waters, and includes the air space over the Zone. As a safeguarding measure, the MMEA 2004 also provides that MMEA officers are equivalent to ranks of police officers, customs officers, and any other officers under other written law. Section 16 of the MMEA 2004 provides that MMEA and the relevant agencies shall closely coordinate, consult and liaise with each other and render to assistance to one another for carrying out the provisions of this Act.
The DoF divides the Malaysian fishery waters into four fishing zones designated for specific fishing gear, classes of vessels, and ownership. The aim of zoning is to provide equitable allocation of resources and reduce conflict between traditional and commercial fishers. The four management zones are as follows:
• Zone A: Fewer than 5 nautical miles from shore. This area is reserved for small-scale fishers using traditional fishing gear and owner-operated vessels of fewer than 10 GT;
• Zone B: beyond 5 nautical miles to 12 nautical miles. This area is opened to owner-operated commercial fishing vessels of fewer than 40 GRT using trawl nets and purse seine nets;
• Zone C: beyond 12 nautical miles to 30 nautical miles. This area is opened to commercial fishing vessels of more than 40 GRT using trawl nets and purse seine nets;
• Zone C2: beyond 30 nautical miles. This area is opened to deep-sea fishing vessels of 70 GRT and above.
MULTI-GEAR AND MULTI-SPECIES FISHERYMalaysian fisheries can be classified into two broad categories – commercial and small-scale, or traditional fishery. This classification is based mainly of the gears, and vessel size or capacity. Small-scale fishers usually operate outboard-powered vessels of fewer than ten gross tonnages (GRT) and they fish within five nautical miles from the shore
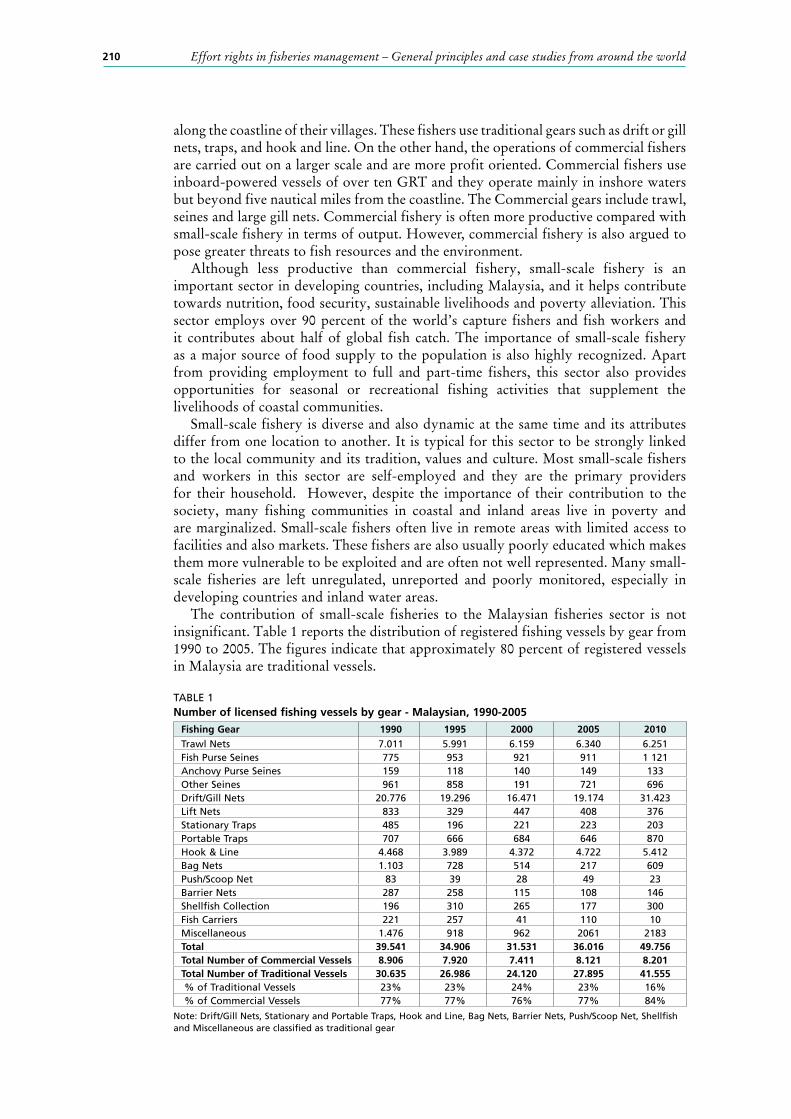
210 Effort rights in fisheries management – General principles and case studies from around the world
along the coastline of their villages. These fishers use traditional gears such as drift or gill nets, traps, and hook and line. On the other hand, the operations of commercial fishers are carried out on a larger scale and are more profit oriented. Commercial fishers use inboard-powered vessels of over ten GRT and they operate mainly in inshore waters but beyond five nautical miles from the coastline. The Commercial gears include trawl, seines and large gill nets. Commercial fishery is often more productive compared with small-scale fishery in terms of output. However, commercial fishery is also argued to pose greater threats to fish resources and the environment.
Although less productive than commercial fishery, small-scale fishery is an important sector in developing countries, including Malaysia, and it helps contribute towards nutrition, food security, sustainable livelihoods and poverty alleviation. This sector employs over 90 percent of the world’s capture fishers and fish workers and it contributes about half of global fish catch. The importance of small-scale fishery as a major source of food supply to the population is also highly recognized. Apart from providing employment to full and part-time fishers, this sector also provides opportunities for seasonal or recreational fishing activities that supplement the livelihoods of coastal communities.
Small-scale fishery is diverse and also dynamic at the same time and its attributes differ from one location to another. It is typical for this sector to be strongly linked to the local community and its tradition, values and culture. Most small-scale fishers and workers in this sector are self-employed and they are the primary providers for their household. However, despite the importance of their contribution to the society, many fishing communities in coastal and inland areas live in poverty and are marginalized. Small-scale fishers often live in remote areas with limited access to facilities and also markets. These fishers are also usually poorly educated which makes them more vulnerable to be exploited and are often not well represented. Many small-scale fisheries are left unregulated, unreported and poorly monitored, especially in developing countries and inland water areas.
The contribution of small-scale fisheries to the Malaysian fisheries sector is not insignificant. Table 1 reports the distribution of registered fishing vessels by gear from 1990 to 2005. The figures indicate that approximately 80 percent of registered vessels in Malaysia are traditional vessels.
TABLE 1Number of licensed fishing vessels by gear - Malaysian, 1990-2005
Fishing Gear 1990 1995 2000 2005 2010Trawl Nets 7.011 5.991 6.159 6.340 6.251Fish Purse Seines 775 953 921 911 1 121Anchovy Purse Seines 159 118 140 149 133Other Seines 961 858 191 721 696Drift/Gill Nets 20.776 19.296 16.471 19.174 31.423Lift Nets 833 329 447 408 376Stationary Traps 485 196 221 223 203Portable Traps 707 666 684 646 870Hook & Line 4.468 3.989 4.372 4.722 5.412Bag Nets 1.103 728 514 217 609Push/Scoop Net 83 39 28 49 23Barrier Nets 287 258 115 108 146Shellfish Collection 196 310 265 177 300Fish Carriers 221 257 41 110 10Miscellaneous 1.476 918 962 2061 2183Total 39.541 34.906 31.531 36.016 49.756Total Number of Commercial Vessels 8.906 7.920 7.411 8.121 8.201Total Number of Traditional Vessels 30.635 26.986 24.120 27.895 41.555 % of Traditional Vessels 23% 23% 24% 23% 16% % of Commercial Vessels 77% 77% 76% 77% 84%
Note: Drift/Gill Nets, Stationary and Portable Traps, Hook and Line, Bag Nets, Barrier Nets, Push/Scoop Net, Shellfish and Miscellaneous are classified as traditional gear
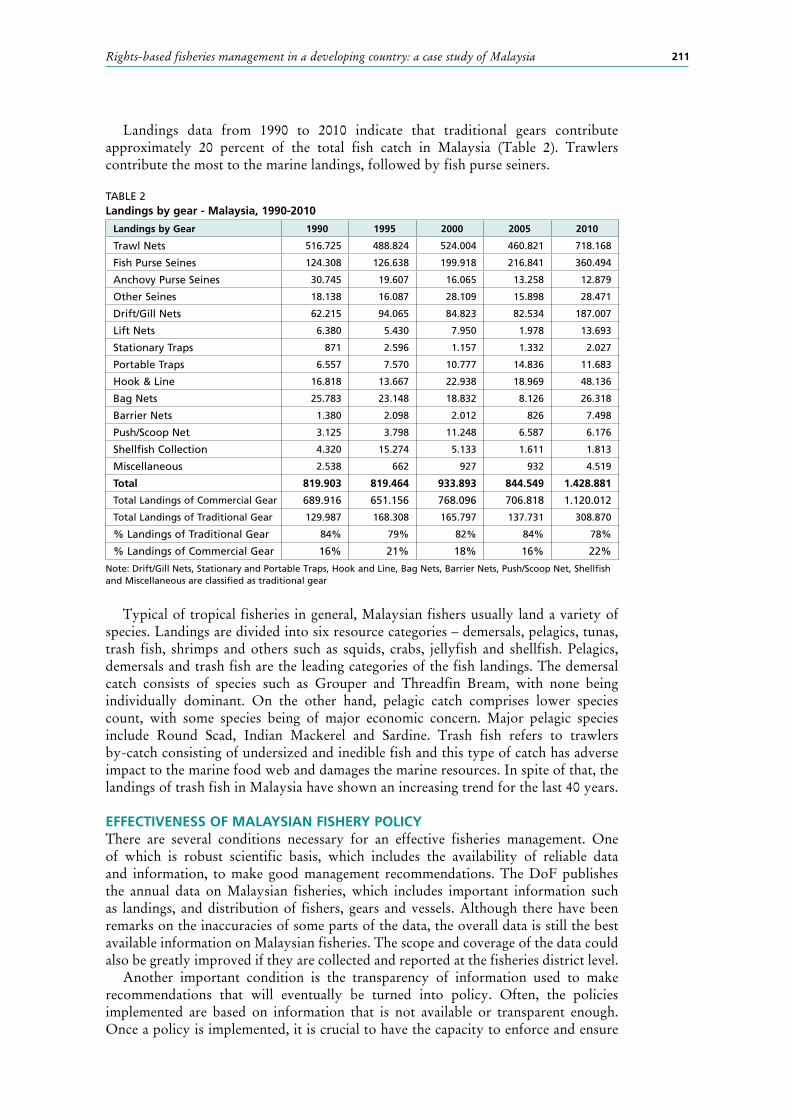
211Rights-based fisheries management in a developing country: a case study of Malaysia
Landings data from 1990 to 2010 indicate that traditional gears contribute approximately 20 percent of the total fish catch in Malaysia (Table 2). Trawlers contribute the most to the marine landings, followed by fish purse seiners.
TABLE 2Landings by gear - Malaysia, 1990-2010
Landings by Gear 1990 1995 2000 2005 2010
Trawl Nets 516.725 488.824 524.004 460.821 718.168
Fish Purse Seines 124.308 126.638 199.918 216.841 360.494
Anchovy Purse Seines 30.745 19.607 16.065 13.258 12.879
Other Seines 18.138 16.087 28.109 15.898 28.471
Drift/Gill Nets 62.215 94.065 84.823 82.534 187.007
Lift Nets 6.380 5.430 7.950 1.978 13.693
Stationary Traps 871 2.596 1.157 1.332 2.027
Portable Traps 6.557 7.570 10.777 14.836 11.683
Hook & Line 16.818 13.667 22.938 18.969 48.136
Bag Nets 25.783 23.148 18.832 8.126 26.318
Barrier Nets 1.380 2.098 2.012 826 7.498
Push/Scoop Net 3.125 3.798 11.248 6.587 6.176
Shellfish Collection 4.320 15.274 5.133 1.611 1.813
Miscellaneous 2.538 662 927 932 4.519
Total 819.903 819.464 933.893 844.549 1.428.881
Total Landings of Commercial Gear 689.916 651.156 768.096 706.818 1.120.012
Total Landings of Traditional Gear 129.987 168.308 165.797 137.731 308.870
% Landings of Traditional Gear 84% 79% 82% 84% 78%
% Landings of Commercial Gear 16% 21% 18% 16% 22%
Note: Drift/Gill Nets, Stationary and Portable Traps, Hook and Line, Bag Nets, Barrier Nets, Push/Scoop Net, Shellfish and Miscellaneous are classified as traditional gear
Typical of tropical fisheries in general, Malaysian fishers usually land a variety of species. Landings are divided into six resource categories – demersals, pelagics, tunas, trash fish, shrimps and others such as squids, crabs, jellyfish and shellfish. Pelagics, demersals and trash fish are the leading categories of the fish landings. The demersal catch consists of species such as Grouper and Threadfin Bream, with none being individually dominant. On the other hand, pelagic catch comprises lower species count, with some species being of major economic concern. Major pelagic species include Round Scad, Indian Mackerel and Sardine. Trash fish refers to trawlers by-catch consisting of undersized and inedible fish and this type of catch has adverse impact to the marine food web and damages the marine resources. In spite of that, the landings of trash fish in Malaysia have shown an increasing trend for the last 40 years.
EFFECTIVENESS OF MALAYSIAN FISHERY POLICYThere are several conditions necessary for an effective fisheries management. One of which is robust scientific basis, which includes the availability of reliable data and information, to make good management recommendations. The DoF publishes the annual data on Malaysian fisheries, which includes important information such as landings, and distribution of fishers, gears and vessels. Although there have been remarks on the inaccuracies of some parts of the data, the overall data is still the best available information on Malaysian fisheries. The scope and coverage of the data could also be greatly improved if they are collected and reported at the fisheries district level.
Another important condition is the transparency of information used to make recommendations that will eventually be turned into policy. Often, the policies implemented are based on information that is not available or transparent enough. Once a policy is implemented, it is crucial to have the capacity to enforce and ensure
212 Effort rights in fisheries management – General principles and case studies from around the world
compliance with regulation. The primary entities responsible for the implementation of fisheries policy in Malaysia are the DoF and LKIM. The DoF is in charge of issuing fishing licenses, import and export permits for fish and also certification procedures. Apart from those, the department also has the authority to institute and implement fisheries policies such as zoning, vessel and gear restrictions, also resource conservation. On the other hand, LKIM is mainly responsible for overseeing the development of the fisheries industry in Malaysia. Their functions include managing fishers’ associations in Malaysia, marketing and trading of fish, improving productivity, and administering government subsidy programmes.
Implementation and enforcement of regulations is one of the biggest challenges in fisheries management. Nevertheless, the fishing industry in Malaysia to an extent is well regulated by the DoF. There are proper procedures in place for the issuance of licenses and permits and there is also clear demarcation of fishing zones. The licensing policy which is the primary rights-based instrument in Malaysia was initially implemented to provide fishing rights in order to reduce conflicts between artisanal fishers and trawlers. The licensing policy also has other objectives such as to prevent over-exploitation of fishery resources in inshore waters, to create a more equitable distribution of fishing throughout the Malaysian waters, to promote the development of off-shore commercial fishing, and to restructure the pattern of ownership of fishing capital in accordance with the New Economic Policy. The enforcement of regulations in the marine waters is carried out by MMEA. The DoF has to work closely with MMEA to ensure effective enforcement of fisheries regulations.
Zoning of marine waters is another form of rights-based management to control fishing effort. Zoning establishes fishing rights for different fisher groups with different vessel sizes and gears and it ensures more equitable distribution of fishing, fishing effort, ownership and benefits. Under the zoning system, fishing effort is further regulated through license limitation in each zone to prevent over-exploitation. Zone A, which is fewer than 5 nautical miles, is reserved exclusively for artisanal fishers using traditional gears that are more conservation friendly. Fishers operating commercial gears are prohibited from operating in this area. To curb with dwindling marine resources, the DoF is currently not issuing new licenses to operate in Zones A, B, and C. The department is also not issuing new permits to operate in the C2 zone but the permit to operate in the C3 zone which is in international waters is still open.
Although another important condition for an effective fisheries management is minimizing subsidies, and the Malaysian fishery is still a heavily subsidized industry. The Malaysian fisheries management policy is multi-objectives and not based on output optimization and stock conservation alone. Socio-economic and political aspects are also given major consideration in policy formulation. A human rights based approach has always been the primary agenda of the country’s policymakers. Fishers, particularly the ones with low fishing capital, are generally poor and haveaverage incomes among the lowest in the nation. Hence, subsidies and subsistence-based policies are targeted mainly to address issues of low income and poverty among small-scale fishers.
The subsidy programmes for the fisheries industry in Malaysia comprise livelihood subsidy, catch subsidy and fuel subsidy. These subsidies are offered to two different fisher groups. The first group is in-shore fishers who are entitled to a livelihood subsistence of RM200 per month, a catch subsidy of RM0.10 per kg of catch with a maximum of RM200 per month and a maximum of 2 000 litres of diesel or petrol at a highly subsidized price of RM0.60 and RM0.70 per litre respectively1. The second
1 The current per liter market prices for RON95 petrol and diesel are RM1.90 and RM1.80 respectively.
213Rights-based fisheries management in a developing country: a case study of Malaysia
group is off-shore or deep sea fishers, trawlers and purse seiners also receive the same livelihood subsistence as the first group. However, this group is entitled to a higher catch subsidy, with a maximum of RM500 per month and a higher maximum amount of fuel that can be claimed per month, ranging from 5 000 to 6 000 litres.
The fuel subsidy programme began in June 2008, and as of September 2011, a total of 4.033 million litres of fuel has been supplied to fishers. The amount of subsidized fuel distributed in 2008 was almost as much as the amount of fuel distributed in the whole of 2009, although the number of eligible fishers in 2008 were only half of the number of eligible fishers in 2009. This was primarily attributed to poor management during the initial part of the programme. The fisheries output receiving catch subsidy was reported to have increased from 51 706 tonnes in 2008 to 87 012 tonnes in 2011. The total number of fishers receiving livelihood subsistence has increased substantially from 276 529 in 2008 to 485 945 in 2011.
On the whole, the Malaysian government has given out a significant amount of subsidies to the fisheries sector. The total amount of subsidies has increased from RM732 million in 2008 to RM865 million in 2010, and this figure is expected to increase in the future. However, the effectiveness of these subsidy programmes is questionable. Data on productivity is still showing a declining trend despite the introduction of various subsidies. Reward on catch and lower than market value fuel prices failed to prevent the decline in output per unit of fisher. In fact, these programmes might have perverse effects on fisheries productivity. The introduction of subsistence payments has attracted more fishers into this industry and this increases the pressure on the fishing stock. Catch subsidy can also be argued to have the same effect on stock as it provides an incentive for fishers to increase fishing efforts. Fuel subsidy is the largest component of the subsidy programmes and the major concern of this type of subsidy is its effects on the natural resource and the environment. Apart from pollution, fuel subsidy increases the already high fishing effort, and this will reduce the resource stock. Data have shown that that fishers need to spend more time fishing to be able to catch the same amount of fish as before.
CONCLUSIONThe main objective of effort control which is a form fishing rights is primarily to conserve fishing stocks and to ensure sustainable fisheries in the long run. However, the fisheries management objective for a developing country such as Malaysia is broader in the sense that it needs to take into account not only fishing rights, but more importantly the human rights of fishers. Malaysia does not adopt fishing rights based approaches such as transferable quotas and output quotas. The adoption of input restrictions is also limited to gear types and does not extend to other effort-based restrictions such as the number of fishing days. The only effective form of effort control in this country is through vessel and gear licensing. There are proper licensing procedures established but there are still issues related to enforcement as evidenced by the prevalence of IUU fishing. This problem can be solved by strengthening the coordination between all levels of the DoF, MMEA, Marine Parks, and Maritime Department in enforcing the fisheries regulations.
Some of the current subsidy programmes are important to secure the basic human rights of fishers. Subsidies provided to these poor fishers can be considered as some form of insurance premium to food security of this country. The basic livelihoods of these fishers need to be taken care of before they are able to fish and supply our food source. However, there is also a need to withdraw gradually these subsidies in order to increase the efficiency of the fisheries sector. The policy of giving subsidies across the board has to be re-evaluated. Subsidies allocated for commercial fishery have to be substantially reduced, if not completely eliminated.

214 Effort rights in fisheries management – General principles and case studies from around the world
REFERENCESGovernment of Malaysia. 1985. Fisheries Act. Kuala Lumpur. (available at http://faolex.
fao.org/docs/pdf/mal1869.pdf).Majid, S.A. 1985. Controlling Fishing Effort: Malaysia’s Experience and Problems. FAO
Fisheries Technical Report. (also available at http://www.fao.org/docrep/005/ac750e/AC750E10.htm).
Saharuddin, D. 1995. Development and management of Malaysian marine fisheries. Marine Policy, 19: 115-26.
Shepherd, J.G. 2003. Fishing effort control: Could it work under the common fisheries policy? Fisheries Research, 63: 149–153.
215
The effort control programme in the northeast United States groundfish fishery
Eric Thunberg, NMFS, Office of Science and Technology, Economic and Social Analysis DivisionE-mail: [email protected]
Min-Yang Lee, Northeast Fisheries Science Center, Social Sciences BranchE-mail: [email protected]
INTRODUCTIONThe New England groundfish fishery is prosecuted in the Northwest Atlantic waters of the United States Exclusive Economic Zone (EEZ) by fishers using both fixed (gillnet and hook gears including bottom longline, tub trawls, and rod and reel) and trawl gears. Management measures for the fishery are developed by the New England Fishery Management Council (NEFMC or Council) and implemented by the National Marine Fisheries Service (NMFS). The groundfish resource is distributed throughout waters of the Gulf of Maine and Georges Bank and to a lesser extent Southern New England and the Mid-Atlantic bight. In biological terms, the fishery is defined by the principal managed species including roundfish species of cod, haddock, Acadian redfish, pollock, white hake, and several flatfish species including yellowtail flounder, winter flounder, American plaice, and witch flounder. Some of these species (cod, haddock, yellowtail flounder, and winter flounder) are further subdivided into stock areas and the Georges Bank cod, haddock, and yellowtail flounder stocks are shared between the United States and Canada. In economic terms, the fishery is characterized by a joint production function (Squires, 1987; Kirkley and Strand, 1988): fishing vessels are likely to catch many different species (both groundfish and non-groundfish) on a single trip. In addition, a substantial amount of industry earnings comes from species that are not managed under the Northeast Multispecies Fishery Management Plan; hereafter referred to as the Groundfish Plan. These economic realities meant that the effort control programme was, by and large, a blunt instrument in meeting conservation objectives in the groundfish fishery, and led fishery managers to substitute indirect for direct effort controls. Both of these factors have implications for the effectiveness of effort controls in multispecies fisheries.
In this paper, we provide an overview of the effort control programme in the northeast United States groundfish fishery. In the first section, major programme objectives are identified. The second section describes the major features of the effort control programme and how these features have changed over time. The third section provides an evaluation of programme performance. In the fourth section, we describe the transferability provisions of the effort control programme and evaluate the implications of the design features on the market itself. In the final section, we offer some lessons learned for effort control programmes in multispecies fisheries.
216 Effort rights in fisheries management – General principles and case studies from around the world
EFFORT CONTROL PROGRAMME OBJECTIVESThe guiding principles for managing the groundfish fishery were established by the Council at the time the Groundfish Plan was adopted in 1986. The overriding management policy was to “allow the multispecies fishery to operate and evolve with minimum regulatory intervention, and…adopt initial measures to prevent stocks from reaching minimum abundance levels…” (NEFMC, 1993).
Minimum abundance levels were defined as stock sizes below which there is an unacceptably high risk of stock collapse. Additional considerations included freedom of choice for fishers and avoidance of abrupt economic dislocations in implementing the policy conditional on preventing species or species groups from falling below their minimum abundance level. If a species within a major species group were to fall below its minimum abundance level, consideration was to be given to the impact on fisheries for other species within the major species group or other species groups in restoring the species to an appropriate abundance level. This overall approach to management meant that biological objectives were to avoid collapse but not necessarily to rebuild stocks to levels capable of producing higher yield. These economic considerations, especially the avoidance of abrupt economic dislocations in particular, resulted in a tendency to adopt management strategies that phased in effort reductions in order to provide a “soft landing”.
Statement of a management policy does not assure its execution, and key groundfish stocks continued to decline below the minimum abundance levels throughout the late 1980s and early 1990s to historically low levels. In fact, a lawsuit filed by the Conservation Law Foundation was the driver forcing the Council to develop Amendment 5. Over time, a combination of additional litigation and changes in statutory requirements in Federal fisheries law compelled the Council to adopt more stringent biological objectives. Under current law, the Council must end overfishing and rebuild groundfish stocks to levels capable of achieving Maximum Sustained Yield (MSY). Additionally, annual catch limits and accountability measures must be specified for each groundfish stock.
For the most part, the Council’s economic objectives have not changed that much from the policy developed in 1986. The Council has several guiding principles. One is voiding abrupt economic dislocation. A second is freedom of choice for fishers to participate in the various species in the fishery conditional on management measures required to meet conservation requirements. This applies to individual choices as the Council has not articulated a Maximum Economic Yield (MEY) policy for the groundfish fishery as a whole. That is, the Council seeks to promote economic efficiency while also retaining a vision of a diverse fishing fleet in terms of gears, vessel size, and geographic distribution of traditional ports. Thus far, the Council has been reluctant to place limits on individual choices that would affect any particular vision of fleet diversity.
GROUNDFISH EFFORT CONTROLBoth limited access and effort control programmes were implemented in 1994 with Amendment 5 of the Groundfish Plan. Eligibility for limited access was based on landing one or more pounds of any one of the 13 species regulated under the Groundfish Plan between January 1990 and February 1991. This eligibility criterion resulted in a total of 1 754 qualifying vessels. In addition to several limited access permit categories, there were two categories of open access permits. One category was for vessels which used only hand-line hook gear (including recreational for-hire vessels). Another category was for a 500 pound possession limit. In 1994, a total of 1 635 open access hook-only permits and 1 371 possession limit-only permits were issued. An additional 15 vessel owners received both types of open access permits. Vessels issued a limited access permit were prohibited from holding either of the open access permits.

217The effort control programme in the northeast United States groundfish fishery
For most limited access vessels, the primary effort control measure was a limit on the number of Days-at-Sea (DAS) with a series of scheduled reductions over 5 years in allocated DAS to achieve a 50 percent reduction from the 1994 initial DAS allocations. Two methods were used to determine initial allocations of DAS; these are commonly referred to as “Individual” and “Fleet” allocations. The initial “Individual” allocations of DAS were based on the average of documented days absent per year during 1988-1990. During these years, fishing vessels were not required to report effort or landings on a trip-basis. Instead, NMFS port agents conducted interviews with captains returning from a fishing trip to collect information on area fished, gear used, and days absent from port. Fishing vessels that made frequent trips were interviewed more often; hence reasonably reliable data that could be used to document the number of days absent were only available for approximately 20 percent of vessels engaged in the fishery. Relative to the rest of the fleet, these vessels were larger, more likely to operate out of the major ports (e.g., Portland, Gloucester, New Bedford, Point Judith), and completed a comparatively large number of trips of longer duration. These vessels averaged 190 days absent from port during 1988-1990. The “Fleet” allocation method set the number of DAS equal to the average of documented days by the fleet (190 days). Vessel owners were given the option to qualify for an individual allocation or accept the Fleet allocation value of 190 days. Vessels opting for an individual allocation were also required to purchase a Vessel Monitoring System (VMS). Nearly all limited access qualifiers subject to the DAS controls opted for the fleet average. Although the VMS requirement may have been a deterrent for some vessel owners, for others, the fleet allocation was much larger than what their individual allocation would have been1.
Vessels opting for the Fleet allocation also had additional restrictions on how these days could be used. These restrictions included a layover provision whereby the vessel would have to declare out of groundfish for two consecutive days for every day on a groundfish trip (a trip lasting two days/48 hours, for example would require a layover of four days/96 hours) and a requirement to take days out of the groundfish fishery in a minimum of 20 day blocks. Whether for layover or “days out”, vessels were not required to be tied up at the dock, but could not fish for groundfish. Because of these two provisions, the fleet allocation was referred to as “opportunity days.” That is, given the layover and days-out requirements, there was no assurance that vessels would be able to fish for groundfish during all their opportunity days given weather conditions and the likelihood that they participated in other fisheries at different times of the year. During the first year of the Amendment, the required days out amounted to 80 DAS, but by the end of the five-year planned effort reduction programme, fleet allocation vessels would have to declare out of fishing for groundfish for 200 days and their opportunity days would decline to 110. Note that a sixth year, if deemed necessary, would have further reduced opportunity days to 88 and increased days out to 233 days.
Amendment 5 was designed to achieve a 50 percent reduction in fishing mortality for key groundfish stocks over a five-year period; thus the planned 50 percent reduction in allocated DAS. Of course, for this relationship to hold, it must be assumed that fishers would not adjust their fishing practices in response to lower DAS allocations. The veracity of the assumed 1:1 relationship between allocated DAS and fishing mortality aside, decisions made during the development of Amendment 5 set the stage for exceptions or exemptions from DAS as well as for substitution of indirect for direct effort controls that was to be a hallmark of future Groundfish Plan amendments and annual adjustments. For example, vessels that fished with fewer than 4 500 hooks or were less than 45-feet long were exempt from DAS controls. Vessels
1 The VMS requirement was not, in fact, implemented, but this would not have been known at the time vessel owners had to choose between an individual allocation and the fleet average.
218 Effort rights in fisheries management – General principles and case studies from around the world
in these permit categories represented 38 percent of the limited access fleet. Vessels fishing with gillnets (366 in 1994) were also exempted, as reduced effort was assumed to be achieved through measures to lower interactions with harbor porpoise. Including gillnet vessels, 57 percent of the limited access fleet was exempted from the primary means of controlling effort in the groundfish fishery. Fleet allocation vessels taking trips less than 24-hours were exempt from the layover requirement. Further, the initial concept of a day at sea was based on a calendar day. In this manner, a vessel that left and returned to port on the same day was considered to have taken a “day-trip”. When Amendment 5 was implemented, DAS were counted “on-the-clock”. This meant that a day-trip that was, for example, 12-hours from start to finish actually used only one-half of a DAS. As a consequence, DAS allocations were by and large not binding for vessels taking short trips.
Shortly after Amendment 5 was implemented, stock assessment advice noted that the biological objectives of the Amendment were not sufficient to rebuild the groundfish resources, and that additional effort control measures were needed to achieve a now 80 percent reduction in fishing mortality. Based on this advice, Amendment 7 to the Groundfish Plan was developed and implemented during 1996. Amendment 7 removed most of the limited access exemptions created by Amendment 5 and brought nearly all limited access vessels under the DAS umbrella. Amendment 7 also accelerated the DAS reduction schedule implemented under Amendment 5 from five or six years to two years ending in 1998. However, reductions in DAS allocations remained at no more than 50 percent from 1994 levels and the remaining 30 percent reduction in fishing mortality was to be achieved through indirect controls including trip limits, gear changes, seasonal closures, and other measures intended to reduce total removals.
Given the anticipated economic impacts engendered by the proposed changes in the effort control programme, both the layover and the days out provisions were eliminated. Of course, the underlying rationale for eliminating these regulatory impediments was based on economic efficiency. This rationale was supported (in fact, suggested) by NMFS economists as a means to improve the economic performance of the fishery. At the time, and for quite some time afterward, it was argued that removal of the layover and days out provisions was a mistake as it impaired the effectiveness of the DAS programme. In effect, removing these two provisions converted “opportunity days” into available fishing days. To see this distinction, consider that vessel owners would have ended up with 88 opportunity days under Amendment 5, but that they would also have to declare 233 days out where they would not be fishing for groundfish and hope that the weather conditions or prices would be favourable during the 88 days that were left to fish. Additionally, for any trip taken lasting more than 24-hours,captains would be required to layover at a rate of 2:1 so actual time available for fishing could have been as little as 44 days. In this respect, 88 opportunity days were illusory because vessels would be unlikely to take full advantage of their allocated DAS. However, this was thought of as a conservation benefit. Removing the layover and days out provisions meant that 88 opportunity days were equivalent to 88 fishing days that could be taken whenever market or weather conditions were most favourable, but the conservation benefit of regulated inefficiency was now lost.
Amendment 7 also provided the opportunity to carry-over up to 10 unused DAS from one year to the subsequent fishing year. This provision was primarily based on vessel safety. The Council adopted carry-over to provide a disincentive to fish near the end of the fishing year and avoid losing unused DAS because the fishing year ends in April when weather conditions can be poor. However, carry-over also meant that between seven and 10 thousand DAS over and above initial allocations now needed to be accounted for in the effort control programme, but they were not. Amendment 7 has remained the primary basis for the effort control programme in the groundfish fishery. With the transition to output-based controls, the overwhelming majority of
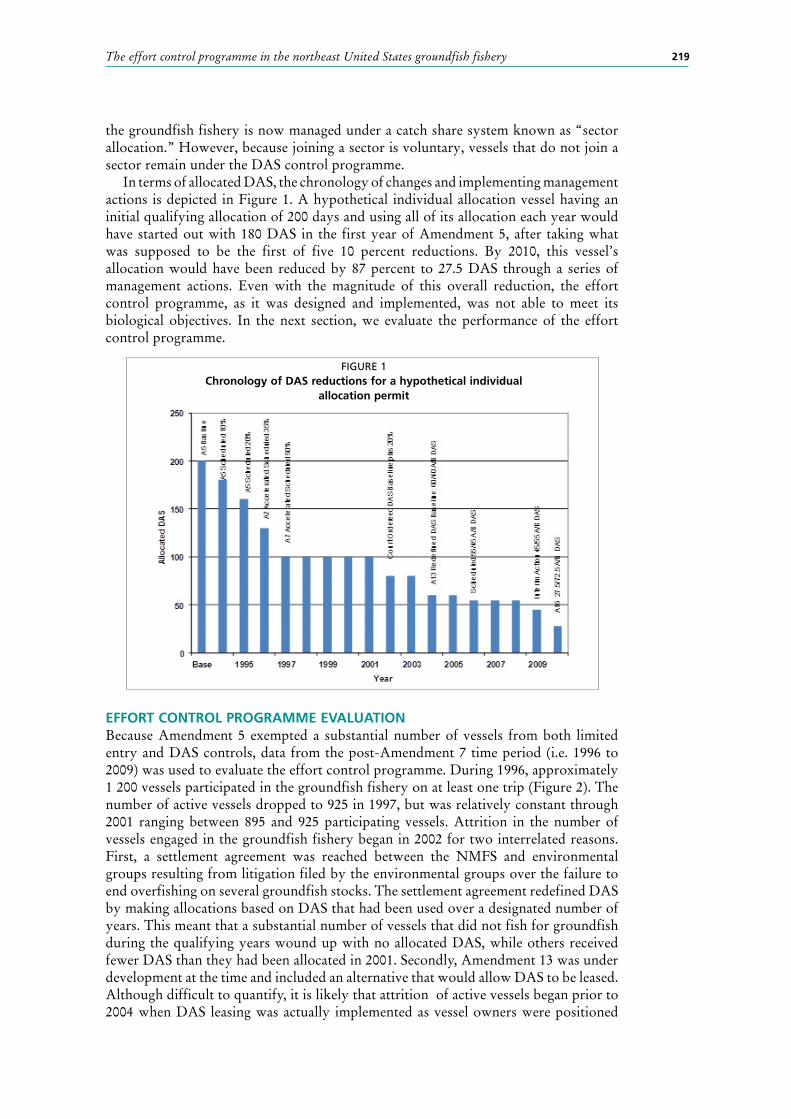
219The effort control programme in the northeast United States groundfish fishery
the groundfish fishery is now managed under a catch share system known as “sector allocation.” However, because joining a sector is voluntary, vessels that do not join a sector remain under the DAS control programme.
In terms of allocated DAS, the chronology of changes and implementing management actions is depicted in Figure 1. A hypothetical individual allocation vessel having an initial qualifying allocation of 200 days and using all of its allocation each year would have started out with 180 DAS in the first year of Amendment 5, after taking what was supposed to be the first of five 10 percent reductions. By 2010, this vessel’s allocation would have been reduced by 87 percent to 27.5 DAS through a series of management actions. Even with the magnitude of this overall reduction, the effort control programme, as it was designed and implemented, was not able to meet its biological objectives. In the next section, we evaluate the performance of the effort control programme.
EFFORT CONTROL PROGRAMME EVALUATIONBecause Amendment 5 exempted a substantial number of vessels from both limited entry and DAS controls, data from the post-Amendment 7 time period (i.e. 1996 to 2009) was used to evaluate the effort control programme. During 1996, approximately 1 200 vessels participated in the groundfish fishery on at least one trip (Figure 2). The number of active vessels dropped to 925 in 1997, but was relatively constant through 2001 ranging between 895 and 925 participating vessels. Attrition in the number of vessels engaged in the groundfish fishery began in 2002 for two interrelated reasons. First, a settlement agreement was reached between the NMFS and environmental groups resulting from litigation filed by the environmental groups over the failure to end overfishing on several groundfish stocks. The settlement agreement redefined DAS by making allocations based on DAS that had been used over a designated number of years. This meant that a substantial number of vessels that did not fish for groundfish during the qualifying years wound up with no allocated DAS, while others received fewer DAS than they had been allocated in 2001. Secondly, Amendment 13 was under development at the time and included an alternative that would allow DAS to be leased. Although difficult to quantify, it is likely that attrition of active vessels began prior to 2004 when DAS leasing was actually implemented as vessel owners were positioned
FIGURE 1Chronology of DAS reductions for a hypothetical individual
allocation permit
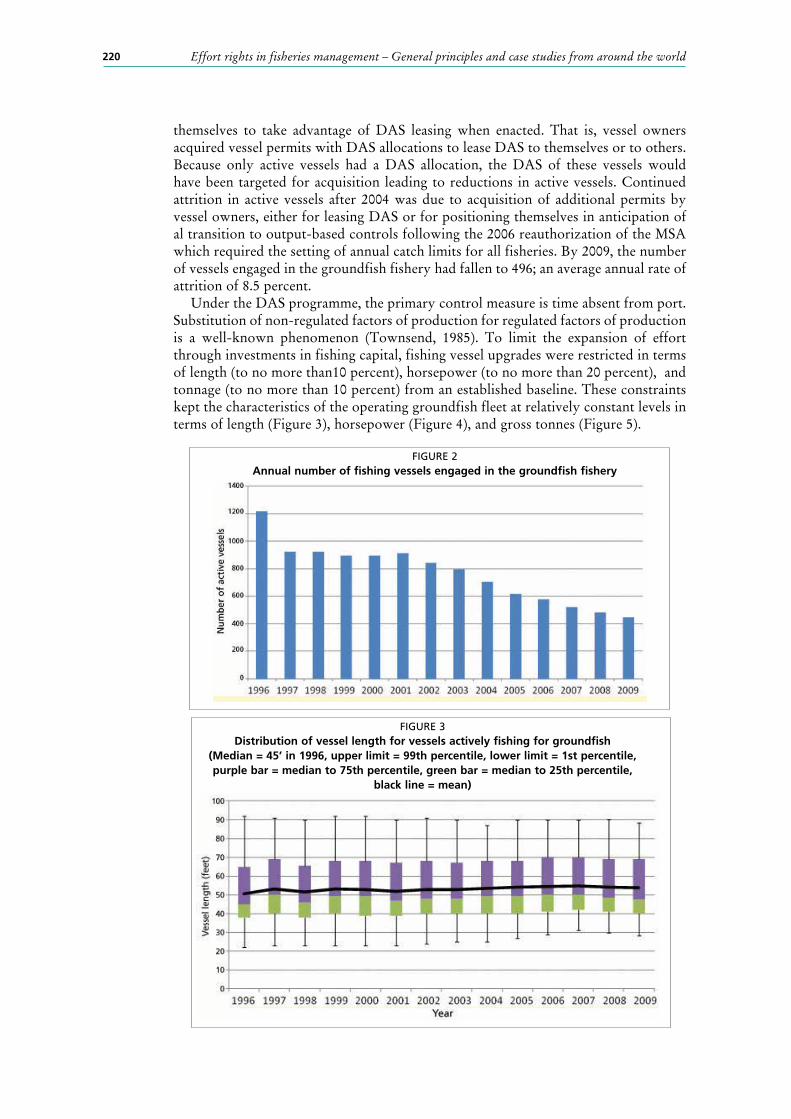
220 Effort rights in fisheries management – General principles and case studies from around the world
themselves to take advantage of DAS leasing when enacted. That is, vessel owners acquired vessel permits with DAS allocations to lease DAS to themselves or to others. Because only active vessels had a DAS allocation, the DAS of these vessels would have been targeted for acquisition leading to reductions in active vessels. Continued attrition in active vessels after 2004 was due to acquisition of additional permits by vessel owners, either for leasing DAS or for positioning themselves in anticipation of al transition to output-based controls following the 2006 reauthorization of the MSA which required the setting of annual catch limits for all fisheries. By 2009, the number of vessels engaged in the groundfish fishery had fallen to 496; an average annual rate of attrition of 8.5 percent.
Under the DAS programme, the primary control measure is time absent from port. Substitution of non-regulated factors of production for regulated factors of production is a well-known phenomenon (Townsend, 1985). To limit the expansion of effort through investments in fishing capital, fishing vessel upgrades were restricted in terms of length (to no more than10 percent), horsepower (to no more than 20 percent), and tonnage (to no more than 10 percent) from an established baseline. These constraints kept the characteristics of the operating groundfish fleet at relatively constant levels in terms of length (Figure 3), horsepower (Figure 4), and gross tonnes (Figure 5).
FIGURE 2Annual number of fishing vessels engaged in the groundfish fishery
FIGURE 3Distribution of vessel length for vessels actively fishing for groundfish
(Median = 45’ in 1996, upper limit = 99th percentile, lower limit = 1st percentile, purple bar = median to 75th percentile, green bar = median to 25th percentile,
black line = mean)
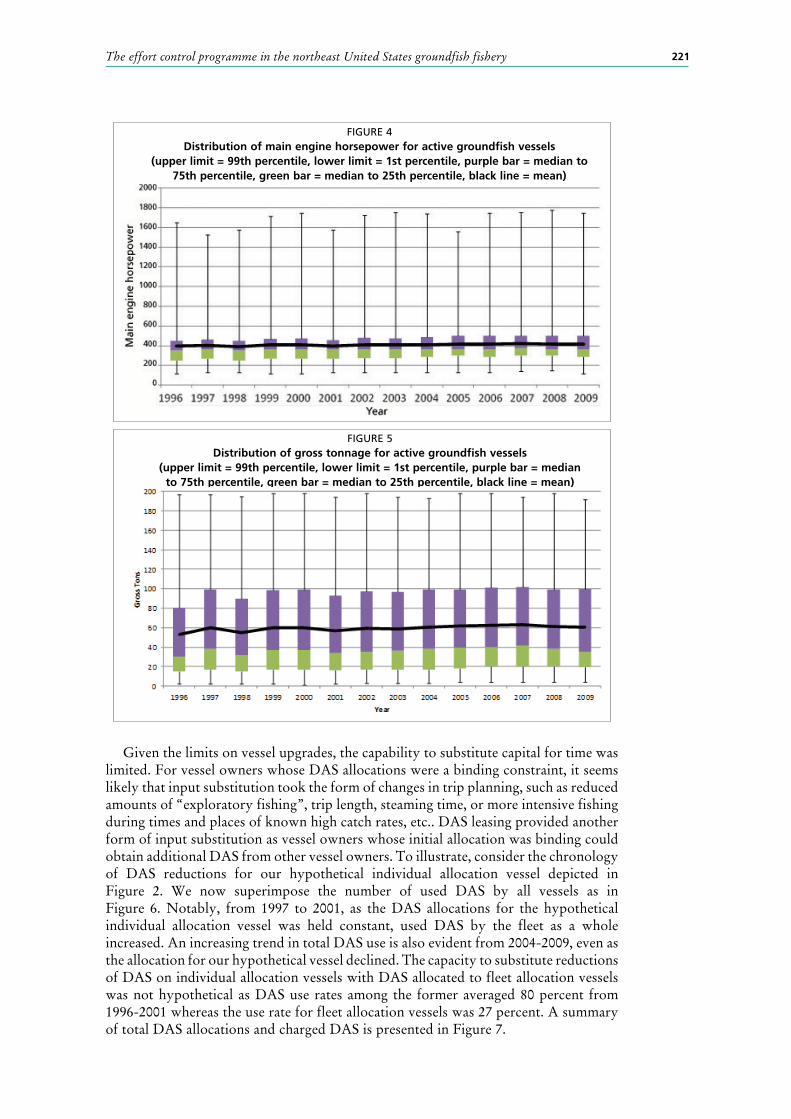
221The effort control programme in the northeast United States groundfish fishery
Given the limits on vessel upgrades, the capability to substitute capital for time was limited. For vessel owners whose DAS allocations were a binding constraint, it seems likely that input substitution took the form of changes in trip planning, such as reduced amounts of “exploratory fishing”, trip length, steaming time, or more intensive fishing during times and places of known high catch rates, etc.. DAS leasing provided another form of input substitution as vessel owners whose initial allocation was binding could obtain additional DAS from other vessel owners. To illustrate, consider the chronology of DAS reductions for our hypothetical individual allocation vessel depicted in Figure 2. We now superimpose the number of used DAS by all vessels as in Figure 6. Notably, from 1997 to 2001, as the DAS allocations for the hypothetical individual allocation vessel was held constant, used DAS by the fleet as a whole increased. An increasing trend in total DAS use is also evident from 2004-2009, even as the allocation for our hypothetical vessel declined. The capacity to substitute reductions of DAS on individual allocation vessels with DAS allocated to fleet allocation vessels was not hypothetical as DAS use rates among the former averaged 80 percent from 1996-2001 whereas the use rate for fleet allocation vessels was 27 percent. A summary of total DAS allocations and charged DAS is presented in Figure 7.
FIGURE 4Distribution of main engine horsepower for active groundfish vessels
(upper limit = 99th percentile, lower limit = 1st percentile, purple bar = median to 75th percentile, green bar = median to 25th percentile, black line = mean)
FIGURE 5Distribution of gross tonnage for active groundfish vessels
(upper limit = 99th percentile, lower limit = 1st percentile, purple bar = median to 75th percentile, green bar = median to 25th percentile, black line = mean)
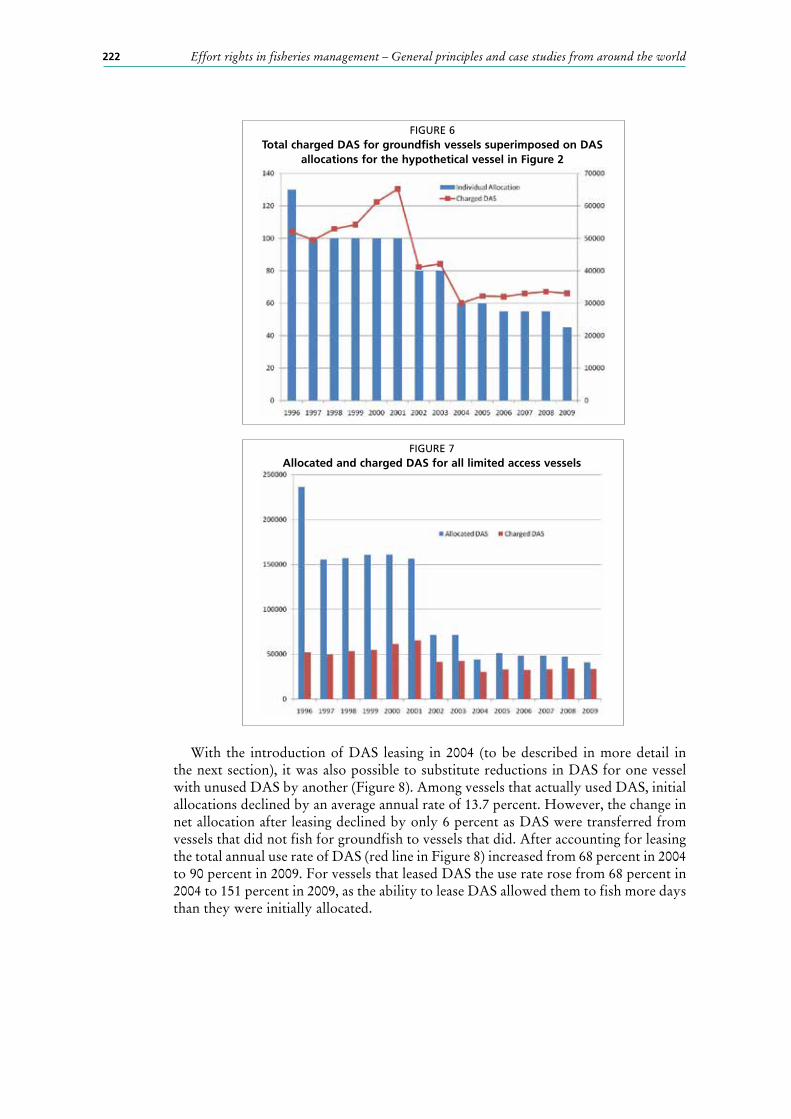
222 Effort rights in fisheries management – General principles and case studies from around the world
With the introduction of DAS leasing in 2004 (to be described in more detail in the next section), it was also possible to substitute reductions in DAS for one vessel with unused DAS by another (Figure 8). Among vessels that actually used DAS, initial allocations declined by an average annual rate of 13.7 percent. However, the change in net allocation after leasing declined by only 6 percent as DAS were transferred from vessels that did not fish for groundfish to vessels that did. After accounting for leasing the total annual use rate of DAS (red line in Figure 8) increased from 68 percent in 2004 to 90 percent in 2009. For vessels that leased DAS the use rate rose from 68 percent in 2004 to 151 percent in 2009, as the ability to lease DAS allowed them to fish more days than they were initially allocated.
FIGURE 6Total charged DAS for groundfish vessels superimposed on DAS
allocations for the hypothetical vessel in Figure 2
FIGURE 7Allocated and charged DAS for all limited access vessels
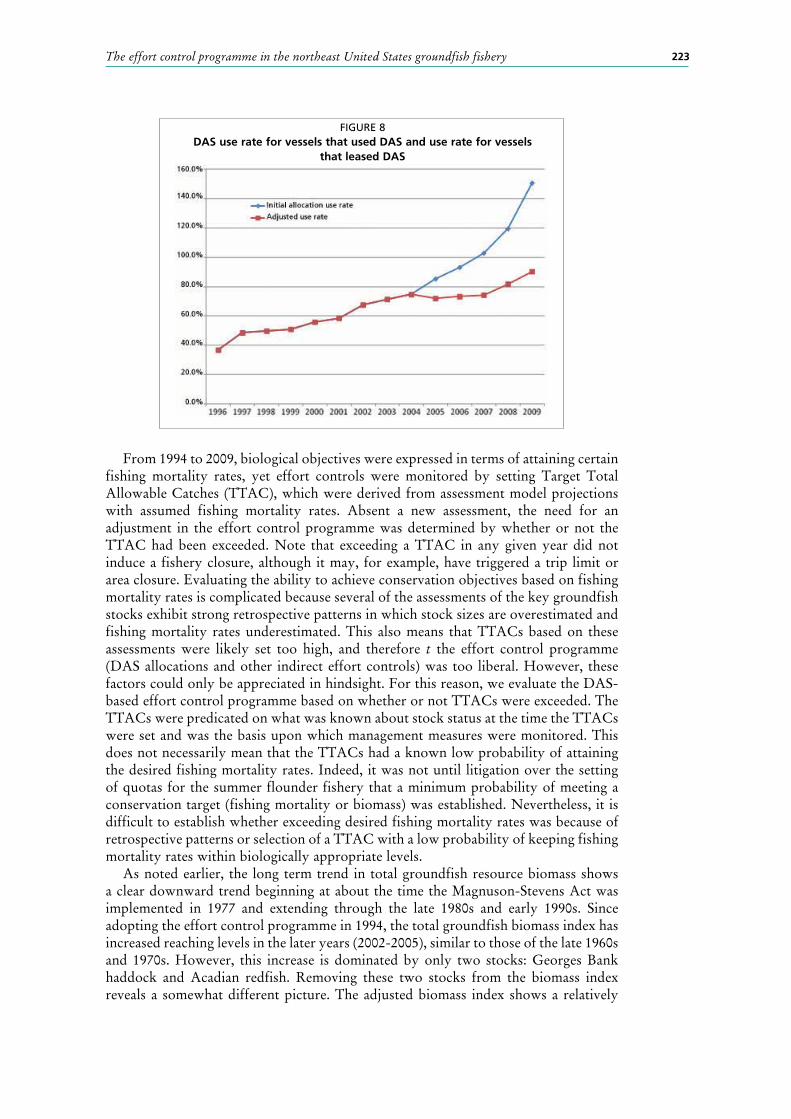
223The effort control programme in the northeast United States groundfish fishery
From 1994 to 2009, biological objectives were expressed in terms of attaining certain fishing mortality rates, yet effort controls were monitored by setting Target Total Allowable Catches (TTAC), which were derived from assessment model projections with assumed fishing mortality rates. Absent a new assessment, the need for an adjustment in the effort control programme was determined by whether or not the TTAC had been exceeded. Note that exceeding a TTAC in any given year did not induce a fishery closure, although it may, for example, have triggered a trip limit or area closure. Evaluating the ability to achieve conservation objectives based on fishing mortality rates is complicated because several of the assessments of the key groundfish stocks exhibit strong retrospective patterns in which stock sizes are overestimated and fishing mortality rates underestimated. This also means that TTACs based on these assessments were likely set too high, and therefore t the effort control programme (DAS allocations and other indirect effort controls) was too liberal. However, these factors could only be appreciated in hindsight. For this reason, we evaluate the DAS-based effort control programme based on whether or not TTACs were exceeded. The TTACs were predicated on what was known about stock status at the time the TTACs were set and was the basis upon which management measures were monitored. This does not necessarily mean that the TTACs had a known low probability of attaining the desired fishing mortality rates. Indeed, it was not until litigation over the setting of quotas for the summer flounder fishery that a minimum probability of meeting a conservation target (fishing mortality or biomass) was established. Nevertheless, it is difficult to establish whether exceeding desired fishing mortality rates was because of retrospective patterns or selection of a TTAC with a low probability of keeping fishing mortality rates within biologically appropriate levels.
As noted earlier, the long term trend in total groundfish resource biomass shows a clear downward trend beginning at about the time the Magnuson-Stevens Act was implemented in 1977 and extending through the late 1980s and early 1990s. Since adopting the effort control programme in 1994, the total groundfish biomass index has increased reaching levels in the later years (2002-2005), similar to those of the late 1960s and 1970s. However, this increase is dominated by only two stocks: Georges Bank haddock and Acadian redfish. Removing these two stocks from the biomass index reveals a somewhat different picture. The adjusted biomass index shows a relatively
FIGURE 8DAS use rate for vessels that used DAS and use rate for vessels
that leased DAS
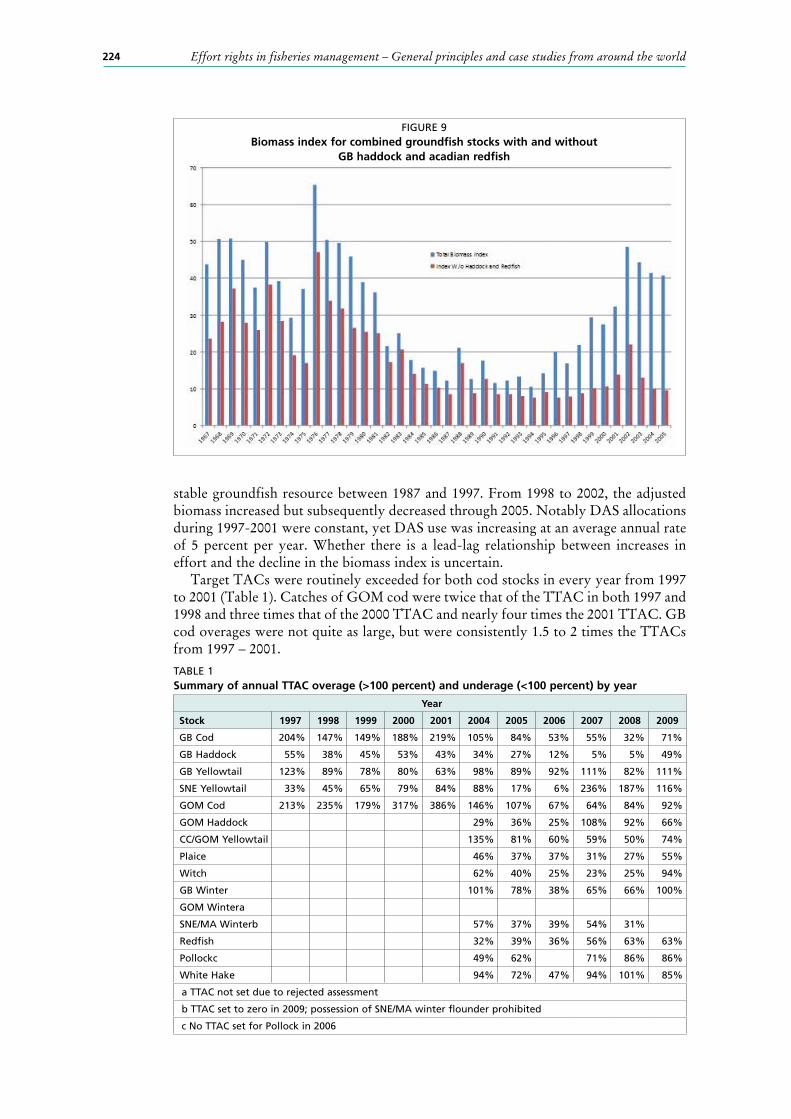
224 Effort rights in fisheries management – General principles and case studies from around the world
stable groundfish resource between 1987 and 1997. From 1998 to 2002, the adjusted biomass increased but subsequently decreased through 2005. Notably DAS allocations during 1997-2001 were constant, yet DAS use was increasing at an average annual rate of 5 percent per year. Whether there is a lead-lag relationship between increases in effort and the decline in the biomass index is uncertain.
Target TACs were routinely exceeded for both cod stocks in every year from 1997 to 2001 (Table 1). Catches of GOM cod were twice that of the TTAC in both 1997 and 1998 and three times that of the 2000 TTAC and nearly four times the 2001 TTAC. GB cod overages were not quite as large, but were consistently 1.5 to 2 times the TTACs from 1997 – 2001.
TABLE 1Summary of annual TTAC overage (>100 percent) and underage (<100 percent) by year
Year
Stock 1997 1998 1999 2000 2001 2004 2005 2006 2007 2008 2009
GB Cod 204% 147% 149% 188% 219% 105% 84% 53% 55% 32% 71%
GB Haddock 55% 38% 45% 53% 43% 34% 27% 12% 5% 5% 49%
GB Yellowtail 123% 89% 78% 80% 63% 98% 89% 92% 111% 82% 111%
SNE Yellowtail 33% 45% 65% 79% 84% 88% 17% 6% 236% 187% 116%
GOM Cod 213% 235% 179% 317% 386% 146% 107% 67% 64% 84% 92%
GOM Haddock 29% 36% 25% 108% 92% 66%
CC/GOM Yellowtail 135% 81% 60% 59% 50% 74%
Plaice 46% 37% 37% 31% 27% 55%
Witch 62% 40% 25% 23% 25% 94%
GB Winter 101% 78% 38% 65% 66% 100%
GOM Wintera
SNE/MA Winterb 57% 37% 39% 54% 31%
Redfish 32% 39% 36% 56% 63% 63%
Pollockc 49% 62% 71% 86% 86%
White Hake 94% 72% 47% 94% 101% 85%
a TTAC not set due to rejected assessment
b TTAC set to zero in 2009; possession of SNE/MA winter flounder prohibited
c No TTAC set for Pollock in 2006
FIGURE 9Biomass index for combined groundfish stocks with and without
GB haddock and acadian redfish
225The effort control programme in the northeast United States groundfish fishery
During 2002 and 2003, the groundfish fishery operated under a court-ordered settlement agreement that provided a transition to revised DAS allocations based on more recent usage rates. During these years, specific TTACs were not set, and so are not reported in Table 1. The change in DAS allocations wrought by the settlement agreement was made permanent (with some revisions) with the implementation of Amendment 13 in 2004. This Amendment also developed rebuilding plans and set TTACs for nearly all stocks managed under the Multispecies Plan. The redesigned effort controls were more effective in meeting TTACs, as catch targets were exceeded for GB cod in only 2004 and the GOM cod TTAC was exceeded in only 2004 and 2005. Other than in these two cod stocks, no other overages occurred during 2005 and there were no overages of any stocks in 2006. During 2007, overages occurred for GB yellowtail flounder (111 percent) and for GOM haddock (108 percent). In 2008, there was only a small overage for white hake (101 percent). SNE/MA yellowtail flounder was the only stock with a persistent overage in each year from 2007 through 2009. The GB yellowtail flounder TTAC was also exceeded in 2009.
Thus, at least since 2004, the effort control programme was able to achieve the majority of the catch limits that were known or believed to be required to meet the fishing mortality rates for rebuilding. Of course, in hindsight, the TTACs were generally set too high because the retrospective patterns in the assessment models were either ignored, not well understood, or were not discovered until later. Nevertheless, Amendment 13 provided the Council with the means to adjust effort controls to achieve the TTACs.
As previously noted, the NEFMC implemented a variety of indirect effort controls such as trip limits, gear restrictions, time/area closures in addition to direct DAS controls. Adjustments to DAS and indirect controls were required in every fishing year (1 May to 30 April) to achieve biological objectives. The frequency and magnitude of these adjustments varied from year to year. As a measure of management complexity, we compiled data on the annual number of separate management actions required to adjust the effort control programme (see Figure 10). We excluded proposed rules as well as actions taken under the Groundfish Plan whose purpose was to regulate another fishery. For each action we also counted the number of pages in the Federal Register used to describe the action, respond to public comments, and to provide the regulatory language required to implement the action2. The number of actions provides an indicator of the frequency with which regulations needed to be altered, while page numbers in the Federal Register serves as a proxy for the number of regulations that needed to be changed on each occasion. This is also an indicator of the contentiousness of an adjustment measure as controversial actions typically require a lengthy description of the purpose and need for the action, as well as an extended response to the large number of public comments received during the rule making process.
We also differentiate between four specific types of management actions; Amendments (denoted as green in Figure 10); Framework Adjustments (orange); Emergency Actions (red); Court-ordered actions ( purple); and all other actions (blue). Major amendments to the Groundfish Plan occurred in 1994 (Amendment 5), 1996 (Amendment 7), 2004 (Amendment 13), and 2010 (Amendment 16). The Framework Adjustment process was created by Amendment 5 to enable a more rapid response to emerging management problems by pre-specifying the set of management measures that may be adjusted. Emergency Actions may be taken in cases where there is a compelling biological or economic imperative that requires immediate action. Emergency Actions have a limited duration (180 days renewable for up to an additional 180 days) and will expire unless replaced by a permanent action.
2 See http://www.nero.noaa.gov/sfd/sfdmultifr.html for a compilation of all regulatory actions related to the Groundfish Plan.
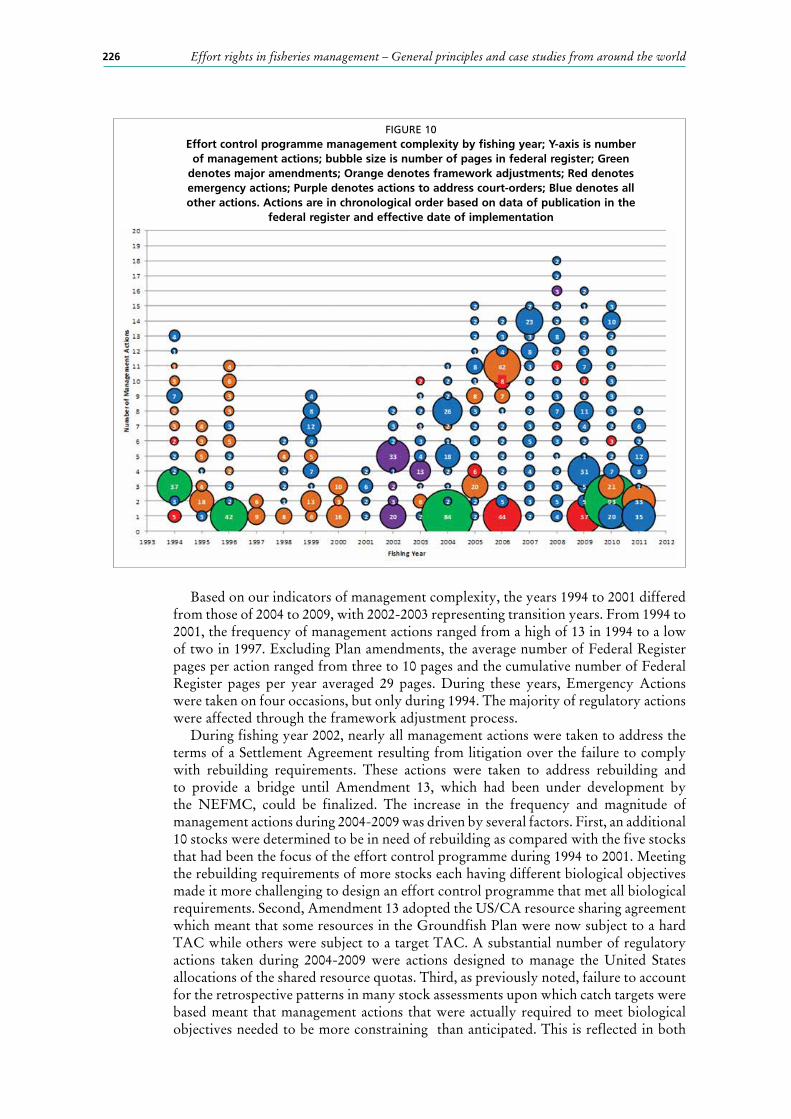
226 Effort rights in fisheries management – General principles and case studies from around the world
Based on our indicators of management complexity, the years 1994 to 2001 differed from those of 2004 to 2009, with 2002-2003 representing transition years. From 1994 to 2001, the frequency of management actions ranged from a high of 13 in 1994 to a low of two in 1997. Excluding Plan amendments, the average number of Federal Register pages per action ranged from three to 10 pages and the cumulative number of Federal Register pages per year averaged 29 pages. During these years, Emergency Actions were taken on four occasions, but only during 1994. The majority of regulatory actions were affected through the framework adjustment process.
During fishing year 2002, nearly all management actions were taken to address the terms of a Settlement Agreement resulting from litigation over the failure to comply with rebuilding requirements. These actions were taken to address rebuilding and to provide a bridge until Amendment 13, which had been under development by the NEFMC, could be finalized. The increase in the frequency and magnitude of management actions during 2004-2009 was driven by several factors. First, an additional 10 stocks were determined to be in need of rebuilding as compared with the five stocks that had been the focus of the effort control programme during 1994 to 2001. Meeting the rebuilding requirements of more stocks each having different biological objectives made it more challenging to design an effort control programme that met all biological requirements. Second, Amendment 13 adopted the US/CA resource sharing agreement which meant that some resources in the Groundfish Plan were now subject to a hard TAC while others were subject to a target TAC. A substantial number of regulatory actions taken during 2004-2009 were actions designed to manage the United States allocations of the shared resource quotas. Third, as previously noted, failure to account for the retrospective patterns in many stock assessments upon which catch targets were based meant that management actions that were actually required to meet biological objectives needed to be more constraining than anticipated. This is reflected in both
FIGURE 10Effort control programme management complexity by fishing year; Y-axis is number
of management actions; bubble size is number of pages in federal register; Green denotes major amendments; Orange denotes framework adjustments; Red denotes emergency actions; Purple denotes actions to address court-orders; Blue denotes all other actions. Actions are in chronological order based on data of publication in the
federal register and effective date of implementation
227The effort control programme in the northeast United States groundfish fishery
the increased number and magnitude of actions taken through Emergency Action and the overall increase in the magnitude of Framework Adjustments. For example, seven Framework Adjustments were implemented during 2004-2009. These actions averaged 19 pages and the cumulative sum of Federal Register pages was 133 pages. The cumulative number of pages for all 19 Framework Adjustments during 1994 to 2001 was 121 pages and averaged six pages per action. From 2004 to 2009, the number of distinct regulatory actions ranged from 11 in 2004 to 18 in 2008. Over these years, the cumulative number of Federal Register pages averaged 82 pages as compared with 29 pages during 1994 to 2001.
Fishing years 2010 and 2011 are included in Figure 10 even though the majority of the active groundfish fleet had transitioned to the Sector Allocation catch share programme under Amendment 16 to the Groundfish Plan. These years are included to provide a contrast to the prior 15 years under effort controls. During 2010, there were a total of 15 regulatory actions taken including Amendment 16. Amendment 16 required two separate additional actions: one to approve the 17 sectors that had been requested to be created, and a second to set the annual catch limits and Annual Catch Entitlement, by stock, for each sector. These two actions account for the larger management actions of 20 and 21 pages, respectively, shown for 2010 in Figure 10, and for the 35 and 33 Federal Register pages in fishing year 2011. Other than adjustments to the TAC for several stocks, there were no in-season actions affecting the catch share component of the groundfish fishery. By contrast, in-season adjustments were required for the so-called common pool, the component of the groundfish fishery that chose to remain under the effort control programme. During 2010, five (33 percent of the total) regulatory actions were required to adjust common pool measures. During 2011, eight regulatory actions were taken, four of which were common pool adjustments.
DAYS AT SEA LEASINGAs noted earlier, Amendment 13 provided the opportunity for vessel owners to lease DAS. Leasing of DAS was seen as a way for vessel owners to improve economic efficiency. Recognizing that DAS leasing would likely lead to increases in effective effort as DAS were moved from less to more efficient vessels, the Council sought to ensure that this programme would be conservation neutral. This led to development of two management alternatives. One alternative would have allowed trades between any two vessel owners, but would have adjusted the DAS exchanged to account for difference in capacity output. For example, a smaller vessel with half the capacity output of a larger vessel could still lease ten DAS to a larger vessel, but the larger vessel would only be credited with five DAS. This approach was not adopted. Instead, exchanges were limited within specified intervals based on horsepower and length. The Council chose the latter and implemented the following “conservation equivalency” restrictions on DAS leasing: A lesser may not lease DAS to any vessel with a baseline horsepower rating that is 20 percent or more greater than that of the horsepower baseline of the lessee vessel. A lesser also may not lease DAS to any vessel with a baseline LOA [length] that is 10 percent or more greater than that of the baseline of the lessee vessel’s LOA (USOFR, 2004).
These limitations on leases were designed to prevent effort from shifting to larger, more powerful vessels with higher catch rates and also to promote fleet diversity. On the surface, there were large numbers of potential participants in the market, making exertion of market power unlikely. However, the largest vessels may lease DAS from only a small number of potential trading partners or counterparties, placing the large vessels at a disadvantage in the bargaining process and resulting in higher prices. Similarly, the smallest vessels may lease DAS from almost any seller and may be at a relative advantage in the bargaining process. Table 1 illustrates this imbalance by summarizing the feasible counterparties using only the vessel length conservation equivalency restriction.
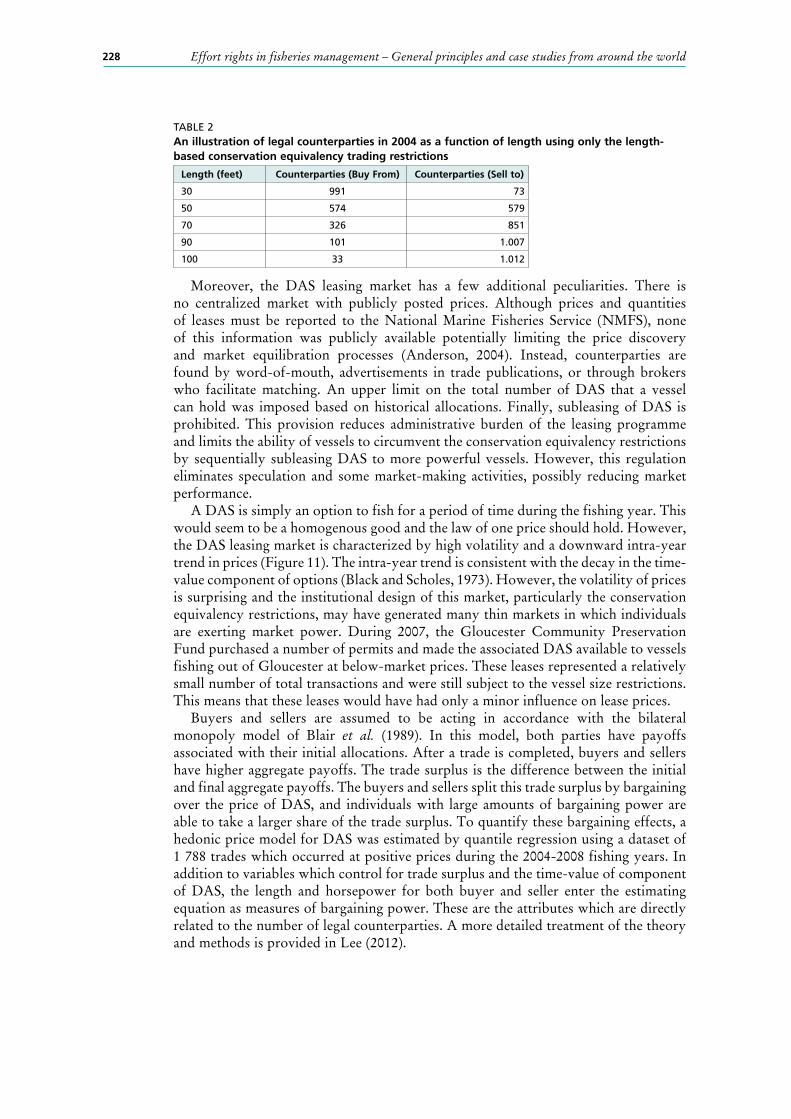
228 Effort rights in fisheries management – General principles and case studies from around the world
TABLE 2An illustration of legal counterparties in 2004 as a function of length using only the length-based conservation equivalency trading restrictions
Length (feet) Counterparties (Buy From) Counterparties (Sell to)
30 991 73
50 574 579
70 326 851
90 101 1.007
100 33 1.012
Moreover, the DAS leasing market has a few additional peculiarities. There is no centralized market with publicly posted prices. Although prices and quantities of leases must be reported to the National Marine Fisheries Service (NMFS), none of this information was publicly available potentially limiting the price discovery and market equilibration processes (Anderson, 2004). Instead, counterparties are found by word-of-mouth, advertisements in trade publications, or through brokers who facilitate matching. An upper limit on the total number of DAS that a vessel can hold was imposed based on historical allocations. Finally, subleasing of DAS is prohibited. This provision reduces administrative burden of the leasing programme and limits the ability of vessels to circumvent the conservation equivalency restrictions by sequentially subleasing DAS to more powerful vessels. However, this regulation eliminates speculation and some market-making activities, possibly reducing market performance.
A DAS is simply an option to fish for a period of time during the fishing year. This would seem to be a homogenous good and the law of one price should hold. However, the DAS leasing market is characterized by high volatility and a downward intra-year trend in prices (Figure 11). The intra-year trend is consistent with the decay in the time-value component of options (Black and Scholes, 1973). However, the volatility of prices is surprising and the institutional design of this market, particularly the conservation equivalency restrictions, may have generated many thin markets in which individuals are exerting market power. During 2007, the Gloucester Community Preservation Fund purchased a number of permits and made the associated DAS available to vessels fishing out of Gloucester at below-market prices. These leases represented a relatively small number of total transactions and were still subject to the vessel size restrictions. This means that these leases would have had only a minor influence on lease prices.
Buyers and sellers are assumed to be acting in accordance with the bilateral monopoly model of Blair et al. (1989). In this model, both parties have payoffs associated with their initial allocations. After a trade is completed, buyers and sellers have higher aggregate payoffs. The trade surplus is the difference between the initial and final aggregate payoffs. The buyers and sellers split this trade surplus by bargaining over the price of DAS, and individuals with large amounts of bargaining power are able to take a larger share of the trade surplus. To quantify these bargaining effects, a hedonic price model for DAS was estimated by quantile regression using a dataset of 1 788 trades which occurred at positive prices during the 2004-2008 fishing years. In addition to variables which control for trade surplus and the time-value of component of DAS, the length and horsepower for both buyer and seller enter the estimating equation as measures of bargaining power. These are the attributes which are directly related to the number of legal counterparties. A more detailed treatment of the theory and methods is provided in Lee (2012).
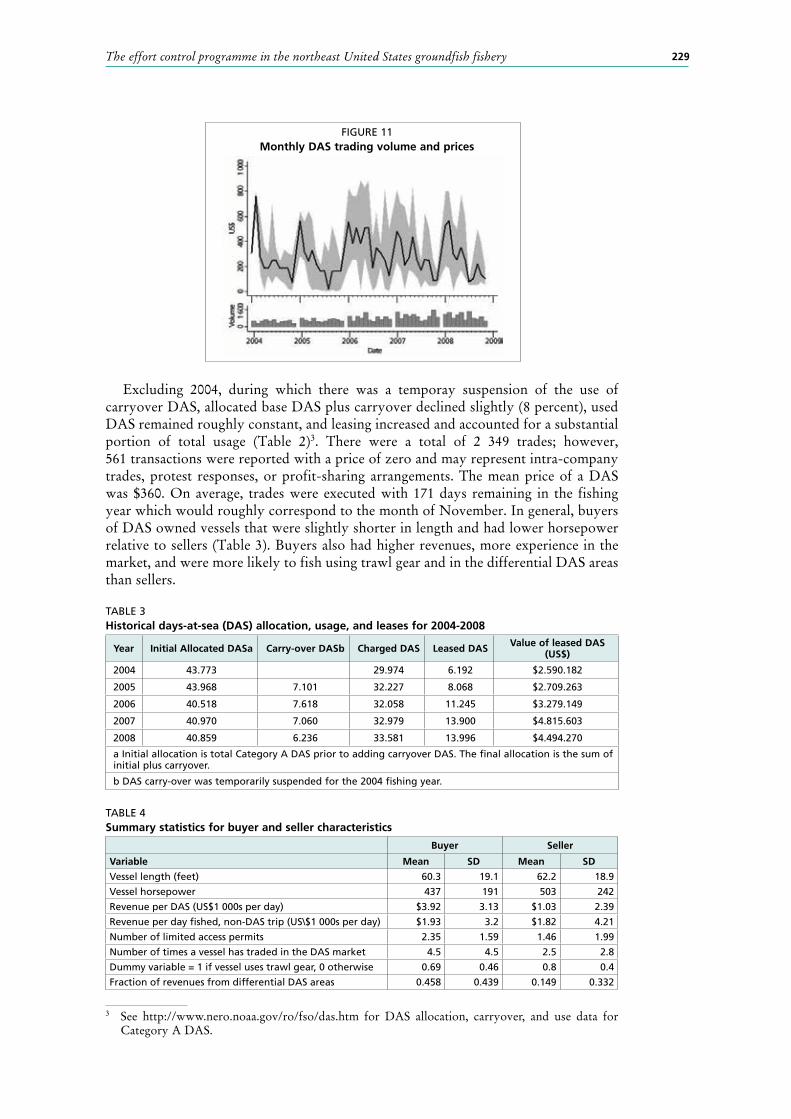
229The effort control programme in the northeast United States groundfish fishery
3 See http://www.nero.noaa.gov/ro/fso/das.htm for DAS allocation, carryover, and use data for Category A DAS.
Excluding 2004, during which there was a temporay suspension of the use of carryover DAS, allocated base DAS plus carryover declined slightly (8 percent), used DAS remained roughly constant, and leasing increased and accounted for a substantial portion of total usage (Table 2)3. There were a total of 2 349 trades; however, 561 transactions were reported with a price of zero and may represent intra-company trades, protest responses, or profit-sharing arrangements. The mean price of a DAS was $360. On average, trades were executed with 171 days remaining in the fishing year which would roughly correspond to the month of November. In general, buyers of DAS owned vessels that were slightly shorter in length and had lower horsepower relative to sellers (Table 3). Buyers also had higher revenues, more experience in the market, and were more likely to fish using trawl gear and in the differential DAS areas than sellers.
TABLE 3Historical days-at-sea (DAS) allocation, usage, and leases for 2004-2008
Year Initial Allocated DASa Carry-over DASb Charged DAS Leased DAS Value of leased DAS (US$)
2004 43.773 29.974 6.192 $2.590.182
2005 43.968 7.101 32.227 8.068 $2.709.263
2006 40.518 7.618 32.058 11.245 $3.279.149
2007 40.970 7.060 32.979 13.900 $4.815.603
2008 40.859 6.236 33.581 13.996 $4.494.270
a Initial allocation is total Category A DAS prior to adding carryover DAS. The final allocation is the sum of initial plus carryover.
b DAS carry-over was temporarily suspended for the 2004 fishing year.
TABLE 4Summary statistics for buyer and seller characteristics
Buyer Seller
Variable Mean SD Mean SD
Vessel length (feet) 60.3 19.1 62.2 18.9
Vessel horsepower 437 191 503 242
Revenue per DAS (US$1 000s per day) $3.92 3.13 $1.03 2.39
Revenue per day fished, non-DAS trip (US\$1 000s per day) $1.93 3.2 $1.82 4.21
Number of limited access permits 2.35 1.59 1.46 1.99
Number of times a vessel has traded in the DAS market 4.5 4.5 2.5 2.8
Dummy variable = 1 if vessel uses trawl gear, 0 otherwise 0.69 0.46 0.8 0.4
Fraction of revenues from differential DAS areas 0.458 0.439 0.149 0.332
FIGURE 11Monthly DAS trading volume and prices
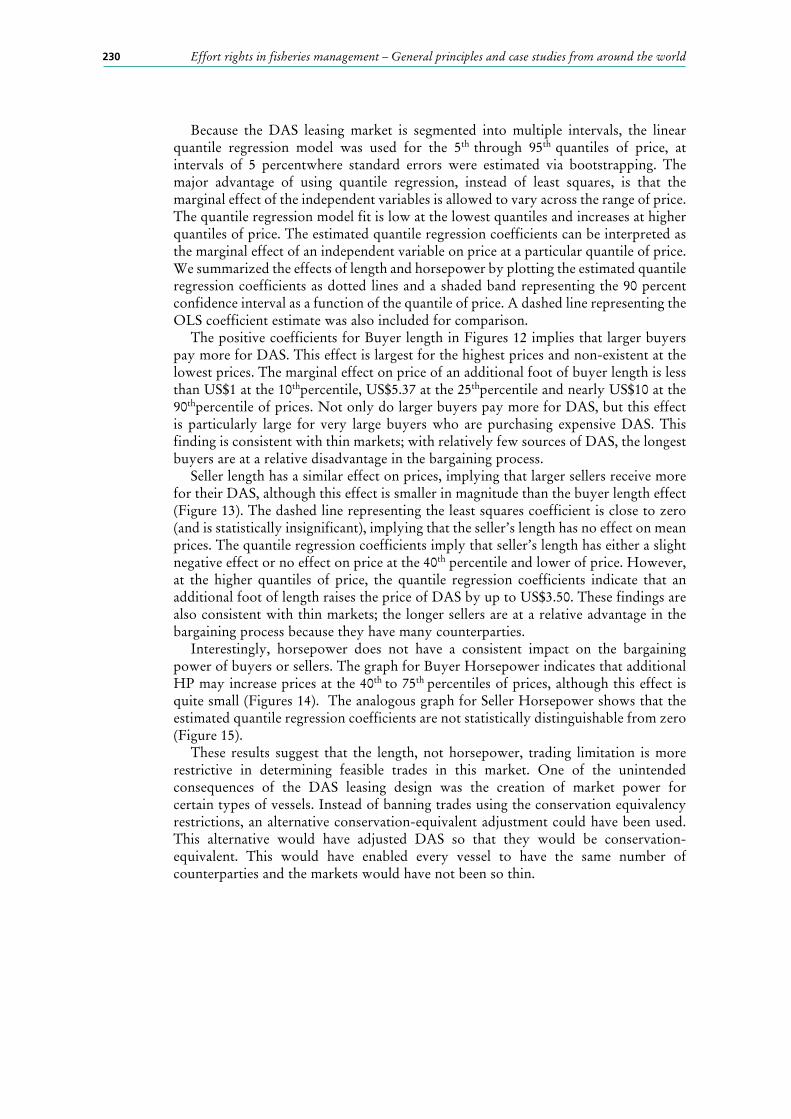
230 Effort rights in fisheries management – General principles and case studies from around the world
Because the DAS leasing market is segmented into multiple intervals, the linear quantile regression model was used for the 5th through 95th quantiles of price, at intervals of 5 percentwhere standard errors were estimated via bootstrapping. The major advantage of using quantile regression, instead of least squares, is that the marginal effect of the independent variables is allowed to vary across the range of price. The quantile regression model fit is low at the lowest quantiles and increases at higher quantiles of price. The estimated quantile regression coefficients can be interpreted as the marginal effect of an independent variable on price at a particular quantile of price. We summarized the effects of length and horsepower by plotting the estimated quantile regression coefficients as dotted lines and a shaded band representing the 90 percent confidence interval as a function of the quantile of price. A dashed line representing the OLS coefficient estimate was also included for comparison.
The positive coefficients for Buyer length in Figures 12 implies that larger buyers pay more for DAS. This effect is largest for the highest prices and non-existent at the lowest prices. The marginal effect on price of an additional foot of buyer length is less than US$1 at the 10thpercentile, US$5.37 at the 25thpercentile and nearly US$10 at the 90thpercentile of prices. Not only do larger buyers pay more for DAS, but this effect is particularly large for very large buyers who are purchasing expensive DAS. This finding is consistent with thin markets; with relatively few sources of DAS, the longest buyers are at a relative disadvantage in the bargaining process.
Seller length has a similar effect on prices, implying that larger sellers receive more for their DAS, although this effect is smaller in magnitude than the buyer length effect (Figure 13). The dashed line representing the least squares coefficient is close to zero (and is statistically insignificant), implying that the seller’s length has no effect on mean prices. The quantile regression coefficients imply that seller’s length has either a slight negative effect or no effect on price at the 40th percentile and lower of price. However, at the higher quantiles of price, the quantile regression coefficients indicate that an additional foot of length raises the price of DAS by up to US$3.50. These findings are also consistent with thin markets; the longer sellers are at a relative advantage in the bargaining process because they have many counterparties.
Interestingly, horsepower does not have a consistent impact on the bargaining power of buyers or sellers. The graph for Buyer Horsepower indicates that additional HP may increase prices at the 40th to 75th percentiles of prices, although this effect is quite small (Figures 14). The analogous graph for Seller Horsepower shows that the estimated quantile regression coefficients are not statistically distinguishable from zero (Figure 15).
These results suggest that the length, not horsepower, trading limitation is more restrictive in determining feasible trades in this market. One of the unintended consequences of the DAS leasing design was the creation of market power for certain types of vessels. Instead of banning trades using the conservation equivalency restrictions, an alternative conservation-equivalent adjustment could have been used. This alternative would have adjusted DAS so that they would be conservation-equivalent. This would have enabled every vessel to have the same number of counterparties and the markets would have not been so thin.
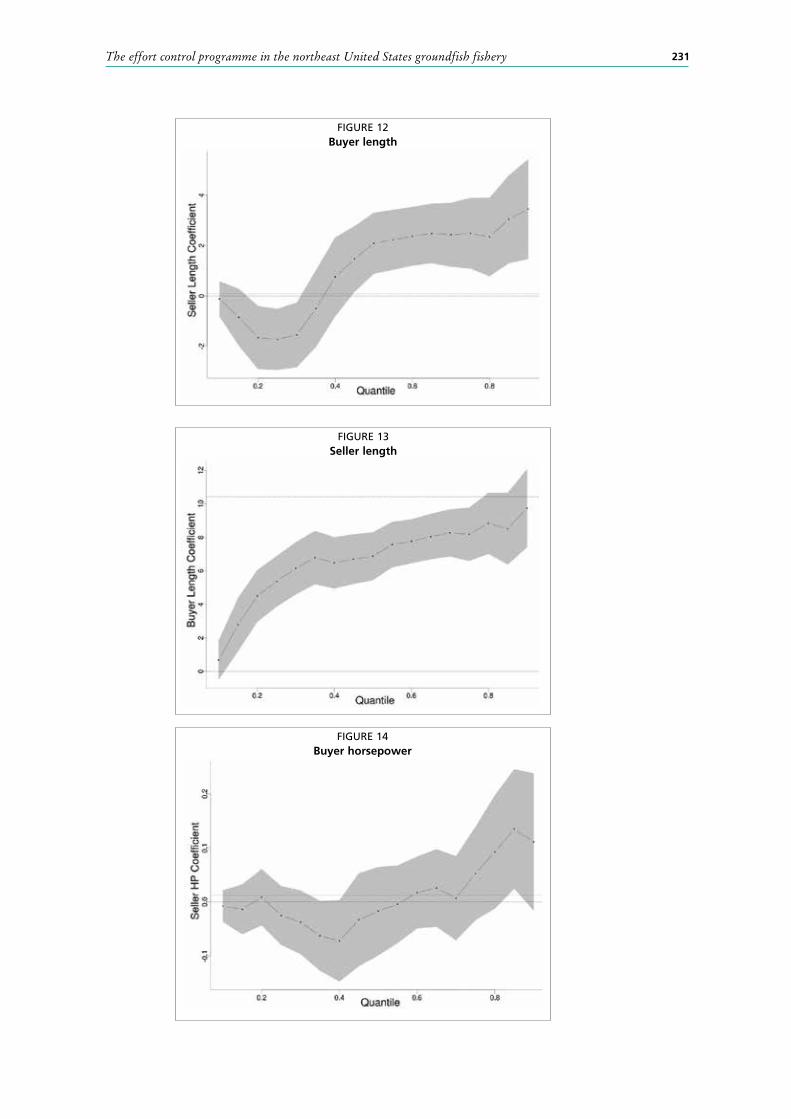
231The effort control programme in the northeast United States groundfish fishery
FIGURE 12Buyer length
FIGURE 13Seller length
FIGURE 14Buyer horsepower
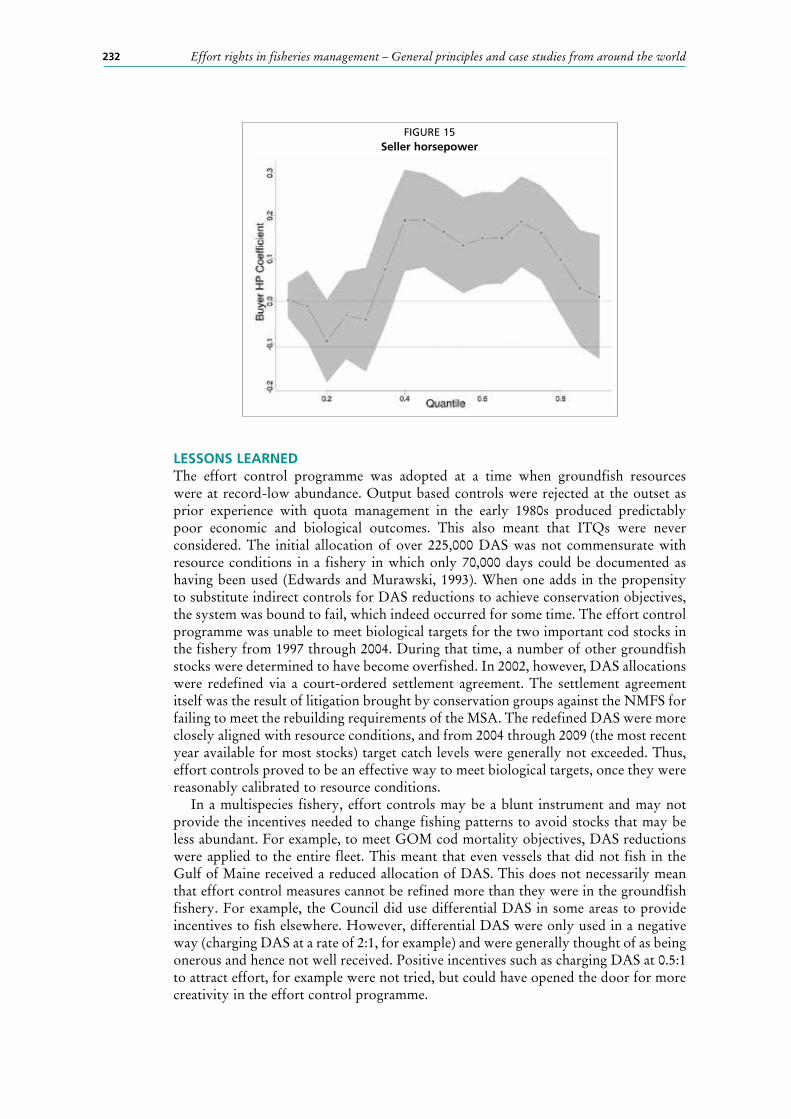
232 Effort rights in fisheries management – General principles and case studies from around the world
LESSONS LEARNEDThe effort control programme was adopted at a time when groundfish resources were at record-low abundance. Output based controls were rejected at the outset as prior experience with quota management in the early 1980s produced predictably poor economic and biological outcomes. This also meant that ITQs were never considered. The initial allocation of over 225,000 DAS was not commensurate with resource conditions in a fishery in which only 70,000 days could be documented as having been used (Edwards and Murawski, 1993). When one adds in the propensity to substitute indirect controls for DAS reductions to achieve conservation objectives, the system was bound to fail, which indeed occurred for some time. The effort control programme was unable to meet biological targets for the two important cod stocks in the fishery from 1997 through 2004. During that time, a number of other groundfish stocks were determined to have become overfished. In 2002, however, DAS allocations were redefined via a court-ordered settlement agreement. The settlement agreement itself was the result of litigation brought by conservation groups against the NMFS for failing to meet the rebuilding requirements of the MSA. The redefined DAS were more closely aligned with resource conditions, and from 2004 through 2009 (the most recent year available for most stocks) target catch levels were generally not exceeded. Thus, effort controls proved to be an effective way to meet biological targets, once they were reasonably calibrated to resource conditions.
In a multispecies fishery, effort controls may be a blunt instrument and may not provide the incentives needed to change fishing patterns to avoid stocks that may be less abundant. For example, to meet GOM cod mortality objectives, DAS reductions were applied to the entire fleet. This meant that even vessels that did not fish in the Gulf of Maine received a reduced allocation of DAS. This does not necessarily mean that effort control measures cannot be refined more than they were in the groundfish fishery. For example, the Council did use differential DAS in some areas to provide incentives to fish elsewhere. However, differential DAS were only used in a negative way (charging DAS at a rate of 2:1, for example) and were generally thought of as being onerous and hence not well received. Positive incentives such as charging DAS at 0.5:1 to attract effort, for example were not tried, but could have opened the door for more creativity in the effort control programme.
FIGURE 15Seller horsepower
233The effort control programme in the northeast United States groundfish fishery
An additional programme that may have some potential for other effort control programmes (not mentioned earlier in the interest of brevity but which was implemented in Amendment 13 to the Groundfish Plan) was the classification of DAS allocations into three different categories; A, B, and C. In its original form, the idea was to create a hierarchy of DAS such that only category A DAS would be allowed to fish in the early years of the Amendment 13 rebuilding plan. As stocks were rebuilding, additional DAS could be used and these were to be the Category B DAS. If still more DAS could be allocated, then Category C DAS would be used. In this manner, allocated DAS were to be tied to rebuilding and only allowed to increase if stock conditions allowed. What eventually emerged captured the overall intent, but changed how B days were treated by allowing their use in so-called Special Access Programmes (SAP) or to target healthy stocks. These were referred to as “Regular” B DAS. Adjustments in the number of A and B DAS depended on resource conditions.
Special Access Programmes were established for several groundfish stocks that were not overfished and which had low bycatch rates of stocks that were in a rebuilding programme (i.e. stocks of concern). For each SAP, a specified time, area, and -in some cases- gear was established. Quotas were set for the stocks of concern that, if exceeded, closed the SAP. The rationale behind regular B DAS was that there were several stocks among the 19 in the Groundfish Plan were not overfished and that fishers would be able to target these stocks and have low catches of stocks that were in a rebuilding plan. Fishers were required to declare that they were taking a regular B DAS trip, but if catch rates of the stocks of concern exceeded a specified quantity these fishers were required to “flip” to an A DAS. We have not made any assessment of the success of either the differential DAS or the DAS categories as they were implemented. Rather, we mention them as design features that might be considered in developing an effort control programme based on time at sea.
Overall, the experience with effort limitations in the New England groundfish fishery is a cautionary tale. Meaningful effort control in terms of meeting biological objectives was not achieved until 2004; a decade after the programme was initiated in 1994. Initial allocations of DAS were far in excess of sustainable levels, exemptions were granted to various fleet segments from DAS, myriad indirect effort controls were also enacted, and substitution of indirect for direct effort controls compromised the potential effectiveness of the DAS programme. While these and other mistakes were made, it is unclear whether they could have been avoided given the institutional setting and information available at the time. The groundfish resource is composed of multiple stocks of varying size and status with different life histories. The fishery is prosecuted by a heterogeneous fleet in terms of size, gears, and fishing practices. Fishing participants and fishing related industries are widely distributed across different states and varying communities from small towns to major metropolitan areas. Given this context, it should come as no surprise that fishery management decisions were incremental and required accommodation and negotiation at every step. In retrospect, had the Council opted for individual DAS allocations for all vessels in 1994 instead of allowing vessel owners to opt for a fleet average, it may have been easier to match the effort control programme to resource conditions. Of the lessons learned, this harmonization is perhaps the most pertinent to the design of an effective effort control programme. An effort control programme must be calibrated to resource conditions from the outset. Otherwise, problems will abound and management objectives will likely not be met.
REFERENCESAnderson, C. 2004. How institutions affect outcomes in laboratory tradable fishing
allowance systems. Agricultural and Resource Economics Review, 33(2): 193–208.Blair, R.D., Kaserman, D.L. & Romano, R.E. 1989. A pedagogical treatment of bilateral
monopoly. Southern Economic Journal, 55(4): 831-841.
234 Effort rights in fisheries management – General principles and case studies from around the world
Black, F. & Scholes, M. 1973. The pricing of options and corporate liabilities. The Journal of Political Economy, 81(3): 637–654.
Kirkley, J. & Strand, I. 1988. The technology and management of multi-species fisheries. Applied Economics, 20(10): 1279–1292.
Koenker, R. & Bassett, G. Jr. 1978. Regression quantiles. Econometrica, 46(1): 33–50.Lee, M. 2012. Examining Bargaining Power in the Northeast Multispecies Days-at-Sea
Market. North American Journal of Fisheries Management, 32(5): 1017-1031.Edwards, S.F. & Murawski, S.A. 1993. Potential economic benefits from the efficient
harvest of New England groundfish. North American Journal of Fisheries Management, 13(3): 437-449.
Newell, R., Sanchirico, J. & Kerr, S. 2005. Fishing quota markets. Journal of Environmental Economics and Management, 49(3): 437–462.
New England Fishery Management Council. 1993. Final Amendment #5 to the Northeast Multispecies Plan incorporating the Supplemental Environmental Impact Statement, 1: 1-366. (Also available at http://www.nefmc.org/nemulti/index.html).
Squires, D. 1987. Public regulation and the structure of production in multiproduct industries: An application to the New England otter trawl industry. The RAND Journal of Economics, 18(2): 232–247.
Townsend, R. E. 1987. On Capital Stuffing in Regulated Fisheries. Land Economics, 61(2): 195-197.
USOFR (U.S. Office of the Federal Register). 2004. Magnuson-Stevens Fishery Conservation and Management Act Provisions; Fisheries of the Northeastern United States; Northeast (NE) Multispecies Fishery; Amendment 13; Final Rule. Code of Federal Regulations, Title 50, Part 648. 69(81): 22906-22988. U.S. Government Printing Office, Washington, DC.
235
Tradable traps in the northeast United States American lobster fishery
Eric M. Thunberg, NOAA Fisheries Office of Science and Technology, Economics and Social Analysis DivisionE-mail: [email protected]
INTRODUCTIONValued at US$492 million in 2012, American lobster (Homarus americanus) was second only to Atlantic sea scallops (US$559 million) in terms of value among all species landed in the United States (NMFS, 2012). The overwhelming majority of American lobster is landed in New England states (Maine, New Hampshire, Massachusetts, Rhode Island, and Connecticut) with Maine alone accounting for about 80 percent of total landings and value. Although some lobster are harvested as incidental catch in trawl fisheries, nearly all American lobster are harvested using traps which engenders territorial behaviours (Acheson, 1975) that has resulted in an area-based approach to management. This approach has led to differing strategies from reliance on input controls in much of the Gulf of Maine (Area 1) to tradable trap programmes in the offshore fishery (Area 3), the near shore fishery in Southern New England (Area 2), and Outer Cape Cod (see Figure 1). However, these management areas moved to a tradable trap programme only after a protracted period of reliance on input controls was unable to achieve conservation objectives.
The American lobster fishery shares a number of characteristics with many other crustacean (crab and lobster) fisheries. Crabs and lobsters tend to be of high value either because of local, tourism, or export demand. Most crustacean fisheries are prosecuted using trap or pot gear and either rely exclusively on input controls, or did so for extended periods of time before transitioning to some form of transferrable trap or quota system. The following section provides a survey of crustacean fisheries in the US, the Caribbean, Australia, and New Zealand that use some form of transferrable rights in managing the fishery. The paper then returns to the American lobster fishery by describing the management context within which management decisions are made. The specific features for the transferrable trap programmes that have been developed, but have yet to be fully implemented are also noted. The final section of the paper draws inferences for transferable rights programmes in crustacean fisheries in general and the American lobster fishery in particular.
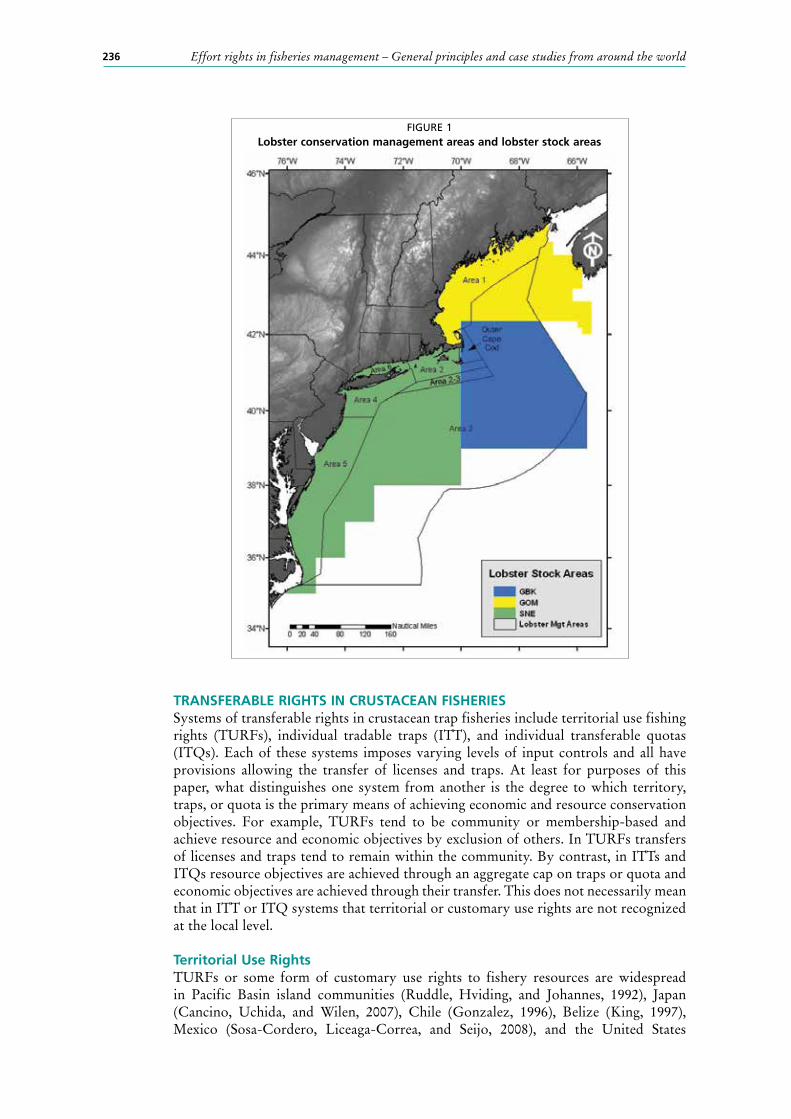
236 Effort rights in fisheries management – General principles and case studies from around the world
TRANSFERABLE RIGHTS IN CRUSTACEAN FISHERIESSystems of transferable rights in crustacean trap fisheries include territorial use fishing rights (TURFs), individual tradable traps (ITT), and individual transferable quotas (ITQs). Each of these systems imposes varying levels of input controls and all have provisions allowing the transfer of licenses and traps. At least for purposes of this paper, what distinguishes one system from another is the degree to which territory, traps, or quota is the primary means of achieving economic and resource conservation objectives. For example, TURFs tend to be community or membership-based and achieve resource and economic objectives by exclusion of others. In TURFs transfers of licenses and traps tend to remain within the community. By contrast, in ITTs and ITQs resource objectives are achieved through an aggregate cap on traps or quota and economic objectives are achieved through their transfer. This does not necessarily mean that in ITT or ITQ systems that territorial or customary use rights are not recognized at the local level.
Territorial Use RightsTURFs or some form of customary use rights to fishery resources are widespread in Pacific Basin island communities (Ruddle, Hviding, and Johannes, 1992), Japan (Cancino, Uchida, and Wilen, 2007), Chile (Gonzalez, 1996), Belize (King, 1997), Mexico (Sosa-Cordero, Liceaga-Correa, and Seijo, 2008), and the United States
FIGURE 1Lobster conservation management areas and lobster stock areas
237Tradable traps in the northeast United States American lobster fishery
(Acheson, 1975; 1989). Of these systems, King (1997), Sosa-Cordero, Liceaga-Correa, and Seijo (2008), and Acheson (1975, 1989) provide examples of TURFs for lobster species. With the exception of a few resident-only lobster fishing zones around island communities, TURFs are not formally recognized by the State of Maine. Rather, TURFs are informal agreements among individuals that fish in and around a specific harbour. These agreements determine who may fish within the harbour’s territory which is vigorously defended (Acheson, 1975). The TURF system in Caye Caulker, Belize described by King (1997) is similar to that of Maine except that territories are recognized by a community based cooperative that also serves as a supplier of purchased inputs and an avenue for selling the catch. However, territories in Caye Caulker that are controlled by a member of the cooperative may be transferred to a family member or sold to someone else whereas transferability of territory, as such, does not occur in the Maine TURF system.
ITTs and ITQsOnly three of the ten crustacean fisheries identified herein are currently managed with an ITT (see Table 1), and although each of the four Australian rock lobster fisheries were managed as ITT’s, they are all now managed under an ITQ. The remaining three fisheries went from limited entry with input controls directly to an ITQ. The ITT programme in the United States American lobster fishery will be discussed in detail in the following section. The basic features of the other programmes listed in Table 1 are summarized below.
TABLE 1Summary of transferable rights systems in crustacean trap fisheries in the United States, New Zealand, and Australia
Design feature implementation year
Programme Limited entry Trap limit Tradable traps Individual transferable quota
Florida Spiny Lobster ITT 1988 1992
Florida Stone Crab ITT 1995 2002
New England American Lobster ITT 1995 1999 1997a, 2002b, 2003c
Bering Sea Aleutian Island Crab ITQ 1995 1993 2005
New Zealand Rock Lobster ITQ 1977 1990
New Zealand Deep Sea Crab ITQ 1991 2006
Tasmanian Rock Lobster ITQ 1967 1967 1967 1998
Western Australia Rock Lobster ITQ 1963 1963 1965 2013
South Australia Rock Lobster; South ITQ 1967 1968 1968 1994
South Australia Rock Lobster; North ITQ 1967 1968 1968 2003
a Lobster Conservation Area 3
b Outer Cape Cod Lobster Conservation Area
c Lobster Conservation Area 2
Florida Spiny LobsterThe Florida spiny lobster fishery was an open access fishery until 1988 when a moratorium on issuing new licenses was implemented (Milon, Larkin, and Ehrhart, 1999). Due to a combination of new entrants and no trap limits the number of traps expanded from around 100 000 in the 1960s to over 900 000 in 1990, yet landings were relatively constant (Muller et al., 1997). For this reason, the tradable trap programme implemented in 1992 was initially created so to deal with overcapitalization and economic inefficiencies, although conservation benefits were expected (Larkin and Milon, 2000). Qualification for initial allocations was based on historical trap use
238 Effort rights in fisheries management – General principles and case studies from around the world
over a three year period. Allocations were converted into certificates corresponding to one certificate for each trap (Matthews, 1995). Trap certificates are subject to annual renewal and trap tags corresponding to each certificate must be affixed to each trap fished. Allocations were initially reduced in 10 percent annual increments to 543 000 traps in 1999 (Vondruska, 2010). Additional reductions are effected through a 10 percent conservation tax upon transfer to non-family members up until a target of 400 000 traps has been reached (Florida Administrative Code; Rule 68B-24.009). Trap certificates are fully transferrable, subject to eligibility requirements and a certificate transfer fee set at US$2 per trap certificate if the transfer is to an immediate family member and US$5 or 25 percent of the transfer price otherwise. The higher fees for transfers outside a fisher’s immediate family are to offset the cost of administering the programme and provide a royalty paid to the State for the use of a public resource (Matthews, 1995). Leasing of trap certificates is prohibited. In addition to the tradable trap programme there are a number of additional regulations designed to protect the spiny lobster resource. These regulations include minimum size, prohibition on the taking of egg-bearing female lobsters, a closed season requiring removal of all traps, a prohibition on hauling gear at night, gear marking requirements, as well as several specifications affecting trap size and configuration.
Florida Stone CrabThe Florida stone crab fishery is prosecuted predominately in the Gulf of Mexico from Texas to the Florida Keys (Matthews and Larkin, 2002). Stone crabs are harvested using baited traps where only one claw is removed and the crab is returned alive to the water (Fluech, undated). The stone crab fishery followed a pattern of exploitation similar to that of spiny lobster with increasing participation and trap use (Matthews and Larkin, 2002). A moratorium on new licenses was implemented in1995 with no limit on the number of traps that could be used resulting in continued escalation in trap use. The moratorium was extended in 2001 and a transferrable trap programme similar to that of the spiny lobster trap certificate programme was enacted in 2002. The trap certificate programme capped the total number of traps that may be fished1.
With a cap on total traps established, the moratorium on issuing new licenses was lifted in July 2002, although licensees cannot fish for stone crabs without a trap certificate. The stone crab tradable trap programme seeks to achieve a target of 600 000 traps through passive reductions at the time trap certificates are transferred. However, these reductions only apply to transfers to persons outside the immediate family. Trap certificates may be transferred in whole or in part but cannot be leased. The programme includes provisions for lower transfer fees to qualifying crew that were not eligible for an initial allocation of trap certificates. The stone crab fishery retains a number of technical conservation measures such as minimum sizes, maximum size for females, and prohibitions on egg-bearing females as well as input controls such as gear marking, trap configuration, and a prohibition on hauling traps at night.
Bering Sea and Aleutian Islands CrabThe Bering Sea and Aleutian Islands (BSAI) crab fishery targets five species of king and tanner crabs in several different management areas resulting in eight “meta-fisheries” that have been the primary management concern (Fina, 2005). The State of Alaska has been actively involved in the management of the fishery since its inception and continues to be engaged in the day-to-day management of the fishery (Abbott, Garber-Yonts, and Wilen, 2010). However, because the fishery takes place entirely in the Exclusive Economic Zone (EEZ), management is shared between the State
1 See https://www.flrules.org/gateway/ChapterHome.asp?Chapter=68B-13 for detailed currentregulations enforced by the State of Florida governing the stone crab fishery.
239Tradable traps in the northeast United States American lobster fishery
and the North Pacific Management Council (NPFMC) under a cooperative Fishery Management Plan enacted in 1989 (NPFMC, 2011). The BSAI Crab fishery has been managed using harvest guidelines at least since 1989, but remained an open access fishery until 1995 (Brisman, 2003). This management approach resulted in increased capitalization, shortened seasons, and overages of the harvest guidelines. In an attempt to reduce harvest rates, the State of Alaska implemented trap limits in 1992 that varied by vessel size and stock. These trap limits were adjusted on a number of occasions based on the harvest guidelines and the number of vessel expected to participate in the fishery. At no time were traps tradable.
Reliance on input based controls resulted in increasingly short seasons and over-capacity (Fina, 2005) and the fishery was one of the most dangerous in the United States, averaging eight fatalities per year from 1990 to 1999 (Woodley, Lincoln, and Medlicott, 2009). These factors led to the development of an Individual Fishing Quota (IFQ) programme for the BSAI crab trap fishery which was implemented in 2005. The IFQ programme includes both harvesting and processor quota shares as well as regional share designations (Matulich, 2008). Allocation of Individual Processor Quota (IPQ) shares was done to protect processor investments as well as mitigate a shift in bargaining power that was presumed to occur under a harvester-only IFQ programme (Fina, 2005). Both harvester IFQ and processor IPQ carry regional designations to provide protections to fishing communities (NPFMC, 2008).
Both quota share and quota pounds are transferrable under the IFQ programme subject to eligibility requirements which include United States citizenship and at least 150 days of sea time in a harvesting capacity in a United States commercial harvest fishery. Quota pounds may be leased but quota shares cannot be unless held as part of a cooperative. Individual use caps are placed on the use and holdings of harvest shares although disinvestment was not required if initial allocations were above the use cap. However, any individual “grandfathered” under the use cap provision cannot lease or purchase any additional share or quota pounds unless holdings fall below the use cap.
New Zealand Rock LobsterA limited entry programme that had been in place since 1937 was lifted in 1963, resulting in a substantial increase in the number of licensed vessels operating in the New Zealand rock lobster fishery (Annala, 1983). A permit moratorium was reinstated in 1977 to allow time to develop a controlled fishery for rock lobsters (Yandle, 2008). At the time the controlled fishery programme was being considered, the fishery was subject to a number of input controls including closed seasons, area closures, and escape vents on traps in addition to biological protections for under-sized lobsters, egg-bearing females, and soft-shelled lobsters (Annala, 1983). These requirements did not include any limits on the number of traps that could be fished.
The stated management goal of the rock lobster control programme was to ensure continuing maximum yield from the fishery taking into account the social and economic benefits derived from the fishery (Annala, 1983). At the time the control programme was being developed, New Zealand fisheries were transitioning to ITQs. An ITQ was initially rejected for the rock lobster fishery as the fishery seemed healthy and industry representatives were concerned about a system that would set harvest limits (Yandle, 2008). However, after a set of policy options developed during 1986 that included tradable traps and tradable licenses was rejected by the Ministry of Fisheries and Agriculture in favour of a TAC with or without an ITQ, an ITQ system was eventually implemented in 1990 (Yandle, 2008). The ITQ system allows for freely transferable quota and license limitations have been removed (Miller and Breen, 2010).
240 Effort rights in fisheries management – General principles and case studies from around the world
New Zealand Deep Sea CrabThe New Zealand deep sea crab trap fishery began as an experimental fishery targeting king crabs and spider crabs (Soboil and Craig, 2008). Under the Quota Monitoring System (QMS) in New Zealand fishing permits are required to initiate an exploratory fishery which began in 1996 and 2001. Sufficient quantities of crabs were found and the fishery was brought into the QMS system via public tender (Soboil and Craig, 2008). Since the fishery was developed after New Zealand went to an ITQ-based management system for all fisheries, the deep sea crab fishery did not go through a prolonged period of input based controls.
Tasmanian Rock LobsterBradshaw (2004) traces the management history of the Tasmanian rock lobster fishery in phases from technical conservation measures (1889-1962), input restrictions (1967-1983), and a transitional period (1986-1995) to eventual adoption of an ITQ programme in 1998. Technical conservation measures governing the condition of lobsters taken in the commercial fishery including minimum sizes and prohibition on taking egg-bearing lobsters were implemented in 1889, and with modifications over time, remain in effect (Phillips, Kriwoken, and Hay, 2002). Trap limits based on vessel size were implemented in 1950, yet no limits were placed on the number of licenses that could be issued (Ford and Nichol, 2001).
Input restrictions were developed over time beginning with license limitation in 1967 which had less to do with resource conservation and more to do with protecting incomes of existing license holders (Phillips, Kriwoken, and Hay, 2002; Bradshaw, 2004). Each license was assigned a trap limit and only one license was issued to each active participant. Licenses and the associated trap limits were freely transferable, but were done so as a package because only one license could be issued to an individual (Bradshaw, 2004). The limitation on issuing only one permit to each active fisher was lifted in 1970 resulting in an increase in effective effort as licenses and traps were transferred to more productive owners and individuals scaled up trap use to their full trap limit. The total number of traps that could be used was capped at 10 507 traps in 1972 and consolidation of licenses and associated trap limits was allowed in 1976 (Bradshaw, 2004). In effect, with the combination of a cap on total traps coupled with transferability including leasing, the fishery effectively operated as an ITT until 1998, even though it was never deliberately managed as such.
The input restrictions were not able to halt resource declines as effective effort continued to increase as vessel operators invested in technology and larger vessels (Phillips, Kriwoken, and Hay, 2002). Thus while catches were relatively stable, catch per unit effort was declining, resulting in increased costs of fishing. Transition to the ITQ programme in 1998 required a deliberative process between industry groups and the government that culminated in acceptance of quota management in lieu of a 30 percent reduction in traps (Bradshaw, 2004).
Under the ITQ programme quota units are still enumerated in terms of traps by dividing the total quota by the number of traps (Hamon et al., 2009). Quota units may be transferred or leased subject to ownership accumulation caps, which limit the number of traps that may be fished per vessel to 50 and limit the number of quota units to 200 (van Putten and Gardner, 2010). A minimum of one quota unit may be held by an individual, although control over 15 quota units is required to actually begin fishing. The ITQ programme retains a number of limitations prescribing how traps may be used including the amount of time a trap may be left unattended (48 hours), the maximum number of traps per buoy line (2), gear marking requirements, as well as technical specifications for trap configuration and maximum size2.
2 See http://www.thelaw.tas.gov.au/index.w3p for current regulations governing the ITQ programme as well as specific regulations affecting the commercial harvest and sale of rock lobster.
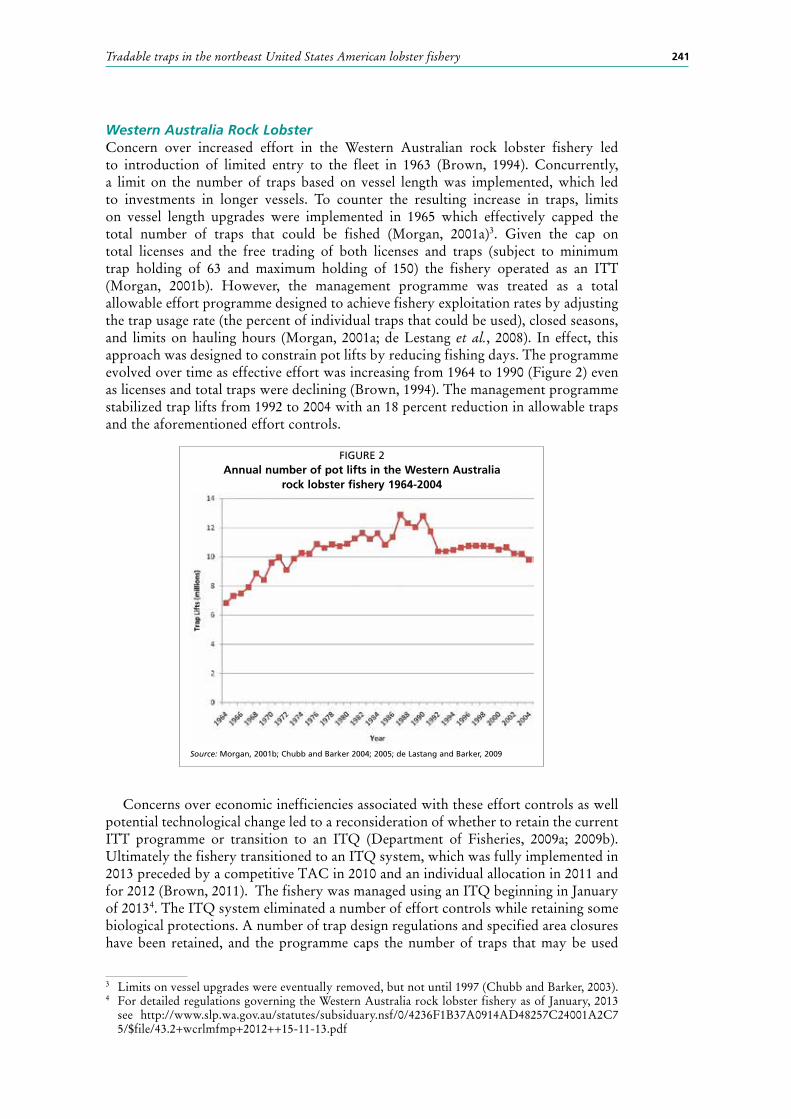
241Tradable traps in the northeast United States American lobster fishery
Western Australia Rock LobsterConcern over increased effort in the Western Australian rock lobster fishery led to introduction of limited entry to the fleet in 1963 (Brown, 1994). Concurrently, a limit on the number of traps based on vessel length was implemented, which led to investments in longer vessels. To counter the resulting increase in traps, limits on vessel length upgrades were implemented in 1965 which effectively capped the total number of traps that could be fished (Morgan, 2001a)3. Given the cap on total licenses and the free trading of both licenses and traps (subject to minimum trap holding of 63 and maximum holding of 150) the fishery operated as an ITT (Morgan, 2001b). However, the management programme was treated as a total allowable effort programme designed to achieve fishery exploitation rates by adjusting the trap usage rate (the percent of individual traps that could be used), closed seasons, and limits on hauling hours (Morgan, 2001a; de Lestang et al., 2008). In effect, this approach was designed to constrain pot lifts by reducing fishing days. The programme evolved over time as effective effort was increasing from 1964 to 1990 (Figure 2) even as licenses and total traps were declining (Brown, 1994). The management programme stabilized trap lifts from 1992 to 2004 with an 18 percent reduction in allowable traps and the aforementioned effort controls.
Concerns over economic inefficiencies associated with these effort controls as well potential technological change led to a reconsideration of whether to retain the current ITT programme or transition to an ITQ (Department of Fisheries, 2009a; 2009b). Ultimately the fishery transitioned to an ITQ system, which was fully implemented in 2013 preceded by a competitive TAC in 2010 and an individual allocation in 2011 and for 2012 (Brown, 2011). The fishery was managed using an ITQ beginning in January of 20134. The ITQ system eliminated a number of effort controls while retaining some biological protections. A number of trap design regulations and specified area closures have been retained, and the programme caps the number of traps that may be used
FIGURE 2Annual number of pot lifts in the Western Australia
rock lobster fishery 1964-2004
Source: Morgan, 2001b; Chubb and Barker 2004; 2005; de Lastang and Barker, 2009
3 Limits on vessel upgrades were eventually removed, but not until 1997 (Chubb and Barker, 2003).4 For detailed regulations governing the Western Australia rock lobster fishery as of January, 2013
see http://www.slp.wa.gov.au/statutes/subsiduary.nsf/0/4236F1B37A0914AD48257C24001A2C75/$file/43.2+wcrlmfmp+2012++15-11-13.pdf
242 Effort rights in fisheries management – General principles and case studies from around the world
by any one person. The trap caps have been retained even though the programme is not denominated in traps. The trap caps serve to mitigate ecological risks identified in Fletcher et al. (2005) including interactions with protected species, bycatch of non-target species, and ecological impacts of fishing gear.
South Australia Rock LobsterThe South Australia rock lobster fishery is sub-divided into Northern and Southern management zones that are both now ITQ-managed yet the path taken from input to output-based controls differed significantly between the two zones. Initially, the rock lobster fishery in South Australia was managed as a single fishery until 1968 when the fishery was sub-divided into the Northern and Southern zones and limits were placed on licenses and traps that could be fished in each zone (Sloan and Crosthwaite, 2007a, 2007b). In both zones licenses and traps were transferable, and at least until 1994, the two zones were primarily managed using input controls. Prior to 1994, both fisheries experienced significant increases in effective effort even as traps were reduced in 1984 (15 percent and 10 percent in the Southern and Northern zones respectively) and with a buyout in the Southern zone which removed 45 licenses and about 2 400 traps from the fishery (Sloan and Crosthwaite, 2007a, 2007b; Morgan, 2001c).
A management review conducted in 1992 concluded that the harvest levels in both zones were not sustainable and that effort needed to be reduced. The government advocated for a quota-based management system in both lobster fishing zones, which was adopted in the Southern Zone, but industry groups in the Northern voted to retain input-based controls (Sloan and Crosthwaite, 2007a; 2007b). In the Southern Zone a competitive quota was implemented in 1993 which was followed up with an ITQ in 1994.
Quota allocations in the Southern Zone are based on a per pot entitlement in which the total quota is divided by total pots. Individual allocations are the sum of the per pot entitlement and total pots assigned to the license (Morgan, 2001c). Licenses and pots are freely transferrable subject to minimum and maximum trap holdings of 40 and 100 respectively. Once converted into quota units, license holders may choose to actively fish fewer pots than they may be entitled to use. Temporary transfers of quota units are allowed, but also require the transfer of traps because quota units themselves are denominated in terms of pots. The Southern Zone fishery includes a number of additional management measures including a closed season, closed areas, minimum size, prohibition on taking egg-bearing females, trap design specifications, and reporting requirements.
Retention of input controls in the Northern Zone in 1992 was driven by concerns over the ability to reliably set quotas, the ability to effectively monitor quotas, allocation rules, and general support for effort controls in effect at the time (Sloan and Crosthwaite, 2007a). However, effort was still deemed to be unsustainable, which led to a series of effort controls, including a 10 percent trap reduction in 1992 as well as a series of progressive increases in both closure times and minimum sizes. The time closures made it difficult to respond to market conditions, leading to a management review in 2002 that resulted in the adoption of a quota management system in 2003 (Sloan and Crosthwaite, 2007a). After a three-year adjustment period, the fishery operated as an ITQ fishery in much the same manner as that of the Southern Zone. Specifically, quota units are denominated in terms of traps by dividing the total quota by the number of traps assigned to each license. The Northern zone has a minimum and maximum number of traps that may be assigned to each license as well as a minimum number of quota units, but does not limit the number of quota units that may be assigned to any one license. Because license holders may fish no more than 100 pots, there is an upper limit on the number of quota units that may be effectively used by any given license holder, although this limit is self-determined by individual skill and
243Tradable traps in the northeast United States American lobster fishery
initiative. The Northern Zone rock lobster fishery retains a number of input controls including a closed season, closed areas, minimum harvestable size, trap specification requirement including escape vents, and monitoring and reporting requirements including an electronic vessel monitoring system (Sloan and Crosthwaite, 2007a).
TRANSFERRABLE TRAPS IN THE NORTHEAST UNITED STATES AMERICAN LOBSTER (HOMARUS AMERICANUS) FISHERYAcheson (1997) describes the commercial fishery for American lobster in the United States as beginning in the 1840s with the development of the re-circulating seawater tank that made it possible to ship lobsters to urban population centres in the Northeast. The fishery was almost exclusively prosecuted in near-shore waters using traps and for much of its early history, the lobster fishery was managed by individual states, with little formal attempt to coordinate either management or regulatory actions across states (Thunberg, 2007). Over time the aerial extent of the fishery has expanded to the United States EEZ, resulting in shared management responsibility between the states and the Federal government (Thunberg, 2007).
Initially the Federal management authority was exercised through the provisions of the Fishery Conservation and Management Act of 1976 (commonly referred to as the Magnuson Act). The Magnuson Act established the fishery management council system with the New England Fishery Management Council (NEFMC), designated as the primary lead under which management actions affecting the lobster fishery were to be developed and recommended for implementation by the National Marine Fisheries Service (NMFS). The first Fishery Management Plan (FMP) for lobster was implemented in 1983. The FMP established a number of provisions intended to bring consistency throughout the range of the resource including a standard minimum size, prohibition on landing lobster parts and egg-bearing females, escape vents on traps, and a permit requirement for fishing in EEZ waters. The FMP was amended on a number of occasions that would have increased the minimum size by one-thirty second of an inch per year for five consecutive years starting in 1988. Initially, individual States adopted the same schedule of size increases, but responding to opposition Maine which accounted for about 75 percent of landings repealed any further size increases above three and one quarter of an inch. The remaining states quickly followed suit (Thunberg, 2007). This was just the start of tension between the States and Federal management as Federal authority extended only over the EEZ whereas the majority of harvest took place in state waters. Eventually, Federal authority for managing the lobster fishery under the Magnuson Act was withdrawn and transferred in 1999 to the Atlantic Coastal Fisheries Cooperative Management Act (ACFCMA).
Under ACFCMA, the Atlantic States Marine Fisheries Commission (ASMFC) now has the lead responsibility for developing management measures for the lobster fishery in both state and federal waters. Within this setting the ASMFC develops measures to be implemented by its member states and recommends complementary action to be taken by the NMFS for federal waters. This institutional structure still retains the jurisdictional boundaries between regulatory actions taken by individual states and actions by NMFS, but assures coordination across jurisdictions. Complementary action taken by NMFS must take the ASMFC recommendations into account, but NMFS may choose to deviate from them under certain circumstances such as when a recommended action may conflict with a National Standard, may be administratively burdensome, or may conflict with other applicable federal law.
Coordinated state action is based on an Interstate Fishery Management Plan (ISFMP). Amendment 3 to the American lobster ISFMP was developed by the ASMFC in 1997 and remains in effect today (Thunberg, 2007). Amendment 3 established a regional management approach by sub-dividing the lobster resource into Lobster Conservation Management Areas (LCMA) (see Figure 1) based partly on biologically recognized
244 Effort rights in fisheries management – General principles and case studies from around the world
stock areas and fishing practices. Specifically, management recommendations are developed for each LCMA by Lobster Conservation Management Teams (LCMT) whose members predominately fish within each LCMA.
Amendment 3 of the ISFMP established a number of measures that would be implemented coast-wide as well as a default approach to management in each LCMA that would go into effect in the absence of any further action. The coast-wide measures included biological protections such as minimum sizes, a maximum size in the Gulf of Maine, prohibitions on taking egg-bearing or V-notched lobster5, and a requirement to have a ghost panel in each trap6. The default measures included a scheduled reduction in the maximum number of traps that may be used by each permit holder. The trap cap was to be 1 200 traps in 1998, 1 000 traps in 1999, and 800 traps by 2000 in most areas. The default cap for LCMA 3 was set at 2 000 traps (Lockhart and Estrella, 1997). At the time, the LCMT representing LCMA 3 was the only one that expressed the intent to develop an individual trap allocation programme. By 1999, limited entry with individual trap allocations were proposed for LCMA 3, 4, 5, and 6 (ASMFC, 1999). Notably, limited entry was not proposed for LCMA 1, which accounts for the overwhelming majority of landings7. In 2002, the list of LCMAs that had proposed limited entry and individual trap allocations grew to the Outer Cape Cod (OCC) LCMA (ASMFC, 2002), and in 2003 LCMA 2 proposed that the fishery be managed with limited entry with individual trap allocations (ASMFC, 2003).
Individual trap allocations were established in LCMAs 4, 5, and 6, but there were no provisions to transfer traps among individuals that were eligible to fish in these areas. By contrast, transferability was proposed during 2002 for the OCC LCMA (ASMFC, 2002), and in 2003 for both LCMA 3 and LCMA 2 (ASMFC, 2003). These initial proposals have undergone a number of revisions based on changing resource conditions and implementation issues since they were first proposed. With the exception of the OCC programme, which is entirely administered by the state of Massachusetts, full implementation of trap transferability in LCMA 2 and 3 has yet to be accomplished because complementary Federal regulations have yet to be reconciled with the manner which each programme has been implemented across states. Reconciling state and Federal regulations is complicated by the partitioning of management among regions which led to development of three different qualification criteria and transferability provisions and the fact that these provisions have to be implemented in substantially the same way by each state from Maine to North Carolina (ASMFC, 2009a).
Although not yet fully implemented, the provisions for each of the three LCAMs that include transferability have a number of common characteristics (see Table 2). Each programme allows permanent transfer of licenses and/or traps, but none permit leasing. The prohibition on leasing is a reflection of the desire to see that the primary benefits from transferability accrue to active participants. All programmes have a cap on the number of licenses that may be assigned to any one person or business entity as well as a cap on the total number of traps that may be assigned to any one license. All programmes have provisions for passive reductions in total traps by levying what is referred to as a “conservation tax” on all trap transfers. In LCMA 3 the conservation tax is higher for trap-only transfers as compared with a transfer of the entire business (license and all traps allocated to the license). The minimum number of traps that may be transferred on each occasion is 50 traps unless the transferor only owns fewer than
5 The practice of “v-notching” involves cutting a v-shaped notch cut in the tail of egg-bearing females prior to returning them to the water. The practice is intended to afford additional protection to known breeding lobsters as the notch will remain through one or more molts.
6 A ghost panel is a panel usually incorporated into the escape panel that is attached using a degradable material that will create a large hole in the trap in the event the trap is lost.
7 Limited entry was not proposed for LCMA 1 until 2009 (ASMFC, 2009b).
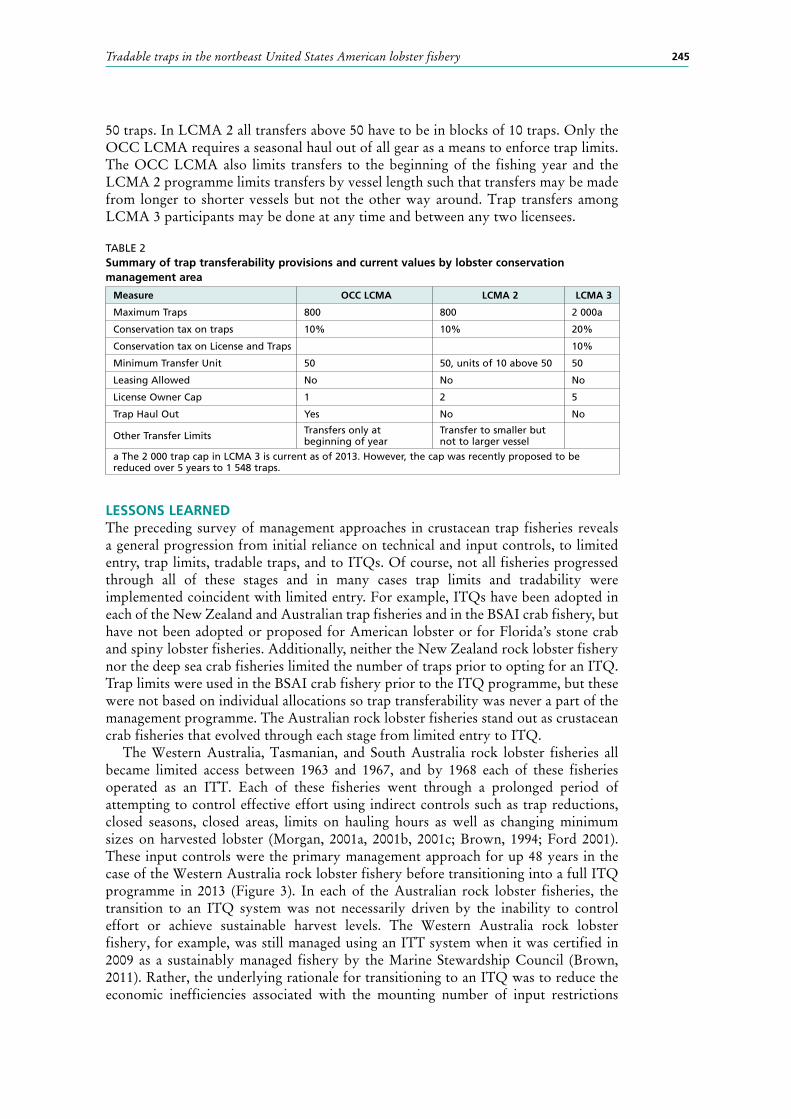
245Tradable traps in the northeast United States American lobster fishery
50 traps. In LCMA 2 all transfers above 50 have to be in blocks of 10 traps. Only the OCC LCMA requires a seasonal haul out of all gear as a means to enforce trap limits. The OCC LCMA also limits transfers to the beginning of the fishing year and the LCMA 2 programme limits transfers by vessel length such that transfers may be made from longer to shorter vessels but not the other way around. Trap transfers among LCMA 3 participants may be done at any time and between any two licensees.
TABLE 2Summary of trap transferability provisions and current values by lobster conservation management area
Measure OCC LCMA LCMA 2 LCMA 3
Maximum Traps 800 800 2 000a
Conservation tax on traps 10% 10% 20%
Conservation tax on License and Traps 10%
Minimum Transfer Unit 50 50, units of 10 above 50 50
Leasing Allowed No No No
License Owner Cap 1 2 5
Trap Haul Out Yes No No
Other Transfer Limits Transfers only at beginning of year
Transfer to smaller but not to larger vessel
a The 2 000 trap cap in LCMA 3 is current as of 2013. However, the cap was recently proposed to be reduced over 5 years to 1 548 traps.
LESSONS LEARNEDThe preceding survey of management approaches in crustacean trap fisheries reveals a general progression from initial reliance on technical and input controls, to limited entry, trap limits, tradable traps, and to ITQs. Of course, not all fisheries progressed through all of these stages and in many cases trap limits and tradability were implemented coincident with limited entry. For example, ITQs have been adopted in each of the New Zealand and Australian trap fisheries and in the BSAI crab fishery, but have not been adopted or proposed for American lobster or for Florida’s stone crab and spiny lobster fisheries. Additionally, neither the New Zealand rock lobster fishery nor the deep sea crab fisheries limited the number of traps prior to opting for an ITQ. Trap limits were used in the BSAI crab fishery prior to the ITQ programme, but these were not based on individual allocations so trap transferability was never a part of the management programme. The Australian rock lobster fisheries stand out as crustacean crab fisheries that evolved through each stage from limited entry to ITQ.
The Western Australia, Tasmanian, and South Australia rock lobster fisheries all became limited access between 1963 and 1967, and by 1968 each of these fisheries operated as an ITT. Each of these fisheries went through a prolonged period of attempting to control effective effort using indirect controls such as trap reductions, closed seasons, closed areas, limits on hauling hours as well as changing minimum sizes on harvested lobster (Morgan, 2001a, 2001b, 2001c; Brown, 1994; Ford 2001). These input controls were the primary management approach for up 48 years in the case of the Western Australia rock lobster fishery before transitioning into a full ITQ programme in 2013 (Figure 3). In each of the Australian rock lobster fisheries, the transition to an ITQ system was not necessarily driven by the inability to control effort or achieve sustainable harvest levels. The Western Australia rock lobster fishery, for example, was still managed using an ITT system when it was certified in 2009 as a sustainably managed fishery by the Marine Stewardship Council (Brown, 2011). Rather, the underlying rationale for transitioning to an ITQ was to reduce the economic inefficiencies associated with the mounting number of input restrictions
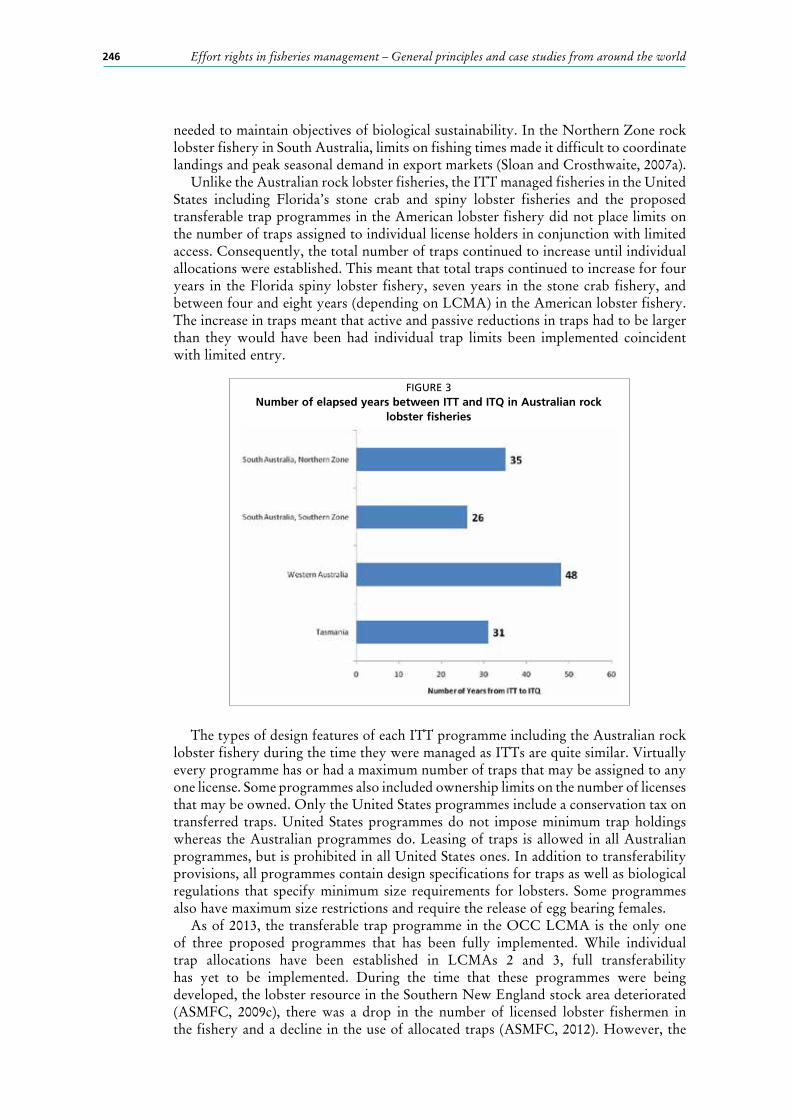
246 Effort rights in fisheries management – General principles and case studies from around the world
needed to maintain objectives of biological sustainability. In the Northern Zone rock lobster fishery in South Australia, limits on fishing times made it difficult to coordinate landings and peak seasonal demand in export markets (Sloan and Crosthwaite, 2007a).
Unlike the Australian rock lobster fisheries, the ITT managed fisheries in the United States including Florida’s stone crab and spiny lobster fisheries and the proposed transferable trap programmes in the American lobster fishery did not place limits on the number of traps assigned to individual license holders in conjunction with limited access. Consequently, the total number of traps continued to increase until individual allocations were established. This meant that total traps continued to increase for four years in the Florida spiny lobster fishery, seven years in the stone crab fishery, and between four and eight years (depending on LCMA) in the American lobster fishery. The increase in traps meant that active and passive reductions in traps had to be larger than they would have been had individual trap limits been implemented coincident with limited entry.
The types of design features of each ITT programme including the Australian rock lobster fishery during the time they were managed as ITTs are quite similar. Virtually every programme has or had a maximum number of traps that may be assigned to any one license. Some programmes also included ownership limits on the number of licenses that may be owned. Only the United States programmes include a conservation tax on transferred traps. United States programmes do not impose minimum trap holdings whereas the Australian programmes do. Leasing of traps is allowed in all Australian programmes, but is prohibited in all United States ones. In addition to transferability provisions, all programmes contain design specifications for traps as well as biological regulations that specify minimum size requirements for lobsters. Some programmes also have maximum size restrictions and require the release of egg bearing females.
As of 2013, the transferable trap programme in the OCC LCMA is the only one of three proposed programmes that has been fully implemented. While individual trap allocations have been established in LCMAs 2 and 3, full transferability has yet to be implemented. During the time that these programmes were being developed, the lobster resource in the Southern New England stock area deteriorated (ASMFC, 2009c), there was a drop in the number of licensed lobster fishermen in the fishery and a decline in the use of allocated traps (ASMFC, 2012). However, the
FIGURE 3Number of elapsed years between ITT and ITQ in Australian rock
lobster fisheries
247Tradable traps in the northeast United States American lobster fishery
unused traps remain assigned to a license as long as the license is renewed for a nominal fee. The prospect of being able to transfer unused traps creates an incentive to renew inactive licenses, which can then be transferred to active licenses once transferability has been implemented. Concerns over the transfer and subsequent conversion of latent effort into active effort led to development of provisions that would limit the number of traps that could be actively fished and placed a higher limit on the number of traps that may be assigned (ASMFC, 2013). The provisions allow licensees to “bank” traps that cannot be actively fished, but insulates the licensee from a series of scheduled trap reductions as reductions would be absorbed by the banked traps leaving the traps that may be actively fished unchanged. While the total number of traps available to be fished in LCMA 2 and 3 would be reduced, the change in actively fished traps would be less than proportional to the reduction in total traps. Thus, the change in effective effort is likely to be less than the change in nominal traps even without accounting for technological change.
The inability to control increases in effective effort without imposing measures that create economic inefficiencies is a persistent management problem in crustacean trap fisheries. Rock lobster trap fisheries in Tasmania, Western, and South Australia were managed with ITTs for at least 26 years before transitioning to ITQs. With the Australian experience as a backdrop, the performance of the transferable trap programmes in the United States American lobster trap fishery bears watching.
REFERENCESAbbott, J. K., Garber-Yonts, B. & Wilen, J. E. 2010. Employment and remuneration
effects of IFQs in the Bering Sea/Aleutian Islands crab fisheries. Marine Resource Economics, 25: 333-354.
Acheson, J.M. 1975. The lobster fiefs: economic and ecological effects of territoriality in the Maine lobster fishery. Human Ecology, 3(3): 183-207.
Acheson, J. M. 1989. Where have all the exploiters gone? Co-Management of the Maine lobster fishery. In F. Berkes, eds., Common Property Resources Ecology and Community-Based Sustainable Development. pp. 199-217. London, UK, Belhaven Press.
Acheson, J.M. 1997. The politics of managing the Maine lobster industry: 1860 to the present. Human Ecology, 25(1): 1-25.
Annala, J. 1983. New Zealand Rock Lobsters: Biology and Fishery. Fisheries Research Division Occasional Publication No. 42. Wellington, New Zealand Ministry of Agriculture and Fisheries.
ASMFC. 1999. Addendum I to Amendment 3 of the Interstate Fishery Management Plan for American Lobster. Atlantic States Marine Fisheries Commission.
ASMFC. 2002. Addendum III to Amendment 3 of the Interstate Fishery Management Plan for American Lobster. Fishery Management Report No. 29a. Atlantic States Marine Fisheries Commission.
ASMFC. 2003. Addendum IV to Amendment 3 of the Interstate Fishery Management Plan for American Lobster. Atlantic States Marine Fisheries Commission.
ASMFC. 2009a. Addendum XII to Amendment 3 of the Interstate Fishery Management Plan for American Lobster. Atlantic States Marine Fisheries Commission.
ASMFC. 2009b. Addendum XV to Amendment 3 of the Interstate Fishery Management Plan for American Lobster. Limited Entry for Federal Waters of LCMA 1. Atlantic States Marine Fisheries Commission.
ASMFC, 2009c. American lobster stock assessment report for peer review. Stock Assessment Report No. 09-01 (Supplement). Atlantic States Marine Fisheries Commission.
ASMFC. 2012. Addendum XVIII to Amendment 3 of the Interstate Fishery Management Plan for American Lobster. Southern New England Reductions in Fishing Capacity for Lobster Conservation Management Areas 2 and 3. Atlantic States Marine Fisheries Commission.
248 Effort rights in fisheries management – General principles and case studies from around the world
ASMFC. 2013. Addendum XXI to Amendment 3 of the Interstate Fishery Management Plan for American Lobster. Southern New England Reductions in Fishing Capacity for Lobster Conservation Management Areas 2 and 3 Transferability Measures. Atlantic States Marine Fisheries Commission.
Bradshaw, M. 2004. A combination of state and market through ITQs in the Tasmanian rock lobster fishery: the tail wagging the dog? Fisheries Research, 67: 99-109.
Brisman, A. 2003. A less tragic commons using harvester and processor quotas to address crab overfishing. Seattle University Law Review, 26: 929-978.
Brown, B. K. 1994. Long Term management strategies for the Western rock lobster fishery. Fisheries Management Paper, 1(67). Perth, Australia, Fisheries Department of Western Australia.
Brown, R. 2011. Governance of the Western Rock Lobster Fishery and Marine Stewardship Council Principle 3 Effective Management. Fisheries Occasional Publication No. 96. Western Australia, Department of Fisheries.
Cancino. P., Uchida, H. & Wilen, J. E. 2007. TURFs and ITQs: collective vs. individual decision making. Marine Resource Economics, 22: 391-406.
Christy, F. T. Jr. 1982. Territorial use rights in marine fisheries: definitions and conditions. FAO Fisheries Technical Paper. 227: 10.
Chubb, C. F. & Barker, E. H. 2003. The Western rock lobster fishery 1997/1998 to 1999/2000. Fisheries Research Report No. 140. Western Australia, Department of Fisheries.
Chubb, C. F. & Barker, E. H. 2004. The Western rock lobster fishery 1999/2000 to 2001/2002. Fisheries Research Report No. 145. Western Australia, Department of Fisheries.
Chubb, C. F. & Barker, E. H. 2005. The Western rock lobster fishery 2001/2002 to 2002/2003. Fisheries Research Report No. 149. Western Australia, Department of Fisheries.
Department of Fisheries. 2009a. A quota management system for the Western rock lobster fishery. Fisheries Occasional Publication no 68. Western Australia, Department of Fisheries.
Department of Fisheries. 2009b. An input control management system for the Western rock lobster fishery. Fisheries Occasional Publication no 69. Western Australia, Department of Fisheries.
Fina, M. 2005. Rationalization of the Bering Sea and Aleutian Islands crab fisheries. Marine Policy, 29: 311-322.
Fletcher, W., Chubb, C., McCrea, J., Caputi, N., Webster, F., Gould, R. & Bray, T. 2005. Western Rock Lobster Fishery. ESD Report Series No. 4. Western Australia, Department of Fisheries.
Fluech, B. undated. Overview: Florida’s Stone Crab Fishery. Collier County Sea Grant, University of Florida Sea Grant Programme.
Ford, W. 2001. The effects of the introduction of individual transferable quotas in the Tasmanian rock lobster fishery. In R. Schotten, eds. Case Studies on the Effects of Transferable Fishing Rights on Fleet Capacity and Concentration of Quota Ownership. FAO Fisheries Technical Paper No. 412. Rome, FAO.
Ford, W. and D. Nichol. 2001. The initial allocation of individual transferrable quota in the Tasmanian rock lobster and abalone fisheries. In R. Shotton, eds. Case Studies on the Allocation of Transferable Quota Rights in Fisheries. FAO Fisheries Technical Paper No. 411. Rome, FAO.
Gonzalez, E. 1996. Territorial use rights in Chile. Marine Resource Economics, 11: 211-218.Hamon, K. G., Thébaud, O., Frusher, S., & Little, L.R. 2009. A retrospective analysis of
the effects of adopting individual transferable quotas in the Tasmanian red rock lobster, Jasusedwardsii fishery. Aquatic Living Resources, 22: 549–558.
King, T. D. 1997. Folk management among Belizean lobster fishermen: success and resilience or decline and depletion? Human Organization, 56(4): 418-426.
249Tradable traps in the northeast United States American lobster fishery
Larkin, S. L. & Milon, J. W. 2000. Tradable effort permits: A case study of the Florida spiny lobster trap certificate programme. In Richard S. Johnston, eds., Proceeding of the Tenth Biennial Conference of the International Institute of Fisheries Economics and Trade, July 10-14. Corvallis, Oregon, International Institute of Fisheries Economics and Trade (IIFET).
deLestang, R. & Barker, E. H. 2009. The Western Australia rock lobster fishery 2003/2004 to 2004/2005. Fisheries Research Report No 157. Western Australia, Department of Fisheries.
deLestang, R., Melville-Smith, A., Thomson, M., Rossbach, and Donohue, K. 2008. West Coast Lobster Fishery Status Report. In Fletcher, W.J. and Santoro, K., eds. State of the Fisheries Report 2007/08. Western Australia, Department of Fisheries.
Lockhart, F. & B. Estrella. 1997. Amendment 3 to the Interstate Fishery Management Plan for American Lobster. Fishery Management Report No. 29, Atlantic States Marine Fisheries Commission.
Matthews, R. 1995. Fishing effort reduction in the Florida spiny lobster fishery. In Proceedings of the Forty-Eight Annual Gulf and Caribbean Fisheries Institute. pp. 111-121.
Matthews, T. R., & Larkin, M. F. 2002. Fishing effort and resource allocation in the Florida stone crab (Menippe) fishery. In Proceedings of the Fifty-Third Annual Gulf and Caribbean Fisheries Institute. pp. 83-99.
Matulich, S.C. 2008. Did processing quota damage Alaska red king crab harvesters? Empirical evidence. Marine Resource Economics, 23: 253-271.
Miller, R. J., & Breen, P. A. 2010. Are lobster fisheries being managed effectively? Examples from New Zealand and Nova Scotia. Fisheries Management and Ecology, 17: 394-403.
Milon, J. W., Larkin, S. L. & Ehrhardt, N.M. 1999. Bioeconomic Models of the Florida Commercial Spiny Lobster Fishery. Sea Grant Report Number 117. University of Florida, Florida Sea Grant College Programme.
Morgan, G. R. 2001a. Initial Allocation of harvesting rights in the rock lobster fishery of Western Australia. In R. Shotton eds., Case Studies of the Allocation of Transferable Quota Rights in Fisheries. FAO Fisheries Technical Paper No 411. pp. 136-143. Rome, FAO.
Morgan, G. R. 2001b. Changes in fishing practice, fleet capacity and ownership of harvesting rights in the rock lobster fishery of Western Australia. In R. Schotten, eds. Case Studies on the Effects of Transferable Fishing Rights on Fleet Capacity and Concentration of Quota Ownership. FAO Fisheries Technical Paper, No. 412. pp. 80-88. Rome, FAO.
Morgan, G.R. 2001c. Changes in fishing practice, fleet capacity and ownership of harvesting rights in the fisheries of South Australia. In R. Schotten eds., Case Studies on the Effects of Transferable Fishing Rights on Fleet Capacity and Concentration of Quota Ownership. FAO Fisheries Technical Paper No. 412. pp. 80-88. Rome, FAO.
Muller, R. G., Hunt, J. H., Matthews, T. R. & Sharp, W. C. 1997. Evaluation of effort reduction in the Florida Keys spiny lobster, Panulirusargus, fishery using an age-structured population analysis. Marine and Freshwater Research, 48: 1045-1058.
National Marine Fisheries Service. 2012. Fisheries of the United States 2012. Current Fishery Statistics No. 2012. Silver Spring, Maryland; National Marine Fisheries Service, Office of Science and Technology. (Also available at http://www.st.nmfs.noaa.gov/Assets/commercial/fus/fus12/01_front2012.pdf).
North Pacific Fishery Management Council. 2008. The Three-Year Review of the Crab Rationalization Programme for Bering Sea and Aleutian Islands Crab Fisheries. Anchorage, AK, North Pacific Fishery Management Council. (Also available at http://alaskafisheries.noaa.gov/npfmc/PDFdocuments/catch_shares/Crab/3yearreview1208.pdf).
250 Effort rights in fisheries management – General principles and case studies from around the world
North Pacific Fishery Management Council. 2011. Fishery Management Plan for Bering Sea and Aleutian Islands King and Tanner Crabs. Anchorage, Alaska, North Pacific Fishery Management Council. (Also available at http://www.npfmc.org/wp-content/PDFdocuments/fmp/CrabFMPOct11.pdf).
Phillips, G., Kriwoken, L. & Hay, P. 2002. Private property and public interest in fisheries management: the Tasmanian rock lobster fishery. Marine Policy, 26: 459-469.
Ruddle, K., Hviding, E. & Johannes, R. E. 1992. Marine resources management in the context of customary tenure. Marine Resource Economics, 7: 249-273.
Sloan, S. & Crosthwaite, K. 2007a. Management Plan for the South Australian Northern Zone Rock Lobster Fishery. South Australian Fisheries Management Series, Paper Number 51. South Australia, Primary Industries and Resources.
Sloan, S. & Crosthwaite, K. 2007b. Management Plan for the South Australian Southern Zone Rock Lobster Fishery. South Australian Fisheries Management Series, Paper Number 52. South Australia, Primary Industries and Resources.
Soboil, M. & Craig, A. 2008. Self Governance in New Zealand’s developmental fisheries: deep-sea crabs. In R. Townsend, R. Schotten & H. Uchida, eds. Case Studies in Fisheries Self-Governance. FAO Fisheries Technical Paper 504. Rome, FAO.
Sosa-Cordero, E., Liceaga-Correa, M.L.A. & Seijo, J.C. 2008. The Punta Allen lobster fishery: current status and recent trends. In R. Townsend, R. Shotten & H. Uchida, eds. Case studies in fisheries self-governance. FAO Fisheries Technical Paper 504. pp. 149-162. Rome, FAO.
Thunberg, E. M. 2007. Demographic and economic trends in the northeastern United States lobster (Homarus americanus) fishery, 1970-2005. United States Department of Commerce, Northeast Fisheries Science Center Reference Document. Woods Hole, MA, National Marine Fisheries Service. 64 pp.
Van Putten, I. & Gardner, C. 2010. Lease quota fishing in a changing rock lobster industry. Marine Policy, 34: 859-867.
Vondruska, J. 2010. Florida’s Commercial Fishery for Caribbean Spiny Lobster. SERO-FSSB-2010-02. National Marine Fisheries Service, St. Petersburg, FL, Southeast Regional Office.
Woodley, C. J., Lincoln, J. M. & Medlicott, C. J. 2009. Improving commercial fishing vessel safety through collaboration. Proceedings of the Commercial Fishing Safety and Security Council. The Coast Guard Journal of Safety at Sea, 66(1): 38-43.
Yandle, T. 2008. Rock lobster management in New Zealand: the development of devolved governance. In R. Townsend, R. Shotten, & H. Uchida, eds. Case studies in fisheries self-governance. FAO Fisheries Technical Paper 504. pp. 291-300. Rome, FAO.
251
Collective approaches to fisheries management
Kathleen Segerson, University of ConnecticutE-mail: [email protected]
INTRODUCTIONHistorically, fisheries management has relied primarily on setting aggregate targets for allowable catch and then directly controlling harvesting through restrictions on, for example, entry, days at sea, and fishing gear. However, it has long been recognized that regulatory approaches of this type are typically neither effective nor economically efficient, leading, for example, to a “race to fish” (e.g., Wilen, 1988). An alternative approach based on granting individual property rights through catch shares has been shown to be effective as a means of preventing the collapse of stocks and improving resource management (Costello, et al. 2008; Gutiérrez, et al., 2011). In addition, catch shares in the form of individual transferable quotas (ITQs) have long been advocated by economists as a means of increasing economic efficiency and hence the long run value of commercial fisheries (Scott, 2008).
Although ITQs can improve outcomes relative to traditional regulatory approaches, granting harvest rights to individuals through ITQs does not fully address all of the challenges associated with managing fisheries effectively and efficiently, since it does not internalise all of the relevant external effects of individual harvesting decisions. While ITQs can lead to efficient control of the quantity of individual fishing effort during a given season, they do not ensure an optimal spatial or intra-seasonal allocation of effort and often fail to address adequately complex interactions in multispecies fisheries (Holland, 2004; Wilen, et al., 2012). In addition, ITQs do not provide efficient incentives for (i) biomass conservation over time, (ii) ecosystem and habitat protection, and (iii) balancing of commercial fishing and other uses of the marine environment or marine resources (Arnason, 2012).
An alternative form of rights-based management grants property rights collectively to a group of individuals rather than directly to the individuals themselves. Collective management approaches can involve a variety of institutional forms, including fishing cooperatives and territorial use rights fisheries (TURFs). They have the potential to improve management in situations where the returns or rewards that one member of the group receives depend not only on his own decisions/actions but also on those of other members of the group, or, in other words, when one party’s actions can impose benefits or costs on others within the group. This interdependence can arise from two sources. First, it can stem from the biological or economic environment in which members of the group operate. For example, when harvesters compete for prime fishing locations, times, or stocks, or when the price a harvester receives for his landings depends on the landings of others as well, then one harvester’s revenue will be affected by the harvest decisions of others. In this case, harvesters within a given fishery impose intra-fishery externalities on other harvesters simply because of the nature of the fishery.
Alternatively, even in the absence of ecological or market interactions, interdependence can arise from externally-imposed constraints, such as collective limits on harvest of a target species or bycatch imposed by regulators or fishery managers (Abbott and Wilen,
252 Effort rights in fisheries management – General principles and case studies from around the world
2009; Zhou and Segerson, 2014). These quotas typically seek to limit fishing activity either to reduce intra-fishery externalities of the type described above or to reduce externalities borne outside the fishery, resulting, for example, from bycatch of non-commercial (sometimes endangered) species, ecological impacts of habitat degradation from disruptive fishing, or other non-commercial uses of the marine environment (e.g., recreational fishing). Under a collective quota, use of part of the collective quota by one harvester implies that less is available for use by others, which implies that the opportunities available to one harvester are impacted by the decisions of others. Regardless of whether the interdependencies arise from intra-fishery externalities and/or solely from externally-imposed aggregate constraints, a collective assignment of rights or limits provides an incentive for members of the group to seek to collectively address these interdependencies, which does not exist under ITQs.
Although collective approaches have the potential to overcome some of the limitations of ITQs, they can also create unintended negative incentives, such as an incentive for individuals to free-ride on the effort of others (e.g., Abbott and Wilen, 2009; Heintzelman, et al., 2009). Thus, a key question is whether collective approaches are likely to be more or less effective in fisheries management than approaches that rely on regulating or assigning rights to individual harvesters or vessels. This chapter provides a discussion of collective approaches from an economic perspective. Rather than describing any specific fishery,1 it highlights some general issues that arise in the use of a collective approach and their implications for improved management. In addition, it presents a simple and stylized model that can be used to illustrate some incentive issues that can arise in the use of collective approaches and ways in which potential negative effects can be offset.
FEATURES OF COLLECTIVE APPROACHES TO FISHERIES MANAGEMENTCollective approaches have been used extensively in some countries, such as Japan and Chile (Cancino, et al. 2007), and examples can be found throughout the world (Orvando, et al., 2013). Collective approaches share the common feature that rights (or responsibilities or limits) are explicitly or implicitly assigned collectively to members of an identified group, typically harvesters or vessels. Other than this, there are a number of ways in which collective approaches can differ, and these differences can significantly affect the incentives faced by individuals within the group.
Species vs. spatially-based rightsIn many cases, collective rights are tied to the harvest (or bycatch) of a specific species or collection of species, while in other cases, they are spatially delineated. In the latter case, the rights granted within the designated space can be broadly defined (e.g., covering the entire marine system) or more narrowly defined to include only a subset of the marine resources within that space. Each approach has advantages and disadvantages (Wilen, et al., 2012). For example, species-based rights can be effective in controlling total harvest or bycatch of a designated species, but do not typically ensure efficient allocation of fishing activities over time and space or provide incentives for maintaining biomass and protecting habitat. In addition, they typically ignore inter-species interactions, including predator-prey relationships. In contrast, broadly-defined spatially-delineated rights can provide incentives for managing the marine system more effectively, by coordinating fishing effort across time and space and addressing system-wide species and habitat interactions. However, when species
1 For detailed descriptions of fisheries managed under a collective approach, see, for example, Platteau and Seki (2001), Cancino, et al. (2007), Uchida, et al. (2011), Scheld, et al., (2012) and the case studies in Townsend, et al. (2008).
253Collective approaches to fisheries management
(or larvae) move across spatial boundaries, spatially-delineated rights will fail to provide incentives for consideration of impacts that occur outside the designated area (Holland, 2004; White and Costello, 2011).
Collective rights/limits vs. collective decisions (cooperation)As noted above, collective approaches can typically be categorized as arising from one (or possibly both) of the following two situations: (1) intra-fishery externalities, i.e. inherent interdependencies among members of the group created by ecological and/or economic conditions, or (2) externally-imposed collective limits or responsibilities.2 Under either of these cases, the extent to which the assignment of collective rights or responsibilities leads to collective (i.e., coordinated) decisions can vary significantly, ranging anywhere from full coordination (where, for example, a manager or committee makes all decisions for all members of the group) to no coordination (where each member of the group continues to act independently despite the collective constraint). For example, the industry-wide sea turtle bycatch limit in the Pacific longline swordfish fishery imposes an aggregate limit on bycatch across all vessels, but vessel owners do not collectively manage the fishery or bycatch (Segerson, 2010). Likewise, in many of the New England groundfish sectors, the sector-wide catch allocation is distributed by the sector to individual sector members, who then make independent decisions about how to use their share of the total quota (Holland and Weirsma, 2010). In contrast, the short-lived Alaskan Chignik salmon cooperative was granted a collective allowable catch and managed that allocation cooperatively (Deacon, et al., 2008). Similarly, the local fishing organization that manages the sakuraebi fishery in Japan makes most decisions cooperatively (Uchida and Baba, 2008), as does the deep-sea crab fishery in New Zealand (Soboil and Craig, 2008). Whether decisions by members of the group are coordinated (or, more generally, the extent to which they are) has important implications for the incentives created by the collective approach (see further discussion below).
Types of cooperative activitiesWhen members within a group choose to act cooperatively or collectively, they can do so in a number of different ways (Uchida and Makino, 2008; Deacon, 2012; Orvando, et al., 2013). These include limits on and coordination (and enforcement) of effort and harvest activities (including gear restrictions), sharing of public inputs (e.g. gear, information, and infrastructure), cooperative marketing and stewardship-related activities (including bycatch avoidance, conservation, and habitat enhancement). The nature and source of the interdependencies within the group will determine which of these types of cooperation are likely to be most beneficial to the group.
Income-sharing or pooling rulesIn addition to engaging in cooperative behaviour of different types, some groups also use some form of income sharing or pooling.3 The potential benefits of pooling are usually described in terms of risk-sharing (or insurance) or the creation of incentives for cooperation leading to increased profitability (Platteau and Seki, 2001). For
2 A recent survey by Ovando, et al. (2013) found that about 75 percent of the fishing cooperatives surveyed had some form of government-imposed management structure in place (e.g., TURF, ITQ, or Total Allowable Catch (TAC)), while about 25 percent had no government-imposed restrictions on fishing effort, effectively operating in an open access environment. Nonetheless, all operated under some sort of cooperative management structure.
3 Orvando, et al. (2013) report that 47 percent of surveyed fishing cooperatives engaged in some sort of proceeds sharing. For examples of cooperatively managed fisheries with different types of sharing rules, see, for example, Platteau and Seki (2001), Deacon, et al. (2008), and Uchica and Baba (2008).
254 Effort rights in fisheries management – General principles and case studies from around the world
example, pooling can reduce the incentive to ‘race to fish’, while at the same time creating incentives to share information and some inputs. However, pooling can also generate a free-rider problem, under which members of a group face an incentive to shirk (Heintzelman, et al., 2009). If members of the group bear the full costs of some activities but then reap only a share of the associated benefits, they will not face an efficient incentive to engage in those activities. Rather, they have an incentive to free-ride on the efforts of others.
A number of features relating to the design of the pooling arrangement affect the incentives it creates. These include: (1) whether members only share revenue or also share some or all of their costs (and hence share profit); (2) whether sharing is full or partial, i.e. members pool all or only a fraction of their revenues and/or costs; and (3) how the proceeds in the pool are redistributed (for instance equally or according to some other pre-set criteria)4. For example, in a context where there is no uncertainty (and hence no role for risk-pooling) and members exploiting a common property resource equally share some portion of their output (and hence revenue), Gaspart and Seki (2003) show that neither zero nor full pooling induces efficient effort; rather, pooling only a share of output creates efficient incentives by balancing the incentive to over-exploit due to the commons with the incentive to shirk created by revenue pooling. In contrast, when members of the group equally share total profit (implying a sharing of all revenues and all costs), then they have an incentive to internalise all intra-group interdependencies (Deacon, et al., 2008).
Aside from its incentive effects, as noted above, pooling is sometimes advocated as a means of sharing or spreading risk5. For example, when harvesters cannot fully control the composition or quantity of catch, pooling provides a mechanism for covering the excess catch by a member who ‘experiences a run of bad luck’ (Deacon, 2012). However, combining quota will not always lead to lower risk. For example, if hi denotes the (stochastic) harvest of vessel i and is the corresponding quota allocated to that vessel, it is not necessarily true that the probability that vessel i exceeds its individual quota, i.e. Pr(hi > ), will be greater than the probability that the collective harvest will exceed the combined quota, i.e. Pr(∑i hi >∑i ). This depends on both the nature of the underlying distribution of harvests and the magnitudes of the quotas. For example, under a uniform distribution, the probability of violating an individual limit is greater than the probability of collectively violating the combined quota when the quotas are relatively high, but the opposite is true when the quotas are relatively low (see Zhou and Segerson, 2014).
The discussion above highlights a fundamental trade off that exists under collective approaches. On the one hand, they can lead to more coordinated management decisions that help to address the interdependencies among harvesters that stem from ecological or market conditions or that arise as a result of externally-imposed regulations or limits. However, to be successful, incentives for individuals within the group to act
4 Revenue or profit sharing is often designed to ensure equal outcomes for all members of the group. Alternatively, collective management can be designed to provide equal opportunities, such as equal access to prime fishing locations or times. Some cooperative fisheries have used a rotation system to allocate opportunity equally across members of the group (see, for example, Uchida and Watanobe, 2008). Rotations can be viewed as a sharing system based on sharing some inputs rather than sharing revenue or profits from outputs. However, unlike equal revenue or profit sharing, equally sharing access to inputs does not provide a means for risk sharing (Uchida and Baba, 2008).
5 Harvesters subject to individual limits can also voluntarily combine quota to form risk pools as a means of managing the stochasticity of harvests. See, for example, Holland (2010), Holland and Wiersma (2010), and Holland and Jannot (2012). However, in a case study of three Japanese fishing groups, Platteau and Seki (2001) found evidence of pooling to manage risks related to inputs (nets) but no evidence that fishermen viewed pooling as an important means of smoothing income fluctuations.
hi
hi
hi
255Collective approaches to fisheries management
in accordance with the collective interests of the group and not shirk or deviate from prescribed behaviour must be created. Peer pressure, social norms and social status can sometimes play an important role in this regard (Uchida and Baba, 2008; Platteau and Seki, 2001; Gaspart and Seki, 2003). In addition, policies linked to the granting of collective rights can be used to induce efficient incentives for group members. For example, penalties or fees for exceeding collective quotas will affect the incentives faced by individual harvesters within the group. However, the appropriate design of those penalties will vary with the internal management structure of the group.
The following section illustrates this result more formally using a simple, stylized model of a fishery managed by a collective approach. The model is designed to illustrate the incentives created by a specific type of collective approach, namely a collective quota for a single species. Thus, it focuses on policy-induced interdependence rather than interdependence due to ecological or market conditions, and abstracts from the important real-world coordination issues related to spatial and intra-seasonal allocations of effort, multispecies interactions, product quality and/or price. Rather, in the model, the rationale for imposing quotas is based on a presumed desire to limit harvest to reduce social costs that stem from harvest but are external to the group. Despite these simplifications, the model captures two fundamental features of collective approaches, namely the impact of making collective (rather than individual) decisions when faced with a collective limit and the potential for risk-sharing when harvesters cannot fully control how much they catch.
A STYLIZED MODEL OF A COLLECTIVE APPROACH6
Consider a fishery comprised of two identical harvesters, each of whom owns and operates a single vessel. Let ei be the effort undertaken by harvesteri. The harvest amount hi is a function of the effort level and a random variable ɛi, given by hi = ɛi ei. The stochastic elements of the two harvesters are assumed to be uncorrelated. For simplicity, we assume ɛi is uniformly distributed over the unit interval. Assume that the variable cost of effort is given by C(ei) = ei and let the price of the harvested species be normalized to one. Given these assumptions, the expected profit of each harvester (exclusive of any fees penalties) is given by E[π (ei, ɛi)] = 0.5ei - ei , where the expectation is taken over the random variable ɛi.
Suppose that harvest activity generates external social costs that are proportional to total harvest, where d is the marginal external social cost. This can be interpreted as the cost imposed on others (outside the group) as a result of harvest by members of the group. This could be due, for example, to bycatch, the impacts of harvest on other species, habitat or ecosystem degradation, or long run impacts on stocks. The economically efficient effort levels will maximize the net benefits from harvest, given by the difference between aggregate expected profits and the expected external costs, i.e.
∑i E[π (ei, ɛi)] - dE(h1 + h2) (1)
They are thus given by the levels where the marginal social benefit of an increase in effort (in the form of increased expected profits) equals the marginal expected external social cost. Given the assumptions, this occurs at ei = 0.25(1-d) for i = 1.2. Thus, a higher marginal external damage implies a lower efficient level of effort for each vessel. Without any policy intervention, harvesters can be expected to ignore external costs and choose the effort levels that maximize their expected profits. This occurs when ei = 0.25(1-d) for i = 1.2. Given d<1, this is greater than the efficient effort level for
6 For a more detailed description of the model and results, see Zhou and Segerson (2014).
2
2
*
256 Effort rights in fisheries management – General principles and case studies from around the world
each harvester, representing the classic inefficiency that exists in an unregulated fishery where actions by individual harvesters generate external costs (either immediately or over time).
Consider now the implications of imposing a collective limit (denoted ) on the aggregate harvest of the two vessel owners, designed to reduce effort by both. Although the owners can control effort levels, the harvest that results from that effort is uncertain and hence they cannot directly control harvest to ensure that the collective limit is not exceeded. However, if exceeding the limit triggers some cost for the harvesters, they will have an incentive to reduce the likelihood of exceeding the limit. A number of alternatives are possible. One possibility is that the fishery will be closed once the aggregate limit is reached, as, for example, with the industry-wide limit on sea turtle bycatch in the Pacific longline swordfish fishery. An alternative means of managing the stochasticity of harvest is to require owners to pay a fee or penalty for harvest in excess of the aggregate limit, effectively requiring the group to buy extra quota to cover their excess catch. This is similar to the system of deemed values used in New Zealand’s quota management system (Sanchirico, et al., 2006). In the simple model of a collective approach presented here, for illustrative purposes we assume that catch in excess of the aggregate limit triggers a group payment (in the form of a fee, penalty, or purchase, similar to a deemed value) that is proportional to the amount by which the limit is exceeded, where k denotes the proportional rate.
The imposition of a collective limit does not, by itself, ensure that vessel owners act collectively (i.e., cooperatively) when making decisions about, for example, fishing effort. To understand the importance of intra-group coordination, we consider two alternative ends of the spectrum of possible levels of coordination: no coordination and full coordination.
In the case of no coordination, each member within the group makes his own decision independently to maximize his own expected profit net of his share of any fees that would be incurred if the aggregate limit is exceeded. We assume that the vessel owners in the group share those fees equally. Thus, if aggregate harvest exceeds the limit, i.e., if h1 + h2 > , then each owner incurs an additional cost of 0.5k (h1 + h2 - ). Given the effort levels of others, each harvester will then choose his effort levels to maximize his individual net expected profits, given by
(2)
where Pr(h1 + h2 > ) is the probability that the collective quota is exceeded. Hence, each harvester can be expected to choose the effort level where the marginal benefit from the increased expected pre-penalty profits equals the marginal cost from increased expected penalties, given the effort level of the other harvester. How this choice compares to the efficient level of effort depends on the magnitude of k, given the aggregate quota. Increases in k will reduce each owner’s effort, while decreases in k will increase effort, and by appropriately setting k, which can be viewed as the marginal ‘price’ for exceeding the quota, fishery managers can provide incentives for members of the group to choose efficient effort levels. However, to induce efficient effort, the marginal fee faced by each harvester (0.5k) (must exceed the marginal external damages caused by harvesting (d) if those damages are proportional to harvest while the fee is only incurred if the aggregate quota is exceeded. Thus, the marginal ‘price’ to the group for exceeding the quota would have to be more than twice the marginal external damages to induce efficient behaviour when members of the group do not coordinate.
In the case where members of the group fully cooperate and share all revenues and costs (i.e., there is full profit pooling), effort levels will be set to maximize joint expected profit net of the total fees incurred by the group if the collective quota is exceeded, given by
H
HH
E[π(ei, ɛi)] - E(0.5k(h1 + h2 - ) |h1 + h2 > )Pr(h1 + h2 > )H H H
H
257Collective approaches to fisheries management
(3)
The key difference between this and the previous case is that, with coordination, effort levels set for individuals will reflect the fee that the entire group would face if the quota is exceeded rather than simply the share of that cost that the individual owner would bear. Thus, in this case, the potential costs that one harvester’s effort level imposes on other members of the group are considered when decisions are made collectively, while they are not considered when members of the group make decisions individually. Nonetheless, as in the previous case, adjustments here in the magnitude of k will change the effort levels that are optimal for the group, and by adjusting k appropriately a fishery manager can provide incentives for the group to set effort levels efficiently. However, when the group acts cooperatively, the fee required to provide efficient incentives is only half what it is in the previous case where owners act individually.
Note that, unlike in simple (static, non-spatial) models of ITQs where the private effort choices after trading are identical to those that would emerge from collective choice, here, for a given value of k, the outcomes under the collective limits are different from those under individual quotas that can be traded. The underlying reason is that the aggregate expected penalties conditional on exceeding the total available quota differ. Under the collective policies, this aggregate is E(k(h1 + h2 - H)|h1 + h2 > H). However, under an ITQ system each harvest must purchase additional quota in the market or pay a fee or penalty if one cannot obtain enough quotas in the market to cover the total catch. In this case the conditional aggregate expected cost of purchasing quota or paying fees is E(k(h1 - h2)|h1 + h2 >H), where h is the quota intitially allocated to harvester i and h1 + h2 = H 7. Although the probabilities of incurring fees are the same, the aggregate conditional penalties are different. Under collective limits, the conditional penalty depends on the total amount in violation of the aggregate quota, while under the ITQ it depends on the amount by which an individual’s harvest exceeds his individual quota allocation. As in the previous two cases with collective limits (with and without coordination), under ITQs the magnitude of k can be set to provide efficient incentives, although in general the required magnitude would be different under the ITQ than under the other scenarios because each scenario creates a different set of incentives.
Although the stylized model presented above abstracts from many important dimensions of the operation and management of fisheries, it illustrates several important economic insights into the use of collective approaches to manage fishing effort. First, even if the revenues and costs of vessel owners are not interdependent due to ecological or market conditions, allocating quota to a group rather than to individuals can create a policy-generated interdependency that would not exist under an ITQ where spatial and intra-seasonal allocation of effort are not a concern. This policy-induced interdependency alters the incentives for undertaking fishing effort. In the absence of some form of enforcement mechanism, such as a cost imposed on the group (in the form of fees, penalties, or purchases of additional quota from regulators) when aggregate harvest by the group exceeds the collective quota, fishing effort will be inefficiently high. Incentives to reducing fishing effort and stay within the group quota can be created through a fee structure, such as the deemed values used in New Zealand.
However, it is important to recognize that because incentives are quite different depending on whether individuals within the group act independently or cooperate in determining the effort for each individual vessel, the fees that would be needed to induce efficient effort would depend on how the group functions. In general,
∑i E[π(ei, ɛi)] - E(k(h1 + h2 - )|h1 + h2 > )Pr(h1 + h2 > )H H H
7 This reflects the fact that, because of arbitrage, in equilibrium the quota price should equal k. See Zhou and Segerson (2014).
258 Effort rights in fisheries management – General principles and case studies from around the world
the more collaboratively the group functions, the lower are the fees that would be needed to provide efficient incentives. The intuitive explanation for this lies in the two externalities captured in the stylized model above. The first stems from the external social costs imposed by harvesting a particular species (for example, due to bycatch, multispecies interactions, or long term stock effects). This externality exists regardless of whether individuals within the group cooperate or not, and a fee for exceeding the group quota can internalise this externality. The second externality is within the group, and stems from the policy-induced interdependency created by the group limit. Under a group limit, an increase in one vessel’s harvest increases the likelihood and potential magnitude of exceeding that limit and hence increases not only the expected fee/penalty faced by the owner of that vessel but also the expected fee/penalty of others within the group. This effect is internalised when members of the group act cooperatively but not when they act independently. Again, adjusting the magnitude of the fee can internalise this effect even under non-cooperative behaviour, but it requires a fee that is higher than the fee that induces efficient behaviour under cooperation.
CONCLUSIONCollective approaches have been increasingly used as a way to foster collaboration/cooperation in fisheries management. There is considerable variation in the specifics of how they are structured, such as the source and nature of the interdependencies that they create or are designed to address, whether they are species or spatially delineated, the types of cooperation they involve, and the extent to which they include provisions for sharing revenues and/or costs. These specific features affect the incentives that members of the collective face, both positive and negative. While collective approaches can create positive incentives for members of the group to cooperate in an effort to address important interdependencies within the group, they can also create incentives for free-riding on the efforts of other group members. Thus, a key feature of any collective approach is how it promotes the former while at the same time deterring the latter.
Although peer pressure and/or social factors can help, policy design also plays a critical role in creating incentives. For example, coupling the granting of collective rights with an appropriately designed system of collective fees, charges or penalties that all individuals within the group would share when group outcomes fail to meet objectives can provide increased incentives for efficient behaviour8. However, the appropriate policy design depends on the extent to which other factors promote cooperation, since these factors also serve to offset free-rider incentives. The ultimate success or failure of a collective approach will hinge on a combination of the ecological/economic/social features of the fisheries, the way in which the group organizes itself (including the internal “rules” it imposes on its members), and the design and nature of the collective rights that are granted (including any government-imposed restrictions and/or responses if the group does not meet specified objectives).
8 Similar approaches have been advocated in other contexts as well. For example, in the context of pollution control, an industry or group of polluters (such as a group of farmers) can be provided with an opportunity to meet a collective pollution reduction target voluntarily, with the proviso that failure to achieve the specified reduction voluntarily would lead to imposition of a more costly policy, such as a regulation or a tax, on all members of the group. See, for example, Segerson and Wu (2006) and Dawson and Segerson (2008).
259Collective approaches to fisheries management
REFERENCESAbbott, J.K. & Wilen, J.E. 2009. Regulation of fisheries bycatch with common-pool
output quotas. Journal of Environmental Economics and Management, 57: 195-204.Arnason, R. 2012. Property rights in fisheries: How much can individual transferable
quotas accomplish? Review of Environmental Economics and Policy, 6: 217-236.Cacino, J.P., Uchida, H.& Wilen, J.E. 2007. TURFs and ITQs: collective vs. individual
decision making. Marine Resource Economics, 22: 391-406.Costello, C., Gaines, S.D. & Lynham, J. 2008. Can catch shares prevent fisheries collapse?
Science, 321: 1678-1681.Dawson, N.L. & Segerson, K. 2008. Voluntary agreements with industries: participation
incentives with industry-wide targets. Land Economics, 84: 97-114.Deacon, R.T. 2012. Fishery management by harvester cooperatives. Review of Environmental
Economics and Policy, 6: 258-277.Deacon, R.T., Parker, D.P. & Costello, C. 2008. Improving efficiency by assigning harvest
rights to fishery cooperatives: evidence from the Chignik salmon co-op. Arizona Law Review, 50: 479-509.
Gaspart, F.& Seki, E. 2003. Cooperation, status seeking and competitive behaviour: theory and evidence. Journal of Economic Behaviour and Organization, 51: 51-77.
Gutiérrez, N.L, Hilborn, R.& Defeo, O. 2011. Leadership, social capital and incentives promote successful fisheries. Nature, 470: 386-389.
Heintzelman, M.D., Salant, S.W. & Schott, S. 2009. Putting free-riding to work: A Partnership Solution to the common-property problem. Journal of Environmental Economics and Management, 57: 309-320.
Holland, D.S. 2004. Spatial fishery rights and marine zoning: a discussion with references to management of marine resources in New England. Marine Resource Economics, 19: 21-40.
Holland, D.S. 2010. Markets, pooling and insurance for managing bycatch in fisheries. Ecological Economics, 70: 121-133.
Holland, D.S. &Wiersma, J. 2010. Free form property rights for fisheries: the decentralized design of rights-based management through groundfish “sector” in New England. Marine Policy, 34: 1076-1081.
Holland, D.S.& Jannot, J.E. 2012. Bycatch risk pools for the United States west coast groundfish fishery. Ecological Economics, 78: 132-147.
Platteau, J-P. & Seki, E. 2001. Community arrangements to overcome market failures: pooling groups in Japanese fisheries. In M. Aoki, &Y. Hayami, eds. Communities and Markets in Economics Development, pp. 344-402. New York, NY, USA, Oxford University Press.
Ovando, D.A., Deacon, R.T., Lester, S.E., Costello, C., Van leuvan, T., McIlwain, K., Strauss, C.K., Arbuckle, M., Fujita, R., Gelcich, S. & Uchida, H. 2013. Conservation incentives and collective choices in cooperative fisheries. Marine Policy, 37: 132-140.
Sanchirico, J.N., Holland, D., Quigley, K. & Fina, M. 2006. Catch-quota balancing in multispecies individual fishing quotas. Marine Policy, 30: 767-785.
Scheld, A.M., Anderson, C.M. & Uchida, H. 2012. The economic effects of catch share management: The Rhode Island fluke sector pilot program. Marine Resource Economics, 27: 203-228.
Scott, A.D. 2008. The evolution of resource property rights. Oxford, UK, Oxford University Press.
Segerson, K. 2010. Policies to reduce stochastic sea turtle bycatch: an economic efficiency analysis. In Dutton, P., Squires, D. & Ahmed, M., eds. Conservation of Pacific sea turtles. Honolulu, University of Hawaii Press.
Segerson, K. & Wu, J. 2006. Voluntary approaches to nonpoint pollution control: Inducing first best outcomes through the use of threats. Journal of Environmental Economics and Management, 51: 165-184.
260 Effort rights in fisheries management – General principles and case studies from around the world
Soboil, M.L & Craig, A. 2008. Self governance in New Zealand’s developmental fisheries: deep-sea crabs. In Townsend, R., Shotton, R., & Uchida, H., eds. Case studies in fisheries self-governance, pp. 269-275. FAO Fisheries Technical Paper No. 504. Rome, FAO. 465 pp.
Townsend, R., Shotton, R. & Uchida, H., eds. 2008. Case studies in fisheries self-governance. FAO Fisheries Technical Paper No. 504. Rome, FAO. 465 pp.
Uchida, E., Uchida, H., Lee, J-S., Ryu, J-G. & Kim, D-Y. 2011. TURFs and clubs: empirical evidence of the effect of self-governance on profitability in South Korea’s inshore (maul) fisheries. Environmental and Development Economics, 17: 41-65.
Uchida, H. & Baba, O. 2008. Fishery management and the pooling arrangement in the Sakuraebi Fishery in Japan. In Townsend, R., Shotton, R.& Uchida, H., eds. Case studies in fisheries self-governance, pp. 175-189. FAO Fisheries Technical Paper No. 504. Rome, FAO. 465 pp.
Uchida, H. & Makino, M. 2008. Japanese coastal fishery co-management: an overview. In Townsend, R., Shotton, R. & Uchida, H., eds. Case studies in fisheries self-governance, pp. 221-229. FAO Fisheries Technical Paper No. 504. Rome, FAO. 465 pp.
Uchida, H. & Watanobe, M. 2008.Walley pollock (Suketoudara) fishery management in the Hiyama region of Hokkaido, Japan. In Townsend, R., Shotton, R. & Uchida, H., eds. Case studies in fisheries self-governance, pp. 163-174. FAO Fisheries Technical Paper No. 504. Rome, FAO. 465 pp.
White, C. & Costello, C. 2011. Matching spatial property rights fisheries with scales of fish disperal. Ecological Applications, 21: 350-362.
Wilen, J.E. 1988. Limited entry licensing: A retrospective assessment. Marine Resource Economics, 5(4): 313-24.
Wilen, J.E., Cancino, J.& Uchida, H. 2012. The economics of territorial use rights fisheries, or TURFs. Review of Environmental Economics and Policy, 6: 237-257.
Zhou, R. & Segerson, K. 2014.Individual vs. collective quotas in fisheries management: Efficiency and distributional impacts. Working paper, Department of Economics, University of Connecticut, Storrs, CT, USA.
34FAO FISHERIES AND AQUACULTURE PROCEEDINGS
Effort rights in fisheries managementGeneral principles and case studies
from around the world
17–20 September 2012Bilbao, Spain
This publication reports on a multidisciplinary workshop that evaluated rights-based conservation and management of marine fisheries by fishing effort, and more broadly management by regulating effort rather than catch. This publication includes a synthesis of the workshop results and conclusions, workshop presentations on conceptual issues and case studies, and a chapter commissioned after the workshop to assess individual and collective rights-based management approaches to fisheries.The workshop surveyed and discussed the actual practice and issues associated with effort rights-based management and, more broadly, effort management in general. As rights-based management of catch or effort necessarily requires a total allowable catch (TAC) or total allowable effort (TAE), the workshop discussed rights-based management in conjunction with issues in assessing fish populations and providing TACs or TAEs. The interdisciplinary workshop included economists, population biologists, political economists, and fisheries managers, many of whom provided interdisciplinary background papers and presentations.The workshop focused on comparing the advantages and disadvantages of effort rights-based management with catch rights-based management and trade-offs between the two. Although clear conditions may sometimes exist, favouring one approach over another, the workshop participants recognized that various circumstances may favour a different approach in practice and that hybrid approaches of both catch and effort systems are increasingly found.
I5744E/1/06.16
ISBN 978-92-5-109280-4 ISSN 2070-6103
9 7 8 9 2 5 1 0 9 2 8 0 4


![Characterizing Fishing Effort and Spatial Extent of ...€¦ · more sustainable fisheries management plans [24,25]. Using a mapping tool developed to assess fishing effort in Caribbean](https://img.pdfslide.net/doc/110x75/5f568167515f87541b62949c/characterizing-fishing-effort-and-spatial-extent-of-more-sustainable-fisheries.jpg)