Embed Size (px)
Citation preview
eHealth’s Obamacare Affordability Analysis
Major Metro Areas2018 Projections
September 2017
The Affordable Care Act (ACA) deems health insurance to be “unaffordable” when annual premiums for the lowest-priced plan cost more than 8.16% of a household’s modified adjusted gross income. When health insurance is unaffordable by these standards, qualifying persons may be exempt from the Affordable Care Act’s individual mandate (the Obamacare tax penalty). eHealth reviewed the lowest-price 2017 plan available for families of three comprised of two adults age 35 and one child. The same family model was analyzed using data from Healthcare.gov in 40 cities, data from eHealth.com in 9 cities not utilizing Healthcare.gov, and data from the New York state exchange for New York City.
4
3ehealth.com
Using a relatively modest assumed rate increase of 10% to project 2018 rates from 2017 rates, eHealth discovered the following:
· In 47 of 50 cities surveyed, the lowest-priced plan would be officially
unaffordable under Obamacare affordability standards for families earning 401%
of the federal poverty level (about $82,000 per year in the contiguous US,
making them ineligible for Obamacare subsidies).
· In these cities, the average three-person household would need to earn
an additional $28,939 per year before the lowest-cost plan becomes
affordable according to Obamacare rules.
Government subsidies are generally made available to persons earning up to
400% of the federal poverty level, but middle-income households earning 401% or
more of the federal poverty level are not eligible for subsidy assistance.
The data tables below present a detailed review of each of the cities included in
the survey with contextual demographic information for each, including median
age, household size, and income.
For more information, refer to the methodology note at the end of this document.
4
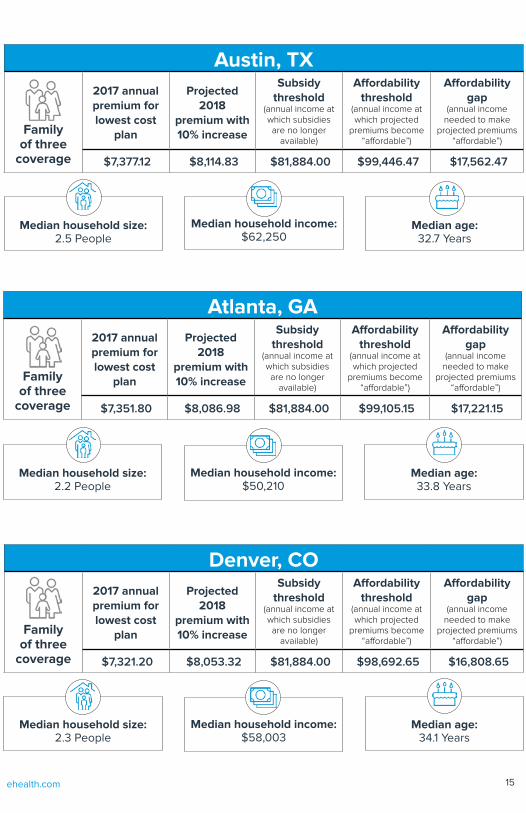
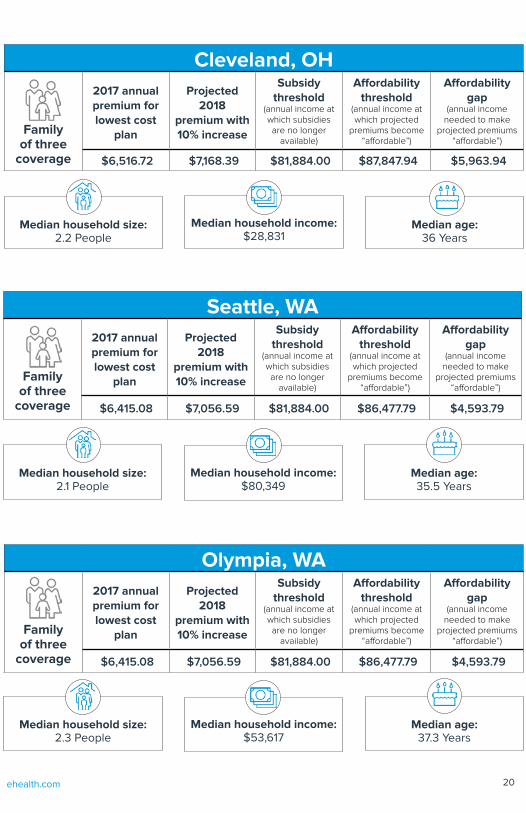
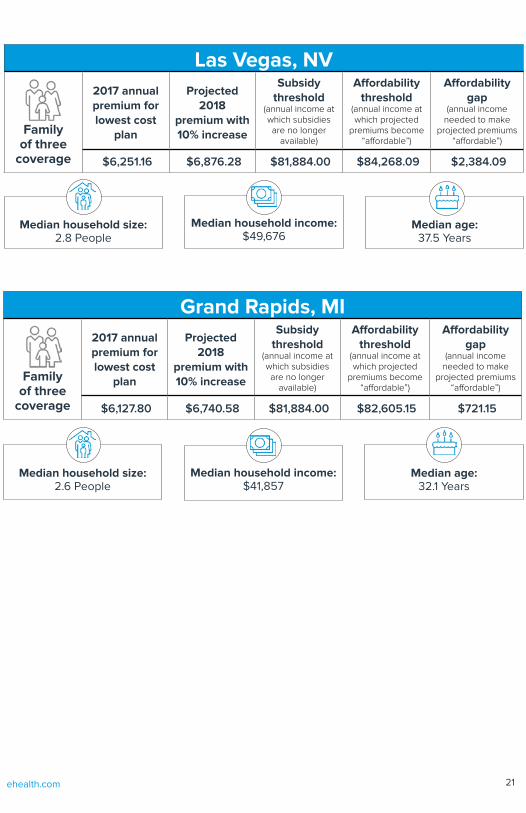
Each table contains the following data for families of three with two adults age 35 and one child:
· 2017 annual premium – This refers to the lowest-cost plan available in
that city or metropolitan area.
· Projected 2018 premiums – The cost of lowest-cost plan in 2018 with a
10% rate increase.
· Subsidy income threshold – This represents annual household income at 401%
of the federal poverty level where Affordable Care Act Advanced Premium Tax
Credits (A.K.A. Obamacare subsidies) are no longer available.
· Premium affordability threshold - Annual household income where projected
premiums for the lowest cost plan become “affordable” by ACA standards.
· Affordability gap - The difference between the subsidy threshold and the
affordability threshold; additiional income needed to make health insurance
premiums “affordable” by ACA standards.
Of the fifty cities surveyed, only Detroit, MI; Albuquerque, NM; and Pittsburgh, PA
showed no affordability gap with the projected 2018 rate increases. These cities
are described first in the tables below, while subsequent cities are given in order
from least affordable (that is, with the largest affordability gap) to most affordable
(with the smallest affordability gap).
Projected Affordable Metro AreasFor Obamacare Coverage in 2018

5ehealth.com
Projected Affordable Metro AreasFor Obamacare Coverage in 2018
Detroit, MI
Family of three
coverage
2017 annual premium for lowest cost
plan
Projected 2018
premium with 10% increase
Subsidy threshold
(annual income at which subsidies are no longer
available)
Affordability threshold
(annual income at which projected
premiums become “affordable”)
Affordability gap
(annual income needed to make
projected premiums “affordable”)
$5,544.00 $6,098.40 $81,884.00 $74,735.29 $(7,148.71)
Median household size:2.6 People
Median household income:$25,980
Median age:34.8 Years
Albuquerque, NM
Family of three
coverage
2017 annual premium for lowest cost
plan
Projected 2018
premium with 10% increase
Subsidy threshold
(annual income at which subsidies are no longer
available)
Affordability threshold
(annual income at which projected
premiums become “affordable”)
Affordability gap
(annual income needed to make
projected premiums “affordable”)
$5,800.08 $6,380.09 $81,884.00 $78,187.35 $(3,696.65)
Median household size:2.5 People
Median household income:$47,096
Median age:36 Years
Pittsburgh, PA
Family of three
coverage
2017 annual premium for lowest cost
plan
Projected 2018
premium with 10% increase
Subsidy threshold
(annual income at which subsidies are no longer
available)
Affordability threshold
(annual income at which projected
premiums become “affordable”)
Affordability gap
(annual income needed to make
projected premiums “affordable”)
$5,972.16 $6,569.38 $81,884.00 $80,507.06 $(1,376.94)
Median household size:2.1 People
Median household income:$41,293
Median age:32.9 Years
6ehealth.com
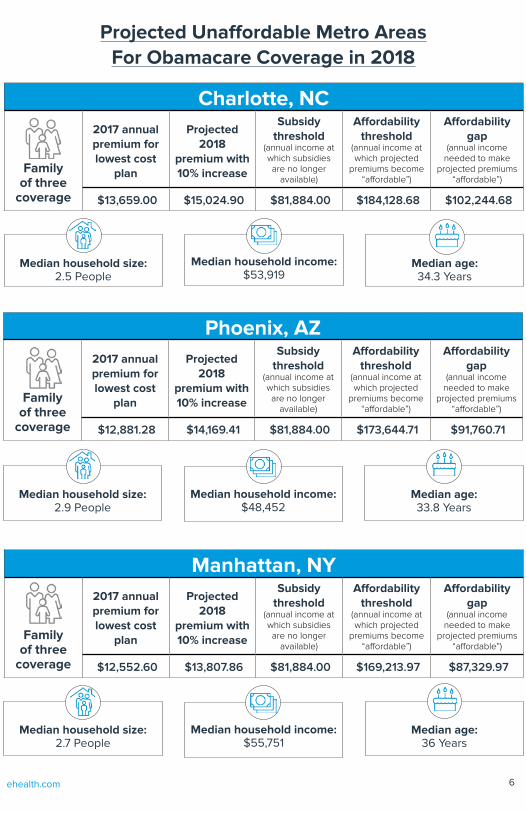
Projected Unaffordable Metro AreasFor Obamacare Coverage in 2018
Charlotte, NC
Family of three
coverage
2017 annual premium for lowest cost
plan
Projected 2018
premium with 10% increase
Subsidy threshold
(annual income at which subsidies are no longer
available)
Affordability threshold
(annual income at which projected
premiums become “affordable”)
Affordability gap
(annual income needed to make
projected premiums “affordable”)
$13,659.00 $15,024.90 $81,884.00 $184,128.68 $102,244.68
Median household size:2.5 People
Median household income:$53,919
Median age:34.3 Years
Phoenix, AZ
Family of three
coverage
2017 annual premium for lowest cost
plan
Projected 2018
premium with 10% increase
Subsidy threshold
(annual income at which subsidies are no longer
available)
Affordability threshold
(annual income at which projected
premiums become “affordable”)
Affordability gap
(annual income needed to make
projected premiums “affordable”)
$12,881.28 $14,169.41 $81,884.00 $173,644.71 $91,760.71
Median household size:2.9 People
Median household income:$48,452
Median age:33.8 Years
Manhattan, NY
Family of three
coverage
2017 annual premium for lowest cost
plan
Projected 2018
premium with 10% increase
Subsidy threshold
(annual income at which subsidies are no longer
available)
Affordability threshold
(annual income at which projected
premiums become “affordable”)
Affordability gap
(annual income needed to make
projected premiums “affordable”)
$12,552.60 $13,807.86 $81,884.00 $169,213.97 $87,329.97
Median household size:2.7 People
Median household income:$55,751
Median age:36 Years
Projected Unaffordable Metro AreasFor Obamacare Coverage in 2018
Charlotte, NC
Family of three
coverage
2017 annual premium for lowest cost
plan
Projected 2018
premium with 10% increase
Subsidy threshold
(annual income at which subsidies are no longer
available)
Affordability threshold
(annual income at which projected
premiums become “affordable”)
Affordability gap
(annual income needed to make
projected premiums “affordable”)
$13,659.00 $15,024.90 $81,884.00 $184,128.68 $102,244.68
Phoenix, AZ
Family of three
coverage
2017 annual premium for lowest cost
plan
Projected 2018
premium with 10% increase
Subsidy threshold
(annual income at which subsidies are no longer
available)
Affordability threshold
(annual income at which projected
premiums become “affordable”)
Affordability gap
(annual income needed to make
projected premiums “affordable”)
$12,881.28 $14,169.41 $81,884.00 $173,644.71 $91,760.71
Manhattan, NY
Family of three
coverage
2017 annual premium for lowest cost
plan
Projected 2018
premium with 10% increase
Subsidy threshold
(annual income at which subsidies are no longer
available)
Affordability threshold
(annual income at which projected
premiums become “affordable”)
Affordability gap
(annual income needed to make
projected premiums “affordable”)
$12,552.60 $13,807.86 $81,884.00 $169,213.97 $87,329.97
7ehealth.com
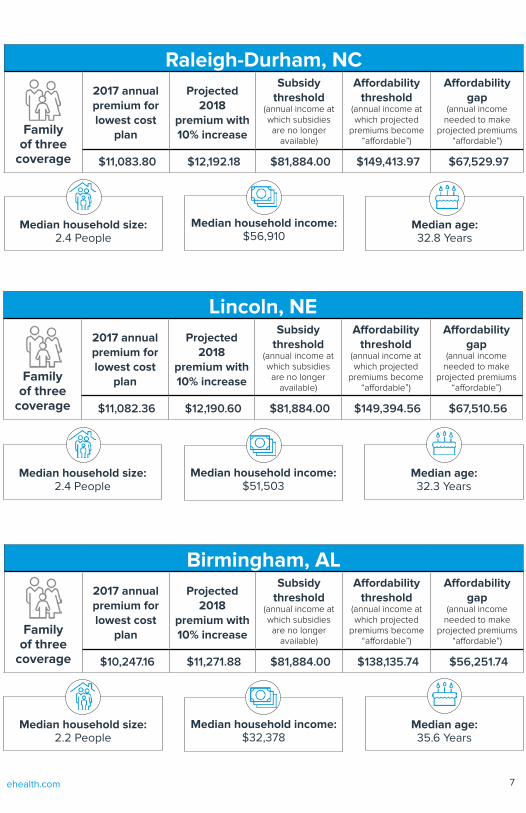
Raleigh-Durham, NC
Family of three
coverage
2017 annual premium for lowest cost
plan
Projected 2018
premium with 10% increase
Subsidy threshold
(annual income at which subsidies are no longer
available)
Affordability threshold
(annual income at which projected
premiums become “affordable”)
Affordability gap
(annual income needed to make
projected premiums “affordable”)
$11,083.80 $12,192.18 $81,884.00 $149,413.97 $67,529.97
Median household size:2.4 People
Median household income:$56,910
Median age:32.8 Years
Lincoln, NE
Family of three
coverage
2017 annual premium for lowest cost
plan
Projected 2018
premium with 10% increase
Subsidy threshold
(annual income at which subsidies are no longer
available)
Affordability threshold
(annual income at which projected
premiums become “affordable”)
Affordability gap
(annual income needed to make
projected premiums “affordable”)
$11,082.36 $12,190.60 $81,884.00 $149,394.56 $67,510.56
Median household size:2.4 People
Median household income:$51,503
Median age:32.3 Years
Birmingham, AL
Family of three
coverage
2017 annual premium for lowest cost
plan
Projected 2018
premium with 10% increase
Subsidy threshold
(annual income at which subsidies are no longer
available)
Affordability threshold
(annual income at which projected
premiums become “affordable”)
Affordability gap
(annual income needed to make
projected premiums “affordable”)
$10,247.16 $11,271.88 $81,884.00 $138,135.74 $56,251.74
Median household size:2.2 People
Median household income:$32,378
Median age:35.6 Years
8ehealth.com
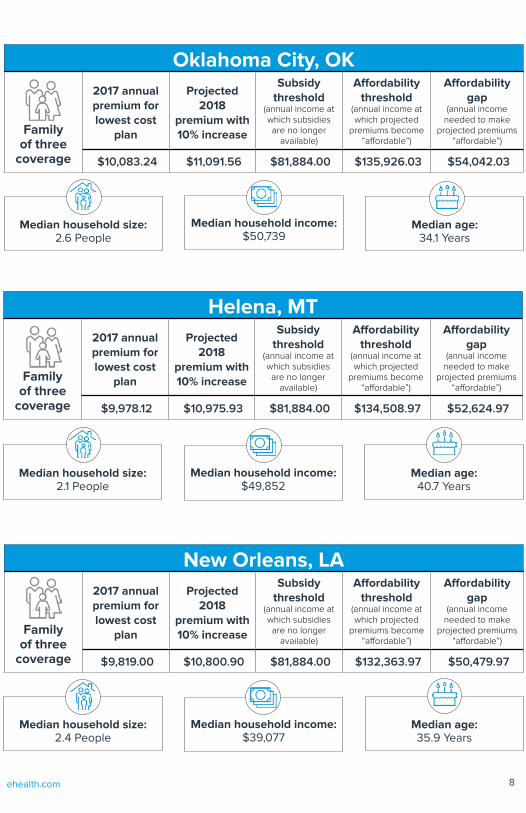
Oklahoma City, OK
Family of three
coverage
2017 annual premium for lowest cost
plan
Projected 2018
premium with 10% increase
Subsidy threshold
(annual income at which subsidies are no longer
available)
Affordability threshold
(annual income at which projected
premiums become “affordable”)
Affordability gap
(annual income needed to make
projected premiums “affordable”)
$10,083.24 $11,091.56 $81,884.00 $135,926.03 $54,042.03
Median household size:2.6 People
Median household income:$50,739
Median age:34.1 Years
Helena, MT
Family of three
coverage
2017 annual premium for lowest cost
plan
Projected 2018
premium with 10% increase
Subsidy threshold
(annual income at which subsidies are no longer
available)
Affordability threshold
(annual income at which projected
premiums become “affordable”)
Affordability gap
(annual income needed to make
projected premiums “affordable”)
$9,978.12 $10,975.93 $81,884.00 $134,508.97 $52,624.97
Median household size:2.1 People
Median household income:$49,852
Median age:40.7 Years
New Orleans, LA
Family of three
coverage
2017 annual premium for lowest cost
plan
Projected 2018
premium with 10% increase
Subsidy threshold
(annual income at which subsidies are no longer
available)
Affordability threshold
(annual income at which projected
premiums become “affordable”)
Affordability gap
(annual income needed to make
projected premiums “affordable”)
$9,819.00 $10,800.90 $81,884.00 $132,363.97 $50,479.97
Median household size:2.4 People
Median household income:$39,077
Median age:35.9 Years
Oklahoma City, OK
Family of three
coverage
2017 annual premium for lowest cost
plan
Projected 2018
premium with 10% increase
Subsidy threshold
(annual income at which subsidies are no longer
available)
Affordability threshold
(annual income at which projected
premiums become “affordable”)
Affordability gap
(annual income needed to make
projected premiums “affordable”)
$10,083.24 $11,091.56 $81,884.00 $135,926.03 $54,042.03
Helena, MT
Family of three
coverage
2017 annual premium for lowest cost
plan
Projected 2018
premium with 10% increase
Subsidy threshold
(annual income at which subsidies are no longer
available)
Affordability threshold
(annual income at which projected
premiums become “affordable”)
Affordability gap
(annual income needed to make
projected premiums “affordable”)
$9,978.12 $10,975.93 $81,884.00 $134,508.97 $52,624.97
New Orleans, LA
Family of three
coverage
2017 annual premium for lowest cost
plan
Projected 2018
premium with 10% increase
Subsidy threshold
(annual income at which subsidies are no longer
available)
Affordability threshold
(annual income at which projected
premiums become “affordable”)
Affordability gap
(annual income needed to make
projected premiums “affordable”)
$9,819.00 $10,800.90 $81,884.00 $132,363.97 $50,479.97
9ehealth.com
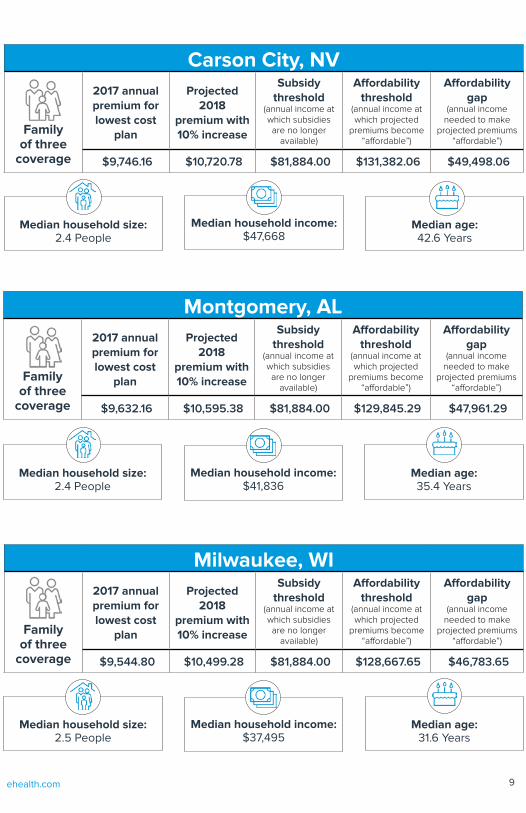
Carson City, NV
Family of three
coverage
2017 annual premium for lowest cost
plan
Projected 2018
premium with 10% increase
Subsidy threshold
(annual income at which subsidies are no longer
available)
Affordability threshold
(annual income at which projected
premiums become “affordable”)
Affordability gap
(annual income needed to make
projected premiums “affordable”)
$9,746.16 $10,720.78 $81,884.00 $131,382.06 $49,498.06
Median household size:2.4 People
Median household income:$47,668
Median age:42.6 Years
Montgomery, AL
Family of three
coverage
2017 annual premium for lowest cost
plan
Projected 2018
premium with 10% increase
Subsidy threshold
(annual income at which subsidies are no longer
available)
Affordability threshold
(annual income at which projected
premiums become “affordable”)
Affordability gap
(annual income needed to make
projected premiums “affordable”)
$9,632.16 $10,595.38 $81,884.00 $129,845.29 $47,961.29
Median household size:2.4 People
Median household income:$41,836
Median age:35.4 Years
Milwaukee, WI
Family of three
coverage
2017 annual premium for lowest cost
plan
Projected 2018
premium with 10% increase
Subsidy threshold
(annual income at which subsidies are no longer
available)
Affordability threshold
(annual income at which projected
premiums become “affordable”)
Affordability gap
(annual income needed to make
projected premiums “affordable”)
$9,544.80 $10,499.28 $81,884.00 $128,667.65 $46,783.65
Median household size:2.5 People
Median household income:$37,495
Median age:31.6 Years
10ehealth.com
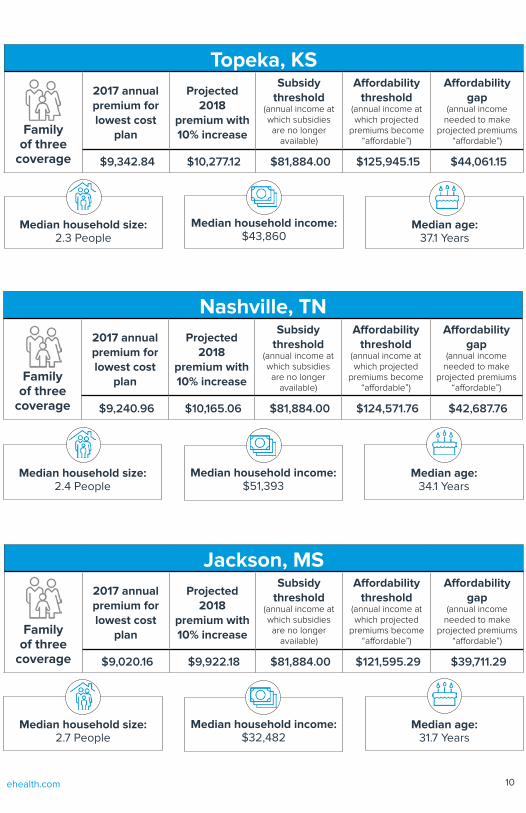
Topeka, KS
Family of three
coverage
2017 annual premium for lowest cost
plan
Projected 2018
premium with 10% increase
Subsidy threshold
(annual income at which subsidies are no longer
available)
Affordability threshold
(annual income at which projected
premiums become “affordable”)
Affordability gap
(annual income needed to make
projected premiums “affordable”)
$9,342.84 $10,277.12 $81,884.00 $125,945.15 $44,061.15
Median household size:2.3 People
Median household income:$43,860
Median age:37.1 Years
Nashville, TN
Family of three
coverage
2017 annual premium for lowest cost
plan
Projected 2018
premium with 10% increase
Subsidy threshold
(annual income at which subsidies are no longer
available)
Affordability threshold
(annual income at which projected
premiums become “affordable”)
Affordability gap
(annual income needed to make
projected premiums “affordable”)
$9,240.96 $10,165.06 $81,884.00 $124,571.76 $42,687.76
Median household size:2.4 People
Median household income:$51,393
Median age:34.1 Years
Jackson, MS
Family of three
coverage
2017 annual premium for lowest cost
plan
Projected 2018
premium with 10% increase
Subsidy threshold
(annual income at which subsidies are no longer
available)
Affordability threshold
(annual income at which projected
premiums become “affordable”)
Affordability gap
(annual income needed to make
projected premiums “affordable”)
$9,020.16 $9,922.18 $81,884.00 $121,595.29 $39,711.29
Median household size:2.7 People
Median household income:$32,482
Median age:31.7 Years
Topeka, KS
Family of three
coverage
2017 annual premium for lowest cost
plan
Projected 2018
premium with 10% increase
Subsidy threshold
(annual income at which subsidies are no longer
available)
Affordability threshold
(annual income at which projected
premiums become “affordable”)
Affordability gap
(annual income needed to make
projected premiums “affordable”)
$9,342.84 $10,277.12 $81,884.00 $125,945.15 $44,061.15
Nashville, TN
Family of three
coverage
2017 annual premium for lowest cost
plan
Projected 2018
premium with 10% increase
Subsidy threshold
(annual income at which subsidies are no longer
available)
Affordability threshold
(annual income at which projected
premiums become “affordable”)
Affordability gap
(annual income needed to make
projected premiums “affordable”)
$9,240.96 $10,165.06 $81,884.00 $124,571.76 $42,687.76
Jackson, MS
Family of three
coverage
2017 annual premium for lowest cost
plan
Projected 2018
premium with 10% increase
Subsidy threshold
(annual income at which subsidies are no longer
available)
Affordability threshold
(annual income at which projected
premiums become “affordable”)
Affordability gap
(annual income needed to make
projected premiums “affordable”)
$9,020.16 $9,922.18 $81,884.00 $121,595.29 $39,711.29
11ehealth.com
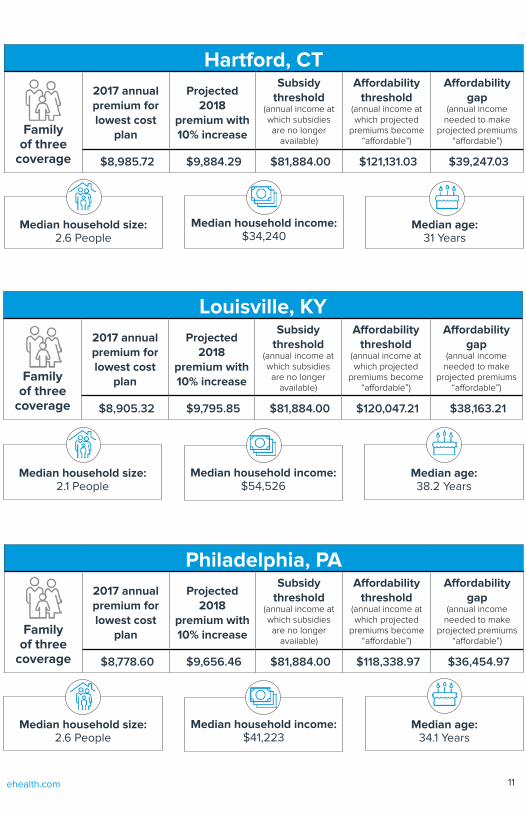
Hartford, CT
Family of three
coverage
2017 annual premium for lowest cost
plan
Projected 2018
premium with 10% increase
Subsidy threshold
(annual income at which subsidies are no longer
available)
Affordability threshold
(annual income at which projected
premiums become “affordable”)
Affordability gap
(annual income needed to make
projected premiums “affordable”)
$8,985.72 $9,884.29 $81,884.00 $121,131.03 $39,247.03
Median household size:2.6 People
Median household income:$34,240
Median age:31 Years
Louisville, KY
Family of three
coverage
2017 annual premium for lowest cost
plan
Projected 2018
premium with 10% increase
Subsidy threshold
(annual income at which subsidies are no longer
available)
Affordability threshold
(annual income at which projected
premiums become “affordable”)
Affordability gap
(annual income needed to make
projected premiums “affordable”)
$8,905.32 $9,795.85 $81,884.00 $120,047.21 $38,163.21
Median household size:2.1 People
Median household income:$54,526
Median age:38.2 Years
Philadelphia, PA
Family of three
coverage
2017 annual premium for lowest cost
plan
Projected 2018
premium with 10% increase
Subsidy threshold
(annual income at which subsidies are no longer
available)
Affordability threshold
(annual income at which projected
premiums become “affordable”)
Affordability gap
(annual income needed to make
projected premiums “affordable”)
$8,778.60 $9,656.46 $81,884.00 $118,338.97 $36,454.97
Median household size:2.6 People
Median household income:$41,223
Median age:34.1 Years

12ehealth.com
Trenton, NJ
Family of three
coverage
2017 annual premium for lowest cost
plan
Projected 2018
premium with 10% increase
Subsidy threshold
(annual income at which subsidies are no longer
available)
Affordability threshold
(annual income at which projected
premiums become “affordable”)
Affordability gap
(annual income needed to make
projected premiums “affordable”)
$8,770.68 $9,647.75 $81,884.00 $118,232.21 $36,348.21
Median household size:3 People
Median household income:$35.041
Median age:33.3 Years
Chesapeake, VA
Family of three
coverage
2017 annual premium for lowest cost
plan
Projected 2018
premium with 10% increase
Subsidy threshold
(annual income at which subsidies are no longer
available)
Affordability threshold
(annual income at which projected
premiums become “affordable”)
Affordability gap
(annual income needed to make
projected premiums “affordable”)
$8,724.84 $9,597.32 $81,884.00 $117,614.26 $35,730.26
Median household size:2.7 People
Median household income:$67,491
Median age:36.7 Years
Tampa, FL
Family of three
coverage
2017 annual premium for lowest cost
plan
Projected 2018
premium with 10% increase
Subsidy threshold
(annual income at which subsidies are no longer
available)
Affordability threshold
(annual income at which projected
premiums become “affordable”)
Affordability gap
(annual income needed to make
projected premiums “affordable”)
$8,270.64 $9,097.70 $81,884.00 $111,491.47 $29,607.47
Median household size:2.5 People
Median household income:$44,432
Median age:35.3 Years
Trenton, NJ
Family of three
coverage
2017 annual premium for lowest cost
plan
Projected 2018
premium with 10% increase
Subsidy threshold
(annual income at which subsidies are no longer
available)
Affordability threshold
(annual income at which projected
premiums become “affordable”)
Affordability gap
(annual income needed to make
projected premiums “affordable”)
$8,770.68 $9,647.75 $81,884.00 $118,232.21 $36,348.21
Chesapeake, VA
Family of three
coverage
2017 annual premium for lowest cost
plan
Projected 2018
premium with 10% increase
Subsidy threshold
(annual income at which subsidies are no longer
available)
Affordability threshold
(annual income at which projected
premiums become “affordable”)
Affordability gap
(annual income needed to make
projected premiums “affordable”)
$8,724.84 $9,597.32 $81,884.00 $117,614.26 $35,730.26
Tampa, FL
Family of three
coverage
2017 annual premium for lowest cost
plan
Projected 2018
premium with 10% increase
Subsidy threshold
(annual income at which subsidies are no longer
available)
Affordability threshold
(annual income at which projected
premiums become “affordable”)
Affordability gap
(annual income needed to make
projected premiums “affordable”)
$8,270.64 $9,097.70 $81,884.00 $111,491.47 $29,607.47
13ehealth.com
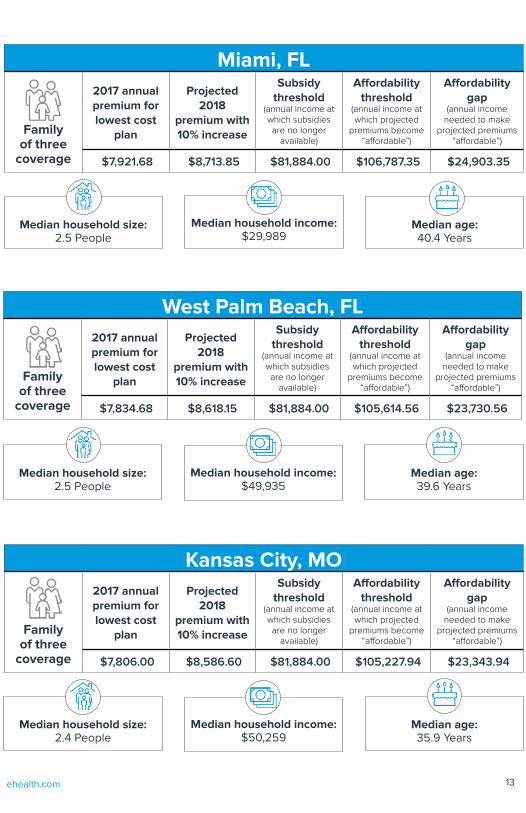
Miami, FL
Family of three
coverage
2017 annual premium for lowest cost
plan
Projected 2018
premium with 10% increase
Subsidy threshold
(annual income at which subsidies are no longer
available)
Affordability threshold
(annual income at which projected
premiums become “affordable”)
Affordability gap
(annual income needed to make
projected premiums “affordable”)
$7,921.68 $8,713.85 $81,884.00 $106,787.35 $24,903.35
Median household size:2.5 People
Median household income:$29,989
Median age:40.4 Years
West Palm Beach, FL
Family of three
coverage
2017 annual premium for lowest cost
plan
Projected 2018
premium with 10% increase
Subsidy threshold
(annual income at which subsidies are no longer
available)
Affordability threshold
(annual income at which projected
premiums become “affordable”)
Affordability gap
(annual income needed to make
projected premiums “affordable”)
$7,834.68 $8,618.15 $81,884.00 $105,614.56 $23,730.56
Median household size:2.5 People
Median household income:$49,935
Median age:39.6 Years
Kansas City, MO
Family of three
coverage
2017 annual premium for lowest cost
plan
Projected 2018
premium with 10% increase
Subsidy threshold
(annual income at which subsidies are no longer
available)
Affordability threshold
(annual income at which projected
premiums become “affordable”)
Affordability gap
(annual income needed to make
projected premiums “affordable”)
$7,806.00 $8,586.60 $81,884.00 $105,227.94 $23,343.94
Median household size:2.4 People
Median household income:$50,259
Median age:35.9 Years
14ehealth.com
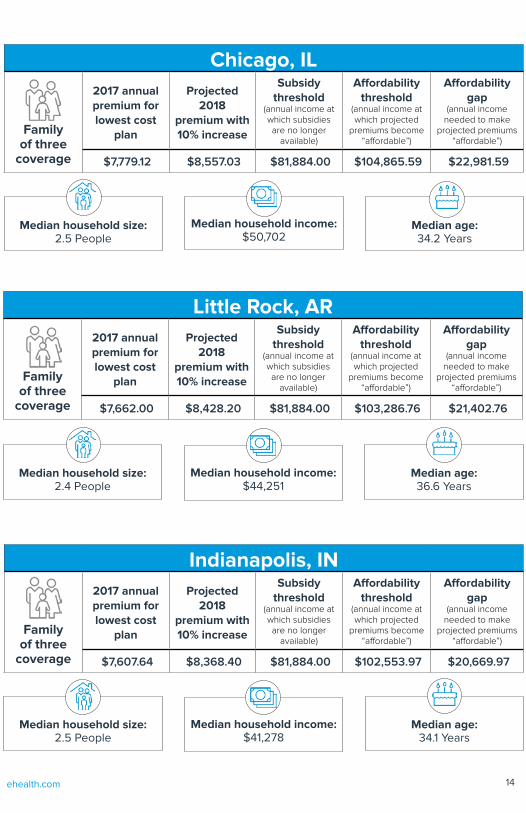
Chicago, IL
Family of three
coverage
2017 annual premium for lowest cost
plan
Projected 2018
premium with 10% increase
Subsidy threshold
(annual income at which subsidies are no longer
available)
Affordability threshold
(annual income at which projected
premiums become “affordable”)
Affordability gap
(annual income needed to make
projected premiums “affordable”)
$7,779.12 $8,557.03 $81,884.00 $104,865.59 $22,981.59
Median household size:2.5 People
Median household income:$50,702
Median age:34.2 Years
Little Rock, AR
Family of three
coverage
2017 annual premium for lowest cost
plan
Projected 2018
premium with 10% increase
Subsidy threshold
(annual income at which subsidies are no longer
available)
Affordability threshold
(annual income at which projected
premiums become “affordable”)
Affordability gap
(annual income needed to make
projected premiums “affordable”)
$7,662.00 $8,428.20 $81,884.00 $103,286.76 $21,402.76
Median household size:2.4 People
Median household income:$44,251
Median age:36.6 Years
Indianapolis, IN
Family of three
coverage
2017 annual premium for lowest cost
plan
Projected 2018
premium with 10% increase
Subsidy threshold
(annual income at which subsidies are no longer
available)
Affordability threshold
(annual income at which projected
premiums become “affordable”)
Affordability gap
(annual income needed to make
projected premiums “affordable”)
$7,607.64 $8,368.40 $81,884.00 $102,553.97 $20,669.97
Median household size:2.5 People
Median household income:$41,278
Median age:34.1 Years
Chicago, IL
Family of three
coverage
2017 annual premium for lowest cost
plan
Projected 2018
premium with 10% increase
Subsidy threshold
(annual income at which subsidies are no longer
available)
Affordability threshold
(annual income at which projected
premiums become “affordable”)
Affordability gap
(annual income needed to make
projected premiums “affordable”)
$7,779.12 $8,557.03 $81,884.00 $104,865.59 $22,981.59
Little Rock, AR
Family of three
coverage
2017 annual premium for lowest cost
plan
Projected 2018
premium with 10% increase
Subsidy threshold
(annual income at which subsidies are no longer
available)
Affordability threshold
(annual income at which projected
premiums become “affordable”)
Affordability gap
(annual income needed to make
projected premiums “affordable”)
$7,662.00 $8,428.20 $81,884.00 $103,286.76 $21,402.76
Indianapolis, IN
Family of three
coverage
2017 annual premium for lowest cost
plan
Projected 2018
premium with 10% increase
Subsidy threshold
(annual income at which subsidies are no longer
available)
Affordability threshold
(annual income at which projected
premiums become “affordable”)
Affordability gap
(annual income needed to make
projected premiums “affordable”)
$7,607.64 $8,368.40 $81,884.00 $102,553.97 $20,669.97
15ehealth.com
Austin, TX
Family of three
coverage
2017 annual premium for lowest cost
plan
Projected 2018
premium with 10% increase
Subsidy threshold
(annual income at which subsidies are no longer
available)
Affordability threshold
(annual income at which projected
premiums become “affordable”)
Affordability gap
(annual income needed to make
projected premiums “affordable”)
$7,377.12 $8,114.83 $81,884.00 $99,446.47 $17,562.47
Median household size:2.5 People
Median household income:$62,250
Median age:32.7 Years
Atlanta, GA
Family of three
coverage
2017 annual premium for lowest cost
plan
Projected 2018
premium with 10% increase
Subsidy threshold
(annual income at which subsidies are no longer
available)
Affordability threshold
(annual income at which projected
premiums become “affordable”)
Affordability gap
(annual income needed to make
projected premiums “affordable”)
$7,351.80 $8,086.98 $81,884.00 $99,105.15 $17,221.15
Median household size:2.2 People
Median household income:$50,210
Median age:33.8 Years
Denver, CO
Family of three
coverage
2017 annual premium for lowest cost
plan
Projected 2018
premium with 10% increase
Subsidy threshold
(annual income at which subsidies are no longer
available)
Affordability threshold
(annual income at which projected
premiums become “affordable”)
Affordability gap
(annual income needed to make
projected premiums “affordable”)
$7,321.20 $8,053.32 $81,884.00 $98,692.65 $16,808.65
Median household size:2.3 People
Median household income:$58,003
Median age:34.1 Years

16ehealth.com
Washington, DC
Family of three
coverage
2017 annual premium for lowest cost
plan
Projected 2018
premium with 10% increase
Subsidy threshold
(annual income at which subsidies are no longer
available)
Affordability threshold
(annual income at which projected
premiums become “affordable”)
Affordability gap
(annual income needed to make
projected premiums “affordable”)
$7,254.24 $7,979.66 $81,884.00 $97,790.00 $15,906.00
Median household size:2.2 People
Median household income:$75,628
Median age:33.8 Years
Baltimore, MD
Family of three
coverage
2017 annual premium for lowest cost
plan
Projected 2018
premium with 10% increase
Subsidy threshold
(annual income at which subsidies are no longer
available)
Affordability threshold
(annual income at which projected
premiums become “affordable”)
Affordability gap
(annual income needed to make
projected premiums “affordable”)
$7,251.12 $7,976.23 $81,884.00 $97,747.94 $15,863.94
Median household size:2.5 People
Median household income:$44,165
Median age:34.7 Years
Columbus, OH
Family of three
coverage
2017 annual premium for lowest cost
plan
Projected 2018
premium with 10% increase
Subsidy threshold
(annual income at which subsidies are no longer
available)
Affordability threshold
(annual income at which projected
premiums become “affordable”)
Affordability gap
(annual income needed to make
projected premiums “affordable”)
$7,063.08 $7,769.39 $81,884.00 $95,213.09 $13,329.09
Median household size:2.4 People
Median household income:$47,401
Median age:32.5 Years
Washington, DC
Family of three
coverage
2017 annual premium for lowest cost
plan
Projected 2018
premium with 10% increase
Subsidy threshold
(annual income at which subsidies are no longer
available)
Affordability threshold
(annual income at which projected
premiums become “affordable”)
Affordability gap
(annual income needed to make
projected premiums “affordable”)
$7,254.24 $7,979.66 $81,884.00 $97,790.00 $15,906.00
Baltimore, MD
Family of three
coverage
2017 annual premium for lowest cost
plan
Projected 2018
premium with 10% increase
Subsidy threshold
(annual income at which subsidies are no longer
available)
Affordability threshold
(annual income at which projected
premiums become “affordable”)
Affordability gap
(annual income needed to make
projected premiums “affordable”)
$7,251.12 $7,976.23 $81,884.00 $97,747.94 $15,863.94
Columbus, OH
Family of three
coverage
2017 annual premium for lowest cost
plan
Projected 2018
premium with 10% increase
Subsidy threshold
(annual income at which subsidies are no longer
available)
Affordability threshold
(annual income at which projected
premiums become “affordable”)
Affordability gap
(annual income needed to make
projected premiums “affordable”)
$7,063.08 $7,769.39 $81,884.00 $95,213.09 $13,329.09
17ehealth.com
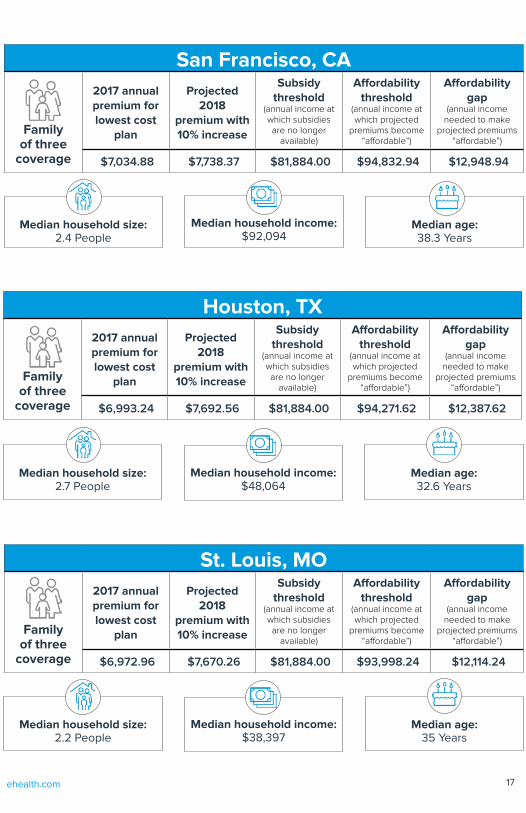
San Francisco, CA
Family of three
coverage
2017 annual premium for lowest cost
plan
Projected 2018
premium with 10% increase
Subsidy threshold
(annual income at which subsidies are no longer
available)
Affordability threshold
(annual income at which projected
premiums become “affordable”)
Affordability gap
(annual income needed to make
projected premiums “affordable”)
$7,034.88 $7,738.37 $81,884.00 $94,832.94 $12,948.94
Median household size:2.4 People
Median household income:$92,094
Median age:38.3 Years
Houston, TX
Family of three
coverage
2017 annual premium for lowest cost
plan
Projected 2018
premium with 10% increase
Subsidy threshold
(annual income at which subsidies are no longer
available)
Affordability threshold
(annual income at which projected
premiums become “affordable”)
Affordability gap
(annual income needed to make
projected premiums “affordable”)
$6,993.24 $7,692.56 $81,884.00 $94,271.62 $12,387.62
Median household size:2.7 People
Median household income:$48,064
Median age:32.6 Years
St. Louis, MO
Family of three
coverage
2017 annual premium for lowest cost
plan
Projected 2018
premium with 10% increase
Subsidy threshold
(annual income at which subsidies are no longer
available)
Affordability threshold
(annual income at which projected
premiums become “affordable”)
Affordability gap
(annual income needed to make
projected premiums “affordable”)
$6,972.96 $7,670.26 $81,884.00 $93,998.24 $12,114.24
Median household size:2.2 People
Median household income:$38,397
Median age:35 Years
18ehealth.com
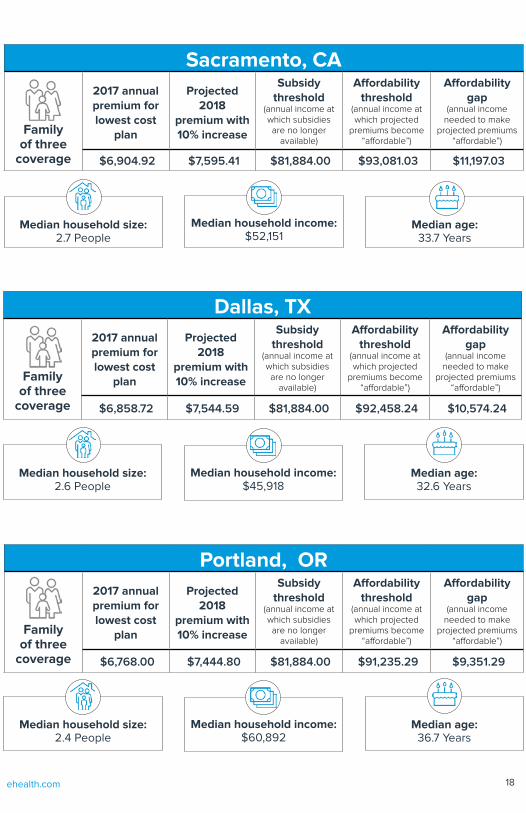
Sacramento, CA
Family of three
coverage
2017 annual premium for lowest cost
plan
Projected 2018
premium with 10% increase
Subsidy threshold
(annual income at which subsidies are no longer
available)
Affordability threshold
(annual income at which projected
premiums become “affordable”)
Affordability gap
(annual income needed to make
projected premiums “affordable”)
$6,904.92 $7,595.41 $81,884.00 $93,081.03 $11,197.03
Median household size:2.7 People
Median household income:$52,151
Median age:33.7 Years
Dallas, TX
Family of three
coverage
2017 annual premium for lowest cost
plan
Projected 2018
premium with 10% increase
Subsidy threshold
(annual income at which subsidies are no longer
available)
Affordability threshold
(annual income at which projected
premiums become “affordable”)
Affordability gap
(annual income needed to make
projected premiums “affordable”)
$6,858.72 $7,544.59 $81,884.00 $92,458.24 $10,574.24
Median household size:2.6 People
Median household income:$45,918
Median age:32.6 Years
Portland, OR
Family of three
coverage
2017 annual premium for lowest cost
plan
Projected 2018
premium with 10% increase
Subsidy threshold
(annual income at which subsidies are no longer
available)
Affordability threshold
(annual income at which projected
premiums become “affordable”)
Affordability gap
(annual income needed to make
projected premiums “affordable”)
$6,768.00 $7,444.80 $81,884.00 $91,235.29 $9,351.29
Median household size:2.4 People
Median household income:$60,892
Median age:36.7 Years
Sacramento, CA
Family of three
coverage
2017 annual premium for lowest cost
plan
Projected 2018
premium with 10% increase
Subsidy threshold
(annual income at which subsidies are no longer
available)
Affordability threshold
(annual income at which projected
premiums become “affordable”)
Affordability gap
(annual income needed to make
projected premiums “affordable”)
$6,904.92 $7,595.41 $81,884.00 $93,081.03 $11,197.03
Dallas, TX
Family of three
coverage
2017 annual premium for lowest cost
plan
Projected 2018
premium with 10% increase
Subsidy threshold
(annual income at which subsidies are no longer
available)
Affordability threshold
(annual income at which projected
premiums become “affordable”)
Affordability gap
(annual income needed to make
projected premiums “affordable”)
$6,858.72 $7,544.59 $81,884.00 $92,458.24 $10,574.24
Portland, OR
Family of three
coverage
2017 annual premium for lowest cost
plan
Projected 2018
premium with 10% increase
Subsidy threshold
(annual income at which subsidies are no longer
available)
Affordability threshold
(annual income at which projected
premiums become “affordable”)
Affordability gap
(annual income needed to make
projected premiums “affordable”)
$6,768.00 $7,444.80 $81,884.00 $91,235.29 $9,351.29
19ehealth.com
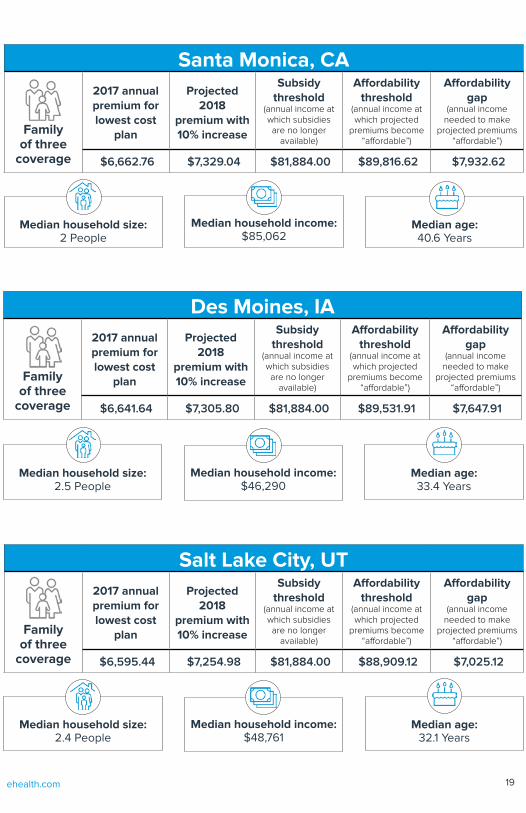
Santa Monica, CA
Family of three
coverage
2017 annual premium for lowest cost
plan
Projected 2018
premium with 10% increase
Subsidy threshold
(annual income at which subsidies are no longer
available)
Affordability threshold
(annual income at which projected
premiums become “affordable”)
Affordability gap
(annual income needed to make
projected premiums “affordable”)
$6,662.76 $7,329.04 $81,884.00 $89,816.62 $7,932.62
Median household size:2 People
Median household income:$85,062
Median age:40.6 Years
Des Moines, IA
Family of three
coverage
2017 annual premium for lowest cost
plan
Projected 2018
premium with 10% increase
Subsidy threshold
(annual income at which subsidies are no longer
available)
Affordability threshold
(annual income at which projected
premiums become “affordable”)
Affordability gap
(annual income needed to make
projected premiums “affordable”)
$6,641.64 $7,305.80 $81,884.00 $89,531.91 $7,647.91
Median household size:2.5 People
Median household income:$46,290
Median age:33.4 Years
Salt Lake City, UT
Family of three
coverage
2017 annual premium for lowest cost
plan
Projected 2018
premium with 10% increase
Subsidy threshold
(annual income at which subsidies are no longer
available)
Affordability threshold
(annual income at which projected
premiums become “affordable”)
Affordability gap
(annual income needed to make
projected premiums “affordable”)
$6,595.44 $7,254.98 $81,884.00 $88,909.12 $7,025.12
Median household size:2.4 People
Median household income:$48,761
Median age:32.1 Years
20ehealth.com
Cleveland, OH
Family of three
coverage
2017 annual premium for lowest cost
plan
Projected 2018
premium with 10% increase
Subsidy threshold
(annual income at which subsidies are no longer
available)
Affordability threshold
(annual income at which projected
premiums become “affordable”)
Affordability gap
(annual income needed to make
projected premiums “affordable”)
$6,516.72 $7,168.39 $81,884.00 $87,847.94 $5,963.94
Median household size:2.2 People
Median household income:$28,831
Median age:36 Years
Seattle, WA
Family of three
coverage
2017 annual premium for lowest cost
plan
Projected 2018
premium with 10% increase
Subsidy threshold
(annual income at which subsidies are no longer
available)
Affordability threshold
(annual income at which projected
premiums become “affordable”)
Affordability gap
(annual income needed to make
projected premiums “affordable”)
$6,415.08 $7,056.59 $81,884.00 $86,477.79 $4,593.79
Median household size:2.1 People
Median household income:$80,349
Median age:35.5 Years
Olympia, WA
Family of three
coverage
2017 annual premium for lowest cost
plan
Projected 2018
premium with 10% increase
Subsidy threshold
(annual income at which subsidies are no longer
available)
Affordability threshold
(annual income at which projected
premiums become “affordable”)
Affordability gap
(annual income needed to make
projected premiums “affordable”)
$6,415.08 $7,056.59 $81,884.00 $86,477.79 $4,593.79
Median household size:2.3 People
Median household income:$53,617
Median age:37.3 Years
Cleveland, OH
Family of three
coverage
2017 annual premium for lowest cost
plan
Projected 2018
premium with 10% increase
Subsidy threshold
(annual income at which subsidies are no longer
available)
Affordability threshold
(annual income at which projected
premiums become “affordable”)
Affordability gap
(annual income needed to make
projected premiums “affordable”)
$6,516.72 $7,168.39 $81,884.00 $87,847.94 $5,963.94
Seattle, WA
Family of three
coverage
2017 annual premium for lowest cost
plan
Projected 2018
premium with 10% increase
Subsidy threshold
(annual income at which subsidies are no longer
available)
Affordability threshold
(annual income at which projected
premiums become “affordable”)
Affordability gap
(annual income needed to make
projected premiums “affordable”)
$6,415.08 $7,056.59 $81,884.00 $86,477.79 $4,593.79
Olympia, WA
Family of three
coverage
2017 annual premium for lowest cost
plan
Projected 2018
premium with 10% increase
Subsidy threshold
(annual income at which subsidies are no longer
available)
Affordability threshold
(annual income at which projected
premiums become “affordable”)
Affordability gap
(annual income needed to make
projected premiums “affordable”)
$6,415.08 $7,056.59 $81,884.00 $86,477.79 $4,593.79
21ehealth.com
Las Vegas, NV
Family of three
coverage
2017 annual premium for lowest cost
plan
Projected 2018
premium with 10% increase
Subsidy threshold
(annual income at which subsidies are no longer
available)
Affordability threshold
(annual income at which projected
premiums become “affordable”)
Affordability gap
(annual income needed to make
projected premiums “affordable”)
$6,251.16 $6,876.28 $81,884.00 $84,268.09 $2,384.09
Median household size:2.8 People
Median household income:$49,676
Median age:37.5 Years
Grand Rapids, MI
Family of three
coverage
2017 annual premium for lowest cost
plan
Projected 2018
premium with 10% increase
Subsidy threshold
(annual income at which subsidies are no longer
available)
Affordability threshold
(annual income at which projected
premiums become “affordable”)
Affordability gap
(annual income needed to make
projected premiums “affordable”)
$6,127.80 $6,740.58 $81,884.00 $82,605.15 $721.15
Median household size:2.6 People
Median household income:$41,857
Median age:32.1 Years
22ehealth.com
Methodology NoteeHealth prepared the present analysis by surveying 2017 premiums for the
lowest-cost plan available in fifty cities and/or metropolitan areas. Rates were
gathered through the federally-run health insurance exchange Healthcare.gov,
with the exceptions of New York, New York (gathered from the New York state
exchange) and the following cities located in states not served by Healthcare.gov
where rates were gathered from plans offered through eHealth.com: Hartford, CT;
Washington, DC; Baltimore, MD; Denver, CO, Santa Monica, San Francisco and
Sacramento, CA; Seattle and Olympia, WA.
The rates quoted in eHealth’s analysis are for family groups of three in which two
adults are aged 35 years. Premium projections for 2018 are calculated as a ten
percent increase over 2017. This uniform ten percent projected increase is simply
an assumption used for this analysis and is not intended to imply that all plans will
uniformly increase at the same rate or to reflect the actual rate increase for any
specific plan in any market or for any aggregated set of plans. Each plan in each
market will have its own actual rate increase (or, possibly in some cases, decrease)
for 2018. It should be noted that rates may in some cases vary from zip code to
zip code within the same metropolitan area or state and that less costly plans may
be available in some cases to consumers who do not utilize the health insurance
exchanges and marketplaces noted above. In addition, this analysis does not at-
tempt to predict legislative, regulatory, or other changes that may affect the actual
2018 rates for plans.
In determining the subsidy threshold – the point at which government subsidies
are no longer available to persons purchasing qualifying health plans – eHealth
employed federal poverty level guidelines for 2017. Subsidies may be available to
persons with a household income of up to 400% of the federal poverty level; as
such, eHealth’s described “subsidy threshold” is calculated at 401% of the federal
poverty level for 2017. The “affordability threshold” is calculated as the annual
household income level at which eHealth’s 2018 premium projections attain to
8.16% of household income. This is the point at which the lowest-priced available
plan is considered unaffordable under the rules of the Affordable Care Act for
2017.
Demographic data used in this report covering median age, median household
size, and median income was derived from Censusreporter.org.

23ehealth.com
© 2017 eHealth, Inc.www.ehealth.com