Embed Size (px)
Citation preview

El Dorado CountyEconomic & Demographic Profile
2007 - 2008
El Dorado County 2007E c o n o m i c a n d D e m o g r a p h i c P r o f i l e
Center for Economic DevelopmentCalifornia State University, Chico
Chico, CA 95929-0765Phone: (530) 898-4598
Fax: (530) 898-4734http://www.csuchico.edu/cedp
ii
2007 Economic and Demographic Profile
AcknowledgementsThe CED wishes to acknowledge the work of the staff who produced this profile:
Courtney Danehy, Project ManagerBrenton Michael Farrell, Technical Writer & Editor
Jude Bayham, Research AssistantEdward Roualdes, Research AssistantRichard Wagner, Research AssistantMeghan Danehy, Production Assistant
Dan Ripke, CED DirectorAndria Gilbert, CED Secretary
The CED would like to recognize the Regional Research Program Board of Directors for their time and support:
Charlie Brown, Northern Rural Training and Employment ConsortiumNorth Central Counties Consortium
Cover design by Aislinn Race.
Additional thanks to the organizations and companies who partnered with the CED on this project. Without their generous financialsupport, production, and marketing, distribution of this profile would not have been possible.
Copyright © 2007 by the Center for Economic Development, CSU, Chico Research Foundation. All rights reserved.
This report or any part thereof may not be reproduced without the written permission of the Center for Economic Development or the CSU, ChicoResearch Foundation.
Support for the profile series comes from our sponsors, the Board of Directors, and the Center for Economic Development. The CED is funded in partby the U.S. Department of Commerce, Economic Development Administration and the Small Business Administration (SBA).
iii
Introduction
Introduction
Welcome to the 2007 El Dorado County Economic and Demographic Profile. This docu-ment contains important information concerning the economic well-being of El Dorado County'sresidents, community, and economy. The data here has been compiled to represent trends over thelast decade, and in many cases provides projections for the coming years. This information may beused for many purposes, including small business development, market analysis, and grant writing,among others. It may assist companies and individuals in relocating to Northern California or improving existing conditions.By exploring the structure of El Dorado County in various aspects, the Center for Economic Development and its partnershope to facilitate healthy and effective living and provide valuable information for the growth and strength of the area.
This profile was compiled by the Center for Economic Development (CED), California State University, Chico ResearchFoundation. The CED is a community outreach organization of the University Research Foundation at CSU, Chico. TheCED receives funding from the Economic Development Administration of the U.S. Department of Commerce along withmatching funds provided by the university.
The CED's Regional Research Program (RRP) has provided Northern California county profiles since 1989, and con-tinually seeks to improve their content, readability, and clarity. Based on client surveys and requests, as well as new research, theRRP has updated the 2007 series to include more information, new narratives, and improvements in data display. The CEDcontinues to welcome any comments and/or suggestions. The CED has access to market professionals both in-house and with-in the local community, and gladly facilitates additional needs to our fullest capacity upon request.
El Dorado County
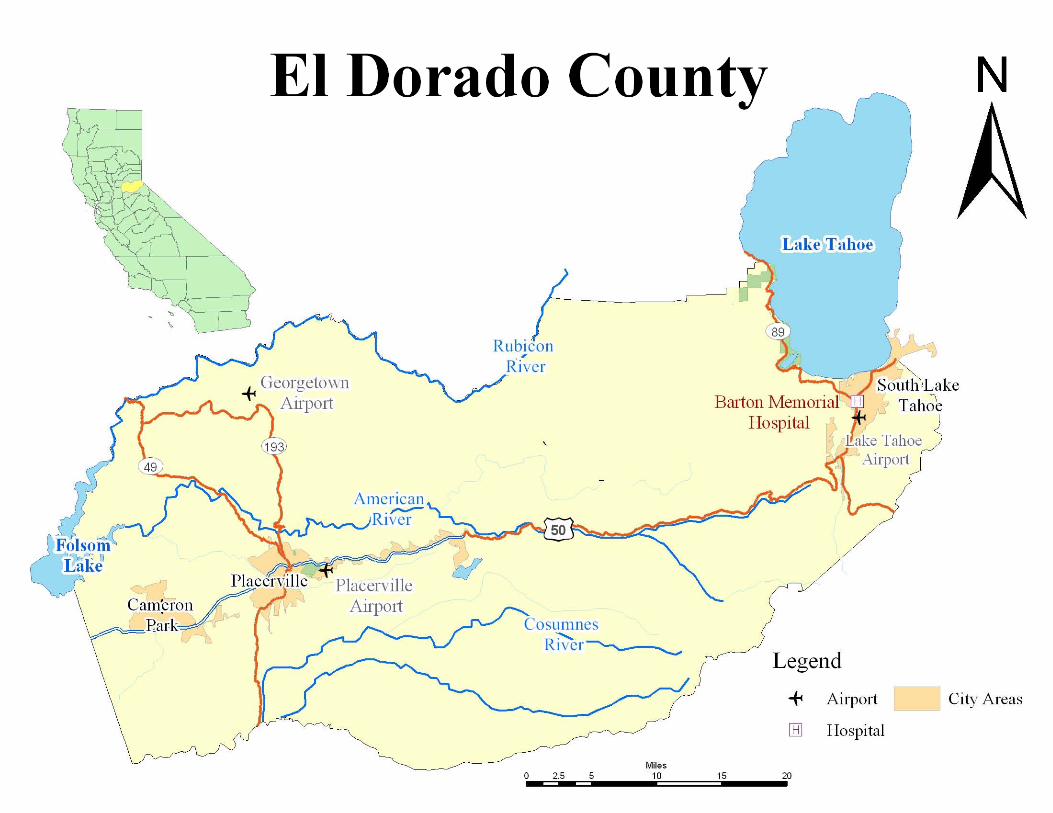
Location and DemographicsEl Dorado County is thirty miles east of Sacramento, and offers many nice suburbs for those who commute to
Sacramento during the workweek. As the site of James Marshall's first gold finding in 1848, El Dorado County became theepicenter for the gold rush madness that seized California in the nineteenth century. The gold rush brought visitors fromEurope, Mexico, and other states. Their diverse cultural influence is still seen today in El Dorado County. El Dorado Countyencompasses 1,711 square miles and is home to approximately 176,200 people.
RecreationWhen not enjoying world-class skiing at Lake Tahoe, visitors can enjoy river rafting and kayaking on the South Fork of
the American River. For history buffs, the Marshall Gold Discovery State Park Historic Museum celebrates the origins of thegold rush and offers a unique perspective on the past. Several nineteenth century houses in El Dorado County have been con-verted into bed and breakfast inns, providing visitors with quaint, affordable lodging.
EconomyThe Lake Tahoe area and the ski resorts within are excellent sources of revenue for El Dorado County. Skiers from all
over the world visit during the winter months. El Dorado County has a largely agricultural economic base during the rest ofthe year. Apple orchards grow throughout the eastern parts of the county, and apple exports are a reliable source of seasonalincome when the hustle and bustle of ski season ceases. The Sierra Nevada range is also in El Dorado County, where loggingindustries provide additional economic stimulus. Gold is still found in El Dorado County, lending a feeling of excitement tothe area's economic environment.
v
El Dorado County
Cameron Park
Cameron Park is a fairly new community in El Dorado County, and offers itself as a glimpse into the area's past. Burialmounds and grinding stones of the Niesnan branch of the Maidu Indians, and the Skinner Winery from 1865 are a few of thehistorical interests in the area. The site of Cameron Park rests in the same county where gold was discovered in 1848, prior tothe California Gold Rush. Originally purchased by Larry Cameron in the 1950's, the 5,000 foothill acres were meant to beranch land. Cameron divided the land, and it now has many different qualities to offer the community, including residentialand shopping areas, ranch-sized properties, a championship country club, a recreational lake, and the Airpark Estates. AirparkEstates is a neighborhood located right by the airport, with a "runway" home. One of the advantages to living and flying inthe Cameron Airpark Estates is the drive home. The wide streets throughout the community allow the pilots to taxi all the wayto their driveway.
For more information on Cameron Park, you can visit or contact the Chamber of Commerce.
Chamber of Commerce: http://www.sscpchamber.org/Postal Address: P. O. Box 341Physical Address: 3300 Coach Lane, Suite B8Cameron Park, CA 95682Phone: (530) 677-8000Fax: (530) 676-8313
Georgetown
Georgetown is another point of historical interest in El Dorado County. Named after George Phipps, who led a com-pany of sailors there during the nineteenth century, Georgetown was the site of a gold camp and trading center for around10,000 miners during the gold rush. It also was the site for an attempt of Japanese settlers to form the Wakamatsu Colony, estab-lished in 1868 to operate a tea and silk plantation. The venture failed after two years.
Today, Georgetown remains "The Pride of the Mountains" for the residents, with the beautiful surrounding Sierra NevadaMountain range and the historical Main Street. It also is part of the Sacramento, California metropolitan area.
For more information on Georgetown, informational phone numbers and web sites are listed below.
Georgetown Airport: (916) 622-0459Georgetown Web site: http://www.caohwy.com/g/georgeto.htmGeorgetown Lodging: http://www.usa-lodging.com/motels/califn/Georgetown.htm
vi
2007 Economic and Demographic Profile
Shingle Springs
As most of El Dorado County, Shingle Springs played an important role in California history, and specifically in the daysof the California Gold Rush. Though today it is a peaceful and quiet country community with large estates and ranches, at onetime, Shingle Springs was littered with rich placer mines (and miners) yielding up to $200 per rocker per day. The discovery ofgold brought people to the area, but as mines began to fail, the population declined. However, some cattle ranchers and farm-ers knew the value of the land despite the lack of minerals, and continued to support the town. The first post office was estab-lished on February 3, 1853, the first general store was built in 1865, and the Sacramento Valley Railroad was extended intoShingle Springs in 1866. With transportation coming and going on a daily basis, business increased, and Shingle Springsbecame a booming area.
One year later, the railroad was rerouted through Auburn, taking with it Shingle Springs residents. However, the major-ity of the population remained in Shingle Springs to establish a permanent community. On May 11, 1865 Shingle Springsbecame Shingle, and remained that way until 1955, when it returned to its original name, Shingle Springs.
Chamber of Commerce: http://www.sscpchamber.org/Postal Address: P. O. Box 341 Physical Address: 3300 Coach Lane, Suite B8Cameron Park, CA 95682Phone: (530) 677-8000 Fax: (530) 676-8313
El Dorado Hills
El Dorado Hills has always been a beautiful part of the county. The views of the surrounding areas are breath-taking, and the community is warm and welcoming to all visitors.
The community has many recreational activities available to everyone. Some of these activities include El DoradoHills Golf Course, playgrounds, and sports fields, not to mention biking country roads, hiking, and water sports atFolsom Lake and the Marina at Brown's Ravine. Folsom Lake is one of the most popular recreational areas inCalifornia, with seventy-seven miles of shoreline to play on.
Referred to as the gateway to El Dorado County, El Dorado Hills has varying elevations, ranging from 200 feetto over 10,800 feet, with the towering Sierras offering ski areas close by. It is also home to many famous wineries, brew-eries, bake shops, and farms.
Chamber of Commerce: Phone: (916) 933-1335Email: [email protected] Golf Course: (916) 933-6552.http://www.eldoradohillschamber.com/ Lake Tahoe Visitors Authority: (530) 544-5050http://www.visit-eldorado.com http://www.virtualtahoe.com/LTVAPostal Address: P.O. Box 5055Physical Address: 981 Governor Dr., Ste. 103El Dorado Hills, CA 95762
vii
El Dorado County
Diamond Springs
Diamond Springs got its name from a clear water spring that was located approximately where Main Street is now.Originally founded in 1848, it was among the richest spots in this vicinity, with diggings producing a twenty-five-pound nugget,one of the largest ever found in El Dorado County. Its most thriving period was in 1851 and, through its lumber, lime pro-duction, and agriculture, Diamond Springs has retained some of its early importance.
Today, it remains a viable area, placed in the middle of a variety of recreational possibilities. The landscape is beautiful,and the area offers many opportunities for recreational fun.
For more information on Diamond Springs, visit: http://ceres.ca.gov/geo_area/counties/El_Dorado/landmarks.html.
Pollock Pines
Pollock Pines is yet another beautiful area of El Dorado County. With lush forests and majestic mountains, thisis a great source of recreation for everyone. Located between Lake Tahoe, Sacramento, and the Sierra NevadaMountains, camping, hiking, fishing, and snow sports are just a few of the options visitors have. The area also experi-ences all four seasons, so visitors, plan ahead and catch the weather you're looking for.
Though most of El Dorado County was home to miners during the Gold Rush, Pollock Pines was only a restingplace for Pony Express riders to catch some sleep, as it was along the Wagon Train and Mormon Emigrant Trail. Annualreenactments of the history of the Gold Rush remind the community of the importance of the area.
For more information on Pollock Pines, contact the El Dorado County Chamber of Commerce:http://co.el-dorado.ca.us/
viii
2007 Economic and Demographic Profile
ix
Table of Contents
Table of ContentsGeneral Indicators:1. Demographics
Total Population . . . . . . . . . . . . . . . . . . . . . . . . . . . . . . . . . . . . . . . . . . . 2
Population by City . . . . . . . . . . . . . . . . . . . . . . . . . . . . . . . . . . . . . . . . . 3Components of Population Change. . . . . . . . . . . . . . . . . . . . . . . . . . . . 5Age Distribution . . . . . . . . . . . . . . . . . . . . . . . . . . . . . . . . . . . . . . . . . . . 6Population by Race/Ethnicity. . . . . . . . . . . . . . . . . . . . . . . . . . . . . . . . . 8Population by Educational Attainment . . . . . . . . . . . . . . . . . . . . . . . . 10Land Area & Population Density. . . . . . . . . . . . . . . . . . . . . . . . . . . . . 14Net Migration. . . . . . . . . . . . . . . . . . . . . . . . . . . . . . . . . . . . . . . . . . . . 15
2. Environmental FactorsClimate Data . . . . . . . . . . . . . . . . . . . . . . . . . . . . . . . . . . . . . . . . . . . .18Air Quality . . . . . . . . . . . . . . . . . . . . . . . . . . . . . . . . . . . . . . . . . . . . . .19
3. AgricultureHarvested Acreage. . . . . . . . . . . . . . . . . . . . . . . . . . . . . . . . . . . . . . . . . 24Top Crops Production . . . . . . . . . . . . . . . . . . . . . . . . . . . . . . . . . . . . . 26Value of Agricultural Production . . . . . . . . . . . . . . . . . . . . . . . . . . . . . 27Top Crops Price per Unit . . . . . . . . . . . . . . . . . . . . . . . . . . . . . . . . . . . 29Government Payments to Farms . . . . . . . . . . . . . . . . . . . . . . . . . . . . . 30
Economic Indicators:4. Labor Market
Labor Force . . . . . . . . . . . . . . . . . . . . . . . . . . . . . . . . . . . . . . . . . . . . . . 34Total Employment . . . . . . . . . . . . . . . . . . . . . . . . . . . . . . . . . . . . . . . . 35Unemployment. . . . . . . . . . . . . . . . . . . . . . . . . . . . . . . . . . . . . . . . . . . 36Average Monthly Labor Statistics . . . . . . . . . . . . . . . . . . . . . . . . . . . . . 38
5. IncomeTotal Personal Income . . . . . . . . . . . . . . . . . . . . . . . . . . . . . . . . . . . . . 42Components of Total Personal Income.. . . . . . . . . . . . . . . . . . . . . . . . 43Components of Transfer Payments . . . . . . . . . . . . . . . . . . . . . . . . . . . 45Per Capita Income. . . . . . . . . . . . . . . . . . . . . . . . . . . . . . . . . . . . . . . . . 47Median Household Income . . . . . . . . . . . . . . . . . . . . . . . . . . . . . . . . . 48Poverty Rate. . . . . . . . . . . . . . . . . . . . . . . . . . . . . . . . . . . . . . . . . . . . . . 49
x
2007 Economic and Demographic Profile
6. Business & IndustryTaxable Sales . . . . . . . . . . . . . . . . . . . . . . . . . . . . . . . . . . . . . . . . . . . . . 52Business by Employment Size & Industry. . . . . . . . . . . . . . . . . . . . . . 54Job Growth by Industry Sector . . . . . . . . . . . . . . . . . . . . . . . . . . . . . . 56Earnings by Industry . . . . . . . . . . . . . . . . . . . . . . . . . . . . . . . . . . . . . . 59Largest Employers. . . . . . . . . . . . . . . . . . . . . . . . . . . . . . . . . . . . . . . . . 61
7. Housing & Real EstateTotal Housing Units. . . . . . . . . . . . . . . . . . . . . . . . . . . . . . . . . . . . . . . 64New Housing Units Authorized by Building Permits . . . . . . . . . . . . . 67Value of New Construction . . . . . . . . . . . . . . . . . . . . . . . . . . . . . . . . . 69Fair Market Rent . . . . . . . . . . . . . . . . . . . . . . . . . . . . . . . . . . . . . . . . . 72Median Home Price . . . . . . . . . . . . . . . . . . . . . . . . . . . . . . . . . . . . . . . 73Housing Affordability Index. . . . . . . . . . . . . . . . . . . . . . . . . . . . . . . . . 75
8. Travel & TourismTravel Expenditures. . . . . . . . . . . . . . . . . . . . . . . . . . . . . . . . . . . . . . . . 78Travel-Generated Employment . . . . . . . . . . . . . . . . . . . . . . . . . . . . . . 80Total Annual Tourism Earnings . . . . . . . . . . . . . . . . . . . . . . . . . . . . . . 82Tax Revenues Generated by Travel Expenditures. . . . . . . . . . . . . . . . . 83Travel Time to Work. . . . . . . . . . . . . . . . . . . . . . . . . . . . . . . . . . . . . . . 85Means of Transportation. . . . . . . . . . . . . . . . . . . . . . . . . . . . . . . . . . . . 86Vehicle Registration . . . . . . . . . . . . . . . . . . . . . . . . . . . . . . . . . . . . . . . 88
Social Indicators:9. Community Health
Births, Deaths, & Leading Causes of Death . . . . . . . . . . . . . . . . . . . . 92AIDS Cases. . . . . . . . . . . . . . . . . . . . . . . . . . . . . . . . . . . . . . . . . . . . . . 95Teenage Pregnancy . . . . . . . . . . . . . . . . . . . . . . . . . . . . . . . . . . . . . . . . 96Low Birth Weight Infants. . . . . . . . . . . . . . . . . . . . . . . . . . . . . . . . . . . 98Infant Mortality . . . . . . . . . . . . . . . . . . . . . . . . . . . . . . . . . . . . . . . . . . 99Medical Service Providers . . . . . . . . . . . . . . . . . . . . . . . . . . . . . . . . . . 101Alcohol & Drug Program Clients . . . . . . . . . . . . . . . . . . . . . . . . . . . 102Persons Living with a Disability . . . . . . . . . . . . . . . . . . . . . . . . . . . . . 104
xi
Table of Contents
10. Welfare
TANF/CalWORKs Caseload & Expenditures . . . . . . . . . . . . . . . . . 106Food Stamps Caseload & Expenditures. . . . . . . . . . . . . . . . . . . . . . . 108Medi-Cal Caseload & Expenditures . . . . . . . . . . . . . . . . . . . . . . . . . 110Child Abuse Referrals & Allegations . . . . . . . . . . . . . . . . . . . . . . . . . 112Foster Care Entries . . . . . . . . . . . . . . . . . . . . . . . . . . . . . . . . . . . . . . . 114
11. EducationSchool Enrollment . . . . . . . . . . . . . . . . . . . . . . . . . . . . . . . . . . . . . . . 119High School Dropout Rate . . . . . . . . . . . . . . . . . . . . . . . . . . . . . . . . 120Average SAT Scores . . . . . . . . . . . . . . . . . . . . . . . . . . . . . . . . . . . . . . 121Academic Performance Index (API). . . . . . . . . . . . . . . . . . . . . . . . . . 123Statewide & Similar Schools Rank . . . . . . . . . . . . . . . . . . . . . . . . . . 127
12. CrimeReported Crime & Crime Rates . . . . . . . . . . . . . . . . . . . . . . . . . . . . 130Criminal Justice Personnel . . . . . . . . . . . . . . . . . . . . . . . . . . . . . . . . . 132Crime Expenditures . . . . . . . . . . . . . . . . . . . . . . . . . . . . . . . . . . . . . . 133Probation Caseload. . . . . . . . . . . . . . . . . . . . . . . . . . . . . . . . . . . . . . . 134Incarcerated Population . . . . . . . . . . . . . . . . . . . . . . . . . . . . . . . . . . . 135
13. Voter InformationVoter Registration & Political Party Membership . . . . . . . . . . . . . . . 137

xii
2007 Economic and Demographic Profile