Embed Size (px)
Citation preview
Elastomer Characterization Method for Trapped Rubber Processing
Downloaded from: https://research.chalmers.se, 2021-12-23 02:18 UTC
Citation for the original published paper (version of record):Khalili, P., Boulanger, T., Blinzler, B. (2020)Elastomer Characterization Method for Trapped Rubber ProcessingPolymers, 12(3)http://dx.doi.org/10.3390/polym12030686
N.B. When citing this work, cite the original published paper.
research.chalmers.se offers the possibility of retrieving research publications produced at Chalmers University of Technology.It covers all kind of research output: articles, dissertations, conference papers, reports etc. since 2004.research.chalmers.se is administrated and maintained by Chalmers Library
(article starts on next page)

polymers
Article
Elastomer Characterization Method for TrappedRubber Processing
Pooria Khalili , Thomas Boulanger and Brina J. Blinzler *
Division of Material and Computational Mechanics, Department of Industrial and Materials Science, ChalmersUniversity of Technology, SE-412 96 Göteborg, Sweden; [email protected] (P.K.);[email protected] (T.B.)* Correspondence: [email protected]; Tel.: +46-31-772-6336
Received: 27 February 2020; Accepted: 15 March 2020; Published: 19 March 2020�����������������
Abstract: The increasing high-volume demand for polymer matrix composites (PMCs) brings into focusthe need for autoclave alternative processing. Trapped rubber processing (TRP) of PMCs is a methodcapable of achieving high pressures during polymer matrix composite processing by utilizing thermallyinduced volume change of a nearly incompressible material inside a closed cavity mold. Recentadvances in rubber materials and computational technology have made this processing techniquemore attractive. Elastomers can be doped with nanoparticles to increase thermal conductivity andthis can be further tailored for local variations in thermal conductivity for TRP. In addition, recentadvances in computer processing allow for simulation of coupled thermomechanical processes forfull part modeling. This study presents a method of experimentally characterizing prospective rubbermaterials. The experiments are designed to characterize the dynamic in situ change in temperature,the dynamic change in volume, and the resulting real-time change in surface pressure. The materialcharacterization is specifically designed to minimize the number and difficulty of experimental testswhile fully capturing the rubber behavior for the TRP scenario. The experimental characterizationwas developed to provide the necessary data for accurate thermomechanical material models ofnearly incompressible elastomeric polymers for use in TRP virtual design and optimization.
Keywords: composites; processing; elastomers; reinforced polymer composites; autoclave alternative; TRP
1. Introduction
As the demand for carbon fiber reinforced polymers (CFRPs) increases, the need for autoclavealternatives for high performance composite processing that allows faster throughput while maintainingperformance becomes more pronounced. Current autoclave processing of composites relies on polymercompaction through a combination of vacuum bagging and pressurization. The autoclave is heated in away that increases temperature in the air that is transferred to the surface of the part. This procedure issomewhat inefficient and can take a matter of hours for the part to go through the full cure cycle [1,2].Additionally, autoclaves are costly to both acquire and maintain and must be large enough to accommodatefor the largest part produced [3]. Pressurized bladder molding (PBM) is another alternative processingtechnique where the composite preform is placed in a hard cavity mold and pressurized with an internalbladder. This allows for the cure cycle to be reduced to under an hour for thin parts but can be susceptibleto bladder rupture and is typically only used for small parts due to the cost of the exterior tooling [4,5].
There exists an industry need for autoclave alternatives to high performance composite processingthat allows for faster throughput without giving up performance. In the mid-1970s, a number ofpolymeric elastomers were developed for TRP [6–9], but the research stalled due to the low thermalconductivity of the materials and the disconnect between change in temperature and change in pressurefor complex shapes. Over-pressurization is a common initial problem when using a trial-and-error
Polymers 2020, 12, 686; doi:10.3390/polym12030686 www.mdpi.com/journal/polymers

Polymers 2020, 12, 686 2 of 13
based process design methodology. It is clear that numerical process models are required for TRPprocessing design. A well characterized rubber material model can then be used in conjunction withexisting process modeling methods [10]. Recent advances in technology have made the TRP processingtechnique achievable for complex shapes and high-volume production. Extensive research in thecomputer electronics industry has developed a number of elastomers with high thermal conductivity.This increase in thermal conductivity is generally achieved by using nanoscale metallic additives [11].
It is well known that the through-thickness degree of cure or crystallinity gradients causenon-thermoelastic residual stresses during PMC manufacturing [10]. Through-thickness cure gradientsare exacerbated primarily by two mechanisms. One is the rate of thermal loading and the other is thethickness of the composite preform. High throughput automated PMC manufacturing can requirehigh-temperature curing, but sharp distortions are intensified by increasing the processing temperaturerange [12,13]. In-plane residual stresses can be further intensified by increasing the thickness ofthe composite preform [14–18]. It is more efficient for thick parts, to processes the component in asingle cycle, but typically multiple cycles are used to processes parts greater than the recommendedthickness ranges due to the severity of cure gradient, residual stresses, and other phenomena [18].Nano-additives can be exploited to customize the thermal conductivity of the TRP material [19]and mitigate these thermal gradient effects. In this way, sections of the TRP unit in contact withthicker sections of the composite preform can be designed with a comparatively higher conductivityto those other sections in contact with thinner composite preform. Additionally, this can potentiallyeliminate locally under-cured or over-cured areas of the structure. There has also been investigationinto copolymer formulations that combine the hyperplastic properties of one polymer with the highthermal conductivity properties of another polymer [20]. TRP in general is an ideal candidate fornanoscale optimization of multifunctional mechanical and thermal properties.
Once optimal thermal conductivity is achieved, then the remaining question is how to link thetemperature change with changes in pressure. In this paper, a solution is proposed. This coupledthermomechanical process can be simulated with finite element analysis [21]. An experimentalcharacterization method has been designed to capture the volumetric change in pressure via a series ofmaterial tests. These tests are specifically designed to characterize the in-situ change in temperature,the change in volume of the nearly incompressible elastomeric material and the volumetric change insurface pressure on the exterior surface of the TRP unit (Figure 1).Polymers 2020, 12, x FOR PEER REVIEW 3 of 13
Figure 1. Advanced trapped rubber molding process.
2. Materials and Methods
TRP allows more design freedom with more advanced shapes and less risk of processing failure
while maintaining the possibility for custom distributions of pressures, custom distributions of
temperatures, and therefore high‐quality consolidation and curing. Simple TRP is shown in Figure 2.
Here, the outer clamshell mold is shown in yellow, the rubber is blue and the composite preform is
green. The rubber expands due to the temperature change and this imparts a uniform pressure on
the composite preform.
An advanced TRP molding technique (Figure 1) can be developed by isolating the rubber
material that has the large volumetric change. In the illustration in Figure 1, the cavity mold,
aluminum mandrel, and rubber bumper have relatively low coefficients of thermal expansion. While
the TRP unit is tailored to expand for cure pressurization in alignment with the resin system
employed in composite preform. As illustrated here, this process also is amenable to robotic
manufacturing.
Figure 2. Cross section of trapped rubber processing (TRP).
2.1. Specimen Development
The experimental setup is designed and conducted to capture the volumetric change and
resulting pressure via a series of tests. These tests include: the change in temperature, the change in
volume, and the change in surface pressure. The temperature and surface pressure test setup consist
of aluminum molds with an internal steel sphere and the rubber material in a concentric hollow
sphere. The thermal expansion of the aluminum molds and the steel sphere can be calculated easily
during the cure cycle and thereby simplify the characterization of the rubber material. The hollow
rubber sphere (Figure 3) is molded to have an outer diameter of 60.0 mm and an inner diameter of
50.00 mm at room temperature. The two‐part silicone rubber is poured into the rubber manufacturing
Figure 1. Advanced trapped rubber molding process.

Polymers 2020, 12, 686 3 of 13
One of the benefits of advanced trapped rubber processing is that there is no need for an autoclave,which can be costly both to acquire and to maintain [3]. Also, in contrast to PBM there is no needfor a pneumatic system, which is prone to rupture and reduces the complexity of the design [4].Future advanced TRP will also eliminate the need for ovens because the heating technology can beincorporated directly into the rubber material at discrete locations where it is needed for the best cureprofile. The parts made using this processing technique are highly consolidated, which is desirable forhigh performance composites. This process also lends itself more easily to robotic manufacturing whencompared with autoclave processing and PBM. Considering both the reduction in energy consumptionduring processing and a reduction in labor the development of a robust TRP method could lead to moreefficient and sustainable reinforced polymer composite manufacturing. In this paper, a straightforwardexperimental characterization method for TRP materials is proposed. The method limits deviatoricstrains via geometric constraints and captures in situ pressure and temperature transients in rangessimilar to those required for processing thermoset polymer matrix composites.
2. Materials and Methods
TRP allows more design freedom with more advanced shapes and less risk of processing failurewhile maintaining the possibility for custom distributions of pressures, custom distributions oftemperatures, and therefore high-quality consolidation and curing. Simple TRP is shown in Figure 2.Here, the outer clamshell mold is shown in yellow, the rubber is blue and the composite preform isgreen. The rubber expands due to the temperature change and this imparts a uniform pressure on thecomposite preform.
An advanced TRP molding technique (Figure 1) can be developed by isolating the rubber materialthat has the large volumetric change. In the illustration in Figure 1, the cavity mold, aluminum mandrel,and rubber bumper have relatively low coefficients of thermal expansion. While the TRP unit is tailoredto expand for cure pressurization in alignment with the resin system employed in composite preform.As illustrated here, this process also is amenable to robotic manufacturing.
Polymers 2020, 12, x FOR PEER REVIEW 3 of 13
Figure 1. Advanced trapped rubber molding process.
2. Materials and Methods
TRP allows more design freedom with more advanced shapes and less risk of processing failure
while maintaining the possibility for custom distributions of pressures, custom distributions of
temperatures, and therefore high‐quality consolidation and curing. Simple TRP is shown in Figure 2.
Here, the outer clamshell mold is shown in yellow, the rubber is blue and the composite preform is
green. The rubber expands due to the temperature change and this imparts a uniform pressure on
the composite preform.
An advanced TRP molding technique (Figure 1) can be developed by isolating the rubber
material that has the large volumetric change. In the illustration in Figure 1, the cavity mold,
aluminum mandrel, and rubber bumper have relatively low coefficients of thermal expansion. While
the TRP unit is tailored to expand for cure pressurization in alignment with the resin system
employed in composite preform. As illustrated here, this process also is amenable to robotic
manufacturing.
Figure 2. Cross section of trapped rubber processing (TRP).
2.1. Specimen Development
The experimental setup is designed and conducted to capture the volumetric change and
resulting pressure via a series of tests. These tests include: the change in temperature, the change in
volume, and the change in surface pressure. The temperature and surface pressure test setup consist
of aluminum molds with an internal steel sphere and the rubber material in a concentric hollow
sphere. The thermal expansion of the aluminum molds and the steel sphere can be calculated easily
during the cure cycle and thereby simplify the characterization of the rubber material. The hollow
rubber sphere (Figure 3) is molded to have an outer diameter of 60.0 mm and an inner diameter of
50.00 mm at room temperature. The two‐part silicone rubber is poured into the rubber manufacturing
Figure 2. Cross section of trapped rubber processing (TRP).
2.1. Specimen Development
The experimental setup is designed and conducted to capture the volumetric change and resultingpressure via a series of tests. These tests include: the change in temperature, the change in volume, andthe change in surface pressure. The temperature and surface pressure test setup consist of aluminummolds with an internal steel sphere and the rubber material in a concentric hollow sphere. The thermalexpansion of the aluminum molds and the steel sphere can be calculated easily during the cure cycleand thereby simplify the characterization of the rubber material. The hollow rubber sphere (Figure 3) ismolded to have an outer diameter of 60.0 mm and an inner diameter of 50.00 mm at room temperature.The two-part silicone rubber is poured into the rubber manufacturing mold with the 50.00 mm diametersteel sphere suspended in the center. The resulting concentric hollow sphere is a test specimen with auniform thickness for straight forward characterization.

Polymers 2020, 12, 686 4 of 13
Polymers 2020, 12, x FOR PEER REVIEW 4 of 13
mold with the 50.00 mm diameter steel sphere suspended in the center. The resulting concentric
hollow sphere is a test specimen with a uniform thickness for straight forward characterization.
(a)
(b)
Figure 3. 3D printed mold and resulting rubber sphere molded concentrically over a steel sphere: (a)
3D printed rubber mold; (b) Demolded rubber assembly.
A CS25 condensation cure silicone rubber was purchased from Easy Composites Ltd. (Stoke‐on‐
Trent, United Kingdom) The combined rubber and catalyst were grey in color, had the viscosity of
20000–26000 mPa at ambient temperature and had 1.04–1.14 g/cm3 density. The solid steel spheres
were purchased from Spekuma company and had the weight of 510 gram measuring 50.00 mm in
diameter [22]. Loctite hysol 9466 A&B adhesive was used to bond four spring pins in radially oriented
holes in the 3‐D printed PLA molds. The thermocouples used for embedding were TC‐TT‐K‐40‐36
purchased from Omega Engineering Limited. The processing time for the adhesive was 60 min, and
the adhesive had the viscosity of 35 Pa s and possessed the tensile strength of 32 MPa. Mold release
wax was applied to the inner surface of the PLA molds and the A‐staged rubber mixture was
degassed for 3 minutes at a vacuum of 26.6 millibar before pouring into the mold. The mold was
vibrated during pouring to mitigate bubbles forming on the reversed curvature portion of the top of
the mold.
For the in‐situ temperature acquisition, five TC‐TT‐K‐40‐369 thermocouples (TC) were
embedded in the silicone rubber. These TCs have a diameter of 0.08 mm. In order to embed the TCs
as evenly as possible through the thickness of the rubber during the casting process, the TCs were
glued to a thin piece of fabric that was suspended in the rubber manufacturing mold prior to the
addition of the liquid rubber. One side of the fabric was adhered to the steel sphere and the other side
was temporarily taped to the exterior of the mold. During this process, the fabric had to be kept taut
to mitigate sagging and maintain the through thickness location of the TCs. The TCs were placed on
the fabric as shown in Figure 4. The TCs had to be perpendicular to the mold surface and parallel to
each other, to ensure even acquisition of the local in‐situ temperature. The TC wires were then
threaded through the mold line and labeled according to through‐thickness position.
Figure 3. 3D printed mold and resulting rubber sphere molded concentrically over a steel sphere: (a)3D printed rubber mold; (b) Demolded rubber assembly.
A CS25 condensation cure silicone rubber was purchased from Easy Composites Ltd. (Stoke-on-Trent,United Kingdom) The combined rubber and catalyst were grey in color, had the viscosity of 20,000–26,000 mPa at ambient temperature and had 1.04–1.14 g/cm3 density. The solid steel spheres werepurchased from Spekuma company and had the weight of 510 g measuring 50.00 mm in diameter [22].Loctite hysol 9466 A&B adhesive was used to bond four spring pins in radially oriented holes in the3-D printed PLA molds. The thermocouples used for embedding were TC-TT-K-40-36 purchased fromOmega Engineering Limited. The processing time for the adhesive was 60 min, and the adhesive hadthe viscosity of 35 Pa·s and possessed the tensile strength of 32 MPa. Mold release wax was appliedto the inner surface of the PLA molds and the A-staged rubber mixture was degassed for 3 min ata vacuum of 26.6 millibar before pouring into the mold. The mold was vibrated during pouring tomitigate bubbles forming on the reversed curvature portion of the top of the mold.
For the in-situ temperature acquisition, five TC-TT-K-40-369 thermocouples (TC) were embeddedin the silicone rubber. These TCs have a diameter of 0.08 mm. In order to embed the TCs as evenlyas possible through the thickness of the rubber during the casting process, the TCs were glued to athin piece of fabric that was suspended in the rubber manufacturing mold prior to the addition of theliquid rubber. One side of the fabric was adhered to the steel sphere and the other side was temporarilytaped to the exterior of the mold. During this process, the fabric had to be kept taut to mitigate saggingand maintain the through thickness location of the TCs. The TCs were placed on the fabric as shown inFigure 4. The TCs had to be perpendicular to the mold surface and parallel to each other, to ensureeven acquisition of the local in-situ temperature. The TC wires were then threaded through the moldline and labeled according to through-thickness position.
It is extremely difficult to place the TCs exactly 1 mm from each other per the target location.The exact locations were measured after the adhesive cured at 1.33, 2.31, 2.99, 3.70, and 4.65 mmmeasured from the interior edge attached to the steel sphere (Figure 4). Additionally, the exposededges of the TCs were wrapped in tape to limit rubber adhesion outside the desired sphere shape.

Polymers 2020, 12, 686 5 of 13
Polymers 2020, 12, x FOR PEER REVIEW 5 of 13
(a)
(b)
Figure 4. Position of the thermocouples in reference to the sample geometry: (a) View of the rubber
mold, steel sphere, fabric and thermocouple placement location; (b) Detail view of thermocouple
placement on fabric.
It is extremely difficult to place the TCs exactly 1 mm from each other per the target location.
The exact locations were measured after the adhesive cured at 1.33, 2.31, 2.99, 3.70, and 4.65 mm
measured from the interior edge attached to the steel sphere (Figure 4). Additionally, the exposed
edges of the TCs were wrapped in tape to limit rubber adhesion outside the desired sphere shape.
2.2. Rubber Specimen Molding
Two‐part PLA molds with spherical cavity of 60.0 mm in diameter were 3D‐printed for use in
casting the silicon rubber around the suspended steel ball. ZYYXpro 3D printer was used to extrude
the proPLA filament for mold manufacturing sold by ZYYX Labs, AB [23]. Two small holes were also
designed at the bottom of each 3D‐printed PLA molds to be able to suspend the steel ball during the
rubber casting by gluing (Loctite hysol 9466 A&B adhesive) four steel spring pins into the holes and
subsequently resting the ball on the four spring pins.
The stochiometric ratio of silicon rubber to catalyst (100 to 5 parts by weight) was used, and the
mix was degassed for the period of 3 minutes. Then the silicon rubber was poured gently into the
three printed PLA molds with the suspended steel ball. The system was left to cure for 24 hours before
demolding and the whole demolded assembly had the weight of 560 g.
2.3. Temperature Change
The thermal transient was evaluated by placing the hollow rubber sphere in a two‐part cavity
mold, Figure 5. The rubber is effectively trapped between the outer surface of the steel sphere and
the inner surface of the mold. Heat is then applied from the outside of the mold via flat aluminum
Figure 4. Position of the thermocouples in reference to the sample geometry: (a) View of the rubbermold, steel sphere, fabric and thermocouple placement location; (b) Detail view of thermocoupleplacement on fabric.
2.2. Rubber Specimen Molding
Two-part PLA molds with spherical cavity of 60.0 mm in diameter were 3D-printed for use incasting the silicon rubber around the suspended steel ball. ZYYXpro 3D printer was used to extrudethe proPLA filament for mold manufacturing sold by ZYYX Labs, AB [23]. Two small holes were alsodesigned at the bottom of each 3D-printed PLA molds to be able to suspend the steel ball during therubber casting by gluing (Loctite hysol 9466 A&B adhesive) four steel spring pins into the holes andsubsequently resting the ball on the four spring pins.
The stochiometric ratio of silicon rubber to catalyst (100 to 5 parts by weight) was used, andthe mix was degassed for the period of 3 min. Then the silicon rubber was poured gently into thethree printed PLA molds with the suspended steel ball. The system was left to cure for 24 h beforedemolding and the whole demolded assembly had the weight of 560 g.
2.3. Temperature Change
The thermal transient was evaluated by placing the hollow rubber sphere in a two-part cavitymold, Figure 5. The rubber is effectively trapped between the outer surface of the steel sphere and theinner surface of the mold. Heat is then applied from the outside of the mold via flat aluminum platesunder pressure containing electrical heating elements. TCs applied to the external mold are used tomonitor the temperature change over time. Additionally, five TCs are distributed though the thicknessof the rubber to capture the in-situ thermal transient with high accuracy. These TCs are molded into
Polymers 2020, 12, 686 6 of 13
the rubber material to achieve an accurate through thickness heating map in real-time per the locationsin Section 2.1. The model is constructed to effectively represent the test apparatus including the fullmold for simulation [21,24]. Due to the high thermal conductivity of the aluminum cavity mold, theinterior temperature at the rubber surface can be assumed uniform. The simulations confirm this andshow less than 0.0001 ◦C of difference in temperature on the inner cavity surface of the aluminummold during the full simulation [21].
Polymers 2020, 12, x FOR PEER REVIEW 6 of 13
plates under pressure containing electrical heating elements. TCs applied to the external mold are
used to monitor the temperature change over time. Additionally, five TCs are distributed though the
thickness of the rubber to capture the in‐situ thermal transient with high accuracy. These TCs are
molded into the rubber material to achieve an accurate through thickness heating map in real‐time
per the locations in Section 2.1. The model is constructed to effectively represent the test apparatus
including the full mold for simulation [21,24]. Due to the high thermal conductivity of the aluminum
cavity mold, the interior temperature at the rubber surface can be assumed uniform. The simulations
confirm this and show less than 0.0001 ℃ of difference in temperature on the inner cavity surface of
the aluminum mold during the full simulation [21].
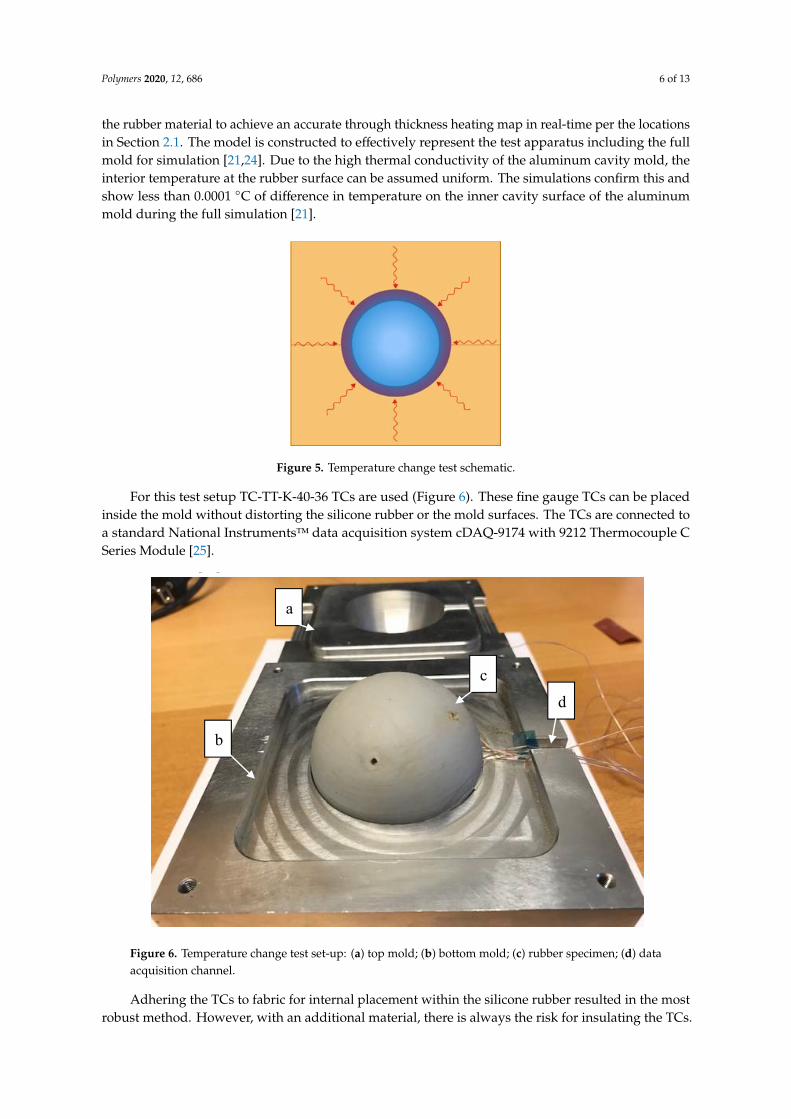
Figure 5. Temperature change test schematic.
For this test setup TC‐TT‐K‐40‐36 TCs are used (Figure 6). These fine gauge TCs can be placed
inside the mold without distorting the silicone rubber or the mold surfaces. The TCs are connected
to a standard National Instruments™ data acquisition system cDAQ‐9174 with 9212 Thermocouple
C Series Module [25].
Figure 6. Temperature change test set‐up: (a) top mold; (b) bottom mold; (c) rubber specimen; (d) data
acquisition channel.
Adhering the TCs to fabric for internal placement within the silicone rubber resulted in the most
robust method. However, with an additional material, there is always the risk for insulating the TCs.
a
b
c
d
Figure 5. Temperature change test schematic.
For this test setup TC-TT-K-40-36 TCs are used (Figure 6). These fine gauge TCs can be placedinside the mold without distorting the silicone rubber or the mold surfaces. The TCs are connected toa standard National Instruments™ data acquisition system cDAQ-9174 with 9212 Thermocouple CSeries Module [25].
Polymers 2020, 12, x FOR PEER REVIEW 6 of 13
plates under pressure containing electrical heating elements. TCs applied to the external mold are
used to monitor the temperature change over time. Additionally, five TCs are distributed though the
thickness of the rubber to capture the in‐situ thermal transient with high accuracy. These TCs are
molded into the rubber material to achieve an accurate through thickness heating map in real‐time
per the locations in Section 2.1. The model is constructed to effectively represent the test apparatus
including the full mold for simulation [21,24]. Due to the high thermal conductivity of the aluminum
cavity mold, the interior temperature at the rubber surface can be assumed uniform. The simulations
confirm this and show less than 0.0001 ℃ of difference in temperature on the inner cavity surface of
the aluminum mold during the full simulation [21].
Figure 5. Temperature change test schematic.
For this test setup TC‐TT‐K‐40‐36 TCs are used (Figure 6). These fine gauge TCs can be placed
inside the mold without distorting the silicone rubber or the mold surfaces. The TCs are connected
to a standard National Instruments™ data acquisition system cDAQ‐9174 with 9212 Thermocouple
C Series Module [25].
Figure 6. Temperature change test set‐up: (a) top mold; (b) bottom mold; (c) rubber specimen; (d) data
acquisition channel.
Adhering the TCs to fabric for internal placement within the silicone rubber resulted in the most
robust method. However, with an additional material, there is always the risk for insulating the TCs.
a
b
c
d
Figure 6. Temperature change test set-up: (a) top mold; (b) bottom mold; (c) rubber specimen; (d) dataacquisition channel.
Adhering the TCs to fabric for internal placement within the silicone rubber resulted in the mostrobust method. However, with an additional material, there is always the risk for insulating the TCs.

Polymers 2020, 12, 686 7 of 13
In order to assess this risk, a test was performed to evaluate the potential insulting impact of twodifferent adhesives; LOCTITE super glue precision and LOCTITE EA 9466 which is a two-part epoxyglue. The two adhesives were then compared with a bare TC, without glue, as a control.
2.4. Volume Change
Thermal expansion of CS25 silicone rubber was measured on a Q400 TA instrument, thermomechanicalanalyzer (TMA) [26] in standard mode which is recommended for most solid materials. A preload of0.01 N was applied to the sample covered by two layers of aluminum foils on top and bottom to ensuregood contact or remove slack. An applied force of 0.05 N was considered during the measurementand the heating rate was set to 5 ◦C/min. The thickness of the sample was approximately 2.88 mmand the temperature ramped from 30 ◦C to 200 ◦C. The temperature range was initially chosento be in the compatible zone with generic aerospace grade epoxy resin systems such as HexcelHexPly®M21E/IMA [27–29]. M21E resin used for structural PMCs, has a complex formulation thatincludes three types of epoxy, a hardener, and two thermoplastic polymers and has been involved in anumber of studies [30]. The curing properties are well documented, and this makes M21E an idealbenchmarking material for processing characterization procedures. The sample was held at 30 ◦C for5 min at the beginning of the test. The data from the second heating cycle was used to plot the relevantfigures. The volume change test can be conducted using a TMA device [31]. TMA can be used to detectboth linear and volumetric material expansion due to increasing temperature. This type of testing canbe used to find more precise coefficients of thermal expansion for the silicone rubber material [31].
2.5. Pressure Change
The pressure transient is captured by placing the hollow rubber sphere in a two-part cavity mold.Heat is then applied from the outside of the mold. A series of real-time pressure sensing devicesare embedded in the mold to obtain pressure on the outer surface of the rubber. In this study, theTactilus®Free Form Sensor System produced by Sensor Products, Inc. [32] is used. Using this systemreal-time surface pressure can be obtained inside the mold coincident with the temperature readings.Three dynamic pressure sensors are used (Figure 7a), and the data acquisition software collects min,max, and average surface pressure on the sensors collectively. An individual sensor was measured atapproximately 3.0 × 6.0 × 0.27 mm and is made of a flexible material that conforms to the shape of themold. A schematic of the sensor placement inside the mold can be seen in Figure 7b. The pressuresensors are extremely thin and can be place inside the mold without significantly changing the surfacecontact (Figure 7c).
Polymers 2020, 12, x FOR PEER REVIEW 7 of 13
In order to assess this risk, a test was performed to evaluate the potential insulting impact of two different adhesives; LOCTITE super glue precision and LOCTITE EA 9466 which is a two-part epoxy glue. The two adhesives were then compared with a bare TC, without glue, as a control.
2.4. Volume Change
Thermal expansion of CS25 silicone rubber was measured on a Q400 TA instrument, thermomechanical analyzer (TMA) [26] in standard mode which is recommended for most solid materials. A preload of 0.01 N was applied to the sample covered by two layers of aluminum foils on top and bottom to ensure good contact or remove slack. An applied force of 0.05 N was considered during the measurement and the heating rate was set to 5 ˚C/min. The thickness of the sample was approximately 2.88 mm and the temperature ramped from 30 ˚C to 200 ˚C. The temperature range was initially chosen to be in the compatible zone with generic aerospace grade epoxy resin systems such as Hexcel HexPly® M21E/IMA [27–29]. M21E resin used for structural PMCs, has a complex formulation that includes three types of epoxy, a hardener, and two thermoplastic polymers and has been involved in a number of studies [30]. The curing properties are well documented, and this makes M21E an ideal benchmarking material for processing characterization procedures. The sample was held at 30 ˚C for 5 min at the beginning of the test. The data from the second heating cycle was used to plot the relevant figures. The volume change test can be conducted using a TMA device [31]. TMA can be used to detect both linear and volumetric material expansion due to increasing temperature. This type of testing can be used to find more precise coefficients of thermal expansion for the silicone rubber material [31].
2.5. Pressure Change
The pressure transient is captured by placing the hollow rubber sphere in a two-part cavity mold. Heat is then applied from the outside of the mold. A series of real-time pressure sensing devices are embedded in the mold to obtain pressure on the outer surface of the rubber. In this study, the Tactilus® Free Form Sensor System produced by Sensor Products, Inc. [32] is used. Using this system real-time surface pressure can be obtained inside the mold coincident with the temperature readings. Three dynamic pressure sensors are used (Figure 7a), and the data acquisition software collects min, max, and average surface pressure on the sensors collectively. An individual sensor was measured at approximately 3.0 x 6.0 x 0.27 mm and is made of a flexible material that conforms to the shape of the mold. A schematic of the sensor placement inside the mold can be seen in Figure 7b. The pressure sensors are extremely thin and can be place inside the mold without significantly changing the surface contact (Figure 7c).
(a) (b) (c)
Figure 7. Sensing system: (a) at style dynamic pressure sensor; (b) Pressure sensor distribution inside the mold; (c) Open mold with rubber sample and pressure sensor.
The temperature range was initially chosen to be in the compatible zone with generic aerospace grade epoxy resin systems such as Hexcel HexPly® M21E/IMA [29]. However, as the pressure limit for the sensors was designed to be 20 bar, and there was no gap in the test specimen-mold configuration in order to prevent uncontrolled convection, neither the composite press nor the pressure sensors were able to handle the pressures predicted from the preliminary simulations [21].
Figure 7. Sensing system: (a) at style dynamic pressure sensor; (b) Pressure sensor distribution insidethe mold; (c) Open mold with rubber sample and pressure sensor.
The temperature range was initially chosen to be in the compatible zone with generic aerospacegrade epoxy resin systems such as Hexcel HexPly®M21E/IMA [29]. However, as the pressure limit forthe sensors was designed to be 20 bar, and there was no gap in the test specimen-mold configuration inorder to prevent uncontrolled convection, neither the composite press nor the pressure sensors wereable to handle the pressures predicted from the preliminary simulations [21]. Thus, the temperature

Polymers 2020, 12, 686 8 of 13
range was modified to a reasonable pressure range, where the whole assembly was cooled to 5 ◦C andabruptly brought to room temperature (22.3 ◦C).
2.6. Processing Mold Design
The final clamshell mold was designed to replicate a situation that would be observed in trappedrubber processing of polymer matrix composites components (Figure 8). Aluminum 6061-T6 wasselected for the mold due to both its machinability, high thermal conductivity, and thermal stabilityat the temperatures and pressures typically used to process thermoset composite components [33].The cavity was designed to have an inner diameter of 60.00 mm and a surface roughness of around0.80 micrometers. Each half of the clamshell mold is 60.00 mm tall. This large thickness ensures evenheat flux on the outer surface of the silicone rubber independent of the surface-to-surface proximityof the inner cavity and outer surface. A small channel is included in the mold for the TCs andpressure sensor wires. The channel is designed so that there is no stress on the wires during testing.Mold alignment is achieved by use of the locking square shape that is recessed on the lower partand embossed on the upper part. This alignment shape has a tolerance of 50 micrometers laterally.Additionally, the processing mold is designed to have a high surface flatness, ensuring good thermalconductivity when used for plate-based heating in a composite press or similar processing apparatus.
Polymers 2020, 12, x FOR PEER REVIEW 8 of 13
Thus, the temperature range was modified to a reasonable pressure range, where the whole assembly
was cooled to 5 ˚C and abruptly brought to room temperature (22.3 ˚C).
2.6. Processing Mold Design
The final clamshell mold was designed to replicate a situation that would be observed in trapped
rubber processing of polymer matrix composites components (Figure 8). Aluminum 6061‐T6 was
selected for the mold due to both its machinability, high thermal conductivity, and thermal stability
at the temperatures and pressures typically used to process thermoset composite components [33].
The cavity was designed to have an inner diameter of 60.00 mm and a surface roughness of around
0.80 micrometers. Each half of the clamshell mold is 60.00 mm tall. This large thickness ensures even
heat flux on the outer surface of the silicone rubber independent of the surface‐to‐surface proximity
of the inner cavity and outer surface. A small channel is included in the mold for the TCs and pressure
sensor wires. The channel is designed so that there is no stress on the wires during testing. Mold
alignment is achieved by use of the locking square shape that is recessed on the lower part and
embossed on the upper part. This alignment shape has a tolerance of 50 micrometers laterally.
Additionally, the processing mold is designed to have a high surface flatness, ensuring good thermal
conductivity when used for plate‐based heating in a composite press or similar processing apparatus.
Figure 8. Aluminum processing mold.
3. Results
The experiments were conducted in order to characterize the rubber material for development
of a simulation‐based tool for predicting local pressures on complex geometries cured using trapped
rubber processing. The tests have been simplified as much as possible to limit the number of
parameters required for characterization and limit convective heat transfer [12,16].
3.1. Preliminary Temperature Change Test
For the adhesive insulation test, the three TCs were placed inside the oven and the temperature
was increased from 22 °C to 200 °C at an approximate ramp rate of 12.5 °C/min while real‐time
temperature data was collected. The three TCs collected similar temperatures. However, there was a
12.7 and 17.8 °C/min lag in the LOCTITE super glue precision and LOCTITE EA 9466, respectively.
After 3 minutes at 200 °C all TCs converged to within 2.0 °C. Because the LOCTITE super glue
precision had a slightly lower effect on the resulting temperature reading, it was selected for sample
preparation. A preliminary temperature change test was conducted to ensure that the embedded TCs
were behaving as expected. This initial test was conducted without the mold by placing the molded
silicone rubber sphere with the embedded TCs and steel sphere in the oven and increasing the
temperature. The rubber test sample was placed inside the oven and the temperature was ramped
from 22 °C to 200 °C at a ramp rate of approximately 7.5 °C/min. The results are shown in Figure 9.
Here, the black curve is the temperature on the outer surface of the rubber, green is the TC that is
Figure 8. Aluminum processing mold.
3. Results
The experiments were conducted in order to characterize the rubber material for development of asimulation-based tool for predicting local pressures on complex geometries cured using trapped rubberprocessing. The tests have been simplified as much as possible to limit the number of parametersrequired for characterization and limit convective heat transfer [12,16].
3.1. Preliminary Temperature Change Test
For the adhesive insulation test, the three TCs were placed inside the oven and the temperature wasincreased from 22 ◦C to 200 ◦C at an approximate ramp rate of 12.5 ◦C/min while real-time temperature datawas collected. The three TCs collected similar temperatures. However, there was a 12.7 and 17.8 ◦C/minlag in the LOCTITE super glue precision and LOCTITE EA 9466, respectively. After 3 min at 200 ◦Call TCs converged to within 2.0 ◦C. Because the LOCTITE super glue precision had a slightly lowereffect on the resulting temperature reading, it was selected for sample preparation. A preliminarytemperature change test was conducted to ensure that the embedded TCs were behaving as expected.This initial test was conducted without the mold by placing the molded silicone rubber sphere with theembedded TCs and steel sphere in the oven and increasing the temperature. The rubber test sample

Polymers 2020, 12, 686 9 of 13
was placed inside the oven and the temperature was ramped from 22 ◦C to 200 ◦C at a ramp rate ofapproximately 7.5 ◦C/min. The results are shown in Figure 9. Here, the black curve is the temperatureon the outer surface of the rubber, green is the TC that is nearest the outer surface of the rubber anddark blue is the TC closest to the interior steel sphere. It was noted that the oven temperature didnot ramp smoothly, but instead resulted in some stepping as the heating elements cycled on and off.Additionally, once the oven reaches 150 ◦C the heating begins to slow and there is an obvious lag ininterior readings. Furthermore, there is a significant heat sink experienced by the TC near the steelsphere. This was expected; however, mitigating this effect would make the test setup more efficient.
Polymers 2020, 12, x FOR PEER REVIEW 9 of 13
nearest the outer surface of the rubber and dark blue is the TC closest to the interior steel sphere. It
was noted that the oven temperature did not ramp smoothly, but instead resulted in some stepping
as the heating elements cycled on and off. Additionally, once the oven reaches 150 °C the heating
begins to slow and there is an obvious lag in interior readings. Furthermore, there is a significant heat
sink experienced by the TC near the steel sphere. This was expected; however, mitigating this effect
would make the test setup more efficient.
Figure 9. Thermal transient in‐situ temperature distribution results.
3.2. Volume Change Test
The volume change was performed on the cured rubber and Figure 10 shows a plot displaying
measured dimension change for the rubber. No volume change parameter was available from the
datasheet of the supplier. The temperature was increased from 30 °C to 200 °C from the second
heating cycle on the TMA instrument. It was found that the change of dimension is almost linear with
a slope of 0.9 μm/°C. This demonstrates the consistent sensitivity of rubber to the heat at the
temperature range tests.
Figure 10. Thermal expansion of CS25 silicone rubber, dimension change vs. temperature.
3.3. Temperature–Volume–Pressure Change Test
The temperature‐volume‐pressure change test consisted of assembling the silicone rubber
sample with the embedded TCs and steel sphere inside the aluminum mold with the pressure sensors
Figure 9. Thermal transient in-situ temperature distribution results.
3.2. Volume Change Test
The volume change was performed on the cured rubber and Figure 10 shows a plot displayingmeasured dimension change for the rubber. No volume change parameter was available from thedatasheet of the supplier. The temperature was increased from 30 ◦C to 200 ◦C from the second heatingcycle on the TMA instrument. It was found that the change of dimension is almost linear with a slope of0.9 µm/◦C. This demonstrates the consistent sensitivity of rubber to the heat at the temperature range tests.
Polymers 2020, 12, x FOR PEER REVIEW 9 of 13
nearest the outer surface of the rubber and dark blue is the TC closest to the interior steel sphere. It
was noted that the oven temperature did not ramp smoothly, but instead resulted in some stepping
as the heating elements cycled on and off. Additionally, once the oven reaches 150 °C the heating
begins to slow and there is an obvious lag in interior readings. Furthermore, there is a significant heat
sink experienced by the TC near the steel sphere. This was expected; however, mitigating this effect
would make the test setup more efficient.
Figure 9. Thermal transient in‐situ temperature distribution results.
3.2. Volume Change Test
The volume change was performed on the cured rubber and Figure 10 shows a plot displaying
measured dimension change for the rubber. No volume change parameter was available from the
datasheet of the supplier. The temperature was increased from 30 °C to 200 °C from the second
heating cycle on the TMA instrument. It was found that the change of dimension is almost linear with
a slope of 0.9 μm/°C. This demonstrates the consistent sensitivity of rubber to the heat at the
temperature range tests.
Figure 10. Thermal expansion of CS25 silicone rubber, dimension change vs. temperature.
3.3. Temperature–Volume–Pressure Change Test
The temperature‐volume‐pressure change test consisted of assembling the silicone rubber
sample with the embedded TCs and steel sphere inside the aluminum mold with the pressure sensors
Figure 10. Thermal expansion of CS25 silicone rubber, dimension change vs. temperature.
3.3. Temperature–Volume–Pressure Change Test
The temperature-volume-pressure change test consisted of assembling the silicone rubber samplewith the embedded TCs and steel sphere inside the aluminum mold with the pressure sensors at the

Polymers 2020, 12, 686 10 of 13
surface between the rubber and the aluminum. The exterior of the mold was then heated slowly whileboth real-time temperature and pressure data were acquired. The objective of this test was to analyzethe pressure at the interface between the rubber and the outer mold surface during the heat up anddwell cycles similar to those used in composite autoclave processing. The center consists of a solidsteel sphere with a rubber hollow sphere molded around it and then the two-part aluminum clamshellmold is placed around the rubber. As described in detail in Section 2.5, the pressure transducer systemis placed between the aluminum mold and the rubber surface. Three pressure transducers are placedat the rubber–aluminum interface.
In order to establish a baseline for the rubber pressure due to full clamp up of the mold. Pressuredata was taken at the initial temperature. It was also established that there is approximately 2 kPa ofnoise in the sensors. Additionally, there was a pressure peak that occurred during clamp up. This takesapproximately 15 s to dissipate. After the pressure stabilized, the baseline pressure at the initial testtemperature was approximately 76 kPa (760 millibar) at 5 ◦C.
To mitigate convection, the initial rubber test sample and the clamshell mold have a tight fit.Because of this, the pressure-temperature test ranges were selected to observe the change in pressureand temperature change induced by moving the apparatus from an outdoor to an indoor environment.In this test, the apparatus is cooled to approximately 5 ◦C and placed in a room at 22.3 ◦C whileobserving the changes. The full apparatus, aluminum mold with rubber sample, embedded TCs,and pressure sensors, were chilled for 6 h at a temperature of approximately 5 ◦C. Once chilled, theapparatus was moved to an area where the air temperature measured 22.3 ◦C. It took approximately1930 min for the full sample to reach equilibrium at 22.3 ◦C and an internal surface pressure of96.5 kPa. During this time, embedded temperature readings and surface pressure were recorded.The results can be seen in Figure 11. The pressure is normalized such that it is zero at the initial teststart time. The real-time acquisition of in-situ temperature and pressure data demonstrates the viabilityof this approach as a method for characterization of a hyper-elastic materials for developing a virtualprocessing model for TRP design. Based on the data here and the coefficient of thermal expansionmeasured in Section 3.2, it is relatively straight forward to calibrate a computational material model.
Polymers 2020, 12, x FOR PEER REVIEW 10 of 13
at the surface between the rubber and the aluminum. The exterior of the mold was then heated slowly
while both real‐time temperature and pressure data were acquired. The objective of this test was to
analyze the pressure at the interface between the rubber and the outer mold surface during the heat
up and dwell cycles similar to those used in composite autoclave processing. The center consists of a
solid steel sphere with a rubber hollow sphere molded around it and then the two‐part aluminum
clamshell mold is placed around the rubber. As described in detail in Section 2.5, the pressure
transducer system is placed between the aluminum mold and the rubber surface. Three pressure
transducers are placed at the rubber–aluminum interface.
In order to establish a baseline for the rubber pressure due to full clamp up of the mold. Pressure
data was taken at the initial temperature. It was also established that there is approximately 2 kPa of
noise in the sensors. Additionally, there was a pressure peak that occurred during clamp up. This
takes approximately 15 seconds to dissipate. After the pressure stabilized, the baseline pressure at
the initial test temperature was approximately 76 kPa (760 millibar) at 5 °C.
To mitigate convection, the initial rubber test sample and the clamshell mold have a tight fit.
Because of this, the pressure‐temperature test ranges were selected to observe the change in pressure
and temperature change induced by moving the apparatus from an outdoor to an indoor
environment. In this test, the apparatus is cooled to approximately 5 °C and placed in a room at 22.3
°C while observing the changes. The full apparatus, aluminum mold with rubber sample, embedded
TCs, and pressure sensors, were chilled for 6 hours at a temperature of approximately 5 °C. Once
chilled, the apparatus was moved to an area where the air temperature measured 22.3 °C. It took
approximately 1930 minutes for the full sample to reach equilibrium at 22.3 °C and an internal surface
pressure of 96.5 kPa. During this time, embedded temperature readings and surface pressure were
recorded. The results can be seen in Figure 11. The pressure is normalized such that it is zero at the
initial test start time. The real‐time acquisition of in‐situ temperature and pressure data demonstrates
the viability of this approach as a method for characterization of a hyper‐elastic materials for
developing a virtual processing model for TRP design. Based on the data here and the coefficient of
thermal expansion measured in Section 3.2, it is relatively straight forward to calibrate a
computational material model.
Figure 11. Full processing test results; left axis temperature of the embedded thermocouples (grey,
orange, and yellow), yellow dashed line is the trend line of the thermocouple readings, the dashed
black line is the external air temperature, and the right axis displays surface pressure between the
rubber and aluminum clamshell mold, time is displayed in log base 3.
Figure 11. Full processing test results; left axis temperature of the embedded thermocouples (grey,orange, and yellow), yellow dashed line is the trend line of the thermocouple readings, the dashedblack line is the external air temperature, and the right axis displays surface pressure between therubber and aluminum clamshell mold, time is displayed in log base 3.

Polymers 2020, 12, 686 11 of 13
4. Discussion
Overall, the characterization method for TRP materials presented here is thorough and can be usedsomewhat independently of a full understanding of the resin material vitrification process. The overallgeometry and data acquisition system worked as expected, and the experimental data acquired can bedirectly used to model a TRP material in a process modeling simulation. However, there were a coupleof issues encountered and these should be followed up with future studies.
Concerning the specimen geometry and the assembly configuration for testing the followingwas observed and discovered during the study. The geometry of the processing mold was found tobe adequate for testing and constrained the rubber in a way that prevents deviatoric strains whichallows for easier characterization for modeling. The initial materials performed as expected in thistest. For future testing, processing silicone rubbers should be used and molded in a similar way inorder to obtain a hollow sphere of rubber around a solid sphere. The steel sphere at the center of thespecimen was straight forward to align during molding, but did absorb a considerable amount of heat.The characterization method could be improved by using a hollow rigid sphere made of a material thatcould be used in polymer matrix composite processing, in order to reduce the time for the assembly tostabilize thermally.
One of the assumptions made in this characterization study is that the coefficient of thermalexpansion of the rubber is roughly linear above freezing. While this has been verified for the generalcasting silicone rubber used for this initial study, material tailored for TRP will not exhibit a linearbehavior. In order to capture the in-situ readings of the cure profile for TRP, a method must bedeveloped to either account for heat transfer in an air gap (which is not representative of PMCprocessing) or develop a material that behaves like a B-staged composite preform in durometer andthermal conductivity.
With respect to the data acquisition and sensors, the following was observed and discoveredduring the study. While the TC embedding process is repeatable and relatively easy to perform, thereis still some insulation experienced due to the glue used. It could be good to find an adhesive thatworks the same mechanically, but has a higher thermal conductivity or a similar thermal conductivityto that of the TRP material.
The pressure sensor placement was quite difficult. In future studies, the use of a temporary sprayadhesive might be beneficial in fixing the upper sensors positions. Additionally, the current sensorpattern adds approximately 0.54 mm to the diameter of the rubber sphere. Because the rubber spherewas molded to exactly fit the cavity, this produced a slight initial pressure. It may be beneficial forfuture rubber specimens to be molded with a planned 0.54 mm gap, although this could lead to sheardeformation and other problems and the effects should be studied further.
It can be observed in Figure 11 that the thermocouple readings are showing a higher plateau thanexpected at around 11.5 ◦C. This is likely due to the steel sphere not coming fully to equilibrium at5 ◦C. This indicates that more than 6 h is needed for the full assembly to come to equilibrium at thecold temperature.
Regarding the results, the coefficient of thermal expansion measured is in the range for siliconeelastomers, but the pressures are slightly lower than initially predicted. The measured coefficient ofthermal expansion of the CS25 silicone rubber was 286 × 10−6/K. This is within the range for typicalsilicone rubbers reported by AZoM as 250 to 300× 10−6/K [34]. Pressures in processing can be extremelyhigh due to the large Poisson’s ratio of the TRP material [7,31]. However, while the pressures observedhere did exhibit the expected exponential progression with increasing temperature [31], the magnitudewas not as great as predicted in the calculations [21]. Further simulation of the test configuration needsto be completed which includes both the compliance of the bolts and the possibility of gaps caused bythe arrangement of the pressure sensors.
In closing, this initial characterization procedure using a generic, inexpensive molding siliconerubber, demonstrates a straightforward approach to capturing the most important material propertiesfor virtual design and optimization of TRP.
Polymers 2020, 12, 686 12 of 13
5. Conclusions
A study of TRP characterization for composite processing simulation has been presented here.In the broader landscape of high-performance composite processing, there is an open need for autoclavealternatives that allow for faster throughput without sacrificing material performance. TRP allowsmore design freedom with more advanced shapes and less risk of processing failure while maintainingthe possibility for custom distributions of pressures and custom distributions of temperatures, andtherefore high-quality consolidation and curing. There is still some work remaining in order to bring thisresearch to a standardized characterization for simulating TRP. However, this study provides an initialmethod for a characterization framework aimed at filling the gap in specialized rubber material datarequired for TRP modeling. This should make it feasible to simulate processing for new and potentiallycomplex or more automated polymer matrix composite component manufacturing processes.
Most importantly, the work presented here demonstrates the viability of this straightforwardcharacterization approach for determining physical parameters required for developing a computationalmaterial model for simulating TRP. With only two types of testing—a high precision measurement of thevolume change to determine the coefficient of thermal expansion, and a combination of in-situ temperatureand pressure measurements—a computational material model can be developed. This approach can beused in the future to aid in the development of tailored nanoparticle conductivity optimization of thetrapped elastomeric material.
Author Contributions: Conceptualization, B.J.B.; Methodology, P.K. and B.J.B.; Software, T.B.; Validation, P.K. andB.J.B.; Investigation, P.K., T.B., and B.J.B.; Resources, B.J.B.; Data curation, T.B., P.K., and B.J.B.; Writing—originaldraft preparation, P.K. and B.J.B.; Writing—review and editing, P.K., T.B., and B.J.B.; Visualization, T.B. and B.J.B.;Supervision, B.J.B.; Project administration, B.J.B.; Funding acquisition, B.J.B. All authors have read and agreed tothe published version of the manuscript.
Funding: This research was funded by Vinnova, grant number 2018-04261.
Acknowledgments: We would like to thank Hans Sjöberg for his support in manufacturing.
Conflicts of Interest: The authors declare no conflict of interest.
References
1. Fernlund, G.; Rahman, N.; Courdji, R.; Bresslauer, M.; Poursartip, A.; Willden, K.; Nelson, K. Experimentaland numerical study of the effect of cure cycle, tool surface, geometry, and lay-up on the dimensional fidelityof autoclave-processed composite parts. Compos. Part A 2002, 33, 341–351.
2. Maistros, G.M.; Partridge, I.K. Monitoring autoclave cure in commercial carbon fibre/epoxy composites.Compos. Part B 1998, 29, 245–250. [CrossRef]
3. Centea, T.; Grunenfelder, L.K.; Nutt, S.R. A review of out-of-autoclave prepregs—Material properties, processphenomena, and manufacturing considerations. Compos. Part A 2015, 70, 132–154. [CrossRef]
4. Anderson, J.P.; Altan, M.C. Properties of Composite Cylinders Fabricated by Bladder Assisted CompositeManufacturing. J. Eng. Mater. Technol. 2012, 134. [CrossRef]
5. Renaudin, J.P.; Renard, P. Method of Manufacturing a Golf Shaft of Complex Shape by Internal BladderPressurization. U.S. Patent 6071460, 15 August 1997.
6. Lion, A.; Diercks, N.; Caillard, J. One the directional approach in constitutive modelling: A generalthermomechanical framework and exact solutions for Mooney-Rivlin type elasticity in each direction. Int. J.Solids Struct. 2013, 50, 2518–2526. [CrossRef]
7. Kemp, D.N. Fixed-Volume, Trapped Rubber Molding Method. U.S. Patent 4889668, 26 December 1989.8. Barraclough, D.J. Molding of Composite Materials. U.S. Patent 4624820, 25 November 1986.9. Hatch, D.M.; Larsen, R.J. High Temperature Consolidation Process. U.S. Patent 4409048, 11 October 1975.10. Baran, I.; Çınar, K.; Ersoy, N.; Akkerman, R.; Hattel, J. A Review on the Mechanical Modeling of Composite
Manufacturing Processes. Arch. Comput. Methods Eng. 2016, 24, 365–395. [CrossRef] [PubMed]11. Gray, D.S.; Tien, J.; Chen, C.S. High-Conductivity Elastomeric Electronics. Adv. Mat. 2004, 16, 393–397.
[CrossRef]

Polymers 2020, 12, 686 13 of 13
12. Sarrazin, H.; Kim, B.; Ahn, S.H. Springer GS Effects of processing temperature and lay-up on springback.J. Compos. Mater. 1995, 29, 1278–1294. [CrossRef]
13. Gigliotti, M.; Wisnom, M.R.; Potter, D. Development of curvature during the cure of AS4/8552 [0/90]unsymmetric composite plates. Compos. Sci. Technol. 2003, 63, 187–197. [CrossRef]
14. Johnston, A. An Integrated Model of the Development of Process-Induced Deformation in AutoclaveProcessing of Composite Structures. Ph.D. Thesis, The University of British Columbia, Vancouver, BC,Canada, 1997.
15. Bogetti, T.A.; Gillespie, J.W., Jr. Process-induced stress and deformation in thick-section thermoset compositelaminates. J. Compos. Mater. 1992, 26, 626–660. [CrossRef]
16. Bogetti, T.A.; Gillipse, J.W. Processing-Induced Stress and Deformation in thick Section Thermosetting CompositeLaminates; CCM Report; University of Delaware: Newark, DE, USA, 1989.
17. Ruiz, E.; Trochu, F. Numerical analysis of cure temperature and internal stresses in thin and thick RTM parts.Compos. A 2005, 36, 806–826. [CrossRef]
18. Young, W.B. Compacting pressure and cure cycle for processing of thick composite laminates. Compos. Sci.Technol. 1995, 54, 299–306. [CrossRef]
19. Sánchez-Hidalgo, R.; Blanco, C.; Menendez, R.; Verdejo, R.; López-Manchado, M.A. Multifunctional SiliconeRubber Nanocomposites by Controlling the Structure and Morphology of Graphene Material. Polymers 2019,11, 449. [CrossRef] [PubMed]
20. Keohan, F.; Wei, X.F.; Wongsarnpigoon, A.; Lazaro, E.; Darga, J.E.; Grill, W.M. Fabrication and evaluationof conductive elastomer electrodes for neural stimulation. J. Biomater. Sci. 2007, 18, 1057–1073. [CrossRef][PubMed]
21. Blinzler, B.J.; Khalili, P. Trapped Rubber Processing Simulation for High Performance/High Rate Processing.In Proceedings of the SAMPE Europe Conference, Nantes, France, 18–19 September 2019.
22. SKF (Svenska Kullagerfabriken), A.B. Material for Bearing Rings and Rolling Elements, SKF Material PropertiesData Sheet; SKF: Gothenburg, Sweden, 2019.
23. ZYYX Labs A.B. ZYYX pro User Manual; ZYYX: Gothenburg, Sweden, 2018.24. Blinzler, B.J.; Khalili, P. High Performance/ High Rate Composite Processing with Trapped Rubber.
In Proceedings of the International Conference of Composite Materials (ICCM22), Melbourne, Australia,12–16 August 2019.
25. National Instruments Corp. LabVIEW™ Simulation Interface Toolkit User Guide with Simulink®for NI-DAQ™;National Instruments: Austin, TX, USA, 2003.
26. TA Instruments-Waters LLC. TMA (Thermomechanical Analyzer) Q Series Getting Started Guide, Revision D; TAInstruments: New Castle, DE, USA, 2006.
27. Ersoy, N.; Potter, K.; Wisnom, M.R.; Clegg, M.J. Development of spring-in angle during cure of a thermosettingcomposite. Compos. A 2005, 36, 1700–1706. [CrossRef]
28. Paris, C.; Olivier, P.A.; Bernhart, G. Modelling of the Thermokinetic Behaviour and the Phases Transitions ofa Carbon/Polymeric Composite Submitted to High Heating Rate Ramps. Int. J. Mater. Form. 2010, 3, 639–642.[CrossRef]
29. Ersoy, N.; Garstka, T.; Potter, K.; Wisnom, M.R.; Porter, D.; Clegg, M.; Stringer, G. Development of theproperties of a carbon fibre reinforced thermosetting composite through cure. Compos. Part A 2010, 41,401–409. [CrossRef]
30. Tranchard, P.; Duquesne, S.; Samyn, F.; Estèbe, B.; Bourbigot, S. Kinetic analysis of the thermal decompositionof a carbon fibre-reinforced epoxy resin laminate. J. Anal. Appl. Pyrolysis 2017, 126, 14–21. [CrossRef]
31. Mower, T.M. Thermomechanical behavior of aerospace-grade RTV (silicone adhesive). Int. J. Adhes. Adhes.2018, 87, 64–72. [CrossRef]
32. Sensor Products Inc. Tactilus®4.0 User Guide; Sensor Products: Madison, NJ, USA, 2005.33. Metals Depot®. 6061-T6511 Aluminum Bar, Metals Depot Material Properties Data Sheet; Metals Depot: Clark
County, KY, USA, 2019.34. Granta Design Limited. Properties of Silicone Rubber, AZo Materials; Granta Design: Cambridge, UK, 2001.
© 2020 by the authors. Licensee MDPI, Basel, Switzerland. This article is an open accessarticle distributed under the terms and conditions of the Creative Commons Attribution(CC BY) license (http://creativecommons.org/licenses/by/4.0/).