Embed Size (px)
DESCRIPTION
ELECTRIC POWER PLANTS. HYDROELECTRIC PLANTS. Hydrologic Cycle. http://www1.eere.energy.gov/windandhydro/hydro_how.html. Hydropower to Electric Power. Electrical Energy. Potential Energy. Electricity. Kinetic Energy. Mechanical Energy. Major Hydropower Producers. Example Hoover Dam (US). - PowerPoint PPT Presentation
Citation preview

ELECTRIC POWER PLANTS
HYDROELECTRIC PLANTS

Hydrologic Cycle
http://www1.eere.energy.gov/windandhydro/hydro_how.html

Hydropower to Electric Power
PotentialEnergy
KineticEnergy
ElectricalEnergy
MechanicalEnergy
Electricity

Major Hydropower Producers

Example
Hoover Dam (US)
http://las-vegas.travelnice.com/dbi/hooverdam-225x300.jpg

Guri Dam (Venezuela)
http://www.infodestinations.com/venezuela/espanol/puerto_ordaz/index.shtml

Itaipú Dam (Brazil & Paraguay)
“Itaipu,” Wikipedia.org

Grand Coulee Dam (US)
www.swehs.co.uk/ docs/coulee.html
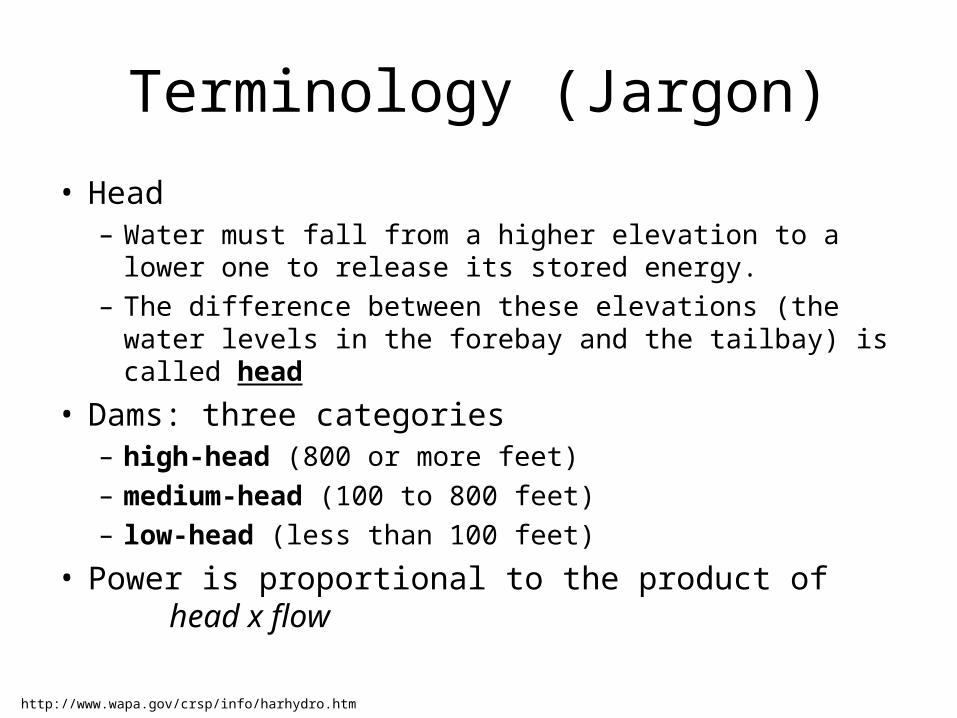
Terminology (Jargon)
• Head – Water must fall from a higher elevation to a lower one to
release its stored energy. – The difference between these elevations (the water levels
in the forebay and the tailbay) is called head
• Dams: three categories– high-head (800 or more feet)– medium-head (100 to 800 feet)– low-head (less than 100 feet)
• Power is proportional to the product of head x flow
http://www.wapa.gov/crsp/info/harhydro.htm

Scale of Hydropower Projects
• Large-hydro– More than 100 MW feeding into a large electricity grid
• Medium-hydro– 15 - 100 MW usually feeding a grid
• Small-hydro– 1 - 15 MW - usually feeding into a grid
• Mini-hydro – Above 100 kW, but below 1 MW– Either stand alone schemes or more often feeding into the grid
• Micro-hydro – From 5kW up to 100 kW – Usually provided power for a small community or rural industry in remote
areas away from the grid.
• Pico-hydro – From a few hundred watts up to 5kW– Remote areas away from the grid.
www.itdg.org/docs/technical_information_service/micro_hydro_power.pdf

Types of Hydroelectric Installation
Boyle, Renewable Energy, 2nd edition, Oxford University Press, 2003

Meeting Peak Demands
• Hydroelectric plants:– Start easily and quickly and change power
output rapidly – Complement large thermal plants (coal and
nuclear), which are most efficient in serving base power loads.
– Save millions of barrels of oil

Meeting Peak Demands
• Hydroelectric plants:– Start easily and quickly and change power
output rapidly – Complement large thermal plants (coal and
nuclear), which are most efficient in serving base power loads.
– Save millions of barrels of oil
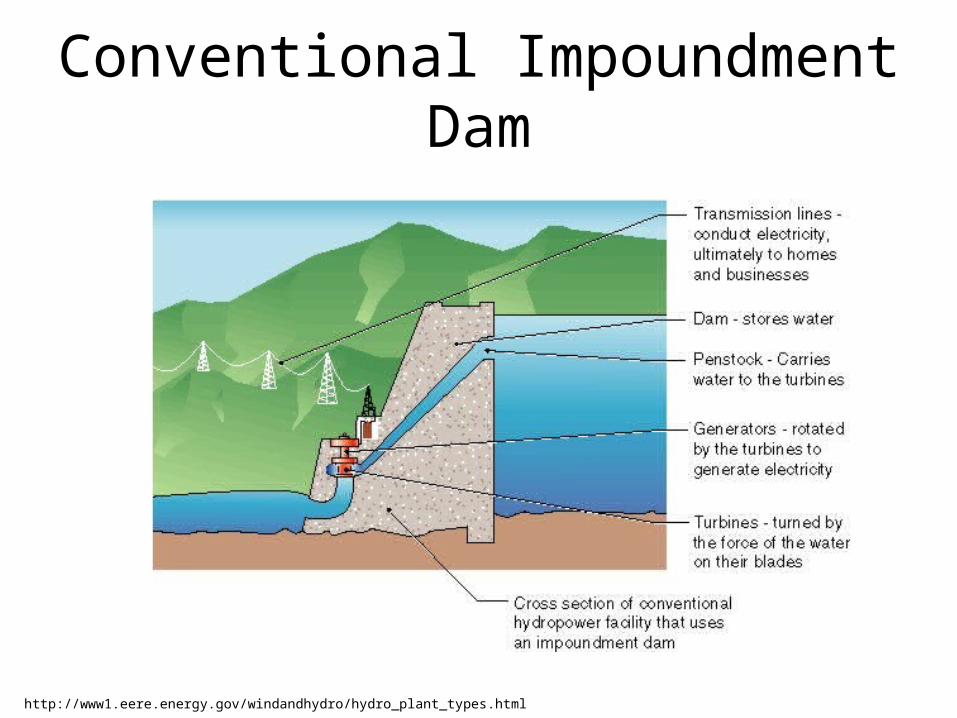
Conventional Impoundment Dam
http://www1.eere.energy.gov/windandhydro/hydro_plant_types.html
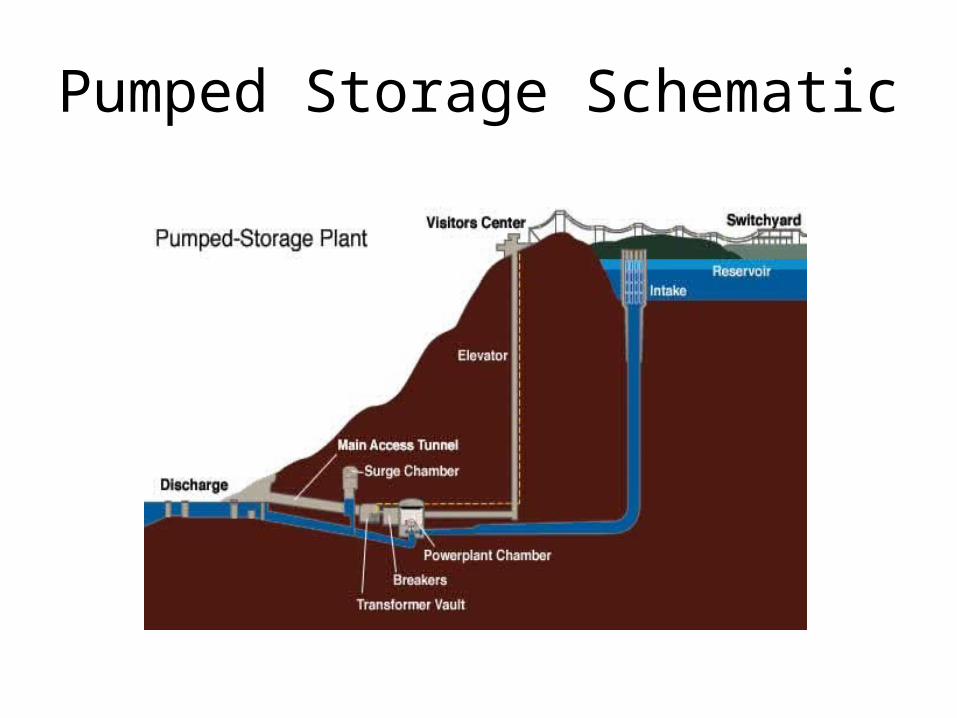
Pumped Storage Schematic
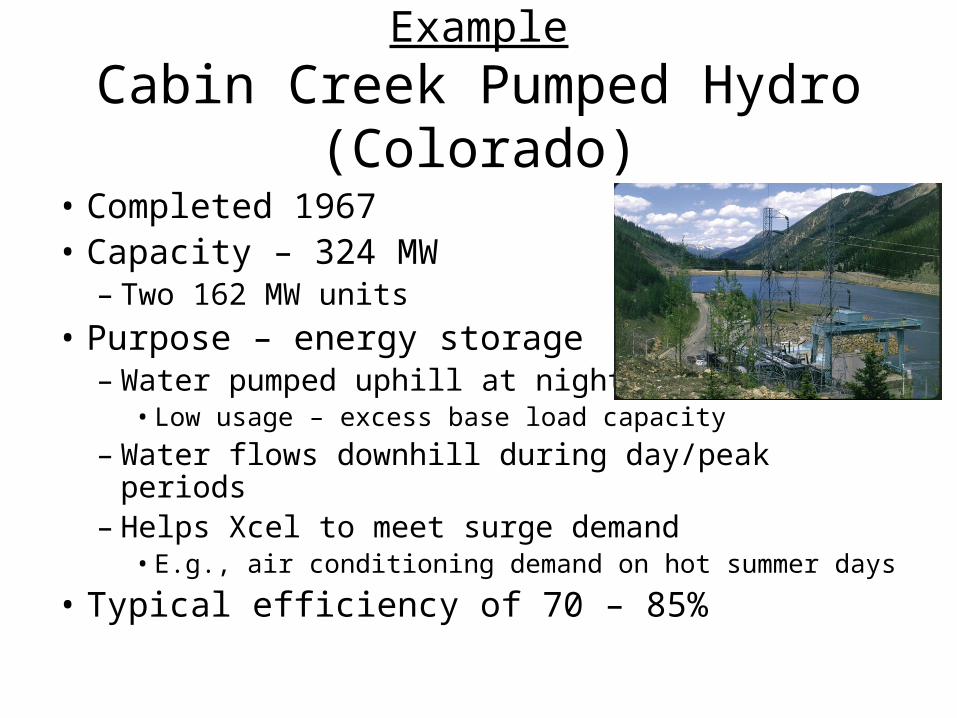
Example
Cabin Creek Pumped Hydro (Colorado)
• Completed 1967• Capacity – 324 MW
– Two 162 MW units
• Purpose – energy storage– Water pumped uphill at night
• Low usage – excess base load capacity
– Water flows downhill during day/peak periods– Helps Xcel to meet surge demand
• E.g., air conditioning demand on hot summer days
• Typical efficiency of 70 – 85%

Turbine Design
Francis TurbineKaplan TurbinePelton TurbineTurgo TurbineNew Designs
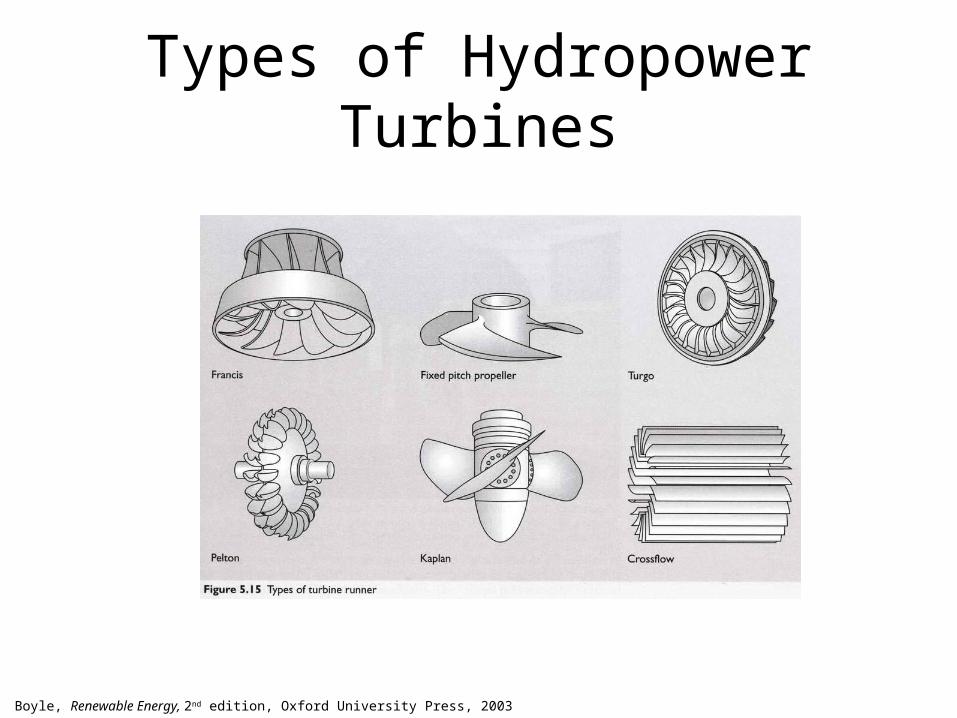
Types of Hydropower Turbines
Boyle, Renewable Energy, 2nd edition, Oxford University Press, 2003

Classification of Hydro Turbines
• Reaction Turbines– Derive power from pressure drop across turbine– Totally immersed in water– Angular & linear motion converted to shaft power– Propeller, Francis, and Kaplan turbines
• Impulse Turbines– Convert kinetic energy of water jet hitting buckets– No pressure drop across turbines– Pelton, Turgo, and crossflow turbines

Schematic of Francis Turbine
Boyle, Renewable Energy, 2nd edition, Oxford University Press, 2003

Francis Turbine Cross-Section
Boyle, Renewable Energy, 2nd edition, Oxford University Press, 2003

Small Francis Turbine & Generator
"Water Turbine," Wikipedia.com

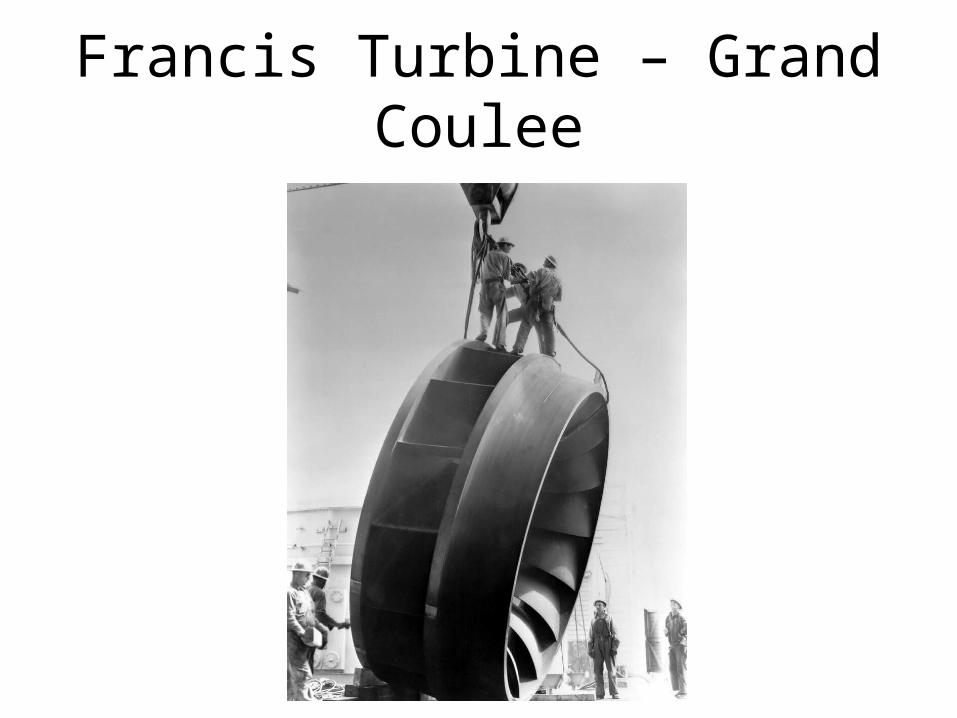
Francis Turbine – Grand Coulee Dam
"Water Turbine," Wikipedia.com

Fixed-Pitch Propeller Turbine
"Water Turbine," Wikipedia.com

Kaplan Turbine Schematic
"Water Turbine," Wikipedia.com
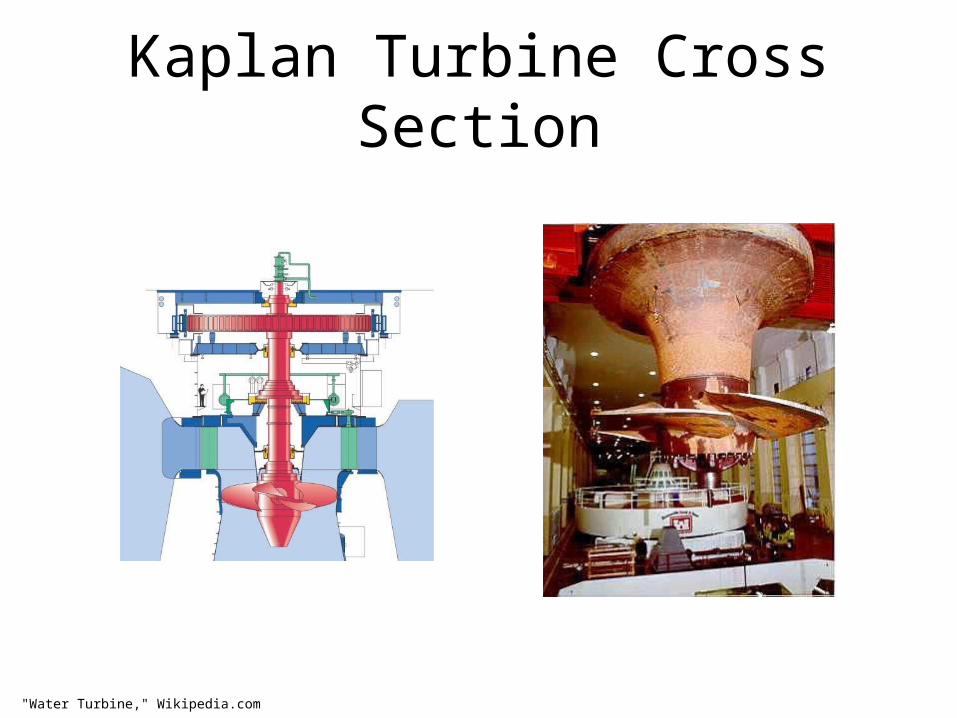
Kaplan Turbine Cross Section
"Water Turbine," Wikipedia.com

Suspended Power, Sheeler, 1939
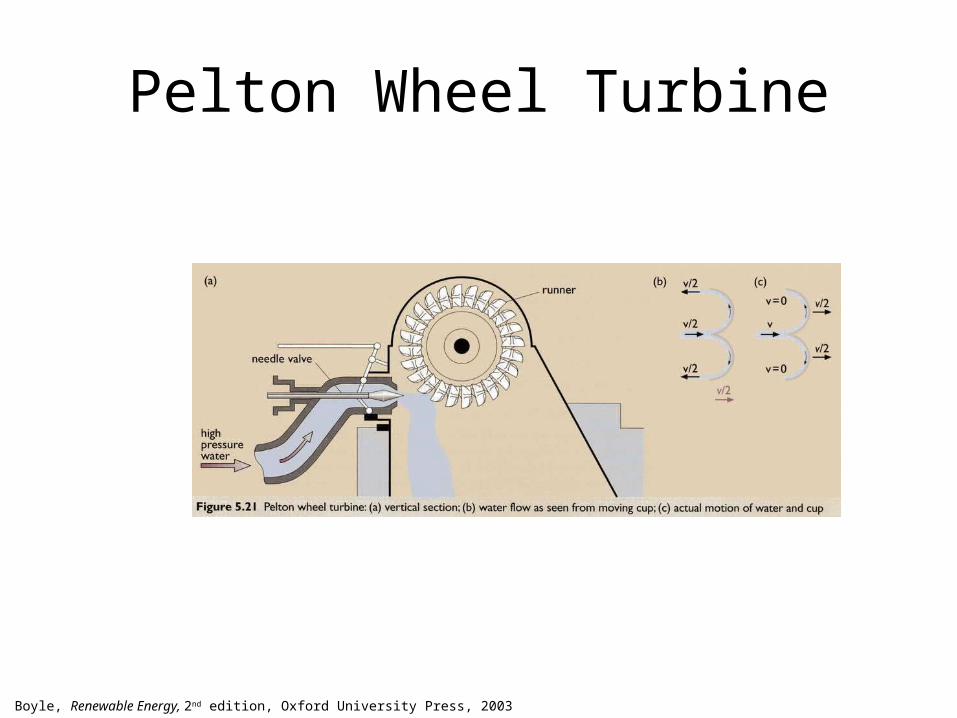
Pelton Wheel Turbine
Boyle, Renewable Energy, 2nd edition, Oxford University Press, 2003

Turgo Turbine
Boyle, Renewable Energy, 2nd edition, Oxford University Press, 2003

Turbine Design Ranges
• Kaplan
• Francis
• Pelton
• Turgo
2 < H < 40
10 < H < 350
50 < H < 1300
50 < H < 250
(H = head in meters)
Boyle, Renewable Energy, 2nd edition, Oxford University Press, 2003
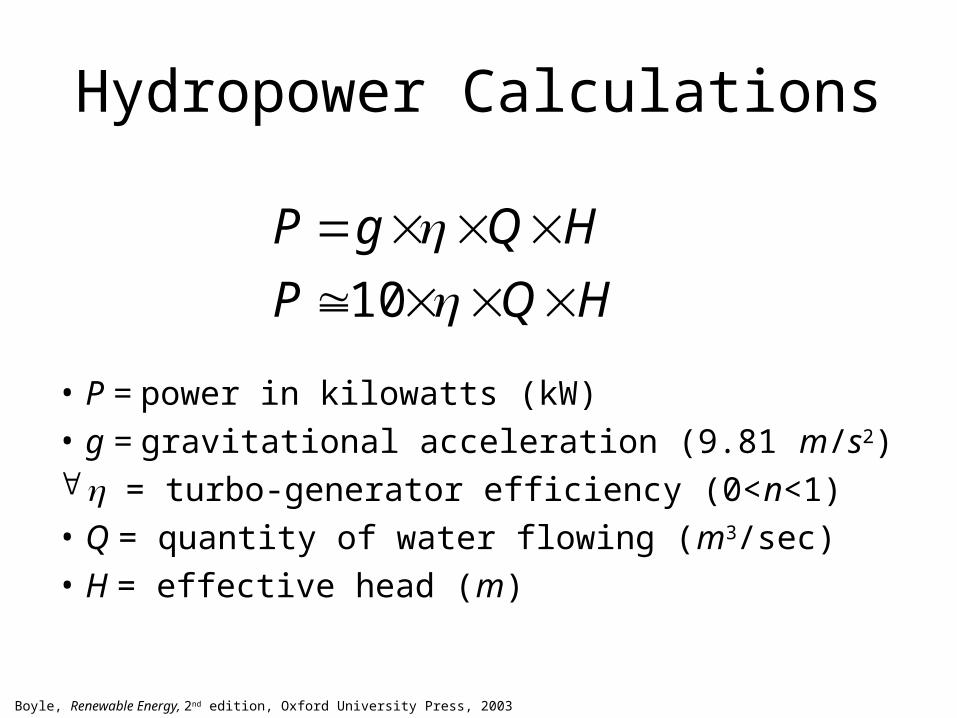
Hydropower Calculations
• P = power in kilowatts (kW)• g = gravitational acceleration (9.81 m/s2) = turbo-generator efficiency (0<n<1)• Q = quantity of water flowing (m3/sec)• H = effective head (m)
HQP
HQgP
10
Boyle, Renewable Energy, 2nd edition, Oxford University Press, 2003
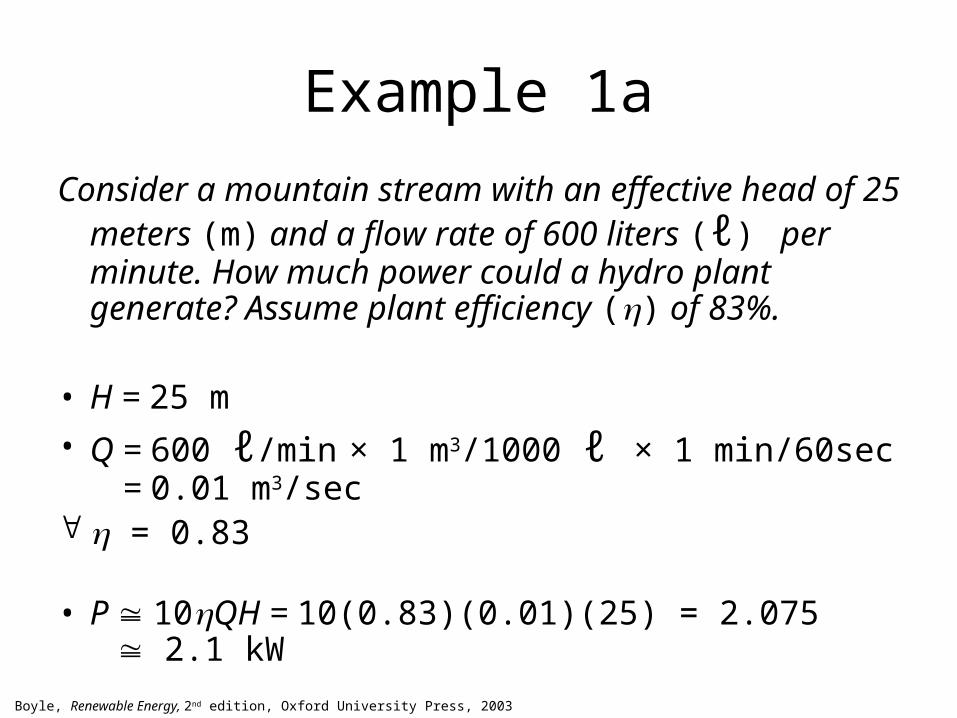
Example 1a
Consider a mountain stream with an effective head of 25 meters (m) and a flow rate of 600 liters (ℓ) per minute. How much power could a hydro plant generate? Assume plant efficiency () of 83%.
• H = 25 m
• Q = 600 ℓ/min × 1 m3/1000 ℓ × 1 min/60secQ = 0.01 m3/sec
= 0.83
• P 10QH = 10(0.83)(0.01)(25) = 2.075P 2.1 kW
Boyle, Renewable Energy, 2nd edition, Oxford University Press, 2003

Example 1b
How much energy (E) will the hydro plant generate each year?
• E = P×tE = 2.1 kW × 24 hrs/day × 365 days/yrE = 18,396 kWh annually
About how many people will this energy support (assume approximately 3,000 kWh / person)?
• People = E÷3000 = 18396/3000 = 6.13• About 6 people
Boyle, Renewable Energy, 2nd edition, Oxford University Press, 2003
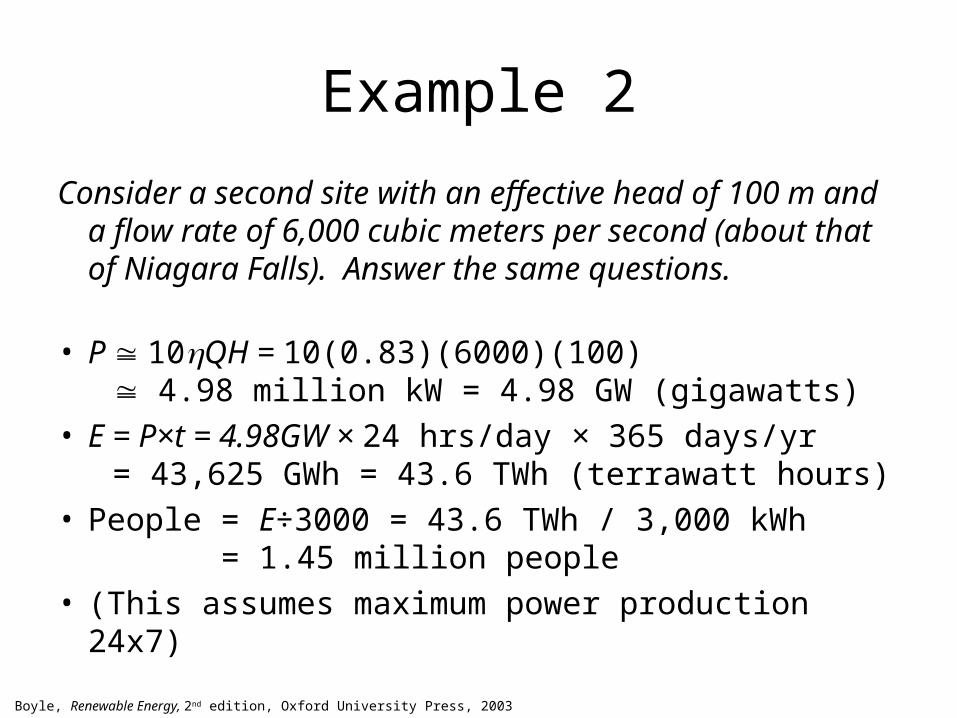
Example 2
Consider a second site with an effective head of 100 m and a flow rate of 6,000 cubic meters per second (about that of Niagara Falls). Answer the same questions.
• P 10QH = 10(0.83)(6000)(100)P 4.98 million kW = 4.98 GW (gigawatts)
• E = P×t = 4.98GW × 24 hrs/day × 365 days/yrE = 43,625 GWh = 43.6 TWh (terrawatt hours)
• People = E÷3000 = 43.6 TWh / 3,000 kWhPeople = 1.45 million people
• (This assumes maximum power production 24x7)Boyle, Renewable Energy, 2nd edition, Oxford University Press, 2003

Production Expense Comparison
Wisconsin Valley Improvement Company, http://www.wvic.com/hydro-facts.htm

Capital Costs of Several Hydro Plants
Note that these are for countries where costs are bound to be lower than for fully industrialized countries
Boyle, Renewable Energy, 2nd edition, Oxford University Press, 2003

Hydropower – Pros and Cons
Positive NegativeEmissions-free, with virtually no CO2, NOX, SOX, hydrocarbons, or particulates
Frequently involves impoundment of large amounts of water with loss of habitat due to land inundation
Renewable resource with high conversion efficiency to electricity (80+%)
Variable output – dependent on rainfall and snowfall
Dispatchable with storage capacity Impacts on river flows and aquatic ecology, including fish migration and oxygen depletion
Usable for base load, peaking and pumped storage applications
Social impacts of displacing indigenous people
Scalable from 10 KW to 20,000 MW Health impacts in developing countries
Low operating and maintenance costs High initial capital costs
Long lifetimes Long lead time in construction of large projects
Francis Turbine – Grand Coulee

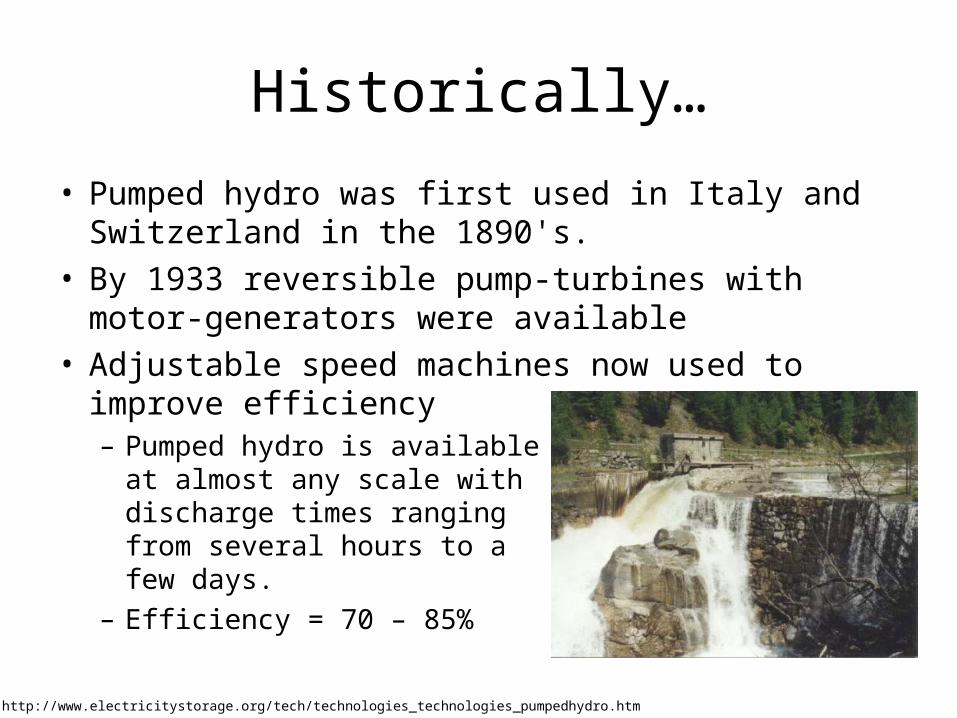
Historically…
• Pumped hydro was first used in Italy and Switzerland in the 1890's.
• By 1933 reversible pump-turbines with motor-generators were available
• Adjustable speed machines now used to improve efficiency– Pumped hydro is available
at almost any scale with discharge times ranging from several hours to a few days.
– Efficiency = 70 – 85%
http://www.electricitystorage.org/tech/technologies_technologies_pumpedhydro.htm
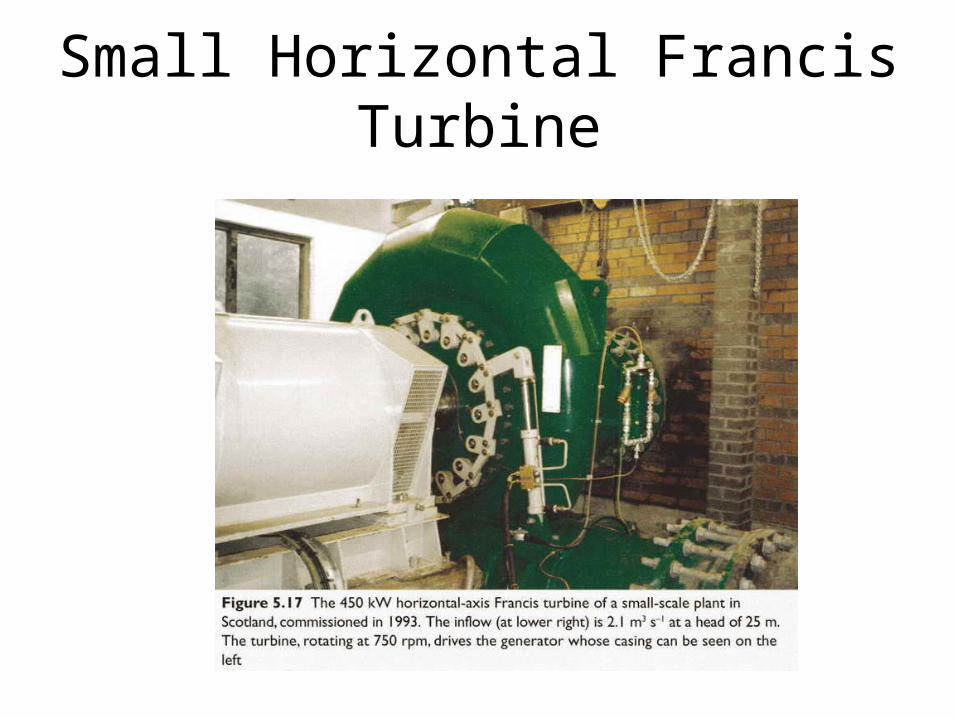
Small Horizontal Francis Turbine

Francis and Turgo Turbine Wheels