Embed Size (px)
Citation preview
Copyright Northern Powergrid (Northeast) Limited, Northern Powergrid (Yorkshire) Plc, British Gas Trading Limited, University of Durham and EA Technology Ltd, 2014
Insight Report Electric Vehicles
DOCUMENT NUMBER CLNR-L092 AUTHORS Robin Wardle, Klara Anna Capova, Peter Matthews, Sandra Bell, Gareth Powells, Harriet Bulkeley, Durham University ISSUE DATE 31/12/2014
Contents 1 Executive Summary ........................................................................................................... 3
2 Introduction ..................................................................................................................... 5
3 Trial Operation ................................................................................................................. 6
3.1 Methodology ............................................................................................................................... 6
3.2 Trial Recruitment ........................................................................................................................ 6
3.3 EV Online Survey ......................................................................................................................... 7
3.4 Qualitative Face-to-Face Visits .................................................................................................... 7
3.5 Monitoring Data and Quality Control ......................................................................................... 8
3.6 Assumptions and Research Questions ........................................................................................ 9
4 Results ............................................................................................................................ 11
4.1 Peak Days Analysis .................................................................................................................... 11
4.2 Seasonal variation: Diurnal Charging Profiles ........................................................................... 18
4.3 Comparison with Reference Test Cell (TC1a) ............................................................................ 25
4.4 Electricity Tariffs for EVs ........................................................................................................... 31
4.5 Home, Public and Workplace Charging..................................................................................... 31
5 Social Science Learning .................................................................................................... 33
5.1 General Findings and Observations .......................................................................................... 33
5.2 Seasonality: Summer and Winter EV Driving ............................................................................ 33
5.2.1 Evening Peak ......................................................................................................................... 34
5.2.2 Weekdays and Weekends ..................................................................................................... 35
5.2.3 Summer and Winter Months ................................................................................................. 35
5.3 Battery Life ................................................................................................................................ 36
5.4 Driving Range and Range Anxiety ............................................................................................. 37
5.5 Acceptability of the EV .............................................................................................................. 38
5.6 Financial Motivation ................................................................................................................. 39
6 Conclusion and Implications ............................................................................................ 41
6.1 Peak Demand and Charging at Home ....................................................................................... 41
6.2 Large Scale Adoption: Suggestions ........................................................................................... 41
1
Copyright Northern Powergrid (Northeast) Limited, Northern Powergrid (Yorkshire) Plc, British Gas Trading Limited, University of Durham and EA Technology Ltd, 2014
6.3 Network Planning ...................................................................................................................... 42
7 Appendix A – Data Validation .......................................................................................... 43
7.1 Data Collection and Handling.................................................................................................... 43
7.2 Validation .................................................................................................................................. 43
7.3 Data availability ......................................................................................................................... 46
7.4 Direct comparison of TC1a and TC6 data .................................................................................. 47
7.5 CCRES Model of Energy Use ...................................................................................................... 50
8 References ...................................................................................................................... 52
Reviewed by Preston Foster, Northern Powergrid Approved by Chris Thompson, Northern Powergrid
Date Issue Status 31/12/14 1.1 For consultation
ACKNOWLEDGEMENTS
The authors would like to acknowledge the contributions the following people and organisations have made to this work and this report.
Dr Charlotte Adams and Dr Steve Lyon of Durham University for literature review and EV-specific survey design, implementation and deployment.
Anya Bramich, Geoff Watson, Lisa Lewins and Lois Warne of Charge Your Car (North) Ltd for detailed data management and preparation.
Element Energy and Northern Powergrid for document content feedback and editing.
2
Copyright Northern Powergrid (Northeast) Limited, Northern Powergrid (Yorkshire) Plc, British Gas Trading Limited, University of Durham and EA Technology Ltd, 2014
1 Executive Summary Changing electricity demand, the electrification of the transport and heating sectors, and the increase in distributed renewable energy sources all present challenges to distribution networks. The Customer-Led Network Revolution project aims to improve our understanding of current and future electricity usage patterns using electrical demand data collected from residential and business customers. Different test cells (TCs), or trials, each with a particular combination of metering type, electricity tariff structure and/or low carbon technology, divide the customers into study groups.
This report describes a CLNR trial examining electric vehicle (EV) usage patterns and network loads arising from EV use (CLNR test cell 6). The trial involved domestic customers who owned an electric vehicle and had access to a home charger, with household electricity loads and EV charging loads being monitored in 143 homes. The quantitative consumption data was supported by an online survey (83 respondents) and face to face interviews (13 respondents) with participants enrolled in the CLNR project. This project provides the largest socio-technical study of domestic EV charging in the UK, sitting alongside other studies such as those supported by Office for Low Emissions Vehicles (OLEV), Ofgem, and Technology Strategy Board (TSB).
Although monitoring was conducted for over a year, data for both house and EV consumption was restricted to a 6 month period (February 2014 to June 14) due to data collection and processing constraints. Nevertheless, with 100 households providing data at any one time, this represents a large and very valuable dataset on EV use and charging loads.
The diurnal profile of weekday charging load averaged across all participants exhibits a significant peak in the evening (0.9kW at around 9pm, broadly equivalent to the house-only consumption peak that occurs at a similar time). The load drops through the overnight period, but during the morning and early evening period the average EV charging load is maintained at about 0.1-0.2kW. The diurnal profile is consistent with the EVs being used primarily as commuting vehicles, where the evening peak correlates with household occupancy as commuters return home and plug-in to charge the EV. The daytime charger demand may be due to shift workers returning home, and the use of some EVs during the day for non-commuting purposes.
The evening peak is not sustained for long and begins to drop after 10pm. This indicates that some vehicles are fully charged by this point and so the average charging load reduces. This is consistent with the expected charging demands of a Nissan Leaf driven daily for approximately 20km (representative of the national average daily trip distance1). This implies that the average charging duration is less than 2 hours, suggesting that there is significant potential to move the charging load out of the evening peak period yet still have vehicles fully charged in the morning.
In the evenings, the variation in EV charging loads is also much greater than the variation in household consumption loads. This indicates that, following the evening commute, EVs begin charging but then some drop out as they are fully charged, while household loads tend to remain on once occupants arrive home in the evening period.
1 National Travel survey database: https://www.gov.uk/government/uploads/system/uploads/attachment_data/file/342160/nts2013-01.pdf
3
Copyright Northern Powergrid (Northeast) Limited, Northern Powergrid (Yorkshire) Plc, British Gas Trading Limited, University of Durham and EA Technology Ltd, 2014
A strong relationship between season and EV consumption was found. An analysis of the daily consumption profiles for each month shows that the evening peak charger demand (up to 0.9kW average for February around 8pm-10pm) gradually reduces for each month studied until June 2014 (the last month of available data) which had a maximum of 0.45kW. This is likely to reflect seasonal EV consumption demand changes, such as additional lighting and heating, as well as reduced battery performance in colder weather.
The household electricity consumption profiles for EV participants were compared with the “control” group in Test Cell 1a (the latter being representative of UK average consumers)2. For all months studied, the EV participants recorded lower average daytime consumption (from 8am until 6pm) than the TC1a group. After this period, the EV participants recorded a higher average evening consumption (typically from 7-9pm) which remained higher than in TC1a until well after midnight. It is reasonable to suggest that the typical participant in the EV trial is less likely to be at home during the day, leading to lower average loads, but following an evening commute the household loads are higher. Despite the differences in diurnal profile of consumption, the average annual household electricity consumption (without the EV charging demand) of EV participants is essentially the same as that of the control group in TC1a.
Conclusions from the quantitative research are supported by the participant interviews. When asked what time of day they charged the car, 54 out of 88 participants responded “evenings” with the next most frequent response being “Anytime/when needed” (12 responses). This is consistent with the diurnal charging profiles reflecting a predominance of evening charging.
When asked what state of charge the battery would be in before they would charge, a total of 58 out of 88 responded: “when the battery is less than half charge” or “less than a quarter charge”. Noting that some EV owners may not always check and record their battery state of charge (hence would struggle to answer the above question accurately), nevertheless the above result would indicate that some vehicles may not be plugged in every night; assuming typical national daily driving distances this would suggest vehicles are plugged in perhaps about once every 3 days. This would be consistent with the < 1kW peak charging load averaged across participants.
While interview participants did notice additional battery consumption during winter months, and recognised this was due to vehicle lighting and heating, they did not report this as being a significant problem for example in terms of reduced range in colder conditions. Despite being EV adopters, when asked about energy consumption, financial considerations were reported as significantly more important (75%) to respondents than environmental concerns (5%).
2 While comparison of the datasets on the same calendar year was not possible, an analysis of weather data shows there was negligible temperature difference between the periods in question, supporting the validity of the comparison.
4
Copyright Northern Powergrid (Northeast) Limited, Northern Powergrid (Yorkshire) Plc, British Gas Trading Limited, University of Durham and EA Technology Ltd, 2014
2 Introduction A major purpose of the CLNR project was to examine in general how smart grid interventions might be designed and implemented, and to understand social responses to such interventions. In this report we examine how EV owners interact with their vehicle and with the distribution network. Through social science interviews we attempt to understand the routines and rhythms which define these EV drivers, the implications for network demands and ways in which this demand may be shaped in future. The project adopts a socio-technical and practice-based approach as the lenses through which to undertake this work, and a range of methodologies across social and engineering sciences is used.
Drawing on 13 qualitative research visits and 83 survey responses from drivers of EVs as well as electricity use data generated by 143 monitored domestic charge points, the report takes a mixed methods approach to explore the EV charging times and practices.
The aims of this research are to study a group of plug-in electric vehicle (EV) drivers over a period of time to understand their EV charging patterns, their charger demand, and their basic household electrical demand profile. An important aspect of this trial is that all of the participants have a domestic charge point installed at their home, and the permanent use of their electric vehicle (either on lease, bought, or as a company car). This enables the study and quantification of domestic properties with plug-in electric vehicles, in order to understand and appreciate the loading these properties place on the distribution network, and whether this loading is likely to introduce serious constraints now, or in future.
5
Copyright Northern Powergrid (Northeast) Limited, Northern Powergrid (Yorkshire) Plc, British Gas Trading Limited, University of Durham and EA Technology Ltd, 2014
3 Trial Operation
3.1 Methodology
Social science research methods consist of two main approaches: a survey and a qualitative interview/tour. The survey instrument was designed in order to capture current levels of engagement with and opportunities for flexibility, that is to say the potential to adjust the diurnal charging profile while still meeting the requirements of the drivers. At a minimum these requirements are equivalent to the charge required to provide the daily EV driving duties, but in practice EV owners also have other requirements, such as confidence that the vehicle can accommodate additional, unplanned trips. The qualitative semi-structured interviews centred on participants’ energy use in general terms, information about occupancy, major electrical loads, heating regimes, thoughts and feelings about electricity use, seasonality and other temporal factors as well as experiences of and attitudes to new and existing tariffs and technologies.
Alongside this, analysis of electrical demand data collected from the trial participants was performed. A basic data validation check was carried out to ensure that readings were physically believable, and without serious defects, following which group electrical demand and consumption properties, such as mean, variability, and totals, over varying time periods, could be calculated. The direct measurements from the field trials could then be matched with survey and interview findings to elaborate and explain observed or reported behaviours. As is shown below, in order to maintain good availability of high quality data the period over which results are reported is less than a calendar year. A comparison of consumption in this test cell with that from the “control” test cell (TC1a) was undertaken for period of time common to both trial datasets.
3.2 Trial Recruitment
A joint partnership between CLNR and Charge Your Car (North) Ltd (CYC) resulted in the recruitment of 143 EV drivers onto the CLNR study. CYC operated the North East’s Plugged in Places project (NE PIP), one of the eight OLEV part-funded Plugged-in-Places (PiP) projects, providing residential, workplace and public charging infrastructure in the North East of England, and was able to recruit some of its residential charger customers to take part in the monitoring programme. Customers signing up to receive a fully-subsidised3 residential charge point agreed to an additional household consumption meter and to provide metering data to CLNR for analysis by Durham University.
Customers accepting one of the subsidised charge points did have to own, or have access to, the use of plug-in electric vehicle as a condition of receiving the subsidy and the installation; thus no, or very little, of the recorded data would be expected to be invalid through non-use of the charge point. Most customers had been recruited to the trials and had received their vehicle by early autumn 2013.
3 Note that this only applies to the equipment and the installation. The customer is still responsible for their electricity bill.
6
Copyright Northern Powergrid (Northeast) Limited, Northern Powergrid (Yorkshire) Plc, British Gas Trading Limited, University of Durham and EA Technology Ltd, 2014
3.3 EV Online Survey
Customers already recruited to the trial by CYC were approached again by CYC to complete an online survey that was developed by both CYC and the CLNR project team and hosted by Durham University using the Bristol Online Survey (BOS) system. The main purpose of this study was to examine current charging behaviours in order to assess future demands upon electrical networks should EV uptake increase.
The survey was thematically divided into three broad sections: demographics, attitudinal responses and energy behaviour. The survey begins by exploring the household composition and socio-demographic make-up of the sample such as age, gender, marital status, occupancy etc. followed by a set of questions related to the electric vehicle.
The second set of questions was designed to inquire into respondent’s attitudes towards energy usage: how aware, knowledgeable and confident people felt about their energy use and energy related purchases. In this section participants were asked to indicate their feeling about what role the government should take in managing energy use and energy markets but these questions are not analysed in this report. Instead, the analysis of energy behaviour, wherein participants were asked to indicate how often, if at all, they save energy by doing a range of energy-saving things, is emphasised.
At the end of the survey participants were also asked about information sources and design support, i.e. who had helped them to make decisions about the most recent energy-related change to their home, and could choose as many of the possible answers as desired.
All respondents were based in the North East of England and at the time of research driving an EV.
3.4 Qualitative Face-to-Face Visits
Thirteen EV owners were interviewed face-to-face. Three were British Gas customers and were all out-of-region (in the Poole, Dorset area), while the remaining ten were all Nissan UK employees in the North East of England.
Each visit conducted in the first round (May – September 2012) was split into three parts; the first being an introductory semi-structured interview focusing on LO1 learning, the second a tour of the participant’s residence and the last being a further semi-structured interview linking the practices and materialities emerging in the first two parts of the visit.
The semi-structured interview focuses on building rapport with the participant while discussing their energy use in general terms. These conversations include information about occupancy, major electrical loads, charging regimes, thoughts and feelings about car and electricity use, seasonality and other temporal factors as well as experiences of and attitudes to new and existing tariffs and technologies. A tour of the premises was participant-led although the participant was prompted by the researcher to talk about all aspects of their electricity use using electrical equipment as catalyst for conversation.
Data collected from the qualitative research was collated and organised through NVivo 9, a qualitative data analysis (QDA) software package. Audio interviews were thematically coded according to a set of initial codes, which then developed iteratively. The coded interview data was analysed using queries and the results transcribed. Seven queries exploring the themes emerging
7
Copyright Northern Powergrid (Northeast) Limited, Northern Powergrid (Yorkshire) Plc, British Gas Trading Limited, University of Durham and EA Technology Ltd, 2014
from the interviews and focusing on different topics were run: charging, evening and night behaviour, technical legacy, economies, prosumers, convenience, and manual queries.
3.5 Monitoring Data and Quality Control
The 143 EV drivers taking part in the trial were supplied with metering equipment that measured and recorded electrical demand at the household level and also of the EV charger. These measurements are independent, so that the total demand of the premises can be calculated as the sum of these two readings. Inevitably, some customers’ data needed to be removed from the study (through metering failure, withdrawal from the trial, and so on) leaving a maximum of 131 customers for study in the monitoring trials. This number is further reduced slightly during analysis and the exact numbers of sample points are reported where appropriate.
Household monitoring started on 06/12/2012 with significant numbers of customers (100+) being monitored from June 2013 onwards. Data collection from residential chargers started on 30/11/2012, with significant (100+) availability of charging data from late-January 2014. Data analysed in this report ran up to early July 2014 for both EV charger and household demand data. Problems with monitoring of EV charging in the earlier period meant that much of the dataset has not been available for study and, as a result, analysis of EV charging with household demand data is limited to the period January-June 2014. Data will continue to be collected by the CLNR-CYC partnership up until the end of March 2015 and it is anticipated that in due course this data will become publicly available.
108 of the EV owners in this study are drawn from employees, or friends and family of employees, of Nissan Motor Manufacturing (UK) Ltd (NMUK), which is in Sunderland, Tyne and Wear. These owners drive a Nissan Leaf as part of an employee lease car scheme, and have a limited ability to charge at work4. This naturally will ensure a certain demographic concentration and this sample bias must be borne in mind. For example, whether owned or leased an EV represents a significant and discretionary investment and this will limit the demographics of the EV adopter group. However, these customers (generally working families, singles or couples) are assumed to be fairly representative of likely current and short-to-medium term future EV owners. Note that the group is not necessarily representative of UK average households, as the data analysis will show.
The quantitative data reported in this document is half-hourly metered consumption (energy) data, converted to equivalent power (kW) data as required. Quality control procedures included:
• Initial bounds checking – identifying unphysical records. If these are clustered, they are removed. If they are not clustered (i.e. not clearly distinct from “good” data) then the associated data record may have systemic problems and is removed from further analysis
• Zero readings in household data were treated as a lack of a record (rather than a valid recording of zero consumption).
• Data availability: an objective was to retain a minimum of 100 households in the dataset, to give some measure of diversity.
4 Nissan has 25 charge points for 250 EVs, and employees are discouraged from relying on workplace charging. A requirement of the lease scheme is that leased car owners must have access to their own or public charging facilities.
8
Copyright Northern Powergrid (Northeast) Limited, Northern Powergrid (Yorkshire) Plc, British Gas Trading Limited, University of Durham and EA Technology Ltd, 2014
• Finally, averaged records were reviewed for consistency against expected behaviour and, for the household (non EV charging) dataset, this was compared against the “control” study TC1a.
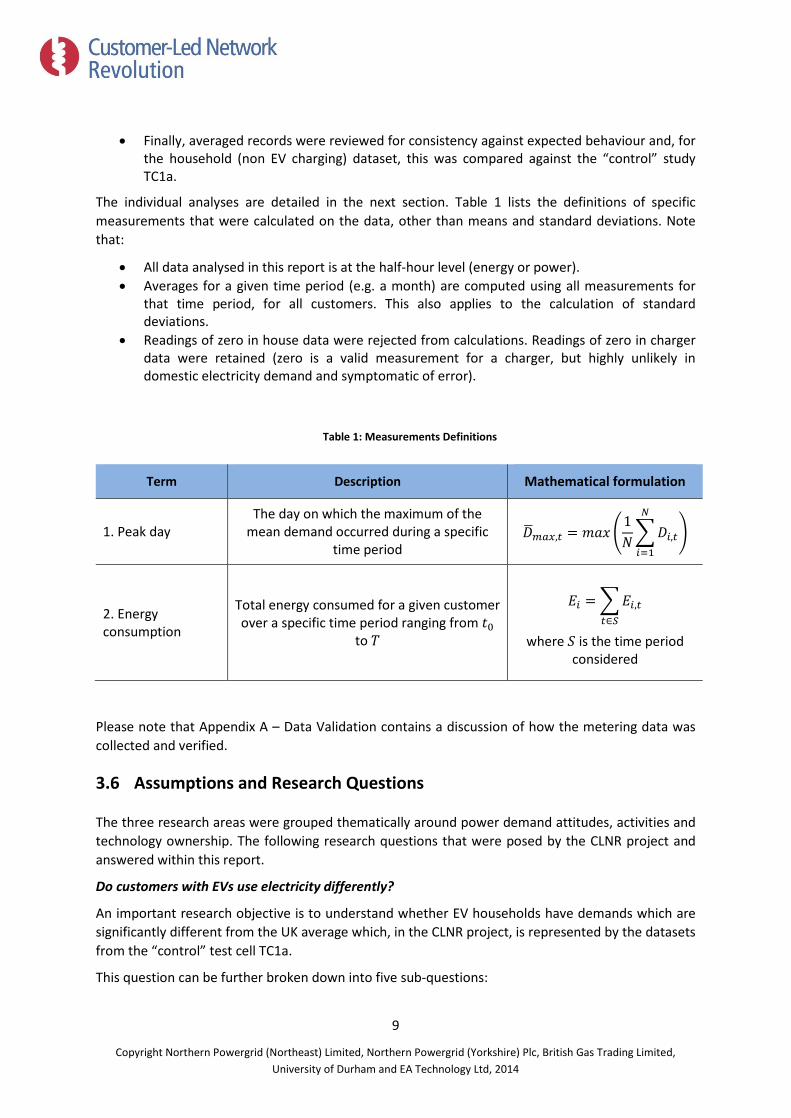
The individual analyses are detailed in the next section. Table 1 lists the definitions of specific measurements that were calculated on the data, other than means and standard deviations. Note that:
• All data analysed in this report is at the half-hour level (energy or power). • Averages for a given time period (e.g. a month) are computed using all measurements for
that time period, for all customers. This also applies to the calculation of standard deviations.
• Readings of zero in house data were rejected from calculations. Readings of zero in charger data were retained (zero is a valid measurement for a charger, but highly unlikely in domestic electricity demand and symptomatic of error).
Table 1: Measurements Definitions
Term Description Mathematical formulation
1. Peak day The day on which the maximum of the
mean demand occurred during a specific time period
𝐷𝐷�𝑚𝑚𝑚𝑚𝑚𝑚,𝑡𝑡 = 𝑚𝑚𝑚𝑚𝑚𝑚 �1𝑁𝑁�𝐷𝐷𝑖𝑖,𝑡𝑡
𝑁𝑁
𝑖𝑖=1
�
2. Energy consumption
Total energy consumed for a given customer over a specific time period ranging from 𝑡𝑡0
to 𝑇𝑇
𝐸𝐸𝑖𝑖 = �𝐸𝐸𝑖𝑖,𝑡𝑡𝑡𝑡∈𝑆𝑆
where 𝑆𝑆 is the time period considered
Please note that Appendix A – Data Validation contains a discussion of how the metering data was collected and verified.
3.6 Assumptions and Research Questions
The three research areas were grouped thematically around power demand attitudes, activities and technology ownership. The following research questions that were posed by the CLNR project and answered within this report.
Do customers with EVs use electricity differently?
An important research objective is to understand whether EV households have demands which are significantly different from the UK average which, in the CLNR project, is represented by the datasets from the “control” test cell TC1a.
This question can be further broken down into five sub-questions:
9
Copyright Northern Powergrid (Northeast) Limited, Northern Powergrid (Yorkshire) Plc, British Gas Trading Limited, University of Durham and EA Technology Ltd, 2014
• Identify the single day of greatest network stress (maximum (gross) power demand), noting that data is not available for a full year for the group, for both test cells 1a (control) and 6 (EV), and sufficient adjacent days to give a weekday; Saturday and Sunday, and the month that contains those three days (because customers may be disposed to do different things on those days).
• How does the demand of customers with EVs differ (or not) from customers in TC1a for the analysis time periods specified? Produce:
o 48 half-hourly values for mean and standard deviations of demand for each of analysis time period specified, separately for the charger and the general household demand.
• Is the distribution of electricity use on a half-hourly and month-by-month basis different for EV customers than for TC1a baseline customers? Produce comparison mean diurnal profiles comparing test cells 1a and 6, for all months where data is available across the trial.
• What proportion of EV charging is done at home rather than at public (and potentially) free charge points?
• Identify the diurnal profile for EV demand. Given that this will vary between weekend, week day, and season: generate 48 half-hourly values for mean and standard deviation of EV charging demand.
What do the social science findings tell us about EVs?
The social science research conducted as part of CLNR has adopted a socio-technical approach to understanding the provision and use of energy services, in which energy systems are seen as constituted through the continual interaction of both social and technical entities and where demand for energy is produced through and essential to the workings of different practices in homes and businesses (7.5 CCRES Model of Energy Use).
The social science team focused its research activities on charging behaviour, timing of routines, driving experience, and acceptability of the EV amongst trial participants.
10
Copyright Northern Powergrid (Northeast) Limited, Northern Powergrid (Yorkshire) Plc, British Gas Trading Limited, University of Durham and EA Technology Ltd, 2014
4 Results
4.1 Peak Days Analysis
Data availability
In this analysis we identify a series of peak days (days of greatest network stress) and we compare the EV household and charger demand on those days with Test Cell 1a. The days are defined as:
• The calendar day of maximum half-hourly household demand (“peak day”), calculated as the maximum average half-hourly demand. It is an average because the number of customers on each day with valid data fluctuates slightly.
• The nearest Saturday, Sunday and weekday to the peak day. Naturally the peak day itself will be one of these days.
Ideally the day corresponding to the day of peak demand for Test Cell 1a would be used for comparison; however while household data is present in reasonable quantities for approximately 12 months, the TC6 EV charger data is not available in significant quantities before 28/01/2014; on this day the number of participating EV customers having both charger and household data jumps from 26 to 83, as can be seen in Figure 35, and thus the test for peak days will not consider days earlier than 28/01/2014. June 2014 was also discarded from the peak day analysis as a loss of data for part of the month rendered some daily half-hourly values a product of only a small handful of customers (as low as one).
Given these constraints the peak value for household demand was found to have occurred on 12/02/2014 (a Wednesday), with a value of 1.097 kW/customer. On this day there were 131 customer household demands recorded, and 94 customers with both EV and household demands present. The household demand peaks for the period analysed are shown in Figure 1. The previous Saturday and Sunday (08/02/2014 and 09/02/2014) are the closest and highest-demand weekend days and these are chosen to be the weekend of highest network stress for this customer group, with the month of February being analysed at the peak demand month for this purpose. This is summarised below in Table 2.
11
Copyright Northern Powergrid (Northeast) Limited, Northern Powergrid (Yorkshire) Plc, British Gas Trading Limited, University of Durham and EA Technology Ltd, 2014
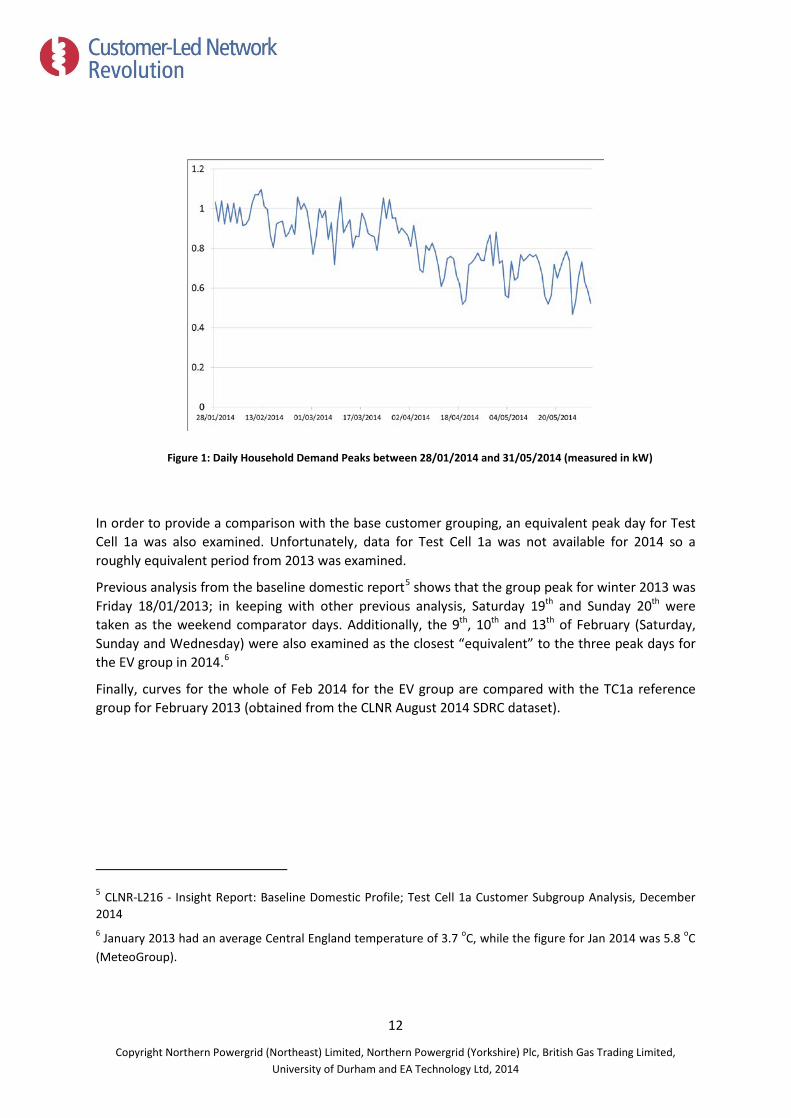
Figure 1: Daily Household Demand Peaks between 28/01/2014 and 31/05/2014 (measured in kW)
In order to provide a comparison with the base customer grouping, an equivalent peak day for Test Cell 1a was also examined. Unfortunately, data for Test Cell 1a was not available for 2014 so a roughly equivalent period from 2013 was examined.
Previous analysis from the baseline domestic report5 shows that the group peak for winter 2013 was Friday 18/01/2013; in keeping with other previous analysis, Saturday 19th and Sunday 20th were taken as the weekend comparator days. Additionally, the 9th, 10th and 13th of February (Saturday, Sunday and Wednesday) were also examined as the closest “equivalent” to the three peak days for the EV group in 2014.6
Finally, curves for the whole of Feb 2014 for the EV group are compared with the TC1a reference group for February 2013 (obtained from the CLNR August 2014 SDRC dataset).
5 CLNR-L216 - Insight Report: Baseline Domestic Profile; Test Cell 1a Customer Subgroup Analysis, December 2014 6 January 2013 had an average Central England temperature of 3.7 oC, while the figure for Jan 2014 was 5.8 oC (MeteoGroup).
12
Copyright Northern Powergrid (Northeast) Limited, Northern Powergrid (Yorkshire) Plc, British Gas Trading Limited, University of Durham and EA Technology Ltd, 2014
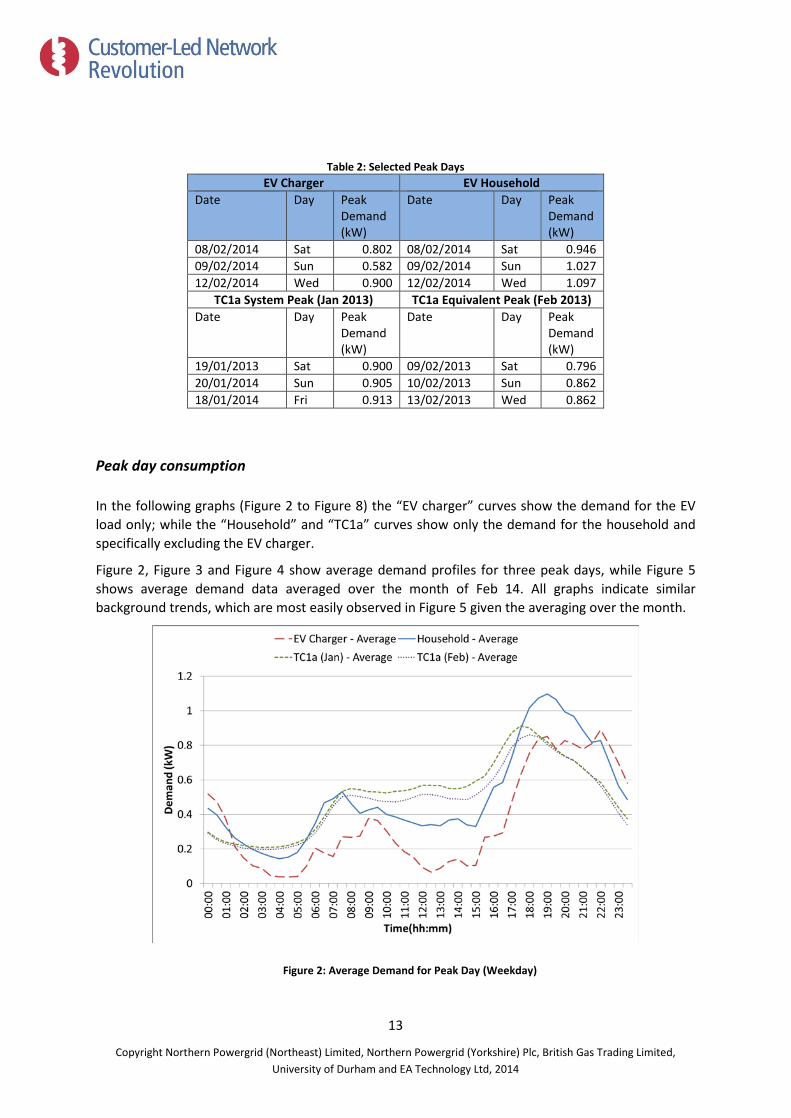
Table 2: Selected Peak Days EV Charger EV Household
Date Day Peak Demand (kW)
Date Day Peak Demand (kW)
08/02/2014 Sat 0.802 08/02/2014 Sat 0.946 09/02/2014 Sun 0.582 09/02/2014 Sun 1.027 12/02/2014 Wed 0.900 12/02/2014 Wed 1.097
TC1a System Peak (Jan 2013) TC1a Equivalent Peak (Feb 2013) Date Day Peak
Demand (kW)
Date Day Peak Demand (kW)
19/01/2013 Sat 0.900 09/02/2013 Sat 0.796 20/01/2014 Sun 0.905 10/02/2013 Sun 0.862 18/01/2014 Fri 0.913 13/02/2013 Wed 0.862
Peak day consumption
In the following graphs (Figure 2 to Figure 8) the “EV charger” curves show the demand for the EV load only; while the “Household” and “TC1a” curves show only the demand for the household and specifically excluding the EV charger.
Figure 2, Figure 3 and Figure 4 show average demand profiles for three peak days, while Figure 5 shows average demand data averaged over the month of Feb 14. All graphs indicate similar background trends, which are most easily observed in Figure 5 given the averaging over the month.
Figure 2: Average Demand for Peak Day (Weekday)
13
Copyright Northern Powergrid (Northeast) Limited, Northern Powergrid (Yorkshire) Plc, British Gas Trading Limited, University of Durham and EA Technology Ltd, 2014
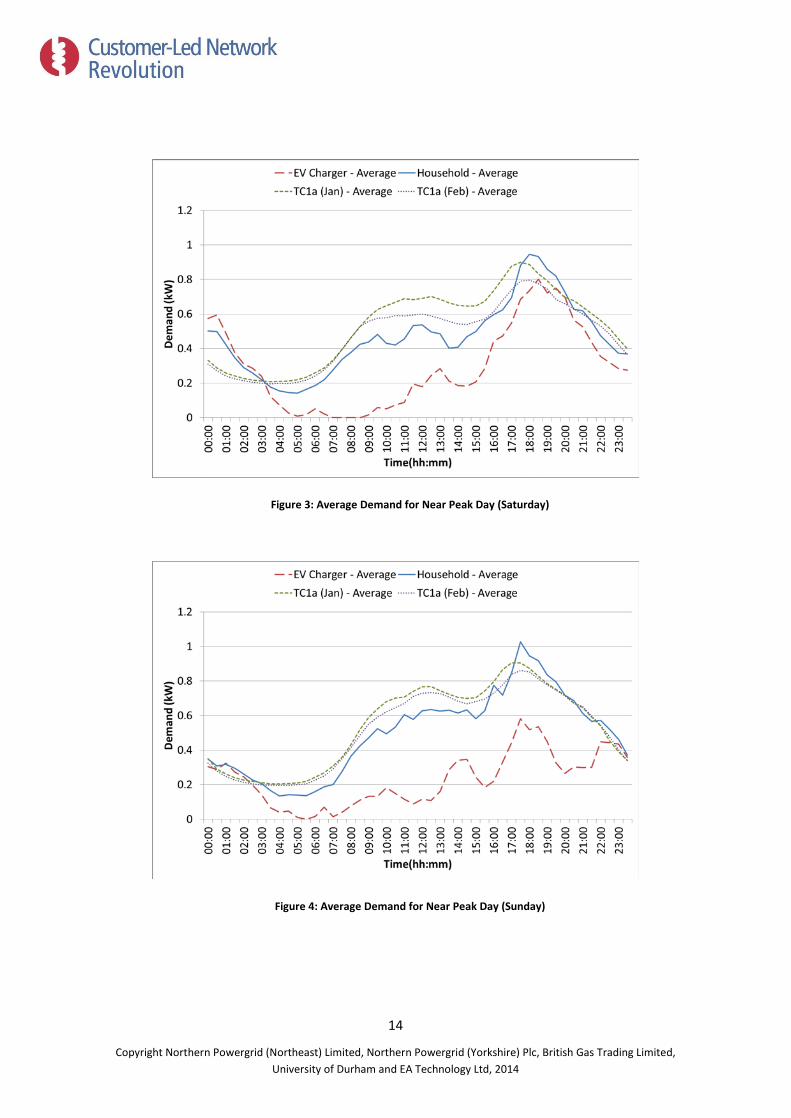
Figure 3: Average Demand for Near Peak Day (Saturday)
Figure 4: Average Demand for Near Peak Day (Sunday)
14
Copyright Northern Powergrid (Northeast) Limited, Northern Powergrid (Yorkshire) Plc, British Gas Trading Limited, University of Durham and EA Technology Ltd, 2014
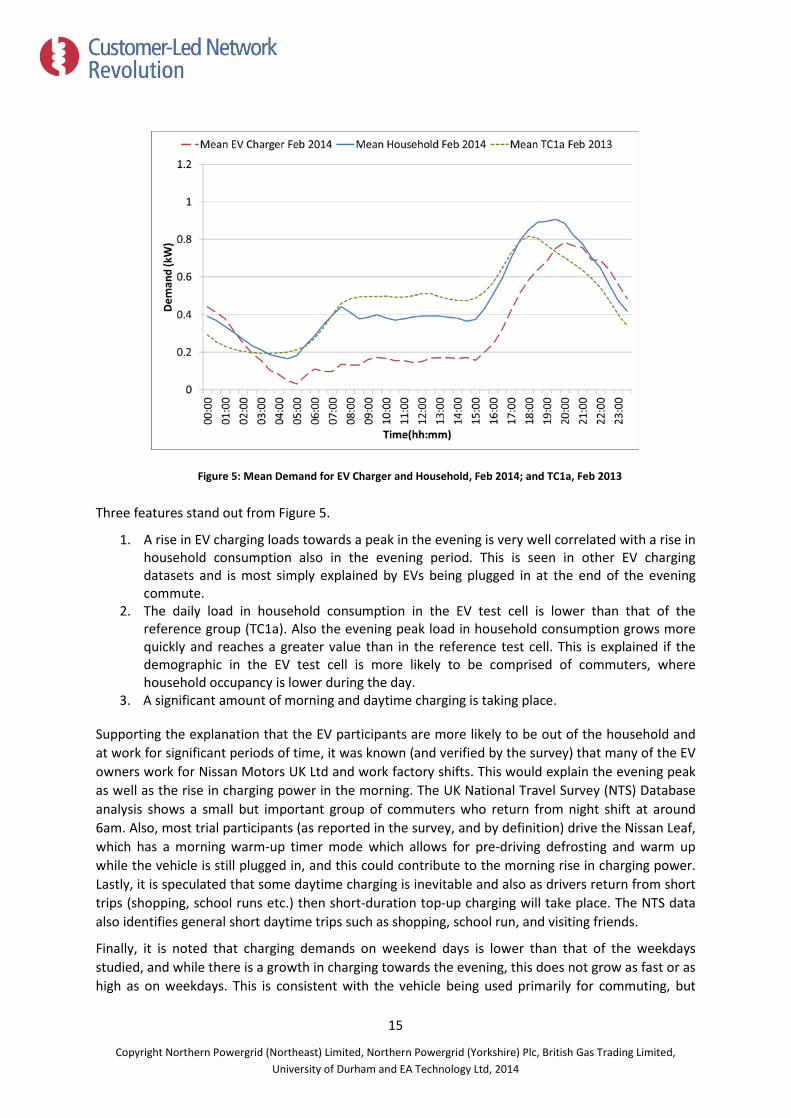
Figure 5: Mean Demand for EV Charger and Household, Feb 2014; and TC1a, Feb 2013
Three features stand out from Figure 5.
1. A rise in EV charging loads towards a peak in the evening is very well correlated with a rise in household consumption also in the evening period. This is seen in other EV charging datasets and is most simply explained by EVs being plugged in at the end of the evening commute.
2. The daily load in household consumption in the EV test cell is lower than that of the reference group (TC1a). Also the evening peak load in household consumption grows more quickly and reaches a greater value than in the reference test cell. This is explained if the demographic in the EV test cell is more likely to be comprised of commuters, where household occupancy is lower during the day.
3. A significant amount of morning and daytime charging is taking place.
Supporting the explanation that the EV participants are more likely to be out of the household and at work for significant periods of time, it was known (and verified by the survey) that many of the EV owners work for Nissan Motors UK Ltd and work factory shifts. This would explain the evening peak as well as the rise in charging power in the morning. The UK National Travel Survey (NTS) Database analysis shows a small but important group of commuters who return from night shift at around 6am. Also, most trial participants (as reported in the survey, and by definition) drive the Nissan Leaf, which has a morning warm-up timer mode which allows for pre-driving defrosting and warm up while the vehicle is still plugged in, and this could contribute to the morning rise in charging power. Lastly, it is speculated that some daytime charging is inevitable and also as drivers return from short trips (shopping, school runs etc.) then short-duration top-up charging will take place. The NTS data also identifies general short daytime trips such as shopping, school run, and visiting friends.
Finally, it is noted that charging demands on weekend days is lower than that of the weekdays studied, and while there is a growth in charging towards the evening, this does not grow as fast or as high as on weekdays. This is consistent with the vehicle being used primarily for commuting, but
15
Copyright Northern Powergrid (Northeast) Limited, Northern Powergrid (Yorkshire) Plc, British Gas Trading Limited, University of Durham and EA Technology Ltd, 2014
then at weekends for shorter journeys such as shopping, where the distances travelled and hence charging requirements are lower.
Peak day consumption - variance
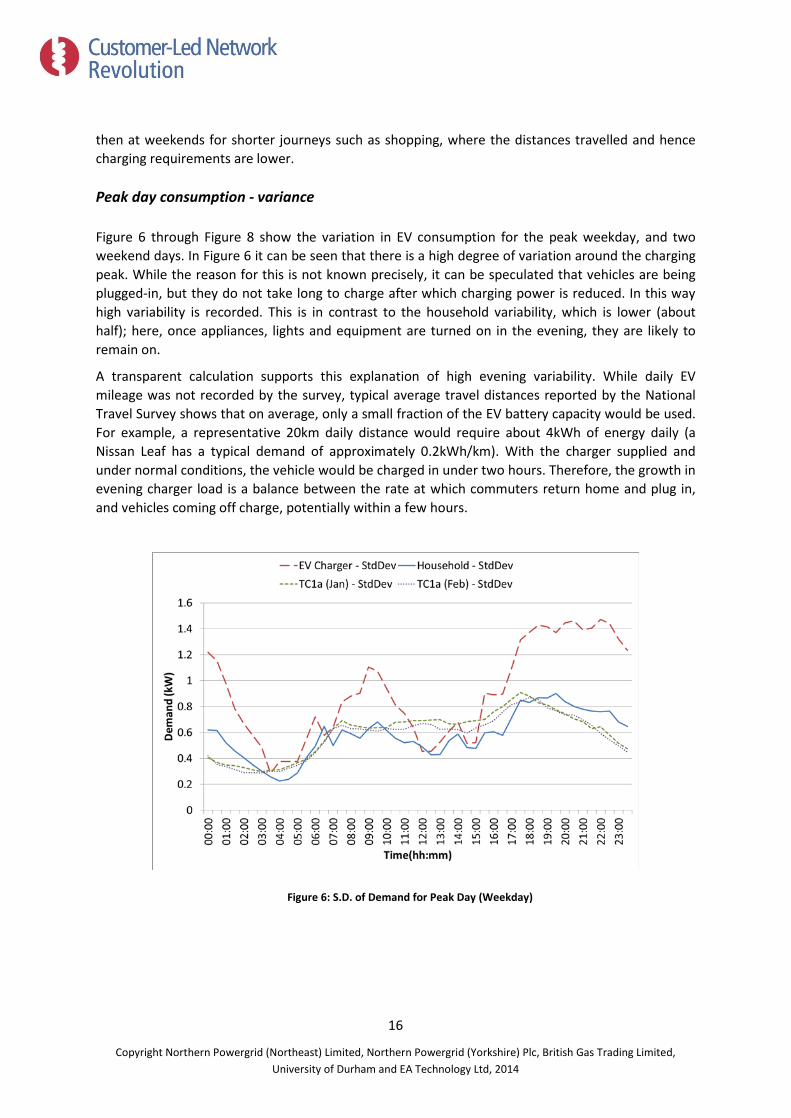
Figure 6 through Figure 8 show the variation in EV consumption for the peak weekday, and two weekend days. In Figure 6 it can be seen that there is a high degree of variation around the charging peak. While the reason for this is not known precisely, it can be speculated that vehicles are being plugged-in, but they do not take long to charge after which charging power is reduced. In this way high variability is recorded. This is in contrast to the household variability, which is lower (about half); here, once appliances, lights and equipment are turned on in the evening, they are likely to remain on.
A transparent calculation supports this explanation of high evening variability. While daily EV mileage was not recorded by the survey, typical average travel distances reported by the National Travel Survey shows that on average, only a small fraction of the EV battery capacity would be used. For example, a representative 20km daily distance would require about 4kWh of energy daily (a Nissan Leaf has a typical demand of approximately 0.2kWh/km). With the charger supplied and under normal conditions, the vehicle would be charged in under two hours. Therefore, the growth in evening charger load is a balance between the rate at which commuters return home and plug in, and vehicles coming off charge, potentially within a few hours.
Figure 6: S.D. of Demand for Peak Day (Weekday)
16
Copyright Northern Powergrid (Northeast) Limited, Northern Powergrid (Yorkshire) Plc, British Gas Trading Limited, University of Durham and EA Technology Ltd, 2014
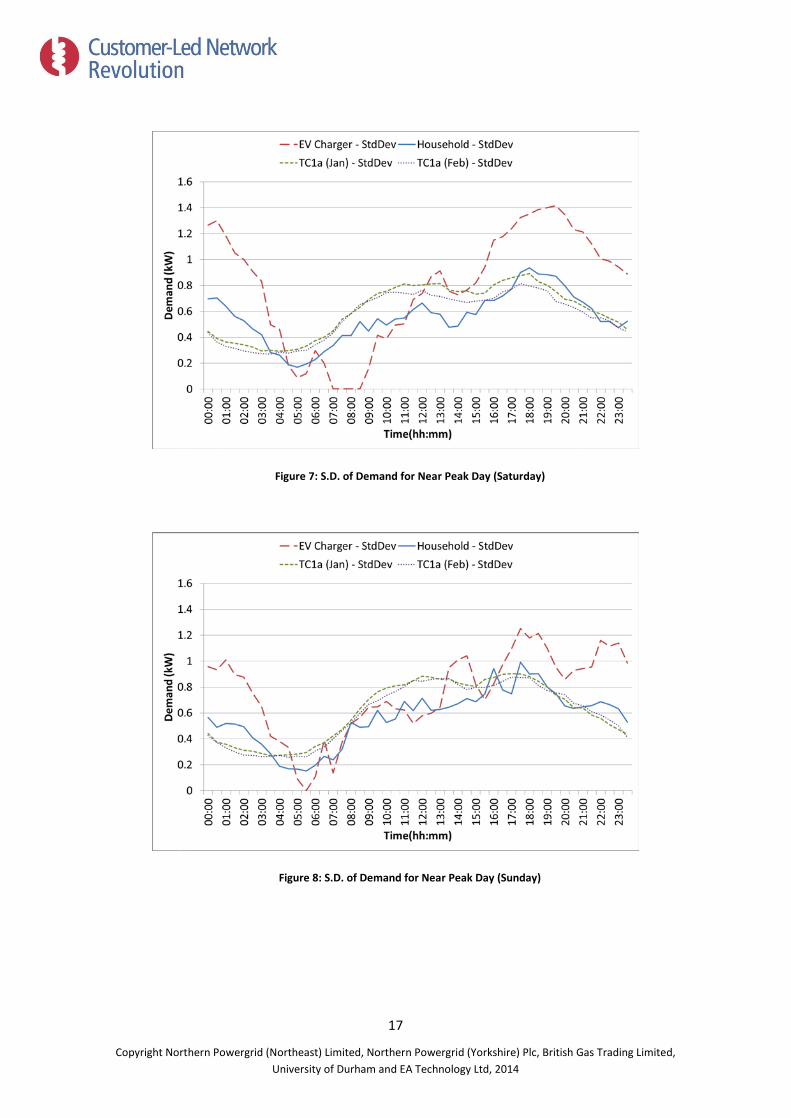
Figure 7: S.D. of Demand for Near Peak Day (Saturday)
Figure 8: S.D. of Demand for Near Peak Day (Sunday)
17
Copyright Northern Powergrid (Northeast) Limited, Northern Powergrid (Yorkshire) Plc, British Gas Trading Limited, University of Durham and EA Technology Ltd, 2014
4.2 Seasonal variation: Diurnal Charging Profiles
Figure 9 to Figure 14 show average EV charging profiles by month (Jan 2014 to Jun 2014) for weekdays and weekends. Care should be taken with the January and June profiles as relatively less data was available for analysis for these months, resulting in less smooth diurnal curves. In particular, the weekend profile for January must be regarded with caution; with fewer than 24 customers recording EV charge point data before 27/02/2014, and fewer than 10 before 17/01/2014, the amount of weekend data available was relatively low. Also data for June is relatively sparse and it is expected that on-going collection of data from the CYC-operated NE PIP project will be used to supplement this study in future to confirm or refute this apparent peak shift.
It can be seen that in general weekday charging is significantly more concentrated at around 8pm with limited daytime charging, which is consistent with the EVs being used as work transport. At the weekend, the diurnal peak is lower and more spread out with considerably more charging happening during the afternoon and less morning charging.
It can also be seen clearly that EV charging is seasonal. The EV charger average peak demand on a weekday is 0.9kW in January, while in June this drops to less than 0.5kW. This is likely to reflect seasonal EV consumption demand changes, such as additional lighting and heating, as well as reduced battery capacity in colder weather. The effect of holidays will also be apparent in the summer months.
June also seems to show a shift of the charging peak into night-time. This is an important result as initially it would not seem to be consistent with commuter-related charging. We may speculate that some of this shift could be attributed to a change in evening practices in the summer months, as living patterns change and more people are on holiday. In particular, the North East of England is at relatively high latitude with sunset times of around 21.30 or slightly later in the summer; potentially EV customers are venturing out later to place their vehicles on charge as it is lighter and warmer in the evening.
18
Copyright Northern Powergrid (Northeast) Limited, Northern Powergrid (Yorkshire) Plc, British Gas Trading Limited, University of Durham and EA Technology Ltd, 2014
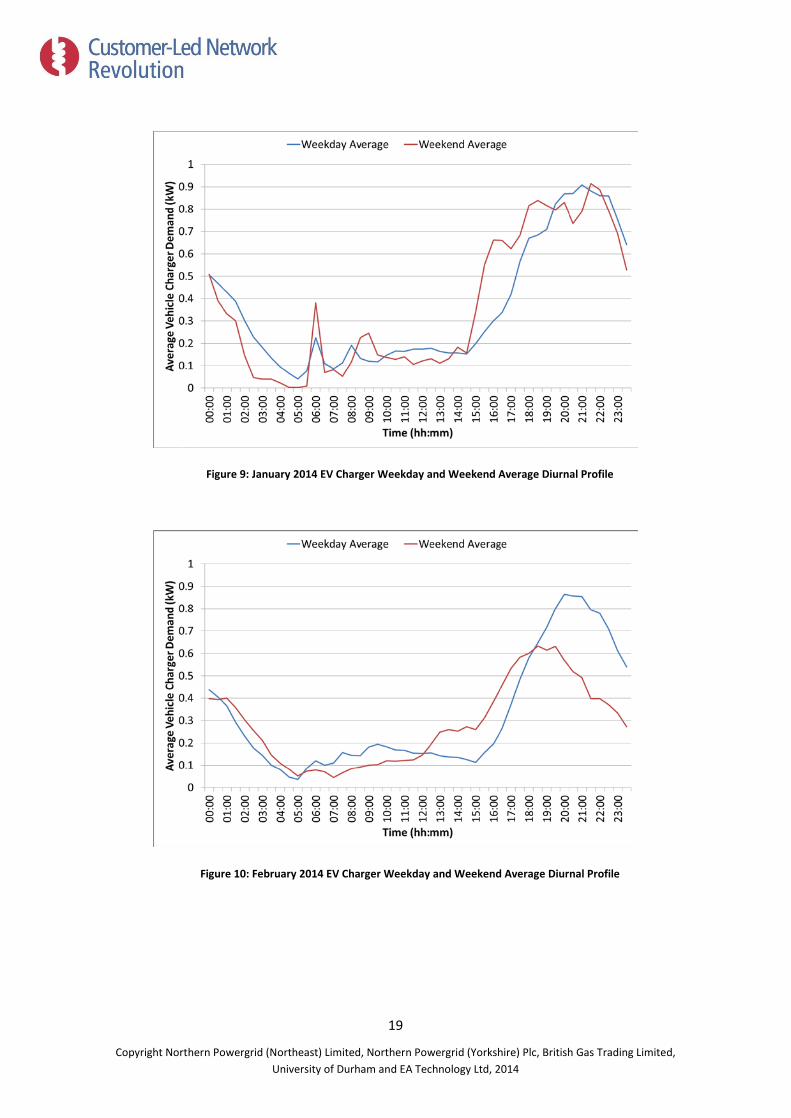
Figure 9: January 2014 EV Charger Weekday and Weekend Average Diurnal Profile
Figure 10: February 2014 EV Charger Weekday and Weekend Average Diurnal Profile
19
Copyright Northern Powergrid (Northeast) Limited, Northern Powergrid (Yorkshire) Plc, British Gas Trading Limited, University of Durham and EA Technology Ltd, 2014
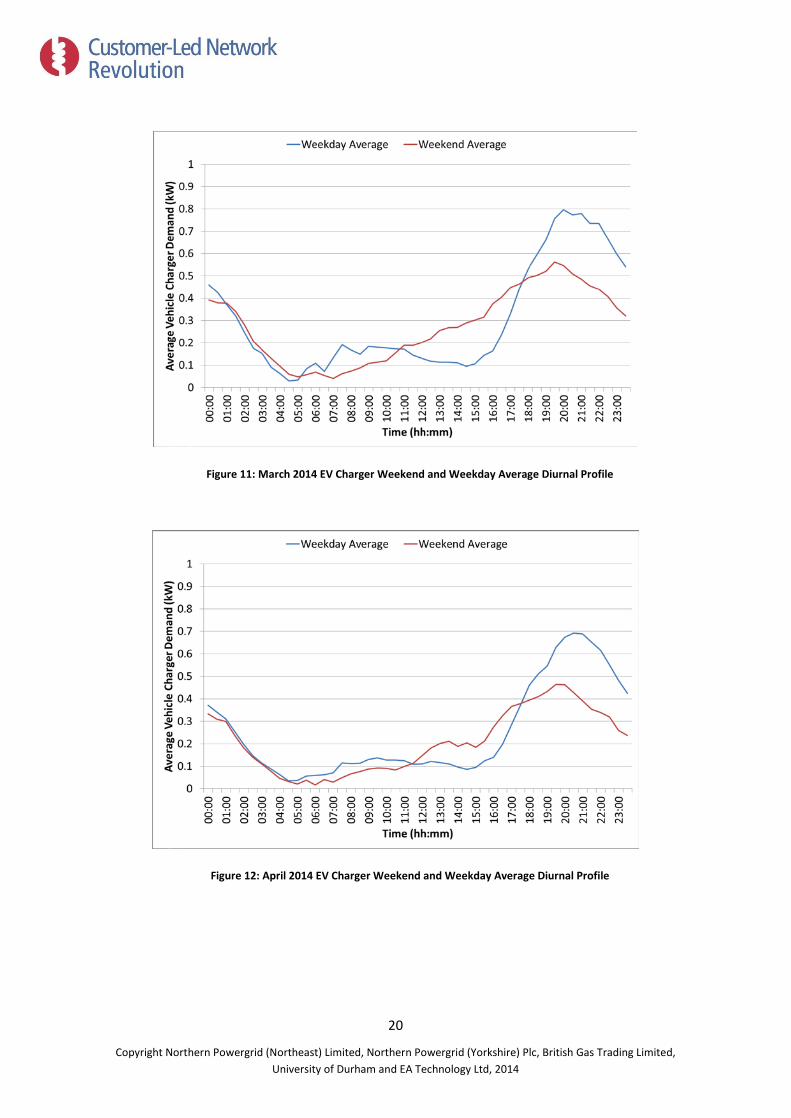
Figure 11: March 2014 EV Charger Weekend and Weekday Average Diurnal Profile
Figure 12: April 2014 EV Charger Weekend and Weekday Average Diurnal Profile
20
Copyright Northern Powergrid (Northeast) Limited, Northern Powergrid (Yorkshire) Plc, British Gas Trading Limited, University of Durham and EA Technology Ltd, 2014
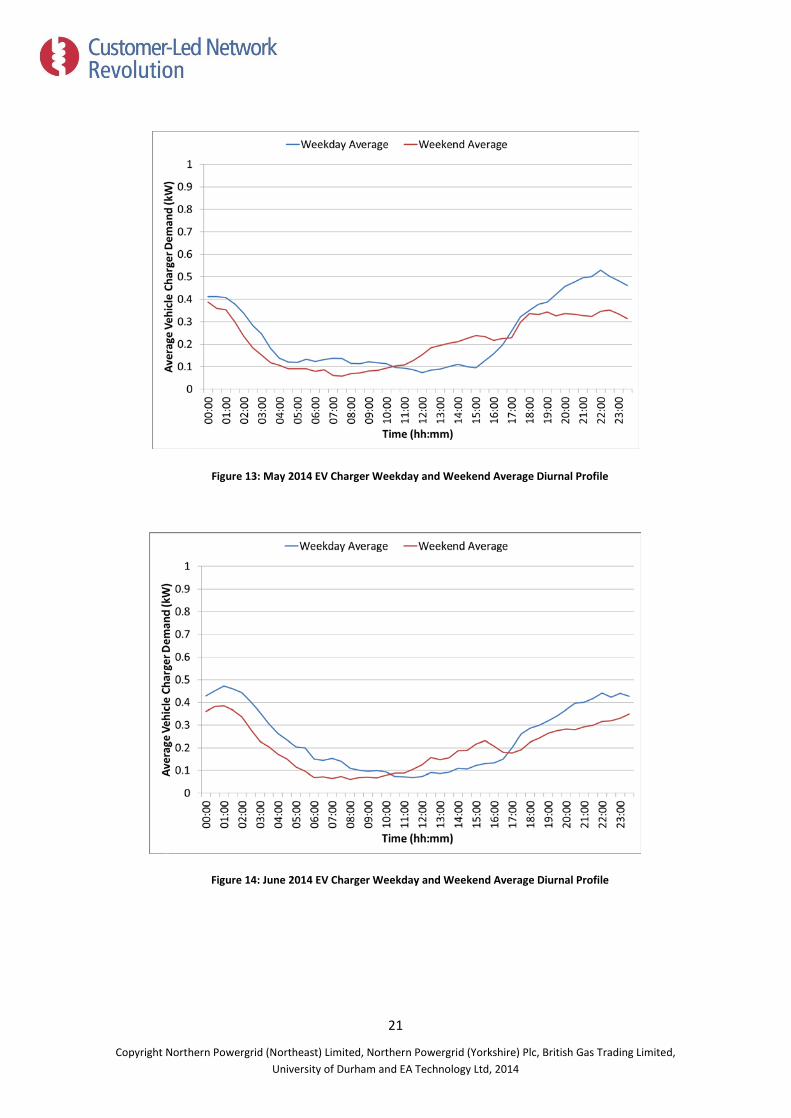
Figure 13: May 2014 EV Charger Weekday and Weekend Average Diurnal Profile
Figure 14: June 2014 EV Charger Weekday and Weekend Average Diurnal Profile
21
Copyright Northern Powergrid (Northeast) Limited, Northern Powergrid (Yorkshire) Plc, British Gas Trading Limited, University of Durham and EA Technology Ltd, 2014
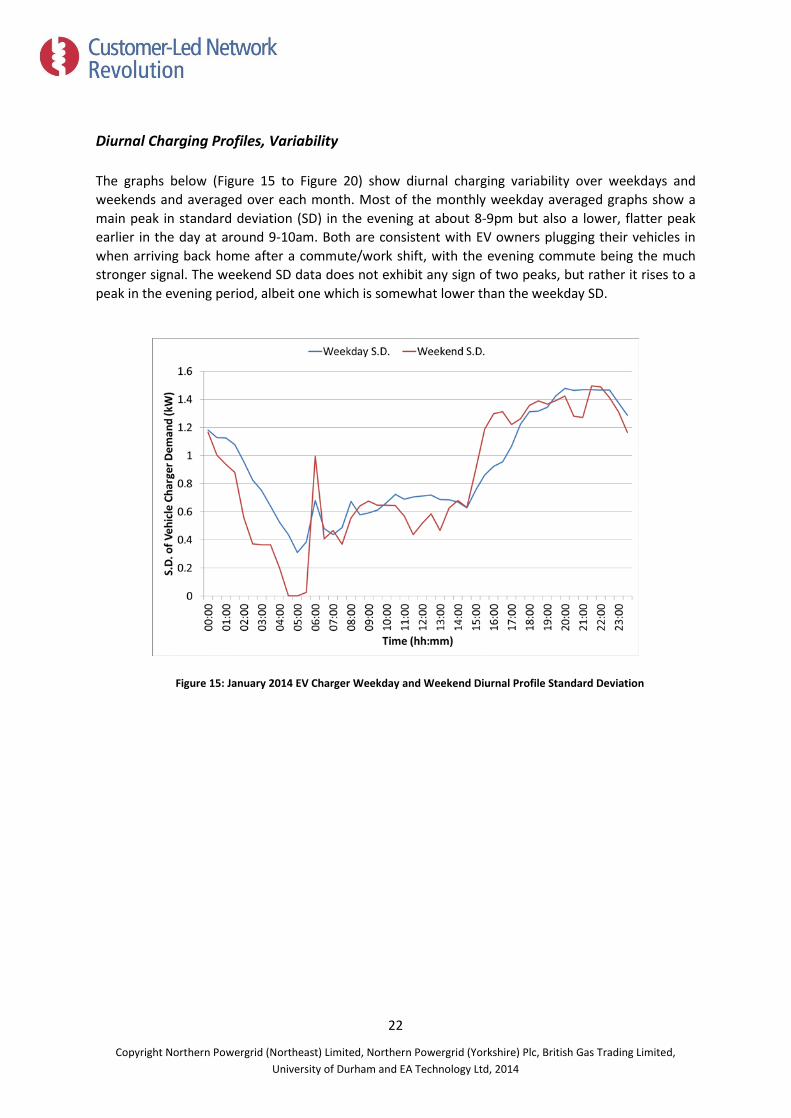
Diurnal Charging Profiles, Variability
The graphs below (Figure 15 to Figure 20) show diurnal charging variability over weekdays and weekends and averaged over each month. Most of the monthly weekday averaged graphs show a main peak in standard deviation (SD) in the evening at about 8-9pm but also a lower, flatter peak earlier in the day at around 9-10am. Both are consistent with EV owners plugging their vehicles in when arriving back home after a commute/work shift, with the evening commute being the much stronger signal. The weekend SD data does not exhibit any sign of two peaks, but rather it rises to a peak in the evening period, albeit one which is somewhat lower than the weekday SD.
Figure 15: January 2014 EV Charger Weekday and Weekend Diurnal Profile Standard Deviation
22
Copyright Northern Powergrid (Northeast) Limited, Northern Powergrid (Yorkshire) Plc, British Gas Trading Limited, University of Durham and EA Technology Ltd, 2014
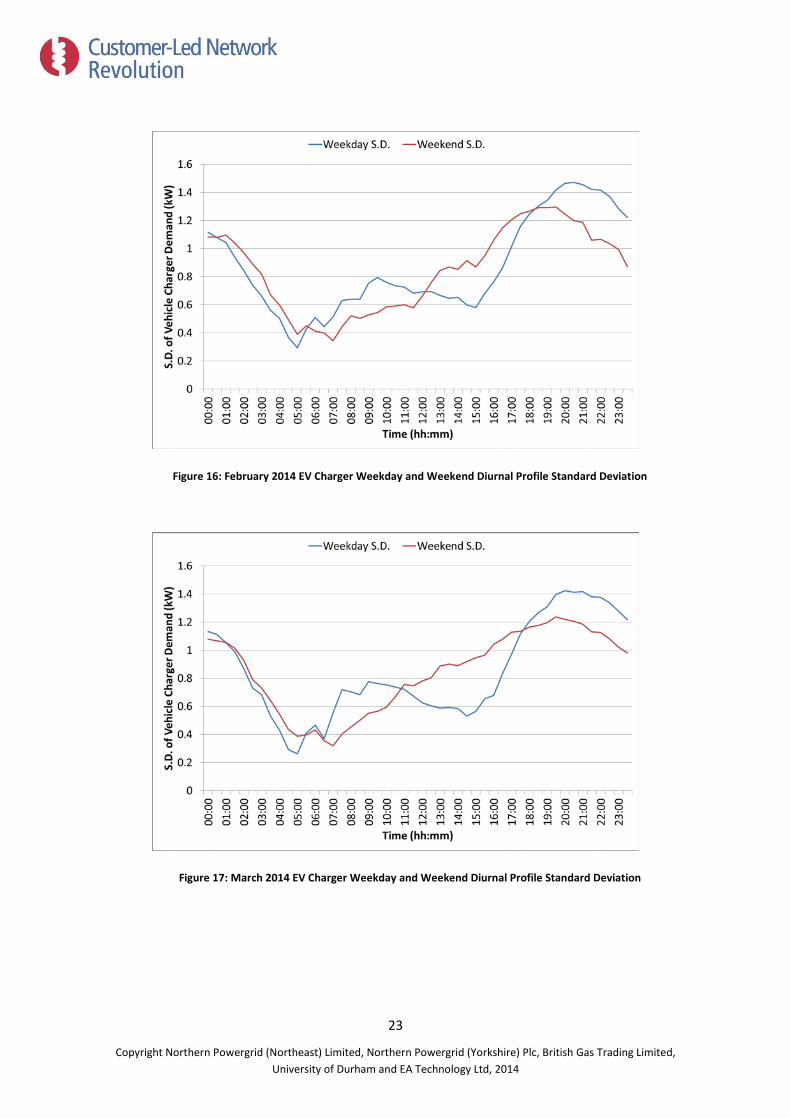
Figure 16: February 2014 EV Charger Weekday and Weekend Diurnal Profile Standard Deviation
Figure 17: March 2014 EV Charger Weekday and Weekend Diurnal Profile Standard Deviation
23
Copyright Northern Powergrid (Northeast) Limited, Northern Powergrid (Yorkshire) Plc, British Gas Trading Limited, University of Durham and EA Technology Ltd, 2014
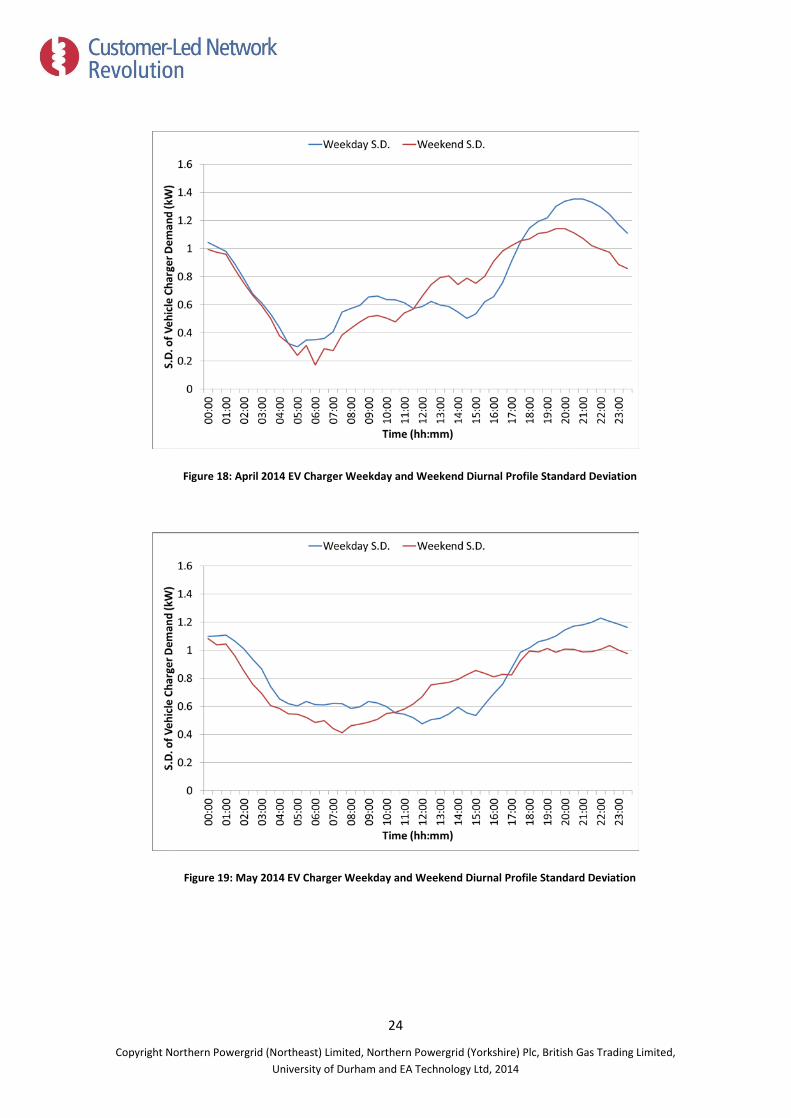
Figure 18: April 2014 EV Charger Weekday and Weekend Diurnal Profile Standard Deviation
Figure 19: May 2014 EV Charger Weekday and Weekend Diurnal Profile Standard Deviation
24
Copyright Northern Powergrid (Northeast) Limited, Northern Powergrid (Yorkshire) Plc, British Gas Trading Limited, University of Durham and EA Technology Ltd, 2014
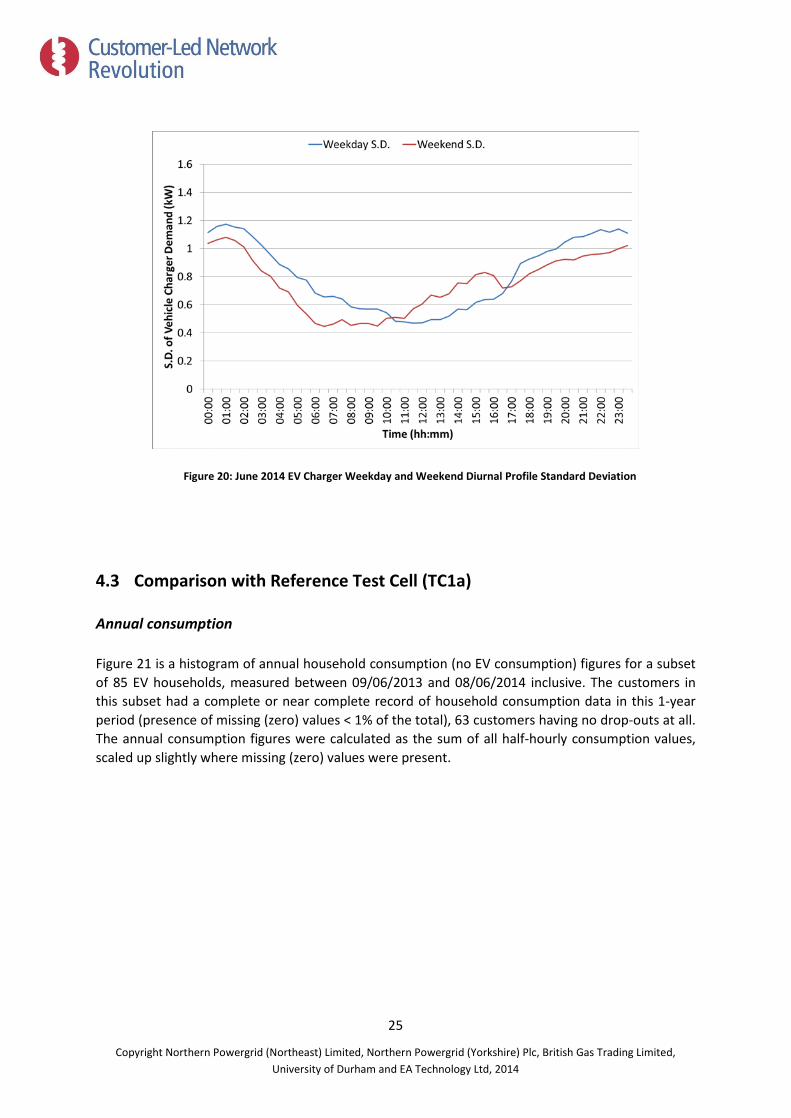
Figure 20: June 2014 EV Charger Weekday and Weekend Diurnal Profile Standard Deviation
4.3 Comparison with Reference Test Cell (TC1a)
Annual consumption
Figure 21 is a histogram of annual household consumption (no EV consumption) figures for a subset of 85 EV households, measured between 09/06/2013 and 08/06/2014 inclusive. The customers in this subset had a complete or near complete record of household consumption data in this 1-year period (presence of missing (zero) values < 1% of the total), 63 customers having no drop-outs at all. The annual consumption figures were calculated as the sum of all half-hourly consumption values, scaled up slightly where missing (zero) values were present.
25
Copyright Northern Powergrid (Northeast) Limited, Northern Powergrid (Yorkshire) Plc, British Gas Trading Limited, University of Durham and EA Technology Ltd, 2014
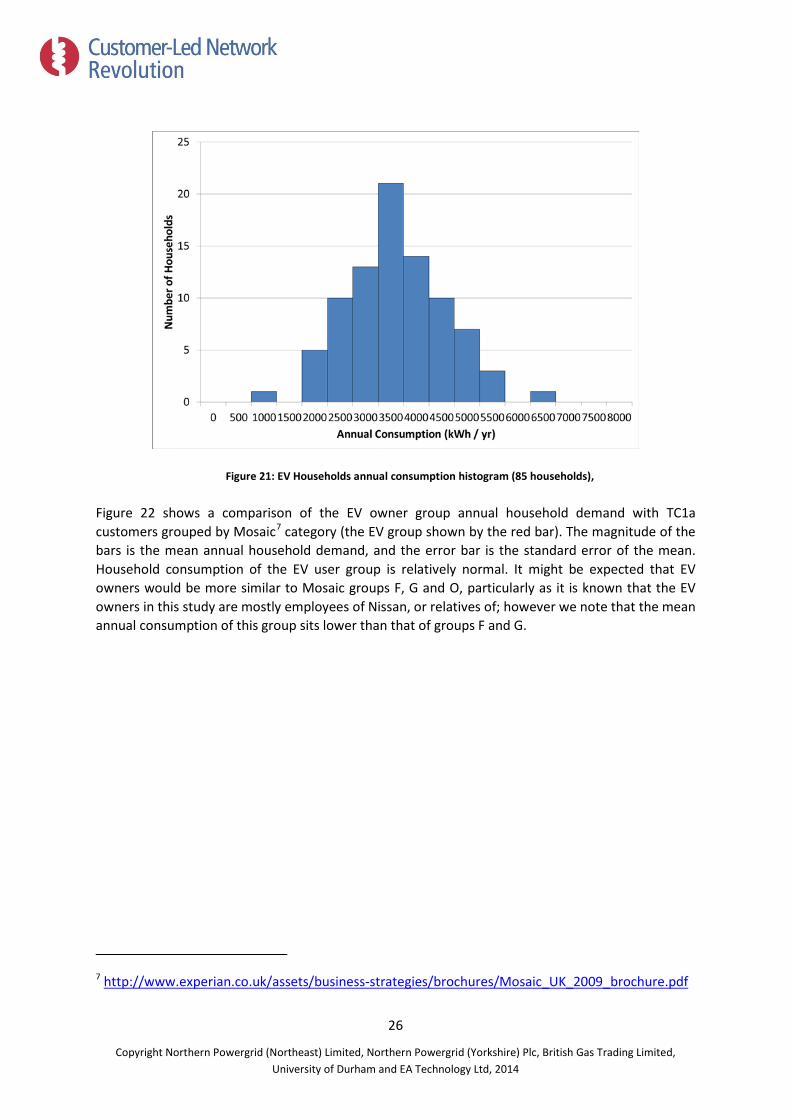
Figure 21: EV Households annual consumption histogram (85 households),
Figure 22 shows a comparison of the EV owner group annual household demand with TC1a customers grouped by Mosaic7 category (the EV group shown by the red bar). The magnitude of the bars is the mean annual household demand, and the error bar is the standard error of the mean. Household consumption of the EV user group is relatively normal. It might be expected that EV owners would be more similar to Mosaic groups F, G and O, particularly as it is known that the EV owners in this study are mostly employees of Nissan, or relatives of; however we note that the mean annual consumption of this group sits lower than that of groups F and G.
7 http://www.experian.co.uk/assets/business-strategies/brochures/Mosaic_UK_2009_brochure.pdf
26
Copyright Northern Powergrid (Northeast) Limited, Northern Powergrid (Yorkshire) Plc, British Gas Trading Limited, University of Durham and EA Technology Ltd, 2014
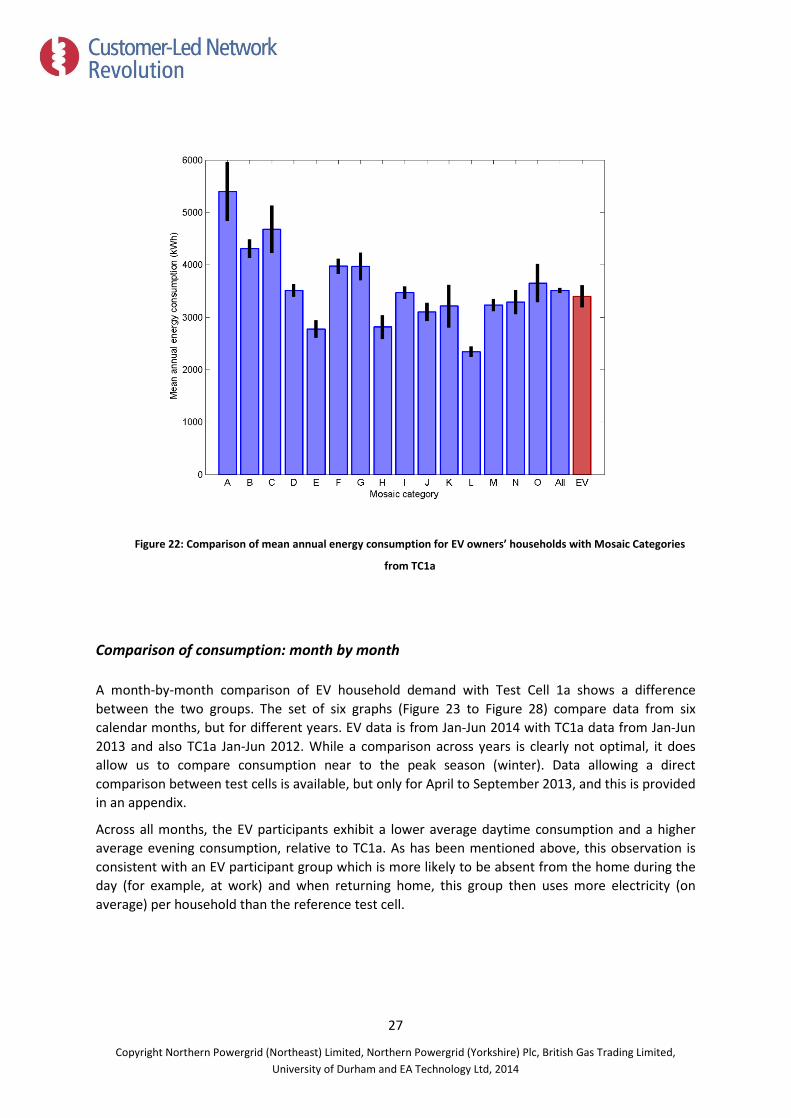
Figure 22: Comparison of mean annual energy consumption for EV owners’ households with Mosaic Categories
from TC1a
Comparison of consumption: month by month
A month-by-month comparison of EV household demand with Test Cell 1a shows a difference between the two groups. The set of six graphs (Figure 23 to Figure 28) compare data from six calendar months, but for different years. EV data is from Jan-Jun 2014 with TC1a data from Jan-Jun 2013 and also TC1a Jan-Jun 2012. While a comparison across years is clearly not optimal, it does allow us to compare consumption near to the peak season (winter). Data allowing a direct comparison between test cells is available, but only for April to September 2013, and this is provided in an appendix.
Across all months, the EV participants exhibit a lower average daytime consumption and a higher average evening consumption, relative to TC1a. As has been mentioned above, this observation is consistent with an EV participant group which is more likely to be absent from the home during the day (for example, at work) and when returning home, this group then uses more electricity (on average) per household than the reference test cell.
27
Copyright Northern Powergrid (Northeast) Limited, Northern Powergrid (Yorkshire) Plc, British Gas Trading Limited, University of Durham and EA Technology Ltd, 2014
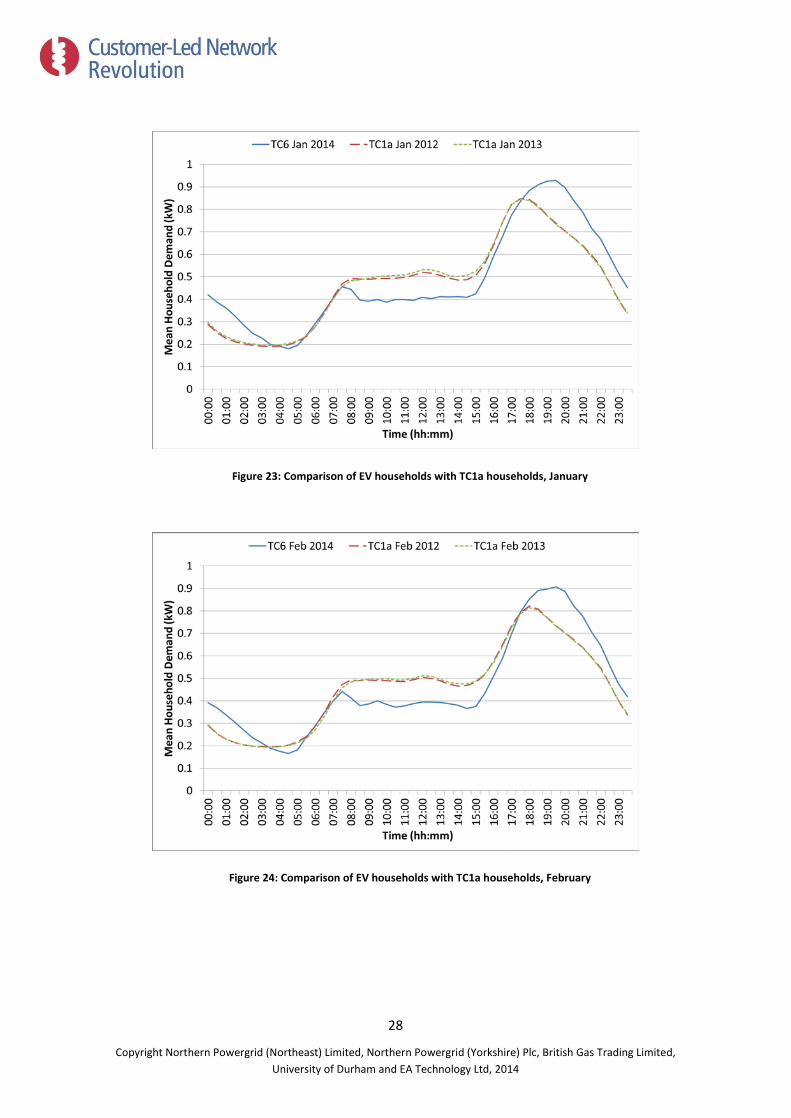
Figure 23: Comparison of EV households with TC1a households, January
Figure 24: Comparison of EV households with TC1a households, February
28
Copyright Northern Powergrid (Northeast) Limited, Northern Powergrid (Yorkshire) Plc, British Gas Trading Limited, University of Durham and EA Technology Ltd, 2014
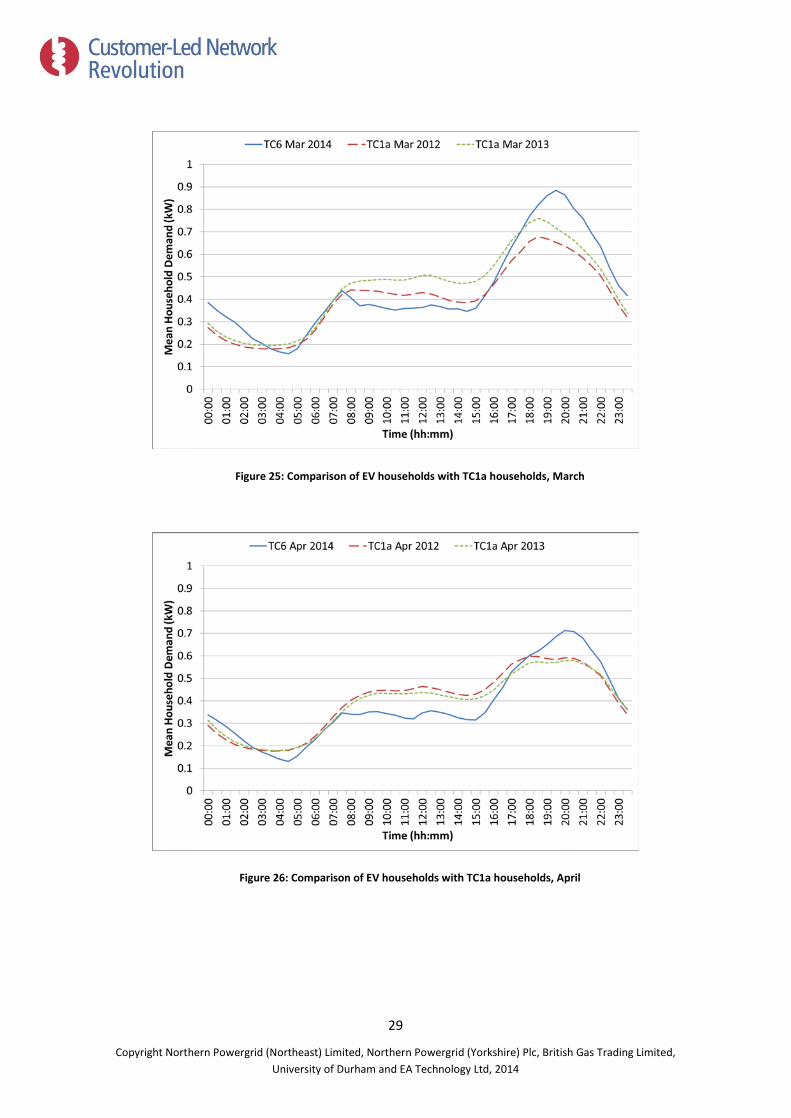
Figure 25: Comparison of EV households with TC1a households, March
Figure 26: Comparison of EV households with TC1a households, April
29
Copyright Northern Powergrid (Northeast) Limited, Northern Powergrid (Yorkshire) Plc, British Gas Trading Limited, University of Durham and EA Technology Ltd, 2014
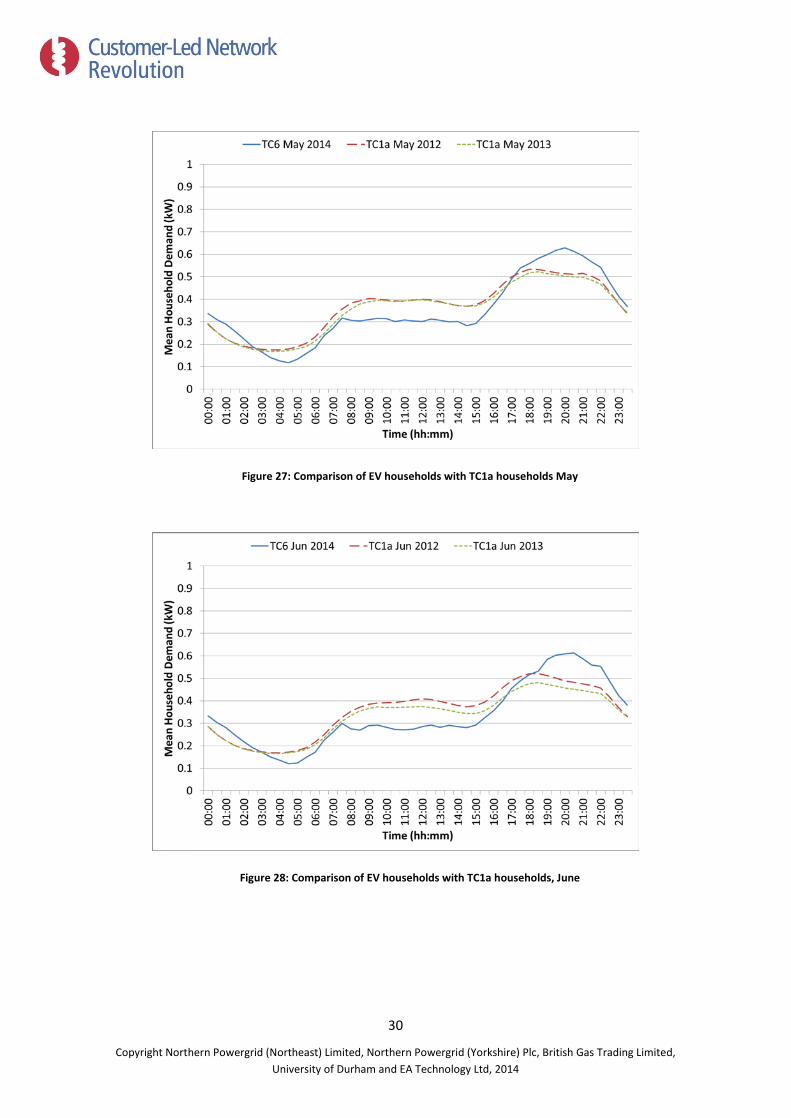
Figure 27: Comparison of EV households with TC1a households May
Figure 28: Comparison of EV households with TC1a households, June
30
Copyright Northern Powergrid (Northeast) Limited, Northern Powergrid (Yorkshire) Plc, British Gas Trading Limited, University of Durham and EA Technology Ltd, 2014
4.4 Electricity Tariffs for EVs
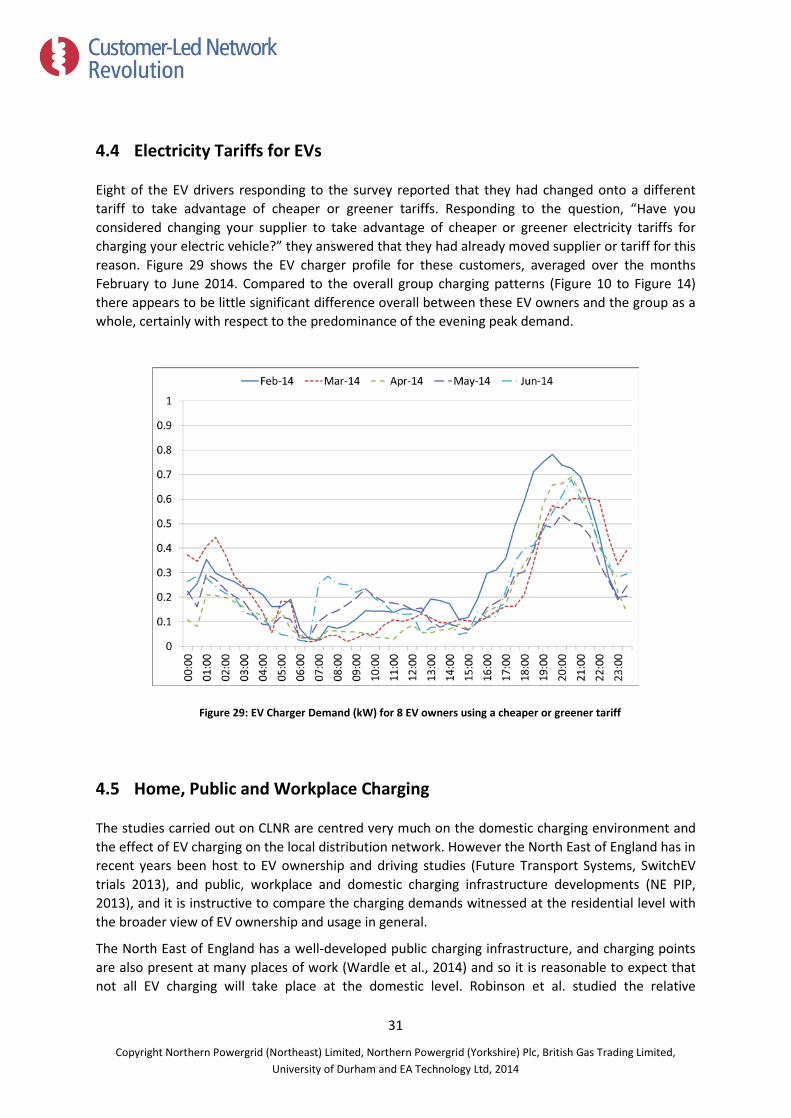
Eight of the EV drivers responding to the survey reported that they had changed onto a different tariff to take advantage of cheaper or greener tariffs. Responding to the question, “Have you considered changing your supplier to take advantage of cheaper or greener electricity tariffs for charging your electric vehicle?” they answered that they had already moved supplier or tariff for this reason. Figure 29 shows the EV charger profile for these customers, averaged over the months February to June 2014. Compared to the overall group charging patterns (Figure 10 to Figure 14) there appears to be little significant difference overall between these EV owners and the group as a whole, certainly with respect to the predominance of the evening peak demand.
Figure 29: EV Charger Demand (kW) for 8 EV owners using a cheaper or greener tariff
4.5 Home, Public and Workplace Charging
The studies carried out on CLNR are centred very much on the domestic charging environment and the effect of EV charging on the local distribution network. However the North East of England has in recent years been host to EV ownership and driving studies (Future Transport Systems, SwitchEV trials 2013), and public, workplace and domestic charging infrastructure developments (NE PIP, 2013), and it is instructive to compare the charging demands witnessed at the residential level with the broader view of EV ownership and usage in general.
The North East of England has a well-developed public charging infrastructure, and charging points are also present at many places of work (Wardle et al., 2014) and so it is reasonable to expect that not all EV charging will take place at the domestic level. Robinson et al. studied the relative
31
Copyright Northern Powergrid (Northeast) Limited, Northern Powergrid (Yorkshire) Plc, British Gas Trading Limited, University of Durham and EA Technology Ltd, 2014
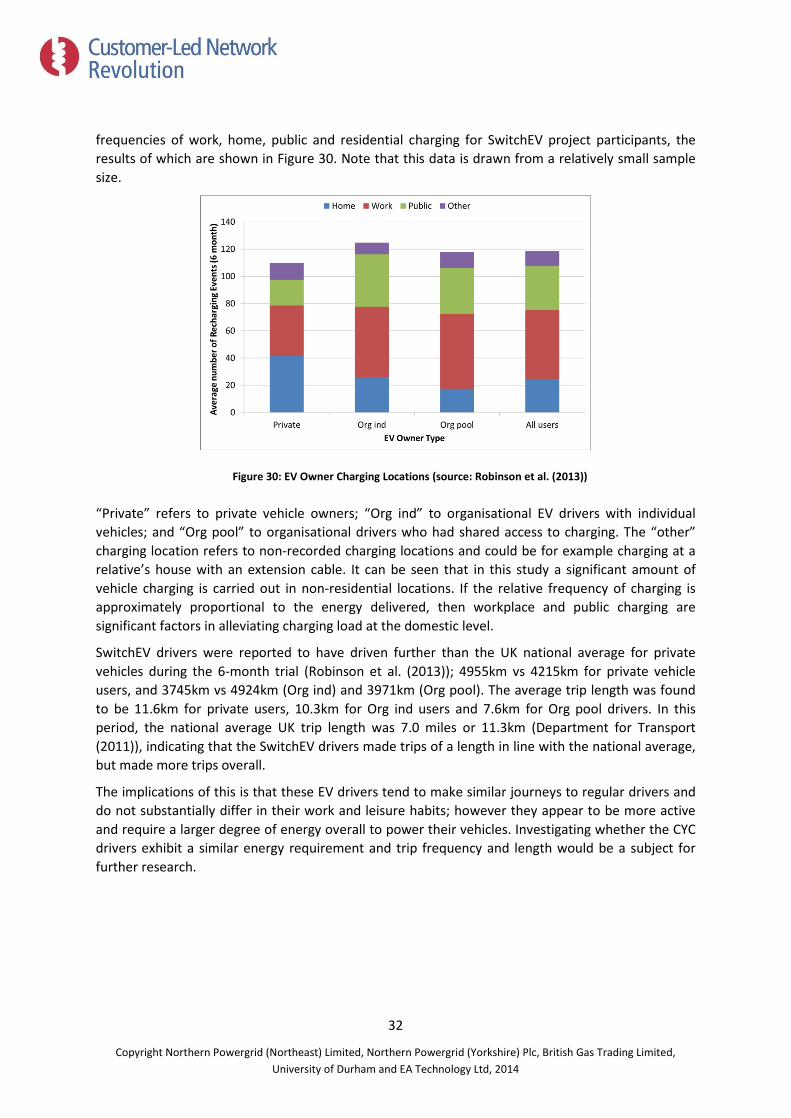
frequencies of work, home, public and residential charging for SwitchEV project participants, the results of which are shown in Figure 30. Note that this data is drawn from a relatively small sample size.
Figure 30: EV Owner Charging Locations (source: Robinson et al. (2013))
“Private” refers to private vehicle owners; “Org ind” to organisational EV drivers with individual vehicles; and “Org pool” to organisational drivers who had shared access to charging. The “other” charging location refers to non-recorded charging locations and could be for example charging at a relative’s house with an extension cable. It can be seen that in this study a significant amount of vehicle charging is carried out in non-residential locations. If the relative frequency of charging is approximately proportional to the energy delivered, then workplace and public charging are significant factors in alleviating charging load at the domestic level.
SwitchEV drivers were reported to have driven further than the UK national average for private vehicles during the 6-month trial (Robinson et al. (2013)); 4955km vs 4215km for private vehicle users, and 3745km vs 4924km (Org ind) and 3971km (Org pool). The average trip length was found to be 11.6km for private users, 10.3km for Org ind users and 7.6km for Org pool drivers. In this period, the national average UK trip length was 7.0 miles or 11.3km (Department for Transport (2011)), indicating that the SwitchEV drivers made trips of a length in line with the national average, but made more trips overall.
The implications of this is that these EV drivers tend to make similar journeys to regular drivers and do not substantially differ in their work and leisure habits; however they appear to be more active and require a larger degree of energy overall to power their vehicles. Investigating whether the CYC drivers exhibit a similar energy requirement and trip frequency and length would be a subject for further research.
32
Copyright Northern Powergrid (Northeast) Limited, Northern Powergrid (Yorkshire) Plc, British Gas Trading Limited, University of Durham and EA Technology Ltd, 2014
5 Social Science Learning
5.1 General Findings and Observations
The International Energy Agency (IEA) (2012:49) reported that 10% of EVs registered in the UK are in the North East England which has only 4% of the country’s population. According to the Office for National Statistics (ONS), there were 113,000 hybrid, electric or gas/LPG powered cars licensed at the end of 2009 in Great Britain although cars powered by these means were still less than half of one per cent of all licensed cars (ONS 2009).
In a narrow socio-economic context of the region, the IEA mentioned that the North East had “an extensive, long-established automotive industry that is home to some of the world’s leading companies including Nissan” (IEA 2012). Nissan’s plant located in Sunderland is the place where both the Nissan LEAF and the lithium-ion batteries have been manufactured since 2012. The North East of England is also one of the regions leading the way in establishing a network of public charging points to enable drivers to recharge their cars when away from home (IEA 2012).
To grasp the socio-economic dimension of the electric vehicles in the region it should be noted that the region is not only home to EV and lithium-ion battery manufacturing, development and research but also EV skills and training development. In 2010 Gateshead College launched the UK’s first electric vehicle apprenticeship, in partnership with Smith Electric Vehicles, a global manufacturer of commercial electric vehicles.
This unique socio-technical network likely makes it easier to implement the new technology on the social level. The social science analysis suggests that people are told about owning and driving an electric vehicle by someone they know, i.e. relatives or friends, and go on to share their knowledge with others.
In addition to these three emerging characteristics of the regional EV use, it should be noted that customers on the trial received their vehicles and charge points some months before EV charger monitoring data started being collected in any quantity (January 2014). By the start of 2014 all of the EV owners had been driving their vehicles and using their residential charge point for several months, and thus it can be assumed that there is no “familiarisation effect” present in the data that was analysed.
5.2 Seasonality: Summer and Winter EV Driving
The analysis of the EV and household load data reveals that for the peak day curves the general features of the TC6 diurnal profiles are similar to those of the test group (TC1a). We observe a slight breakfast peak, followed by a flat daytime demand, and then a standard evening peak and low night-time demand8.
8 The peak is on the higher side which would correspond to the higher-income Mosaic groups.
33
Copyright Northern Powergrid (Northeast) Limited, Northern Powergrid (Yorkshire) Plc, British Gas Trading Limited, University of Durham and EA Technology Ltd, 2014
However the ratio of the peak to the daytime demand is higher than the general TC1a curves. This would imply that the sample group consists predominantly of households which are empty during the day, with adults being at work and any children at school.
5.2.1 Evening Peak
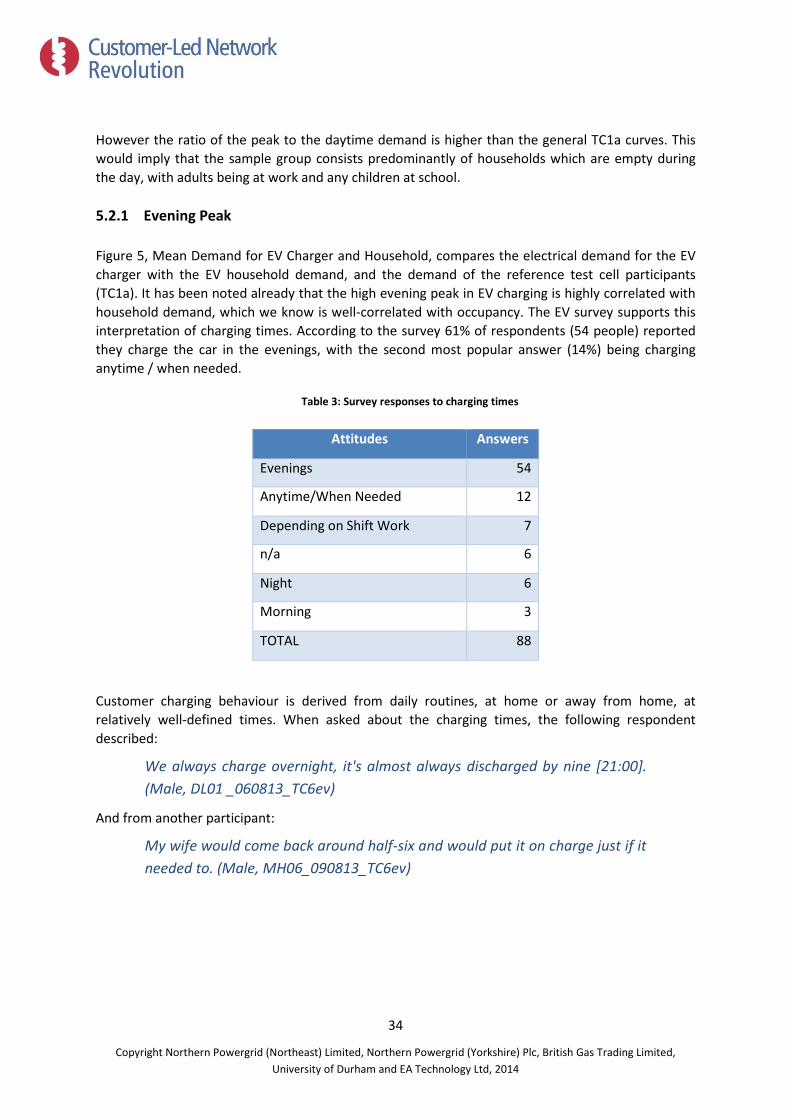
Figure 5, Mean Demand for EV Charger and Household, compares the electrical demand for the EV charger with the EV household demand, and the demand of the reference test cell participants (TC1a). It has been noted already that the high evening peak in EV charging is highly correlated with household demand, which we know is well-correlated with occupancy. The EV survey supports this interpretation of charging times. According to the survey 61% of respondents (54 people) reported they charge the car in the evenings, with the second most popular answer (14%) being charging anytime / when needed.
Table 3: Survey responses to charging times
Attitudes Answers
Evenings 54
Anytime/When Needed 12
Depending on Shift Work 7
n/a 6
Night 6
Morning 3
TOTAL 88
Customer charging behaviour is derived from daily routines, at home or away from home, at relatively well-defined times. When asked about the charging times, the following respondent described:
We always charge overnight, it's almost always discharged by nine [21:00]. (Male, DL01 _060813_TC6ev)
And from another participant:
My wife would come back around half-six and would put it on charge just if it needed to. (Male, MH06_090813_TC6ev)
34
Copyright Northern Powergrid (Northeast) Limited, Northern Powergrid (Yorkshire) Plc, British Gas Trading Limited, University of Durham and EA Technology Ltd, 2014
5.2.2 Weekdays and Weekends
Figure 1 1 compares diurnal profiles of charging averaged over weekend and weekdays for March 2014. As noted above the weekend charging load profile grows more gradually to a peak which is lower than on weekdays, and there is no evidence of an earlier shallow peak as there is on weekdays. The observed data is consistent with EVs being used for weekend journeys (e.g. shopping, seeing friends) which are much less structured and constrained in time than a commute would be. At weekends, vehicles may return from a trip far earlier than from a typical commute, and the rise in the evening weekend profile is consistent with remaining householders returning home following leisure or shopping activities.
5.2.3 Summer and Winter Months
There is a strong seasonality signal in the data, which show lower average demand during the summer months. Figure 9 to Figure 14 clearly show the seasonal difference in peak demand and charging times, which increase in winter months.
This is likely to reflect seasonal EV consumption demand changes, such as additional lighting and heating requirements, as well as reduced battery performance in colder weather. However it may also reflect seasonal driving demand, for example in the summer months the school run is avoided; also there would be a lower demand coinciding with some households going on holidays.
The seasonality of EV car use is also mirrored in the ways people drive the electric car (driving practices). Quotes below show how the EV car range changes in winter months when heating has a big impact on range:
I think the on board thing overestimates the range. When you get in the car it tells you it's got a range of about a hundred and ten miles but in reality that range even if you drove only thirty, forty miles an hour is about sixty to seventy. It's probably slightly less in the winter, so it might be down to like fifty-five but I mean, our experience is - and that is not driving a like seventy miles an hour, which is driving at thirty miles an hour - and we always have the Eco mode. (DL01_060813_TC6ev)
I have had it for two years. Yes, I was an early adopter. [...] I really liked it. I found that although they are meant to do a hundred miles to a charge, that was rarely when you actually get that much out of it; you'd have to drive very carefully in order to get that much. But generally I liked it very much. In winter, I never had any problems at all with the charging. The range in the winter? Probably not the same only because I used heating and head lights, that does tend to reduce the range. Heating is the main one. I have never used the air-conditioning but the heating I have to. The Leaf is my primary car. (DL03_070813_TC6ev)
You only lose a couple of mile by turning the heating on. And likewise, if I'm travelling in nice weather with the air-con on - I went down to [city] to my brother's, a couple of month ago, and on the way back obviously the mileage was getting a bit low so I started to panic so I turned the air-con off but I only got an extra mile! By turning it off. I put it in the Eco and I got another mile. So what's the point? Coz the
35
Copyright Northern Powergrid (Northeast) Limited, Northern Powergrid (Yorkshire) Plc, British Gas Trading Limited, University of Durham and EA Technology Ltd, 2014
mileage you get it's a computer in the car doing an estimation. Your driving style and how you're driving today and all that.. so it's only an estimation. Basically the best thing to do ... you've got the charge bars on the side, the best thing to do is to off the charge bars, how many bars you've got. (MH04_060813_TC6ev)
The EV charging practices are diurnal, weekly, monthly or seasonal patterns of activities.
While the above quotes do identify a level of “range anxiety” even amongst satisfied EV early adopters, the additional energy consumption in winter months due to heating and lighting does not seem to be a significant additional concern. This can be explained if we accept that the vehicles in this trial are used for a typical daily commute (20km per day) but have a mileage at least 3 or 4 times this number. The additional load in winter will not cause the vehicle to be stranded but range remains a concern, whatever the season.
5.3 Battery Life
One of the main concerns related to EV technology adoption is how long EV batteries will last before they need to be replaced. The battery life is limited but the actual battery life-span depends on how drivers use the vehicle’s batteries. To improve battery life, regular deep discharging of the lithium-ion batteries should be avoided.
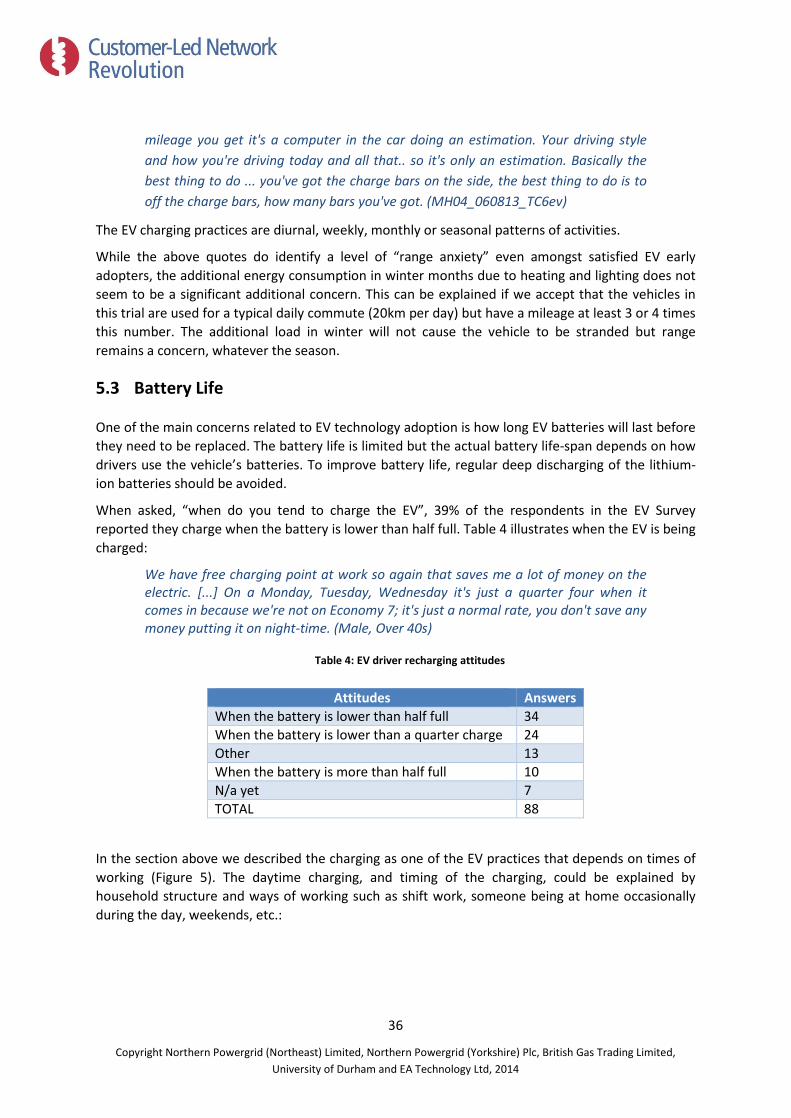
When asked, “when do you tend to charge the EV”, 39% of the respondents in the EV Survey reported they charge when the battery is lower than half full. Table 4 illustrates when the EV is being charged:
We have free charging point at work so again that saves me a lot of money on the electric. [...] On a Monday, Tuesday, Wednesday it's just a quarter four when it comes in because we're not on Economy 7; it's just a normal rate, you don't save any money putting it on night-time. (Male, Over 40s)
Table 4: EV driver recharging attitudes
Attitudes Answers When the battery is lower than half full 34 When the battery is lower than a quarter charge 24 Other 13 When the battery is more than half full 10 N/a yet 7 TOTAL 88
In the section above we described the charging as one of the EV practices that depends on times of working (Figure 5). The daytime charging, and timing of the charging, could be explained by household structure and ways of working such as shift work, someone being at home occasionally during the day, weekends, etc.:
36
Copyright Northern Powergrid (Northeast) Limited, Northern Powergrid (Yorkshire) Plc, British Gas Trading Limited, University of Durham and EA Technology Ltd, 2014
If I'm on dayshift I'd probably plug it in if it needs charging about nine o'clock [21:00], that's about the earliest when it's gonna get charged. (Male, GPEV04)
No, I don't always charge the car over the night. Just when we get in, when we come back we plug it in. [...] I'd say we don't really charge between four and eight [16:00 to 20:00], when we get back, we plug it in. So tonight we leave at six [06:00], get back about seven [19:00]. (Male, DL02_060813_TC6ev)
Aside from the options presented to them in the interview, respondents could simply plug in the vehicle when they return home from work, and therefore never consider explicitly the state of charge of the battery – in which case they may not have answered the question accurately. The narratives from the interviews coincide with our analysis that, rather than take into account the effect of charging on the battery life, the owners are charging when they return home and also opportunistically i.e. whenever there is a charger available and convenient.
5.4 Driving Range and Range Anxiety
A large and growing body of literature has investigated range flexibility and range anxiety, related to the limited range of the battery operated electric vehicle. The reduced driving range is usually regarded as a disadvantage or drawback in using the EV over a conventional car (Pierre et al 2011; Dimitropoulos et al., 2011).
This has been reflected in the qualitative part of the survey where some respondents reported they would charge the car every time they finished using it, daily regardless of battery status, always on arrival at home or after every journey. Others would charge ‘opportunistically’, which means whenever they can have access to a car park charging point. This is likely related to the range anxiety and 'topping up' the miles to increase the EV range whenever possible as shown below:
I charge it whether it needs it or not. Just to max up the miles. [...] There is always this unknown thing if you wanna go somewhere else. Just to put it charging it up, you've got that flexibility. And it takes two seconds to charge up, to plug it in. (Male, EV Shields Dad 1)
Related to the limits of battery use is the need to plan longer journeys to allow for vehicle charging (Kurani et al 1994). Our research shows that when asked whether they worried about running out of charge or not being able to find a charging point while out and about, some respondents reported a change in their practices. This change is reflected in the way they plan their journeys, e.g. they try to undertake journeys within their vehicle range as illustrated in the quote below:
We just plan a lot more, and I look at distances a lot more than I used to. RES(m): I think our confidence of the range now is that if we are the North East, we not gonna get stuck. We know we gonna get there and we get back. RES(f): The thing about Newcastle is; I was paying £5 a day to park in the purple car park. Now I can park for free and charge for free. But if I do have to pay for a charge I still park for free. So I'm actually paying for parking and not paying for fuel so it still a win-win. We did the calculation last year. (Female, EV Young Couple)
37
Copyright Northern Powergrid (Northeast) Limited, Northern Powergrid (Yorkshire) Plc, British Gas Trading Limited, University of Durham and EA Technology Ltd, 2014
I certainly wouldn't rely on it. I wouldn't rely on getting a spot at work. Because we got to work and there wasn't one then I am gonna be stuck and I don't wanna be stuck. So because of that I charge at home, I know what I've got. I could drive around to the bit where they are, find myself that there isn't one and then have to go back and park somewhere else. (Male, EV Shields Dad 1)
The EV is being perceived as a ‘weekday car’ and used exclusively to make routine home-work and back round trips.
We went to the lakes [Lake District] at Easter. And we took the diesel car. I'd have considered taking the Leaf if there was more infrastructure but obviously with the charge points, there is a load of them in the North East so I'm pretty confident around here. If you start going a little bit down towards the Lake District, [to south] there is a very few charge points. I think there is about five hundred in this area but if you start doing down ... I probably would have if I could plan the route but it's a little bit worrying and you obviously have the family in the car. [...] Yes, it's a family car now. Last week we had a ride through the Tynemouth for a day on a beach and I took it. I just charged it at home. The public points are quite good and a lot of them are actually free. (MH02_310713_TC6ev)
Some of participants have identified range anxiety as being one of the reasons to discontinue the usage of an electric vehicle in the future. Note that the survey as presented to the trial participants did not explicitly ask about their regular driving habits or normal mileage.
5.5 Acceptability of the EV
Taken all together, the electric vehicles received a positive feedback. The selections of quotes below identify vehicle features that the EV drivers appreciated the most. The first quote shows that the responded was happy with the car but would welcome more information about the technology:
I have been pleased with it. It's easy to charge, I charge it at the house. I've only ever charged it at the house. I didn't get a lot of information to be honest when we got the car, from anywhere. You're kind of left on your own devices trying to work it out of Internet and emails. (Male, EV Shields Dad 1)
In this quote, the respondent gives feedback on the design and driving experience but also mentions comments made by other people (clients):
They're brilliant. I thought I was going to hate it but I do love it. I've took a few clients it in because they can't believe they don't understand why somebody of my age would want electric car. They think it's really bizarre. When they get it in, it seems to click; they see it's really big inside. It's curious, the Japanese built ones, you've got all the techie things on it. (EV Young Couple)
The selection of quotes gives a mix of feedback on the driving experience, people’s perceptions of the EV car, and also the personal experience of how quiet the EV car is:
38
Copyright Northern Powergrid (Northeast) Limited, Northern Powergrid (Yorkshire) Plc, British Gas Trading Limited, University of Durham and EA Technology Ltd, 2014
Very easy, very nice to drive. Probably a shape boring [...] but they're certainly very comfortable, very nice. [...] [about the EV tariff] I don't really understand about different tariffs. I possibly should have done that. [Male, DL03_070813_TC6ev]
My friends and the family have been joking and that. People's perception of the electric car is, it's a little bob-car, limited in room ... People are amazed by it how much like a normal car it is. But it's actually better than a normal car, because it's so smooth, so quiet, it's more of a luxury! Absolutely brilliant. (Male, MH04_060813_ TC6ev )
That's another thing I found about the Leaf, it's quite a chill-out experience. You finish work on a night, you might have had a stressful day, you get in, you put the radio, it's just so quiet and nice. I don't know if I'm getting old or what it is [laughs] but it just is nice, just drift along. It's a little bit of chill-out. Again, the driving is such a different experience. I do like manual gear boxes and this is actually more like automatic. But it's just a chill-out experience driving the Leaf. (MH01_310713_TC6ev)
Taken together, the interviews point to drivers having significant concerns before use, but after familiarisation tending to acclimatise to the vehicle’s limitations and recognising its positive attributes.
5.6 Financial Motivation
To set the EV data into broader context the survey explored also general attitudes to energy usage. The data shows that 66 of respondents (75%) would like to reduce their current level of household consumption in order to save money (Figure 31). Financial motivations seem to prevail over environmental considerations as only 4 respondents (5%) reported they would like to reduce their consumption in order to help to conserve the environment; although at the same time, 90% or respondents reported that to be environmentally friendly in their day-to-day activities is very important (48%) or important (42%).
39
Copyright Northern Powergrid (Northeast) Limited, Northern Powergrid (Yorkshire) Plc, British Gas Trading Limited, University of Durham and EA Technology Ltd, 2014
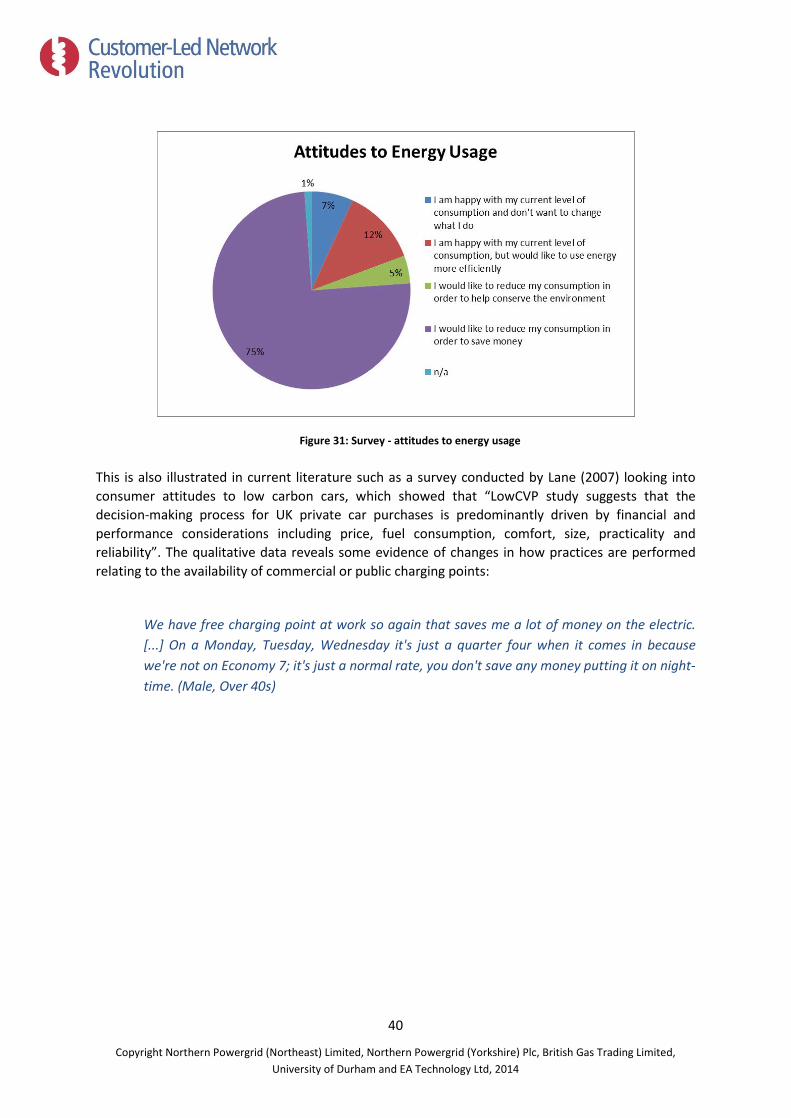
Figure 31: Survey - attitudes to energy usage
This is also illustrated in current literature such as a survey conducted by Lane (2007) looking into consumer attitudes to low carbon cars, which showed that “LowCVP study suggests that the decision-making process for UK private car purchases is predominantly driven by financial and performance considerations including price, fuel consumption, comfort, size, practicality and reliability”. The qualitative data reveals some evidence of changes in how practices are performed relating to the availability of commercial or public charging points:
We have free charging point at work so again that saves me a lot of money on the electric. [...] On a Monday, Tuesday, Wednesday it's just a quarter four when it comes in because we're not on Economy 7; it's just a normal rate, you don't save any money putting it on night-time. (Male, Over 40s)
40
Copyright Northern Powergrid (Northeast) Limited, Northern Powergrid (Yorkshire) Plc, British Gas Trading Limited, University of Durham and EA Technology Ltd, 2014
6 Conclusion and Implications
6.1 Peak Demand and Charging at Home
All of the charging curves show evening peaks in charging demand, which indicate that people are coming in from work or from other trips at the weekend and putting the car on charge. The growth in the diversity of the charging load indicates a balance between vehicles coming on charge following a commute, and vehicles coming off charge because their batteries are fully charged, yet still plugged in.
A simple analysis suggests that most vehicles would be fully charged within a 3-hour window assuming they were charged every day, suggesting that there is significant scope for a technical solution to managing the evening charging peak, i.e. introducing a delay or a slower charge. While this would on average result in a fully-charged vehicle when required, this may not be an easily acceptable option for all households, and might be severely tested if there was a household emergency requiring the vehicle.
It may be that additional information provided to the driver could alleviate some of the concerns with delayed charging. For example a phone app or in-home display which signalled to the driver when charging had started and ended would alleviate charging anxiety. However, most current home chargers are not equipped with this sort of capability.
6.2 Large Scale Adoption: Suggestions
Several factors seem to be the key to enable large-scale adoption of EV technology. One of the obvious factors is the initial investment people have to make when purchasing the car. Financial considerations are reported in this study as being of prime importance and there is a body of evidence which supports the primacy of financial considerations for vehicle purchase. Moreover, there is a high value placed on capital cost, and even when a vehicle such as an EV has a low operating cost, purchasers tend to underestimate the annual benefit.
Battery costs are falling but remain high. For the moment, the market evidence supports the strategy of Tesla, which is to market the benefits of a distinct but relatively expensive vehicle to a demographic which will appreciate its distinguishing characteristics and can afford a purchase.
While 'range anxiety' is clearly driven by a limited battery range, lack of confidence in range estimation and the perceived lack of emergency refuelling options, the presence of reliable charging infrastructure would make it possible to replace current hydrocarbon powered cars and enable EVs to take a role as a household primary vehicle. Anh (2008:2103) noted that “the gasoline-powered car still occupies a superior position in the automobile market because of the stability of its performance and the existence of a substantial infrastructure dedicated to that type of car, such as maintenance services”. Similarly, one of the respondents described:
Yes, it's the infrastructure (that's let the car down for me). We can't charge it. And if they put the infrastructure in and I gonna get to flee on the M3 find this ten people
41
Copyright Northern Powergrid (Northeast) Limited, Northern Powergrid (Yorkshire) Plc, British Gas Trading Limited, University of Durham and EA Technology Ltd, 2014
waiting for an hour charge and then you know ... There was this really high-tech talk in California where they're developing a liquid battery. They are developing a liquid battery that can charge a full charge in fifteen minutes or five minutes. And they say that if they can get this liquid battery to charge as quick as filling the car then people would just go to plug station, plug in, bang, five minutes! (Male, DL02_060813_TC6ev)
However we note that there is a distinction between the driver perception that infrastructure is the solution, versus their actual driving needs. The qualitative analysis suggests that home and workplace charging would provide the energy needs of a large proportion of journeys, but whether that is sufficient to alleviate concerns about range is a subject for further research. The successful adoption of EV technology would also need to include the presence of services associated with having a car, but customised to the new technology. Those include car insurance, maintenance, and driving schools, and in general training in how to use an EV.
6.3 Network Planning
At the moment, electric vehicles present a marginal technology and thus from a network planning perspective do not pose a significant network risk. This is likely to remain true unless EV technology becomes a mainstream one and is adopted on a large scale.
From a network perspective, an EV-enabled household is about equivalent to two normal households on average, with the peaks in household and EV charging being well-correlated daily and seasonally. Under conditions of widespread EV adoption, there is significant technical “headroom” to move charging to the later evening and overnight period, but research is required to determine how acceptable this would be to EV owners.
Neaimeh, et al. (2013) suggest that certain networks (e.g. urban networks with high public charging facilities and low journey distances) may be quite resilient in the face of increasing EV ownership. Other networks (e.g. sparse rural) may suffer headroom erosion and power flow problems much earlier, but not quickly enough to cause network constraints overnight.
Extensive future EV take-up may only be precipitated by vehicles with longer range and hence larger batteries and the ability to charge these batteries quickly. This is likely to mean larger chargers (i.e. 48A or larger, 3-phase) which will bring about network constraints much more quickly. However it is known that for EV owners using their vehicle for commuting the average daily driving distance is comfortably within current BEV range of approximately 100 miles, so a larger battery will help with range anxiety but not cause significant additional loads on a network, assuming current charger sizes and / or sufficient charging diversity, or slowed rates of charging.
Where public EV charging infrastructure exists there is likely to be a very strong incentive to reduce charging times, which is achieved by increasing charger power. Accommodating many high-powered chargers at a motorway EV filling station is likely to require a network upgrade, but it is expected that this would be funded by the owners of the charging infrastructure through normal connection agreement mechanisms.
42
Copyright Northern Powergrid (Northeast) Limited, Northern Powergrid (Yorkshire) Plc, British Gas Trading Limited, University of Durham and EA Technology Ltd, 2014
7 Appendix A – Data Validation
7.1 Data Collection and Handling
Charge Your Car (North) Ltd (CYC) receives data from the EV trials through metering services provided by G4S. Two types of metering are present in households and the following data are received by CYC:
a) 10-minute sample rate left-aligned EV charger data. All EV chargers in the CYC trials are nominal 3.6kW (16A @ 230V). b) 30-minute sample rate left-aligned household data.
The household and EV charger are metered independently and total household demand is calculated as the sum of the two. In order to do this, because the household data is 30-minute resolution the 10-minute EV data were averaged to 30 minutes using a SQL script. This calculated the 10-minute real power W10(t) from the measured apparent and reactive powers as W10(t) = Sqr(Abs((VA10(t) * VA10(t)) – (VAR10(t) * VAR10(t)))) which are then summed and averaged to produce average 30-minute power consumptions W30(t), i.e. W30(00:00) = [W10(00:00) + W10(00:10) + W10(00:20)] / 3; W30(00:30) = [W10(00.30) + W10(00.40) + W10(00.50)]; and so on.
All data is supplied in GMT and is converted to BST before computing peak days, diurnal profiles and other measurements on the data.
Household data was provided as 30-minute average power readings in CSV format. Validation of meter and customer numbers was performed by CYC before handover to CLNR. No filtering was performed on the household data, i.e. data was provided “as-is” from the meter by G4S to CYC and then DEI, with the only transformation being one of file consolidation and formatting.
7.2 Validation
Figure 32 shows the sorted maximum and minimum values of household demand in kW, measured for all customers in the trial. These are within acceptable bounds except for two customers who have a maximum reading of nearly 0kW; these are excluded from the analysis.
Figure 33 and Figure 34 show the maximum and minimum values of vehicle charger power throughput: apparent power and reactive power respectively. These are within physical bounds except for: a customer exhibiting a 6kVA maximum and -3.5kVA minimum, and a second customer showing a high (9.5kVA) maximum. These customers are excluded from the analysis. A further 10 customers show a maximum throughput of zero, or close to zero, kVA, implying that these chargers have never been used. Three customers are confirmed not to own an EV, and a further three have moved house, so these customers are excluded from the analysis as not being representative of an EV-owning population. A final three were at the time of writing being contacted by CYC to investigate their lack of home charging, but these are excluded from the present analysis under the assumption that they too have either moved or not owned an EV.
It was discovered that one customer with very low household demand does have an EV but charges mainly at work; this customer is retained in the calculations.
43
Copyright Northern Powergrid (Northeast) Limited, Northern Powergrid (Yorkshire) Plc, British Gas Trading Limited, University of Durham and EA Technology Ltd, 2014
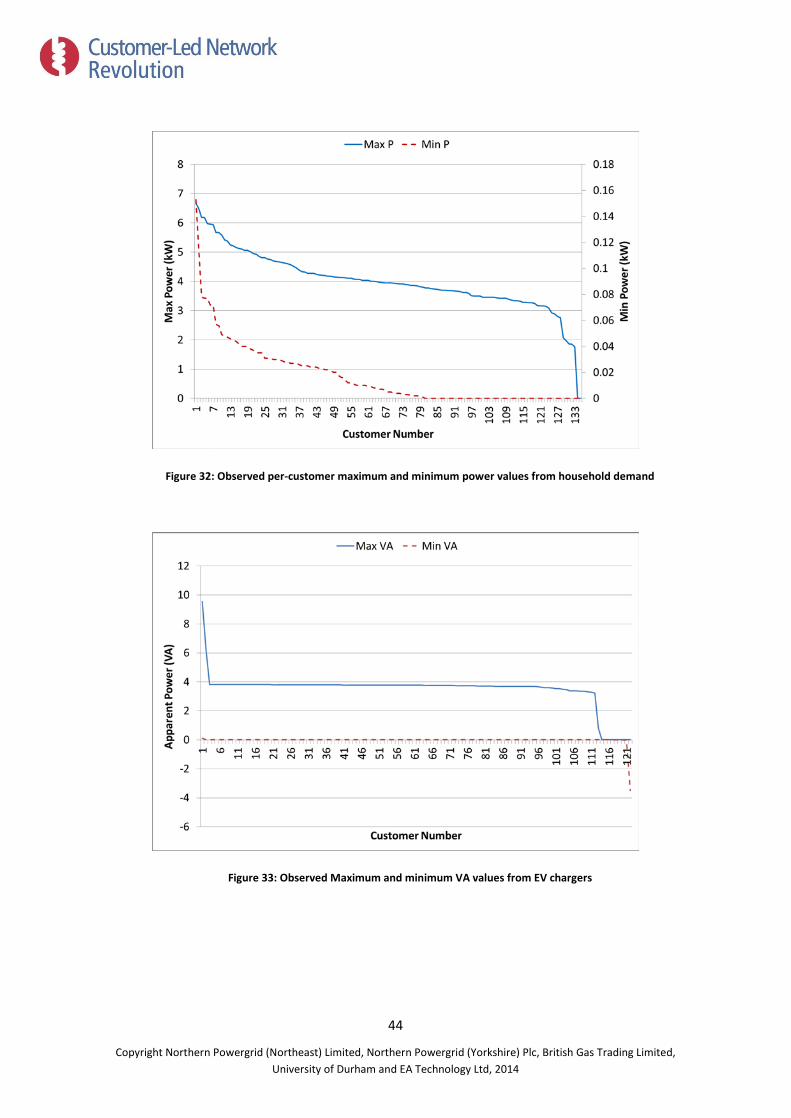
Figure 32: Observed per-customer maximum and minimum power values from household demand
Figure 33: Observed Maximum and minimum VA values from EV chargers
44
Copyright Northern Powergrid (Northeast) Limited, Northern Powergrid (Yorkshire) Plc, British Gas Trading Limited, University of Durham and EA Technology Ltd, 2014
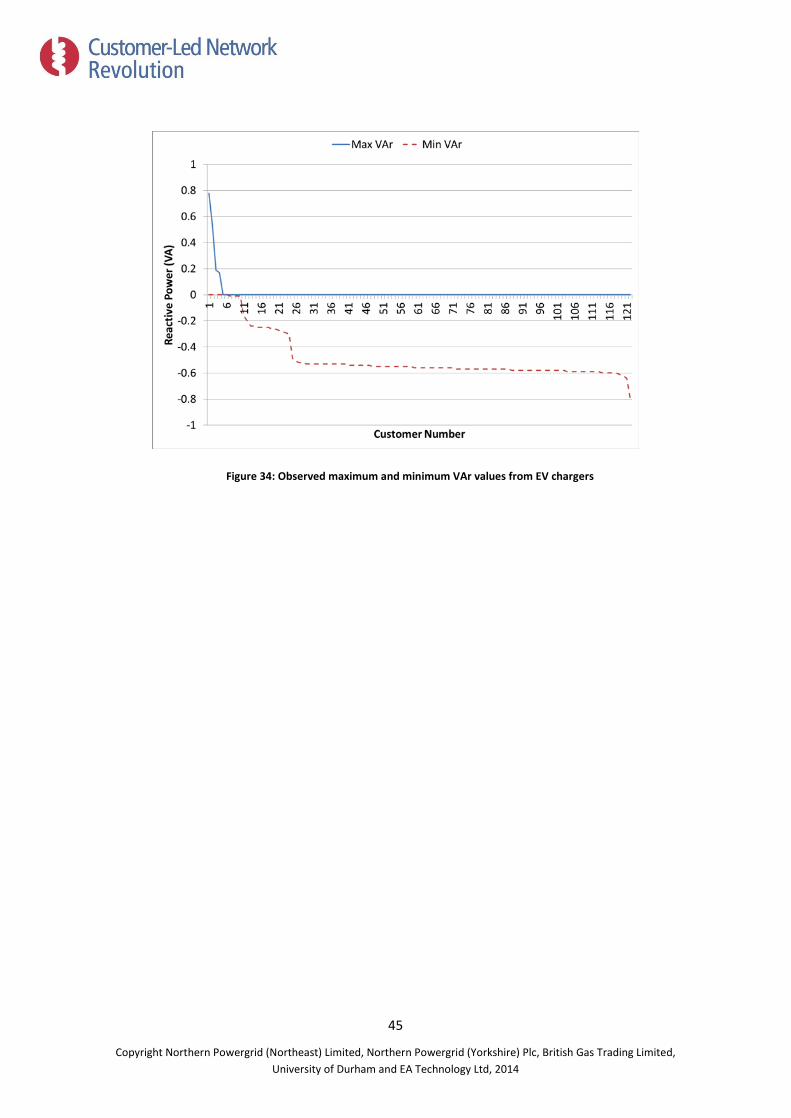
Figure 34: Observed maximum and minimum VAr values from EV chargers
45
Copyright Northern Powergrid (Northeast) Limited, Northern Powergrid (Yorkshire) Plc, British Gas Trading Limited, University of Durham and EA Technology Ltd, 2014
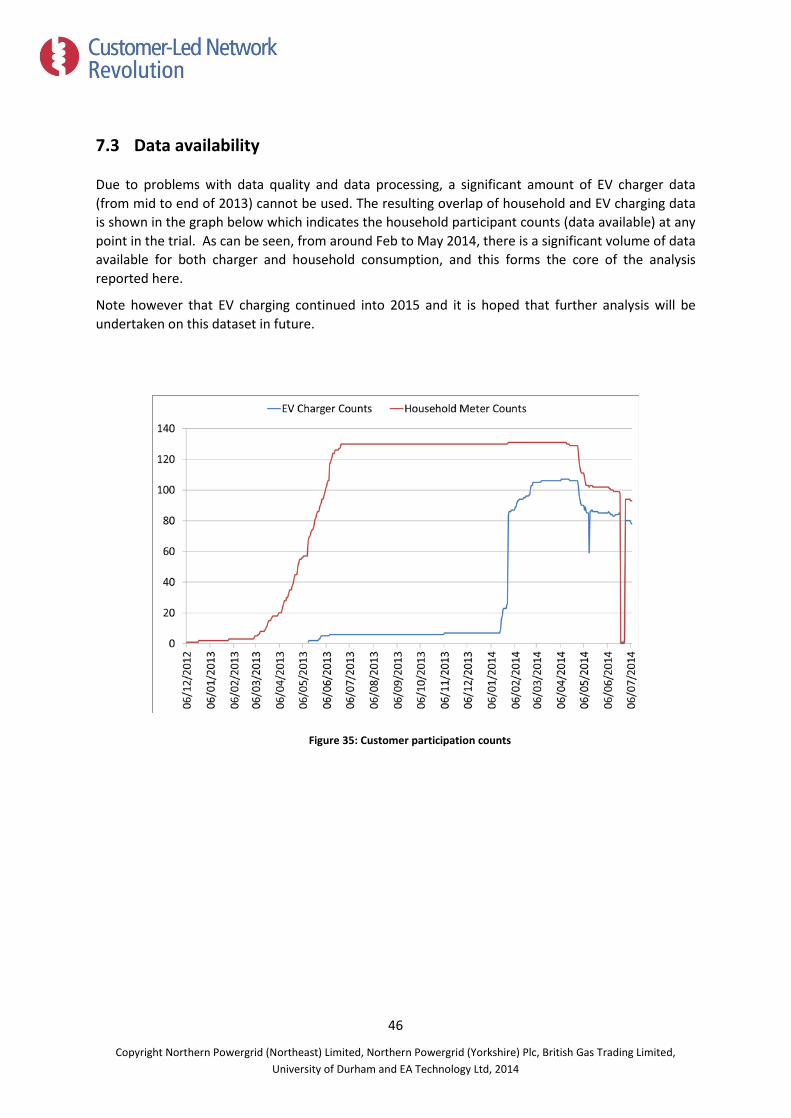
7.3 Data availability
Due to problems with data quality and data processing, a significant amount of EV charger data (from mid to end of 2013) cannot be used. The resulting overlap of household and EV charging data is shown in the graph below which indicates the household participant counts (data available) at any point in the trial. As can be seen, from around Feb to May 2014, there is a significant volume of data available for both charger and household consumption, and this forms the core of the analysis reported here.
Note however that EV charging continued into 2015 and it is hoped that further analysis will be undertaken on this dataset in future.
Figure 35: Customer participation counts
46
Copyright Northern Powergrid (Northeast) Limited, Northern Powergrid (Yorkshire) Plc, British Gas Trading Limited, University of Durham and EA Technology Ltd, 2014
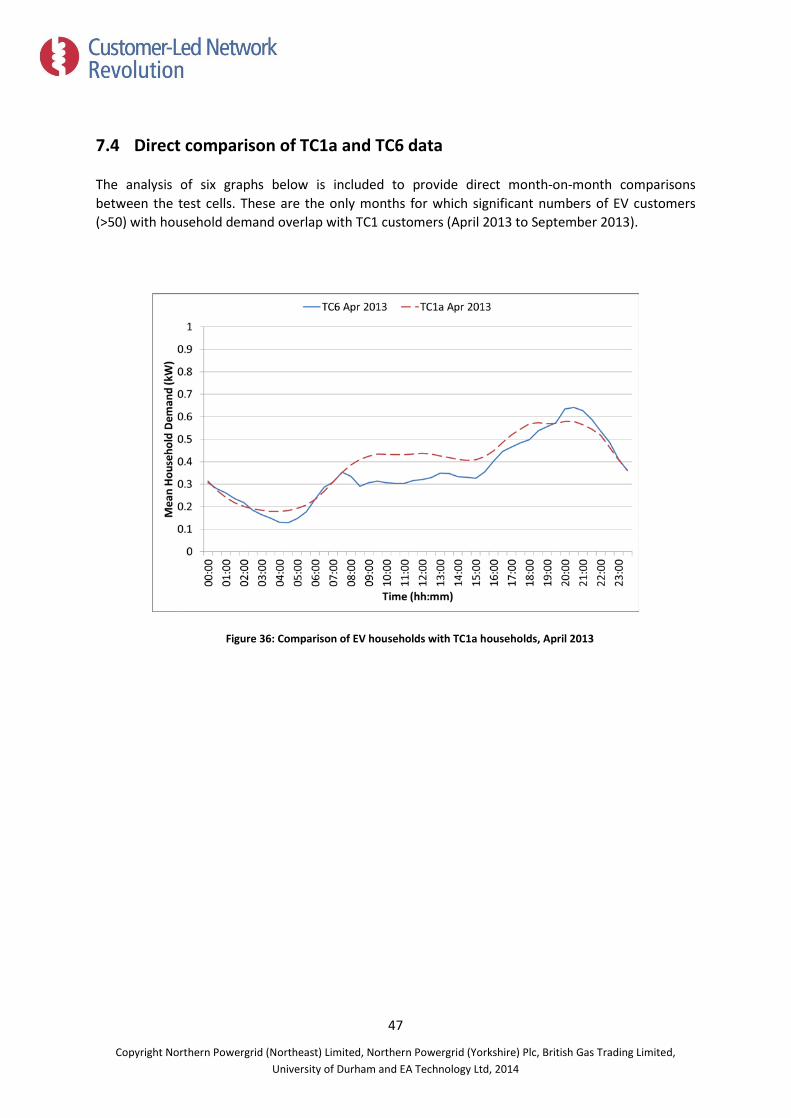
7.4 Direct comparison of TC1a and TC6 data
The analysis of six graphs below is included to provide direct month-on-month comparisons between the test cells. These are the only months for which significant numbers of EV customers (>50) with household demand overlap with TC1 customers (April 2013 to September 2013).
Figure 36: Comparison of EV households with TC1a households, April 2013
47
Copyright Northern Powergrid (Northeast) Limited, Northern Powergrid (Yorkshire) Plc, British Gas Trading Limited, University of Durham and EA Technology Ltd, 2014
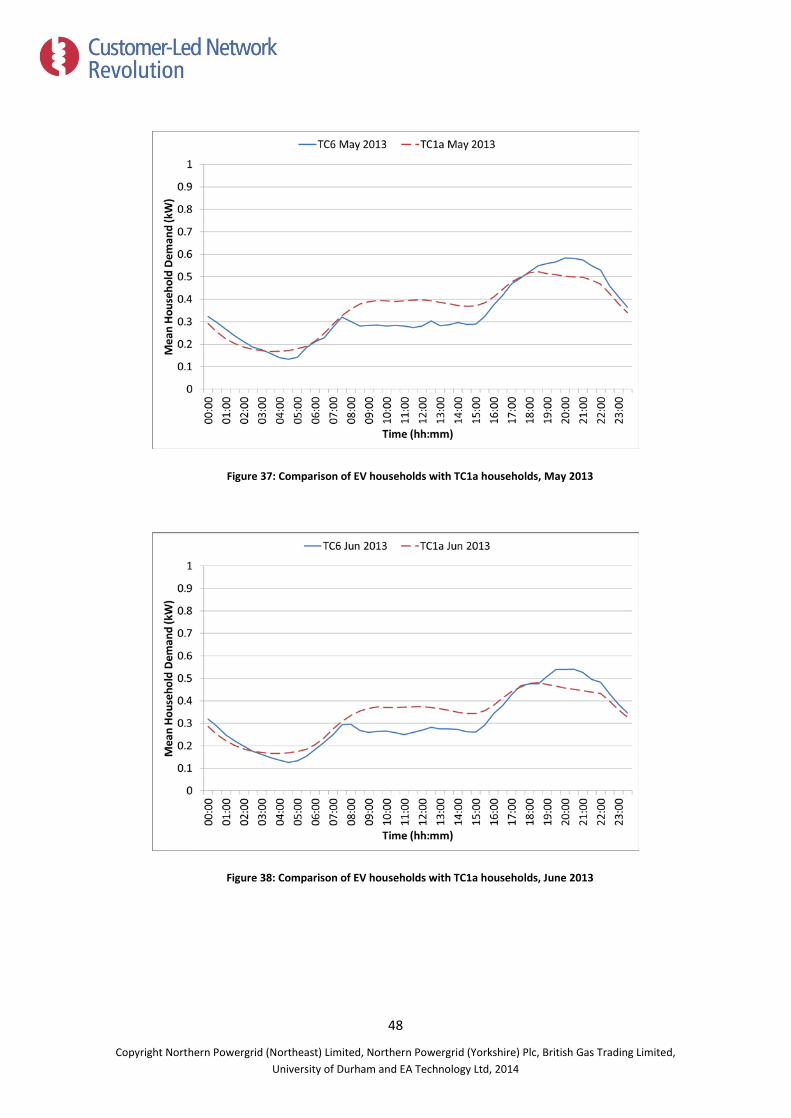
Figure 37: Comparison of EV households with TC1a households, May 2013
Figure 38: Comparison of EV households with TC1a households, June 2013
48
Copyright Northern Powergrid (Northeast) Limited, Northern Powergrid (Yorkshire) Plc, British Gas Trading Limited, University of Durham and EA Technology Ltd, 2014
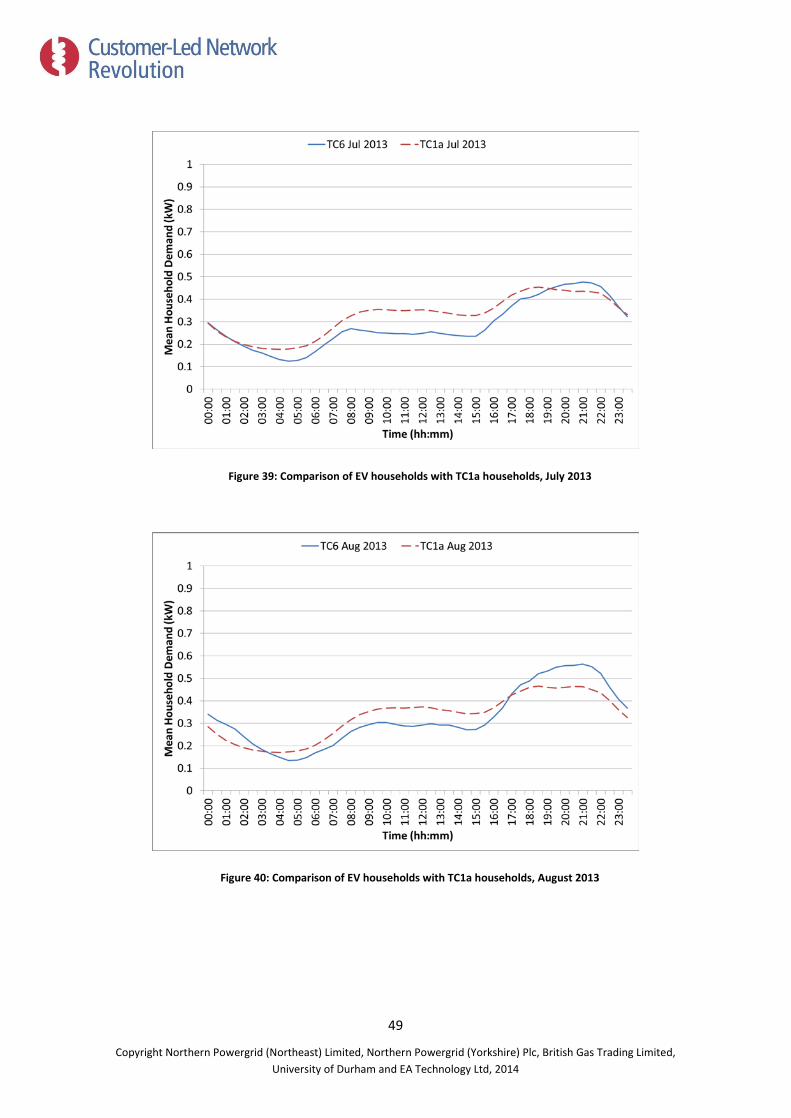
Figure 39: Comparison of EV households with TC1a households, July 2013
Figure 40: Comparison of EV households with TC1a households, August 2013
49
Copyright Northern Powergrid (Northeast) Limited, Northern Powergrid (Yorkshire) Plc, British Gas Trading Limited, University of Durham and EA Technology Ltd, 2014
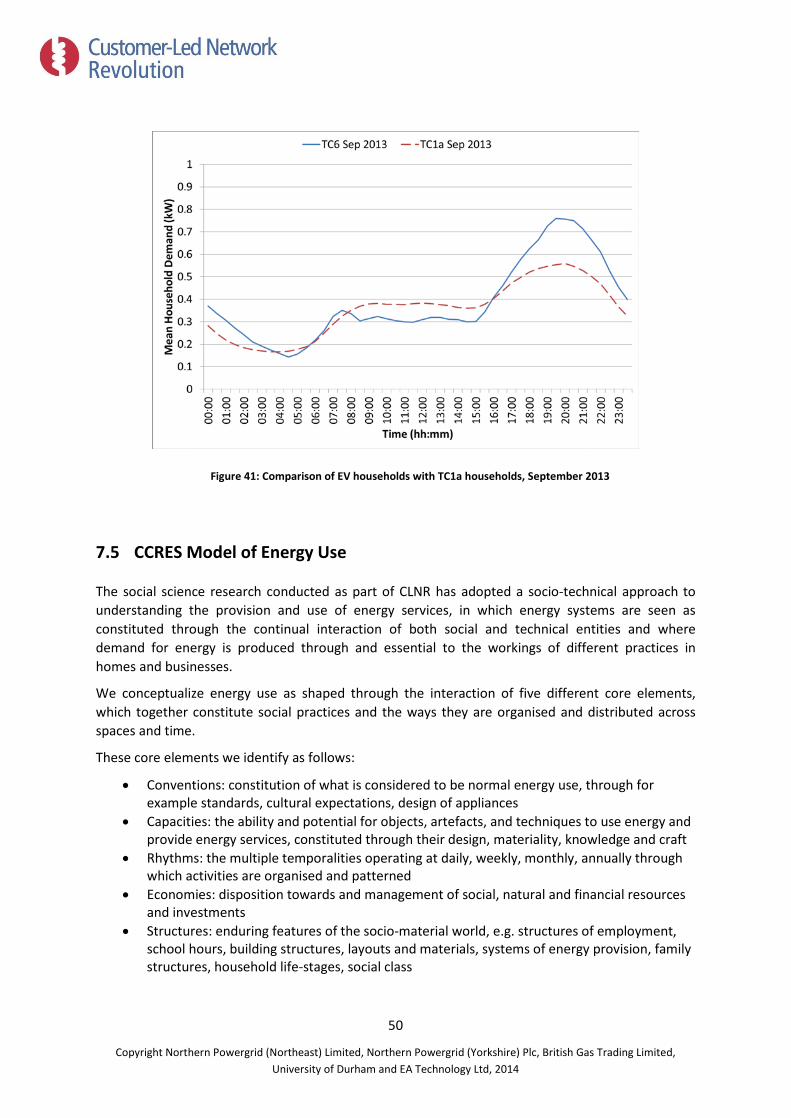
Figure 41: Comparison of EV households with TC1a households, September 2013
7.5 CCRES Model of Energy Use
The social science research conducted as part of CLNR has adopted a socio-technical approach to understanding the provision and use of energy services, in which energy systems are seen as constituted through the continual interaction of both social and technical entities and where demand for energy is produced through and essential to the workings of different practices in homes and businesses.
We conceptualize energy use as shaped through the interaction of five different core elements, which together constitute social practices and the ways they are organised and distributed across spaces and time.
These core elements we identify as follows:
• Conventions: constitution of what is considered to be normal energy use, through for example standards, cultural expectations, design of appliances
• Capacities: the ability and potential for objects, artefacts, and techniques to use energy and provide energy services, constituted through their design, materiality, knowledge and craft
• Rhythms: the multiple temporalities operating at daily, weekly, monthly, annually through which activities are organised and patterned
• Economies: disposition towards and management of social, natural and financial resources and investments
• Structures: enduring features of the socio-material world, e.g. structures of employment, school hours, building structures, layouts and materials, systems of energy provision, family structures, household life-stages, social class
50
Copyright Northern Powergrid (Northeast) Limited, Northern Powergrid (Yorkshire) Plc, British Gas Trading Limited, University of Durham and EA Technology Ltd, 2014
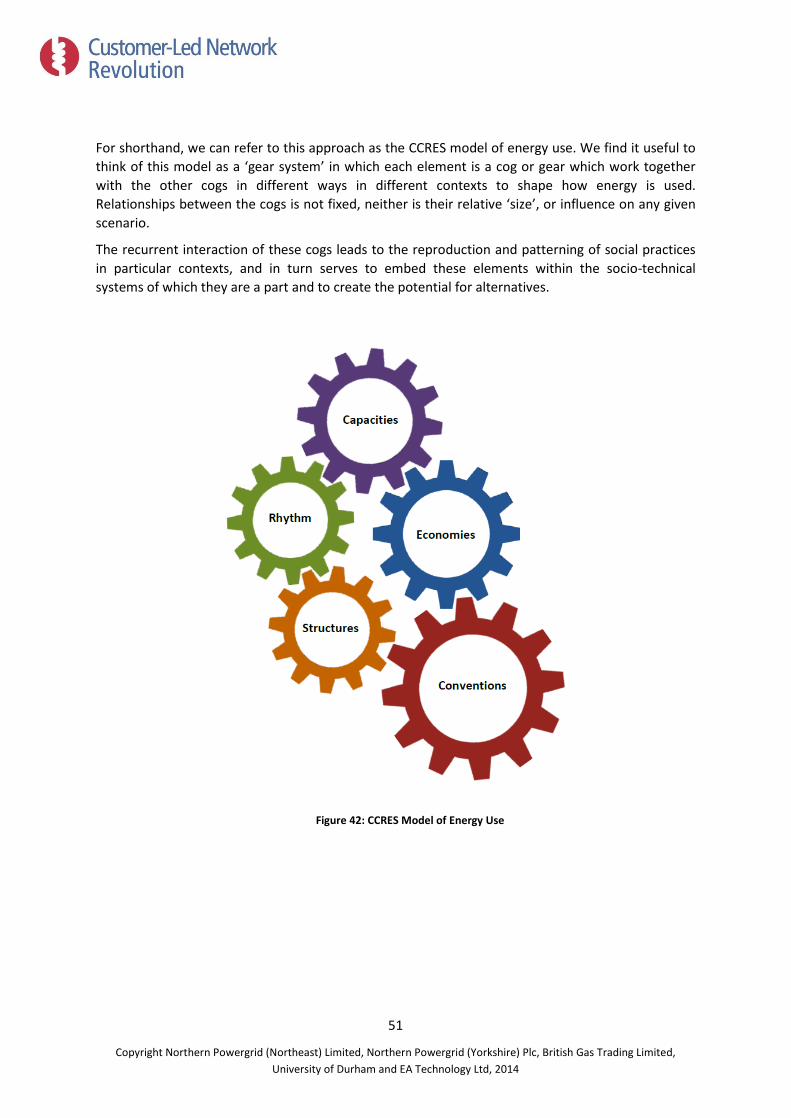
For shorthand, we can refer to this approach as the CCRES model of energy use. We find it useful to think of this model as a ‘gear system’ in which each element is a cog or gear which work together with the other cogs in different ways in different contexts to shape how energy is used. Relationships between the cogs is not fixed, neither is their relative ‘size’, or influence on any given scenario.
The recurrent interaction of these cogs leads to the reproduction and patterning of social practices in particular contexts, and in turn serves to embed these elements within the socio-technical systems of which they are a part and to create the potential for alternatives.
Figure 42: CCRES Model of Energy Use
51
Copyright Northern Powergrid (Northeast) Limited, Northern Powergrid (Yorkshire) Plc, British Gas Trading Limited, University of Durham and EA Technology Ltd, 2014
8 References Ahn, J., Gicheol, J., Kim, Y., (2008). A forecast of household ownership and use of alternative fuel vehicles: a multiple discrete-continuous choice approach. Energy Economics 30, 2091–2104.
Cass, N., Shove, E., & Urry, J. (2005). Social exclusion, mobility and access. The sociological review, 53(3), 539-555.
Department for Transport (DfT), “National Travel Survey: 2010 Statistical Release” (2011).
Dimitropoulos, A., Rietveld, P., van Ommeren, J.N., 2011. Consumer Valuation of Driving Range: A Meta-Analysis. Tinbergen Institute Discussion Paper, 133(3).
International Energy Agency (IEA), “EV City Casebook”, (2012). Retrieved from: http://www.iea.org/publications/freepublications/publication/name,31983,en.html
Future Transport Systems, “SwitchEV – Final Report” (2013). Retrieved from http://www.futuretransportsystems.co.uk/projects/switch-ev--final-report.aspx
Future Transport Systems, “SwitchEV Electric Vehicle Demonstration Project” (2013). Retrieved from: http://vehicletrial.switchev.co.uk/the-project.aspx
Hidrue, M. K., et al. (2011). "Willingness to pay for electric vehicles and their attributes." Resource and Energy Economics 33(3): 686-705.
Kurani, K. S., et al. (1994). "Demand for electric vehicles in hybrid households: an exploratory analysis." Transport Policy 1(4): 244-256.
Neaimeh, M., et al. (2013). “Integrating smart meter and electric vehicle charging data to predict distribution network impacts”. Proceedings of ISGT Europe, 2013 4th IEEE/PES, pp 1-5.
Office for Low Emission Vehicles (OLEV), “Plugged-In Places” (2013). Retrieved from: https://www.gov.uk/government/publications/plugged-in-places
Office for National Statistics (2009). Transport. Social Trends 41. ONS: London.
Ozaki, R. and K. Sevastyanova (2011). "Going hybrid: An analysis of consumer purchase motivations." Energy Policy 39(5): 2217-2227.
Pierre, M., et al. (2011). "Driving an electric vehicle. A sociological analysis on pioneer users." Energy Efficiency 4(4): 511-522.
Robinson, A. P., et al. (2013). “Analysis of electric vehicle driver recharging demand profiles and subsequent impacts on the carbon content of electric vehicle trips”. Energy Policy 61 (2013) 337-348.
Steg, L., et al. (2001). "The effects of motivational factors on car use: a multidisciplinary modelling approach." Transportation Research Part A: Policy and Practice 35(9): 789-806.
Wardle, J., et al. (2014). “The provision of public recharging infrastructure for Electric Vehicles in North East England – is there life after subsidies?” ASCE International Conference on Sustainable Infrastructure2014: Long Beach, California, USA.
52
Copyright Northern Powergrid (Northeast) Limited, Northern Powergrid (Yorkshire) Plc, British Gas Trading Limited, University of Durham and EA Technology Ltd, 2014

For enquires about the project Contact [email protected]
www.networkrevolution.co.uk
Copyright Northern Powergrid (Northeast) Limited, Northern Powergrid (Yorkshire) Plc, British Gas Trading Limited and the University of Durham 2015