Embed Size (px)
Citation preview
ELECTRIC VEHICLES TODAY AND TOMORROW
Delaware Valley Regional Planning Commission
Monday, November 6, 2017Gil Tal [email protected] Ji [email protected]
Tom Turrentine [email protected]
EV Toolbox Introduction
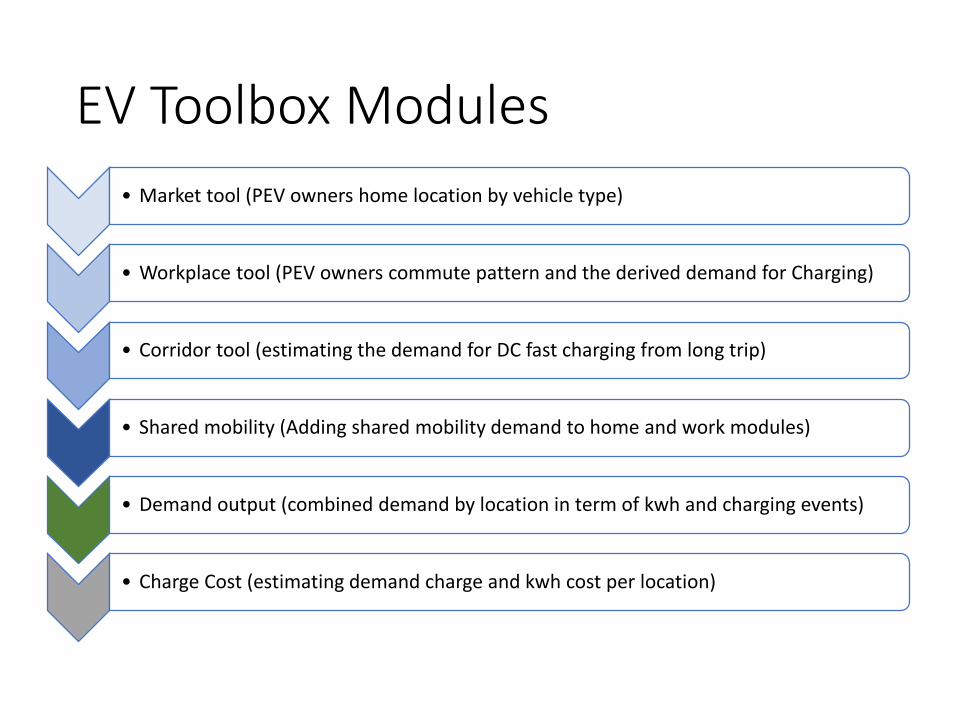
EV Toolbox Modules • Market tool (PEV owners home location by vehicle type)
• Workplace tool (PEV owners commute pattern and the derived demand for Charging)
• Corridor tool (estimating the demand for DC fast charging from long trip)
• Shared mobility (Adding shared mobility demand to home and work modules)
• Demand output (combined demand by location in term of kwh and charging events)
• Charge Cost (estimating demand charge and kwh cost per location)
Composition
• Market tool -> the spatial distribution of PEVs• Fast charging tool -> corridor charging demand• Workplace tool -> workplace charging demand
1.1 Market Tool
• Predict the spatial distribution and/or temporal development of plug-in electric vehicle (PEV) market
• PHEV• Short-range BEV• Long-range BEV• Luxury BEV (e.g. Tesla)
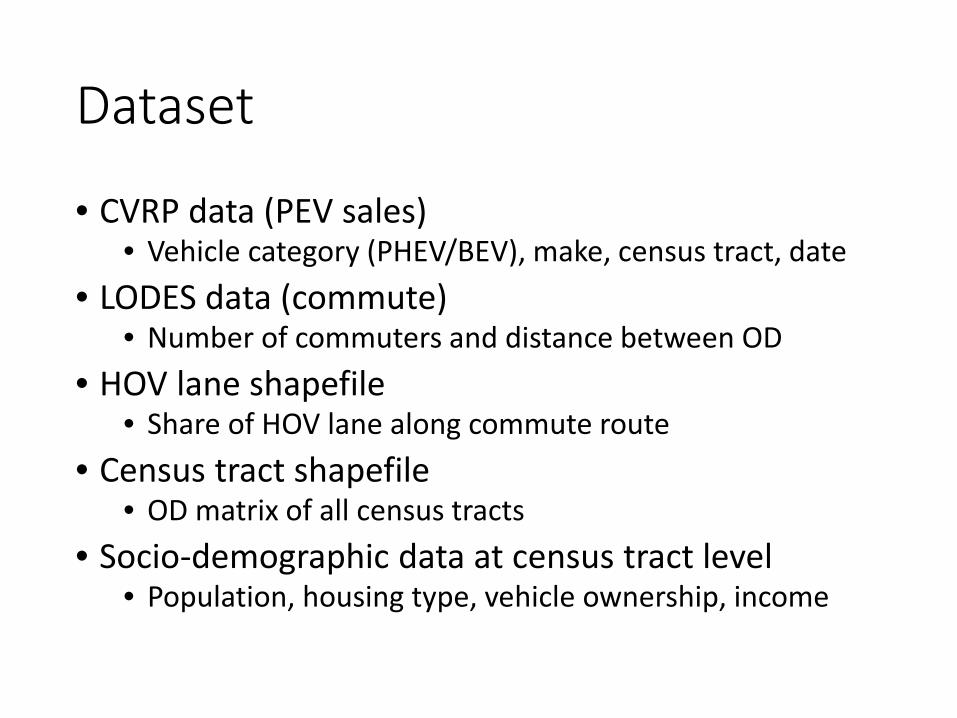
Dataset
• CVRP data (PEV sales)• Vehicle category (PHEV/BEV), make, census tract, date
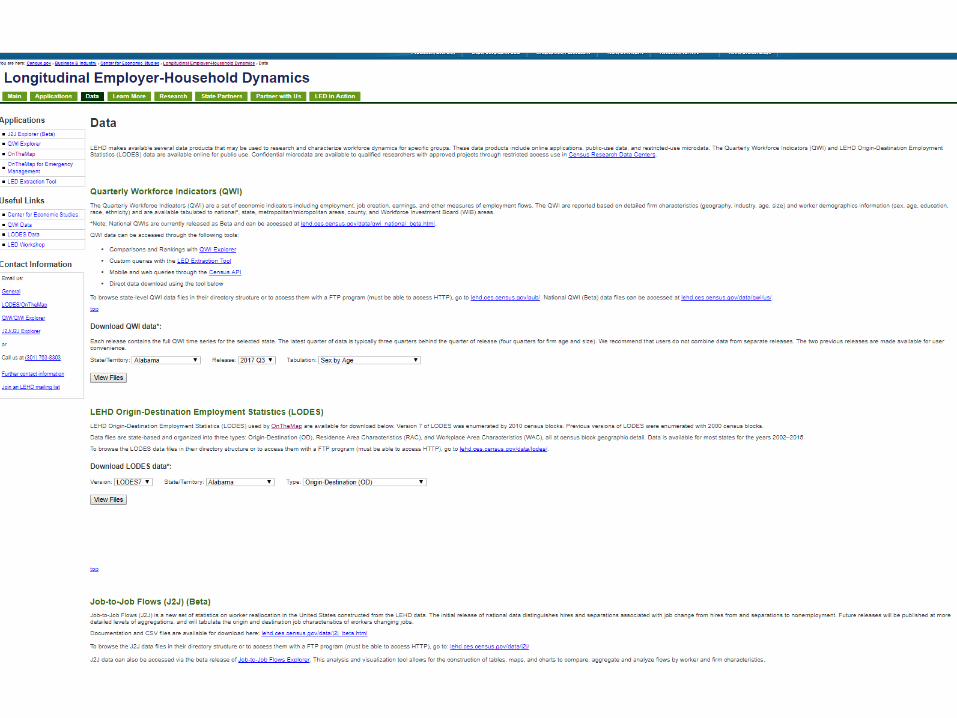
• LODES data (commute)• Number of commuters and distance between OD
• HOV lane shapefile• Share of HOV lane along commute route
• Census tract shapefile• OD matrix of all census tracts
• Socio-demographic data at census tract level• Population, housing type, vehicle ownership, income
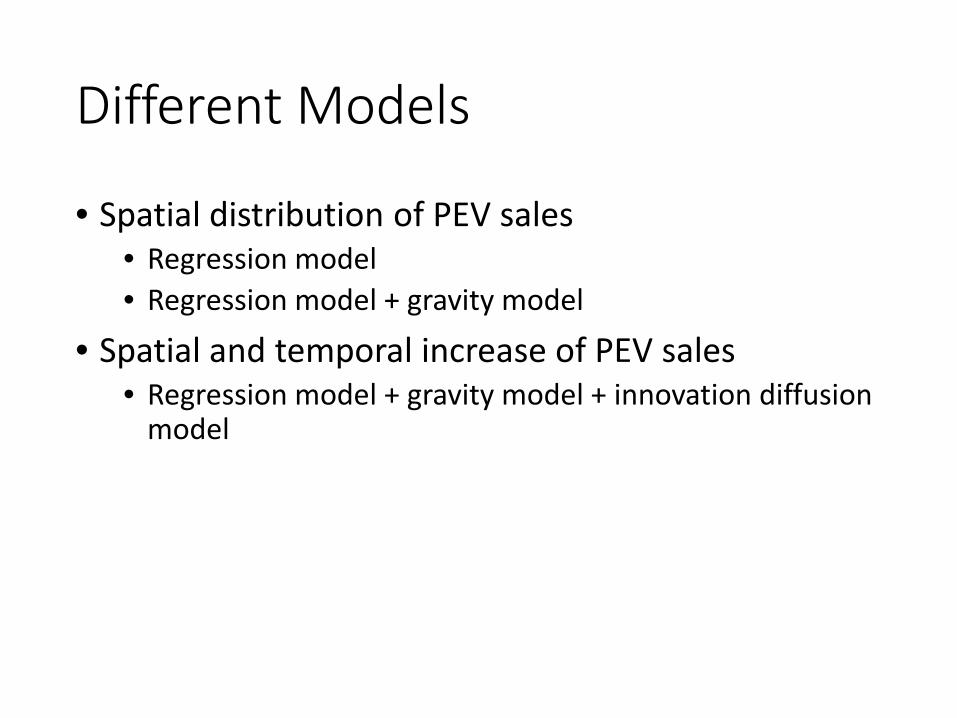
Different Models
• Spatial distribution of PEV sales• Regression model• Regression model + gravity model
• Spatial and temporal increase of PEV sales• Regression model + gravity model + innovation diffusion
model
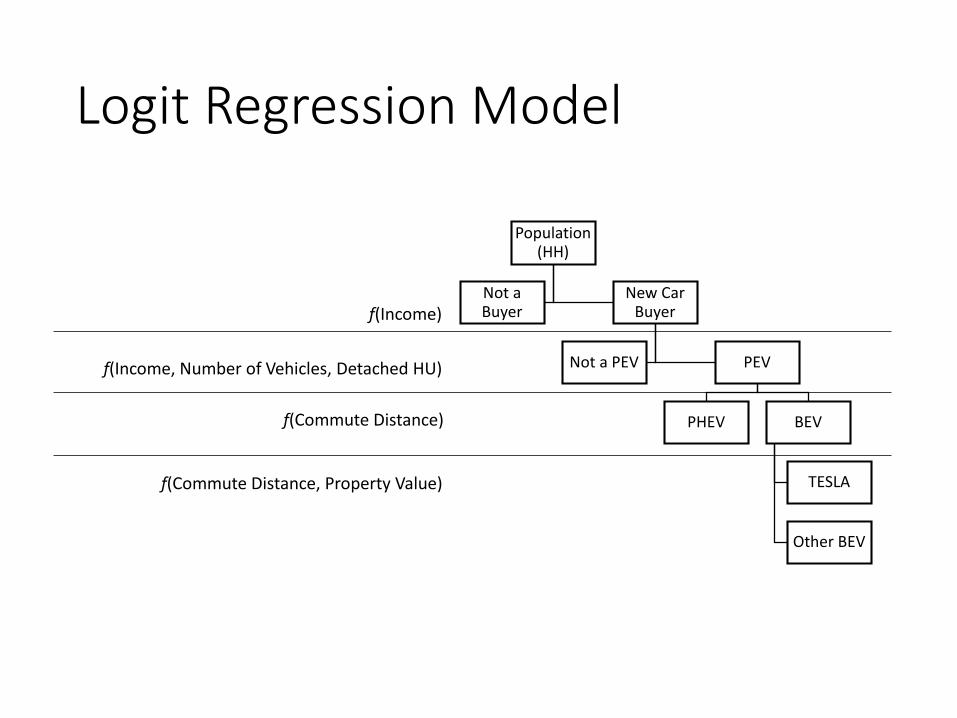
Logit Regression Model
Population (HH)
Not a Buyer
New Car Buyer
Not a PEV PEV
PHEV BEV
TESLA
Other BEV
f(Income)
f(Income, Number of Vehicles, Detached HU)
f(Commute Distance)
f(Commute Distance, Property Value)
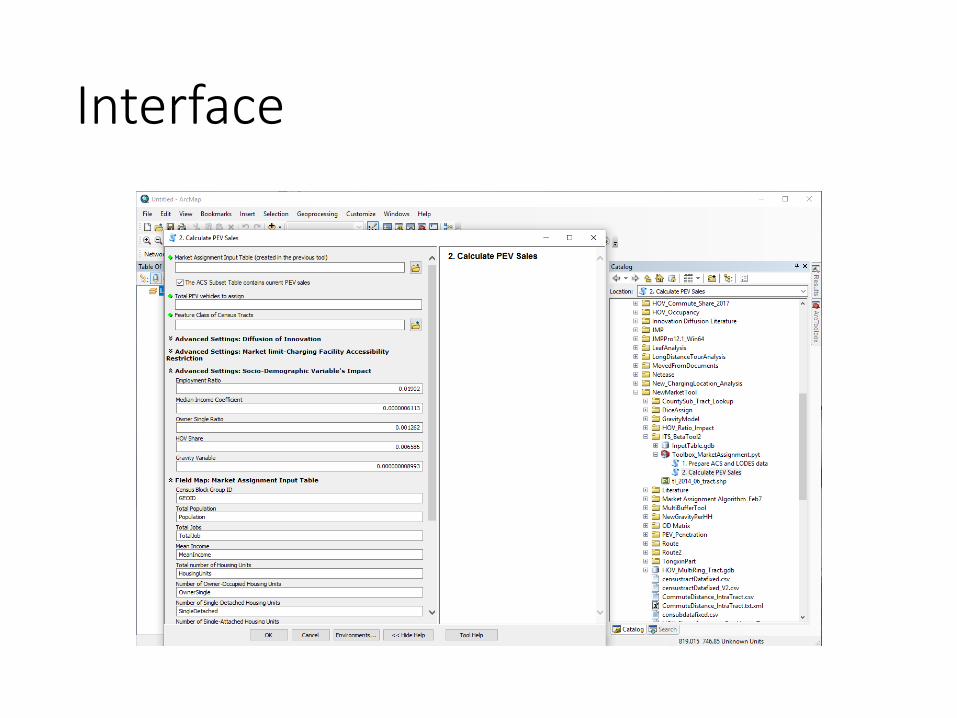
Interface
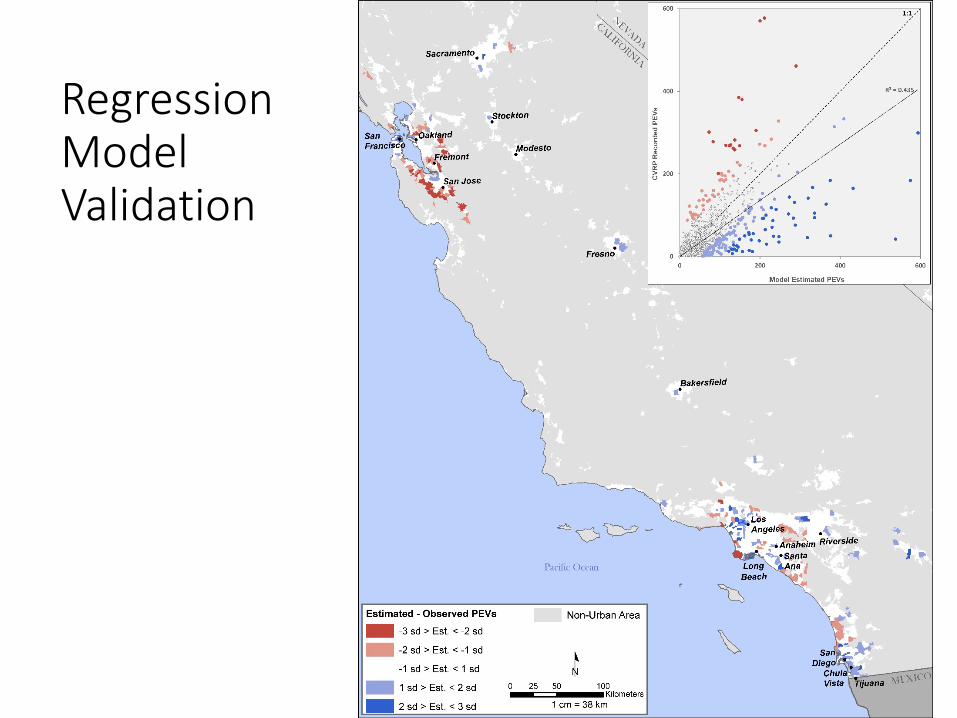
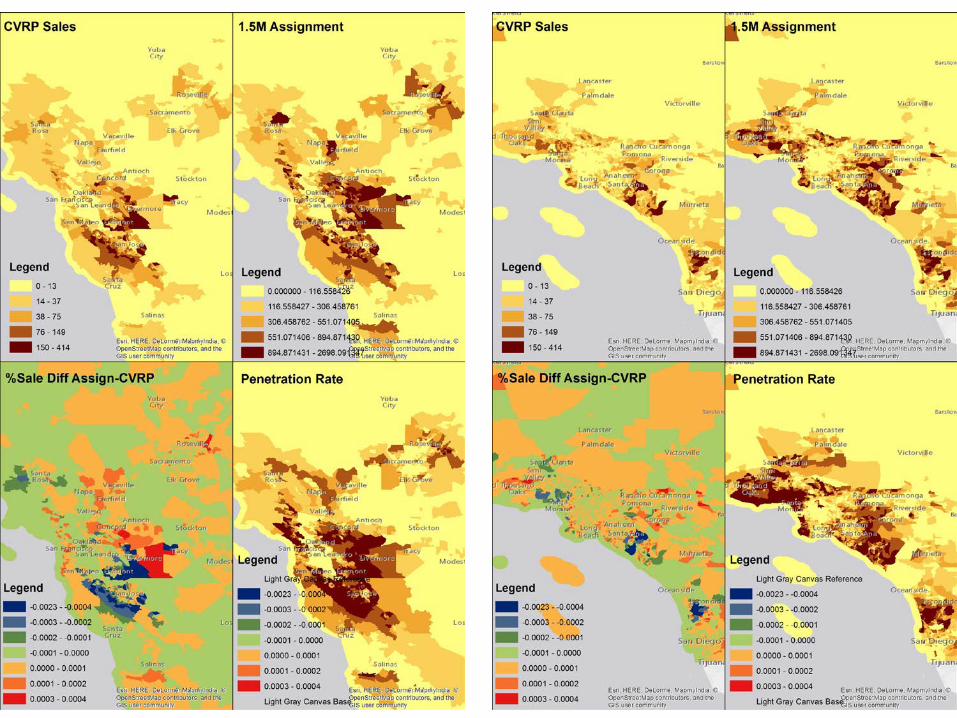
Regression Model Validation
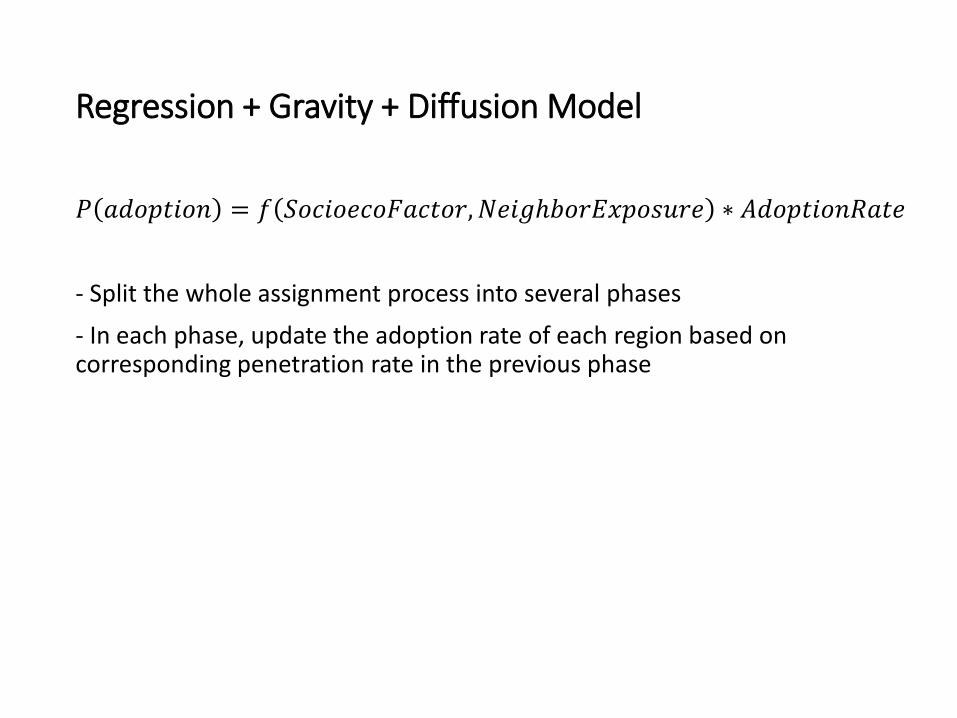
Regression + Gravity + Diffusion Model
𝑃𝑃 𝑎𝑎𝑎𝑎𝑎𝑎𝑎𝑎𝑎𝑎𝑎𝑎𝑎𝑎𝑎𝑎 = 𝑓𝑓 𝑆𝑆𝑎𝑎𝑆𝑆𝑎𝑎𝑎𝑎𝑆𝑆𝑆𝑆𝑎𝑎𝑆𝑆𝑎𝑎𝑆𝑆𝑎𝑎𝑎𝑎𝑆𝑆,𝑁𝑁𝑆𝑆𝑎𝑎𝑁𝑁𝑁𝑁𝑁𝑎𝑎𝑆𝑆𝑁𝑁𝑁𝑁𝑎𝑎𝑎𝑎𝑁𝑁𝑁𝑁𝑆𝑆𝑆𝑆 ∗ 𝐴𝐴𝑎𝑎𝑎𝑎𝑎𝑎𝑎𝑎𝑎𝑎𝑎𝑎𝑎𝑎𝐴𝐴𝑎𝑎𝑎𝑎𝑆𝑆
- Split the whole assignment process into several phases- In each phase, update the adoption rate of each region based on corresponding penetration rate in the previous phase
1.2 Fast Charging Tool
• Simulate driving and charging behavior• Estimate corridor charging demand• What’s more:
• Evaluate current chargers• Evaluate proposed locations• Choose new sites that are underserved
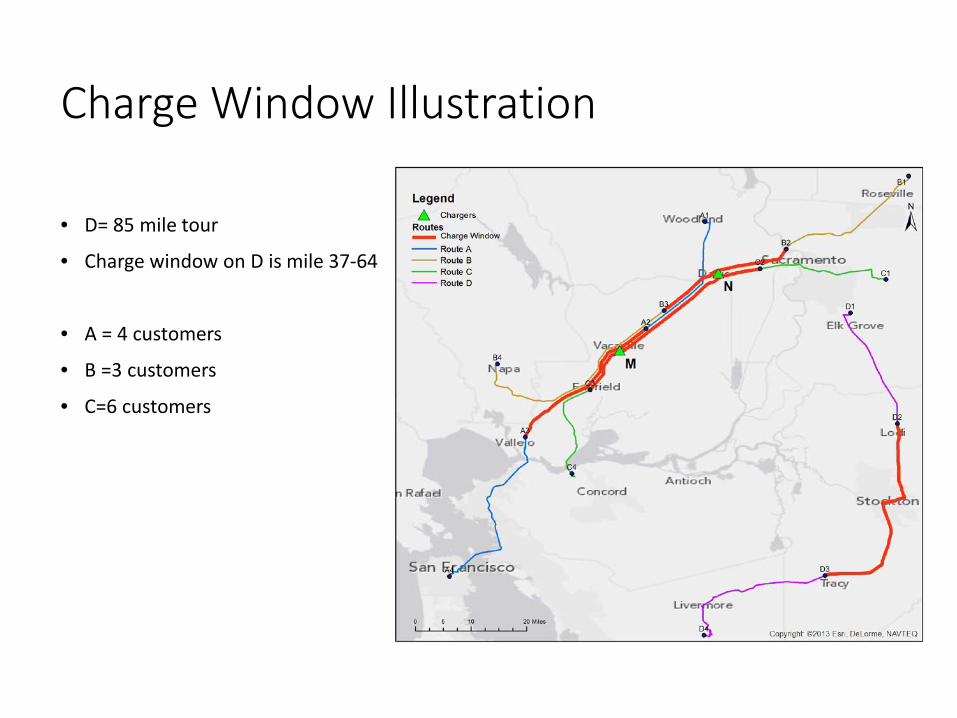
Charge Window Illustration
• D= 85 mile tour
• Charge window on D is mile 37-64
• A = 4 customers
• B =3 customers
• C=6 customers
Dataset
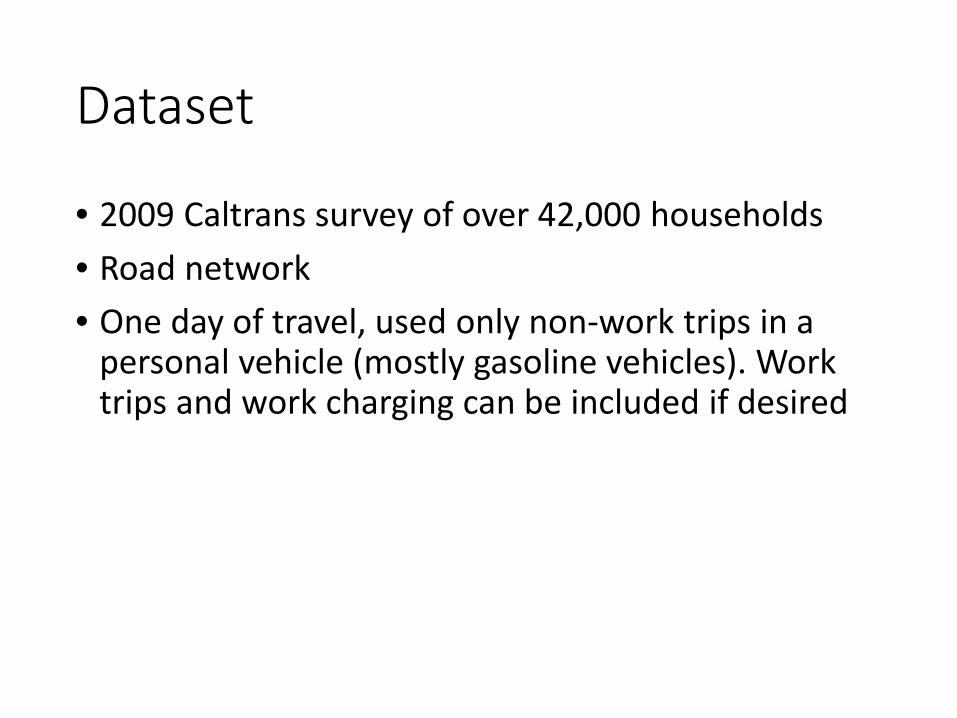
• 2009 Caltrans survey of over 42,000 households• Road network• One day of travel, used only non-work trips in a
personal vehicle (mostly gasoline vehicles). Work trips and work charging can be included if desired
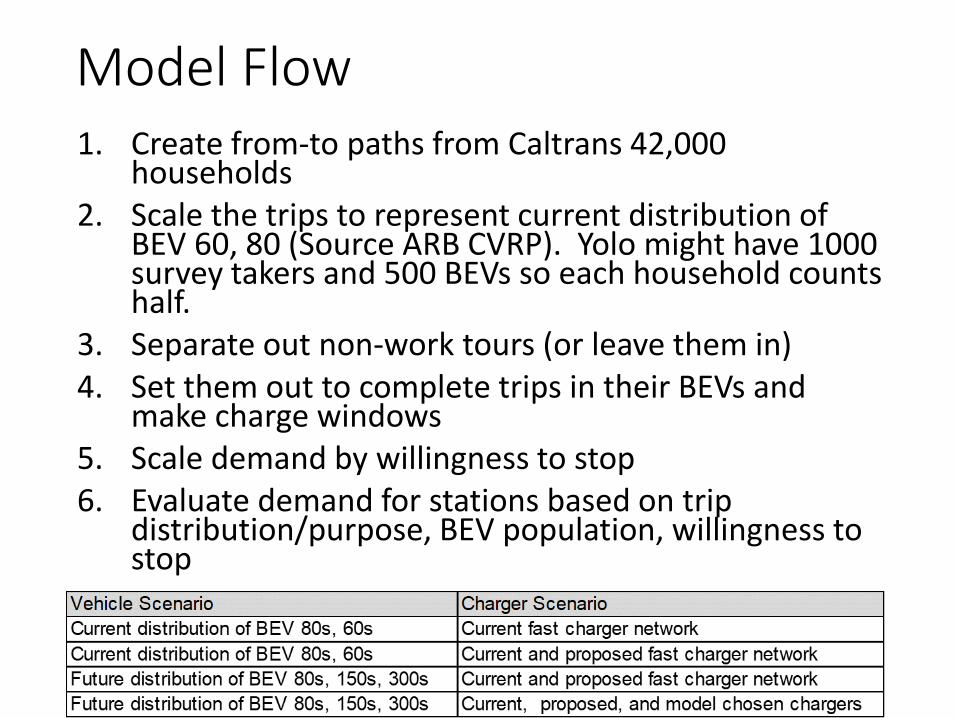
Model Flow1. Create from-to paths from Caltrans 42,000
households2. Scale the trips to represent current distribution of
BEV 60, 80 (Source ARB CVRP). Yolo might have 1000 survey takers and 500 BEVs so each household counts half.
3. Separate out non-work tours (or leave them in)4. Set them out to complete trips in their BEVs and
make charge windows5. Scale demand by willingness to stop6. Evaluate demand for stations based on trip
distribution/purpose, BEV population, willingness to stop
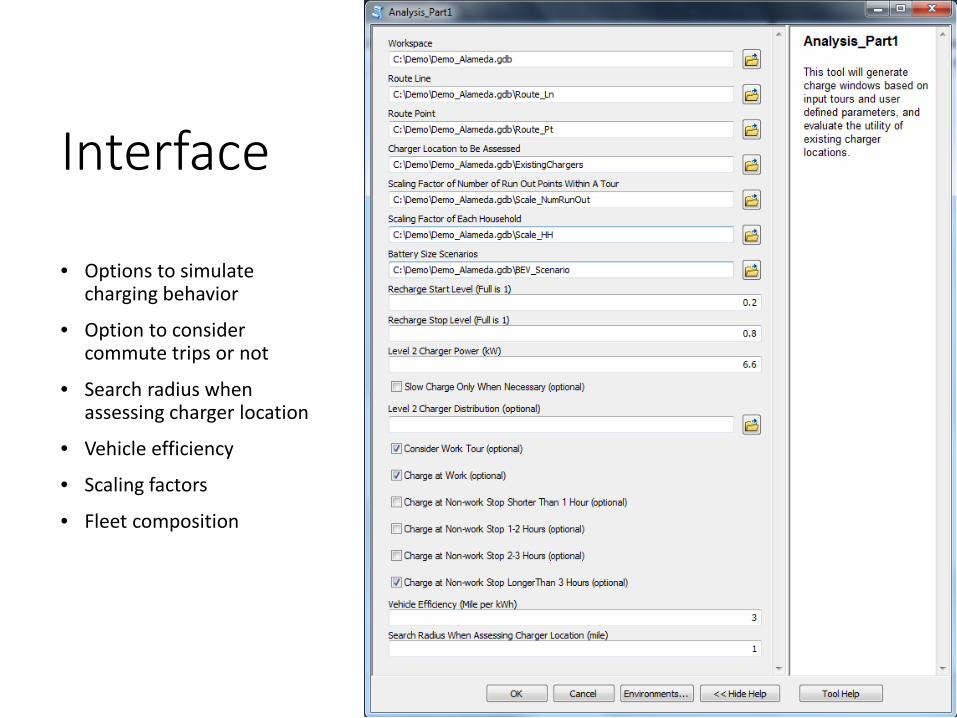
Interface
• Options to simulate charging behavior
• Option to consider commute trips or not
• Search radius when assessing charger location
• Vehicle efficiency
• Scaling factors
• Fleet composition
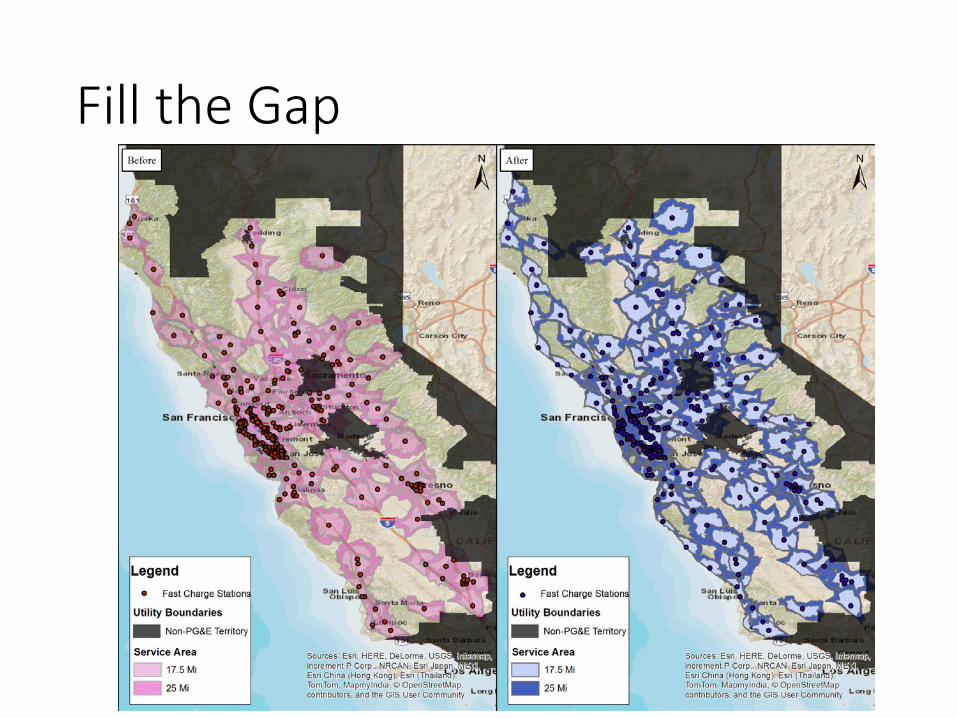
Fill the Gap
1.3 Workplace Charging Tool
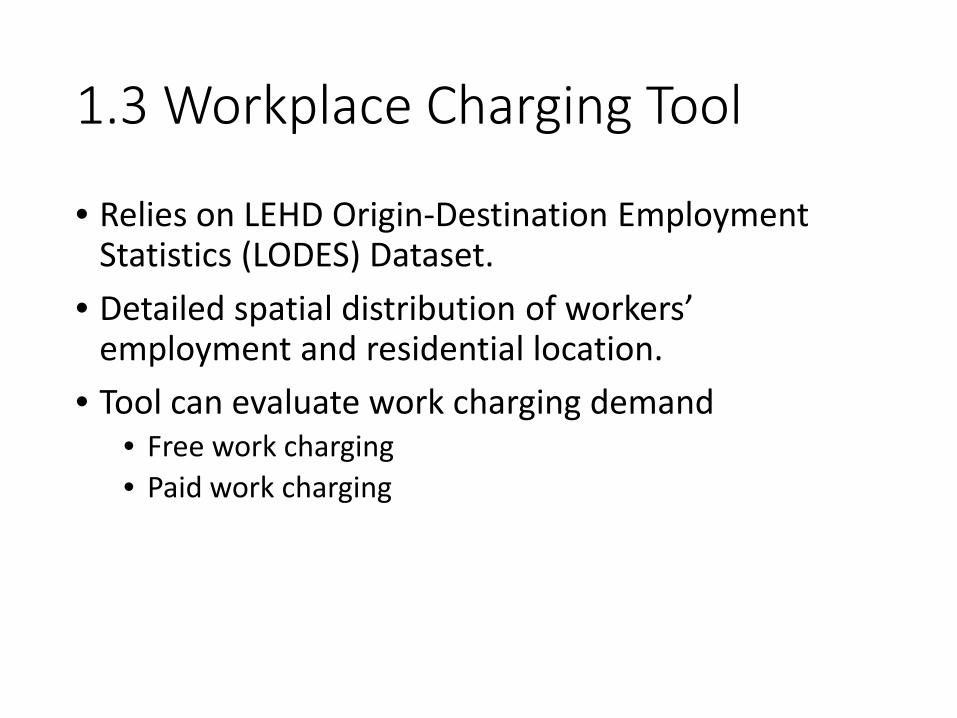
• Relies on LEHD Origin-Destination Employment Statistics (LODES) Dataset.
• Detailed spatial distribution of workers’ employment and residential location.
• Tool can evaluate work charging demand• Free work charging• Paid work charging
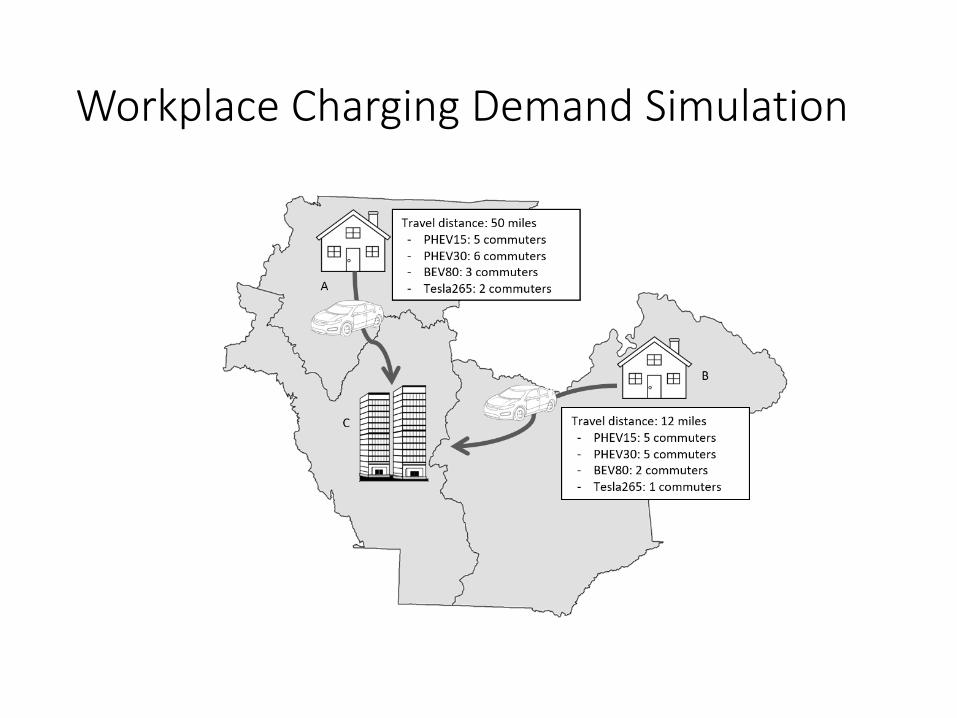
Workplace Charging Demand Simulation
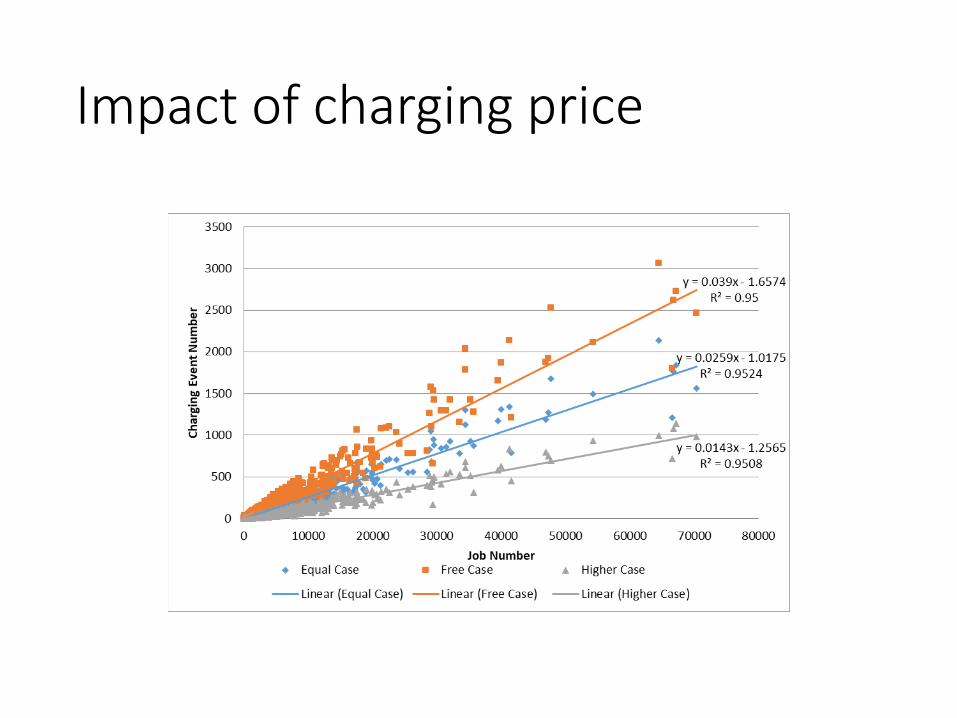
Impact of charging price
1.4 Combination of 3 Types Demand
• Charging demand that might appear at fast charging stations:
• Corridor demand• Near workplace• Near home
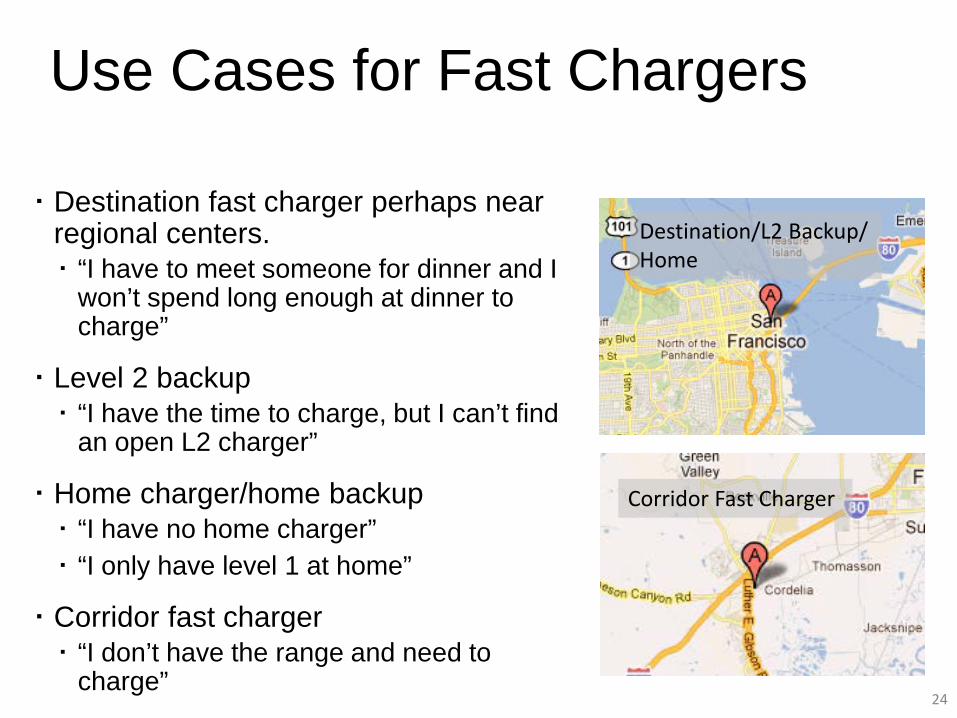
Use Cases for Fast Chargers
24
Destination fast charger perhaps near regional centers. “I have to meet someone for dinner and I
won’t spend long enough at dinner to charge”
Level 2 backup “I have the time to charge, but I can’t find
an open L2 charger”
Home charger/home backup “I have no home charger” “I only have level 1 at home”
Corridor fast charger “I don’t have the range and need to
charge”
Corridor Fast Charger
Destination/L2 Backup/ Home
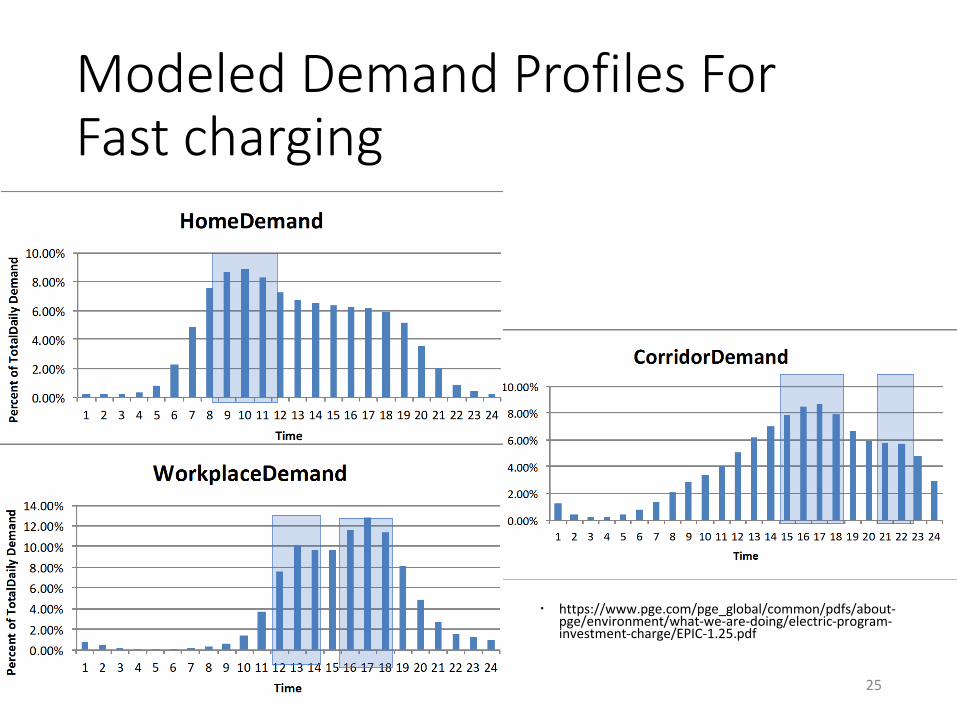
Modeled Demand Profiles For Fast charging
25
https://www.pge.com/pge_global/common/pdfs/about-pge/environment/what-we-are-doing/electric-program-investment-charge/EPIC-1.25.pdf
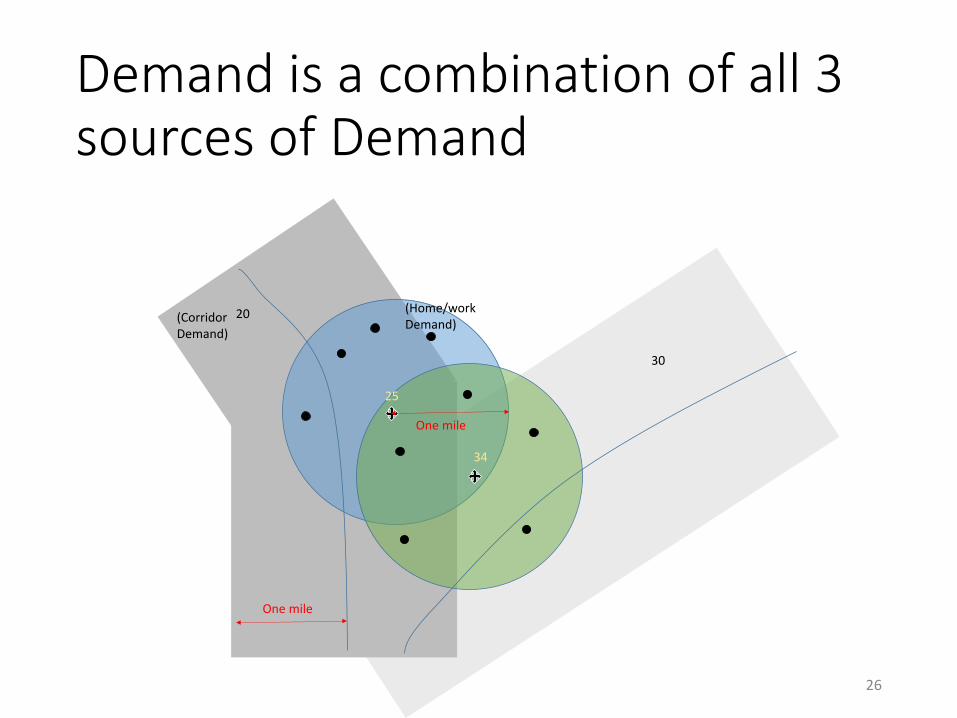
Demand is a combination of all 3 sources of Demand
26
30
20
25
34
One mile
(Corridor Demand)
(Home/work Demand)
One mile
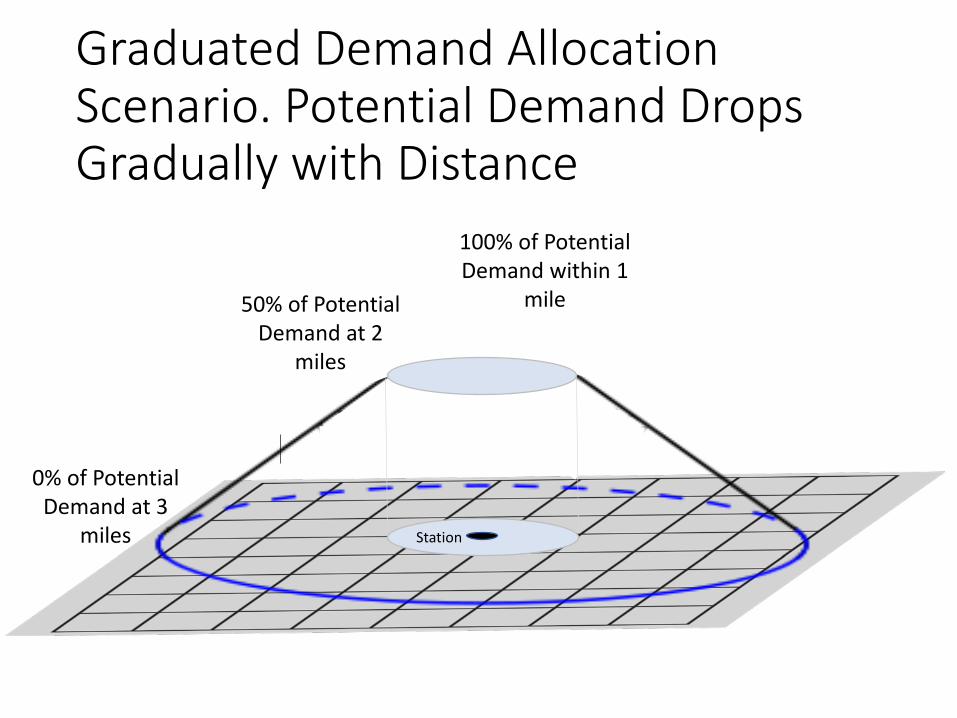
Graduated Demand Allocation Scenario. Potential Demand Drops Gradually with Distance
0% of Potential Demand at 3
miles
100% of Potential Demand within 1
mile50% of Potential Demand at 2
miles
Station
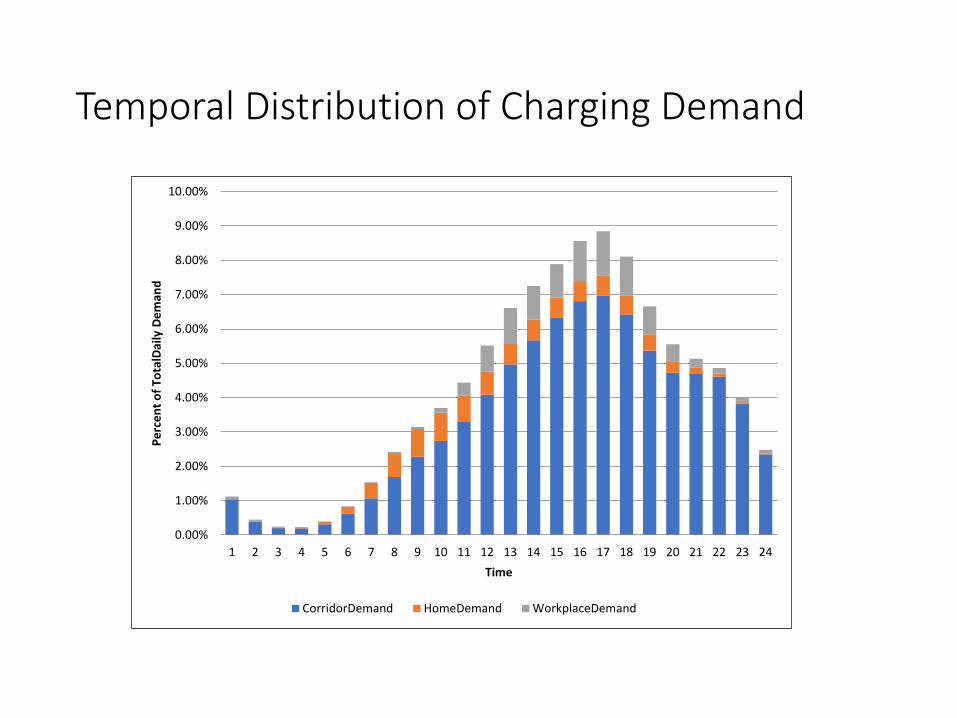
Temporal Distribution of Charging Demand
0.00%
1.00%
2.00%
3.00%
4.00%
5.00%
6.00%
7.00%
8.00%
9.00%
10.00%
1 2 3 4 5 6 7 8 9 10 11 12 13 14 15 16 17 18 19 20 21 22 23 24
Perc
ent o
f Tot
alDa
ily D
eman
d
Time
CorridorDemand HomeDemand WorkplaceDemand
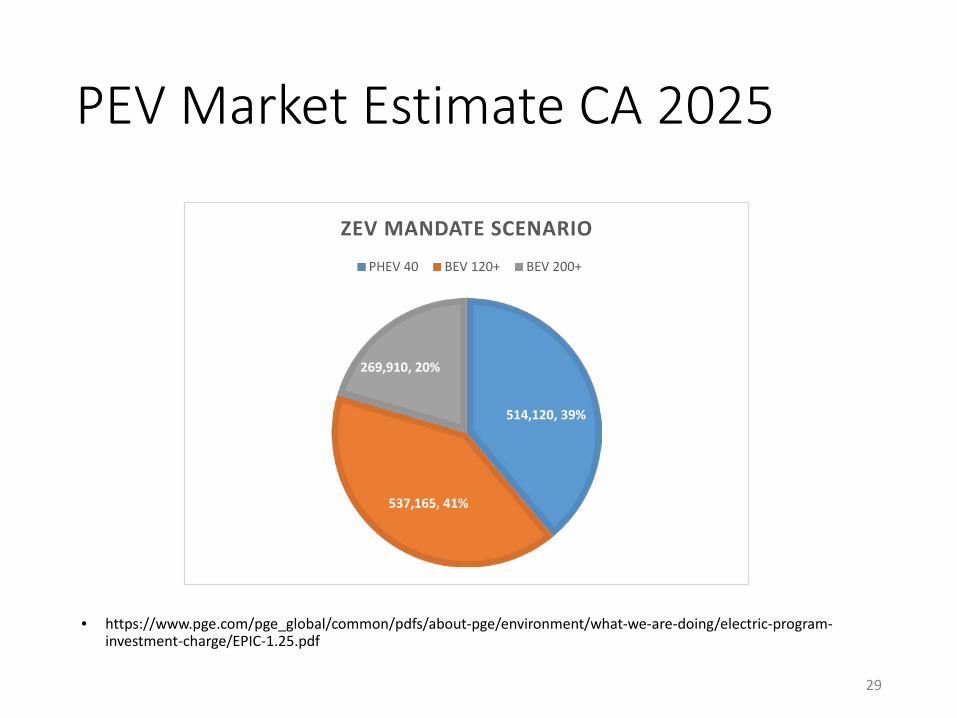
PEV Market Estimate CA 2025
• https://www.pge.com/pge_global/common/pdfs/about-pge/environment/what-we-are-doing/electric-program-investment-charge/EPIC-1.25.pdf
29
514,120, 39%
537,165, 41%
269,910, 20%
ZEV MANDATE SCENARIO
PHEV 40 BEV 120+ BEV 200+
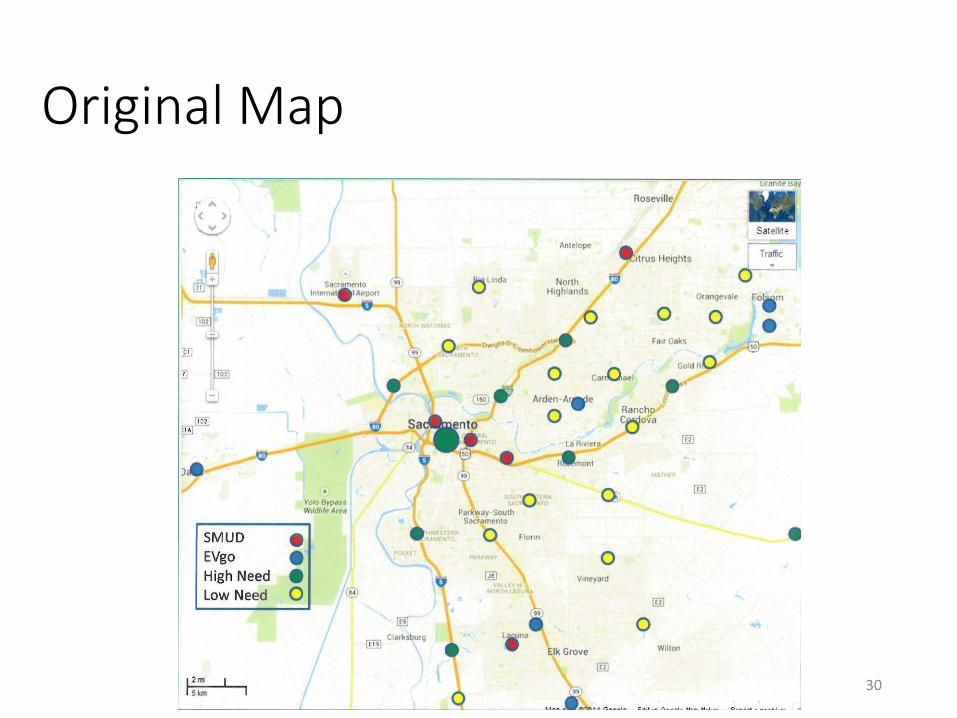
Original Map
30
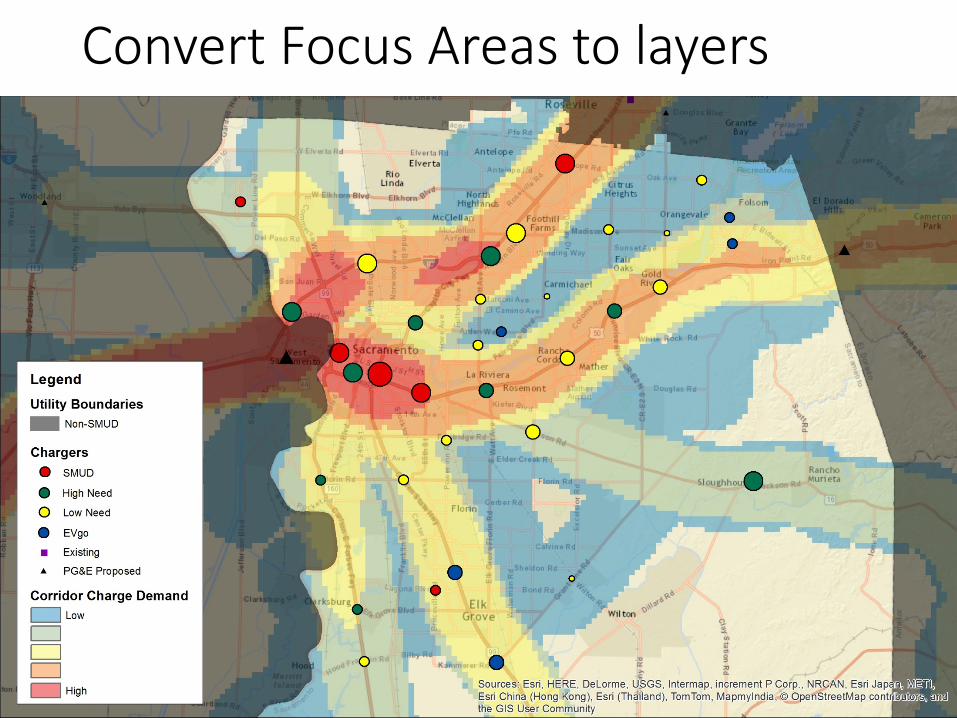
Convert Focus Areas to layers
31
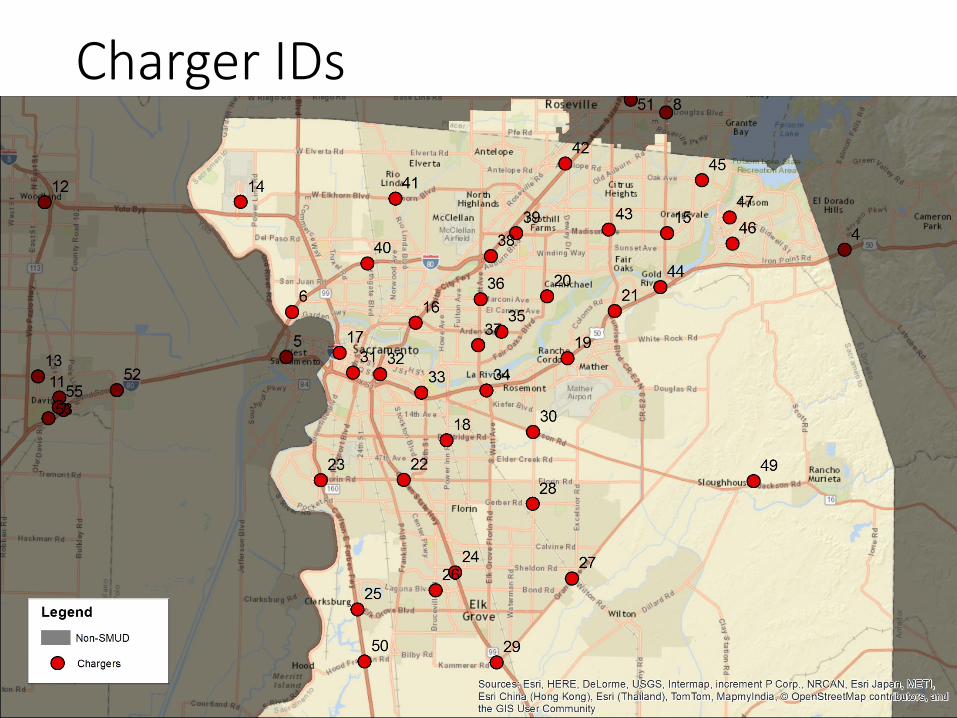
Charger IDs

Demand Scenario 1. 2025 with PG&E inputs. 1.5 Million vehicles
33
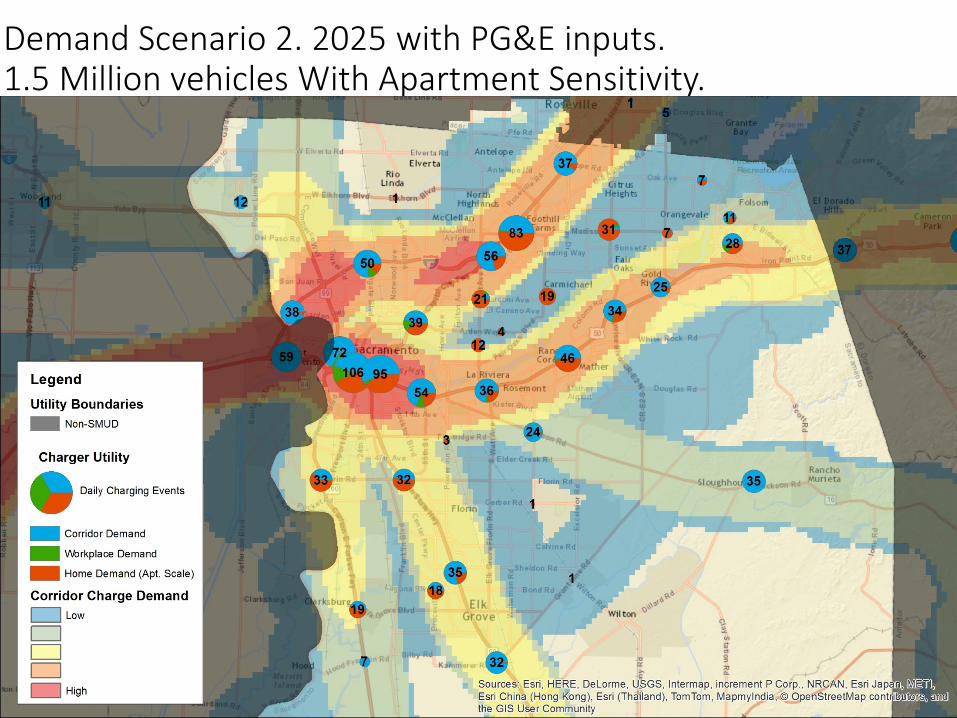
Demand Scenario 2. 2025 with PG&E inputs. 1.5 Million vehicles With Apartment Sensitivity.
34
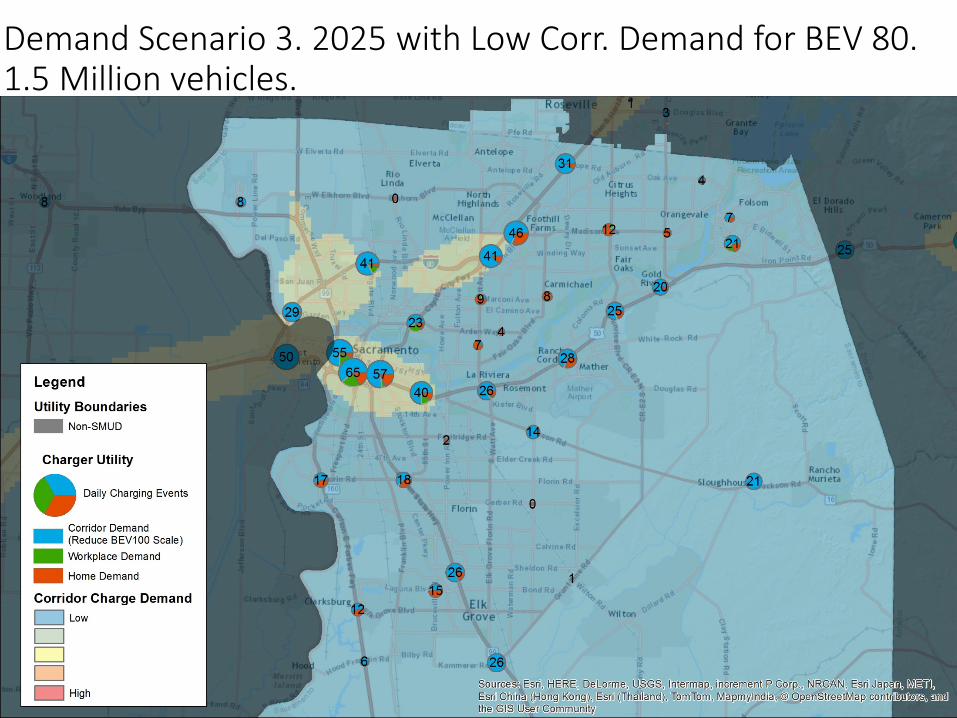
Demand Scenario 3. 2025 with Low Corr. Demand for BEV 80. 1.5 Million vehicles.
35

Demand Scenario 4. 2025 with Low Corr. Demand for BEV 80. 1.5 Million vehicles. Apartment Rescale
36
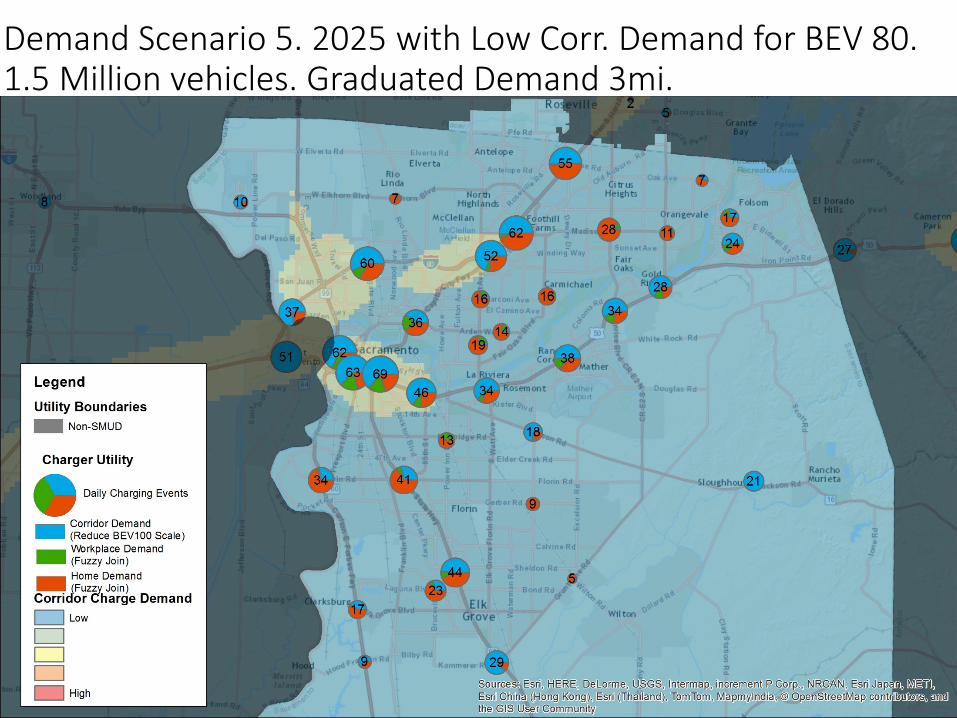
Demand Scenario 5. 2025 with Low Corr. Demand for BEV 80. 1.5 Million vehicles. Graduated Demand 3mi.
37
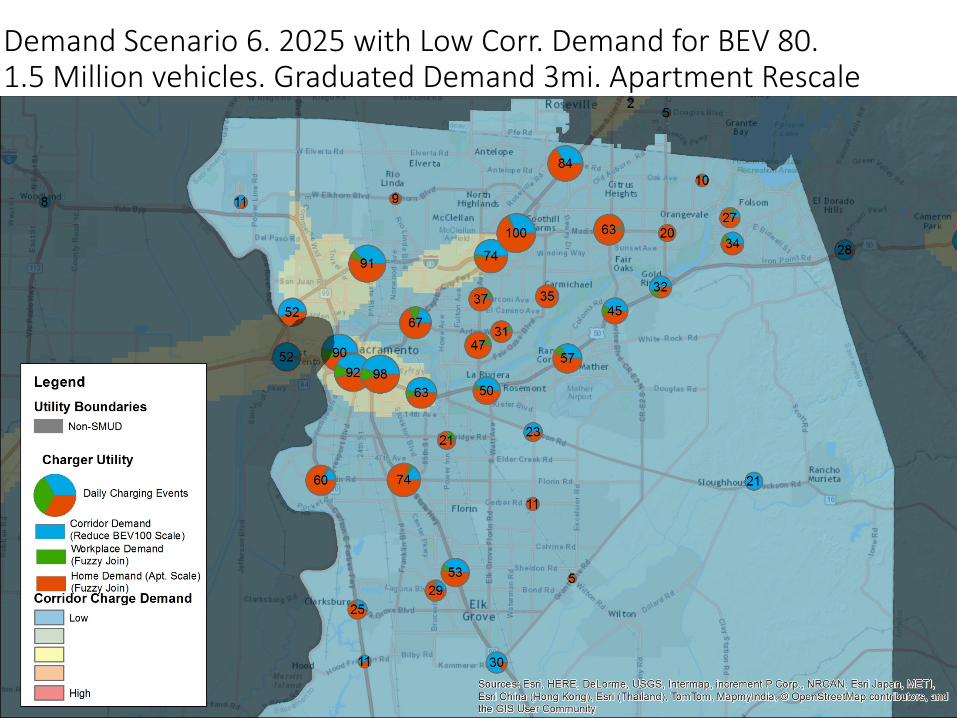
Demand Scenario 6. 2025 with Low Corr. Demand for BEV 80. 1.5 Million vehicles. Graduated Demand 3mi. Apartment Rescale
38

shared mobility?
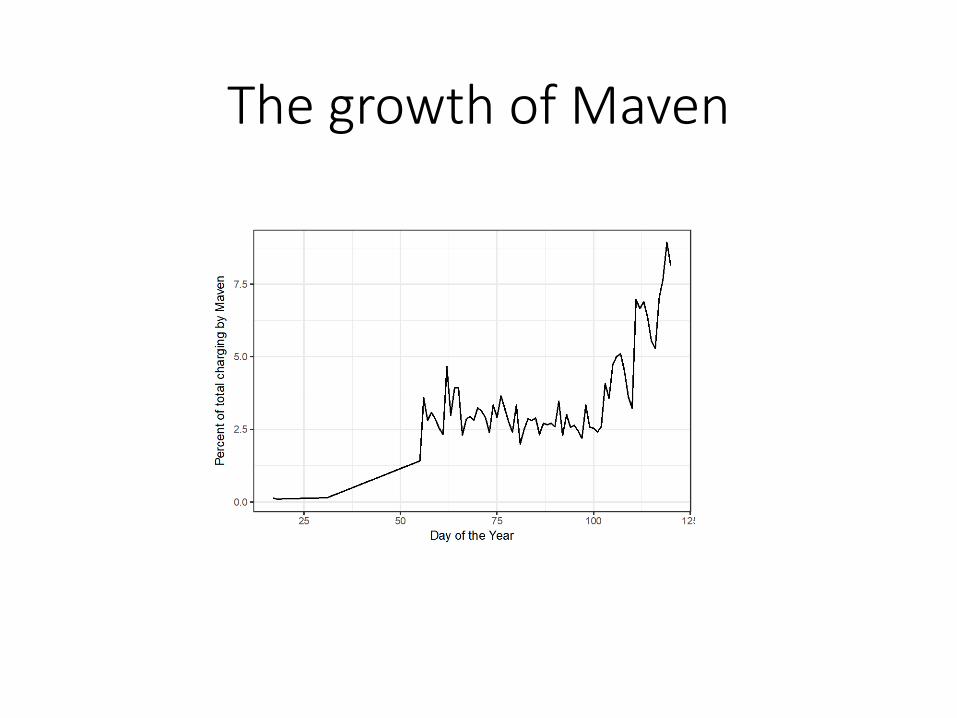
The growth of Maven
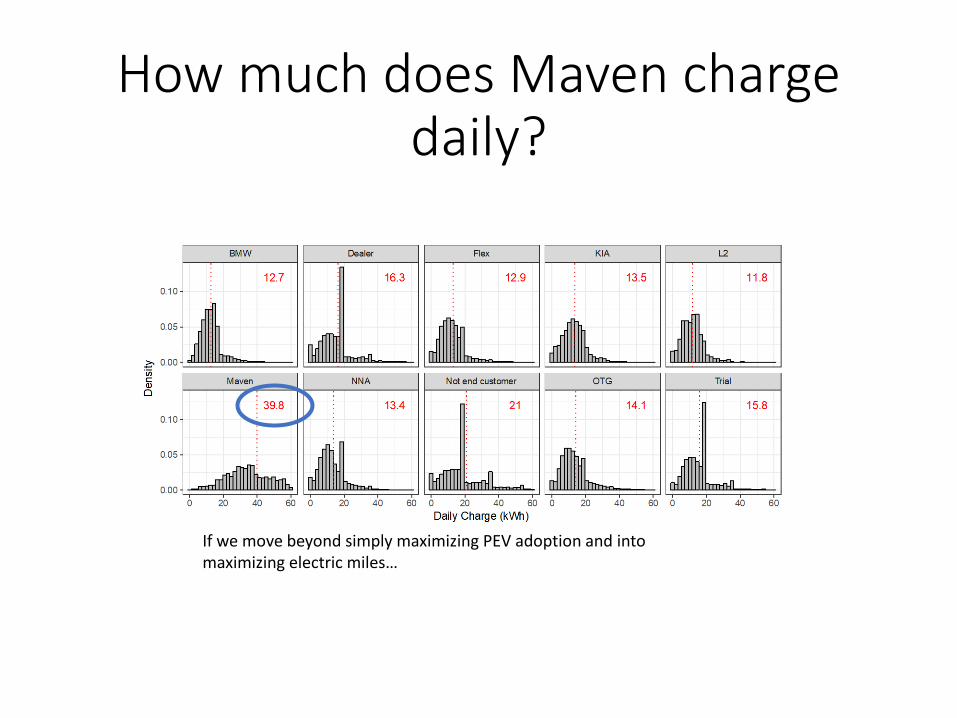
How much does Maven charge daily?
If we move beyond simply maximizing PEV adoption and into maximizing electric miles…
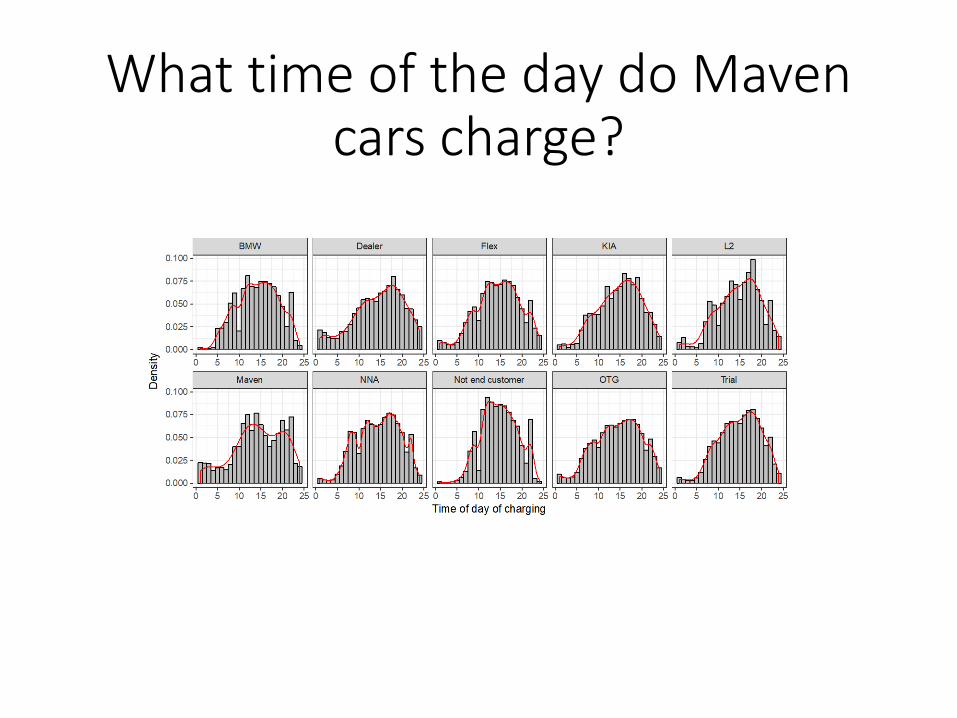
What time of the day do Maven cars charge?
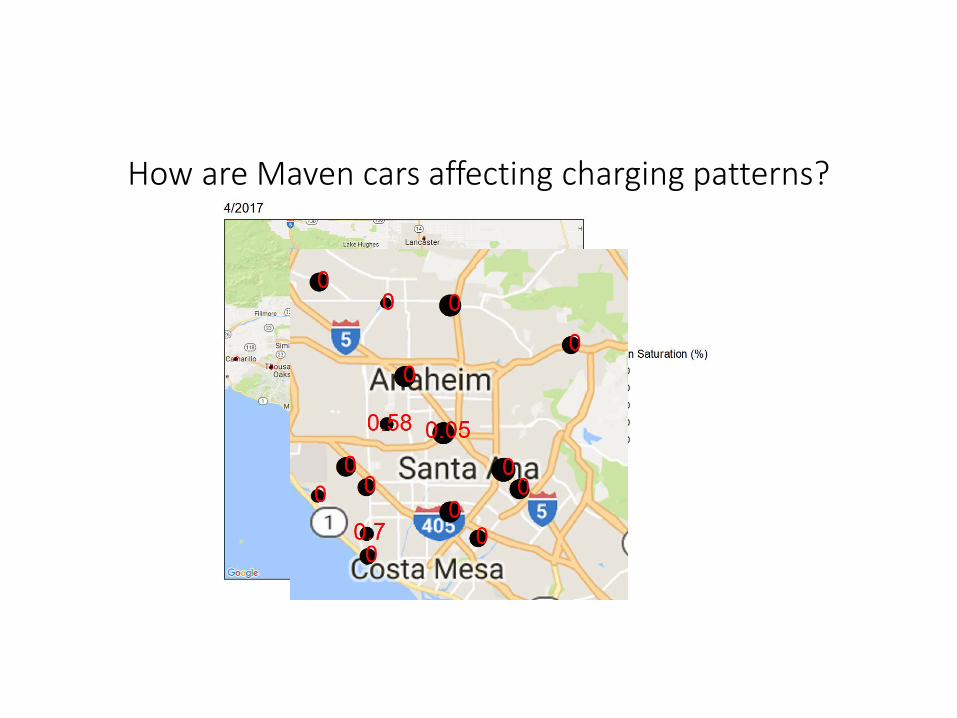
How are Maven cars affecting charging patterns?
11/7/201744
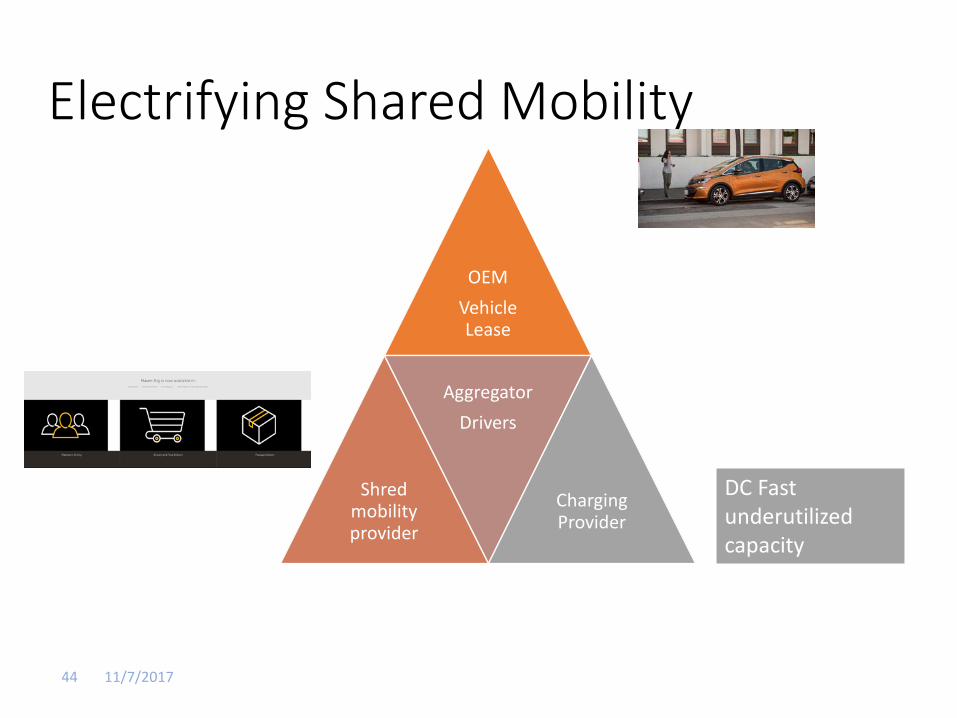
Electrifying Shared Mobility
OEMVehicle Lease
Shred mobility provider
AggregatorDrivers
Charging Provider
DC Fast underutilized capacity
11/7/201745
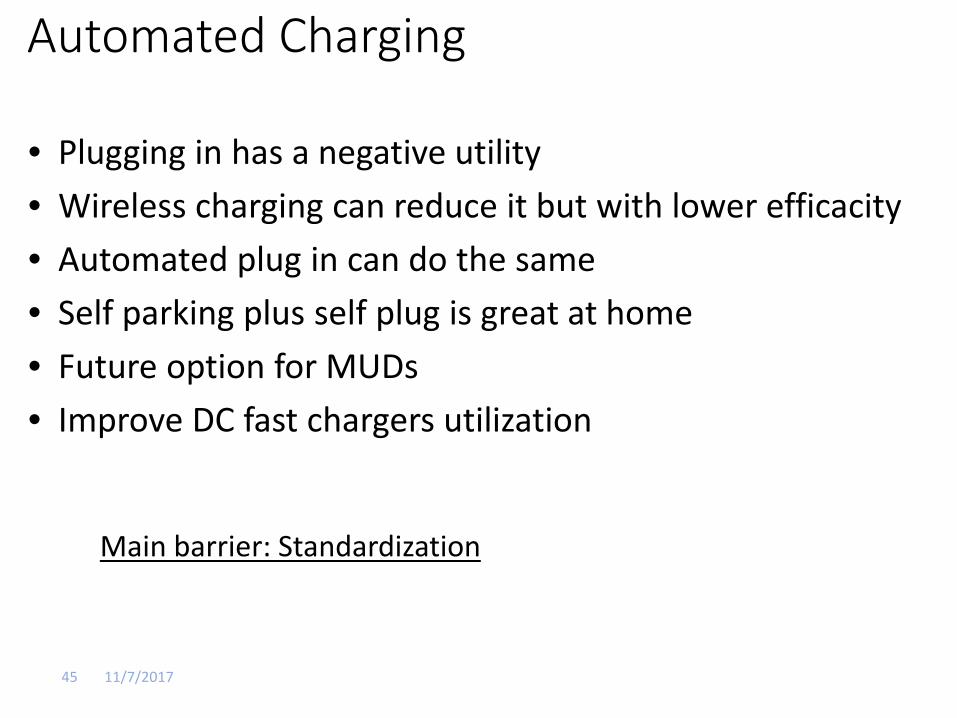
Automated Charging
• Plugging in has a negative utility• Wireless charging can reduce it but with lower efficacity • Automated plug in can do the same• Self parking plus self plug is great at home• Future option for MUDs• Improve DC fast chargers utilization
Main barrier: Standardization

demand chargers?
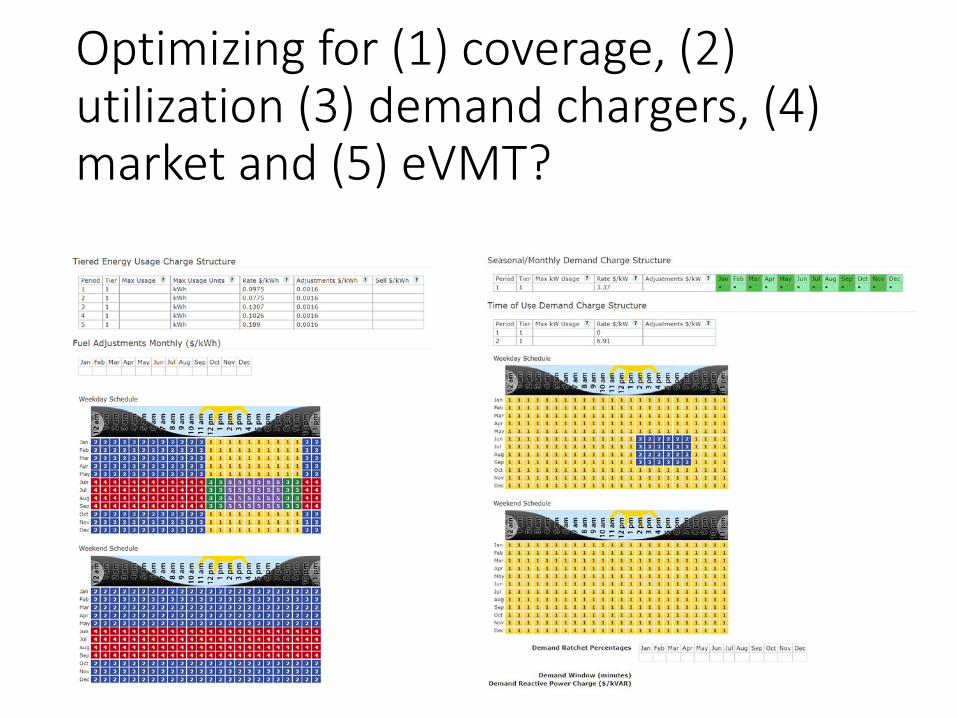
Optimizing for (1) coverage, (2) utilization (3) demand chargers, (4) market and (5) eVMT?
Nobody goes there anymore. It's too crowded
• If L2 public charging is free we need about 60 chargers per 100 PEVs
• If public charging is congested nobody goes there anymore
• Especially not those who need it in order to go back home.
• The only one who can use it are does who can charge at home anyway.
• Paid Dependable public charging may reduce market share but increase the usability of BEVs.
Nobody goes there anymore. It's too crowded
• DCFC is being used mostly within the vehicle range
• It’s not going to change• Pricing have a major impact
• We don’t know who is not using the chargers
• But we know it’s not dependable
• Multi Use Chargers are the best way to get higher utilization rate
• Charge plaza vs more location?• The impact of shared mobility?