Embed Size (px)
Citation preview

© 2014 Eaton. All Rights Reserved..
Electrical Products Group Conference
Alexander M. Cutler – Chairman and Chief Executive Officer
May 20, 2014

2 © 2014 Eaton. All Rights Reserved..
Forward-looking statements and non-GAAP financial information
The information provided at our conference today will include forward-looking statements relating to our goals and estimates for future years, including statements about expected sales, acquisition synergies, operating earnings per share, cash flow, segment margins, our worldwide markets, our anticipated effective income tax rate, the effects of currency exchange rates, our capital allocation plans and others. These statements should be used with caution and are subject to various risks and uncertainties, many of which are outside the company’s control. The following factors could cause actual results to differ materially from those in the forward-looking statements: unanticipated changes in the markets for the company’s business segments; unanticipated downturns in business relationships with customers or their purchases from us; competitive pressures on sales and pricing; increases in the cost of material and other production costs, or unexpected costs that cannot be recouped in product pricing; the introduction of competing technologies; unexpected technical or marketing difficulties; unexpected claims, charges, litigation or dispute resolutions; the impact of acquisitions and divestitures; unanticipated difficulties integrating acquisitions or realizing expected synergies from the Cooper acquisition; new laws and governmental regulations; interest rate changes; changes in currency exchange rates; stock market fluctuations; and unanticipated deterioration of economic and financial conditions in the United States and around the world. We do not assume any obligation to update these forward-looking statements. This presentation includes certain non-GAAP measures as defined by SEC rules. A reconciliation of those measures to the most directly comparable GAAP equivalent is provided in the investor relations section of our website at www.eaton.com and is contained in your packet.

3 © 2014 Eaton. All rights reserved.
Eaton is a leading global power management company
Uniquely positioned to provide safe, reliable, efficient and sustainable power management solutions for our global customers
Electrical Fluid Mechanical
Cities & Buildings
Industrial & Machinery
Information Technology
Energy & Utilities
Transportation Infrastructure

4 © 2014 Eaton. All rights reserved.
We have created a portfolio capable of delivering stronger growth and more consistent earnings…
61% 14%
8%
17%
2013 Segment Sales
Electrical Hydraulics
Aerospace Vehicle
50%
26%
24%
2013 Sales by Destination
U.S.Int'l DevelopedInt'l Emerging
29%
29%
31%
11%
2013 Cycle Sales
Early Mid Late No

5 5
…and our returns have substantially exceeded those of our peers and the S&P 500
2000 – April, 2014 CAGR* Return
Index
14.8%
Note – ** Peer Group represents an equal weighted index of ABB, DHR, DOV, EMR, HON, IR, ITW, LR, PH, ROK, SIE, SU, UTX *CAGR = Calculated using the End Point Methodology Source Data: Capital IQ, Eaton analysis
0
100
200
300
400
500
600
700
2000 2001 2002 2003 2004 2005 2006 2007 2008 2009 2010 2011 2012 2013 Apr30,
2014
Cumulative Shareholder Returns
Eaton S&P 500 Peer Group**
12.2%
4.7%

6 © 2014 Eaton. All Rights Reserved.
The Cooper acquisition significantly expanded our electrical solutions
Legacy Eaton
Former Cooper
Data Centers Industrial Utility Commercial / Residential Machinery
7 © 2014 Eaton. All Rights Reserved.
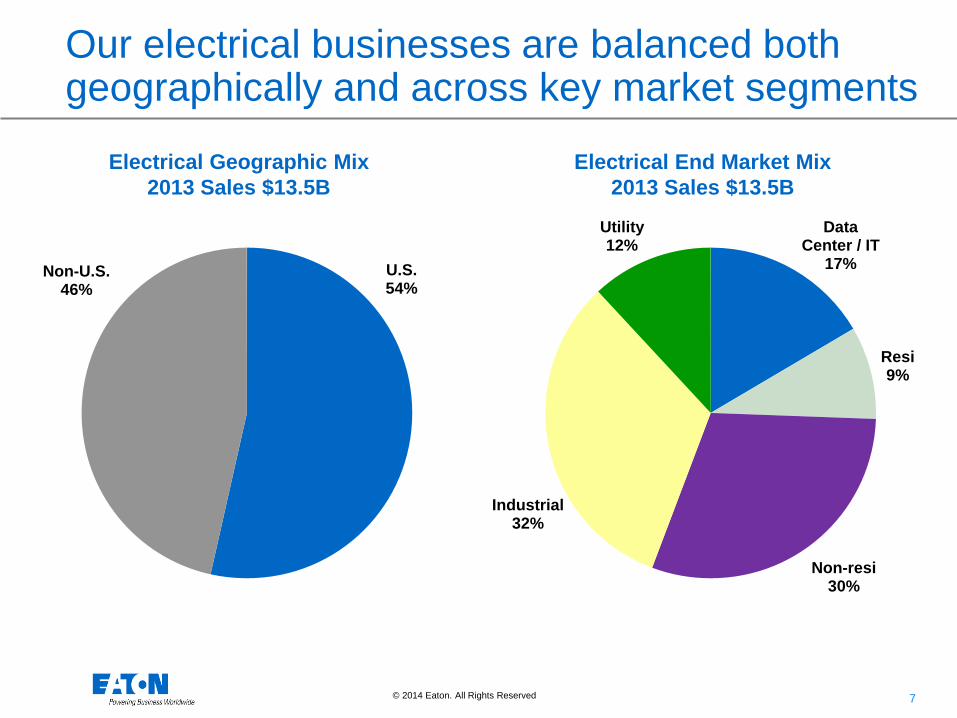
Our electrical businesses are balanced both geographically and across key market segments
Electrical Geographic Mix 2013 Sales $13.5B
U.S. 54%
Non-U.S. 46%
Electrical End Market Mix 2013 Sales $13.5B
Data Center / IT
17%
Resi 9%
Non-resi 30%
Industrial 32%
Utility 12%

8 © 2014 Eaton. All Rights Reserved.
Power distribution and circuit protection Delivers reliable, efficient and safe power where it is needed
Panelboards and switchboards
LV / MV switchgear Transformers Fuses Circuit
breakers
• Eaton is the only company that provides both a full range of circuit breakers and fuses, selling them both stand alone and packaged in NEMA / ANSI or IEC assemblies
• We are extending that position with an innovative power distribution fuse block that uses 50% less panel space and reduces installation time and labor by 33%
• We are a clear leader in arc flash technology
Our expanded electrical business has a number of distinctive capabilities in power distribution…
9 © 2014 Eaton. All Rights Reserved.
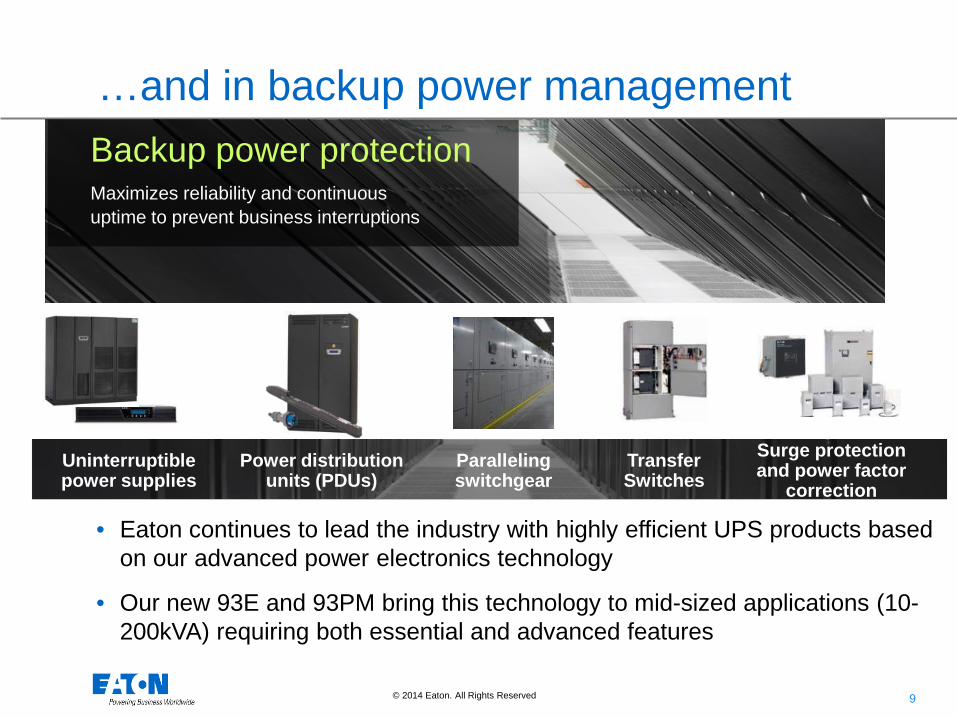
• Eaton continues to lead the industry with highly efficient UPS products based on our advanced power electronics technology
• Our new 93E and 93PM bring this technology to mid-sized applications (10-200kVA) requiring both essential and advanced features
Backup power protection Maximizes reliability and continuous uptime to prevent business interruptions
Uninterruptible power supplies
Surge protection and power factor
correction Power distribution
units (PDUs) Transfer Switches
Paralleling switchgear
…and in backup power management
10 © 2014 Eaton. All Rights Reserved.
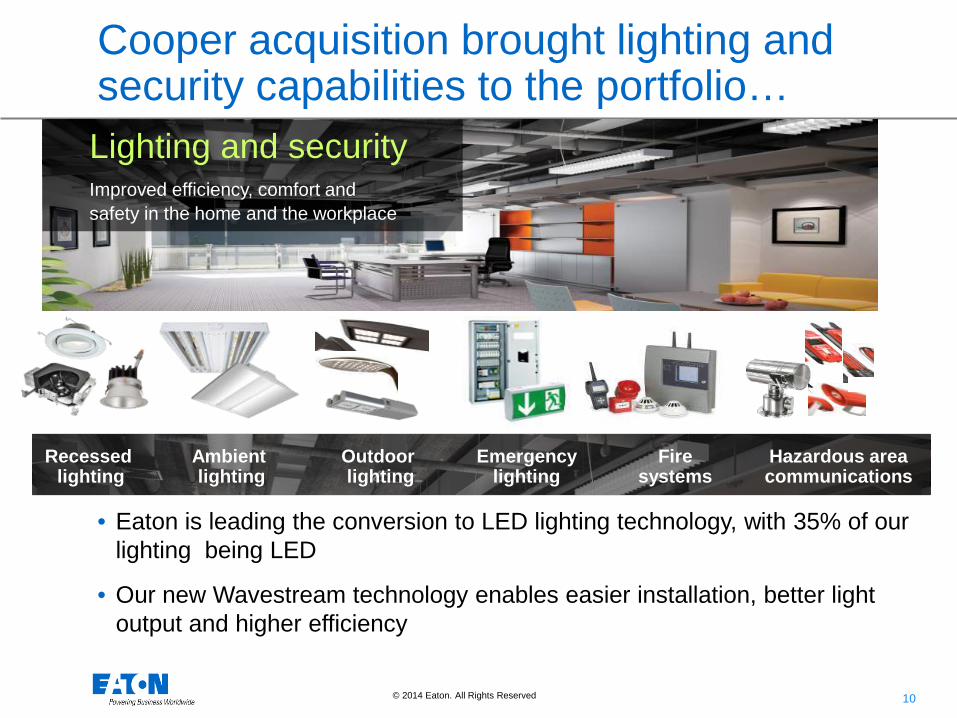
Recessed lighting
Ambient lighting
Hazardous area communications
Emergency lighting
Outdoor lighting
Fire systems
Lighting and security Improved efficiency, comfort and safety in the home and the workplace
• Eaton is leading the conversion to LED lighting technology, with 35% of our lighting being LED
• Our new Wavestream technology enables easier installation, better light output and higher efficiency
Cooper acquisition brought lighting and security capabilities to the portfolio…

11 © 2014 Eaton. All Rights Reserved.
Enclosures Industrial control and switchgear Instrumentation Lighting
Solutions for harsh and hazardous environments Delivers reliability and safety to prevent production interruptions
Commercial outlet boxes, wiring and fittings
• Eaton’s Crouse-Hinds unit specializes in packaging products for Class 1 environments
• We have extended our lead with 50+ new product introductions for that environment
• We are the first to determine how to package a drive to work in a Class 1 environment
…along with a range of solutions for harsh and hazardous environments

12 © 2014 Eaton. All Rights Reserved.
Cable tray systems
Bolted framing strut systems
Enclosures and airflow management Safety grating
Structural solutions Improved efficiency and safety during installation with maximum return on investment
• Eaton cable support systems allow for longer spans, resulting in faster installation time and up to 66% less structural steel requirements
• The serrated pattern on Eaton safety grating allows it to be 230% more slip-resistant than other gratings
The Cooper acquisition also increased our range of structural solutions

13 © 2014 Eaton. All Rights Reserved.
Studies Design Build Support • Power quality and reliability audits • Engineering services • Project management • Maintenance / aftermarket • Energy management audits • Consulting services • Turnkey services • 24x7 monitoring • Safety audits • Modeling and analysis • Modernization • Emergency response
Engineering services and project management… through all stages of the application lifecycle
• More than 2,000 field, engineering, management and support professionals in over 20 countries
• Centers of Excellence that specialize in modernization of electrical equipment by upgrading it with the latest technology
We now have the ability to leverage a strong service capability across this expanded portfolio of products

14 © 2014 Eaton. All Rights Reserved.
We continue to leverage innovation and product vitality to drive organic growth
• CXH - Increased safety and reliability with unmatched arc flash mitigation
• Hazardous location boltless cover reduces installation and maintenance costs
Hazardous Area Boltless Enclosures
CXH Low Voltage Assemblies
Marine Duty Uninterruptable Power Supplies
• Marine certified UPS for marine safety, control, bridge and commercial systems
• Standard and engineered solutions address end user applications
Extending UPS technology to additional markets
General Purpose, Machine & EU Directive Drives
• General purpose and machinery drives expand functionality and increase ease of use
• Simple motor drives meet new European energy savings directive
Drives technology for every application
Creating oil & gas technology to enhance safety and maintenance
WaveStream Architectural Solutions
• Expanded WaveStream LED solutions for more design freedom
• Provides best in class optical control, brightness control and energy efficiency
Utilizing LED technology to increase flexibility
15 © 2014 Eaton. All rights reserved.
0
100
200
300
400
500
2013 2014 2015 2016
Syne
rgy
Prof
it ($
M)
Current Plan Original Plan
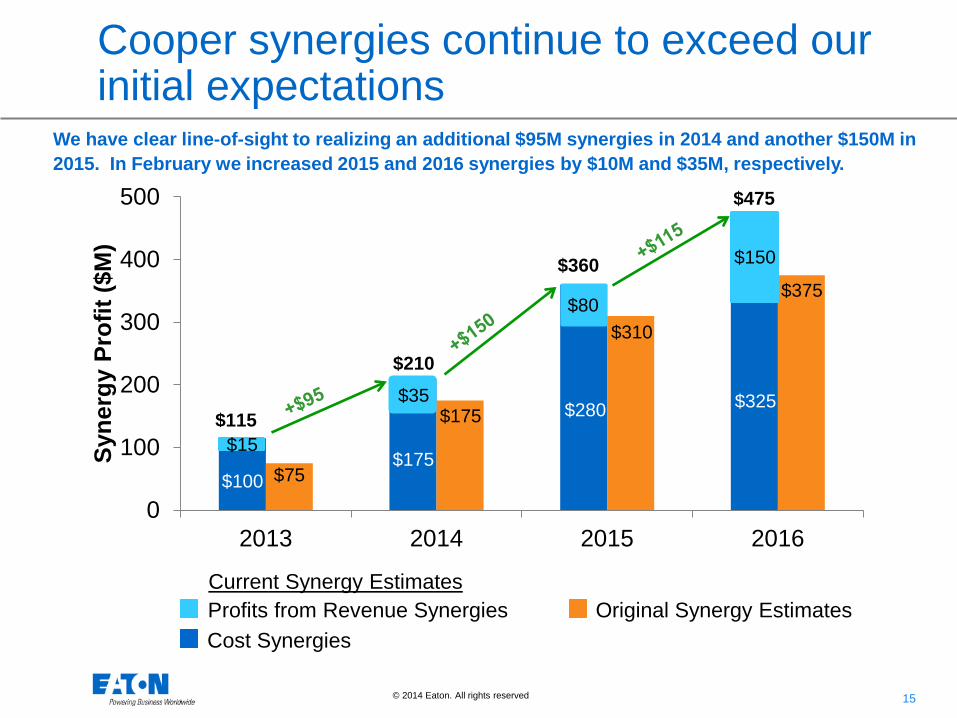
$115
$210
$360
Cooper synergies continue to exceed our initial expectations
We have clear line-of-sight to realizing an additional $95M synergies in 2014 and another $150M in 2015. In February we increased 2015 and 2016 synergies by $10M and $35M, respectively.
$475
$15
$35
$80
$150
$100 $175
$280 $325
$75
$175
$310
$375
Original Synergy Estimates Profits from Revenue Synergies Cost Synergies
Current Synergy Estimates

16 © 2014 Eaton. All Rights Reserved.
Corporate Cost
Reduction • Corporate
functions • Data centers • Back office
support
Plant & Distribution
• Facility & product line rationalization
• Distribution center rationalization
Application of EBS Tools
• ELSS • EQS • PROLaunch • VAVE
Supply Chain Economies
of Scale • Direct /
indirect spend • Logistics
Leveraging Eaton’s
Infrastructure • Operating
SG&A • Shared R&D • Shared
service centers
Cost synergies come from five main areas
EBS
60% of total 2016 cost-out synergies
40% of total 2016 cost-out synergies

17 © 2014 Eaton. All Rights Reserved.
Sales synergies come from four main areas
Geographic Expansion
• Pull-through opportunities
• Greater scale opportunities
Boost Channel
Sales • Distributor
conversion • Increased
penetration
Larger Package to Common Customers
• Oil & Gas • Data Centers • Mining • Utility
Service
Business • Large Cooper
installed base & relationships
• Leverage Eaton’s existing service business
70% of total 2016 sales synergies
30% of total 2016 sales synergies

18 © 2014 Eaton. All rights reserved.
15.4% 16.0% 17.0%
2013 2014e 2015e
14.2% 14.0% 15.0%
2013 2014e 2015e
13.1% 13.5% 15.0%
2013 2014e 2015e
14.4% 14.5% 16.0%
2013 2014e 2015e
16.1% 17.75% 19.0%
2013 2014e 2015e
290 bps
160 bps
190 bps
80 bps
160 bps
We are driving significant margin improvement across all five segments
Electrical Systems & Services
2013-2015 Change
Electrical Products
2013-2015 Change
Hydraulics
Aerospace
Vehicle
2013-2015 Change
2013-2015 Change
2013-2015 Change
We remain on track to achieve segment margins of 17% in 2015

19 © 2014 Eaton. All rights reserved.
Our cash earnings are much greater than operating earnings
$3.45 $4.13
$4.80
$0.24
$0.98 $0.86
$3.69
$5.11 $5.66
2007 2013 2014E
Cash Earnings Comparison
Operating EPS Cash Operating EPS
Note: Cash Operating EPS is Operating EPS plus per share after-tax amortization and inventory step-up expense

20 © 2014 Eaton. All rights reserved.
Strong cash flow and a stronger balance sheet provide future financial flexibility
Nea
r-ter
m
Long
er-te
rm
Capital Allocation Plans
Repurchase shares if we become overcapitalized or there is an opportunity to buy the shares at a sudden discount… …we have repurchased $1.9B in the last 10 years
Invest in acquisitions which advance our strategy and return at least 300 bps over our cost of capital… …expect to have capacity to ramp up acquisition program in 2015
Reinvest in the business to drive organic growth… …invest 3% of sales annually in capital expenses
Return cash to shareholders with a growing dividend… …grow dividends in line with earnings growth
Retire debt to strengthen our balance sheet… …committed to repaying $2.1B of term debt by 2016

21 © 2014 Eaton. All rights reserved.
2014 End Market Growth Forecast
(Y-O-Y % Growth)
Electrical 3% Hydraulics 3% Aerospace 3% Vehicle 5% Consolidated Markets 3%

22 © 2014 Eaton. All rights reserved.
2014 Outlook Market Growth 3% Outgrowth $330M Revenues from Divestiture ($80)M Forex ($200)M Incremental Margin 26% Tax Rate 5%
Operating EPS Full Year $4.60 – $5.00
Q2 $1.15 – $1.25 Operating Cash Flow $2.7B – $2.9B Free Cash Flow $2.0B – $2.2B CAPEX $700M

23 © 2014 Eaton. All rights reserved.
Summary
• For the full year 2014, on modest market growth of 3% we are expecting 16% operating EPS growth based upon the midpoint of our guidance at $4.80
• The Cooper integration remains on track to deliver $210M
of synergies in 2014, representing an increase of $95M over 2013 levels
• In 2015, we expect an additional $185M of operating profits
from: An incremental $150M in Cooper synergies over 2014 levels $35M in incremental annual benefits from the $40M restructuring
program undertaken in the Industrial Sector in Q2 of 2014

24 © 2014 Eaton. All rights reserved.