Embed Size (px)
Citation preview

ELECTRICITY INFORMATION 2011 EDITION
DOCUMENTATION FOR BEYOND 2020 FILES

ELECTRICITY INFORMATION (2011 edition) - 1
INTERNATIONAL ENERGY AGENCY
LIST OF ELECTRONIC TABLES 2011 edition

ELECTRICITY INFORMATION (2011 edition) - 3
INTERNATIONAL ENERGY AGENCY
INTRODUCTION Electricity Information 2011 – Electronic Tables
OECD, Electricity and Heat Supply and Consump-tion (GWh, TJ): EleHeatBal_OECD.IVT
This table provides a full balance of electricity and heat for OECD countries, including gross and net pro-duction, trade, energy supply, energy industry use and final consumption.
World, Electricity and Heat Supply and Consump-tion (GWh, TJ): EleHeatBal.IVT
This table provides a full balance of electricity and heat for the world, through 2009, including gross and net production, trade, energy supply, energy industry use and final consumption.
OECD, Electricity and Heat Generation (GWh, TJ): EleHeatGen.IVT
This table presents gross electricity and heat produc-tion from each energy source such as Nuclear, Hydro, Combustible Fuels, Geothermal, Solar, Wind and Other Sources as well as the breakdown according to the type of plant (electricity only, CHP or heat only). Inputs by type of fuel are also provided.
OECD, Net Electricity and Heat Production by Autoproducers (GWh, TJ): EleAuto.IVT
This table contains data on net electricity and heat production by autoproducers in all plants, by sector.
OECD, Electricity Imports by Origin (GWh): EleImp.IVT
This table contains electricity imports by origin.
OECD, Electricity Exports by Destination (GWh): EleExp.IVT
This table contains electricity exports by destination.
OECD, Net Electrical Capacity (MWe): Ele-Cap.IVT
This table shows a comprehensive status of net elec-trical capacity by type of energy. It also contains data on single fuel-fired and multi-fuel fired plants, type of generation and peak load.
OECD, Monthly Net Electricity Supply (GWh): EleMonthly.IVT
This table includes monthly OECD net electricity production from main sources and trade data from January 2000 to December 2010.
Additional information on this service can be obtained from:
Robert Schnapp or Yasmina Abdelilah Energy Statistics Division International Energy Agency 9, rue de la Fédération, 75739 Paris Cedex 15 France Tel: (33 1) 40 57 66 31 or 40 57 66 47 Fax: (33 1) 40 57 66 49 E-mail: [email protected]


ELECTRICITY INFORMATION (2011 edition) - 5
INTERNATIONAL ENERGY AGENCY
1. PRODUCT DEFINITIONS
Electricity and Heat Output Flow Short name Definition
Electricity ELECTR Gross electricity production is measured at the terminals of all alter-nator sets in a station; it therefore includes the energy taken by sta-tion auxiliaries and losses in transformers that are considered inte-gral parts of the station.
The difference between gross and net production is generally esti-mated as 7% for conventional thermal stations, 1% for hydro sta-tions, and 6% for nuclear, geothermal and solar stations. Production in hydro stations includes production from pumped storage plants.
Heat HEAT Heat production includes all heat produced by main activity pro-ducer CHP and heat plants, as well as heat sold by autoproducer CHP and heat plants to third parties.
Fuels used to produce quantities of heat for sale are included in the transformation sector under the rows CHP plants and Heat plants. The use of fuels for heat which is not sold is included under the sec-tors in which the fuel use occurs.
6 - ELECTRICITY INFORMATION (2011 edition)
INTERNATIONAL ENERGY AGENCY
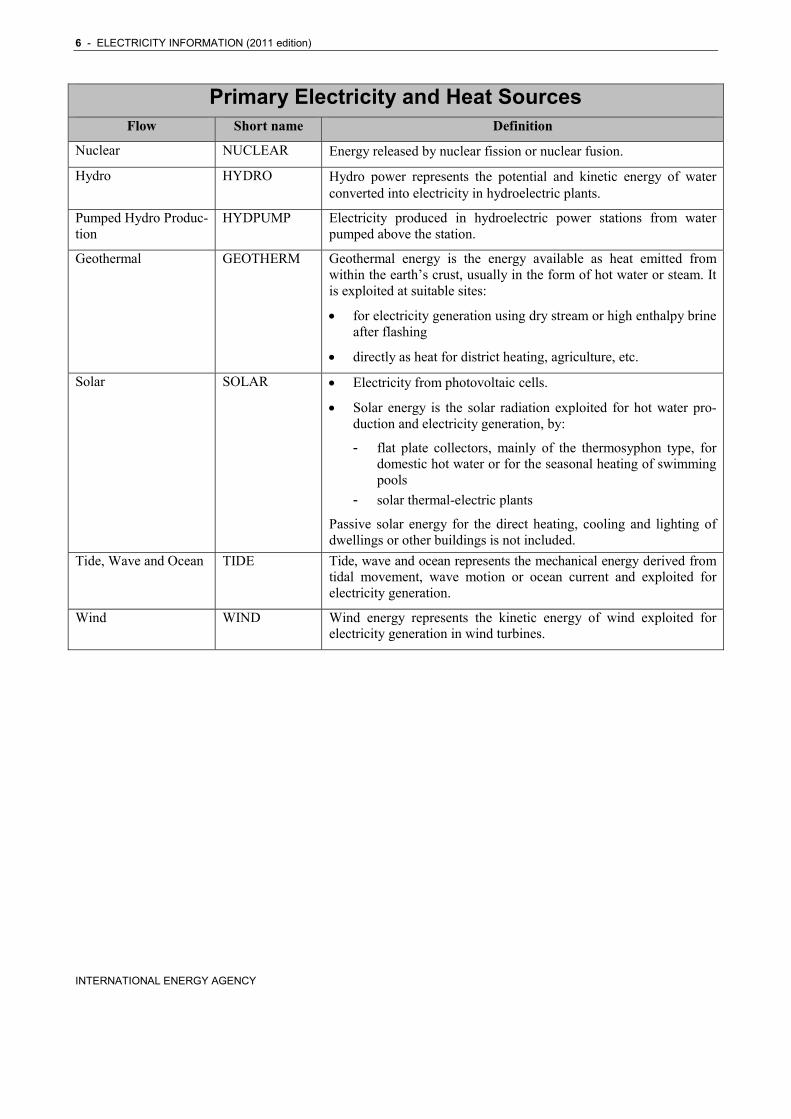
Primary Electricity and Heat Sources Flow Short name Definition
Nuclear NUCLEAR Energy released by nuclear fission or nuclear fusion.
Hydro HYDRO Hydro power represents the potential and kinetic energy of water converted into electricity in hydroelectric plants.
Pumped Hydro Produc-tion
HYDPUMP Electricity produced in hydroelectric power stations from water pumped above the station.
Geothermal GEOTHERM Geothermal energy is the energy available as heat emitted from within the earth’s crust, usually in the form of hot water or steam. It is exploited at suitable sites:
for electricity generation using dry stream or high enthalpy brine after flashing
directly as heat for district heating, agriculture, etc.
Solar SOLAR Electricity from photovoltaic cells.
Solar energy is the solar radiation exploited for hot water pro-duction and electricity generation, by:
- flat plate collectors, mainly of the thermosyphon type, for domestic hot water or for the seasonal heating of swimming pools
- solar thermal-electric plants
Passive solar energy for the direct heating, cooling and lighting of dwellings or other buildings is not included.
Tide, Wave and Ocean TIDE Tide, wave and ocean represents the mechanical energy derived from tidal movement, wave motion or ocean current and exploited for electricity generation.
Wind WIND Wind energy represents the kinetic energy of wind exploited for electricity generation in wind turbines.
ELECTRICITY INFORMATION (2011 edition) - 7
INTERNATIONAL ENERGY AGENCY
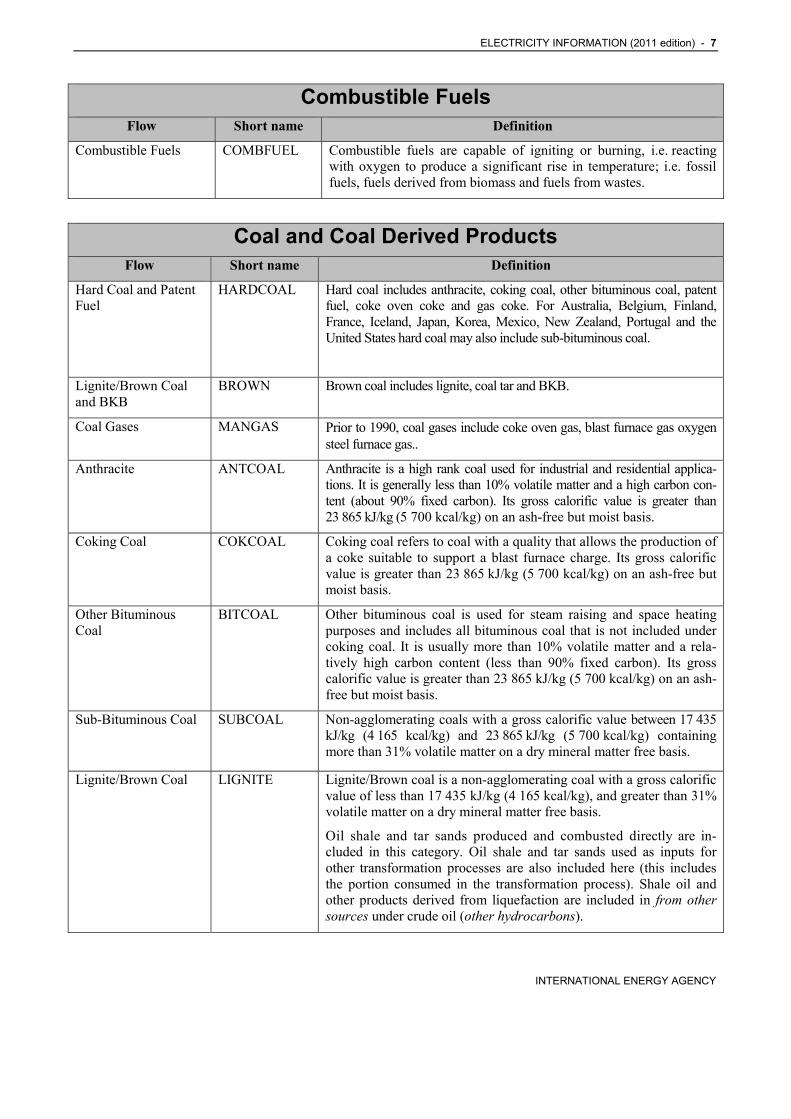
Combustible Fuels Flow Short name Definition
Combustible Fuels COMBFUEL Combustible fuels are capable of igniting or burning, i.e. reacting with oxygen to produce a significant rise in temperature; i.e. fossil fuels, fuels derived from biomass and fuels from wastes.
Coal and Coal Derived Products Flow Short name Definition
Hard Coal and Patent Fuel
HARDCOAL Hard coal includes anthracite, coking coal, other bituminous coal, patent fuel, coke oven coke and gas coke. For Australia, Belgium, Finland, France, Iceland, Japan, Korea, Mexico, New Zealand, Portugal and the United States hard coal may also include sub-bituminous coal.
Lignite/Brown Coal and BKB
BROWN Brown coal includes lignite, coal tar and BKB.
Coal Gases MANGAS Prior to 1990, coal gases include coke oven gas, blast furnace gas oxygen steel furnace gas..
Anthracite ANTCOAL Anthracite is a high rank coal used for industrial and residential applica-tions. It is generally less than 10% volatile matter and a high carbon con-tent (about 90% fixed carbon). Its gross calorific value is greater than 23 865 kJ/kg (5 700 kcal/kg) on an ash-free but moist basis.
Coking Coal COKCOAL Coking coal refers to coal with a quality that allows the production of a coke suitable to support a blast furnace charge. Its gross calorific value is greater than 23 865 kJ/kg (5 700 kcal/kg) on an ash-free but moist basis.
Other Bituminous Coal
BITCOAL Other bituminous coal is used for steam raising and space heating purposes and includes all bituminous coal that is not included under coking coal. It is usually more than 10% volatile matter and a rela-tively high carbon content (less than 90% fixed carbon). Its gross calorific value is greater than 23 865 kJ/kg (5 700 kcal/kg) on an ash-free but moist basis.
Sub-Bituminous Coal SUBCOAL Non-agglomerating coals with a gross calorific value between 17 435 kJ/kg (4 165 kcal/kg) and 23 865 kJ/kg (5 700 kcal/kg) containing more than 31% volatile matter on a dry mineral matter free basis.
Lignite/Brown Coal LIGNITE Lignite/Brown coal is a non-agglomerating coal with a gross calorific value of less than 17 435 kJ/kg (4 165 kcal/kg), and greater than 31% volatile matter on a dry mineral matter free basis.
Oil shale and tar sands produced and combusted directly are in-cluded in this category. Oil shale and tar sands used as inputs for other transformation processes are also included here (this includes the portion consumed in the transformation process). Shale oil and other products derived from liquefaction are included in from other sources under crude oil (other hydrocarbons).
8 - ELECTRICITY INFORMATION (2011 edition)
INTERNATIONAL ENERGY AGENCY
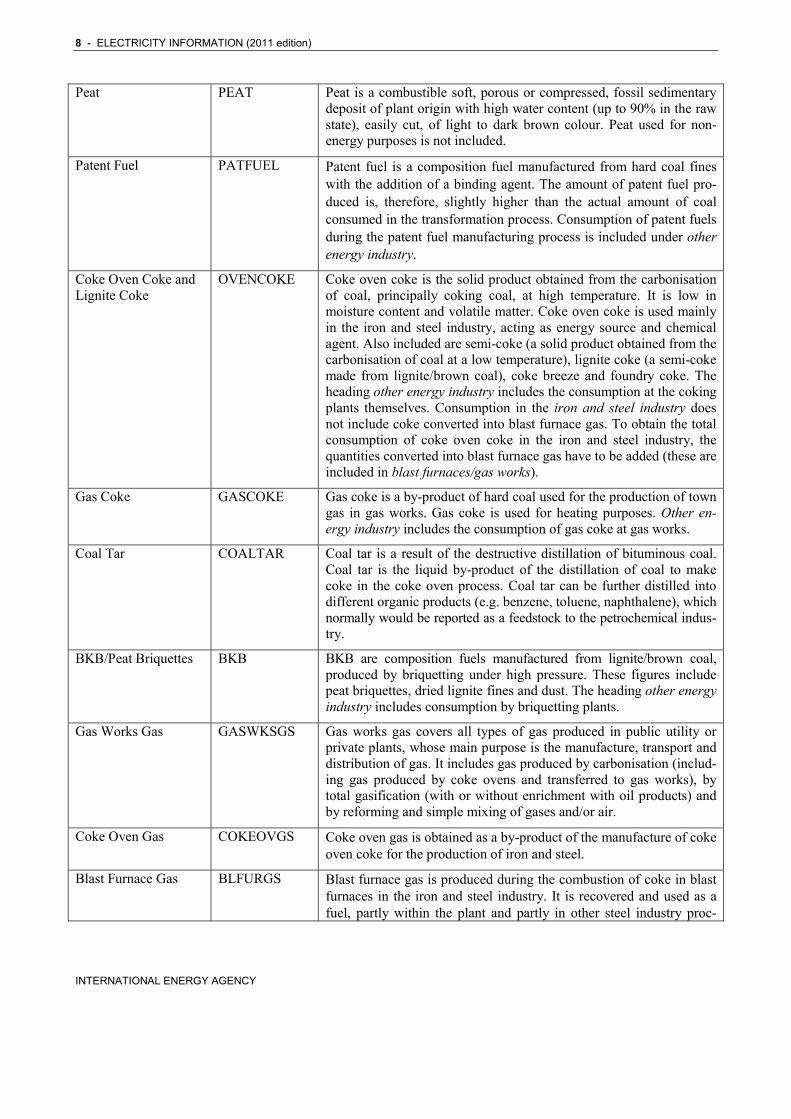
Peat PEAT Peat is a combustible soft, porous or compressed, fossil sedimentary deposit of plant origin with high water content (up to 90% in the raw state), easily cut, of light to dark brown colour. Peat used for non-energy purposes is not included.
Patent Fuel PATFUEL Patent fuel is a composition fuel manufactured from hard coal fines with the addition of a binding agent. The amount of patent fuel pro-duced is, therefore, slightly higher than the actual amount of coal consumed in the transformation process. Consumption of patent fuels during the patent fuel manufacturing process is included under other energy industry.
Coke Oven Coke and Lignite Coke
OVENCOKE Coke oven coke is the solid product obtained from the carbonisation of coal, principally coking coal, at high temperature. It is low in moisture content and volatile matter. Coke oven coke is used mainly in the iron and steel industry, acting as energy source and chemical agent. Also included are semi-coke (a solid product obtained from the carbonisation of coal at a low temperature), lignite coke (a semi-coke made from lignite/brown coal), coke breeze and foundry coke. The heading other energy industry includes the consumption at the coking plants themselves. Consumption in the iron and steel industry does not include coke converted into blast furnace gas. To obtain the total consumption of coke oven coke in the iron and steel industry, the quantities converted into blast furnace gas have to be added (these are included in blast furnaces/gas works).
Gas Coke GASCOKE Gas coke is a by-product of hard coal used for the production of town gas in gas works. Gas coke is used for heating purposes. Other en-ergy industry includes the consumption of gas coke at gas works.
Coal Tar COALTAR Coal tar is a result of the destructive distillation of bituminous coal. Coal tar is the liquid by-product of the distillation of coal to make coke in the coke oven process. Coal tar can be further distilled into different organic products (e.g. benzene, toluene, naphthalene), which normally would be reported as a feedstock to the petrochemical indus-try.
BKB/Peat Briquettes BKB BKB are composition fuels manufactured from lignite/brown coal, produced by briquetting under high pressure. These figures include peat briquettes, dried lignite fines and dust. The heading other energy industry includes consumption by briquetting plants.
Gas Works Gas GASWKSGS Gas works gas covers all types of gas produced in public utility or private plants, whose main purpose is the manufacture, transport and distribution of gas. It includes gas produced by carbonisation (includ-ing gas produced by coke ovens and transferred to gas works), by total gasification (with or without enrichment with oil products) and by reforming and simple mixing of gases and/or air.
Coke Oven Gas COKEOVGS Coke oven gas is obtained as a by-product of the manufacture of coke oven coke for the production of iron and steel.
Blast Furnace Gas BLFURGS Blast furnace gas is produced during the combustion of coke in blast furnaces in the iron and steel industry. It is recovered and used as a fuel, partly within the plant and partly in other steel industry proc-
ELECTRICITY INFORMATION (2011 edition) - 9
INTERNATIONAL ENERGY AGENCY
esses or in power stations equipped to burn it.
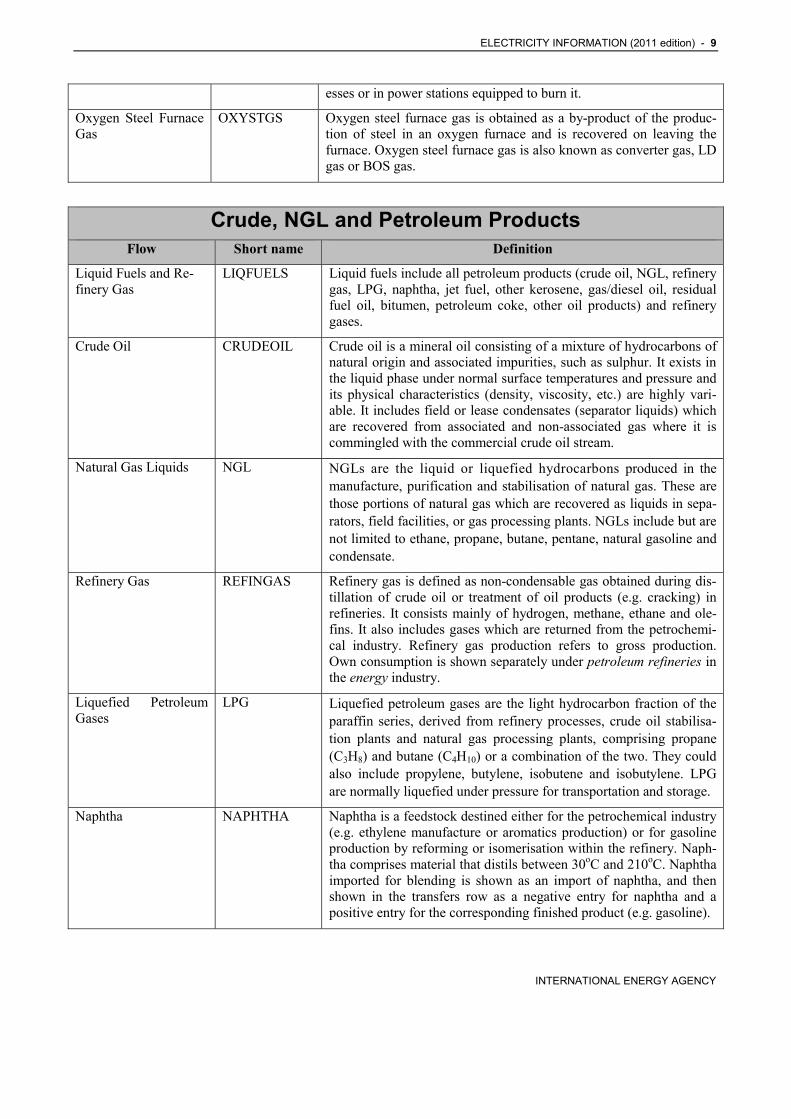
Oxygen Steel Furnace Gas
OXYSTGS Oxygen steel furnace gas is obtained as a by-product of the produc-tion of steel in an oxygen furnace and is recovered on leaving the furnace. Oxygen steel furnace gas is also known as converter gas, LD gas or BOS gas.
Crude, NGL and Petroleum Products Flow Short name Definition
Liquid Fuels and Re-finery Gas
LIQFUELS Liquid fuels include all petroleum products (crude oil, NGL, refinery gas, LPG, naphtha, jet fuel, other kerosene, gas/diesel oil, residual fuel oil, bitumen, petroleum coke, other oil products) and refinery gases.
Crude Oil CRUDEOIL Crude oil is a mineral oil consisting of a mixture of hydrocarbons of natural origin and associated impurities, such as sulphur. It exists in the liquid phase under normal surface temperatures and pressure and its physical characteristics (density, viscosity, etc.) are highly vari-able. It includes field or lease condensates (separator liquids) which are recovered from associated and non-associated gas where it is commingled with the commercial crude oil stream.
Natural Gas Liquids NGL NGLs are the liquid or liquefied hydrocarbons produced in the manufacture, purification and stabilisation of natural gas. These are those portions of natural gas which are recovered as liquids in sepa-rators, field facilities, or gas processing plants. NGLs include but are not limited to ethane, propane, butane, pentane, natural gasoline and condensate.
Refinery Gas REFINGAS Refinery gas is defined as non-condensable gas obtained during dis-tillation of crude oil or treatment of oil products (e.g. cracking) in refineries. It consists mainly of hydrogen, methane, ethane and ole-fins. It also includes gases which are returned from the petrochemi-cal industry. Refinery gas production refers to gross production. Own consumption is shown separately under petroleum refineries in the energy industry.
Liquefied Petroleum Gases
LPG Liquefied petroleum gases are the light hydrocarbon fraction of the paraffin series, derived from refinery processes, crude oil stabilisa-tion plants and natural gas processing plants, comprising propane (C3H8) and butane (C4H10) or a combination of the two. They could also include propylene, butylene, isobutene and isobutylene. LPG are normally liquefied under pressure for transportation and storage.
Naphtha NAPHTHA Naphtha is a feedstock destined either for the petrochemical industry (e.g. ethylene manufacture or aromatics production) or for gasoline production by reforming or isomerisation within the refinery. Naph-tha comprises material that distils between 30oC and 210oC. Naphtha imported for blending is shown as an import of naphtha, and then shown in the transfers row as a negative entry for naphtha and a positive entry for the corresponding finished product (e.g. gasoline).
10 - ELECTRICITY INFORMATION (2011 edition)
INTERNATIONAL ENERGY AGENCY
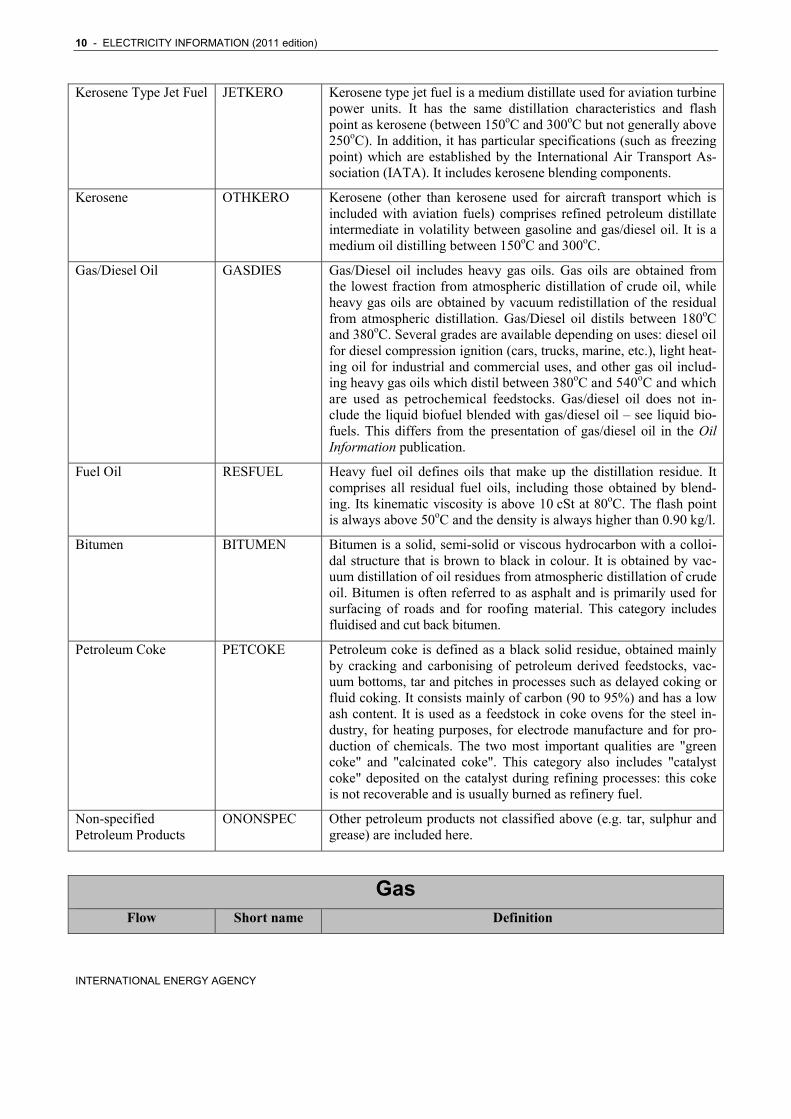
Kerosene Type Jet Fuel JETKERO Kerosene type jet fuel is a medium distillate used for aviation turbine power units. It has the same distillation characteristics and flash point as kerosene (between 150oC and 300oC but not generally above 250oC). In addition, it has particular specifications (such as freezing point) which are established by the International Air Transport As-sociation (IATA). It includes kerosene blending components.
Kerosene OTHKERO Kerosene (other than kerosene used for aircraft transport which is included with aviation fuels) comprises refined petroleum distillate intermediate in volatility between gasoline and gas/diesel oil. It is a medium oil distilling between 150oC and 300oC.
Gas/Diesel Oil GASDIES Gas/Diesel oil includes heavy gas oils. Gas oils are obtained from the lowest fraction from atmospheric distillation of crude oil, while heavy gas oils are obtained by vacuum redistillation of the residual from atmospheric distillation. Gas/Diesel oil distils between 180oC and 380oC. Several grades are available depending on uses: diesel oil for diesel compression ignition (cars, trucks, marine, etc.), light heat-ing oil for industrial and commercial uses, and other gas oil includ-ing heavy gas oils which distil between 380oC and 540oC and which are used as petrochemical feedstocks. Gas/diesel oil does not in-clude the liquid biofuel blended with gas/diesel oil – see liquid bio-fuels. This differs from the presentation of gas/diesel oil in the Oil Information publication.
Fuel Oil RESFUEL Heavy fuel oil defines oils that make up the distillation residue. It comprises all residual fuel oils, including those obtained by blend-ing. Its kinematic viscosity is above 10 cSt at 80oC. The flash point is always above 50oC and the density is always higher than 0.90 kg/l.
Bitumen BITUMEN Bitumen is a solid, semi-solid or viscous hydrocarbon with a colloi-dal structure that is brown to black in colour. It is obtained by vac-uum distillation of oil residues from atmospheric distillation of crude oil. Bitumen is often referred to as asphalt and is primarily used for surfacing of roads and for roofing material. This category includes fluidised and cut back bitumen.
Petroleum Coke PETCOKE Petroleum coke is defined as a black solid residue, obtained mainly by cracking and carbonising of petroleum derived feedstocks, vac-uum bottoms, tar and pitches in processes such as delayed coking or fluid coking. It consists mainly of carbon (90 to 95%) and has a low ash content. It is used as a feedstock in coke ovens for the steel in-dustry, for heating purposes, for electrode manufacture and for pro-duction of chemicals. The two most important qualities are "green coke" and "calcinated coke". This category also includes "catalyst coke" deposited on the catalyst during refining processes: this coke is not recoverable and is usually burned as refinery fuel.
Non-specified Petroleum Products
ONONSPEC Other petroleum products not classified above (e.g. tar, sulphur and grease) are included here.
Gas Flow Short name Definition
ELECTRICITY INFORMATION (2011 edition) - 11
INTERNATIONAL ENERGY AGENCY
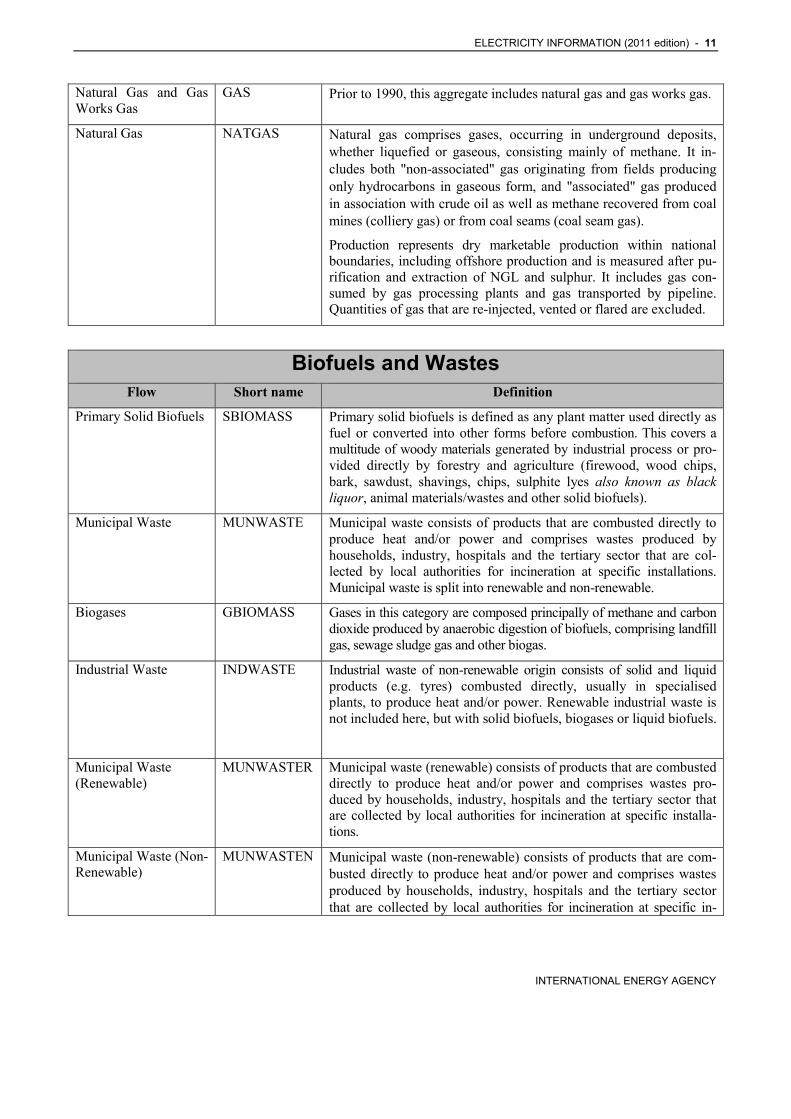
Natural Gas and Gas Works Gas
GAS Prior to 1990, this aggregate includes natural gas and gas works gas.
Natural Gas NATGAS Natural gas comprises gases, occurring in underground deposits, whether liquefied or gaseous, consisting mainly of methane. It in-cludes both "non-associated" gas originating from fields producing only hydrocarbons in gaseous form, and "associated" gas produced in association with crude oil as well as methane recovered from coal mines (colliery gas) or from coal seams (coal seam gas).
Production represents dry marketable production within national boundaries, including offshore production and is measured after pu-rification and extraction of NGL and sulphur. It includes gas con-sumed by gas processing plants and gas transported by pipeline. Quantities of gas that are re-injected, vented or flared are excluded.
Biofuels and Wastes Flow Short name Definition
Primary Solid Biofuels SBIOMASS Primary solid biofuels is defined as any plant matter used directly as fuel or converted into other forms before combustion. This covers a multitude of woody materials generated by industrial process or pro-vided directly by forestry and agriculture (firewood, wood chips, bark, sawdust, shavings, chips, sulphite lyes also known as black liquor, animal materials/wastes and other solid biofuels).
Municipal Waste MUNWASTE Municipal waste consists of products that are combusted directly to produce heat and/or power and comprises wastes produced by households, industry, hospitals and the tertiary sector that are col-lected by local authorities for incineration at specific installations. Municipal waste is split into renewable and non-renewable.
Biogases GBIOMASS Gases in this category are composed principally of methane and carbon dioxide produced by anaerobic digestion of biofuels, comprising landfill gas, sewage sludge gas and other biogas.
Industrial Waste INDWASTE Industrial waste of non-renewable origin consists of solid and liquid products (e.g. tyres) combusted directly, usually in specialised plants, to produce heat and/or power. Renewable industrial waste is not included here, but with solid biofuels, biogases or liquid biofuels.
Municipal Waste (Renewable)
MUNWASTER Municipal waste (renewable) consists of products that are combusted directly to produce heat and/or power and comprises wastes pro-duced by households, industry, hospitals and the tertiary sector that are collected by local authorities for incineration at specific installa-tions.
Municipal Waste (Non-Renewable)
MUNWASTEN Municipal waste (non-renewable) consists of products that are com-busted directly to produce heat and/or power and comprises wastes produced by households, industry, hospitals and the tertiary sector that are collected by local authorities for incineration at specific in-
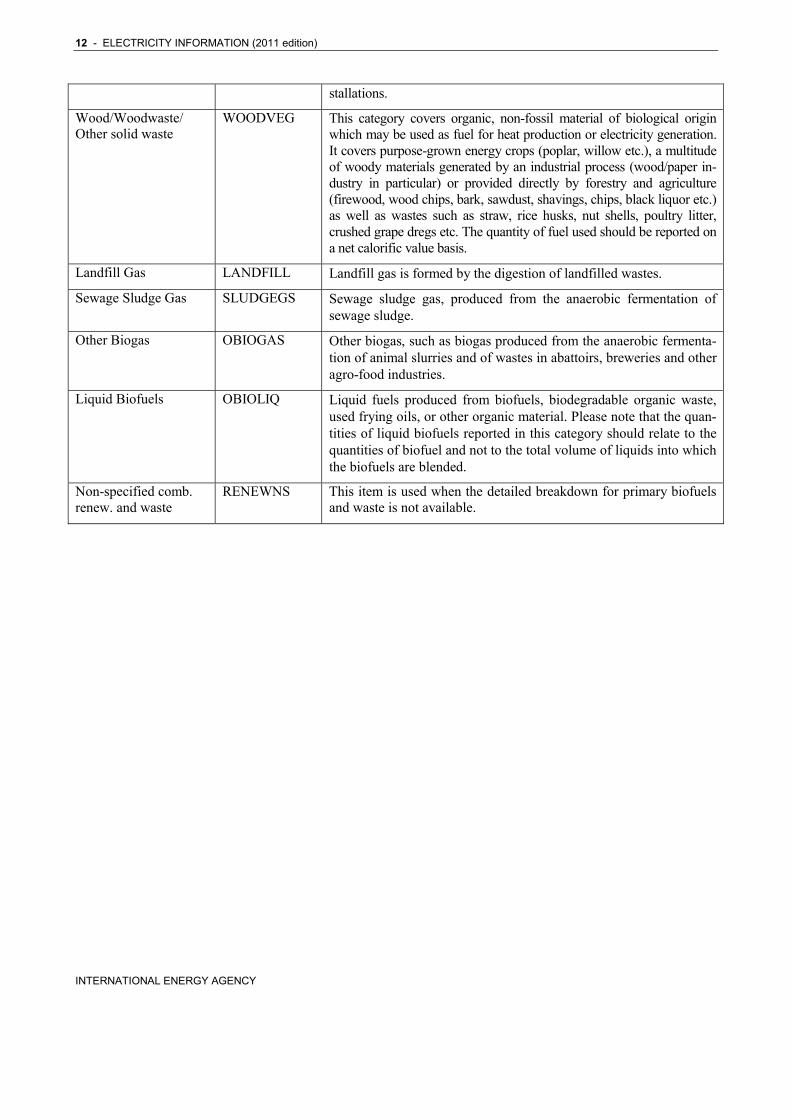
12 - ELECTRICITY INFORMATION (2011 edition)
INTERNATIONAL ENERGY AGENCY
stallations.
Wood/Woodwaste/ Other solid waste
WOODVEG This category covers organic, non-fossil material of biological origin which may be used as fuel for heat production or electricity generation. It covers purpose-grown energy crops (poplar, willow etc.), a multitude of woody materials generated by an industrial process (wood/paper in-dustry in particular) or provided directly by forestry and agriculture (firewood, wood chips, bark, sawdust, shavings, chips, black liquor etc.) as well as wastes such as straw, rice husks, nut shells, poultry litter, crushed grape dregs etc. The quantity of fuel used should be reported on a net calorific value basis.
Landfill Gas LANDFILL Landfill gas is formed by the digestion of landfilled wastes.
Sewage Sludge Gas SLUDGEGS Sewage sludge gas, produced from the anaerobic fermentation of sewage sludge.
Other Biogas OBIOGAS Other biogas, such as biogas produced from the anaerobic fermenta-tion of animal slurries and of wastes in abattoirs, breweries and other agro-food industries.
Liquid Biofuels OBIOLIQ Liquid fuels produced from biofuels, biodegradable organic waste, used frying oils, or other organic material. Please note that the quan-tities of liquid biofuels reported in this category should relate to the quantities of biofuel and not to the total volume of liquids into which the biofuels are blended.
Non-specified comb. renew. and waste
RENEWNS This item is used when the detailed breakdown for primary biofuels and waste is not available.
ELECTRICITY INFORMATION (2011 edition) - 13
INTERNATIONAL ENERGY AGENCY
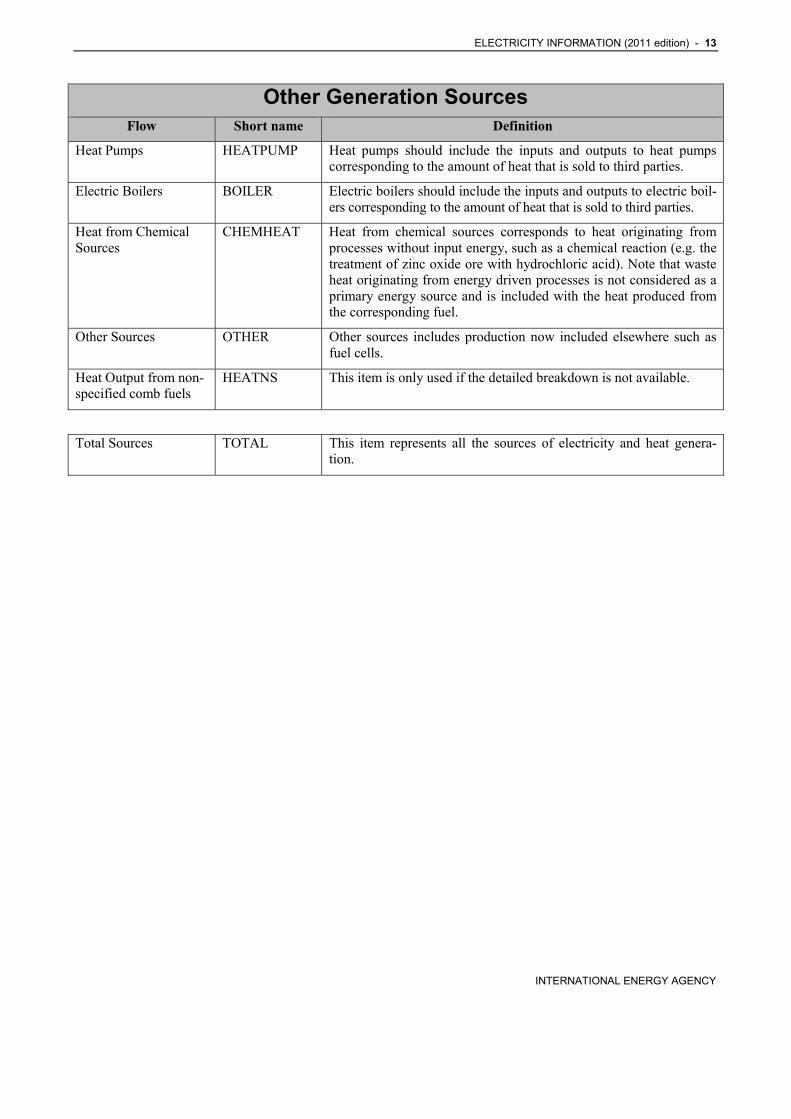
Other Generation Sources Flow Short name Definition
Heat Pumps HEATPUMP Heat pumps should include the inputs and outputs to heat pumps corresponding to the amount of heat that is sold to third parties.
Electric Boilers BOILER Electric boilers should include the inputs and outputs to electric boil-ers corresponding to the amount of heat that is sold to third parties.
Heat from Chemical Sources
CHEMHEAT Heat from chemical sources corresponds to heat originating from processes without input energy, such as a chemical reaction (e.g. the treatment of zinc oxide ore with hydrochloric acid). Note that waste heat originating from energy driven processes is not considered as a primary energy source and is included with the heat produced from the corresponding fuel.
Other Sources OTHER Other sources includes production now included elsewhere such as fuel cells.
Heat Output from non-specified comb fuels
HEATNS This item is only used if the detailed breakdown is not available.
Total Sources TOTAL This item represents all the sources of electricity and heat genera-tion.

ELECTRICITY INFORMATION (2011 edition) - 15
INTERNATIONAL ENERGY AGENCY
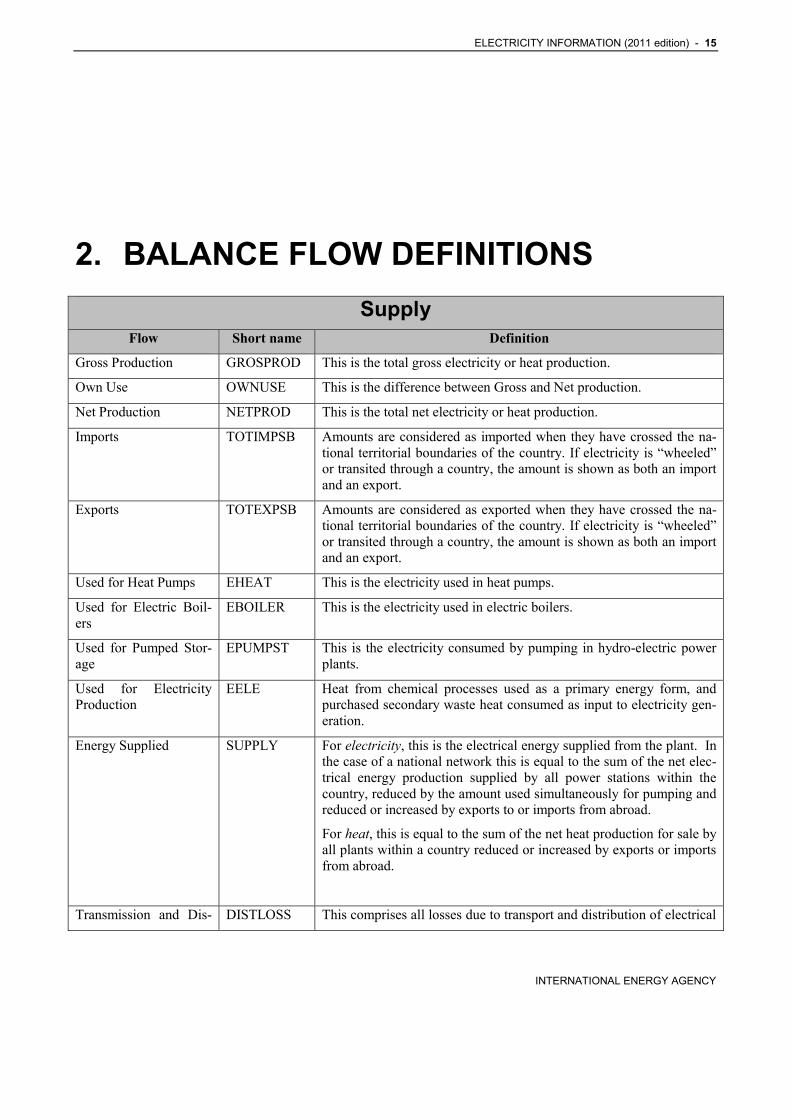
2. BALANCE FLOW DEFINITIONS
Supply Flow Short name Definition
Gross Production GROSPROD This is the total gross electricity or heat production.
Own Use OWNUSE This is the difference between Gross and Net production.
Net Production NETPROD This is the total net electricity or heat production.
Imports TOTIMPSB Amounts are considered as imported when they have crossed the na-tional territorial boundaries of the country. If electricity is “wheeled” or transited through a country, the amount is shown as both an import and an export.
Exports TOTEXPSB Amounts are considered as exported when they have crossed the na-tional territorial boundaries of the country. If electricity is “wheeled” or transited through a country, the amount is shown as both an import and an export.
Used for Heat Pumps EHEAT This is the electricity used in heat pumps.
Used for Electric Boil-ers
EBOILER This is the electricity used in electric boilers.
Used for Pumped Stor-age
EPUMPST This is the electricity consumed by pumping in hydro-electric power plants.
Used for Electricity Production
EELE Heat from chemical processes used as a primary energy form, and purchased secondary waste heat consumed as input to electricity gen-eration.
Energy Supplied SUPPLY For electricity, this is the electrical energy supplied from the plant. In the case of a national network this is equal to the sum of the net elec-trical energy production supplied by all power stations within the country, reduced by the amount used simultaneously for pumping and reduced or increased by exports to or imports from abroad.
For heat, this is equal to the sum of the net heat production for sale by all plants within a country reduced or increased by exports or imports from abroad.
Transmission and Dis- DISTLOSS This comprises all losses due to transport and distribution of electrical

16 - ELECTRICITY INFORMATION (2011 edition)
INTERNATIONAL ENERGY AGENCY
tribution Losses energy and heat. For electricity, losses in transformers which are not considered as integral parts of the power plants are also included.
Calculated Consump-tion
TFCCALC This equals the Energy Supplied minus Transmission and Distribution Losses.
Statistical Difference STATDIFF This equals the Total Consumption (calculated) – Total Consumption (observed).
Observed Consumption TFCOBS This is the amount actually recorded in surveys of end-use sectors. It should, in principle, correspond to the total consumption (calculated).
ELECTRICITY INFORMATION (2011 edition) - 17
INTERNATIONAL ENERGY AGENCY
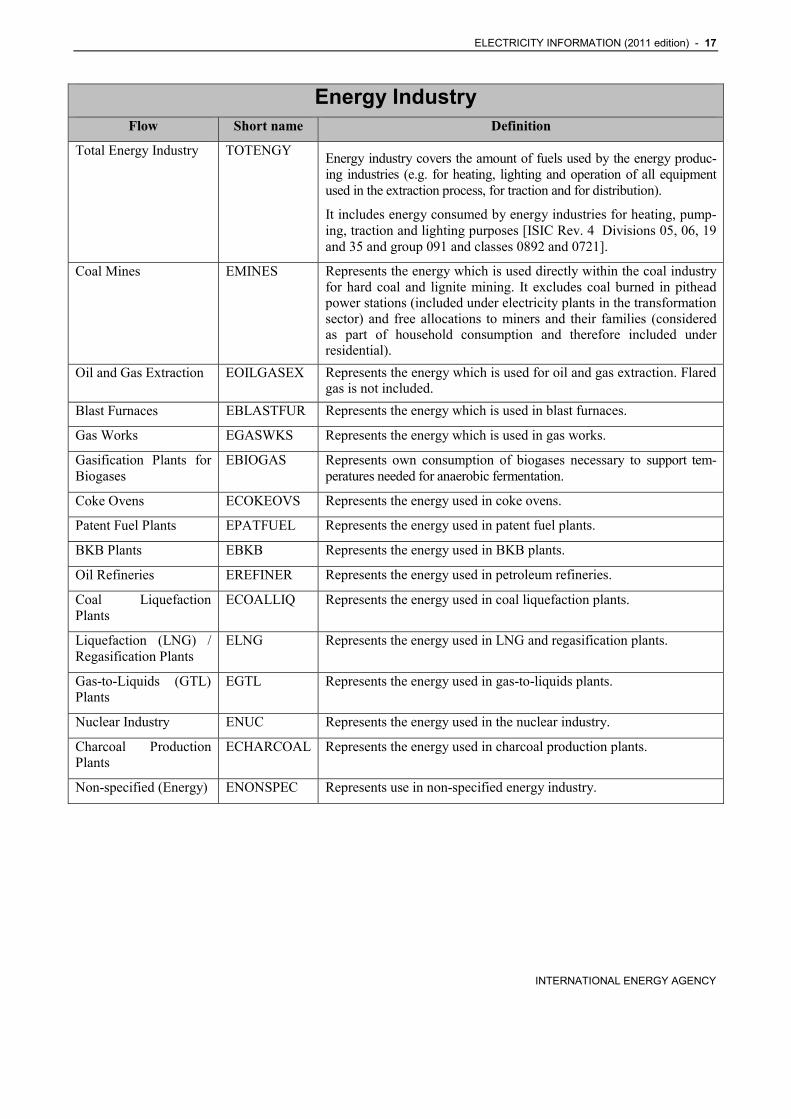
Energy Industry Flow Short name Definition
Total Energy Industry TOTENGY Energy industry covers the amount of fuels used by the energy produc-ing industries (e.g. for heating, lighting and operation of all equipment used in the extraction process, for traction and for distribution).
It includes energy consumed by energy industries for heating, pump-ing, traction and lighting purposes [ISIC Rev. 4 Divisions 05, 06, 19 and 35 and group 091 and classes 0892 and 0721].
Coal Mines EMINES Represents the energy which is used directly within the coal industry for hard coal and lignite mining. It excludes coal burned in pithead power stations (included under electricity plants in the transformation sector) and free allocations to miners and their families (considered as part of household consumption and therefore included under residential).
Oil and Gas Extraction EOILGASEX Represents the energy which is used for oil and gas extraction. Flared gas is not included.
Blast Furnaces EBLASTFUR Represents the energy which is used in blast furnaces.
Gas Works EGASWKS Represents the energy which is used in gas works.
Gasification Plants for Biogases
EBIOGAS Represents own consumption of biogases necessary to support tem-peratures needed for anaerobic fermentation.
Coke Ovens ECOKEOVS Represents the energy used in coke ovens.
Patent Fuel Plants EPATFUEL Represents the energy used in patent fuel plants.
BKB Plants EBKB Represents the energy used in BKB plants.
Oil Refineries EREFINER Represents the energy used in petroleum refineries.
Coal Liquefaction Plants
ECOALLIQ Represents the energy used in coal liquefaction plants.
Liquefaction (LNG) / Regasification Plants
ELNG Represents the energy used in LNG and regasification plants.
Gas-to-Liquids (GTL) Plants
EGTL Represents the energy used in gas-to-liquids plants.
Nuclear Industry ENUC Represents the energy used in the nuclear industry.
Charcoal Production Plants
ECHARCOAL Represents the energy used in charcoal production plants.
Non-specified (Energy) ENONSPEC Represents use in non-specified energy industry.
18 - ELECTRICITY INFORMATION (2011 edition)
INTERNATIONAL ENERGY AGENCY
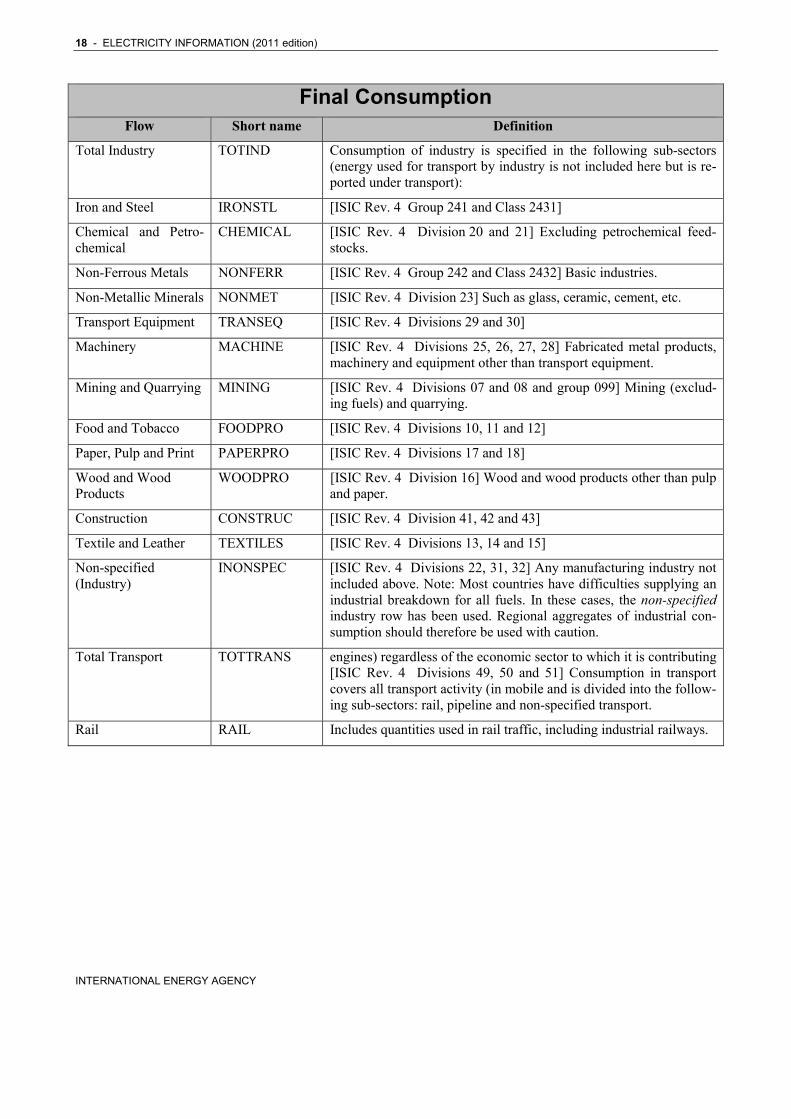
Final Consumption Flow Short name Definition
Total Industry TOTIND Consumption of industry is specified in the following sub-sectors (energy used for transport by industry is not included here but is re-ported under transport):
Iron and Steel IRONSTL [ISIC Rev. 4 Group 241 and Class 2431]
Chemical and Petro-chemical
CHEMICAL [ISIC Rev. 4 Division 20 and 21] Excluding petrochemical feed-stocks.
Non-Ferrous Metals NONFERR [ISIC Rev. 4 Group 242 and Class 2432] Basic industries.
Non-Metallic Minerals NONMET [ISIC Rev. 4 Division 23] Such as glass, ceramic, cement, etc.
Transport Equipment TRANSEQ [ISIC Rev. 4 Divisions 29 and 30]
Machinery MACHINE [ISIC Rev. 4 Divisions 25, 26, 27, 28] Fabricated metal products, machinery and equipment other than transport equipment.
Mining and Quarrying MINING [ISIC Rev. 4 Divisions 07 and 08 and group 099] Mining (exclud-ing fuels) and quarrying.
Food and Tobacco FOODPRO [ISIC Rev. 4 Divisions 10, 11 and 12]
Paper, Pulp and Print PAPERPRO [ISIC Rev. 4 Divisions 17 and 18]
Wood and Wood Products
WOODPRO [ISIC Rev. 4 Division 16] Wood and wood products other than pulp and paper.
Construction CONSTRUC [ISIC Rev. 4 Division 41, 42 and 43]
Textile and Leather TEXTILES [ISIC Rev. 4 Divisions 13, 14 and 15]
Non-specified (Industry)
INONSPEC [ISIC Rev. 4 Divisions 22, 31, 32] Any manufacturing industry not included above. Note: Most countries have difficulties supplying an industrial breakdown for all fuels. In these cases, the non-specified industry row has been used. Regional aggregates of industrial con-sumption should therefore be used with caution.
Total Transport TOTTRANS engines) regardless of the economic sector to which it is contributing [ISIC Rev. 4 Divisions 49, 50 and 51] Consumption in transport covers all transport activity (in mobile and is divided into the follow-ing sub-sectors: rail, pipeline and non-specified transport.
Rail RAIL Includes quantities used in rail traffic, including industrial railways.
ELECTRICITY INFORMATION (2011 edition) - 19
INTERNATIONAL ENERGY AGENCY
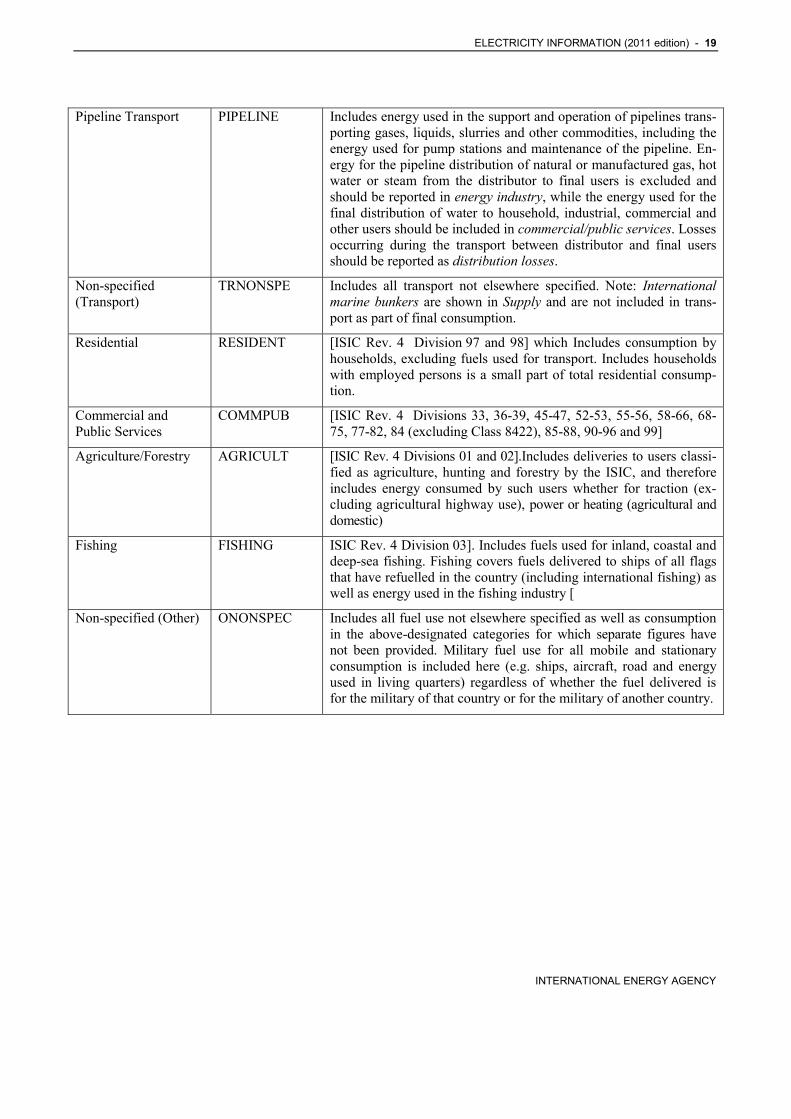
Pipeline Transport PIPELINE Includes energy used in the support and operation of pipelines trans-porting gases, liquids, slurries and other commodities, including the energy used for pump stations and maintenance of the pipeline. En-ergy for the pipeline distribution of natural or manufactured gas, hot water or steam from the distributor to final users is excluded and should be reported in energy industry, while the energy used for the final distribution of water to household, industrial, commercial and other users should be included in commercial/public services. Losses occurring during the transport between distributor and final users should be reported as distribution losses.
Non-specified (Transport)
TRNONSPE Includes all transport not elsewhere specified. Note: International marine bunkers are shown in Supply and are not included in trans-port as part of final consumption.
Residential RESIDENT [ISIC Rev. 4 Division 97 and 98] which Includes consumption by households, excluding fuels used for transport. Includes households with employed persons is a small part of total residential consump-tion.
Commercial and Public Services
COMMPUB [ISIC Rev. 4 Divisions 33, 36-39, 45-47, 52-53, 55-56, 58-66, 68-75, 77-82, 84 (excluding Class 8422), 85-88, 90-96 and 99]
Agriculture/Forestry AGRICULT [ISIC Rev. 4 Divisions 01 and 02].Includes deliveries to users classi-fied as agriculture, hunting and forestry by the ISIC, and therefore includes energy consumed by such users whether for traction (ex-cluding agricultural highway use), power or heating (agricultural and domestic)
Fishing FISHING ISIC Rev. 4 Division 03]. Includes fuels used for inland, coastal and deep-sea fishing. Fishing covers fuels delivered to ships of all flags that have refuelled in the country (including international fishing) as well as energy used in the fishing industry [
Non-specified (Other) ONONSPEC Includes all fuel use not elsewhere specified as well as consumption in the above-designated categories for which separate figures have not been provided. Military fuel use for all mobile and stationary consumption is included here (e.g. ships, aircraft, road and energy used in living quarters) regardless of whether the fuel delivered is for the military of that country or for the military of another country.

ELECTRICITY INFORMATION (2011 edition) - 21
INTERNATIONAL ENERGY AGENCY
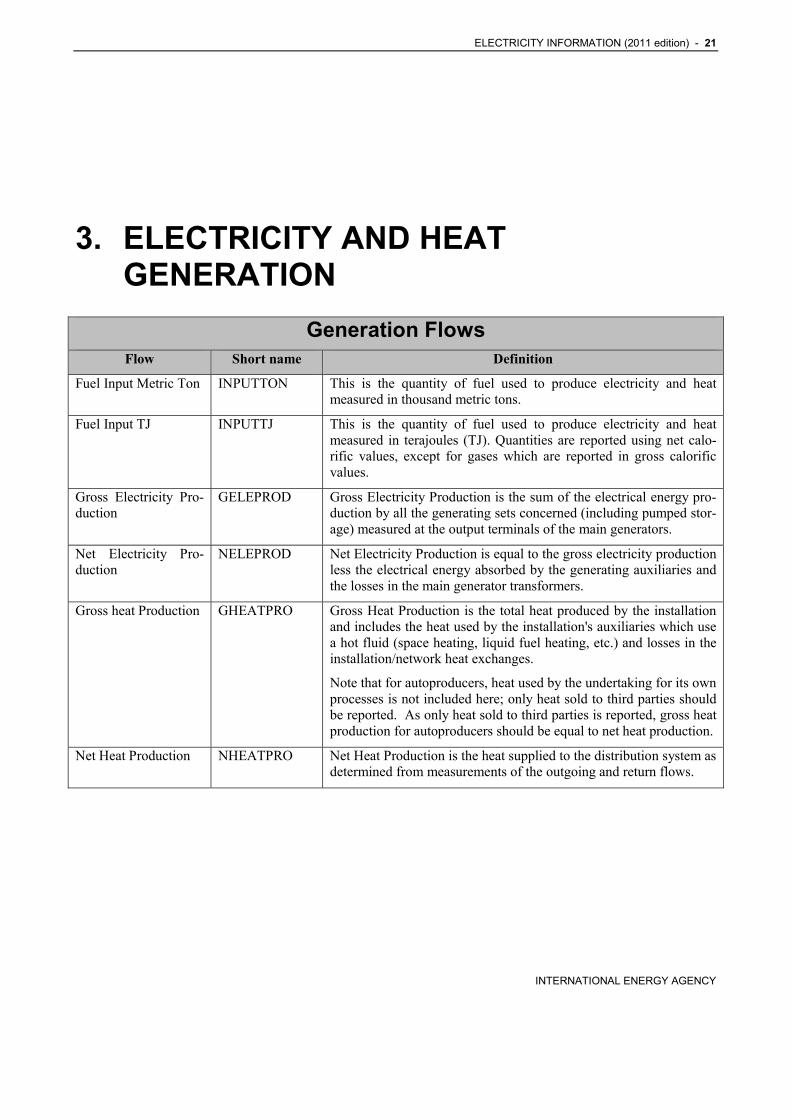
3. ELECTRICITY AND HEAT GENERATION
Generation Flows Flow Short name Definition
Fuel Input Metric Ton INPUTTON This is the quantity of fuel used to produce electricity and heat measured in thousand metric tons.
Fuel Input TJ INPUTTJ This is the quantity of fuel used to produce electricity and heat measured in terajoules (TJ). Quantities are reported using net calo-rific values, except for gases which are reported in gross calorific values.
Gross Electricity Pro-duction
GELEPROD Gross Electricity Production is the sum of the electrical energy pro-duction by all the generating sets concerned (including pumped stor-age) measured at the output terminals of the main generators.
Net Electricity Pro-duction
NELEPROD Net Electricity Production is equal to the gross electricity production less the electrical energy absorbed by the generating auxiliaries and the losses in the main generator transformers.
Gross heat Production GHEATPRO Gross Heat Production is the total heat produced by the installation and includes the heat used by the installation's auxiliaries which use a hot fluid (space heating, liquid fuel heating, etc.) and losses in the installation/network heat exchanges.
Note that for autoproducers, heat used by the undertaking for its own processes is not included here; only heat sold to third parties should be reported. As only heat sold to third parties is reported, gross heat production for autoproducers should be equal to net heat production.
Net Heat Production NHEATPRO Net Heat Production is the heat supplied to the distribution system as determined from measurements of the outgoing and return flows.
22 - ELECTRICITY INFORMATION (2011 edition)
INTERNATIONAL ENERGY AGENCY
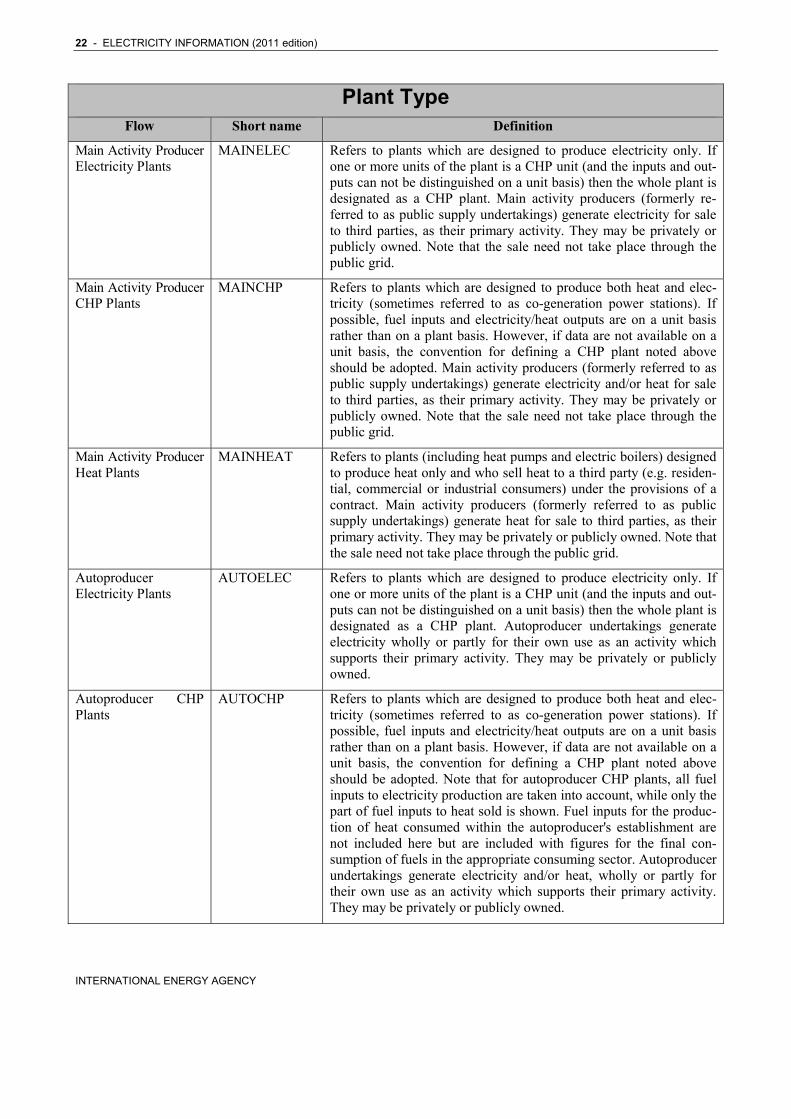
Plant Type Flow Short name Definition
Main Activity Producer Electricity Plants
MAINELEC Refers to plants which are designed to produce electricity only. If one or more units of the plant is a CHP unit (and the inputs and out-puts can not be distinguished on a unit basis) then the whole plant is designated as a CHP plant. Main activity producers (formerly re-ferred to as public supply undertakings) generate electricity for sale to third parties, as their primary activity. They may be privately or publicly owned. Note that the sale need not take place through the public grid.
Main Activity Producer CHP Plants
MAINCHP Refers to plants which are designed to produce both heat and elec-tricity (sometimes referred to as co-generation power stations). If possible, fuel inputs and electricity/heat outputs are on a unit basis rather than on a plant basis. However, if data are not available on a unit basis, the convention for defining a CHP plant noted above should be adopted. Main activity producers (formerly referred to as public supply undertakings) generate electricity and/or heat for sale to third parties, as their primary activity. They may be privately or publicly owned. Note that the sale need not take place through the public grid.
Main Activity Producer Heat Plants
MAINHEAT Refers to plants (including heat pumps and electric boilers) designed to produce heat only and who sell heat to a third party (e.g. residen-tial, commercial or industrial consumers) under the provisions of a contract. Main activity producers (formerly referred to as public supply undertakings) generate heat for sale to third parties, as their primary activity. They may be privately or publicly owned. Note that the sale need not take place through the public grid.
Autoproducer Electricity Plants
AUTOELEC Refers to plants which are designed to produce electricity only. If one or more units of the plant is a CHP unit (and the inputs and out-puts can not be distinguished on a unit basis) then the whole plant is designated as a CHP plant. Autoproducer undertakings generate electricity wholly or partly for their own use as an activity which supports their primary activity. They may be privately or publicly owned.
Autoproducer CHP Plants
AUTOCHP Refers to plants which are designed to produce both heat and elec-tricity (sometimes referred to as co-generation power stations). If possible, fuel inputs and electricity/heat outputs are on a unit basis rather than on a plant basis. However, if data are not available on a unit basis, the convention for defining a CHP plant noted above should be adopted. Note that for autoproducer CHP plants, all fuel inputs to electricity production are taken into account, while only the part of fuel inputs to heat sold is shown. Fuel inputs for the produc-tion of heat consumed within the autoproducer's establishment are not included here but are included with figures for the final con-sumption of fuels in the appropriate consuming sector. Autoproducer undertakings generate electricity and/or heat, wholly or partly for their own use as an activity which supports their primary activity. They may be privately or publicly owned.

ELECTRICITY INFORMATION (2011 edition) - 23
INTERNATIONAL ENERGY AGENCY
Autoproducer Heat Plants
AUTOHEAT Refers to plants (including heat pumps and electric boilers) designed to produce heat only and who sell heat to a third party (e.g. residen-tial, commercial or industrial consumers) under the provisions of a contract. Autoproducer undertakings generate heat, wholly or partly for their own use as an activity which supports their primary activity. They may be privately or publicly owned.
Total Main Activity Producer Plants
MAINTOT This refers to inputs to and outputs from all main activity producer plants.
Total Autoproducer Plants
AUTOTOT This refers to inputs to and outputs from all autoproducer plants.
Total Plants TOTAL This refers to inputs to and outputs from all plants.

ELECTRICITY INFORMATION (2011 edition) - 25
INTERNATIONAL ENERGY AGENCY
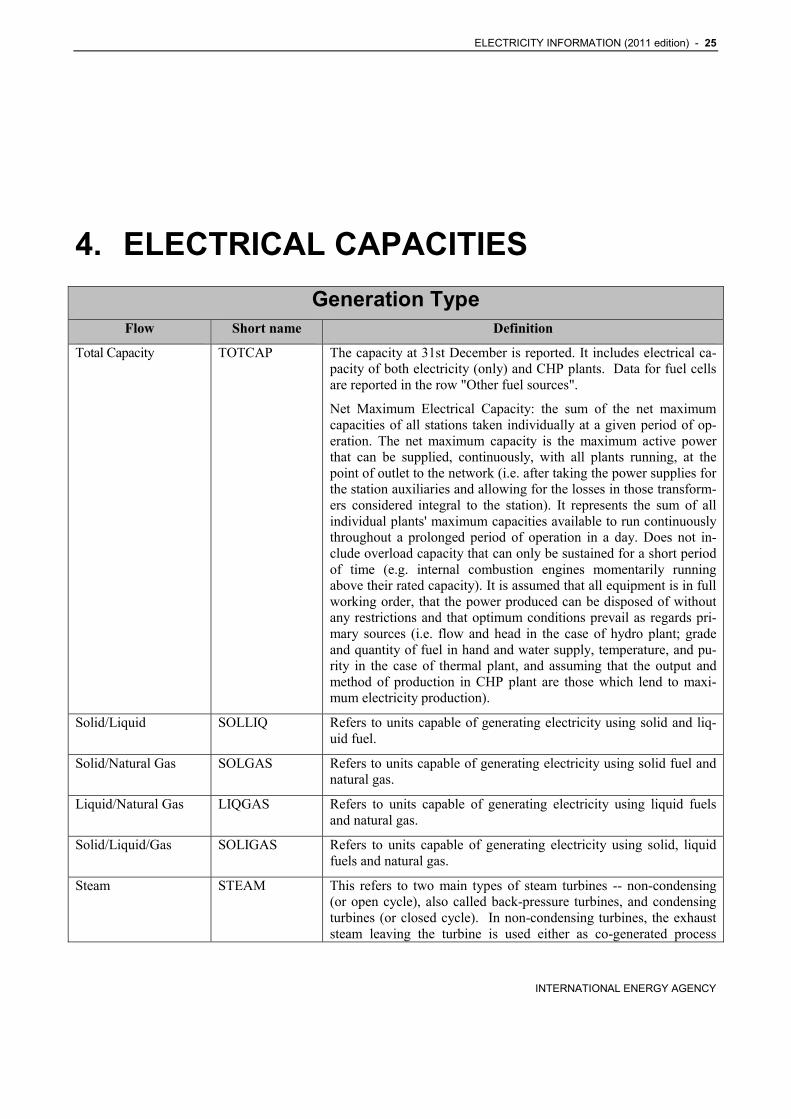
4. ELECTRICAL CAPACITIES
Generation Type Flow Short name Definition
Total Capacity TOTCAP The capacity at 31st December is reported. It includes electrical ca-pacity of both electricity (only) and CHP plants. Data for fuel cells are reported in the row "Other fuel sources".
Net Maximum Electrical Capacity: the sum of the net maximum capacities of all stations taken individually at a given period of op-eration. The net maximum capacity is the maximum active power that can be supplied, continuously, with all plants running, at the point of outlet to the network (i.e. after taking the power supplies for the station auxiliaries and allowing for the losses in those transform-ers considered integral to the station). It represents the sum of all individual plants' maximum capacities available to run continuously throughout a prolonged period of operation in a day. Does not in-clude overload capacity that can only be sustained for a short period of time (e.g. internal combustion engines momentarily running above their rated capacity). It is assumed that all equipment is in full working order, that the power produced can be disposed of without any restrictions and that optimum conditions prevail as regards pri-mary sources (i.e. flow and head in the case of hydro plant; grade and quantity of fuel in hand and water supply, temperature, and pu-rity in the case of thermal plant, and assuming that the output and method of production in CHP plant are those which lend to maxi-mum electricity production).
Solid/Liquid SOLLIQ Refers to units capable of generating electricity using solid and liq-uid fuel.
Solid/Natural Gas SOLGAS Refers to units capable of generating electricity using solid fuel and natural gas.
Liquid/Natural Gas LIQGAS Refers to units capable of generating electricity using liquid fuels and natural gas.
Solid/Liquid/Gas SOLIGAS Refers to units capable of generating electricity using solid, liquid fuels and natural gas.
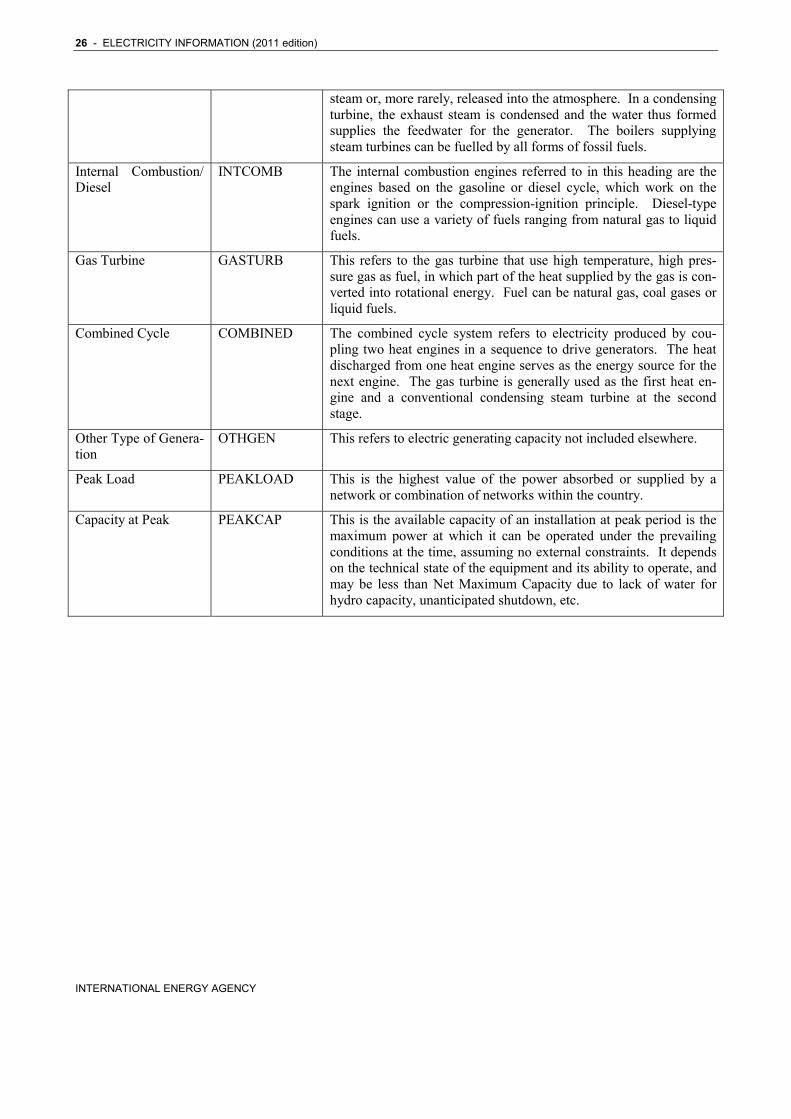
Steam STEAM This refers to two main types of steam turbines -- non-condensing (or open cycle), also called back-pressure turbines, and condensing turbines (or closed cycle). In non-condensing turbines, the exhaust steam leaving the turbine is used either as co-generated process
26 - ELECTRICITY INFORMATION (2011 edition)
INTERNATIONAL ENERGY AGENCY
steam or, more rarely, released into the atmosphere. In a condensing turbine, the exhaust steam is condensed and the water thus formed supplies the feedwater for the generator. The boilers supplying steam turbines can be fuelled by all forms of fossil fuels.
Internal Combustion/ Diesel
INTCOMB The internal combustion engines referred to in this heading are the engines based on the gasoline or diesel cycle, which work on the spark ignition or the compression-ignition principle. Diesel-type engines can use a variety of fuels ranging from natural gas to liquid fuels.
Gas Turbine GASTURB This refers to the gas turbine that use high temperature, high pres-sure gas as fuel, in which part of the heat supplied by the gas is con-verted into rotational energy. Fuel can be natural gas, coal gases or liquid fuels.
Combined Cycle COMBINED The combined cycle system refers to electricity produced by cou-pling two heat engines in a sequence to drive generators. The heat discharged from one heat engine serves as the energy source for the next engine. The gas turbine is generally used as the first heat en-gine and a conventional condensing steam turbine at the second stage.
Other Type of Genera-tion
OTHGEN This refers to electric generating capacity not included elsewhere.
Peak Load PEAKLOAD This is the highest value of the power absorbed or supplied by a network or combination of networks within the country.
Capacity at Peak PEAKCAP This is the available capacity of an installation at peak period is the maximum power at which it can be operated under the prevailing conditions at the time, assuming no external constraints. It depends on the technical state of the equipment and its ability to operate, and may be less than Net Maximum Capacity due to lack of water for hydro capacity, unanticipated shutdown, etc.
ELECTRICITY INFORMATION (2011 edition) - 27
INTERNATIONAL ENERGY AGENCY
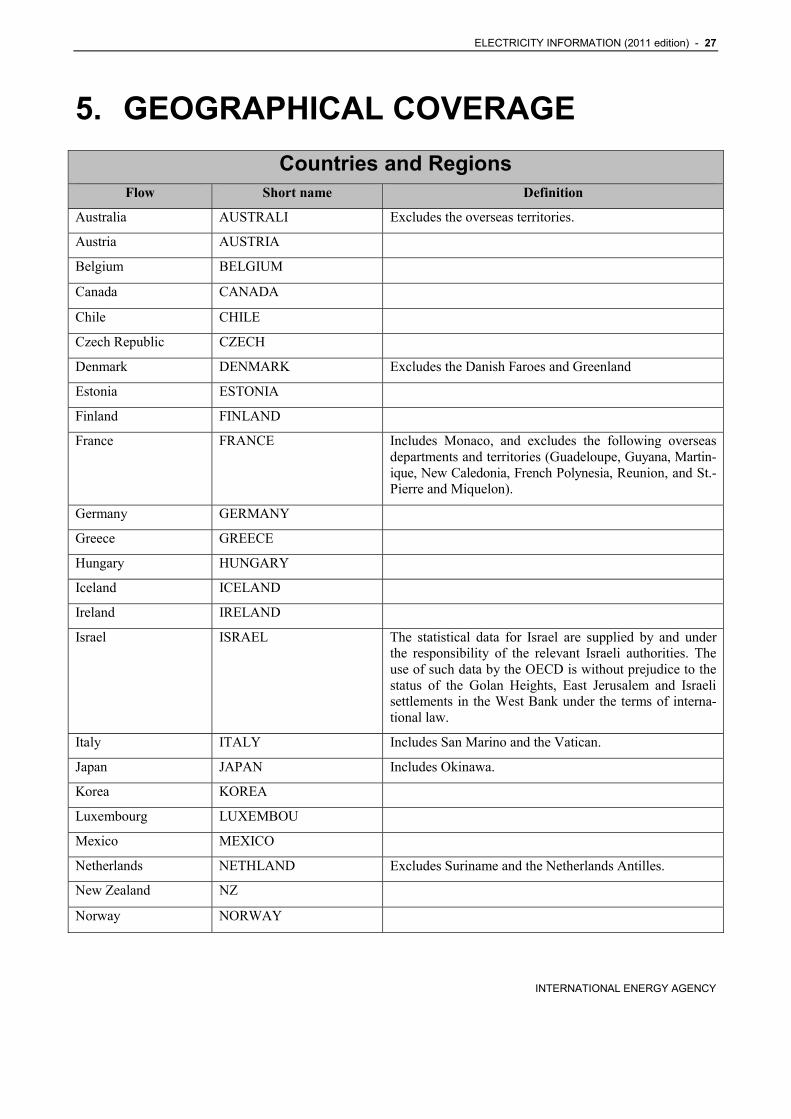
5. GEOGRAPHICAL COVERAGE
Countries and Regions Flow Short name Definition
Australia AUSTRALI Excludes the overseas territories.
Austria AUSTRIA
Belgium BELGIUM
Canada CANADA
Chile CHILE
Czech Republic CZECH
Denmark DENMARK Excludes the Danish Faroes and Greenland
Estonia ESTONIA
Finland FINLAND
France FRANCE Includes Monaco, and excludes the following overseas departments and territories (Guadeloupe, Guyana, Martin-ique, New Caledonia, French Polynesia, Reunion, and St.-Pierre and Miquelon).
Germany GERMANY
Greece GREECE
Hungary HUNGARY
Iceland ICELAND
Ireland IRELAND
Israel ISRAEL The statistical data for Israel are supplied by and under the responsibility of the relevant Israeli authorities. The use of such data by the OECD is without prejudice to the status of the Golan Heights, East Jerusalem and Israeli settlements in the West Bank under the terms of interna-tional law.
Italy ITALY Includes San Marino and the Vatican.
Japan JAPAN Includes Okinawa.
Korea KOREA
Luxembourg LUXEMBOU
Mexico MEXICO
Netherlands NETHLAND Excludes Suriname and the Netherlands Antilles.
New Zealand NZ
Norway NORWAY
28 - ELECTRICITY INFORMATION (2011 edition)
INTERNATIONAL ENERGY AGENCY
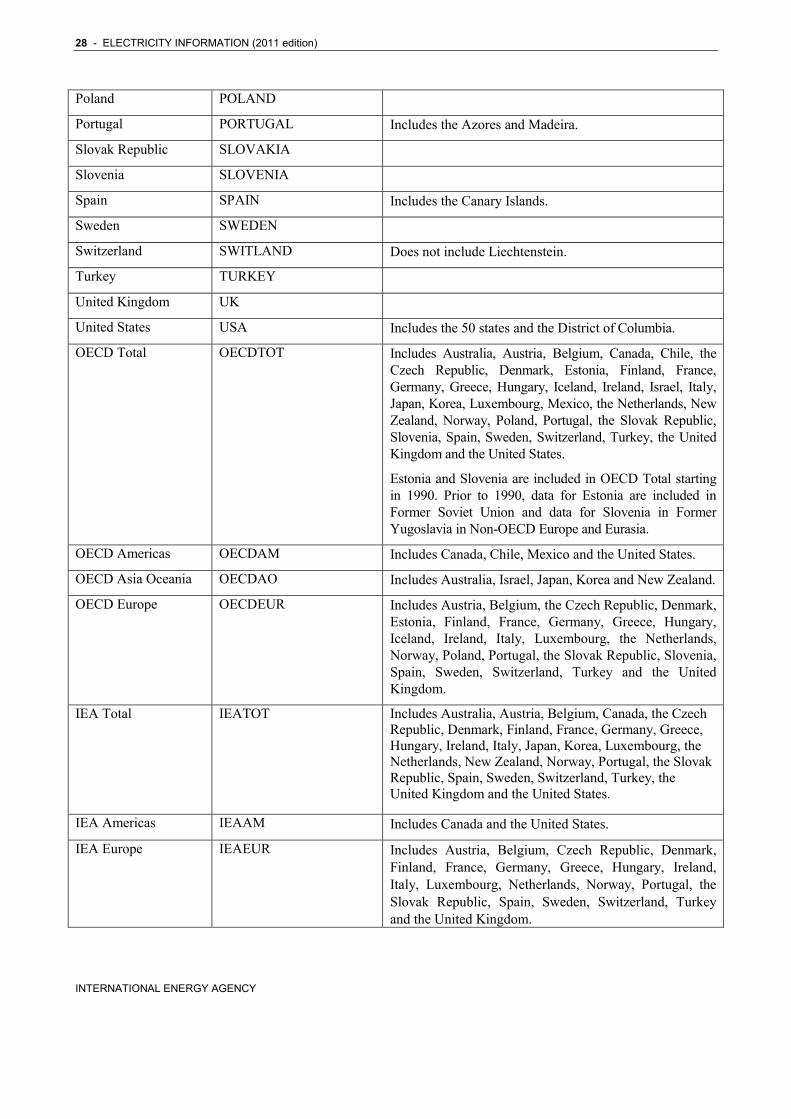
Poland POLAND
Portugal PORTUGAL Includes the Azores and Madeira.
Slovak Republic SLOVAKIA
Slovenia SLOVENIA
Spain SPAIN Includes the Canary Islands.
Sweden SWEDEN
Switzerland SWITLAND Does not include Liechtenstein.
Turkey TURKEY
United Kingdom UK
United States USA Includes the 50 states and the District of Columbia.
OECD Total OECDTOT Includes Australia, Austria, Belgium, Canada, Chile, the Czech Republic, Denmark, Estonia, Finland, France, Germany, Greece, Hungary, Iceland, Ireland, Israel, Italy, Japan, Korea, Luxembourg, Mexico, the Netherlands, New Zealand, Norway, Poland, Portugal, the Slovak Republic, Slovenia, Spain, Sweden, Switzerland, Turkey, the United Kingdom and the United States.
Estonia and Slovenia are included in OECD Total starting in 1990. Prior to 1990, data for Estonia are included in Former Soviet Union and data for Slovenia in Former Yugoslavia in Non-OECD Europe and Eurasia.
OECD Americas OECDAM Includes Canada, Chile, Mexico and the United States.
OECD Asia Oceania OECDAO Includes Australia, Israel, Japan, Korea and New Zealand.
OECD Europe OECDEUR Includes Austria, Belgium, the Czech Republic, Denmark, Estonia, Finland, France, Germany, Greece, Hungary, Iceland, Ireland, Italy, Luxembourg, the Netherlands, Norway, Poland, Portugal, the Slovak Republic, Slovenia, Spain, Sweden, Switzerland, Turkey and the United Kingdom.
IEA Total IEATOT Includes Australia, Austria, Belgium, Canada, the Czech Republic, Denmark, Finland, France, Germany, Greece, Hungary, Ireland, Italy, Japan, Korea, Luxembourg, the Netherlands, New Zealand, Norway, Portugal, the Slovak Republic, Spain, Sweden, Switzerland, Turkey, the United Kingdom and the United States.
IEA Americas IEAAM Includes Canada and the United States.
IEA Europe IEAEUR Includes Austria, Belgium, Czech Republic, Denmark, Finland, France, Germany, Greece, Hungary, Ireland, Italy, Luxembourg, Netherlands, Norway, Portugal, the Slovak Republic, Spain, Sweden, Switzerland, Turkey and the United Kingdom.
ELECTRICITY INFORMATION (2011 edition) - 29
INTERNATIONAL ENERGY AGENCY
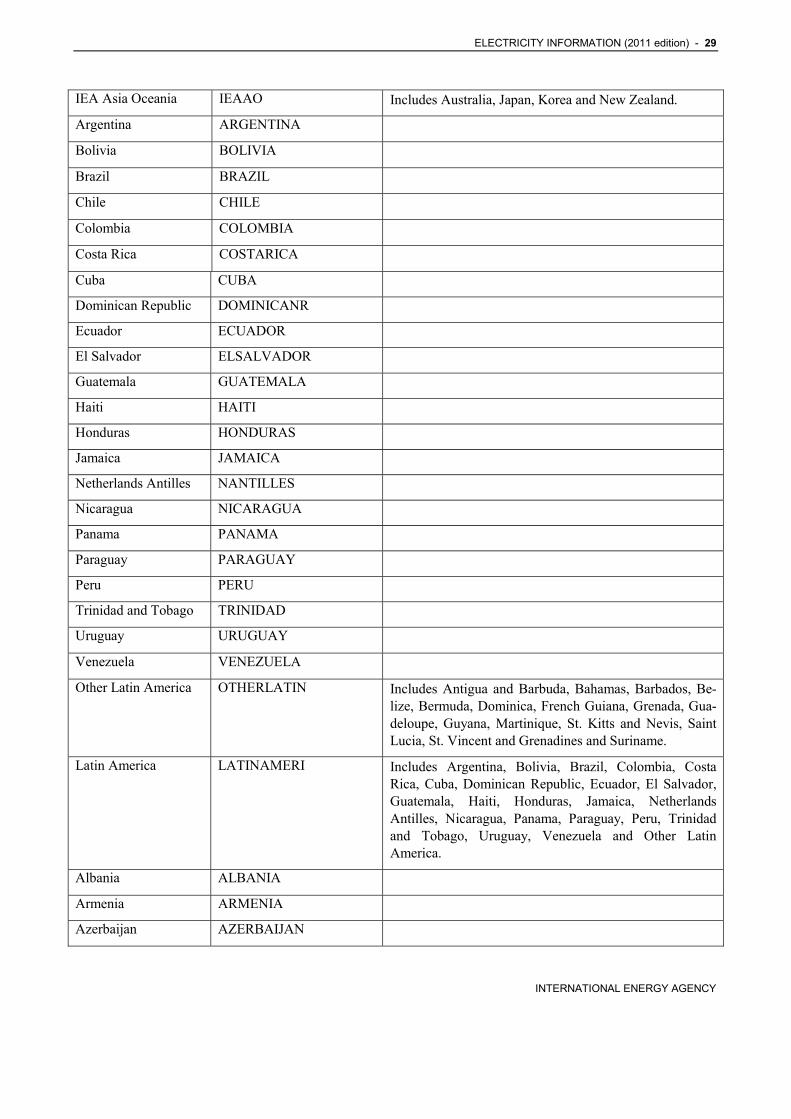
IEA Asia Oceania IEAAO Includes Australia, Japan, Korea and New Zealand.
Argentina ARGENTINA
Bolivia BOLIVIA
Brazil BRAZIL
Chile CHILE
Colombia COLOMBIA
Costa Rica COSTARICA
Cuba CUBA
Dominican Republic DOMINICANR
Ecuador ECUADOR
El Salvador ELSALVADOR
Guatemala GUATEMALA
Haiti HAITI
Honduras HONDURAS
Jamaica JAMAICA
Netherlands Antilles NANTILLES
Nicaragua NICARAGUA
Panama PANAMA
Paraguay PARAGUAY
Peru PERU
Trinidad and Tobago TRINIDAD
Uruguay URUGUAY
Venezuela VENEZUELA
Other Latin America OTHERLATIN Includes Antigua and Barbuda, Bahamas, Barbados, Be-lize, Bermuda, Dominica, French Guiana, Grenada, Gua-deloupe, Guyana, Martinique, St. Kitts and Nevis, Saint Lucia, St. Vincent and Grenadines and Suriname.
Latin America LATINAMERI Includes Argentina, Bolivia, Brazil, Colombia, Costa Rica, Cuba, Dominican Republic, Ecuador, El Salvador, Guatemala, Haiti, Honduras, Jamaica, Netherlands Antilles, Nicaragua, Panama, Paraguay, Peru, Trinidad and Tobago, Uruguay, Venezuela and Other Latin America.
Albania ALBANIA
Armenia ARMENIA
Azerbaijan AZERBAIJAN
30 - ELECTRICITY INFORMATION (2011 edition)
INTERNATIONAL ENERGY AGENCY
Belarus BELARUS
Bosnia
and Herzegovina
BOSNIAHERZ
Bulgaria BULGARIA
Croatia CROATIA
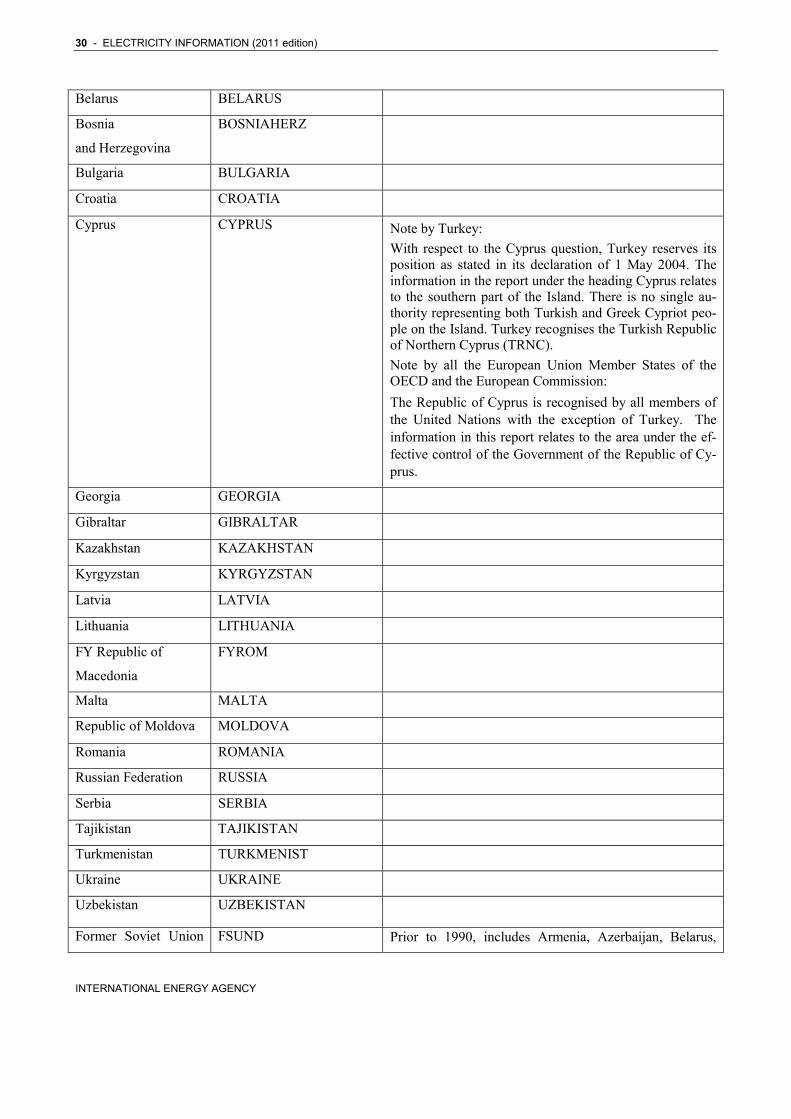
Cyprus CYPRUS Note by Turkey:
With respect to the Cyprus question, Turkey reserves its position as stated in its declaration of 1 May 2004. The information in the report under the heading Cyprus relates to the southern part of the Island. There is no single au-thority representing both Turkish and Greek Cypriot peo-ple on the Island. Turkey recognises the Turkish Republic of Northern Cyprus (TRNC).
Note by all the European Union Member States of the OECD and the European Commission:
The Republic of Cyprus is recognised by all members of the United Nations with the exception of Turkey. The information in this report relates to the area under the ef-fective control of the Government of the Republic of Cy-prus.
Georgia GEORGIA
Gibraltar GIBRALTAR
Kazakhstan KAZAKHSTAN
Kyrgyzstan KYRGYZSTAN
Latvia LATVIA
Lithuania LITHUANIA
FY Republic of
Macedonia
FYROM
Malta MALTA
Republic of Moldova MOLDOVA
Romania ROMANIA
Russian Federation RUSSIA
Serbia SERBIA
Tajikistan TAJIKISTAN
Turkmenistan TURKMENIST
Ukraine UKRAINE
Uzbekistan UZBEKISTAN
Former Soviet Union FSUND Prior to 1990, includes Armenia, Azerbaijan, Belarus,
ELECTRICITY INFORMATION (2011 edition) - 31
INTERNATIONAL ENERGY AGENCY
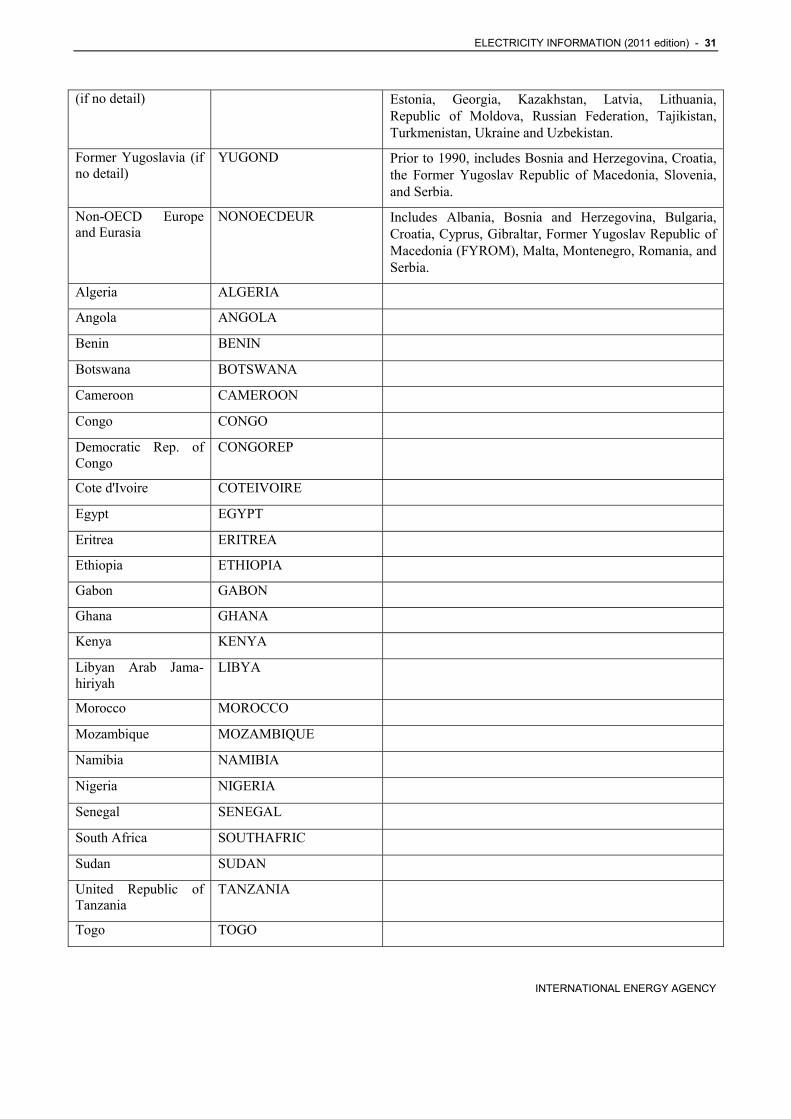
(if no detail) Estonia, Georgia, Kazakhstan, Latvia, Lithuania, Republic of Moldova, Russian Federation, Tajikistan, Turkmenistan, Ukraine and Uzbekistan.
Former Yugoslavia (if no detail)
YUGOND Prior to 1990, includes Bosnia and Herzegovina, Croatia, the Former Yugoslav Republic of Macedonia, Slovenia, and Serbia.
Non-OECD Europe and Eurasia
NONOECDEUR Includes Albania, Bosnia and Herzegovina, Bulgaria, Croatia, Cyprus, Gibraltar, Former Yugoslav Republic of Macedonia (FYROM), Malta, Montenegro, Romania, and Serbia.
Algeria ALGERIA
Angola ANGOLA
Benin BENIN
Botswana BOTSWANA
Cameroon CAMEROON
Congo CONGO
Democratic Rep. of Congo
CONGOREP
Cote d'Ivoire COTEIVOIRE
Egypt EGYPT
Eritrea ERITREA
Ethiopia ETHIOPIA
Gabon GABON
Ghana GHANA
Kenya KENYA
Libyan Arab Jama-hiriyah
LIBYA
Morocco MOROCCO
Mozambique MOZAMBIQUE
Namibia NAMIBIA
Nigeria NIGERIA
Senegal SENEGAL
South Africa SOUTHAFRIC
Sudan SUDAN
United Republic of Tanzania
TANZANIA
Togo TOGO
32 - ELECTRICITY INFORMATION (2011 edition)
INTERNATIONAL ENERGY AGENCY
Tunisia TUNISIA
Zambia ZAMBIA
Zimbabwe ZIMBABWE
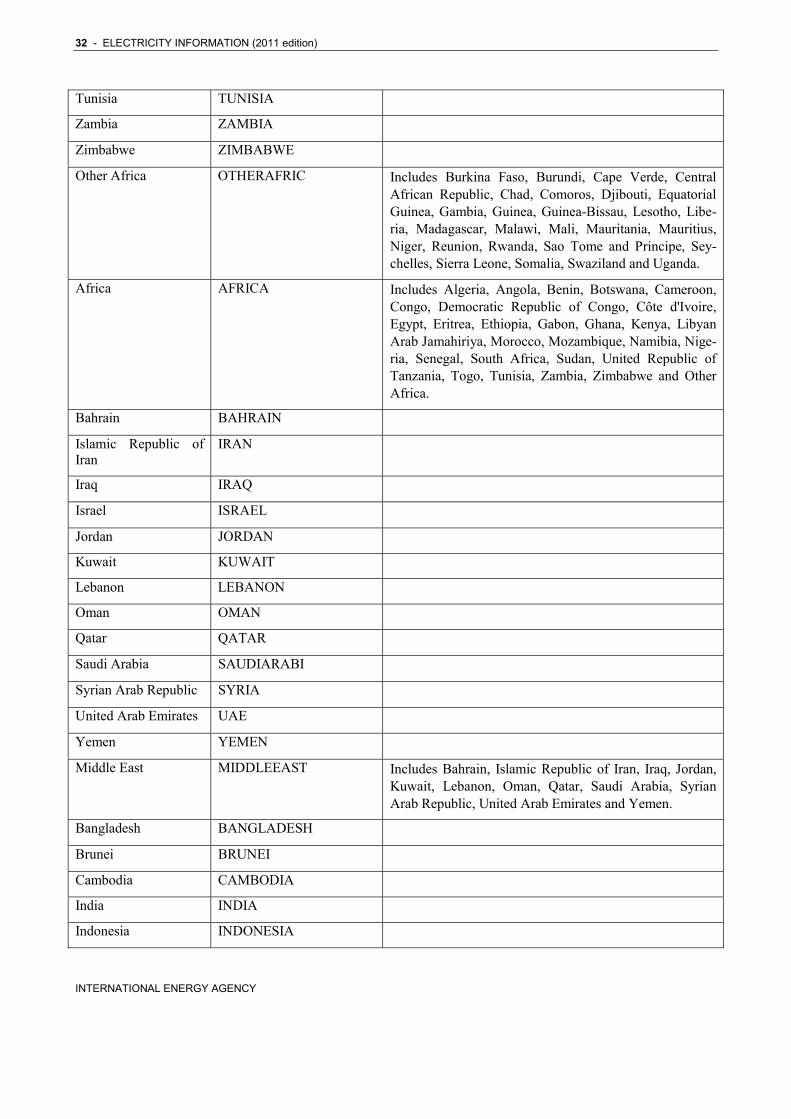
Other Africa OTHERAFRIC Includes Burkina Faso, Burundi, Cape Verde, Central African Republic, Chad, Comoros, Djibouti, Equatorial Guinea, Gambia, Guinea, Guinea-Bissau, Lesotho, Libe-ria, Madagascar, Malawi, Mali, Mauritania, Mauritius, Niger, Reunion, Rwanda, Sao Tome and Principe, Sey-chelles, Sierra Leone, Somalia, Swaziland and Uganda.
Africa AFRICA Includes Algeria, Angola, Benin, Botswana, Cameroon, Congo, Democratic Republic of Congo, Côte d'Ivoire, Egypt, Eritrea, Ethiopia, Gabon, Ghana, Kenya, Libyan Arab Jamahiriya, Morocco, Mozambique, Namibia, Nige-ria, Senegal, South Africa, Sudan, United Republic of Tanzania, Togo, Tunisia, Zambia, Zimbabwe and Other Africa.
Bahrain BAHRAIN
Islamic Republic of Iran
IRAN
Iraq IRAQ
Israel ISRAEL
Jordan JORDAN
Kuwait KUWAIT
Lebanon LEBANON
Oman OMAN
Qatar QATAR
Saudi Arabia SAUDIARABI
Syrian Arab Republic SYRIA
United Arab Emirates UAE
Yemen YEMEN
Middle East MIDDLEEAST Includes Bahrain, Islamic Republic of Iran, Iraq, Jordan, Kuwait, Lebanon, Oman, Qatar, Saudi Arabia, Syrian Arab Republic, United Arab Emirates and Yemen.
Bangladesh BANGLADESH
Brunei BRUNEI
Cambodia CAMBODIA
India INDIA
Indonesia INDONESIA
ELECTRICITY INFORMATION (2011 edition) - 33
INTERNATIONAL ENERGY AGENCY
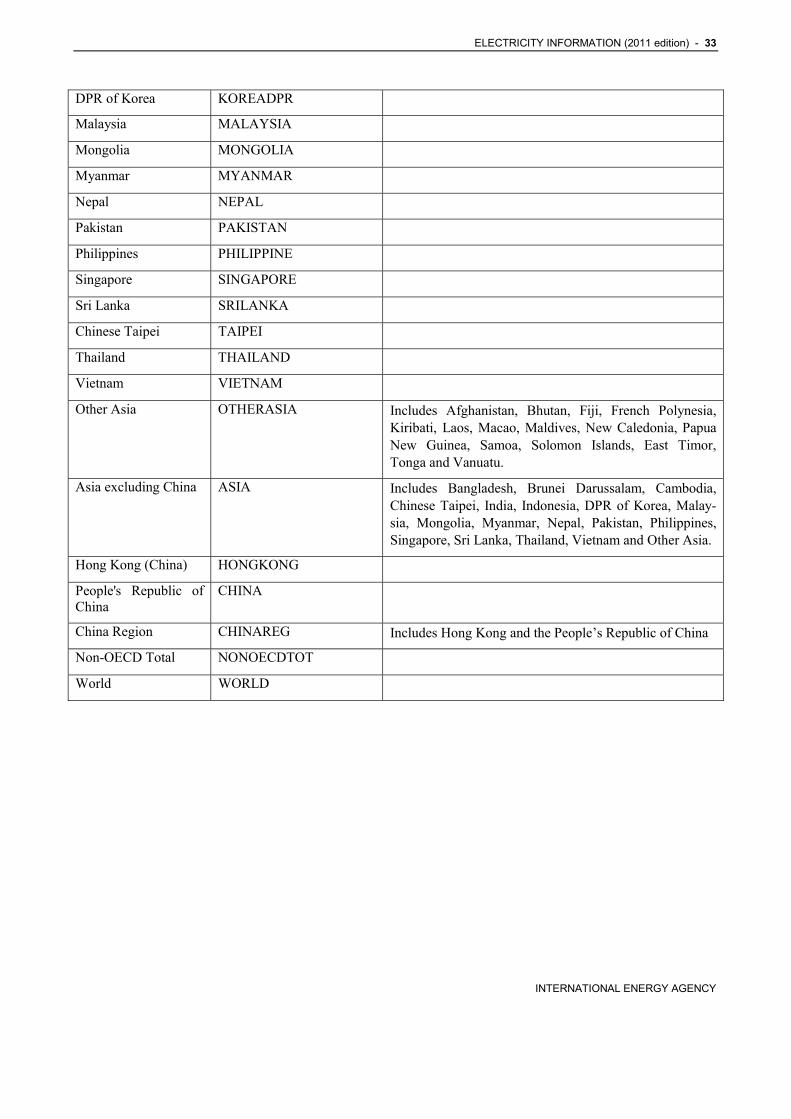
DPR of Korea KOREADPR
Malaysia MALAYSIA
Mongolia MONGOLIA
Myanmar MYANMAR
Nepal NEPAL
Pakistan PAKISTAN
Philippines PHILIPPINE
Singapore SINGAPORE
Sri Lanka SRILANKA
Chinese Taipei TAIPEI
Thailand THAILAND
Vietnam VIETNAM
Other Asia OTHERASIA Includes Afghanistan, Bhutan, Fiji, French Polynesia, Kiribati, Laos, Macao, Maldives, New Caledonia, Papua New Guinea, Samoa, Solomon Islands, East Timor, Tonga and Vanuatu.
Asia excluding China ASIA Includes Bangladesh, Brunei Darussalam, Cambodia, Chinese Taipei, India, Indonesia, DPR of Korea, Malay-sia, Mongolia, Myanmar, Nepal, Pakistan, Philippines, Singapore, Sri Lanka, Thailand, Vietnam and Other Asia.
Hong Kong (China) HONGKONG
People's Republic of China
CHINA
China Region CHINAREG Includes Hong Kong and the People’s Republic of China
Non-OECD Total NONOECDTOT
World WORLD
34 - ELECTRICITY INFORMATION (2011 edition)
INTERNATIONAL ENERGY AGENCY
DEFINITIONS
Gross and net electricity production Gross electricity production is measured at the termi-nals of all alternator sets in a station; it therefore in-cludes the energy taken by station auxiliaries and losses in transformers that are considered integral parts of the station. Net electricity production is de-fined as gross production less own use of power plants. Net electricity production is measured at the station busbars, after deduction of electricity con-sumed within the station.
The difference between gross and net production is generally observed to be about 7% for conventional thermal stations, 1% for hydro stations and 6% for nuclear.
Hydroelectric stations production (gross and net) in-cludes production from pumped storage plants.
Electricity and heat data are organised by the type of producer and the type of plant. These are defined as follows:
Types of producers Producers are classified according to the purpose of production:
Main activity producers generate electricity and/or heat for sale to third parties, as their primary activity. They may be privately or publicly owned. Note that the sale need not take place through the public grid.
Autoproducers generate electricity and/or heat, wholly or partly for their own use as an activity which
supports their primary activity. Autoproducers heat production includes only heat sold to third parties. The input fuels should correspond to the quantity of fuels used to produce the heat sold. The use of fuels for heat which is not sold is recorded in the sectors in which the fuel use occurs.
Types of plants
Electricity plants refer to plants which are designed to produce electricity only.
Combined heat and power plants (CHP) refers to plants which are designed to produce both heat and electricity (sometimes referred to as co-generation power stations). Where possible, fuel inputs and electricity/heat outputs are reported on a unit basis rather than on a plant basis.
Heat plants refers to plants designed to produce heat only. Heat delivered from CHP or heat plants may be used for process or space heating purposes in any sec-tor of economic activity including the residential sector.
It should be noted that the reporting of data on fuel use and electricity and heat production according to plant type is normally conducted at the level of the plant. It is assumed that if a plant comprises at least one CHP unit then the entire plant is considered a CHP plant.
Electricity import and export Electricity is considered to be imported or exported when it has crossed the national territorial boundaries of the country. If electricity is “wheeled” or transited through a country, the amount is shown as both an import and an export.
Electricity and heat
ELECTRICITY INFORMATION (2011 edition) - 35
INTERNATIONAL ENERGY AGENCY
Net maximum capacity
Net maximum capacity is defined as the sum of the net maximum capacities of all stations taken individu-ally at a given period of operation. It is the maximum active power that can be supplied, continuously, with all plants running, at the point of outlet to the network. It is assumed that all equipment is in full working order, that the power produced can be disposed of without any restrictions and that optimum conditions prevail as regards primary sources (i.e. flow and head in the case of hydroelectric plants; grades and quantity of fuel in hand and water supply, temperature and purity, in the case of combustible fuel-fired plants and assuming that the output and method of production in CHP plants are those which contribute to maximum electricity production). It represents the sum of all individual plants’ maximum capacities available to run continuously throughout a prolonged period of operation in a day.
The capacity is net in the sense that it is the output capacity measured at the station busbars, i.e. after de-ducting the power consumed by station auxiliaries and losses in station transformers.
Single-fired capacity refers to units equipped to burn only one fuel type on a continuous basis. The conven-tional thermal fuel types are the following:
- Coal and Coal Products: including all types of coal, blast furnace gas and coke oven gas.
- Liquids: including crude oil and oil products, refinery gas, and other fossil liquid fuels.
- Natural Gas: natural gas and gas works gas.
- Biofuels and waste: covers biomass and waste.
Multi-fired capacity refers to units that can burn more than one fuel individually and/or a combination of fuels on a continuous basis. A multi-fired unit can have either one boiler which can use more than one fuel, or two boilers each utilising a single fuel but which feed the same generator either singly or to-gether. The unit is capable of generating its net maxi-mum capacity or a large proportion of its maximum capacity using any one of the fuels.
Heat
Data collected on heat include more disaggregated data on inputs and outputs of ‘combined heat and power plants’ and on ‘heat only plants’. Data on heat became available in different years for different coun-tries and thus aggregated country data should be used with caution.
Coal is a family name for a variety of solid organic fuels and refers to a whole range of combustible sedimentary rock materials spanning a continuous quality scale. For convenience, this continuous series is often divided into two main categories, which are themselves divided into two subcategories:
Hard coal
Anthracite
Bituminous coal
- Coking coal - Other bituminous coal
Brown coal
Sub-bituminous coal
Lignite
However, coal quality can vary and it is not always possible to ensure that available descriptive and ana-lytical information is truly representative of the body of coal to which it refers.
The International Coal Classification of the Economic Commission for Europe (UN/ECE) recognises two broad categories of coal:
i) Hard coal - Coal of gross calorific value not less than 5 700 kcal/kg (23.9 GJ/t) on an ash-free but moist basis and with a mean random reflectance of vitrinite of at least 0.6.
ii) Brown coal - Non-agglomerating coal with a gross calorific value less than 5 700 kcal/kg (23.9 GJ/t) containing more than 31% volatile matter on a dry mineral matter free basis.
The IEA has adopted this definition of hard coal and brown coal in this book and in other publications.
It should be stressed that this classification system is based on the inherent qualities of the coal in question and not on the final use of the coal. In this way the classification system attempts to be objective and simple to apply.
In this context hard coal normally corresponds to an-thracite and bituminous coal. However, for the coun-tries listed below, hard coal also includes sub-bituminous coal - Australia, Belgium, Chile, Finland, France, Iceland, Japan, Korea, Mexico, New Zealand, Portugal and the United States.
Except for these 12 countries, brown coal is equiva-lent to sub-bituminous coal and lignite. In this publi-cation coke oven coke, gas coke and patent fuel used
Coal
36 - ELECTRICITY INFORMATION (2011 edition)
INTERNATIONAL ENERGY AGENCY
for electricity generation or heat production are in-cluded in hard coal, while coal tar and brown coal briquettes (BKB) are included in brown coal.
In tables where data are presented in Mtoe in this book and sourced to OECD/IEA Energy Balances, the term “Coal” includes all primary coal types (including hard coal and brown coal), peat and coal products (including patent fuel, coke oven coke, gas coke, BKB, coal tar, gas works gas, coke oven gas, blast furnace gas, and oxygen steel furnace gas). In some tables “Coal Gases” are reported separately. In such cases “Coal” does not include these gases.
Peat is defined as a combustible soft, porous or com-pressed fossil sedimentary deposit of plant origin with high water content (up to 90% in the raw state), easily cut and of light to dark brown colour.
Coal gases
Derived gaseous fuels are products resulting from the transformation or manufacturing of hard coal, brown coal or other primary solid fuels, sometimes with the addition of other materials. Included in this category are gas works gas (from 1990), coke oven gas, blast furnace gas and oxygen steel furnace gas. To calculate the net heat content of a coal gas, its gross heat content is multiplied by the following factors:
Product Gross to net ratio
Gas works gas 0.9 Coke oven gas 0.9
Blast furnace gas 1.0
Oxygen steel furnace gas 1.0
This category refers to combustible fuels other than coal, oil and natural gas that are used for electricity and/or heat generation and covers biomass and wastes. Specific products included are: solid biofuels and original products, gases/liquids from biomass, industrial waste and municipal waste.
In this publication, oil includes crude oil, refinery feedstocks, natural gas liquids, hydrocarbons not of crude oil origin and all oil products: LPG, refinery gas, aviation gasoline, motor gasoline, jet fuel, kero-sene, gas/diesel oil, residual (heavy) fuel oil, naphtha,
white spirit, lubricants, bitumen, paraffin waxes, pe-troleum coke and other oil products.
In this publication, natural gas excludes natural gas liquids.
Biofuels and waste
Oil
Natural gas
ELECTRICITY INFORMATION (2011 edition) - 37
INTERNATIONAL ENERGY AGENCY
COUNTRY NOTES
General notes applicable to all countries These notes refer to data from 1960 to 2009. As a general rule, most series show a more detailed breakdown from 1970, due to limited availability of data prior to that year. Data on inputs to and output from combined heat and power plants and from heat plants may have been estimated by the Secretariat.
Prior to 1974, there is no split available between main activity producer and autoproducer electricity plants for any country.
Data refer to fiscal year (e.g. July 2008 to June 2009 for 2009). For the 2002 data, the Australian Admini-stration started to use a new survey methodology which caused shifts in the structure of industry con-sumption. The Australian Administration is planning to revise the historical series. Fuels used for genera-tion by autoproducers are for single-fuel-fired units only. The use of fuel in multi-fired units operated by autoproducers is included in industry consumption. Inputs to and outputs from autoproducer CHP plants are not available prior to 1986. In 2002, the Austra-lian Administration reclassified the types of plants between main activity producers and autoproducers.
The production of electricity from wind is available from 1994. Electricity production from solar PV starts in 1992 and from solar thermal in 2003. Prior to 1995, electricity production from biogases is in-cluded with natural gas.
Heat data are not available from 1992 onwards. Heat from chemical processes used for electricity produc-tion is available from 2004.
Prior to 1971 electricity consumption in the com-mercial and public services sector is included in in-dustry. Prior to 1974, the breakdown of electricity consumption in industry and energy sub-sectors is not available and energy industry consumption is included in industry. Electricity consumption in coke ovens has been estimated by the Australian Administration from 1974 to 1999. Prior to 2007, electricity consumption in the mining and quarrying sector includes consumption in liquefac-tion/regasification plants. From 1990 to 2007, elec-tricity consumption in the wood and wood products sector is included together with paper, pulp and printing.
The direct use of solar energy (mostly domestic so-lar panels) is available from 1974.
Capacity refers to net maximum capacity on 30 June.
Breaks in the series from 1995 to 1996 and from 1998 to 1999 are due to different methods of survey.
Electricity plants data may include some CHP plants operating in electricity only mode. Prior to 1981, all electricity production by CHP plants is included in electricity plants, and only production from combus-tible fuel sources is taken into account.
Prior to 1981, autoproducer CHP heat production is included in main activity producer CHP plants. For heat, own use is included in distribution losses.
Inputs to main activity producer electricity plants include inputs to CHP plants prior to 1981. Inputs of other oil products to autoproducer CHP plants were reclassified as refinery gas and natural gas in 2009. Revisions to the historical time series are planned by the Austrian administration.
Australia
Austria
38 - ELECTRICITY INFORMATION (2011 edition)
INTERNATIONAL ENERGY AGENCY
Electricity consumption in non-specified transport represents tramways, electric busses, ski-lifts and ca-ble cars. Electricity consumption in oil refineries includes consumption in gas works prior to 1991. Also prior to 1991, electricity consumption in the iron and steel industry includes consumption in coke ovens and blast furnaces.
Prior to 1991, consumption in commercial and pub-lic services includes small industries, offices in the tertiary sector and electricity use in electricity sup-ply, district heating and water supply companies. From 1991, consumption in electricity supply, dis-trict heating and water supply companies is included in other energy sector. Starting in 1990, small amounts of electricity used in heat pumps have been included in the residential sector.
Only gross maximum electrical capacity is available. The breakdown of capacity by type of generation and fuel for autoproducer plants is not available from 1988 to 1992.
Exports of electricity to non-specified/others are to Liechtenstein.
The federal authorities changed their method of col-lecting data: instead of receiving data from the “Fédération des Producteurs d’Électricité” (FEP), the operators in the relevant sectors are surveyed by the Ministry of Economic Affairs using a survey based on that of the IEA. Moreover, the “Institut de Conseil et d’Études en Développement Durable” (ICEDD), through its co-ordinating role with respect to the regional authorities, provides complementary information (such as small off-grid power stations, and data on heat from renewable sources) which may not be collected by the FEP.
Breaks in the series may exist between 2007 and 2008 due to revisions of the NACE classifications.
There is no heat consumption from 2007 in the iron and steel industry because the installation concerned became an autoproducer in July 2006 and the heat is no longer sold.
Prior to 1982, electricity production in main activity producer CHP plants is included in production from electricity plants. Also, inputs of fuels for electricity generation in main activity producer electricity plants include inputs for heat production in CHP plants.
For 1998 and 1999, electricity production at main activity producer CHP plants with annual heat out-put below 0.5 TJ is reported with main activity pro-ducer electricity only plants.
In 2000, most autoproducer electricity plants were reclassified as autoproducer CHP plants; the heat production from these plants was used for internal industrial processes and not sold to third parties until 2005. Heat from chemical processes used for elec-tricity production is available from 2005.
Heat output from CHP plants is not available prior to 1973.
The production of electricity from wind is available from 1987. Prior to 1982, data on electrical capacity by type of generation are not available.
The breakdown of electricity and heat generation between natural gas and oil products in main activity producer CHP plants has been estimated by the Ca-nadian Administration starting in 1990. This may cause breaks in the time series between 1989 and 1990. For autoproducers generating electricity with process steam produced from biofuels and waste, the energy required to produce the initial steam is not taken into account by the Canadian Administration and as a result the efficiencies are overstated. Net electricity production by autoproducers prior to 1990 includes production from combustible fuel sources only.
Heat production includes heat produced by nuclear power stations for distribution to other consumers.
Secretariat estimates have been made for certain inputs to CHP production based on output. How-ever, incompatibility of data for inputs to and output from thermal production of autoproducers may re-sult in variable efficiency rates. Inputs of fuels to heat plants are not available for 1979 to 1987.
Breaks in the series occur between 1973 and 1974 in agriculture, and between 1987 and 1988 in the in-dustry sector. Consumption of electricity in coal mines is not available between 1982 and 1986. Con-sumption of electricity in oil and gas extraction is not available prior to 1987. In the 2010 edition, the Canadian Administration revised heat consumption data, causing statistical differences; revisions to pro-duction are pending.
Belgium
Canada
ELECTRICITY INFORMATION (2011 edition) - 39
INTERNATIONAL ENERGY AGENCY
Only gross maximum electrical capacity is available. From 2000 to 2002, data on capacity were estimated by the Secretariat based on Statistics Canada’s “Electric Power Generating Stations” publication. Prior to 1981, data on electrical capacity by type of generation are not available.
Electricity production from other bituminous coal includes sub-bituminous coal.
The split of electricity generation by main activity and autoproducer and by fuel was estimated by the Chilean Administration for 1990 to 2003. From 2004-2007, the split includes estimations by the se-cretariat.
The majority of electricity generation from other sources is from a conveyor belt transporting crushed rock from high altitude to lower altitude in a mine. A small amount from waste heat is also included.
Detailed data on autoproducer electricity production by sector is available from 2009.
From 1990, consumption in paper and pulp includes forestry and consumption in agriculture is included in non-specified industry. In general, a new method-ology has been applied for data since 1990, leading to other breaks in the time series between 1989 and 1990.
Data for peak load is available from 1999. Installed capacity by type of technology is not available.
Imports of electricity to non-specified/others are from Argentina.
Data are available from 1971.
Electricity statistics from 1971 to 1989 have been estimated by the Secretariat, except for final con-sumption and trade which were submitted by the Czech Administration. Data from 1990 onwards have been officially submitted by the Czech Ad-ministration. This may lead to breaks in the series between 1989 and 1990. Prior to 1990, electricity production in main activity producer and autopro-ducer CHP plants is included in main activity pro-ducer electricity plants. The breakdown of net elec-tricity production by source is not available prior to 1990. In 1999 and 2000 various big enterprises were divided, sold and merged. This causes breaks in the time series of all types of plants. The new reporting
methodology used by the Czech Administration for biofuels and wastes causes some breaks in the time series between 2002 and 2003.
Other sources for heat production refer to recovered waste heat from the glass industry. Electricity gener-ated from waste heat in CHP plants is included with the total production from combustible fuels.
Heat produced from heat pumps is reported from 2007, but the electricity inputs are not available.
Data on heat production, and the corresponding fuel inputs, have been estimated from 1980 to 1989 based on consumption in the residential and com-mercial/public services sectors. Prior to that, inputs are included in industry. Heat production prior to 1990 excludes heat sold by industry. In addition, heat production prior to 1990 is reported under main activity heat plants because the breakdown by pro-ducer and plant type is not available before then.
Industrial waste use in main activity producer elec-tricity plants is included with solid biofuels from 1996. Data on biogases and waste used in main ac-tivity producer CHP and autoproducer heat plants start in 1993.
From 1999 onwards, small amounts of heat have been exported to Slovak Republic.
The direct use of solar energy is available from 2004.
The breakdown of generating capacity is not avail-able prior to 1990. Starting in 2000, the peak load data reported in main activity producers include the autoproducers value.
The production of electricity from wind is available from 1978.
Heat data are not available prior to 1976. Geother-mal and solar heat production for sale is available from 1989. Heat produced for sale in heat pumps starts in 1994.
From 1984 onwards, small amounts of heat have been imported from Germany.
The amount of heat reported under other sources is heat recovered from industrial processes and sold for district heating.
Chile
Czech Republic Denmark
40 - ELECTRICITY INFORMATION (2011 edition)
INTERNATIONAL ENERGY AGENCY
Electricity consumption in non-specified energy industry includes consumption in district heating plants and use for the distribution of electricity.
In the 2011 edition, the Danish Administration revised heat production data, resulting in statistical differences; revisions to consumption are pending. The direct use of solar thermal energy is available from 1978.
Prior to 1981 for main activity producers, to 1994 for autoproducers, data on electrical capacity by type of generation are not available.
Data for Estonia are available starting in 1990. Prior to that, they are included in Former Soviet Union in Energy Statistics of Non-OECD Countries.
Data reported under lignite are for oil shale. From 1990 – 1999 some electricity and heat production are reported under other oil products while the in-puts are reported under the individual fuels. Revi-sions to classify the electricity and heat production by oil product are pending. Inputs of residual fuel oil and gas works gas to the transformation sector in-clude shale oil.
A new survey system and a reclassification of the data led to breaks in the time series between 1999 and 2000.
Electricity production from biofuels and waste is not available between 1974 and 1976. Inputs of liquid fuels and natural gas to CHP plants are included with the inputs of these fuels to main activity pro-ducer electricity only and heat only plants prior to 1978. Electricity and heat production from biogases are available from 1996. Breakdown of net electric-ity production by autoproducers is not available be-fore 1999. The decrease in electricity production in 2005 is mainly due to lower generation from coal and peat which was offset by increased electricity imports from Sweden.
Heat production from autoproducer CHP plants is available starting in 1996 and from autoproducer heat plants starting in 2000; corresponding inputs may be under-reported. Heat from chemical proc-esses and associated electricity generation are avail-able from 2004. The increasing heat production from heat pumps in 2007 and 2008 is from the new Katri
Vala district heating and cooling plant. Prior to 2009, electricity and heat production from other sources includes production from hydrogen, pur-chased steam from the industry, and waste heat. From 2009 onwards, other sources includes only hydrogen and purchased steam.
Consumption of electricity in the industry sub-sector machinery includes consumption in transport equipment prior to 1995. Consumption of electricity in non-specified transport corresponds to use for urban transport systems.
Consumption of heat in residential includes consump-tion in commercial and public services and agricul-ture.
Net maximum electrical capacity data are not avail-able prior to 1974. Prior to 2000, capacity reported in autoproducers steam generation includes all types of generation.
A new survey and a reclassification between main activity producer electricity plants and autoproducer electricity plants may cause breaks in the series for other bituminous coal between 1998 and 1999. The French Administration is working to reconcile their data collection methods for the inputs and the out-puts for electricity generation. Plants using munici-pal waste were reclassified as autoproducer CHP plants from 1995, which leads to a break in the time series. From 2000 - 2008, there are further classifi-cation issues for inputs of and outputs of electricity from oil.
Net electricity production by autoproducers prior to 1983 includes production from combustible fuel sources only. Net electricity production by autopro-ducer CHP plants is available from 1989. Electricity production from wind is available from 1993.
Due to a new survey, for the 2007 edition the French Administration revised the heat data back to 2000 and included heat produced from fossil fuels in CHP plants. Data for heat produced from fossil fuels in heat only plants is not available. However, it is not possible to separate out the amount of heat not sold in autoproducer plants, so these amounts are in-cluded. But, no double counting occurs since the corresponding inputs have not been included in final consumption. In 2005, autoproducer CHP efficien-cies for other biogases drop due to the opening of a larger, less efficient plant.
Estonia
Finland
France
ELECTRICITY INFORMATION (2011 edition) - 41
INTERNATIONAL ENERGY AGENCY
There are major breaks in the time series in 1965 when more detailed breakdown of data on electricity consumption became available. The industry classi-fications used by the French Administration were changed in 1986.
A large part of energy industry electricity consump-tion in non-specified is consumption in uranium treatment plants; this electricity consumption is not available prior to 1980. Consumption of electricity in the nuclear industry is not available prior to 1980. Consumption of electricity in oil refineries is in-cluded in oil and gas extraction from 1988 to 2000. Total energy industry includes the statistical differ-ences from 1992. Consumption of electricity in non-specified includes exports to Monaco prior to 1992.
From 1995, due to a change in the economic activity classification, data have been reported in non-specified other sectors.
Prior to 1981 and after 1998, data on electrical ca-pacity by type of generation and fuel are not avail-able.
Data for Germany include the new federal German states from 1970, but only the former Federal Re-public of Germany from 1960 to 1969. A new sur-vey for the renewable products can cause breaks in the time series between 1998 and 1999.
GDP figures prior to 1991 are based on conversions made by the German Institute for Economic Re-search (Deutsches Institut für Wirtschaftsforschung) and the former Statistical Office of the GDR (Sta-tistisches Amt der DDR). These conversions are cal-culations which are highly dependent on specific hypotheses and do not necessarily reflect economic realities.
Electricity production in electricity plants includes production from CHP plants prior to 2003. In 2007, many main activity CHP plants that burn biofuels and waste were reclassified as electricity only which results in breaks in the time series between 2006 and 2007. Data on electricity production from wind and solar are available from 1986 and 1990, respec-tively. In some instances, electricity generation from nuclear, hydroelectric, solar and wind in autopro-ducer electricity plants are confidential or non-available and, therefore, included in main activity producer electricity plants. The same applies to bio-gases from 1999. For 2002 and 2003, the German
Administration did not submit the breakdown of electricity and heat production from combustible fuels. The data were estimated by the Secretariat as follows: renewables and waste were taken from the Renewables and Waste questionnaire and the other combustible fuels were estimated pro rata based on 2001 estimates. The German Administration started reporting near the surface geothermal energy in 1995, which leads to a break in the time series with 1994, where only deep geothermal energy is re-ported. From 1999 -2008 onwards, small amounts of electricity generation that are not accounted for in the data submission have been attributed to various combustible fuels. Electricity production from other sources is available starting in 2009. This refers to the production of electricity from turbines which are located at pressure drops in fluid transport and from purchased waste heat.
Due to the implementation of the Energy Statistics Act, data collection concerning heat produced in heat plants and district heating plants became more efficient and more complete. This leads to breaks in the time series between 2002 and 2003 and between 2003 and 2004. Detailed data by fuel are not avail-able for total heat production. The non-allocated part is reported as “heat production from non-specified combustible fuels”. Starting in the 2010 edition, the German Administration changed their methodology for reporting heat. From 2007 onwards all heat pro-duction in autoproducers is considered as non-sold (i.e. for self-use) and, therefore, not reported. Inputs for this heat production are no longer reported in the transformation sector. Also, more information on district heat has become available. This causes breaks in the time series between 2006 and 2007. Prior to 1993, all heat production from BKB/peat briquettes is included in main activity CHP plants.
Heat production and consumption prior to 1970, have been estimated by the Secretariat based on En-ergiebilanz der Bundesrepublic für das Jahr 1990 provided by the German Institute for Economic Re-search.
Prior to 1991, electricity trade data includes only trade of the Former Federal Republic of Germany.
Starting in 1984, small amounts of heat have been exported to Denmark.
Between 1971 and 1980 electricity consumption in coal mines includes consumption in coke ovens and BKB plants. The German Federal Statistics Office reclassified some industrial branches which may
Germany
42 - ELECTRICITY INFORMATION (2011 edition)
INTERNATIONAL ENERGY AGENCY
cause a break in the time series in the industry sub-sectors of industry between 1994 and 1995.
The breakdown of heat consumption is not available for 2003 to 2006. The data for that period were es-timated as follows: the transformation and distribu-tion losses were estimated based on previous years, the heat produced by autoproducers was included in non-specified industry, and the remaining consump-tion included in non-specified other.
Prior to 1974, data on electrical capacity by type of generation are not available. Electricity generating capacity before 1991 is for the Former Federal Re-public.
No production of solar heat is reported. Production or consumption of distributed heat (heat sold) that is produced from lignite is available from 1997.
In 2008 a new plant using refinery gas started oper-ating in an experimental phase. For this reason the efficiency is low.
Electricity consumption in iron and steel and in the non-ferrous metals industry prior to 1971 has been estimated by the Secretariat. There is a break in the series between 1991 and 1992 for electricity con-sumption in transport. Prior to 1981, data on electri-cal capacity by type of generation are not available.
Data are available from 1965.
The Hungarian Administration reclassified some of their plants in 1996 and 2000 which may lead to breaks in the time series.
The electricity and heat statistics were revised by the Hungarian Administration in early 2000. The revi-sion of heat production data to conform to IEA re-porting methodologies may result in a mismatch of fuel inputs with electricity and heat outputs by plant type, causing high efficiencies.
Prior to 2000, electricity output from sub-bituminous coal is included with lignite. Nuclear electricity production in main activity producer elec-tricity plants is available from 1983. Electricity and heat production from solid biofuels in autoproducer CHP plants is available from 1995. Geothermal heat production in main activity producer heat plants is also available from 1995.
Direct use of geothermal heat is available from 1990. Direct use of solar thermal heat is available from 2001.
Electricity production from geothermal sources in main activity producer CHP plants is available from 1992. In 1998, 60 MW of generating capacity was installed in the geothermal CHP plant at Nesjavellir. Since the plant was inoperable for four months, production of geothermal heat decreased compared to 1997. However, the extra electricity capacity caused electricity production from geothermal to almost double over the same period.
Heat production from municipal waste is available from 1993. In 2002, the increase of heat produced by geothermal was due to the installation of a third unit at the Nesjavellir CHP power plant. The in-crease in hydro and geothermal electricity produc-tion from 2007 is due to expansion of the aluminium industry.
Energy industry consumption of electricity refers mainly to the use of electricity by the geothermal industry to pump hot water from underground sources. From 1991, it includes electricity used for the transport by pipeline of hot water from Nesjav-ellir to Reykjavik. Prior to 1970, total final con-sumption includes inputs to and outputs from heat production and non-energy use. After 1970, data on inputs and outputs in CHP plants and in main activ-ity producer heat plants (district heat plants) and for non-energy use are separately specified. The con-sumption of electricity reported in non-specified other sectors corresponds to a NATO base at Ke-flavik airport which closed in 2005. Residential sec-tor includes agriculture prior to 1983. The industrial classifications used by the Icelandic Administration changed in 1987. The increase of electricity con-sumption in the construction sector from 2003 to 2007 is due to the drilling of tunnels for the Kárahnjúkar power plant. Prior to 2008, all heat for space heating was reported in residential. From 2008 a portion is estimated by the Iceland Administration to be consumed in commercial and public services.
Greece
Hungary
Iceland
Ireland
ELECTRICITY INFORMATION (2011 edition) - 43
INTERNATIONAL ENERGY AGENCY
Electricity production from wind begins in 1992 and from landfill gas in 1996.
Fuels used by autoproducers have been estimated by the Irish Administration for 1991 and 1992. Inputs of peat in kilo tonnes (kt) for electricity production have been estimated by the Secretariat prior to 1992 based on data submitted in terajoules (TJ) by the Irish Administration. Inputs of hard coal in autopro-ducer CHP plants have been estimated by the Secre-tariat from 1984 to 1989.
Prior to 1990, electricity consumption in agriculture is included with residential. Electricity consumption in the iron and steel industry includes consumption in the non-ferrous metals industry prior to 1990. The decrease of electricity consumption in the iron and steel industry from 2001 onwards is due to the fact that the main steel plant in Ireland ceased produc-tion. Electricity used for urban transport is included in non-specified transport. The increase in 2004 is due to the new light rail transit system in Dublin.
Direct use of geothermal heat and solar thermal heat is available from 1989 and 1990, respectively.
Prior to 1981, data on electrical capacity by type of generation are not available for main activity produc-ers.
Capacity reported under other sources corresponds to cross-border transmission capacity with Northern Ireland.
Electricity production from wind begins in 2001. Data on the breakdown of hydroelectric plants are available from 2008. For 2009, solar photovoltaic electricity generation is estimated.
From 2000 onwards, the Italian Administration de-fines electricity and heat production from autopro-ducers as including generation from producers that consume more than 70% of their own electricity production. However, for the 2000 to 2002 period, all electricity production from autoproducers is re-ported with main activity producers.
Prior to 2004, electricity production from orimulsion is confidential and is included with residual fuel oil.
The production of electricity reported in the cate-gory other fuel sources refers to produced from tur-bines which are located at pressure drops in fluid transport. Prior to 1984, net electricity production by autoproducers includes production from combustible fuel sources only. From 1989, not all outputs are reported for industrial waste used in autoproducer CHP plants.
Heat production is reported starting in 2004 and in-cludes self-generation in industry. With the intro-duction of a new survey in 2008, amounts of naph-tha and other kerosene that were previously included in other oil products have been reported separately in autoproducer CHP plants.
The breakdown of renewables and waste inputs into electricity, heat and CHP plants is available from 1989 only. Prior to that year, the total of the differ-ent fuels involved is reported as non-specified re-newables. Prior to 2009, sub-bituminous coal used in main activity electricity plants was included under other bituminous coal.
Consumption of electricity in transport includes electricity used for pumping in oil pipelines from 1981. Other energy industry includes electricity con-sumption for blast furnaces. From 2000 it also in-cludes consumption for the distribution of gas, and prior to 1989 consumption of electricity used for uranium extraction. The breakdown of heat con-sumption by sector has been estimated by the Italian Administration.
Prior to 1981, data on electrical capacity by type of generation are not available.
Data for the entire time series refer to fiscal year.
Fuels used and corresponding electricity and heat produced in CHP plants are not included in the data series. Inputs of biofuels and waste for electricity production and related outputs are available from 1982. Net electricity production by autoproducers prior to 1982 includes production from combustible fuel sources only. Net electricity production by autoproducers in the transport sector is included in non-specified prior to 1982. Net electricity produc-tion by autoproducers in the energy industry is not available prior to 1982. The production of electricity from wind began in 1993.
Israel
Italy
Japan
44 - ELECTRICITY INFORMATION (2011 edition)
INTERNATIONAL ENERGY AGENCY
The IEA Secretariat estimated the photovoltaic (PV) electricity generation from autoproducers starting in 1992 based on an average capacity factor of 12% and capacity data for autoproducers. Autoproducer PV capacity is derived from data from the Japanese Administration as well as the IEA Photovoltaic Power Systems Programme (IEA-PVPS) report, “Trends in Photovoltaic Applications” published in 2010. The capacity factor was based on the report “National survey report of PV Power Applications in Japan 2009”, published in 2010 by IEA-PVPS. The corresponding electricity consumption has been included with non-specified other consumption.
Prior to 1998, the electricity produced using TRT technology (Top pressure Recovery Turbines) was included with electricity generated from solid biofu-els. Starting in 1998, it is included with electricity generated from coal gases.
Fuels used and heat produced for sale by autopro-ducers from heat plants are not available. Heat pro-duction from geothermal and solar thermal sources in Japan is not reported by the Japanese Administra-tion. Heat produced for sale in main activity heat plants is not available prior to 1972. Heat produced for sale in main activity producer heat plants from waste heat and from electric boilers is available from 1977 and 1983, respectively.
Between 1972 and 1976, the use of combustible fu-els in main activity producer heat plants is included in non-specified. Fuels used to produce heat for sale in heat plants are not available prior to 1977.
Consumption of electricity in non-specified industry includes wood and wood products and construction prior to 1982. Electricity consumption in urban transport systems is included with rail.
Prior to 1981, data on electrical capacity by type of generation are not available for main activity pro-ducer plants. Prior to 1974, data on electrical capac-ity by type of fuel are not available for autoproducer plants. Electricity generation capacity for nuclear power increased in 1997 due to the commissioning of two nuclear plants.
Data are available from 1971.
Electricity statistics from 1971 to 1993 are estimated by the Secretariat based on the Korean National Sta-tistics. Data from 1994 onwards have been submit-ted by the Korean Administration. This leads to breaks in the series between 1993 and 1994.
Before 1994, electricity production from main activ-ity producer CHP plants is included with main activ-ity producer electricity only plants. In 2002, the Ko-rean Administration started to report electricity and heat production by autoproducers using natural gas and petroleum products which were not reported before. Electricity generation reported under other sources is from fuel cells. Electricity production us-ing heat from chemical processes in copper and zinc plants is available from 2005; the corresponding heat inputs are estimated. Heat from chemical proc-esses that is sold is available from 2008. Prior to 2009, autoproducer heat production includes amounts of unsold heat.
Heat data are available from 1993. For 1993 to 1999, the breakdown of heat output by type of fuel has been estimated by the Secretariat. The break-down by sector of heat production in autoproducers is estimated by the Korean Administration based on consumption data of purchasing companies. Heat consumption by sector is available from 2000.
Prior to 2007, production and consumption of elec-tricity and heat in oil refineries and LNG liquefaction/regasification plants are included in the industry sector. Prior to 2008, sales of electricity by Korea’s main electricity distributor, KEPCO, to the non-ferrous metals sector are included in iron and steel consumption. Data for electricity consumption in the transport equipment sector are available from 1994 and are included in the machinery sector until 2001.
The breakdown of generating capacity by fuel is not available prior to 1994.
Most of the hydro production shown for Luxem-bourg is from the Vianden pumped storage plant and is exported directly to Germany. For 1989, the elec-tricity production by autoproducers by fuel was es-timated by the Secretariat based on fuel inputs sub-mitted by the Luxembourg Administration. Net elec-tricity production by autoproducers prior to 1990 includes production from combustible fuel sources only. Electricity from natural gas for autoproducer
Korea
Luxembourg
ELECTRICITY INFORMATION (2011 edition) - 45
INTERNATIONAL ENERGY AGENCY
CHP plants are available starting in 1995 and for main activity CHP plants starting in 1996. Electric-ity and heat production from biogases are available from 1999. The increase in electricity production in 2002 was due to a new natural gas combined cycle power plant. In the 2011 edition, heat production from natural gas in autoproducer CHP plants was removed because it was discovered the heat was not sold.
The iron and steel industry stopped production of electricity at the end of 1997.
The breakdown of electricity consumption in indus-try is not available from 1990 – 1999.
Heat consumption from 2000 to 2009 was estimated by the Secretariat.
Prior to 1995, data on electrical capacity by type of generation are not available for autoproducers. Due to the lack of blast furnace gas, the iron and steel industry stopped generating electricity at the end of 1997. Therefore, electrical capacity by combustible fuels declined.
Electricity statistics are available from 1971. In the 2011 edition, autoproducer data was revised to be consistent with the data presented by the national Energy Regulatory Commission (Comisión Regu-ladora de Energía).
The breakdown of net electricity production by autoproducers is available from 1993. Electricity production from wind and solar photovoltaic is available from 1990. Electricity output from biofuels and waste is available from 1998. New autoproducer electricity plants fuelled with coal gases were put on line in 1999. Prior to 1996, gas/diesel oil inputs to autoproducer electricity plants were only of diesel.
Some electricity consumption in the energy industry is included in the industry sub-sector where it was generated (e.g. the chemical industry, as well as in non-specified industry).
Net maximum electrical capacity for autoproducers is not available prior to 1974. The breakdown of generating capacity for main activity producer elec-tricity plants by combustible fuels is not available prior to 1982. Production and generating capacity of main activity producer electricity plants from wind is available from 1994.
Electricity from other sources includes generation from chemical waste gases and heat bought from other industries. For 1970 to 1973, electricity output from autoproducer CHP plants has been included with main activity producer CHP plants. Electricity production from and inputs to main activity pro-ducer CHP plants are included with main activity producer electricity plants prior to 1982. Net elec-tricity production by autoproducers prior to 1988 includes production from combustible fuel sources only. Electricity production from solar photovoltaic is available from 1992. Net electricity production by autoproducers in the energy industry is not available prior to 1993. The decrease in electricity produced from nuclear in 1997 is due to the closure for five months of one nuclear power plant. For the 2007 edition, the Dutch Administration implemented a reporting methodology which causes some breaks in the time series between 2004 and 2005.
Heat production from main activity producer CHP plants and heat plants is available from 1982. Heat production by fuel in heat plants prior to 1987 are estimated by the Secretariat based on fuel inputs submitted by the Dutch Administration. Heat pro-duced from combustible renewables is available from 1990.
Heat production in commercial and public services includes production in agriculture.
Inputs of hard coal for electricity production from 1981 to 1989 in terajoules (TJ) are estimated by the Secretariat based on data submitted in kilotonnes (kt) by the Dutch Administration. Prior to 2008, a few small autoproducer electricity plants using solid biofuels were included with main activity plants for reasons of confidentiality.
The strong increase in electricity trade in 1999 is caused by the liberalization of the Dutch electricity market. Until 2003, trade data are based on con-tracted quantities instead of physical flows,
Electricity consumption in commercial and public services includes small users in other sectors. Elec-tricity consumption in non-specified transport corre-sponds to consumption for road traffic. Increasing electricity consumption in agriculture is due to the expansion of the greenhouse farming sector. Prior to 1979, electricity consumption in agriculture is included in commercial and public services.
Mexico
Netherlands
46 - ELECTRICITY INFORMATION (2011 edition)
INTERNATIONAL ENERGY AGENCY
Data on direct use of solar thermal are available from 1988.
Prior to 1981 for main activity producer plants and 1982 for autoproducers, data on electrical capacity by type of generation are not available.
There are several breaks in the series between 1987 and 1988 due to a reorganisation of government de-partments during 1987. The industry classifications used by the Administration of New Zealand were changed in 1991. In the 2011 edition, electricity and heat data were revised back to 1990.
Prior to 1990, data refer to fiscal year (April 1989 to March 1990 for 1989). From 1990 data refer to cal-endar year. As a result, there are breaks in the series between 1989 and 1990.
Electricity production by autoproducers from natural gas and from oil has been estimated by the Secre-tariat from 1970 to 1973. Electricity production by autoproducers from geothermal is available from 1990. In 1999, a reclassification of autoproducer plants causes some breaks in the time series. For 2002 and 2003, natural gas autoproducer electricity includes generation of electricity from on-site heat/steam recovery during the combustion of car-bon monoxide (CO) gas from the iron making reduc-tion and melting process.
Heat from chemical processes used for electricity production is available from 2004 and corresponds to acid plants in the fertiliser industry where sulphur is the main input.
From 1974 to 1993 distribution losses include the statistical differences. Electricity consumption in pulp, paper and printing is included in wood and wood products prior to 1991. There are breaks in the time series between 1996 and 1997 for electricity consumption due to a new NZ Standard Industrial Classification (NZSIC).
Prior to 1981, data on electrical capacity by type of generation are not available. Generating capacity for autoproducers is available from 1994.
No data on electricity production from solar energy are submitted to the IEA by the Norwegian Admini-stration. Prior to 1991, net electricity production by autoproducers by industry sub-sector was estimated by the Secretariat based on data submitted by the Norwegian Administration. Electricity production from wind is available from 1992. Breaks in the time series between 1996 and 1997 and between 2001 and 2002 are due to a reclassification of main activ-ity producers and autoproducers. The electricity generated from other sources represents electricity from waste heat.
Own use of electricity in 2008 is based on prelimi-nary monthly statistics as opposed to final annual data for previous years.
The increase in gas-fired generating capacity and the associated production of electricity in 2007 is due to the opening of a new plant at Kårstø in late 2007.
Heat production is not available prior to 1983. Heat production from heat pumps and electric boilers (and the electricity used for this production) are available from 1989. Heat production from biogases is available from 1995. Heat produced in autopro-ducer heat plants from chemical processes and from other sources and used for electricity production was estimated by the Secretariat for the period 1990 to 2006.
Data on inputs and outputs in heat plants are not available prior to 1983 for main activity heat plants and prior to 1988 for autoproducer heat plants.
Distribution losses may include statistical differ-ences. The breakdown of heat consumption by in-dustry sub-sector was expanded in 1992, reclassified in 1994 and collected by a new reporting system in 1997.
Consumption of electricity for pipeline transport is included in oil and gas extraction.
Electricity trade with the Netherlands begins in 2008 with the operation of a cross-sea cable interconnec-tion between the two countries.
Net maximum electrical capacity of pumped storage plants is not available from 1970 to 1972.
New Zealand
Norway Poland
ELECTRICITY INFORMATION (2011 edition) - 47
INTERNATIONAL ENERGY AGENCY
Electricity production in autoproducer electricity plants is available from 1986.
Gross heat production from autoproducer CHP plants includes the unsold heat for own use between 1988 – 1995. In order to alleviate this, the Polish Administration adopted new methods to estimate the production of heat sold in autoproducer heat plants (1993) and in autoproducer CHP plants (1995). This causes breaks in the time series between 1992 and 1993, and between 1994 and 1995 for heat produc-tion and fuel inputs in these plants and for heat con-sumption in industry sub-sectors. Data for direct use of geothermal heat become available in 2000 and direct use of solar thermal heat in 2002. In 2008, a number of CHP plants were reclassified from auto-producer to main activity producer due to an indus-try re-organisation.
Prior to 1995, heat consumption in the energy indus-try includes process heat not sold.
Production of electricity in main activity producer CHP plants and the associated fuel inputs are not available prior to 1980. Production of electricity from solar photovoltaic and wind are available from 1989. Net electricity production by autoproducers prior to 1992 includes production from combustible fuel sources only. New plants fuelled by municipal waste started in 1999.
To conform to the IEA methodology, heat produced from biofuels and waste (mainly black liquor) in autoproducer CHP plants is not accounted for since it is not sold, while the electricity produced in these plants is included. In 2007, some power plants that were previously reported as main activity CHP were reclassified as autoproducer CHP. The power station that burns industrial waste started to work as a CHP plant in 2007, whereas previously it was only pro-ducing electricity.
Data on direct use of solar thermal heat and geother-mal heat are available from 1989 and 1994, respec-tively.
Peak load for main activity producer plants includes the autoproducers data and is not available prior to 1986.
Data are available from 1971.
Electricity and heat production from combustible fuels from 1990 to 2000 have been estimated by the Secretariat based on the data on fuel used for elec-tricity and heat plants reported in the annual fuel questionnaires. Prior to 2001, electricity generation from primary solid biofuels, municipal waste and biogases are included with industrial waste.
The breakdown of net electricity and heat produc-tion by source has been estimated by the Secretariat for the period 1990-2000.
The breakdown of trade by origin and destination is available from 1993.
Direct use of geothermal heat is available from 2001 and of solar thermal heat from 2005.
The low electricity consumption in petroleum refin-eries in 2003 and 2004 is due to a change in owner-ship and work carried out on a refinery.
Data for generating capacity are not available prior to 1995. The breakdown of installed capacity by type of generation/fuel is available from 2001.
Data for Slovenia are available starting in 1990. Prior to that, they are included in Former Yugosla-via. A new energy data collection system was im-plemented in January 2001, causing some breaks in the time series between 1999 and 2000.
Surveys for data on heat consumption are available from 2003 onward. Prior to 2003 the data was esti-mated by the Slovenian national administration.
Prior to 1983, net electricity production by autopro-ducers includes production from combustible fuel sources only and net electricity production by auto-producer CHP plants is included in electricity plants. From 1983, net electricity production by autopro-ducers has been estimated by the Spanish Admini-stration. Prior to 1987 electricity production in main activity producer CHP plants is included with pro-duction from main activity producer electricity plants. Prior to 1989 inputs and outputs from the use
Portugal
Slovak Republic
Slovenia
Spain
48 - ELECTRICITY INFORMATION (2011 edition)
INTERNATIONAL ENERGY AGENCY
of biofuels and waste to generate electricity and/or heat (i.e. comprising solid and liquid biofuels, indus-trial waste, municipal waste and biogases) are re-ported under non-specified biofuels and waste. Elec-tricity production from wind and solar are reported from 1989 when data became available. Production by autoproducer CHP is included with autoproducer electricity for petroleum products prior to 1990. The large increase in electricity output from main activ-ity producer electricity plants fuelled by natural gas in 1997 is due to the opening of a new plant. Elec-tricity from solar thermal plants is available from 2007. A reclassification of plants from main activity to autoproducer in 2008 has led to breaks in the time series for electricity and heat production between 2008 and 2009. For 2004 and 2005, electricity pro-duction from gas diesel is included under heavy fuel oil. Electricity reported under other sources is from waste heat.
Transmission and distribution losses are estimated by the Spanish administration. Starting in 2006, a new method was used to estimate the losses from final consumption data resulting in a break in time series between 2005 and 2006.
Direct use of solar thermal heat and geothermal heat are available from 1994.
Prior to 1980, data on electrical capacity by type of generation are not available and from 2003 no breakdown of capacity by type of fuel/generation is available. From 2004, capacity of autoproducers is included with main activity producers.
Prior to 1987 net electricity production by autopro-ducer plants includes data for CHP plants only. From 1987, the breakdown of net electricity produc-tion by industry for autoproducer electricity plants is available. Prior to 1992, electricity production from biogases is included with wood/wood waste.
Heat produced in main activity producer CHP plants is not available prior to 1974; heat produced in main activity producer heat plants is not available prior to 1980. Heat produced for sale by autoproducer heat plants is available from 1992. Heat produced for sale from heat pumps and electric boilers is reported from 1992. Heat production from petroleum prod-ucts in main activity producer CHP plants includes
heat recovered from flue-gas condensing for 1997 and 1998.
Consumption of heat in industry and other sectors is available from 1984. Consumption of electricity for distribution of district heat is included in other en-ergy industry.
Data on direct use of solar thermal are available from 1989.
The breakdown of generating capacity of main ac-tivity producer and autoproducer electricity plants by fuel is not available from 1990 to 2003 and from 2006 onwards. Peak load data for main activity pro-ducer plants includes data for autoproducer plants from 1992. Generating capacity of main activity producer electricity plants includes autoproducer plants prior to 1984. Prior to 1981, data on electrical capacity by type of generation are not available for main activity producer plants.
The allocation of electricity production in main ac-tivity producer electricity only and CHP plants be-tween 1967 and 1973, and in main activity producer CHP and autoproducer CHP plants in 1974 are Se-cretariat estimates. Solar electricity production by autoproducers is available from 1990. Data for pumped hydro electricity production by autoproduc-ers data are available from 1996.
Heat production includes heat sold by nuclear power stations and distributed to other consumers. Prior to 1978, heat output from CHP plants is not available. A decrease in the use of natural gas in main activity CHP plants in 2007 is caused by the reduced opera-tion of one plant after the start-up of a new waste-incineration plant and the shutting down of another plant. Use increases again in 2008 due to the re-starting of a district heating plant.
Electricity consumption in the transport equipment industry is included in the machinery sub-sector. The breakdown of final consumption of electricity in the industry sector from 2000 to 2001 and final con-sumption of heat in the industry sector from 2000 to 2009 were estimated by the Secretariat.
Direct use of solar thermal heat and geothermal heat is available from 1990. Geothermal direct use is overstated as it refers to heat production by geo-thermal heat pumps, which include inputs from elec-tricity and/or gas in the transformation process.
Sweden
Switzerland
ELECTRICITY INFORMATION (2011 edition) - 49
INTERNATIONAL ENERGY AGENCY
Electricity generating capacity for liquid fuels in main activity producer plants includes all combusti-ble fuels prior to 1990. For 1990 to 2007 the split of hydro and pumped hydro capacity between main activity producers and autoproducers is estimated based on the split of capacity at peak load.
Electricity trade to and from the country for non-specified/others non-specified represents trade with Liechtenstein.
Data on electricity generated from biofuels are available from 1991. In 1995, the Turkish Admini-stration reclassified autoproducer plants by type and source to be consistent with IEA definitions. This causes breaks in the time series between 1994 and 1995 for electricity production in these plants. Elec-tricity production from wind is available starting in 1998.
A new gas fired main activity producer CHP plant was put into operation in 1999 and a new autopro-ducer electricity plant fuelled with coking coal started in 2000. In the 2006 edition, the Turkish Sta-tistical Office started providing electricity and heat output on the basis of a new survey that allowed for the revision of the time series back to 2000. This causes breaks in the time series between 1999 and 2000.
Comprehensive data on electricity consumption are available from 1973. This causes a break in the se-ries between 1972 and 1973. Consumption in the machinery sector includes transport equipment. Prior to 1998, electricity consumption in wood and wood products sub-sector includes that of pulp, paper, and printing industry.
Net electricity generating capacity by type of gen-eration for both main activity producers and auto-producers is not available prior to 1999. Generating capacity reported in other type of generation corre-sponds to gas engines.
Imports of electricity from Turkmenistan are not physical quantities, but contracted quantities that are imported via Iran. Exports of electricity to Non-specified/others are to Iraq and Syria.
The reorganisation and subsequent privatisation of the electricity supply industry in 1990 results in some breaks in the time series. In 1996, the break in
the electricity production from nuclear time series is due to the reclassification of plants from autopro-ducer to main activity producer plants. Data on elec-tricity production from solar is available from 1999 and electricity production from wind is available from 1989.
For the United Kingdom, it was necessary to com-bine figures for main activity producers and auto-producers in order to prevent the disclosure of in-formation relating to less than three electricity gen-erating companies, since this information is consid-ered confidential. For this reason data for main ac-tivity producer CHP plants have been included with autoproducer CHP plants from 1988. Also, inputs of and output from natural gas in main activity pro-ducer electricity plants are included in autoproducer electricity plants for 1990. Prior to 1988, electricity output from CHP plants was included with main activity producer electricity plants. Prior to 2003, all outputs of electricity and heat from oil products are reported in the other oil products category. From 2007 onwards, inputs of petroleum coke inputs to main electricity plants are included in residual fuel oil and outputs of electricity are included in bitumi-nous coal. Heat production from autoproducers is available starting in 1999.
From 1984 onwards, the electricity consumption in the industry non-specified sub-sector includes that of the wood and wood products sub-sector and unallo-cated consumption. Electricity consumption in coal mines includes consumption in patent fuel plants. Consumption in gas works includes electricity use in the transmission/distribution of public supply gas. Consumption in the machinery sub-sector includes that of the transport equipment industry before 1996. Consumption in the non-metallic mineral products sub-sector includes mining and quarrying. Starting in 1990, small amounts of electricity used in heat pumps have been included in the residential sector Electricity used for urban transport systems is in-cluded in non-specified transport. In the 2011 edi-tion, the methodology for allocating electricity con-sumption by sector was revised which results in a break between 2004 and 2005 in the residential sec-tor.
Prior to 1981 for main activity producer plants and prior to 1983 for autoproducers, data on electrical capacity by type of generation are not available.
Turkey
United Kingdom
United States
50 - ELECTRICITY INFORMATION (2011 edition)
INTERNATIONAL ENERGY AGENCY
There are breaks in the series concerning the total production of electricity and heat in the United States. Prior to 1989, there are no data available for autoproducers. Electricity production in main activ-ity producer CHP plants is available from 1991. Comprehensive data on electricity and heat produc-tion and consumption in main activity producer elec-tricity, CHP and heat plants and autoproducer elec-tricity and CHP plants are not available for all years. The selling of main activity producer plants to auto-producers may cause breaks in the series between 1998 and 2000. Data on electricity used for pumping and electricity production from pumped storage plants is available from 1987.
For the 2003 edition the US Administration changed the definition of what it reports under autoproducers. Prior to 2000, autoproducers include small and inde-pendent power producers which under IEA defini-tions are considered as main activity producers. Pro-duction from these small and independent power producers account for about 25% of reported pro-duction of electricity by autoproducers in the United States. This reclassification causes breaks between 1999 and 2000. For the 2009 edition the US Ad-ministration changed their methodology for calculat-ing heat production in CHP plants, and revised data back to 2006. This leads to breaks in the time series between 2005 and 2006. Electricity generation re-ported under other sources is from purchased steam. From 2007, the industrial waste category includes recovered heat from industrial processes. Accurate accounting of coke oven gas and refinery gas inputs is not always possible and can lead to efficiencies of over 100% in main activity producer CHP plants.
Data for heat produced in main activity producer heat plants is available from 1992. Since 1995, heat data are no longer collected and have been estimated by the US Administration, which causes breaks in the time series between 1994 and 1995.
Sub-bituminous coal inputs for electricity and heat production are included in hard coal before 1983. Prior to 1991 some of the fuel inputs to electricity and heat production reported for autoproducer plants are reported as final consumption in the particular economic sector in which the autoproducer is oper-ating. Data for peat are confidential between 1994 and 1998 and from 2000 are not reported. Prior to 2001, data on plants consuming other bituminous coal, sub-bituminous coal and lignite have been es-timated by the Secretariat using information pro-vided in the EIA’s Annual Electricity Generator
Report – Utility. From 2004 onwards, the EIA has reported electricity and heat production from anthra-cite under sub-bituminous coal. The IEA Secretariat estimated the split of output by fuel type based on the assumption that the plant efficiencies of the ag-gregate are equal to that of each part. The decline in patent fuel used for electricity production in 2008 and subsequent cessation of time series in 2009 is a result of the termination of the patent fuel tax credit in 2008 which had previously made the fuel eco-nomical for electricity production.
The breakdown of fuel used and production of heat in main activity producer heat plants have been es-timated by the Secretariat for 1992 and 1993.
A new survey for electricity consumption may cause breaks in the time series for 2003 and 2004, espe-cially in the industry, transport, commercial and residential sectors. There are breaks in the series concerning the total consumption of heat sold to third parties. The consumption of heat sold in indus-try is available from 1991 and in the energy industry from 1992. Prior to 1991, total consumption of heat sold only referred to consumption in commercial and public services. No heat is reported as being sold to the residential or agriculture sectors.
From 2000 onwards, the United States assumes that autoproducer CHP plants use all of the heat pro-duced themselves and sell none to third parties. Therefore, this may underestimate the heat sold to third parties.
Direct use of heat in heat pumps (mainly in residen-tial and industry) is not available. Direct use of solar thermal heat in residential is available from 1999. Prior to 1999, solar thermal electricity production includes generation from natural gas because some natural gas units are attached to solar thermal plants and their production cannot be separated. The IEA Secretariat estimated US photovoltaic (PV) electric-ity generation from autoproducers starting in 1999 by multiplying the dispersed and distributed PV ca-pacity estimated by the EIA by an average capacity factor of 12%. The capacity factor was based on a report published in 2007 by the IEA Photovoltaic Power Systems Programme, Cost and Performance Trends in Grid-Connected Photovoltaic Systems and Case Studies. The corresponding electricity con-sumption has been included under non-specified other consumption.
Capacity is net summer capacity. The breakdown of capacity by fuel type for 1989 is a Secretariat esti-

ELECTRICITY INFORMATION (2011 edition) - 51
INTERNATIONAL ENERGY AGENCY
mate. Capacity by type of generation is not reported prior to 1981. Data on electrical capacity for auto-producers are available from 1989.
52 - ELECTRICITY INFORMATION (2011 edition)
INTERNATIONAL ENERGY AGENCY
CONVERSION FACTORS AND CALORIFIC VALUES
Conversion (to toe)
All units in this publication are metric units. Most IEA/OECD publications showing inter-fuel relations and projections present such information in a common energy unit, the tonne of oil equivalent (toe). A tonne of oil equivalent is defined as 107 kcal (41.868 GJ), a convenient measure because it is approximately the net heat content of one tonne of average crude oil. This unit is used by the IEA/OECD in its energy bal-ances. Note also that totals may not be the sum of their components due to independent rounding.
The change from using the original unit to tonne of oil equivalent implies choosing coefficients of equiva-lence between different forms and sources of energy. This problem can be approached in many different ways. For example one could adopt a single equiva-lence for each major primary energy source in all countries, e.g. 29 307 kJ/kg (7 000 kcal/kg) for hard coal, 41 868 kJ/kg (10 000 kcal/kg) for oil, etc.
The main objection to this method is that it results in distortions since there is a wide spread in calorific values between types of coal and individual coal products, and between calorific values of these fuels in different countries.
The Secretariat has therefore adopted specific calo-rific factors supplied by the national administrations for the main categories of each quality of coal and for each flow or use (i.e. production, imports, exports,
electricity generation, coke ovens, blast furnaces and industry). For crude oil, specific factors have been used based on consultations with experts from the national administrations, while for petroleum products regional conversion factors have been used.
The balances are expressed in terms of "net" calorific value. The difference between the "net" and the “gross” calorific value for each fuel is the latent heat of vaporisation of the water produced during combus-tion of the fuel. For coal and oil, net calorific value is usually around 5% less than gross, for most forms of natural and manufactured gas the difference is 9-10%, while for electricity there is no difference as the con-cept has no meaning in this case. The use of the net calorific value is consistent with the practice of the Statistical Offices of the European Communities and the United Nations.
Electricity data are converted from original units of gigawatt hours to million tonnes of oil equivalent us-ing the relationship:
1 TWh = 0.086 Mtoe.
Complete listings of net calorific values to convert energy sources from basic units to tonne of oil equiva-lent are reported in section IV and can be found at the end of this Chapter.
Electricity
All electricity data are reported to the IEA in GWh (for generation) or MW (for capacity).
Figures for the energy equivalent of electricity pro-duction, trade, and final consumption are calculated
Units and conversions
ELECTRICITY INFORMATION (2011 edition) - 53
INTERNATIONAL ENERGY AGENCY
using the energy content of the electricity, i.e. at a rate of 1 TWh = 0.086 Mtoe. Hydroelectricity production (excluding pumped storage) and electricity produced by other non-thermal means (wind, tide, photovoltaic, etc.), are accounted for similarly using 1 TWh = 0.086 Mtoe.
However, the primary energy equivalent of nuclear electricity is calculated from the gross generation by assuming a 33% conversion efficiency, i.e. 1 TWh = (0.086 ÷ 0.33) Mtoe. The 33% figure is based on empirical data obtained by Eurostat on conversion efficiencies in nuclear plants in the European Union.
In the case of electricity produced from geothermal heat, the primary equivalent is calculated assuming an efficiency of 10%, when the geothermal energy input is not submitted by a country.
1 TWh = (0.086 ÷ 0.1) Mtoe.
Heat
Information on heat is supplied in Terajoules (TJ).
1 TJ = 2.388 x 10⁻⁵ Mtoe.
In the case of geothermal heat, the primary equivalent is calculated assuming an average thermal efficiency of 50%, when the geothermal energy input is not submitted by a country.
1 TJ = (2.388 x 10⁻⁵ ÷ 0.5) Mtoe.
Natural gas
In this publication, natural gas excludes natural gas liquids. For the net heat content of a natural gas, its gross heat content is multiplied by 0.9.
Oil
The IEA applies regional conversion factors (in con-junction with Eurostat for the European countries) for the petroleum products:
Regional net calorific values for petroleum products
Petroleum products Europe Americas Asia Oceania
kJ/kg kJ/kg kJ/kg
Refinery gas 49 500 48 100 48 100
Ethane 49 500 49 400 49 400
Liquefied petroleum gases
46 000 47 300 47 700
Motor gasoline 44 000 44 800 44 600
Aviation gasoline 44 000 44 800 44 600
Gasoline type jet fuel 43 000 44 800 44 600
Kerosene type jet fuel 43 000 44 600 44 500
Kerosene 43 000 43 800 42 900
Gas/diesel oil 42 600 42 600 42 600
Residual fuel oil 40 000 40 200 42 600
Naphtha 44 000 45 000 43 200
White spirit 43 600 43 000 43 000
Lubricants 42 000 42 000 42 900
Bitumen 39 000 40 000 38 800
Paraffin waxes 40 000
Petroleum coke 32 000 32 000 33 800
Non-specified petroleum products
40 000
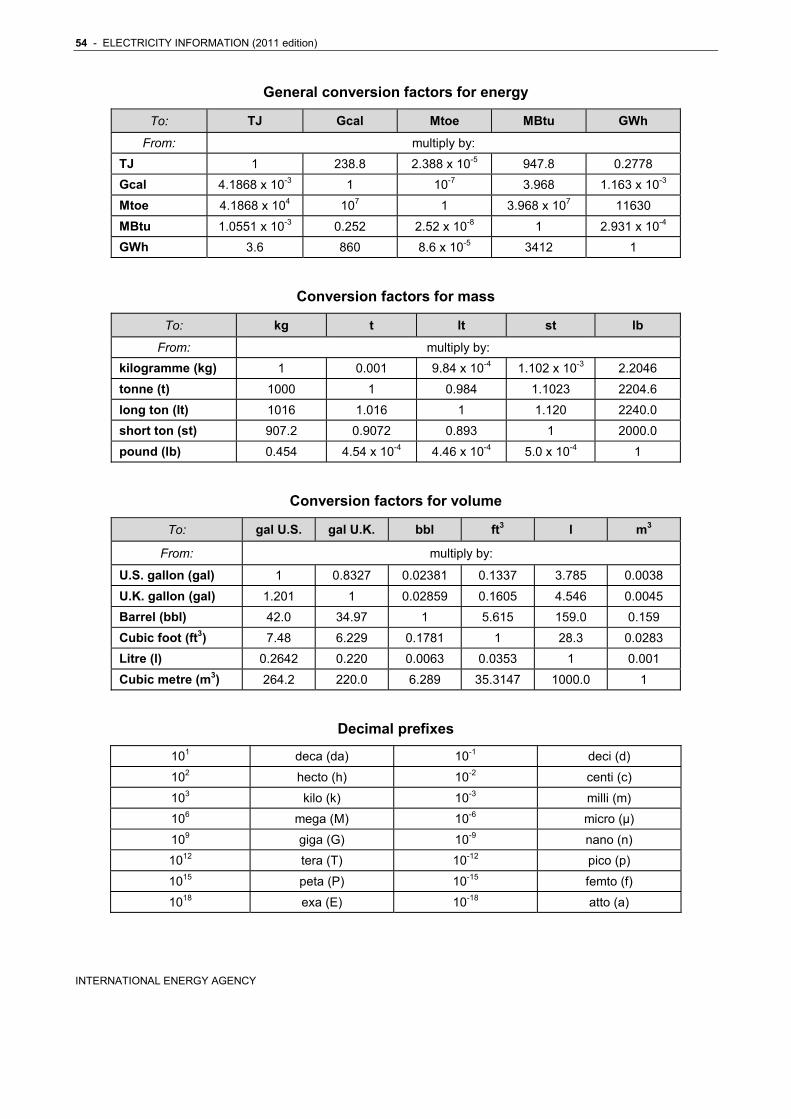
54 - ELECTRICITY INFORMATION (2011 edition)
INTERNATIONAL ENERGY AGENCY
General conversion factors for energy
To: TJ Gcal Mtoe MBtu GWh
From: multiply by:
TJ 1 238.8 2.388 x 10⁻⁵ 947.8 0.2778
Gcal 4.1868 x 10⁻³ 1 10-7 3.968 1.163 x 10⁻³
Mtoe 4.1868 x 10⁴ 107 1 3.968 x 10⁷ 11630
MBtu 1.0551 x 10⁻³ 0.252 2.52 x 10⁻⁸ 1 2.931 x 10⁻⁴
GWh 3.6 860 8.6 x 10⁻⁵ 3412 1
Conversion factors for mass
To: kg t lt st lb
From: multiply by:
kilogramme (kg) 1 0.001 9.84 x 10⁻⁴ 1.102 x 10⁻³ 2.2046
tonne (t) 1000 1 0.984 1.1023 2204.6
long ton (lt) 1016 1.016 1 1.120 2240.0
short ton (st) 907.2 0.9072 0.893 1 2000.0
pound (lb) 0.454 4.54 x 10⁻⁴ 4.46 x 10⁻⁴ 5.0 x 10⁻⁴ 1
Conversion factors for volume
To: gal U.S. gal U.K. bbl ft3 l m3
From: multiply by:
U.S. gallon (gal) 1 0.8327 0.02381 0.1337 3.785 0.0038
U.K. gallon (gal) 1.201 1 0.02859 0.1605 4.546 0.0045
Barrel (bbl) 42.0 34.97 1 5.615 159.0 0.159
Cubic foot (ft3) 7.48 6.229 0.1781 1 28.3 0.0283
Litre (l) 0.2642 0.220 0.0063 0.0353 1 0.001
Cubic metre (m3) 264.2 220.0 6.289 35.3147 1000.0 1
Decimal prefixes
101 deca (da) 10-1 deci (d)
102 hecto (h) 10-2 centi (c)
103 kilo (k) 10-3 milli (m)
106 mega (M) 10-6 micro (µ)
109 giga (G) 10-9 nano (n)
1012 tera (T) 10-12 pico (p)
1015 peta (P) 10-15 femto (f)
1018 exa (E) 10-18 atto (a)