Embed Size (px)
Citation preview

ENERGY STATISTICS OF NON-OECD COUNTRIES 2015 REVISED EDITION
DATABASE DOCUMENTATION

2 - ENERGY STATISTICS OF NON-OECD COUNTRIES: DATABASE DOCUMENTATION (2015 revised edition)
INTERNATIONAL ENERGY AGENCY
This document provides information regarding the 2015 edition of the IEA Energy Statistics of NON- OECD countries database. This document can be found online at:
http://www.iea.org/statistics/topics/energybalances/
Please address your inquiries to [email protected].
Please note that all IEA data are subject to the Terms and Conditions which can be found on the IEA’s website: http://www.iea.org/t&c/termsandconditions/

ENERGY STATISTICS OF NON-OECD COUNTRIES: DATABASE DOCUMENTATION (2015 revised edition) - 3
INTERNATIONAL ENERGY AGENCY
TABLE OF CONTENTS
1. CHANGES FROM LAST EDITION ........................................................................................................... 4
2. DATABASE STRUCTURE ........................................................................................................................ 6
3. FLOW DEFINITIONS ................................................................................................................................. 7
4. PRODUCT DEFINITIONS ....................................................................................................................... 21
5. GEOGRAPHICAL COVERAGE .............................................................................................................. 34
6. COUNTRY NOTES AND SOURCES ...................................................................................................... 44
7. ISSUES OF DATA QUALITY .................................................................................................................. 98
8. ABBREVIATIONS ................................................................................................................................. 101

4 - ENERGY STATISTICS OF NON-OECD COUNTRIES: DATABASE DOCUMENTATION (2015 revised edition)
INTERNATIONAL ENERGY AGENCY
1. CHANGES FROM LAST EDITION
Changes from August 2015 edition
In September 2015, the National Bureau of Statistics of China published China’s energy statistics for 2013, as well as revised statistics for the years 2000 to 2012. NBS supplied the IEA with detailed energy balances for 2011 to 2013 and using these the IEA revised its 2011-2013 data based on these newly available figures. The revisions show significant changes both on the supply and demand side for a number of energy products, resulting in breaks in time series between 2010 and 2011. For the years 2000-2010, revisions will be published in the next edition of this publication in summer 2016.
The revised energy balances released by the NBS integrate findings from a national economic census for all years since 2000. The revised balance data solve several detailed issues, most importantly the unallocated coal demand that appeared in the recent years of the Chinese energy balance (shown as the statistical difference), has been pri-marily allocated to final consumption in the industrial sector.
Changes from August 2014 edition
Country coverage
The IEA continues to try to expand the coverage of our statistics reports and encourage more countries to collabo-rate on data exchange. This year data have become available for Niger from 2000 to 2013, therefore Niger has been removed from the region Other Africa for those years. These data are presented in this edition of the publica-tion. Data have also become available for South Sudan for the years 2012 and 2013, therefore data for Sudan and South Sudan are presented separately for these years.
Finally, data for the former Netherlands Antilles have been separated into its constituent islands. Data for Cura-çao are presented for 2012 and 2013 and data for the remaining islands (Bonaire, Saba, Saint Eustatius and Sint Maarten) have been included in Other Non-OECD Americas.
Additional countries in Non-OECD Statistics
Longname Shortname Comment
Niger NIGER In this edition, data for Niger became available from 2000.
South Sudan SSUDAN South Sudan became an independent country on 9 July 2011.
Data for South Sudan are available separately from 2012.

ENERGY BALANCES OF NON-OECD COUNTRIES: DATABASE DOCUMENTATION (2015 edition) - 5
INTERNATIONAL ENERGY AGENCY
Change in countries in Non-OECD Statistics
Old Longname Old shortname New longname New shortname
Netherlands Antilles NANTILLES Curaçao CURACAO
Change in aggregates in Non-OECD Statistics
Longname Shortname Comment
Memo: Africa AFRICA Now includes NIGER and SSUDAN.
Memo:Non-OECD Americas
LATINAMERI NANTILLES replaced by CURACAO.

6 - ENERGY STATISTICS OF NON-OECD COUNTRIES: DATABASE DOCUMENTATION (2015 revised edition)
INTERNATIONAL ENERGY AGENCY
2. DATABASE STRUCTURE
The database Energy Statistics of NON-OECD countries includes annual data for:
countries: 108 countries and 20 regional aggregates (see section 5:Geographical coverage); years: 1971-2014, unless otherwise specified. For 2014, only provisional energy supply data are available.
The database includes the following three files:
WED_BES.IVT Energy statistics of NON-OECD countries:
Energy Statistics in matrix form (68 product categories; 90 flows) (kt; TJ);
Electricity and heat output by type of producer (12 flows) (GWh; TJ).
WED_STATCONV.IVT Conversion factors of NON-OECD countries:
net calorific values by flow for 15 coal, peat, oil shale products (toe/t; kJ/kg);
average net calorific values for 23 oil products and 4 biofuel products (toe/t; kJ/kg);
volume to mass ratio for 22 oil products and 3 biofuel products (barrels/tonne).
WED_BBL.IVT Oil demand by product of NON-OECD countries:
Oil demand in matrix form (9 product categories; 4 flows) (kbarrels/day).

ENERGY STATISTICS OF NON-OECD COUNTRIES: DATABASE DOCUMENTATION (2015 revised edition) - 7
INTERNATIONAL ENERGY AGENCY
3. FLOW DEFINITIONS
Supply Flow Short name Definition
Production INDPROD Refers to the quantities of fuels extracted or produced, calculated after any operation for removal of inert matter or impurities (e.g. sulphur from natural gas). For “other hydrocarbons” (shown with crude oil), production should include synthetic crude oil (including mineral oil extracted from bituminous minerals such as oil shale and tar sands, etc.). Production of secondary oil products represents the gross refinery output. Secondary coal products (including coal gases) repre-sent the output from coke ovens, gas works, blast furnaces and other transformation processes.
From other sources – coal
OSCOAL Refers to both primary energy that has not been accounted for under production and secondary energy that has been accounted for in the production of another fuel. For example, under primary coal: recov-ered slurries, middlings, recuperated coal dust and other low-grade coal products that cannot be classified according to type of coal from which they are obtained; under gas works gas: natural gas, refinery gas, and LPG, that are treated or mixed in gas works (i.e. gas works gas produced from sources other than coal).
From other sources - natural gas
OSNATGAS Refers to both primary energy that has not been accounted for under production and secondary energy that has been accounted for in the production of another fuel.
From other sources - oil products
OSOIL Refers to both primary energy that has not been accounted for under production and secondary energy that has been accounted for in the production of another fuel. For example, under additives: benzol, al-cohol and methanol produced from natural gas; under refinery feed-stocks: backflows from the petrochemical industry used as refinery feedstocks; under “other hydrocarbons” (included with crude oil): liq-uids obtained from coal liquefaction and GTL plants.
From other sources - renewables
OSRENEW Refers to both primary energy that has not been accounted for under production and secondary energy that has been accounted for in the production of another fuel.

8 - ENERGY STATISTICS OF NON-OECD COUNTRIES: DATABASE DOCUMENTATION (2015 revised edition)
INTERNATIONAL ENERGY AGENCY
Supply Flow Short name Definition
From other sources - non-specified
OSNONSPEC Refers to both primary energy that has not been accounted for under production and secondary energy that has been accounted for in the production of another fuel. This flow is used if the source is not known.
Imports IMPORTS Comprises amounts having crossed the national territorial boundaries of the country whether or not customs clearance has taken place.
For coal: Imports comprise the amount of fuels obtained from other countries, whether or not there is an economic or customs union be-tween the relevant countries. Coal in transit should not be included.
For oil and natural gas: Quantities of crude oil and oil products imported under processing agreements (i.e. refining on account) are included. Quantities of oil in transit are excluded. Crude oil, NGL and natural gas are reported as coming from the country of origin; refinery feedstocks and oil products are reported as coming from the country of last consignment.
For electricity: Amounts are considered as imported when they have crossed the national territorial boundaries of the country. If electricity is “wheeled” or transited through a country, the amount is shown as both an import and an export.
Exports EXPORTS Comprises amounts having crossed the national territorial boundaries of the country whether or not customs clearance has taken place.
For coal: Exports comprise the amount of fuels supplied to other countries, whether or not there is an economic or customs union be-tween the relevant countries. Coal in transit should not be included.
For oil and natural gas: Quantities of crude oil and oil products exported under processing agreements (i.e. refining on account) are included. Re-exports of oil imported for processing within bonded areas are shown as an export of product from the processing country to the final destination.
For electricity: Amounts are considered as exported when they have crossed the national territorial boundaries of the country. If electricity is “wheeled” or transited through a country, the amount is shown as both an import and an export.
International marine bunkers
MARBUNK Covers those quantities delivered to ships of all flags that are engaged in international navigation. The international navigation may take place at sea, on inland lakes and waterways, and in coastal waters. Consumption by ships engaged in domestic navigation is excluded. The domestic/international split is determined on the basis of port of departure and port of arrival, and not by the flag or nationality of the ship. Consumption by fishing vessels and by military forces is also excluded. See definitions of transport, fishing, and non-specified (other).

ENERGY STATISTICS OF NON-OECD COUNTRIES: DATABASE DOCUMENTATION (2015 revised edition) - 9
INTERNATIONAL ENERGY AGENCY
Supply Flow Short name Definition
International aviation bunkers
AVBUNK Includes deliveries of aviation fuels to aircraft for international avia-tion. Fuels used by airlines for their road vehicles are excluded. The domestic/international split should be determined on the basis of de-parture and landing locations and not by the nationality of the airline. For many countries this incorrectly excludes fuel used by domestically owned carriers for their international departures.
Stock changes STOCKCHA Reflects the difference between opening stock levels on the first day of the year and closing levels on the last day of the year of stocks on national territory held by producers, importers, energy transformation industries and large consumers. Oil and gas stock changes in pipelines are not taken into account. With the exception of large users men-tioned above, changes in final users' stocks are not taken into account. A stock build is shown as a negative number, and a stock draw as a positive number.
Domestic supply DOMSUP Defined as production + from other sources + imports - exports - international marine bunkers - international aviation bunkers ± stock changes. Note, exports, bunkers and stock changes incorporate the algebraic sign directly in the number.
Transfers TRANSFER Comprises interproduct transfers, products transferred and recycled products.
Interproduct transfers results from reclassification of products either because their specification has changed or because they are blended into another product, e.g. kerosene may be reclassified as gasoil after blending with the latter in order to meet its winter diesel specification. The net balance of interproduct transfers is zero.
Products transferred is intended for oil products imported for further processing in refineries. For example, fuel oil imported for upgrading in a refinery is transferred to the feedstocks category.
Recycled products are finished products which pass a second time through the marketing network, after having been once delivered to final consumers (e.g. used lubricants which are reprocessed).
Statistical differences
STATDIFF Defined as deliveries to final consumption + use for transformation processes + consumption by energy industry own use + losses - do-mestic supply - transfers. Statistical differences arise because the data for the individual components of supply are often derived from differ-ent data sources by the national administration. Furthermore, the in-clusion of changes in some large consumers' stocks in the supply part of the balance introduces distortions which also contribute to the sta-tistical differences.

10 - ENERGY STATISTICS OF NON-OECD COUNTRIES: DATABASE DOCUMENTATION (2015 revised edition)
INTERNATIONAL ENERGY AGENCY
Transformation processes Flow Short name Definition
Transformation processes
TOTTRANF Transformation processes comprise the conversion of primary forms of energy to secondary and further transformation (e.g. coking coal to coke, crude oil to oil products, and fuel oil to electricity).
Main activity producer electricity plants
MAINELEC Refers to plants which are designed to produce electricity only. If one or more units of the plant is a CHP unit (and the inputs and outputs can not be distinguished on a unit basis) then the whole plant is des-ignated as a CHP plant. Main activity producers generate electricity for sale to third parties, as their primary activity. They may be pri-vately or publicly owned. Note that the sale need not take place through the public grid.
Autoproducer electricity plants
AUTOELEC Refers to plants which are designed to produce electricity only. If one or more units of the plant is a CHP unit (and the inputs and outputs can not be distinguished on a unit basis) then the whole plant is des-ignated as a CHP plant. Autoproducer undertakings generate electrici-ty wholly or partly for their own use as an activity which supports their primary activity. They may be privately or publicly owned.
Main activity producer CHP plants
MAINCHP Refers to plants which are designed to produce both heat and electric-ity (sometimes referred to as co-generation power stations). If possi-ble, fuel inputs and electricity/heat outputs are on a unit basis rather than on a plant basis. However, if data are not available on a unit ba-sis, the convention for defining a CHP plant noted above should be adopted. Main activity producers generate electricity and/or heat for sale to third parties, as their primary activity. They may be privately or publicly owned. Note that the sale need not take place through the public grid.
Autoproducer CHP plants
AUTOCHP Refers to plants which are designed to produce both heat and electric-ity (sometimes referred to as co-generation power stations). If possi-ble, fuel inputs and electricity/heat outputs are on a unit basis rather than on a plant basis. However, if data are not available on a unit ba-sis, the convention for defining a CHP plant noted above should be adopted. Note that for autoproducer CHP plants, all fuel inputs to electricity production are taken into account, while only the part of fuel inputs to heat sold is shown. Fuel inputs for the production of heat consumed within the autoproducer's establishment are not in-cluded here but are included with figures for the final consumption of fuels in the appropriate consuming sector. Autoproducer undertakings generate electricity and/or heat, wholly or partly for their own use as an activity which supports their primary activity. They may be pri-vately or publicly owned.

ENERGY STATISTICS OF NON-OECD COUNTRIES: DATABASE DOCUMENTATION (2015 revised edition) - 11
INTERNATIONAL ENERGY AGENCY
Transformation processes Flow Short name Definition
Main activity producer heat plants
MAINHEAT Refers to plants (including heat pumps and electric boilers) designed to produce heat only and who sell heat to a third party (e.g. residen-tial, commercial or industrial consumers) under the provisions of a contract. Main activity producers generate heat for sale to third par-ties, as their primary activity. They may be privately or publicly owned. Note that the sale need not take place through the public grid.
Autoproducer heat plants
AUTOHEAT Refers to plants (including heat pumps and electric boilers) designed to produce heat only and who sell heat to a third party (e.g. residen-tial, commercial or industrial consumers) under the provisions of a contract. Autoproducer undertakings generate heat, wholly or partly for their own use as an activity which supports their primary activity. They may be privately or publicly owned.
Heat pumps THEAT Includes heat produced by heat pumps in transformation. Heat pumps that are operated within the residential sector where the heat is not sold are not considered a transformation process and are not included here – the electricity consumption would appear as residential use.
Electric boilers TBOILER Includes electric boilers used to produce heat.
Chemical heat for electricity production
TELE Includes heat from chemical processes that is used to generate electricity.
Blast furnaces TBLASTFUR Includes the production of recovered gases (e.g. blast furnace gas and oxygen steel furnace gas). The production of pig-iron from iron ore in blast furnaces uses fuels for supporting the blast furnace charge and providing heat and carbon for the reduction of the iron ore. Accounting for the calorific content of the fuels entering the process is a complex matter as transformation (into blast furnace gas) and consumption (heat of combustion) occur simultaneously. Some carbon is also retained in the pig-iron; almost all of this reappears later in the oxygen steel furnace gas (or converter gas) when the pig-iron is converted to steel. In the 1992/1993 annual questionnaires, Member Countries were asked for the first time to report in transformation processes the quantities of all fuels (e.g. pulverised coal injection [PCI] coal, coke oven coke, natural gas and oil) entering blast furnaces and the quantity of blast furnace gas and oxygen steel furnace gas produced. The Secretariat then needed to split these inputs into the transformation and consumption components. The trans-formation component is shown in the row blast furnaces in the column appropriate for the fuel, and the consumption component is shown in the row iron and steel, in the column appropriate for the fuel. The Secretariat decided to assume a transformation efficiency such that the carbon input into the blast furnaces should equal the carbon output. This is roughly equivalent to assuming an energy transformation efficiency of 40%.
Gas works TGASWKS Includes the manufacture of town gas.
Coke ovens TCOKEOVS Includes the manufacture of coke and coke oven gas.
Patent fuel plants TPATFUEL Includes the manufacture of patent fuels.

12 - ENERGY STATISTICS OF NON-OECD COUNTRIES: DATABASE DOCUMENTATION (2015 revised edition)
INTERNATIONAL ENERGY AGENCY
Transformation processes Flow Short name Definition
BKB/peat briquette plants
TBKB Includes the manufacture of BKB and peat briquettes.
Oil refineries TREFINER Includes the manufacture of finished oil products.
Petrochemical plants
TPETCHEM Covers backflows returned from the petrochemical industry. Note that backflows from oil products that are used for non-energy purposes (i.e. white spirit and lubricants) are not included here, but in non-energy use.
Coal liquefaction plants
TCOALLIQ Includes coal, oil and tar sands used to produce synthetic oil.
Gas-to-liquids (GTL) plants
TGTL Includes natural gas used as feedstock for the conversion to liquids, e.g. the quantities of fuel entering the methanol production process for transformation into methanol.
For blended natural gas
TBLENDGAS Includes other gases that are blended with natural gas.
Charcoal production plants
TCHARCOAL Includes the transformation of solid biofuels into charcoal.
Non-specified (transformation)
TNONSPEC Includes other non-specified transformation.

ENERGY STATISTICS OF NON-OECD COUNTRIES: DATABASE DOCUMENTATION (2015 revised edition) - 13
INTERNATIONAL ENERGY AGENCY
Energy industry own use and Losses Flow Short name Definition
Energy industry own use
TOTENGY Energy industry own use covers the amount of fuels used by the energy producing industries (e.g. for heating, lighting and operation of all equip-ment used in the extraction process, for traction and for distribution).
It includes energy consumed by energy industries for heating, pump-ing, traction and lighting purposes [ISIC Rev. 4 Divisions 05, 06, 19 and 35, Group 091 and Classes 0892 and 0721].
Coal mines EMINES Represents the energy which is used directly within the coal industry for hard coal and lignite mining. It excludes coal burned in pithead power stations (included under electricity plants in transformation processes) and free allocations to miners and their families (considered as part of household consumption and therefore included under residential).
Oil and gas extraction
EOILGASEX Represents the energy which is used for oil and gas extraction. Flared gas is not included.
Blast furnaces EBLASTFUR Represents the energy which is used in blast furnaces.
Gas works EGASWKS Represents the energy which is used in gas works.
Gasification plants for biogases
EBIOGAS Represents own consumption of biogas necessary to support tempera-tures needed for anaerobic fermentation.
Coke ovens ECOKEOVS Represents the energy used in coke ovens.
Patent fuel plants EPATFUEL Represents the energy used in patent fuel plants.
BKB/peat briquette plants
EBKB Represents the energy used in BKB and peat briquette plants.
Oil refineries EREFINER Represents the energy used in oil refineries.
Coal liquefaction plants
ECOALLIQ Represents the energy used in coal liquefaction plants.
Liquefaction (LNG) / regasification plants
ELNG Represents the energy used in LNG and regasification plants.
Gas-to-liquids (GTL) plants
EGTL Represents the energy used in gas-to-liquids plants.
Own use in electricity, CHP and heat plants
EPOWERPLT Represents the energy used in electricity, CHP and heat plants.
Pumped storage plants
EPUMPST Represents electricity consumed in hydro-electric plants for pumped storage.
Nuclear industry ENUC Represents the energy used in the nuclear industry.
Charcoal production plants
ECHARCOAL Represents the energy used in charcoal production plants.
Non-specified (energy)
ENONSPEC Represents use in non-specified energy industries.
Losses DISTLOSS Losses in energy distribution, transmission and transport.
14 - ENERGY STATISTICS OF NON-OECD COUNTRIES: DATABASE DOCUMENTATION (2015 revised edition)
INTERNATIONAL ENERGY AGENCY
Final consumption Flow Short name Definition
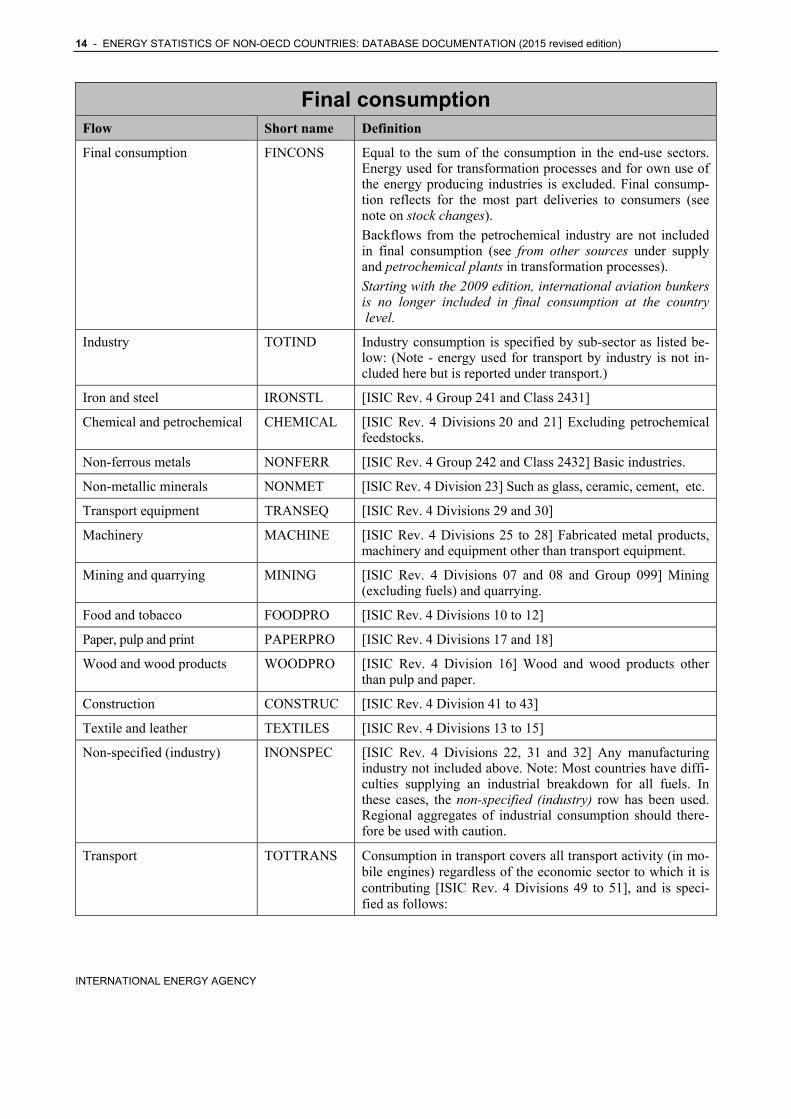
Final consumption FINCONS Equal to the sum of the consumption in the end-use sectors. Energy used for transformation processes and for own use of the energy producing industries is excluded. Final consump-tion reflects for the most part deliveries to consumers (see note on stock changes).
Backflows from the petrochemical industry are not included in final consumption (see from other sources under supply and petrochemical plants in transformation processes).
Starting with the 2009 edition, international aviation bunkers is no longer included in final consumption at the country level.
Industry TOTIND Industry consumption is specified by sub-sector as listed be-low: (Note - energy used for transport by industry is not in-cluded here but is reported under transport.)
Iron and steel IRONSTL [ISIC Rev. 4 Group 241 and Class 2431]
Chemical and petrochemical CHEMICAL [ISIC Rev. 4 Divisions 20 and 21] Excluding petrochemical feedstocks.
Non-ferrous metals NONFERR [ISIC Rev. 4 Group 242 and Class 2432] Basic industries.
Non-metallic minerals NONMET [ISIC Rev. 4 Division 23] Such as glass, ceramic, cement, etc.
Transport equipment TRANSEQ [ISIC Rev. 4 Divisions 29 and 30]
Machinery MACHINE [ISIC Rev. 4 Divisions 25 to 28] Fabricated metal products, machinery and equipment other than transport equipment.
Mining and quarrying MINING [ISIC Rev. 4 Divisions 07 and 08 and Group 099] Mining (excluding fuels) and quarrying.
Food and tobacco FOODPRO [ISIC Rev. 4 Divisions 10 to 12]
Paper, pulp and print PAPERPRO [ISIC Rev. 4 Divisions 17 and 18]
Wood and wood products WOODPRO [ISIC Rev. 4 Division 16] Wood and wood products other than pulp and paper.
Construction CONSTRUC [ISIC Rev. 4 Division 41 to 43]
Textile and leather TEXTILES [ISIC Rev. 4 Divisions 13 to 15]
Non-specified (industry) INONSPEC [ISIC Rev. 4 Divisions 22, 31 and 32] Any manufacturing industry not included above. Note: Most countries have diffi-culties supplying an industrial breakdown for all fuels. In these cases, the non-specified (industry) row has been used. Regional aggregates of industrial consumption should there-fore be used with caution.
Transport TOTTRANS Consumption in transport covers all transport activity (in mo-bile engines) regardless of the economic sector to which it is contributing [ISIC Rev. 4 Divisions 49 to 51], and is speci-fied as follows:

ENERGY STATISTICS OF NON-OECD COUNTRIES: DATABASE DOCUMENTATION (2015 revised edition) - 15
INTERNATIONAL ENERGY AGENCY
Final consumption Flow Short name Definition
World aviation bunkers WORLDAV Covers fuels delivered to aircraft of all countries that are en-gaged in international aviation (International aviation bun-kers) for the world total.
World aviation bunkers is not applicable for individual coun-tries and regions and is included in transport for the world total.
Note that for World, total primary energy supply includes international aviation bunkers.
Domestic aviation DOMESAIR Includes deliveries of aviation fuels to aircraft for domestic avia-tion - commercial, private, agricultural, etc. It includes use for purposes other than flying, e.g. bench testing of engines, but not airline use of fuel for road transport. The domestic/international split should be determined on the basis of departure and landing locations and not by the nationality of the airline. Note that this may include journeys of considerable length between two air-ports in a country (e.g. San Francisco to Honolulu). For many countries this incorrectly includes fuel used by domestically owned carriers for outbound international traffic;
Road ROAD Includes fuels used in road vehicles as well as agricultural and industrial highway use. Excludes military consumption as well as motor gasoline used in stationary engines and diesel oil for use in tractors that are not for highway use;
Rail RAIL Includes quantities used in rail traffic, including industrial railways;
Pipeline transport PIPELINE Includes energy used in the support and operation of pipelines transporting gases, liquids, slurries and other commodities, in-cluding the energy used for pump stations and maintenance of the pipeline. Energy for the pipeline distribution of natural gas or coal gases, hot water or steam (ISIC Rev. 4 Division 35) from the distributor to final users is excluded and should be reported in energy industry own use, while the energy used for the final distribution of water (ISIC Rev. 4 Division 36) to household, in-dustrial, commercial and other users should be included in com-mercial/public services. Losses occurring during the transport between distributor and final users should be reported as losses;
World marine bunkers WORLDMAR Covers fuels delivered to ships of all flags that are engaged in international navigation (International marine bunkers) for the world total.
World marine bunkers is not applicable for individual coun-tries and regions and is included in transport for the world total.
Note that for World, total primary energy supply includes international marine bunkers.

16 - ENERGY STATISTICS OF NON-OECD COUNTRIES: DATABASE DOCUMENTATION (2015 revised edition)
INTERNATIONAL ENERGY AGENCY
Final consumption Flow Short name Definition
Domestic navigation DOMESNAV Includes fuels delivered to vessels of all flags not engaged in international navigation (see international marine bunkers). The domestic/international split should be determined on the basis of port of departure and port of arrival and not by the flag or nationality of the ship. Note that this may include journeys of considerable length between two ports in a coun-try (e.g. San Francisco to Honolulu). Fuel used for ocean, coastal and inland fishing and military consumption are ex-cluded;
Non-specified (transport) TRNONSPE Includes all transport not elsewhere specified. Note: Interna-tional marine bunkers and international aviation bunkers are shown in Supply and are not included in transport as part of final consumption.
Other TOTOTHER Includes residential, commercial/public services, agriculture/forestry, fishing and non-specified (other).
Residential RESIDENT Includes consumption by households, excluding fuels used for transport. Includes households with employed persons [ISIC Rev. 4 Divisions 97 and 98] which is a small part of total residential consumption.
Commercial and public services
COMMPUB [ISIC Rev. 4 Divisions 33, 36-39, 45-47, 52, 53, 55-56, 58-66, 68-75, 77-82, 84 (excluding Class 8422), 85-88, 90-96 and 99]
Agriculture/forestry AGRICULT Includes deliveries to users classified as agriculture, hunting and forestry by the ISIC, and therefore includes energy con-sumed by such users whether for traction (excluding agricul-tural highway use), power or heating (agricultural and domes-tic) [ISIC Rev. 4 Divisions 01 and 02].
Fishing FISHING Includes fuels used for inland, coastal and deep-sea fishing. Fishing covers fuels delivered to ships of all flags that have refuelled in the country (including international fishing) as well as energy used in the fishing industry [ISIC Rev. 4 Divi-sion 03]. Prior to 2007 edition, fishing was included with ag-riculture/forestry and this may continue to be the case for some countries.
Non-specified (other) ONONSPEC Includes all fuel use not elsewhere specified as well as con-sumption in the above-designated categories for which sepa-rate figures have not been provided. Military fuel use for all mobile and stationary consumption is included here (e.g. ships, aircraft, road and energy used in living quarters) regardless of whether the fuel delivered is for the military of that country or for the military of another country.

ENERGY STATISTICS OF NON-OECD COUNTRIES: DATABASE DOCUMENTATION (2015 revised edition) - 17
INTERNATIONAL ENERGY AGENCY
Final consumption Flow Short name Definition
Non-energy use NONENUSE Non-energy use covers those fuels that are used as raw materials in the different sectors and are not consumed as a fuel or trans-formed into another fuel. Non-energy use is shown separately in final consumption under the heading non-energy use. Note that for biomass commodities, only the amounts specifi-cally used for energy purposes (a small part of the total) are included in the energy statistics. Therefore, the non-energy use of biomass is not taken into consideration and the quanti-ties are null by definition.
Non-energy use industry/transformation/energy
NEINTREN Non-energy in industry, transformation processes and energy industry own use.
Memo: Non-energy use chemical/petrochemical
NECHEM The petrochemical industry includes cracking and reforming processes for the purpose of producing ethylene, propylene, bu-tylene, synthesis gas, aromatics, butadene and other hydrocar-bon-based raw materials in processes such as steam cracking, aromatics plants and steam reforming [part of ISIC Rev. 4 Group 201]. Note: this flow was called “of which petrochemical feed-stocks” in previous editions.
Non-energy use in transport NETRANS Non-energy use in transport.
Non-energy use in other NEOTHER Non-energy use in other sectors such as residential, commercial/public services, agriculture/forestry and fishing.

18 - ENERGY STATISTICS OF NON-OECD COUNTRIES: DATABASE DOCUMENTATION (2015 revised edition)
INTERNATIONAL ENERGY AGENCY
Electricity output (GWh) Flow Short name Definition
Electricity output (GWh) ELOUTPUT Shows the total number of GWh generated by power plants separated into electricity plants and CHP plants. Electricity production for hydro pumped storage is also given separately for main activity producers and autoproducers.
Electricity output (GWh)-main activity producer electricity plants
ELMAINE
Electricity output (GWh)-autoproducer electricity plants
ELAUTOE
Electricity output (GWh)-main activity producer CHP plants
ELMAINC
Electricity output (GWh)-autoproducer CHP plants
ELAUTOC
Main activity producers - pumped hydro production (GWh)
MHYDPUMP
Autoproducer - pumped hydro production (GWh)
AHYDPUMP
Heat output (TJ) Flow Short name Definition
Heat output (TJ) HEATOUT Shows the total number of TJ generated by power plants separated into CHP plants and heat plants.
Heat output (TJ)-main activity producer CHP plants
HEMAINC
Heat output (TJ)-autoproducer CHP plants
HEAUTOC
Heat output (TJ)-main activity producer heat plants
HEMAINH
Heat output (TJ)-autoproducer heat plants
HEAUTOH

ENERGY STATISTICS OF NON-OECD COUNTRIES: DATABASE DOCUMENTATION (2015 revised edition) - 19
INTERNATIONAL ENERGY AGENCY
Conversion factors Expressed in tonne of oil equivalent/tonne and in kilojoules/kilogramme; volume to mass in barrels/tonne
Flow Short name Definition
Average net calorific value NAVERAGE Represents the average gross energy content minus the latent heat of vaporisation of 1 unit of mass.
NCV of production NINDPROD Available for coal products, peat, oil shale, and primary oil products.
NCV of other sources NOSOURCES Available for coal products, peat, oil shale, and primary oil products.
NCV of imports NIMPORTS Available for coal products, peat, oil shale, and primary oil products.
NCV of exports NEXPORTS Available for coal products, peat, oil shale, and primary oil products.
NCV of coke ovens NCOKEOVS Only available for coal products, peat, oil shale.
NCV of blast furnaces NBLAST Only available for coal products, peat, oil shale.
NCV in main activity producer electricity plants
NMAIN Only available for coal products, peat, oil shale.
NCV in autoproducer electricity plants
NAUTOELEC Only available for coal products, peat, oil shale.
NCV in main activity CHP plants
NMAINCHP Only available for coal products, peat, oil shale.
NCV in autoproducer CHP plants
NAUTOCHP Only available for coal products, peat, oil shale.
NCV in main activity heat plants
NMAINHEAT Only available for coal products, peat, oil shale.
NCV in autoproducer heat plants
NAUTOHEAT Only available for coal products, peat, oil shale.
NCV in industry NIND Only available for coal products, peat, oil shale.
NCV for other uses NOTHER Only available for coal products, peat, oil shale.
Volume to mass ratio BBLTONRATIO This is the density used to calculate the oil demand by product (in barrels) that is published in Energy Statistics of Non-OECD Countries.

20 - ENERGY STATISTICS OF NON-OECD COUNTRIES: DATABASE DOCUMENTATION (2015 revised edition)
INTERNATIONAL ENERGY AGENCY
Oil demand Expressed in thousand barrels/day (converted from kt using values of barrels/tonne)
Flow Short name Definition
Net inland consumption NETDELIC Obtained from above flows, as:
DOMSUP+TRANSFER+STATDIFF-TPETCHEM-TREFINER-TCOALLIQ-TGTL-EREFINER.
Note that only in this table, net inland consumption in-cludes international aviation bunkers for all countries.
Refinery fuel REFFUEL Equal to EREFINER. It shows oil refineries’ own use of oil products for operation of equipment, heating and lighting. It mainly includes refinery gas, gas/diesel oil and fuel oil.
International marine bunkers MARBUNK Equal to MARBUNK. It shows international marine bunkers consumption of liquid fuels, mainly gas/diesel oil and fuel oil.
Demand DEMAND Sum of the previous three flows.
Note that only in this table, demand includes interna-tional marine and aviation bunkers for all countries.

ENERGY STATISTICS OF NON-OECD COUNTRIES: DATABASE DOCUMENTATION (2015 revised edition) - 21
INTERNATIONAL ENERGY AGENCY
4. PRODUCT DEFINITIONS
Coal With the exception of the coal gases, the fuels in this section are expressed in thousand tonnes. The coal gases
are expressed in terajoules on a gross calorific value basis. Product Short name Definition
Hard coal (if no detail)
HARDCOAL This item is only used if the detailed breakdown is not available. It includes anthracite, coking coal, other bituminous coal and (depend-ing on the country) also may include sub-bituminous coal.
Brown coal (if no detail)
BROWN This item is only used if the detailed breakdown is not available. It includes lignite and (depending on the country) also may include sub-bituminous coal.
Anthracite ANTCOAL Anthracite is a high rank coal used for industrial and residential applica-tions. It has generally less than 10% volatile matter and a high carbon con-tent (about 90% fixed carbon). Its gross calorific value is equal to or great-er than 24 000 kJ/kg on an ash-free but moist basis.
Coking coal COKCOAL Coking coal refers to bituminous coal with a quality that allows the production of a coke suitable to support a blast furnace charge. Its gross calorific value is equal to or greater than 24 000 kJ/kg on an ash-free but moist basis.
Other bituminous coal
BITCOAL Other bituminous coal is used mainly used for steam raising and space heating purposes and includes all bituminous coal that is not included under coking coal nor anthracite. It is characterized by high-er volatile matter than anthracite (more than 10%) and lower carbon content (less than 90% fixed carbon). Its gross calorific value is equal to or greater than 24 000 kJ/kg on an ash-free but moist basis.
Sub-bituminous coal
SUBCOAL Non-agglomerating coal with a gross calorific value between 20 000 kJ/kg and 24 000 kJ/kg containing more than 31% volatile mat-ter on a dry mineral matter-free basis.
Lignite LIGNITE Lignite is a non-agglomerating coal with a gross calorific value of less than 20 000 kJ/kg and greater than 31% volatile matter on a dry mineral matter free basis.
Note: starting with the 2015 edition, oil shale is presented separately and not included with lignite any longer.

22 - ENERGY STATISTICS OF NON-OECD COUNTRIES: DATABASE DOCUMENTATION (2015 revised edition)
INTERNATIONAL ENERGY AGENCY
Coal With the exception of the coal gases, the fuels in this section are expressed in thousand tonnes. The coal gases
are expressed in terajoules on a gross calorific value basis. Product Short name Definition
Patent fuel PATFUEL Patent fuel is a composition fuel manufactured from hard coal fines with the addition of a binding agent. The amount of patent fuel pro-duced may, therefore, be slightly higher than the actual amount of coal consumed in the transformation process. Consumption of patent fuels during the patent fuel manufacturing process is included under energy industry own use.
Coke oven coke OVENCOKE Coke oven coke is the solid product obtained from the carbonisation of coal, principally coking coal, at high temperature. It is low in moisture content and volatile matter. Coke oven coke is used mainly in the iron and steel industry, acting as energy source and chemical agent. Also included are semi-coke (a solid product obtained from the carbonisation of coal at a low temperature), lignite coke (a semi-coke made from lignite), coke breeze and foundry coke. The heading ener-gy industries own use includes the consumption at the coking plants themselves. Consumption in the iron and steel industry does not in-clude coke converted into blast furnace gas. To obtain the total con-sumption of coke oven coke in the iron and steel industry, the quanti-ties converted into blast furnace gas have to be added (these are in-cluded in blast furnaces).
Gas coke GASCOKE Gas coke is a by-product of hard coal used for the production of town gas in gas works. Gas coke is used for heating purposes. Energy in-dustry own use includes the consumption of gas coke at gas works.
Coal tar COALTAR Coal tar is a result of the destructive distillation of bituminous coal or of the low-temperature carbonisation of brown coal. Coal tar from bituminous coal is the liquid by-product of the distillation of coal to make coke in the coke oven process. Coal tar can be further distilled into different organic products (e.g. benzene, toluene, naphthalene), which normally would be reported as a feedstock to the petrochemical industry.
BKB BKB Brown coal briquettes are composition fuels manufactured from lignite, produced by briquetting under high pressure with or without the addi-tion of a binding agent.
Gas works gas GASWKSGS Gas works gas covers all types of gas produced in public utility or pri-vate plants, whose main purpose is the manufacture, transport and dis-tribution of gas. It includes gas produced by carbonisation (including gas produced by coke ovens and transferred to gas works), by total gas-ification (with or without enrichment with oil products) and by reform-ing and simple mixing of gases and/or air.
Coke oven gas COKEOVGS Coke oven gas is obtained as a by-product of the manufacture of coke oven coke for the production of iron and steel.
Blast furnace gas BLFURGS Blast furnace gas is produced during the combustion of coke in blast furnaces in the iron and steel industry. It is recovered and used as a fuel, partly within the plant and partly in other steel industry processes or in power stations equipped to burn it.

ENERGY STATISTICS OF NON-OECD COUNTRIES: DATABASE DOCUMENTATION (2015 revised edition) - 23
INTERNATIONAL ENERGY AGENCY
Coal With the exception of the coal gases, the fuels in this section are expressed in thousand tonnes. The coal gases
are expressed in terajoules on a gross calorific value basis. Product Short name Definition
Other recovered gases
OGASES By-product of the production of steel in an oxygen furnace, recovered on leaving the furnace. The gases are also known as converter gas, LD gas or BOS gas. The quantity of recuperated fuel should be re-ported on a gross calorific value basis. Also covers non-specified manufactured gases not mentioned above, such as combustible gases of solid carbonaceous origin recovered from manufacturing and chemical processes not elsewhere defined.
Peat and peat products The fuels in this section are expressed in thousand tonnes.
Product Short name Definition
Peat PEAT Peat is a combustible soft, porous or compressed, fossil sedimentary deposit of plant origin with high water content (up to 90% in the raw state), easily cut, of light to dark brown colour. Peat used for non-energy purposes is not included here. Milled peat is included here.
Peat products PEATPROD Products such as peat briquettes derived directly or indirectly from sod peat and milled peat.
Oil shale The fuels in this section are expressed in thousand tonnes.
Product Short name Definition
Oil shale and oil sands
OILSHALE Oil shale and oil sands are sedimentary rock which contains organic matter in the form of kerogen. Kerogen is a waxy hydrocarbon-rich material regarded as a precursor of petroleum. Oil shale may be burned directly or processed by heating to extract shale oil. Oil shale and tar sands used as inputs for other transformation processes are also included here (this includes the portion consumed in the trans-formation process). Shale oil and other products derived from lique-faction are included in from other sources under crude oil (other hydrocarbons).

24 - ENERGY STATISTICS OF NON-OECD COUNTRIES: DATABASE DOCUMENTATION (2015 revised edition)
INTERNATIONAL ENERGY AGENCY
Natural gas Natural gas is expressed in terajoules on a gross calorific value basis.
Product Short name Definition
Natural gas NATGAS Natural gas comprises gases, occurring in underground deposits, whether liquefied or gaseous, consisting mainly of methane. It in-cludes both "non-associated" gas originating from fields producing only hydrocarbons in gaseous form, and "associated" gas produced in association with crude oil as well as methane recovered from coal mines (colliery gas) or from coal seams (coal seam gas).
Production represents dry marketable production within national boundaries, including offshore production and is measured after pu-rification and extraction of NGL and sulphur. It includes gas con-sumed by gas processing plants and gas transported by pipeline. Quantities of gas that are re-injected, vented or flared are excluded.
ENERGY STATISTICS OF NON-OECD COUNTRIES: DATABASE DOCUMENTATION (2015 revised edition) - 25
INTERNATIONAL ENERGY AGENCY
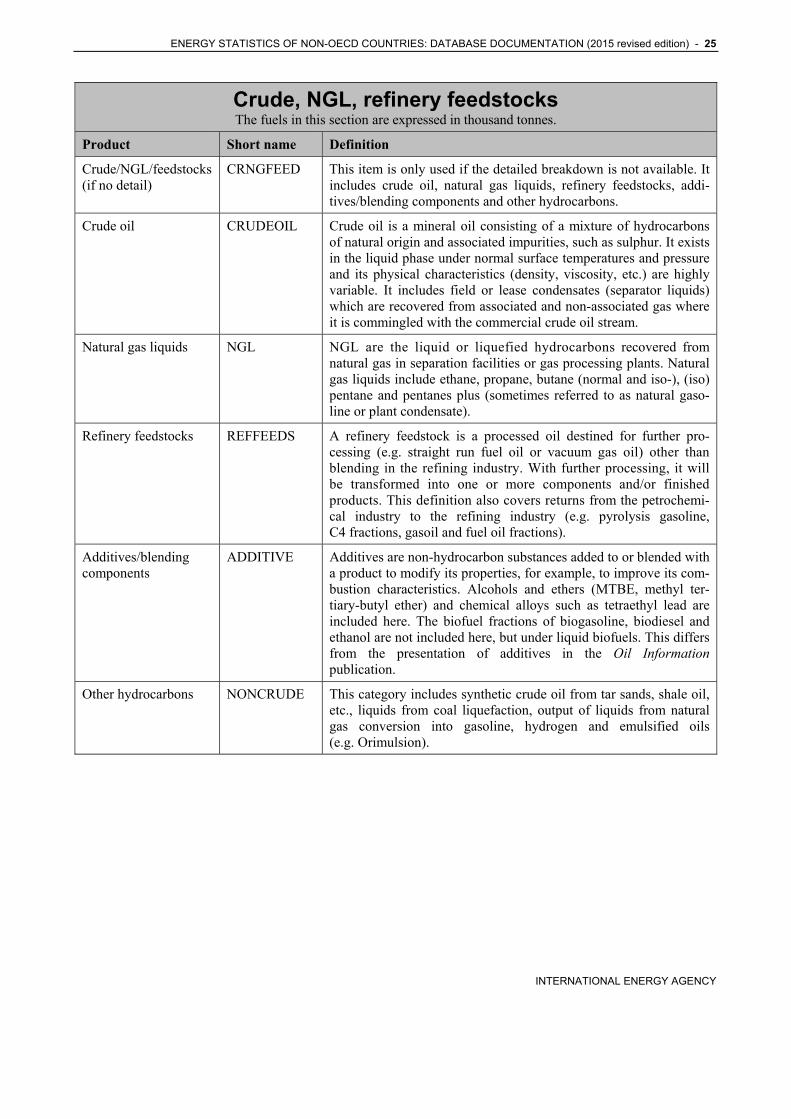
Crude, NGL, refinery feedstocks The fuels in this section are expressed in thousand tonnes.
Product Short name Definition
Crude/NGL/feedstocks (if no detail)
CRNGFEED This item is only used if the detailed breakdown is not available. It includes crude oil, natural gas liquids, refinery feedstocks, addi-tives/blending components and other hydrocarbons.
Crude oil CRUDEOIL Crude oil is a mineral oil consisting of a mixture of hydrocarbons of natural origin and associated impurities, such as sulphur. It exists in the liquid phase under normal surface temperatures and pressure and its physical characteristics (density, viscosity, etc.) are highly variable. It includes field or lease condensates (separator liquids) which are recovered from associated and non-associated gas where it is commingled with the commercial crude oil stream.
Natural gas liquids NGL NGL are the liquid or liquefied hydrocarbons recovered from natural gas in separation facilities or gas processing plants. Natural gas liquids include ethane, propane, butane (normal and iso-), (iso) pentane and pentanes plus (sometimes referred to as natural gaso-line or plant condensate).
Refinery feedstocks REFFEEDS A refinery feedstock is a processed oil destined for further pro-cessing (e.g. straight run fuel oil or vacuum gas oil) other than blending in the refining industry. With further processing, it will be transformed into one or more components and/or finished products. This definition also covers returns from the petrochemi-cal industry to the refining industry (e.g. pyrolysis gasoline, C4 fractions, gasoil and fuel oil fractions).
Additives/blending components
ADDITIVE Additives are non-hydrocarbon substances added to or blended with a product to modify its properties, for example, to improve its com-bustion characteristics. Alcohols and ethers (MTBE, methyl ter-tiary-butyl ether) and chemical alloys such as tetraethyl lead are included here. The biofuel fractions of biogasoline, biodiesel and ethanol are not included here, but under liquid biofuels. This differs from the presentation of additives in the Oil Information publication.
Other hydrocarbons NONCRUDE This category includes synthetic crude oil from tar sands, shale oil, etc., liquids from coal liquefaction, output of liquids from natural gas conversion into gasoline, hydrogen and emulsified oils (e.g. Orimulsion).

26 - ENERGY STATISTICS OF NON-OECD COUNTRIES: DATABASE DOCUMENTATION (2015 revised edition)
INTERNATIONAL ENERGY AGENCY
Oil products The fuels in this section are expressed in thousand tonnes.
Oil products are any oil-based products which can be obtained by distillation and are normally used outside the refining industry. The exceptions to this are those finished products which are classified as refinery feedstocks.
Production of oil products shows gross refinery output for each product.
Refinery fuel (row oil refineries, under energy industry own use) represents consumption of oil products, both intermediate and finished, within refineries, e.g. for heating, lighting, traction, etc. Product Short name Definition
Refinery gas REFINGAS Refinery gas is defined as non-condensable gas obtained during distillation of crude oil or treatment of oil products (e.g. cracking) in refineries. It consists mainly of hydrogen, methane, ethane and olefins. It also includes gases which are returned from the petro-chemical industry. Refinery gas production refers to gross pro-duction. Own consumption is shown separately under oil refiner-ies in energy industry own use.
Ethane ETHANE Ethane is a naturally gaseous straight-chain hydrocarbon (C2H6). It is a colourless paraffinic gas which is extracted from natural gas and refinery gas streams.
Liquefied petroleum gases (LPG)
LPG Liquefied petroleum gases are the light hydrocarbon fraction of the paraffin series, derived from refinery processes, crude oil sta-bilisation plants and natural gas processing plants, comprising propane (C3H8) and butane (C4H10) or a combination of the two. They could also include propylene, butylene, isobutene and iso-butylene. LPG are normally liquefied under pressure for transpor-tation and storage.
Motor gasoline excl. bio
NONBIOGASO
Motor gasoline is light hydrocarbon oil for use in internal com-bustion engines such as motor vehicles, excluding aircraft. Motor gasoline is distilled between 35oC and 215oC and is used as a fuel for land based spark ignition engines. Motor gasoline may in-clude additives, oxygenates and octane enhancers, including lead compounds such as TEL (tetraethyl lead) and TML (tetramethyl lead). Motor gasoline excl bio does not include the liquid biofuel or ethanol blended with gasoline - see liquid biofuels.
Aviation gasoline AVGAS Aviation gasoline is motor spirit prepared especially for aviation piston engines, with an octane number suited to the engine, a freezing point of -60oC, and a distillation range usually within the limits of 30oC and 180oC.
Gasoline type jet fuel
JETGAS Gasoline type jet fuel includes all light hydrocarbon oils for use in aviation turbine power units, which distil between 100oC and 250oC. This fuel is obtained by blending kerosenes and gasoline or naphthas in such a way that the aromatic content does not ex-ceed 25% in volume, and the vapour pressure is between 13.7 kPa and 20.6 kPa. Additives can be included to improve fuel stability and combustibility.

ENERGY STATISTICS OF NON-OECD COUNTRIES: DATABASE DOCUMENTATION (2015 revised edition) - 27
INTERNATIONAL ENERGY AGENCY
Oil products The fuels in this section are expressed in thousand tonnes.
Oil products are any oil-based products which can be obtained by distillation and are normally used outside the refining industry. The exceptions to this are those finished products which are classified as refinery feedstocks.
Production of oil products shows gross refinery output for each product.
Refinery fuel (row oil refineries, under energy industry own use) represents consumption of oil products, both intermediate and finished, within refineries, e.g. for heating, lighting, traction, etc. Product Short name Definition
Kerosene type jet fuel excl bio
NONBIOJETK Kerosene type jet fuel is a medium distillate used for aviation turbine power units. It has the same distillation characteristics and flash point as kerosene (between 150oC and 300oC but not gener-ally above 250oC). In addition, it has particular specifications (such as freezing point) which are established by the International Air Transport Association (IATA). It includes kerosene blending components. Kerosene type jet fuel excluding bio does not in-clude the liquid biofuels blended with jet kerosene.
Other kerosene OTHKERO Kerosene (other than kerosene used for aircraft transport which is included with aviation fuels) comprises refined petroleum distil-late intermediate in volatility between gasoline and gas/diesel oil. It is a medium oil distilling between 150oC and 300oC.
Gas/diesel oil excl. bio
NONBIODIES Gas/diesel oil includes heavy gas oils. Gas oils are obtained from the lowest fraction from atmospheric distillation of crude oil, while heavy gas oils are obtained by vacuum redistillation of the residual from atmospheric distillation. Gas/diesel oil distils be-tween 180oC and 380oC. Several grades are available depending on uses: diesel oil for diesel compression ignition (cars, trucks, marine, etc.), light heating oil for industrial and commercial uses, and other gas oil including heavy gas oils which distil between 380oC and 540oC and which are used as petrochemical feed-stocks. Gas/diesel oil excluding bio does not include the liquid biofuels blended with gas/diesel oil – see liquid biofuels.
Fuel oil RESFUEL Fuel oil defines oils that make up the distillation residue. It com-prises all residual fuel oils, including those obtained by blending. Its kinematic viscosity is above 10 cSt at 80oC. The flash point is always above 50oC and the density is always higher than 0.90 kg/l.
Naphtha NAPHTHA Naphtha is a feedstock destined either for the petrochemical in-dustry (e.g. ethylene manufacture or aromatics production) or for gasoline production by reforming or isomerisation within the re-finery. Naphtha comprises material that distils between 30oC and 210oC. Naphtha imported for blending is shown as an import of naphtha, and then shown in the transfers row as a negative entry for naphtha and a positive entry for the corresponding finished product (e.g. gasoline).

28 - ENERGY STATISTICS OF NON-OECD COUNTRIES: DATABASE DOCUMENTATION (2015 revised edition)
INTERNATIONAL ENERGY AGENCY
Oil products The fuels in this section are expressed in thousand tonnes.
Oil products are any oil-based products which can be obtained by distillation and are normally used outside the refining industry. The exceptions to this are those finished products which are classified as refinery feedstocks.
Production of oil products shows gross refinery output for each product.
Refinery fuel (row oil refineries, under energy industry own use) represents consumption of oil products, both intermediate and finished, within refineries, e.g. for heating, lighting, traction, etc. Product Short name Definition
White spirit & SBP WHITESP White spirit and SBP are refined distillate intermediates with a distillation in the naphtha/kerosene range. White Spirit has a flash point above 30oC and a distillation range of 135oC to 200oC. In-dustrial Spirit (SBP) comprises light oils distilling between 30oC and 200oC, with a temperature difference between 5% vol-ume and 90% volume distillation points, including losses, of not more than 60oC. In other words, SBP is a light oil of narrower cut than motor spirit. There are seven or eight grades of industrial spirit, depending on the position of the cut in the distillation range defined above.
Lubricants LUBRIC Lubricants are hydrocarbons produced from distillate or residue; they are mainly used to reduce friction between bearing surfaces. This category includes all finished grades of lubricating oil, from spindle oil to cylinder oil, and those used in greases, including motor oils and all grades of lubricating oil base stocks.
Bitumen BITUMEN Bitumen is a solid, semi-solid or viscous hydrocarbon with a col-loidal structure that is brown to black in colour. It is obtained by vacuum distillation of oil residues from atmospheric distillation of crude oil. Bitumen is often referred to as asphalt and is primar-ily used for surfacing of roads and for roofing material. This cate-gory includes fluidised and cut back bitumen.
Paraffin waxes PARWAX Paraffin waxes are saturated aliphatic hydrocarbons. These waxes are residues extracted when dewaxing lubricant oils, and they have a crystalline structure which is more or less fine according to the grade. Their main characteristics are that they are colour-less, odourless and translucent, with a melting point above 45oC.
Petroleum coke PETCOKE Petroleum coke is defined as a black solid residue, obtained mainly by cracking and carbonising of petroleum derived feed-stocks, vacuum bottoms, tar and pitches in processes such as de-layed coking or fluid coking. It consists mainly of carbon (90 to 95%) and has a low ash content. It is used as a feedstock in coke ovens for the steel industry, for heating purposes, for electrode manufacture and for production of chemicals. The two most im-portant qualities are "green coke" and "calcinated coke". This category also includes "catalyst coke" deposited on the catalyst during refining processes: this coke is not recoverable and is usu-ally burned as refinery fuel.
Non-specified oil products
ONONSPEC Other oil products not classified above (e.g. tar, sulphur and grease) are included here. This category also includes aromatics (e.g. BTX or benzene, toluene and xylene) and olefins (e.g. pro-pylene) produced within refineries.
ENERGY STATISTICS OF NON-OECD COUNTRIES: DATABASE DOCUMENTATION (2015 revised edition) - 29
INTERNATIONAL ENERGY AGENCY
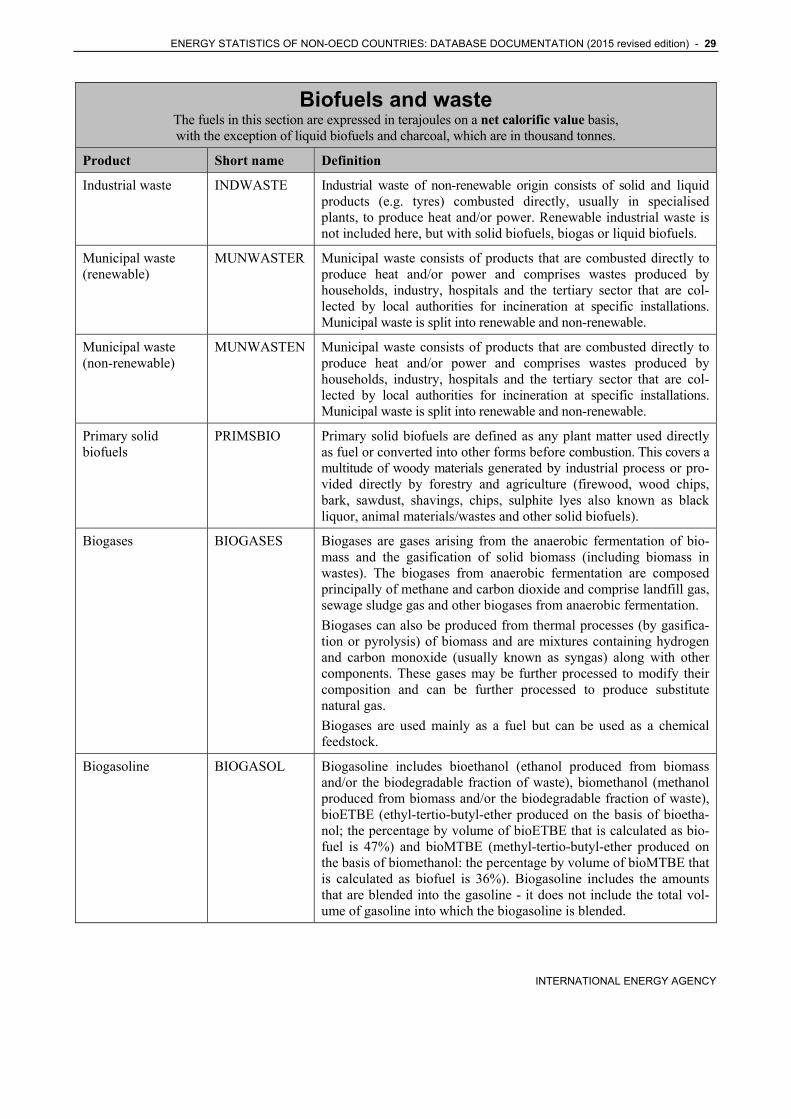
Biofuels and waste The fuels in this section are expressed in terajoules on a net calorific value basis, with the exception of liquid biofuels and charcoal, which are in thousand tonnes.
Product Short name Definition
Industrial waste INDWASTE Industrial waste of non-renewable origin consists of solid and liquid products (e.g. tyres) combusted directly, usually in specialised plants, to produce heat and/or power. Renewable industrial waste is not included here, but with solid biofuels, biogas or liquid biofuels.
Municipal waste (renewable)
MUNWASTER Municipal waste consists of products that are combusted directly to produce heat and/or power and comprises wastes produced by households, industry, hospitals and the tertiary sector that are col-lected by local authorities for incineration at specific installations. Municipal waste is split into renewable and non-renewable.
Municipal waste (non-renewable)
MUNWASTEN Municipal waste consists of products that are combusted directly to produce heat and/or power and comprises wastes produced by households, industry, hospitals and the tertiary sector that are col-lected by local authorities for incineration at specific installations. Municipal waste is split into renewable and non-renewable.
Primary solid biofuels
PRIMSBIO
Primary solid biofuels are defined as any plant matter used directly as fuel or converted into other forms before combustion. This covers a multitude of woody materials generated by industrial process or pro-vided directly by forestry and agriculture (firewood, wood chips, bark, sawdust, shavings, chips, sulphite lyes also known as black liquor, animal materials/wastes and other solid biofuels).
Biogases BIOGASES
Biogases are gases arising from the anaerobic fermentation of bio-mass and the gasification of solid biomass (including biomass in wastes). The biogases from anaerobic fermentation are composed principally of methane and carbon dioxide and comprise landfill gas, sewage sludge gas and other biogases from anaerobic fermentation.
Biogases can also be produced from thermal processes (by gasifica-tion or pyrolysis) of biomass and are mixtures containing hydrogen and carbon monoxide (usually known as syngas) along with other components. These gases may be further processed to modify their composition and can be further processed to produce substitute natural gas.
Biogases are used mainly as a fuel but can be used as a chemical feedstock.
Biogasoline BIOGASOL Biogasoline includes bioethanol (ethanol produced from biomass and/or the biodegradable fraction of waste), biomethanol (methanol produced from biomass and/or the biodegradable fraction of waste), bioETBE (ethyl-tertio-butyl-ether produced on the basis of bioetha-nol; the percentage by volume of bioETBE that is calculated as bio-fuel is 47%) and bioMTBE (methyl-tertio-butyl-ether produced on the basis of biomethanol: the percentage by volume of bioMTBE that is calculated as biofuel is 36%). Biogasoline includes the amounts that are blended into the gasoline - it does not include the total vol-ume of gasoline into which the biogasoline is blended.

30 - ENERGY STATISTICS OF NON-OECD COUNTRIES: DATABASE DOCUMENTATION (2015 revised edition)
INTERNATIONAL ENERGY AGENCY
Biofuels and waste The fuels in this section are expressed in terajoules on a net calorific value basis, with the exception of liquid biofuels and charcoal, which are in thousand tonnes.
Product Short name Definition
Biodiesels BIODIESEL Biodiesels includes biodiesel (a methyl-ester produced from vegeta-ble or animal oil, of diesel quality), biodimethylether (dimethylether produced from biomass), Fischer Tropsh (Fischer Tropsh produced from biomass), cold pressed bio-oil (oil produced from oil seed through mechanical processing only) and all other liquid biofuels which are added to, blended with or used straight as transport diesel. Biodiesels includes the amounts that are blended into the diesel - it does not include the total volume of diesel into which the biodiesel is blended.
Other liquid biofuels OBIOLIQ Other liquid biofuels includes liquid biofuels not reported in either biogasoline or biodiesels.
Non-specified primary biofuels/waste
RENEWNS This item is used when the detailed breakdown for primary combus-tible renewables and wastes is not available.
Charcoal CHARCOAL It covers the solid residue of the destructive distillation and pyrolysis of wood and other vegetal material.

ENERGY STATISTICS OF NON-OECD COUNTRIES: DATABASE DOCUMENTATION (2015 revised edition) - 31
INTERNATIONAL ENERGY AGENCY
Electricity and heat Electricity is expressed in gigawatt hours and heat is expressed in terajoules.
Direct use of geothermal and solar thermal is in terajoules on a net calorific value basis. Product Short name Definition
Elec/heat output from non-specified manufactured gases
MANGAS This item is only used if the detailed breakdown is not available. It includes coke oven gas, blast furnace gas and oxygen steel furnace gas. Gas works gas is not included here.
Heat output from non-specified com-bustible fuels
HEATNS This item is only used if the detailed breakdown is not available.
Nuclear NUCLEAR Energy released by nuclear fission or nuclear fusion.
Hydro HYDRO Hydro energy represents the potential and kinetic energy of water converted into electricity in hydroelectric plants.
Geothermal GEOTHERM Geothermal energy is the energy available as heat emitted from with-in the earth’s crust, usually in the form of hot water or steam. It is exploited at suitable sites:
for electricity generation using dry stream or high enthalpy brine after flashing
directly as heat for district heating, agriculture, etc.
Solar photovoltaics SOLARPV Electricity from photovoltaic cells.
Solar thermal SOLARTH Solar energy is the solar radiation exploited for hot water production and electricity generation, by:
flat plate collectors, mainly of the thermosyphon type, for domes-tic hot water or for the seasonal heating of swimming pools
solar thermal-electric plants
Passive solar energy for the direct heating, cooling and lighting of dwellings or other buildings is not included.
Tide, wave and ocean
TIDE Tide, wave and ocean represents the mechanical energy derived from tidal movement, wave motion or ocean current and exploited for electricity generation.
Wind WIND Wind energy represents the kinetic energy of wind exploited for electricity generation in wind turbines.
Heat pumps HEATPUMP Heat pumps should include the inputs and outputs to heat pumps corresponding to the amount of heat that is sold to third parties.
Electric boilers BOILER Electric boilers should include the inputs and outputs to electric boil-ers corresponding to the amount of heat that is sold to third parties.
Heat from chemical sources
CHEMHEAT Heat from chemical sources corresponds to heat originating from processes without input energy, such as a chemical reaction (e.g. the treatment of zinc oxide ore with hydrochloric acid). Note that waste heat originating from energy driven processes is not considered as a primary energy source and is included with the heat produced from the corresponding fuel.

32 - ENERGY STATISTICS OF NON-OECD COUNTRIES: DATABASE DOCUMENTATION (2015 revised edition)
INTERNATIONAL ENERGY AGENCY
Electricity and heat Electricity is expressed in gigawatt hours and heat is expressed in terajoules.
Direct use of geothermal and solar thermal is in terajoules on a net calorific value basis. Product Short name Definition
Other sources OTHER Other sources includes production not included elsewhere such as fuel cells.
Electricity ELECTR Gross electricity production is measured at the terminals of all alter-nator sets in a station; it therefore includes the energy taken by sta-tion auxiliaries and losses in transformers that are considered integral parts of the station.
The difference between gross and net production is generally esti-mated as 7% for conventional thermal stations, 1% for hydro sta-tions, and 6% for nuclear, geothermal and solar stations. Production in hydro stations includes production from pumped storage plants.
Heat HEAT Heat production includes all heat produced by main activity producer CHP and heat plants, as well as heat sold by autoproducer CHP and heat plants to third parties.
Fuels used to produce quantities of heat for sale are included in transformation processes under the rows CHP plants and Heat plants. The use of fuels for heat which is not sold is included under the sectors in which the fuel use occurs.

ENERGY STATISTICS OF NON-OECD COUNTRIES: DATABASE DOCUMENTATION (2015 revised edition) - 33
INTERNATIONAL ENERGY AGENCY
Oil demand Expressed in thousand barrels/day (converted from kt using values of barrels/tonne)
Flow Short name Definition
NGL/LPG NGL/LPG NGL+LPG+ETHANE
Naphtha NAPHTHA NAPHTHA
Motor gasoline MOTORGAS MOTORGAS+ADDITIVE+BIOGASOL+OBIOLIQ
Aviation fuels JETKERO JETKERO+AVGAS+JETGAS
Other kerosene OTHKERO OTHKERO
Gas/diesel oil GASDIES GASDIES+BIODIESEL
Fuel oil RESFUEL RESFUEL
Other products OPRODS WHITESP+LUBRIC+BITUMEN+PARWAX+
PETCOKE+ONONSPEC+CRUDEOIL+NONCRUDE
+REFINGAS
Total products TOTPRODS Sum of all products.

34 - ENERGY STATISTICS OF NON-OECD COUNTRIES: DATABASE DOCUMENTATION (2015 revised edition)
INTERNATIONAL ENERGY AGENCY
5. GEOGRAPHICAL COVERAGE
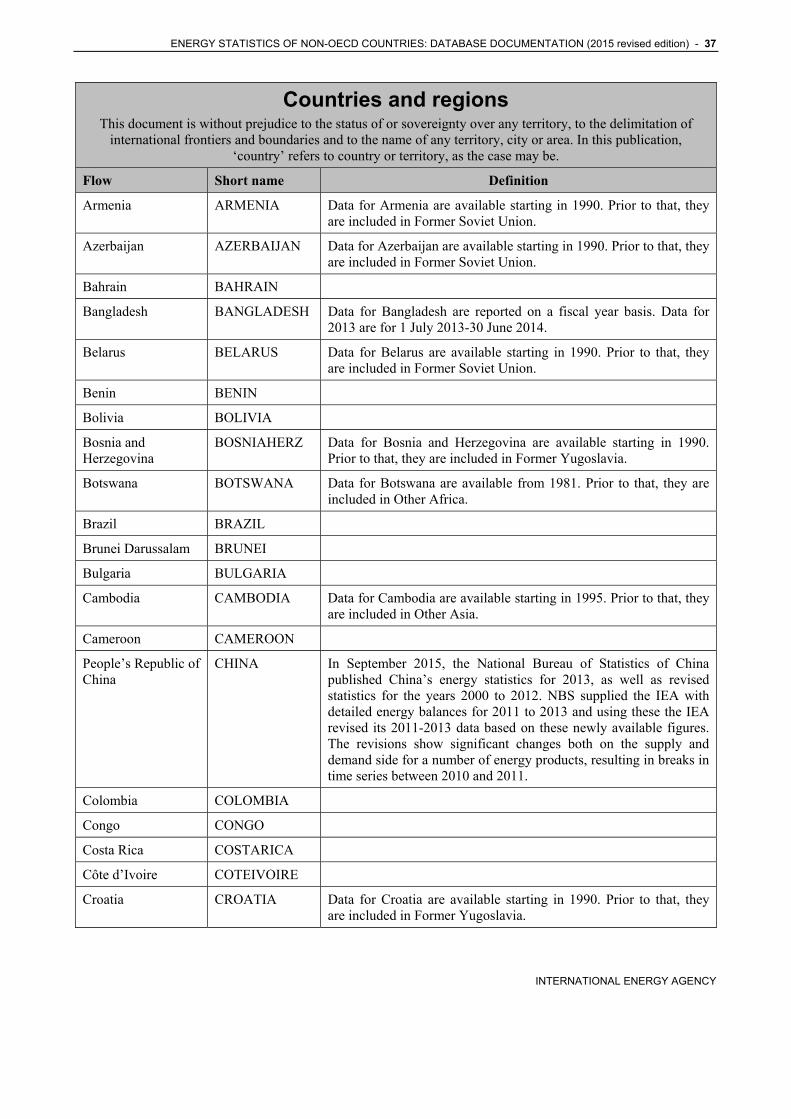
Countries and regions This document is without prejudice to the status of or sovereignty over any territory, to the delimitation of
international frontiers and boundaries and to the name of any territory, city or area. In this publication, ‘country’ refers to country or territory, as the case may be.
Flow Short name Definition
World WORLD Includes OECD Total; Africa; Asia (excluding China); China (P.R. of China and Hong Kong, China); Non-OECD Americas; Middle East; Non-OECD Europe and Eurasia; World aviation bunkers and World marine bunkers.
Due to the revisions made to 2011 to 2013 there is a break in time series for People's Republic of China between 2010 and 2011. As such, changes between 2010 and 2011 in World data should also be used with caution.
OECD Total OECDTOT Includes Australia; Austria; Belgium; Canada; Chile; Czech Republic; Denmark; Estonia; Finland; France; Germany; Greece; Hungary; Iceland; Ireland; Israel 1 ; Italy; Japan; Korea; Luxembourg; Mexico; the Netherlands; New Zealand; Norway; Poland; Portugal; Slovak Republic; Slovenia; Spain; Sweden; Switzerland; Turkey; United Kingdom and United States. Estonia and Slovenia are included starting in 1990. Prior to 1990, Estonia is included in Former Soviet Union and Slovenia is included in Former Yugoslavia.
Within the OECD:
Australia excludes the overseas territories;
Denmark excludes Greenland and the Faroes Islands, except prior to 1990, where data on oil for Greenland were included with the Danish statistics. The administration is planning to revise the series back to 1974 to exclude these amounts;
France includes Monaco, and excludes Andorra and the overseas territories: Guadeloupe; Martinique; French Guiana; Réunion; St.-Pierre and Miquelon; New Caledonia; French Polynesia; Wallis and Futuna and Mayotte;
1. The statistical data for Israel are supplied by and under the responsibility of the relevant Israeli authorities. The use of such data by the OECD is without prejudice to the status of the Golan Heights, East Jerusalem and Israeli settlements in the West Bank under the terms of international law.
ENERGY STATISTICS OF NON-OECD COUNTRIES: DATABASE DOCUMENTATION (2015 revised edition) - 35
INTERNATIONAL ENERGY AGENCY
Countries and regions This document is without prejudice to the status of or sovereignty over any territory, to the delimitation of
international frontiers and boundaries and to the name of any territory, city or area. In this publication, ‘country’ refers to country or territory, as the case may be.
Flow Short name Definition
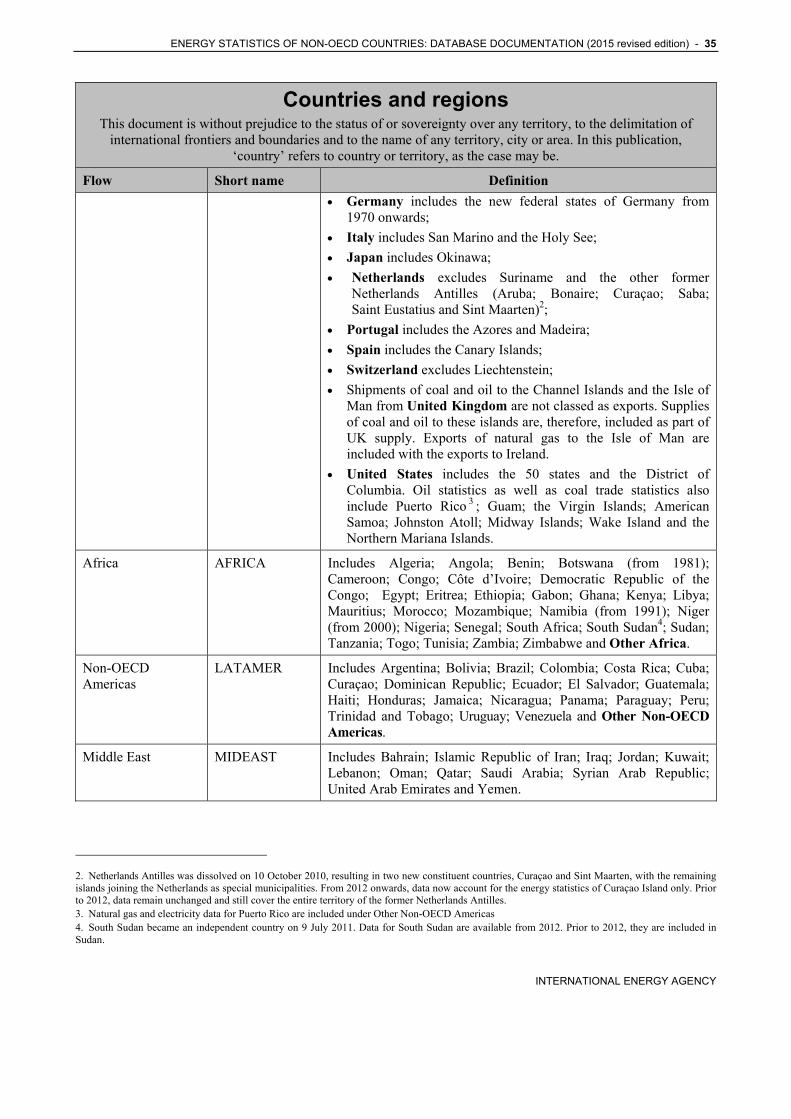
Germany includes the new federal states of Germany from 1970 onwards;
Italy includes San Marino and the Holy See;
Japan includes Okinawa;
Netherlands excludes Suriname and the other former Netherlands Antilles (Aruba; Bonaire; Curaçao; Saba; Saint Eustatius and Sint Maarten)2;
Portugal includes the Azores and Madeira;
Spain includes the Canary Islands;
Switzerland excludes Liechtenstein;
Shipments of coal and oil to the Channel Islands and the Isle of Man from United Kingdom are not classed as exports. Supplies of coal and oil to these islands are, therefore, included as part of UK supply. Exports of natural gas to the Isle of Man are included with the exports to Ireland.
United States includes the 50 states and the District of Columbia. Oil statistics as well as coal trade statistics also include Puerto Rico 3 ; Guam; the Virgin Islands; American Samoa; Johnston Atoll; Midway Islands; Wake Island and the Northern Mariana Islands.
Africa AFRICA Includes Algeria; Angola; Benin; Botswana (from 1981); Cameroon; Congo; Côte d’Ivoire; Democratic Republic of the Congo; Egypt; Eritrea; Ethiopia; Gabon; Ghana; Kenya; Libya; Mauritius; Morocco; Mozambique; Namibia (from 1991); Niger (from 2000); Nigeria; Senegal; South Africa; South Sudan4; Sudan; Tanzania; Togo; Tunisia; Zambia; Zimbabwe and Other Africa.
Non-OECD Americas
LATAMER Includes Argentina; Bolivia; Brazil; Colombia; Costa Rica; Cuba; Curaçao; Dominican Republic; Ecuador; El Salvador; Guatemala; Haiti; Honduras; Jamaica; Nicaragua; Panama; Paraguay; Peru; Trinidad and Tobago; Uruguay; Venezuela and Other Non-OECD Americas.
Middle East MIDEAST Includes Bahrain; Islamic Republic of Iran; Iraq; Jordan; Kuwait; Lebanon; Oman; Qatar; Saudi Arabia; Syrian Arab Republic; United Arab Emirates and Yemen.
2. Netherlands Antilles was dissolved on 10 October 2010, resulting in two new constituent countries, Curaçao and Sint Maarten, with the remaining islands joining the Netherlands as special municipalities. From 2012 onwards, data now account for the energy statistics of Curaçao Island only. Prior to 2012, data remain unchanged and still cover the entire territory of the former Netherlands Antilles. 3. Natural gas and electricity data for Puerto Rico are included under Other Non-OECD Americas 4. South Sudan became an independent country on 9 July 2011. Data for South Sudan are available from 2012. Prior to 2012, they are included in Sudan.

36 - ENERGY STATISTICS OF NON-OECD COUNTRIES: DATABASE DOCUMENTATION (2015 revised edition)
INTERNATIONAL ENERGY AGENCY
Countries and regions This document is without prejudice to the status of or sovereignty over any territory, to the delimitation of
international frontiers and boundaries and to the name of any territory, city or area. In this publication, ‘country’ refers to country or territory, as the case may be.
Flow Short name Definition
Non-OECD Europe and Eurasia
EURASIA Includes Albania; Armenia; Azerbaijan; Belarus; Bosnia and Herzegovina; Bulgaria; Croatia; Cyprus 5 ; Former Yugoslav Republic of Macedonia (Former Yugoslav Republic of Macedonia); Georgia; Gibraltar; Kazakhstan; Kosovo; Kyrgyzstan; Latvia; Lithuania; Malta; Moldova; Montenegro; Romania; Russian Federation; Serbia6; Tajikistan; Turkmenistan; Ukraine; Uzbekistan; Former Soviet Union and Former Yugoslavia.
Asia (excluding China)
ASIA Includes Bangladesh; Brunei Darussalam; Cambodia (from 1995); DPR of Korea; India; Indonesia; Malaysia; Mongolia (from 1985); Myanmar; Nepal; Pakistan; Philippines; Singapore; Sri Lanka; Chinese Taipei; Thailand; Viet Nam and Other Asia.
China (including Hong Kong)
CHINAREG Includes the People’s Republic of China and Hong Kong, China.
Due to the revisions made to 2011 to 2013 there is a break in time series for People's Republic of China between 2010 and 2011. As such, changes between 2010 and 2011 in China data should also be used with caution.
World marine bunkers
WORLDMAR Due to the structure of the database, World marine bunkers are reported both as a flow and as an entity similar to a country or a region. World marine bunkers represents the sum of International marine bunkers from all countries. Therefore, World marine bunkers is not applicable for individual countries and regions, and it is included in transport for the world total.
World aviation bunkers
WORLDAV Due to the structure of the database, World aviation bunkers is reported both as a flow and as an entity similar to a country or a region. World aviation bunkers represents the sum of International aviation bunkers from all countries. Therefore, World aviation bunkers is not applicable for individual countries and regions, and it is included in transport for the world total.
Albania ALBANIA
Algeria ALGERIA
Angola ANGOLA
Argentina ARGENTINA
5. Note by Turkey: The information in this document with reference to “Cyprus” relates to the southern part of the Island. There is no single authority representing both Turkish and Greek Cypriot people on the Island. Turkey recognises the Turkish Republic of Northern Cyprus (TRNC). Until a lasting and equitable solution is found within the context of the United Nations, Turkey shall preserve its position concerning the “Cyprus issue”. Note by all the European Union Member States of the OECD and the European Union: The Republic of Cyprus is recognised by all members of the United Nations with the exception of Turkey. The information in this document relates to the area under the effective control of the Government of the Republic of Cyprus. 6. Serbia includes Montenegro until 2004 and Kosovo until 1999.
ENERGY STATISTICS OF NON-OECD COUNTRIES: DATABASE DOCUMENTATION (2015 revised edition) - 37
INTERNATIONAL ENERGY AGENCY
Countries and regions This document is without prejudice to the status of or sovereignty over any territory, to the delimitation of
international frontiers and boundaries and to the name of any territory, city or area. In this publication, ‘country’ refers to country or territory, as the case may be.
Flow Short name Definition
Armenia ARMENIA Data for Armenia are available starting in 1990. Prior to that, they are included in Former Soviet Union.
Azerbaijan AZERBAIJAN Data for Azerbaijan are available starting in 1990. Prior to that, they are included in Former Soviet Union.
Bahrain BAHRAIN
Bangladesh BANGLADESH Data for Bangladesh are reported on a fiscal year basis. Data for 2013 are for 1 July 2013-30 June 2014.
Belarus BELARUS Data for Belarus are available starting in 1990. Prior to that, they are included in Former Soviet Union.
Benin BENIN
Bolivia BOLIVIA
Bosnia and Herzegovina
BOSNIAHERZ Data for Bosnia and Herzegovina are available starting in 1990. Prior to that, they are included in Former Yugoslavia.
Botswana BOTSWANA Data for Botswana are available from 1981. Prior to that, they are included in Other Africa.
Brazil BRAZIL
Brunei Darussalam BRUNEI
Bulgaria BULGARIA
Cambodia CAMBODIA Data for Cambodia are available starting in 1995. Prior to that, they are included in Other Asia.
Cameroon CAMEROON
People’s Republic of China
CHINA In September 2015, the National Bureau of Statistics of China published China’s energy statistics for 2013, as well as revised statistics for the years 2000 to 2012. NBS supplied the IEA with detailed energy balances for 2011 to 2013 and using these the IEA revised its 2011-2013 data based on these newly available figures. The revisions show significant changes both on the supply and demand side for a number of energy products, resulting in breaks in time series between 2010 and 2011.
Colombia COLOMBIA
Congo CONGO
Costa Rica COSTARICA
Côte d’Ivoire COTEIVOIRE
Croatia CROATIA Data for Croatia are available starting in 1990. Prior to that, they are included in Former Yugoslavia.

38 - ENERGY STATISTICS OF NON-OECD COUNTRIES: DATABASE DOCUMENTATION (2015 revised edition)
INTERNATIONAL ENERGY AGENCY
Countries and regions This document is without prejudice to the status of or sovereignty over any territory, to the delimitation of
international frontiers and boundaries and to the name of any territory, city or area. In this publication, ‘country’ refers to country or territory, as the case may be.
Flow Short name Definition
Cuba CUBA
Curaçao CURACAO The Netherlands Antilles was dissolved on 10 October 2010, resulting in two new constituent countries, Curaçao and Sint Maarten, with the remaining islands joining the Netherlands as special municipalities. From 2012 onwards, data now account for the energy statistics of Curaçao Island only. Prior to 2012, data remain unchanged and still cover the entire territory of the former Netherlands Antilles.
Cyprus CYPRUS Note by Turkey:
The information in this document with reference to “Cyprus” relates to the southern part of the Island. There is no single authority representing both Turkish and Greek Cypriot people on the Island. Turkey recognizes the Turkish Republic of Northern Cyprus (TRNC). Until a lasting and equitable solution is found within the context of the United Nations, Turkey shall preserve its position concerning the “Cyprus” issue.
Note by all the European Union Member States of the OECD and the European Union:
The Republic of Cyprus is recognised by all members of the United Nations with the exception of Turkey. The information in this report relates to the area under the effective control of the Government of the Republic of Cyprus.
Democratic People’s Republic of Korea
KOREADPR
Democratic Republic of the Congo
CONGOREP
Dominican Republic DOMINICANR
Ecuador ECUADOR
Egypt EGYPT Data for Egypt are reported on a fiscal year basis. Data for 2013 are for 1 July 2013-30 June 2014.
El Salvador ELSALVADOR
Eritrea ERITREA Data for Eritrea are available from 1992. Prior to that, they are included in Ethiopia.
Ethiopia ETHIOPIA Ethiopia includes Eritrea prior to 1992.
Former Yugoslav Rep. of Macedonia
FYROM Data for Former Yugoslav Republic Of Macedonia are available starting in 1990. Prior to that, they are included in Former Yugoslavia.

ENERGY STATISTICS OF NON-OECD COUNTRIES: DATABASE DOCUMENTATION (2015 revised edition) - 39
INTERNATIONAL ENERGY AGENCY
Countries and regions This document is without prejudice to the status of or sovereignty over any territory, to the delimitation of
international frontiers and boundaries and to the name of any territory, city or area. In this publication, ‘country’ refers to country or territory, as the case may be.
Flow Short name Definition
Gabon GABON
Georgia GEORGIA Data for Georgia are available starting in 1990. Prior to that, they are included in Former Soviet Union.
Ghana GHANA
Gibraltar GIBRALTAR
Guatemala GUATEMALA
Haiti HAITI
Honduras HONDURAS
Hong Kong, China HONGKONG
India INDIA Data are reported on a fiscal year basis. Data for 2013 are for 1 April 2013-31 March 2014.
Indonesia INDONESIA
Islamic Republic of Iran
IRAN Data are reported according to the Iranian calendar year. Data for 2013 correspond to 20 March 2013 – 19 March 2014.
Iraq IRAQ
Jamaica JAMAICA
Jordan JORDAN
Kazakhstan KAZAKHSTAN Data for Kazakhstan are available starting in 1990. Prior to that, they are included in Former Soviet Union.
Kenya KENYA
Kosovo KOSOVO Data for Kosovo are available starting in 2000. Between 1990 and 1999, data for Kosovo are included in Serbia. Prior to 1990, they are included in Former Yugoslavia.
Kuwait KUWAIT
Kyrgyzstan KYRGYZSTAN Data for Kyrgyzstan are available starting in 1990. Prior to that, they are included in Former Soviet Union.
Latvia LATVIA Data for Latvia are available starting in 1990. Prior to that, they are included in Former Soviet Union.
Lebanon LEBANON
Libya LIBYA
Lithuania LITHUANIA Data for Lithuania are available starting in 1990. Prior to that, they are included in Former Soviet Union.
Malaysia MALAYSIA

40 - ENERGY STATISTICS OF NON-OECD COUNTRIES: DATABASE DOCUMENTATION (2015 revised edition)
INTERNATIONAL ENERGY AGENCY
Countries and regions This document is without prejudice to the status of or sovereignty over any territory, to the delimitation of
international frontiers and boundaries and to the name of any territory, city or area. In this publication, ‘country’ refers to country or territory, as the case may be.
Flow Short name Definition
Malta MALTA
Mauritius MAURITIUS
Moldova MOLDOVA Data for Moldova are available starting in 1990. Prior to that, they are included in Former Soviet Union.
Mongolia MONGOLIA Data for Mongolia are available starting in 1985. Prior to that, they are included in Other Asia.
Montenegro MONTENEGRO Data for Montenegro are available starting in 2005. Between 1990 and 2004, data for Montenegro are included in Serbia. Prior to 1990, they are included in Former Yugoslavia.
Morocco MOROCCO
Mozambique MOZAMBIQUE
Myanmar MYANMAR
Namibia NAMIBIA Data for Namibia are available starting in 1991. Prior to that, data are included in Other Africa.
Nepal NEPAL Data for Nepal are reported on a fiscal year basis.
Nicaragua NICARAGUA
Niger NIGER Prior to 2000, data for Niger are presented in Other Africa.
Nigeria NIGERIA
Oman OMAN
Pakistan PAKISTAN
Panama PANAMA
Paraguay PARAGUAY
Peru PERU
Philippines PHILIPPINE
Qatar QATAR
Romania ROMANIA
Russian Federation RUSSIA Data for Russia are available starting in 1990. Prior to that, they are included in Former Soviet Union.
Saudi Arabia SAUDIARABI
Senegal SENEGAL
Serbia SERBIA Data for Serbia are available starting in 1990. Prior to that, they are included in Former Yugoslavia. Serbia includes Montenegro until 2004 and Kosovo until 1999.

ENERGY STATISTICS OF NON-OECD COUNTRIES: DATABASE DOCUMENTATION (2015 revised edition) - 41
INTERNATIONAL ENERGY AGENCY
Countries and regions This document is without prejudice to the status of or sovereignty over any territory, to the delimitation of
international frontiers and boundaries and to the name of any territory, city or area. In this publication, ‘country’ refers to country or territory, as the case may be.
Flow Short name Definition
Singapore SINGAPORE
South Africa SOUTHAFRIC
South Sudan SSUDAN Data for South Sudan are available from 2012. Prior to 2012, they are included in Sudan.
Sri Lanka SRILANKA
Sudan SUDAN South Sudan became an independent country on 9 July 2011. From 2012, data for South Sudan are reported separately.
Syrian Arab Republic
SYRIA
Chinese Taipei TAIPEI
Tajikistan TAJIKISTAN Data for Tajikistan are available starting in 1990. Prior to that, they are included in Former Soviet Union.
Tanzania TANZANIA
Thailand THAILAND
Togo TOGO
Trinidad and Tobago
TRINIDAD
Tunisia TUNISIA
Turkmenistan TURKMENIST Data for Turkmenistan are available starting in 1990. Prior to that, they are included in Former Soviet Union.
Ukraine UKRAINE Data for Ukraine are available starting in 1990. Prior to that, they are included in Former Soviet Union.
United Arab Emirates
UAE
Uruguay URUGUAY
Uzbekistan UZBEKISTAN Data for Uzbekistan are available starting in 1990. Prior to that, they are included in Former Soviet Union.
Venezuela VENEZUELA
Viet Nam VIETNAM
Yemen YEMEN
Zambia ZAMBIA
Zimbabwe ZIMBABWE

42 - ENERGY STATISTICS OF NON-OECD COUNTRIES: DATABASE DOCUMENTATION (2015 revised edition)
INTERNATIONAL ENERGY AGENCY
Countries and regions This document is without prejudice to the status of or sovereignty over any territory, to the delimitation of
international frontiers and boundaries and to the name of any territory, city or area. In this publication, ‘country’ refers to country or territory, as the case may be.
Flow Short name Definition
Former Soviet Union (if no detail)
FSUND Before 1990, includes Armenia; Azerbaijan; Belarus; Estonia; Georgia; Kazakhstan; Kyrgyzstan; Latvia; Lithuania; Moldova; Russian Federation; Tajikistan; Turkmenistan; Ukraine and Uzbekistan.
Former Yugoslavia (if no detail)
YUGOND Before 1990, includes Bosnia and Herzegovina; Croatia; Former Yugoslav Republic of Macedonia; Kosovo; Montenegro; Slovenia and Serbia.
Other Africa OTHERAFRIC Includes Botswana (until 1980); Burkina Faso; Burundi; Cape Verde; Central African Republic; Chad; Comoros; Djibouti; Equatorial Guinea; Gambia; Guinea; Guinea-Bissau; Lesotho; Liberia; Madagascar; Malawi; Mali; Mauritania; Namibia (until 1990);Niger (until 1999) Réunion; Rwanda; Sao Tome and Principe; Seychelles; Sierra Leone; Somalia; Swaziland; and Uganda.
Other Non-OECD Americas
OTHERLATIN Includes Antigua and Barbuda; Aruba; Bahamas; Barbados; Belize; Bermuda; British Virgin Islands; Cayman Islands; Dominica; Falkland Islands (Malvinas); French Guiana; Grenada; Guadeloupe; Guyana; Martinique; Montserrat; Puerto Rico7 (for natural gas and electricity); St. Kitts and Nevis; Saint Lucia; Saint Pierre et Miquelon; St. Vincent and the Grenadines; Suriname; Turks and Caicos Islands; Bonaire (from 2012); Saba (from 2012); Saint Eustratius (from 2012); and Sint Maarten (from 2012).
Other Asia OTHERASIA Includes Afghanistan; Bhutan; Cambodia (until 1994); Cook Islands; East Timor; Fiji; French Polynesia; Kiribati; Lao People’s Democratic Republic; Macau, China; Maldives; Mongolia (until 1984); New Caledonia; Palau (from 1994); Papua New Guinea; Samoa; Solomon Islands; Tonga and Vanuatu.
Memo: Non-OECD Total
NOECDTOT Includes Africa; Asia (excluding China); China (P.R. of China and Hong Kong, China); Non-OECD Americas; Middle East and Non-OECD Europe and Eurasia.
Due to the revisions made to 2011 to 2013 there is a break in time series for People's Republic of China between 2010 and 2011. As such, changes between 2010 and 2011 in Non-OECD Total data should also be used with caution.
7. Oil statistics as well as coal trade statistics for Puerto Rico are included under the United States.

ENERGY STATISTICS OF NON-OECD COUNTRIES: DATABASE DOCUMENTATION (2015 revised edition) - 43
INTERNATIONAL ENERGY AGENCY
Countries and regions This document is without prejudice to the status of or sovereignty over any territory, to the delimitation of
international frontiers and boundaries and to the name of any territory, city or area. In this publication, ‘country’ refers to country or territory, as the case may be.
Flow Short name Definition
Memo: European Union - 28
EU28 Includes Austria; Belgium; Bulgaria; Croatia; Cyprus5; Czech Republic; Denmark; Estonia; Finland; France; Germany; Greece; Hungary; Ireland; Italy; Latvia; Lithuania; Luxembourg; Malta; Netherlands; Poland; Portugal; Romania; Slovak Republic; Slovenia; Spain; Sweden and United Kingdom.
Please note that in the interest of having comparable data, all these countries are included since 1990 despite different entry dates into the European Union.
Memo: OPEC OPEC12 Includes Algeria; Angola; Ecuador; Islamic Republic of Iran; Iraq; Kuwait; Libya; Nigeria; Qatar; Saudi Arabia; the United Arab Emirates and Venezuela.
Memo: Former Yugoslavia
MYUGO Includes Former Yugoslavia (if no detail); Bosnia and Herzegovina; Croatia; Former Yugoslav Republic of Macedonia; Kosovo; Montenegro; Slovenia and Serbia.
Memo: FSU 15 MFSU15 Includes the Former Soviet Union with all 15 countries for all years
Please note that the following countries have not been considered due to lack of data:
Non-OECD Europe and Eurasia: Andorra and Liechtenstein8 (except for oil data);
Africa: Saint Helena;
Non-OECD Americas: Anguilla;
Asia: Christmas Island; Nauru; Niue and Tuvalu.
8. Oil data for Liechtenstein are included under Switzerland.

44 - ENERGY STATISTICS OF NON-OECD COUNTRIES: DATABASE DOCUMENTATION (2015 revised edition)
INTERNATIONAL ENERGY AGENCY
6. COUNTRY NOTES AND SOURCES In the references below, both the statistical year (2013) for which data are being published in this edi-tion, as well as publication dates of the many docu-ments which have been consulted during the devel-opment of this publication are mentioned. As a gen-eral rule, where specific documents or personal com-munications have been used, the date that is refer-enced is the date of publication of the document or the date of the communication, whereas, where data re-ceived through the completion of questionnaires are mentioned, the date that is referenced is the statistical year for which data are being published in this edition, namely 2013.
Data may not include all informal and/or illegal trade, production or consumption of energy products, alt-hough the IEA secretariat makes efforts to estimate these where reliable information is available.
General references
Annual Bulletin of Coal Statistics for Europe, Eco-nomic Commission for Europe (ECE), New York, 1994.
Annual Bulletin of Electric Energy Statistics for Eu-rope, Economic Commission for Europe (ECE), New York, 1994.
Annual Bulletin of Gas Statistics for Europe, Econom-ic Commission for Europe (ECE), New York, 1994.
Annual Bulletin of General Energy Statistics for Eu-rope, Economic Commission for Europe (ECE), New York, 1994.
Annual Crude Steel production, World Steel Associa-tion, http://www.worldsteel.org.
Annual Report July 1991-June 1992, South African Development Community (SADC), Gaborone, 1993.
Annual Statistical Bulletin, Organization of Petroleum Exporting Countries (OPEC), Vienna, various editions up to 2014.
Annual Statistical Report, Organization of Arab Petro-leum Exporting Countries (OAPEC), Kuwait, various editions up to 2014.
APEC Energy Database, Tokyo, 2014.
Arab Oil and Gas Directory, Arab Petroleum Re-search Centre, Paris, various editions up to 2013.
ASEAN Energy Review 1995 Edition, ASEAN-EC Energy Management Training and Research Centre (AEEMTRC), Jakarta, 1996.
Asia Pacific Databook, FACTS Global Energy, Singapore, various editions up to 2014.
Banque de données Enerdata, Fiches d’expertise des données, Enerdata, Grenoble, September 2014.
Base CHELEM-PIB, Centre d’Etudes Prospectives et d’Informations Internationales (CEPII), Bureau van Dijk, Paris, 2008 to 2015.
Centroamérica: Estadísticas de Hidrocarburos, Comisión Económica para América y el Caribe (CEPAL), United Nations, Mexico, various editions up to 2014.
CIS and East European Energy Databook, Eastern Bloc Research Ltd, Tolsta Chaolais, various editions up to 2014.
Eastern Bloc Energy, Tadcaster, various issues up to May 1999.
Energy Indicators of Developing Member Countries, Asian Development Bank (ADB), Manila, 1994.
Energy-Economic Information System (SIEE), Latin American Energy Organization (OLADE), Ecuador, 2014.

ENERGY STATISTICS OF NON-OECD COUNTRIES: DATABASE DOCUMENTATION (2015 revised edition) - 45
INTERNATIONAL ENERGY AGENCY
Energy Statistics Yearbook 1990, South African Development Community (SADC), Luanda, 1992.
Energy Statistics Yearbook 2008, United Nations, New York, 2011.
External Trade of the CIS countries, The Interstate Statistical Committee of the Commonwealth of Inde-pendent States, Moscow, 2005.
Forestry Data, Food and Agriculture Organisation of the United Nations, Rome, 2000.
Foreign Scouting Service, Commonwealth of Inde-pendent States, IHS Energy Group – IEDS Petrocon-sultants, Geneva.
Forests and Biomass Sub-sector in Africa, African Energy Programme of the African Development Bank, Abidjan, 1996.
Global E&P Service, Commonwealth of Independent States, IHS Energy Group – IEDS Petroconsultants, Geneva.
International Energy Annual, Energy Information Ad-ministration (EIA), Washington, D.C., 1991 to 1994.
International Energy Data Report 1992, World Ener-gy Council, London, 1993.
Les Centrales Nucléaires dans le Monde, Commissariat à l’Énergie Atomique, Paris, various editions up to 2014.
Lund et. al, Direct Utilization of Geothermal Energy 2010 Worldwide Review, World Geothermal Congress, Bali, 2010.
Middle East Economic Survey (MEES), Nicosia, vari-ous issues to June 1999.
Middle East Petroleum Databook, FACTS Global Energy Group, Singapore, various editions up to 2014.
Natural Gas in the World, Cedigaz, Paris, various editions up to 2014.
Natural Gas Vehicles Statistics, International Associa-tion for Natural Gas Vehicles, online database: www.iangv.org.
Notes d'Information et Statistiques, Banque Centrale des Etats de l'Afrique de l'Ouest, Dakar, 1995.
Pétrole 1994, Comité Professionnel du Pétrole (CPDP), Paris, 1995.
Pirani et al, Russian and CIS Gas Markets and Their Impact on Europe, Oxford University Press, Oxford, 2009.
PIW’s Global Oil Stocks & Balances, New York, var-ious issues to June 1995.
PlanEcon Energy Outlook for Eastern Europe and the Former Soviet Republics, Washington, 2003.
PlanEcon Energy Outlook for the Former Soviet Republics, Washington, June 1995 and 1996.
Prospects of Arab Petroleum Refining Industry, Or-ganization of Arab Petroleum Exporting Countries (OAPEC), Kuwait, 1990.
Review of Wood Energy Data in RWEDP Member Countries, Regional Wood Energy Development Pro-gramme in Asia, Food and Agriculture Organisation of the United Nations, Bangkok, 1997.
SIE-Afrique (Systèmes d’Information Énergétique – Afrique), projet promu par ECONOTEC et Institut de l’Energie et de l’Environnement de la Francophonie (IEPF), organe subsidiaire de l’Organisation Interna-tionale de la Francophonie (OIF).
Solar Heat Worldwide, AEE - Institute for Sustainable Technologies, Gleisdorf, various editions up to 2015.
Statistical Bulletin, Arab Union of Producers, Trans-porters and Distributors of Electricity (AUPTDE), Amman, various editions up to 2014.
Statistical Bulletin, The InterState Statistical Commit-tee of the Commonwealth of Independent States, Moscow, 1993 and 1994.
Statistiques économiques, Banque des Etats de l’Afrique Centrale (BEAC), online database 2011.
Statistical Handbook 1993 - States of the Former USSR, The World Bank, Washington, 1993.
Statistical Yearbook, The Interstate Statistical Com-mittee of the Commonwealth of Independent States, Moscow, various editions up to 2011.
Statistical Yearbook of the Member States of the CMEA, Council of Mutual Economic Assistance (CMEA), Moscow, 1985 and 1990.
The LNG Industry, International Group of Liquefied Natural Gas Importers (GIIGNL), Levallois, various editions up to 2014.
The United Nations Energy Statistics Database, Unit-ed Nations Statistical Office, New York, various edi-tions up to 2015.
World Development Indicators, The World Bank, Washington, various editions up to 2014.

46 - ENERGY STATISTICS OF NON-OECD COUNTRIES: DATABASE DOCUMENTATION (2015 revised edition)
INTERNATIONAL ENERGY AGENCY
Note: The OLADE database was used for several Non-OECD
Americas countries.
The UN database was the only source of information for time series of the countries not listed individually and included in the regions Other Africa, Other Non-OECD Americas and Other Asia. It was also used in a number of other countries as a complementary data source.
Albania
For 1993, large quantities of oil, widely reported to have moved through Albania into Former Yugoslavia, may not be included in oil trade. Although estimated to represent up to 100 per cent of domestic consumption levels, no reliable figures for this trade were available.
Starting from 2011, motor gasoline consumption is reported in residential. This consumption corresponds to motor gasoline used in electricity generators.
Sources 2011 to 2013:
Direct communication with the National Agency of Natural Resources, Tirana
Joint IEA/Eurostat/UNECE annual energy question-naires for Oil, Natural gas, Coal, Electricity and heat, Renewables
Sources 2005 to 2010:
Energy Balances 2005-2010, Energy Department of the National Agency of Natural Resources of Albania, Tirana.
IEA secretariat estimates.
Sources up to 2004:
Joint IEA/Eurostat/UNECE annual energy question-naires 1994, 1995, 1998.
Energy Balances, National Agency of Energy of Albania, 1999 to 2004.
The UN Energy Statistics Database.
Aide Memoire of World Bank Mission to Albania May/June 1991.
IEA secretariat estimates.
Sources for Biofuels and waste:
The UN Energy Statistics Database.
Joint IEA/Eurostat/UNECE annual energy questionnaires.
IEA secretariat estimates.
Algeria
Crude oil production and export data do not include field condensate. Field condensate quantities are in-cluded with natural gas liquids.
Revisions were made to the energy balances in 2009 and 2010 which add more detail for certain products and flows. This may result in breaks in time series between 2008 and 2009.
Sources 1990 to 2013:
Direct communication with the Ministry of Energy and Mining, Algiers.
Additional sources 2008:
SONELGAZ, Société nationale de l’électricité et du gaz, online statistics on electricity production, Algiers.
Sources up to 1989:
Bilan Energétique National, Gouvernement Algérien, Algiers, 1984.
Algérie Energie, No 6, Ministère de l'Energie et des Industries Chimiques et Pétrochimiques, Algiers, 1979 to 1983.
Annuaire Statistique de l'Algérie 1980-1984, Office National des Statistiques, Algiers, 1985.
Sources for Biofuels and waste:
The UN Energy Statistics Database.
Ministry of Energy and Mining.
IEA secretariat estimates.
Angola
Crude oil production and export data do not include field condensate. Field condensate quantities are in-cluded with natural gas liquids.
Sources 2003 to 2013:
Relatório de Gestão e Contas, Sonangol E.P, Luanda, 2013.
Direct communication with the Ministry of Energy and Water, Luanda.
Balanço da Produção & Informação sobre o Sector de Petróleo e Gás & Balanço da Refinaria de Luanda, Ministério dos petróleos, Luanda, 2013.
Relatório de Actividades do Sector Petrolífero, Ministério dos petróleos, Luanda, 2007 and 2008 editions.

ENERGY STATISTICS OF NON-OECD COUNTRIES: DATABASE DOCUMENTATION (2015 revised edition) - 47
INTERNATIONAL ENERGY AGENCY
Annual Report, Southern African Power Pool, Harare, various editions up to 2012.
IEA secretariat estimates.
Sources 1992 to 2002:
Direct communication with oil industry sources.
IEA secretariat estimates.
Eskom Annual Statistical Yearbook, 1993, 1994, 1995 citing Empresa Nacional de Electricidade as a source, Johannesburg, 1994-1996.
The UN Energy Statistics Database.
Sources up to 1991:
Le Pétrole et l'Industrie Pétrolière en Angola en 1985, Poste d'Expansion Economique de Luanda, Luanda, 1985.
Sources for Biofuels and waste:
IEA secretariat estimates based on 1991 data from African Energy Programme of the African Develop-ment Bank, Forests and Biomass Sub-sector in Africa, Abidjan, 1996.
Argentina
Since 2010 a different methodology is adopted by Argentina for reporting refinery flows leading to more detailed information (e.g. reprocessing of some oil products). This may result in breaks in time series between 2009 and 2010.
Sources up to 2013:
Direct communication with the Ministry of Economy, Secretariat of Energy, Buenos Aires.
Balance Energético Nacional, Ministerio de Econo-mía, Secretaria de Energía, Buenos Aires, various edi-tions up to 2013.
Informe del sector eléctrico, Ministerio de Planifica-ción Federal, Inversión Pública y Servicios, Secretaria de Energía, Dirección Nacional de Prospectiva, Buenos Aires, various editions up to 2013.
Información del mercado de hidrocarburos, Ministerio de Planificación Federal, Inversión Pública y Servicios, Secretaria de Energía, Dirección Nacional de Prospec-tiva, Buenos Aires, various editions up to 2013.
Informe Enargas, Enargas, Buenos Aires, various edi-tions up to 2013.
Camara Argentina de Biocombustibles, online statistics.
Informe del sector eléctrico, Ministerio de Economía, Secretaria de Energía, Buenos Aires, 1986 to 2003.
Anuario de Combustibles, Ministerio de Economía, Secretaria de Energía, Buenos Aires, 1980 to 2003.
Anuario Estadístico del sector energético Argentino, Instituto Argentino de la Energía “General Mosconi”, Buenos Aires, 2000.
Anuario Estadístico de la República Argentina, Insti-tuto Nacional de Estadística y Censos, Buenos Aires, September 1997.
Boletín Mensual de Combustibles, Ministerio de Obras y Servicios Públicos, Secretaria de Energía, Buenos Aires, various editions.
Natural Gas Projection up to 2000, Gas del Estado Argentina, Buenos Aires, 1970, 1984 to 1986.
Anuario Estadístico de la República Argentina 1970-1981, Instituto Nacional de Estadística y Censos, Secretaria de Planificación, Buenos Aires, 1982.
Plan Energético Nacional 1986-2000, Ministerio de Economía, Secretaría de Energía, Subsecretaría de Planificación Energética, Buenos Aires, 1985.
Anuario Estadístico, Yacimientos Petrolíferos Fiscales, Buenos Aires, 1984 to 1987.
Memoria y Balance General, Yacimientos Petrolíferos Fiscales, Buenos Aires, 1984 to 1986.
Armenia
Data for Armenia are available starting in 1990. Prior to that, they are included in Former Soviet Union.
Data provided by Armenia are mainly supply side data except for electricity. IEA secretariat assump-tions are used to estimate consumption data.
Armenia does not complete the Renewables question-naire, therefore the data from the electricity question-naire concerning power generation from renewables are used.
Sources 1992 to 2013:
Direct communication with National Statistical Service, Yerevan.
Joint IEA/Eurostat/UNECE annual energy questionnaires on Coal, Electricity and heat, Natural gas, Oil.
Forestry Statistics, FAO, Rome.

48 - ENERGY STATISTICS OF NON-OECD COUNTRIES: DATABASE DOCUMENTATION (2015 revised edition)
INTERNATIONAL ENERGY AGENCY
IEA secretariat estimates.
Sources 1990 to 1991:
IEA secretariat estimates.
Sources for Biofuels and waste:
Forestry Statistics, FAO, Rome.
IEA secretariat estimates.
Azerbaijan
Data for Azerbaijan are available starting in 1990. Prior to that, they are included in Former Soviet Union.
Production of natural gas may differ from the Azer-baijan national energy balance because natural gas used for production of electricity by the oil and gas extraction industry is included by the IEA secretariat in the definition of natural gas production. Breaks in time series appear for inputs and outputs of electricity, CHP and heat plants in Azerbaijan between 2006 and 2007 due to an improved data collection methodology in the country from 2007 onwards.
For the purpose of calculating CO2 emissions, an alloca-tion between domestic and international aviation con-sumption of jet kerosene was estimated by the IEA sec-retariat for 1990-2006 based on total aviation consump-tion reported by Azerbaijan and the 2007 allocation.
Sources 1990 to 2013:
Direct communications with the State Committee of Statistics and the Ministry of Economics of Azerbaijan, Baku.
Joint IEA/Eurostat/UNECE annual energy question-naires, 1992 to 2013.
Sources for Biofuels and waste:
Joint IEA/Eurostat/UNECE annual energy question-naires, 2000-2013.
Before 2000: IEA secretariat estimates.
Bahrain
Crude oil production includes production from the Abu Sa’fah field, which is shared with Saudi Arabia.
Consumption of natural gas for autoproducer power generation may include quantities used for non-power generation purposes.
Estimations of the use of petroleum coke in the manu-facture of aluminium have been made to track this
consumption from 2000 onwards. This may lead to breaks in time series between 1999 and 2000.
Sources 1992 to 2013:
Statistics 2005-2013, National Oil and Gas Authority of Bahrain, Manama.
Online statistics 2000-2013, Central Informatics Or-ganization (CIO), Manama, Kingdom of Bahrain.
Direct communication with National Oil and Gas Authority and oil industry sources.
Statistics 2007 and 2008, Electricity & Water Authority, Manama.
Statistical Bulletin, Arab Union of Producers, Trans-porters and Distributors of Electricity, Amman, vari-ous editions up to 2012.
Statistical Abstract, 1994, 1998, 1999, 2000, 2001, 2002 and 2003, Council of Ministers, Control Statistics Organisation, Bahrain, 1995 to 2006.
The UN Energy Statistics Database.
IEA secretariat estimates.
Sources up to 1991:
Statistical Abstract 1990, Council of Ministers, Cen-tral Statistics Organisation, Manama, 1991.
1986 Annual Report, Bahrain Monetary Agency, Ma-nama, 1987.
B.S.C. Annual Report, Bahrain Petroleum Company, Manama, 1982-1984.
Foreign Trade Statistics, Council of Ministers, Cen-tral Statistics Organisation, Manama, 1985.
Bahrain in Figures, Council of Ministers, Central Sta-tistics Organisation, Manama, 1983-1985.
Bangladesh
Data are reported on a fiscal year basis, beginning on the 1st of July and ending on the 30th of June of the subsequent year.
In 2013, time series were revised from 2008 to 2011 based on data retrieved from the Bangladesh Power Development Board. This may result in breaks in time series between 2007 and 2008 for electricity.
In the 2014 edition, time series were revised from 2004 to 2012 based on new data on petroleum prod-ucts retrieved from the Bangladesh Petroleum Corpo-ration and the Eastern Refinery Limited. This may

ENERGY STATISTICS OF NON-OECD COUNTRIES: DATABASE DOCUMENTATION (2015 revised edition) - 49
INTERNATIONAL ENERGY AGENCY
result in breaks in time series between 2004 and 2005 for primary and secondary oil products.
Sources 2008 to 2013:
Annual Report, PetroBangla - Bangladesh Oil, Gas and Mineral Corporation, Dhaka, various editions up to 2014.
Annual Report, Bangladesh Power Development Board (BPDB), Dhaka, various editions from 2007 to 2014.
Annual Report, Dhaka Electric Supply Company Lim-ited (DESCO), Dhaka, various editions from 2008 to 2014.
Bangladesh Economic Review, Ministry of Finance, Dhaka, various editions from 2008 to 2013.
Coal Recent Mine Activities, Barapukuria Coal Min-ing Company Limited (BCMCL), Dhaka, 2013
Statement of total coal production, sale, delivery and stock position, Barapukuria Coal Mining Company Limited (BCMCL), Dhaka, 2014
Production Activities, Eastern Refinery Limited, online statistics: erl.com.bd, 2014.
Commercial & Operation – Petroleum products, Bangladesh Petroleum Corporation (BPC), online sta-tistics: www.bpc.gov.bd.
IEA secretariat estimates.
Sources 1996 to 2007:
U.S. Agency for International Development, Dhaka, 2003 to 2008.
IEA secretariat estimates.
Statistical Yearbook of Bangladesh 1996 to 1999, Ministry of Planning, Bangladesh Bureau of Statistics, Dhaka, 1997 to 2000.
Sources 1992 to 1995:
Statistical Pocket Book of Bangladesh, Ministry of Planning, Bangladesh Bureau of Statistics, Dhaka, 1986 to 1996.
The UN Energy Statistics Database.
Sources up to 1991:
Bangladesh Energy Balances 1976-1981, Government of Bangladesh, Dhaka, 1982.
Statistical Yearbook of Bangladesh 1991, Government of Bangladesh, Dhaka, 1976 to 1991.
Monthly Statistical Bulletin of Bangladesh, Ministry of Planning, Bangladesh Bureau of Statistics, Statis-tics Division, Dhaka, June 1986 and October 1989.
Sources for Biofuels and waste:
Forestry Statistics, FAO, Rome, 2014.
IEA secretariat estimates.
Belarus
Data for Belarus are available starting in 1990. Prior to that, they are included in Former Soviet Union.
Since January 2010, Belarus became a member of a Customs Union with Russia and Kazakhstan. Breaks in trade time series and statistical differences appear from 2009 to 2011 as the Customs progressively shifted from one accounting system to another.
Jet Kerosene is reported under Other Products until 2012. Breaks in time series appear in gas/diesel and fuel oil between 2011 and 2012 as a result of a new classification of industrial products (heating oil re-classified under high sulphur fuel oil).
In this edition methane produced as a by-product dur-ing the petrochemical transformation of naphtha was re-classified by Belarus for the period 1998-2011 from industrial waste to refinery gas. This may lead to breaks in time series between 1997 and 1998.
Belarus reports all inputs and outputs to CHP and heat autoproducer plants including those corresponding to own use of heat.
Sources 1990 to 2013:
Direct communication with the National Statistical Committee of Belarus, Minsk.
Joint IEA/Eurostat/UNECE annual energy question-naires, 1990 to 2011, Oil, Natural gas, Coal, Renewa-bles, Electricity and heat.
Sources for Biofuels and waste:
Joint IEA/Eurostat/UNECE annual energy question-naires for Renewables.
IEA secretariat estimates.
Benin
Member of the SIE-Afrique project.
Time series were revised from 2005 to 2009 based on data received from the Ministère des Mines, de l’Energie et de l’Hydraulique, Cotonou in 2011.

50 - ENERGY STATISTICS OF NON-OECD COUNTRIES: DATABASE DOCUMENTATION (2015 revised edition)
INTERNATIONAL ENERGY AGENCY
Breaks in the time series may occur between 2004 and 2005 for some products.
Sources 1999 to 2013:
Direct communication with the Ministère des Mines, de l’Energie et de l’Hydraulique, Cotonou, through the WEC-IEA Joint Energy Reporting Format for Africa, 1999 to 2002, 2004, 2006, 2007, 2011, 2012.
IEA secretariat estimates.
Sources up to 1998:
Direct communication with the Secretariat, Direction de l'Energie, Cotonou, 1999, 2000.
Direct communication with the electricity utility, Co-tonou, 1998 to 1999.
The UN Energy Statistics Database.
Rapport sur l’Etat de l’Economie Nationale, Ministère de l’Economie, Cotonou, September 1993.
IEA secretariat estimates.
Sources for Biofuels and waste up to 1995:
IEA secretariat estimates based on 1991 data from Forests and Biomass Sub-sector in Africa, African Energy Programme of the African Development Bank, Abidjan, 1996.
Bolivia
Data for international aviation bunkers are estimated by the IEA secretariat based on passenger manifest data.
Breaks in time series for solid biofuels occur between 2009 and 2010. This is due to differences in defini-tions between Bolivia and IEA. Solid biofuels may include other sources of renewable energy (e.g. wind, solar, etc.). Efforts are underway to resolve these def-initional issues for future publications.
Sources 1992 to 2013:
Balance Energético Nacional 2000-2013 Ministerio de Hidrocarburos y Energía, La Paz, 2013.
Anuarío Estadístico, Ministerio de Hidrocarburos y Energía, La Paz, 2013.
Boletín Estadístico, Yacimientios Petroliferos Fiscales Bolivianos, La Paz, 2008 to 2013.
Informe Estadístico, Yacimientos Petrolíferos Fiscales Bolivianos, La Paz, various editions from 1992 to 1998.
Anuarío Estadístico, Autoridad de Fiscalización y Control Social de Electricidad, La Paz, 2013.
Anuarío Estadístico, Superintendencia de Electrici-dad, La Paz, various editions from 1996 to 2007.
Memoria Anual, Comité Nacional de Despacho de Carga, 2011.
SIEE, OLADE.
IEA secretariat estimates.
Sources up to 1991:
Boletín Estadístico 1973-1985, Banco Central de Bolivia, División de Estudios Económicos, La Paz, 1986.
Diez Anos de Estadística Petrolera en Bolivia 1976-1986, Dirección de Planeamiento, Division de Estadística, La Paz, 1987.
Empresa Nacional de Electricidad S.A. 1986 Ende Me-moria, Empresa Nacional de Electricidad, La Paz, 1987.
Sources for Biofuels and waste:
SIEE, OLADE.
Bosnia and Herzegovina
Data for Bosnia and Herzegovina are available start-ing in 1990. Prior to that, they are included in Former Yugoslavia.
Energy statistics are available from the Agency for Statistics of Bosnia and Herzegovina from 2008 for electricity and heat and from 2009 for coal and natural gas. As a consequence, breaks in time series may oc-cur between 2007 and 2008 for electricity and heat and 2008 and 2009 for other products. The source for crude oil and secondary oil products data is the publi-cation “Industrial Production Bosnia and Herzegovina 2012” and “Oil Trade Data” both produced by the Agency for Statistics of Bosnia and Herzegovina.
In 2014, the Agency for Statistics of Bosnia and Her-zegovina conducted their first survey on oil product consumption. Due to this newly available data some breaks in time series may occur between 2012 and 2013.
Sources 2009 to 2013:
Direct communication with the Agency for Statistics of Bosnia and Herzegovina, Sarajevo.
Energy Statistics: Oil products, Issue 1, Agency for Statistics of Bosnia and Herzegovina, Sarajevo.

ENERGY STATISTICS OF NON-OECD COUNTRIES: DATABASE DOCUMENTATION (2015 revised edition) - 51
INTERNATIONAL ENERGY AGENCY
Joint IEA/Eurostat/UNECE annual energy question-naire on Coal, Natural gas and Electricity and heat, 2010 to 2013.
PRODCOM Survey - Industrial Production, Bosnia and Herzegovina, 2009 to 2012.
IEA secretariat estimates.
Sources 2006 to 2008:
European Network of Transmission System Operators for Electricity, online statistics, 2010.
Union for the Co-ordination of Transmission of Elec-tricity, online statistics, 2009.
IEA secretariat estimates.
Sources 2000 to 2005:
Energy Sector Study BiH, Third Electric Power Re-construction Project, consortium led by Energy Insti-tute Hrvoje Pozar, Sarajevo, 2008.
Direct communication with the Joint Power Co-ordination Centre (JPCC).
Statistical Yearbook of BiH, Federation of Bosnia and Herzegovina Federal Office of Statistics, Sarajevo, 2008.
Power Generation and Transmission System in Bosnia Herzegovina, International Management Group, Eu-ropean Commission, Sarajevo, November 2000.
Energy Outlook, Federal Ministry of Energy, Mining and Industry, Sarajevo, December 2001.
The UN Energy Statistics Database.
Botswana
Data for Botswana are available from 1981. Prior to that, they are included in Other Africa.
Sources 1981 to 2013:
Annual Report, Botswana Power Corporation (BPC), Gaborone. Various editions up to 2013. Note: BPC data are published on a fiscal year basis (April to March).
Environment Statistics 2012, Botswana Central Statis-tics Office, Gaborone.
Indices of the physical volume of mining production 3Q 2014, Botswana Central Statistics Office, Gaborone.
Botswana in Figures 2011, Botswana Central Statis-tics Office, Gaborone.
Statistical Yearbook 2010, Botswana Central Statistics Office, Gaborone.Annual Report 2009, Department of Mines, Gaborone.
Energy Statistics, Central Statistics Office, Gaborone.
Direct communication with the Energy Affairs Divi-sion, Ministry of Minerals, Energy and Water Affairs, Gaborone.
Brazil
New information became available in 2015 which explains the types of product transfers within Brazili-an refineries. The IEA has attempted to reflect these transfers as accurately as possible in the current publi-cation
In the IEA balance for Brazil, “Biogasoline” refers to anhydrous ethanol while “Other liquid biofuels” refers to hydrated ethanol.9
Although IEA’s balance is based on Brazil’s national statistics, differences with the national energy balance can be observed due to the different methodologies adopted for reporting nuclear, chemical heat, natural gas, renewables, blast furnaces and coke ovens.
Brazil produces a large share of its pig iron in blast furnaces that are fuelled and fed with charcoal. The blast furnace gases produced when charcoal is used as a reagent in the blast furnaces are renewable products and they have been reported in this publication under the product “Biogases from thermal processes”. Addi-tionally, only the part of these gases consumed for power generation (i.e. energy purposes) has been ac-counted for in the transformation sector. The remain-ing charcoal consumed in or used to heat the blast furnaces is reported in final consumption under the iron and steel industry with no distinction between transformation and final consumption.
Prior to the year 2000 blast furnace gases data availa-bility is limited to the input to auto producer electrici-ty plants. Therefore, from 1971 to 1999, the other
9. The national energy balance of Brazil shows bioethanol as two separate products: anhydrous ethanol ("álcool anidro", i.e. nearly pure ethanol, containing less than 1% of water) and hydrated ethanol ("álcool hidratado", i.e. a blend of ethanol and water, in the proportion of about 95% to 5%, generally obtained from conventional distillation). While anhydrous ethanol is blended with gasoline (the blend sold at the pump generally contains 20-25% of ethanol), hydrated ethanol is sold at separate pumps as a product by itself (álcool) to be used in flex fuel cars, i.e. vehicles that can run on any mix of gasoline and ethanol.

52 - ENERGY STATISTICS OF NON-OECD COUNTRIES: DATABASE DOCUMENTATION (2015 revised edition)
INTERNATIONAL ENERGY AGENCY
flows (e.g. production, consumption etc…) are IEA secretariat estimates.
The Itaipu hydroelectric plant, operating since 1984 and located on the Paraná River (which forms the border of Brazil and Paraguay) was formed as a joint venture between Eletrobrás and the Paraguayan gov-ernment. Production is shared equally between Brazil and Paraguay.
Sources 1971 to 2013:
Direct communication with the Ministério de Minas e Energia, Brasilia.
Mauthner, F. and Weiss W., Solar Heat Worldwide - Markets and contribution to the energy supply, vari-ous editions up to 2015, IEA Solar Heating and Cool-ing Programme.
Brunei Darussalam
Sources 2006 to 2013:
APEC Energy Database, Tokyo, 2015.
Direct communication with the Prime Minister's Office, Strategic Planning Division, Bandar Seri Begawan.
Direct communication to the IEA secretariat from the Prime Minister's Office, Department of Electrical Services, Bandar Seri Begawan.
IEA secretariat estimates.
Sources 1992 to 2005:
APEC Energy Database, Tokyo, 2007.
Direct communication with the UN Statistics Divi-sion, the Office of the Prime Minister, Petroleum Unit, the Asia Pacific Energy Research Centre and the Ministry of Development, Electrical Services Department.
Brunei Statistical Yearbook, 1992 to 1994, Ministry of Finance, Statistics Section, Bandar Seri Begawan, 1993, 1995.
Sources up to 1991:
Fifth National Development Plan 1986-1990, Ministry of Finance, Economic Planning Unit, Bandar Seri Begawan, 1985.
Sources for Biofuels and waste:
The UN Energy Statistics Database.
Bulgaria
Non-specified transformation of natural gas to other hydrocarbons corresponds to hydrogen used in refineries.
Bulgaria has re-classified black liquor from industrial waste to solid biofuels and the renewable portion of tyres from industrial waste to municipal waste – re-newables from 2008. Breaks in time series may occur between 2007 and 2008.
A break in the time series for natural gas stock chang-es may occur between 2003 and 2004 as cushion gas is excluded starting in 2004.
Sources 1990 to 2013:
Direct communication with the National Statistical Institute, Sofia.
Joint IEA/Eurostat/UNECE annual energy questionnaires.
Energy Balances, National Statistical Institute, Sofia, 1995.
Sources up to 1991:
Energy Development of Bulgaria, Government of Bulgaria, Sofia, 1980 and 1984.
Energy in Bulgaria, Government of Bulgaria, Sofia, 1980 to 1983.
General Statistics in the Republic of Bulgaria 1989/1990, Government of Bulgaria, Sofia, 1991.
Sources for Biofuels and waste:
The UN Energy Statistics Database and Joint IEA/Eurostat/UNECE annual energy questionnaires.
Cambodia
Data for Cambodia are available starting in 1995. Pri-or to that, they are included in Other Asia.
In this edition, new information regarding the imports of petroleum products in Cambodia from 2007 on-wards became available. Data for these products were revised accordingly and as a result breaks in time se-ries may occur for different products between 2007 and 2013.Sources up to 2013:
APEC annual energy questionnaires, 2010-2011.

ENERGY STATISTICS OF NON-OECD COUNTRIES: DATABASE DOCUMENTATION (2015 revised edition) - 53
INTERNATIONAL ENERGY AGENCY
Report on Power Sector of the Kingdom of Cambodia, Electricity Authority of Cambodia, Phnom Penh, var-ious editions up to 2014.Petroleum Products Imports Data from the Customs Office, General Department of Petroleum of Cambodia, Phnom Penh, 2014.
Direct communication with the Department of Ener-gy, Ministry of Industry, Mines and Energy, the De-partment of Corporate Planning and Projects, the Electricity Authority of Cambodia and Electricité du Cambodge, Phnom Penh through the APEC annual energy statistics questionnaire, 1995-2011.
IEA secretariat estimates.
Cameroon
Member of the SIE-Afrique project.
Sources 1971 to 2013:
Direct communication with the Ministère de l'Energie et de l'Eau, Yaoundé.
Statistiques économiques, Banque des Etats de l’Afrique Centrale (BEAC), online database, 2011.
Direct communication with the Société Nationale de Raffinage (SONARA).
Direct communication with the Société Nationale d'Electricité du Cameroun (AES – SONEL), Douala.
The UN Energy Statistics Database.
IEA secretariat estimates.
Sources for Biofuels and waste:
IEA secretariat estimates based on 1991 data from Forests and Biomass Sub-sector in Africa, African Energy Programme of the African Development Bank, Abidjan, 1996.
People’s Republic of China
Estimations of China’s 2013 energy data
In September 2015, the National Bureau of Statistics of China published China’s energy statistics for 2013, as well as revised statistics for the years 2000 to 2012. NBS supplied the IEA with detailed energy balances for 2011 to 2013 and using these the IEA revised its 2011-2013 data based on these newly available
figures. The revisions show significant changes both on the supply and demand side for a number of energy products, resulting in breaks in time series between 2010 and 2011. For the years 2000-2010, revisions will be published in the next edition of this publica-tion in summer 2016.
The revised energy balances released by the NBS in-tegrate findings from a national economic census for all years since 2000. The revised balance data solve several detailed issues, most importantly the unallo-cated coal demand that appeared in the recent years of the Chinese energy balance (shown as the statistical difference), has been primarily allocated to final con-sumption in the industrial sector.
Calorific values were also revised for bituminous coal in this edition. Net calorific values (NCV) for coal inputs to power generation as well as to main activity heat plants were modified from 2011 to 2013 by ap-plying assumptions used by China on the average thermal efficiency of coal-fired power stations in these years. NCVs were also modified for bituminous coal production from 2011 to 2013. These NCVs were calculated as the implied calorific values used by China in converting its commodity balance to energy units.
Time series revisions in the 2014 edition
In 2012, the National Bureau of Statistics (NBS) re-vised the format and detail of their energy balance. New expanded questionnaires have allowed for data collection at a more detailed level than in previous years for some products and flows. However, the in-crease in data availability has not been completely uniform, with more information for energy supply than for energy demand. This may lead to increased statistical differences for some products from 2010 to 2012, in particular for coal.
Lignite imports may not be captured in the China Na-tional Energy Balance. In this edition, secondary source data for lignite imports have been added to imports of other bituminous coal for 2010 to 2012.
Calorific values were also revised for bituminous coal in this edition. Net calorific values (NCV) for coal inputs to power generation were modified from 2008 to 2013 by applying assumptions used by China on the average thermal efficiency of coal-fired power stations in these years. NCVs were also modified for bituminous coal production from 2008 to 2013. These NCVs were calculated as the implied calorific values

54 - ENERGY STATISTICS OF NON-OECD COUNTRIES: DATABASE DOCUMENTATION (2015 revised edition)
INTERNATIONAL ENERGY AGENCY
used by China in converting its commodity balance to energy units.
In this edition, diesel consumption in road transporta-tion from 2000 to 2012 was revised based on infor-mation on the definition for diesel consumption in various sectors. Portions of consumption in the resi-dential and the commercial and public services sectors were allocated to road transportation consumption to conform to the definitions for the respective consump-tion flows used by this publication.
Coal to liquids output was estimated based on project-ed production slate of operational coal-to-liquid plants.
Electricity production from pumped storage hydro was reported from 2010 to 2012.
Methodology
A collaborative effort between NBS and IEA contin-ues, with the objective of providing additional detail on energy production, transformation and consump-tion of all five different types of coal (e.g. anthracite, coking coal, other bituminous, sub-bituminous and lignite). At the moment NBS only provides quantities of raw coal and washed coal in their energy balances and the IEA secretariat has attributed these quantities to coking coal and other bituminous coal. It is ex-pected that the continuing work to provide disaggre-gated data on the five different coals will result in greater detail in future editions.
Since 2010, imports and exports of cleaned coal are no longer reported in the national energy balance of China. The IEA secretariat has used secondary sources of information to report this coking coal trade and corresponding quantities have been removed from bituminous coal trade. Consumption of this coking coal is assumed to be in coke ovens.
The IEA data of coal stocks for the years 1985 and 1990 as well as coal production for the years 1997-1999 are estimates and do not represent official data released by the Chinese government. Those estimates were based on the assumption that coal consumption statistics are more reliable than coal production statis-tics and that the production-consumption relationship should maintain a balance over time.
Also as a result of the change in China’s National En-ergy Balance in 2012, other revisions in the 2014 edi-tion may lead to breaks in series between 2009 and 2010. These include new information on:
coal inputs to coal-to-liquids facilities, coal tar inputs to petroleum refining, fuel consumption in natural gas liquefaction
plants.
In addition, for the 2013 cycle, greater use has been made of data from revised energy balances that were previously submitted by NBS to the IEA. This change has resulted primarily in increased coking coal and other bituminous coal production data for the years 2000 to 2007.
New information in 2012 also became available from NBS on the production and consumption of gangue, a mining waste product that has been classified as indus-trial waste in the IEA energy balances. This quantity of industrial waste is not likely to represent the only combustion of industrial waste in China, however, information is not available to provide more complete data on this activity.
In 2012, NBS stopped reporting coal tar trade and non-energy consumption. IEA secretariat estimates have been used to approximate coal tar imports and non-energy consumption from 2010 to 2012.
In 2012, new information became available on how NBS accounts for international aviation and marine bunkers in the China’s national energy balance. Previously international flights by Chinese airlines and ships had been excluded. A revised methodology was implemented that now includes fuel use for inter-national airplanes and ships, regardless of whether they are foreign- or China-owned.
In the 2012 edition, new information became availa-ble on natural gas consumption in public transporta-tion in China. This new consumption was added to the natural gas time series to ensure proper coverage of the transport sector.
Time series for liquid biofuels, biogases, wind (prior to 2010), geothermal, solar photovoltaic and solar thermal generation are based on tertiary sources of information and IEA secretariat estimates. None of these time series are reported in the national energy balance of China.
Observations
In recent years, China has reported large increases in stocks for crude oil, oil products and for different types of coal. These stock increases are seen as con-sistent with trends in economic growth and develop-ment in China; however, information is currently lacking on the scale of the infrastructure available for this magnitude of stock increases.
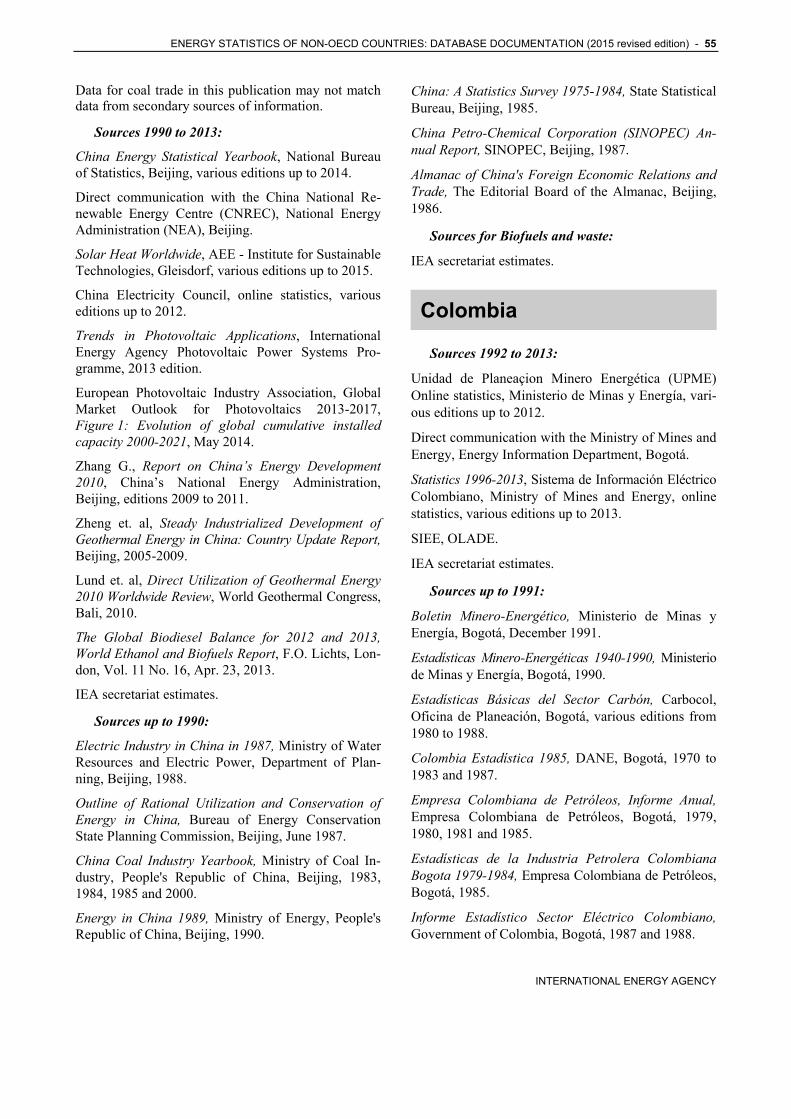
ENERGY STATISTICS OF NON-OECD COUNTRIES: DATABASE DOCUMENTATION (2015 revised edition) - 55
INTERNATIONAL ENERGY AGENCY
Data for coal trade in this publication may not match data from secondary sources of information.
Sources 1990 to 2013:
China Energy Statistical Yearbook, National Bureau of Statistics, Beijing, various editions up to 2014.
Direct communication with the China National Re-newable Energy Centre (CNREC), National Energy Administration (NEA), Beijing.
Solar Heat Worldwide, AEE - Institute for Sustainable Technologies, Gleisdorf, various editions up to 2015.
China Electricity Council, online statistics, various editions up to 2012.
Trends in Photovoltaic Applications, International Energy Agency Photovoltaic Power Systems Pro-gramme, 2013 edition.
European Photovoltaic Industry Association, Global Market Outlook for Photovoltaics 2013-2017, Figure 1: Evolution of global cumulative installed capacity 2000-2021, May 2014.
Zhang G., Report on China’s Energy Development 2010, China’s National Energy Administration, Beijing, editions 2009 to 2011.
Zheng et. al, Steady Industrialized Development of Geothermal Energy in China: Country Update Report, Beijing, 2005-2009.
Lund et. al, Direct Utilization of Geothermal Energy 2010 Worldwide Review, World Geothermal Congress, Bali, 2010.
The Global Biodiesel Balance for 2012 and 2013, World Ethanol and Biofuels Report, F.O. Lichts, Lon-don, Vol. 11 No. 16, Apr. 23, 2013.
IEA secretariat estimates.
Sources up to 1990:
Electric Industry in China in 1987, Ministry of Water Resources and Electric Power, Department of Plan-ning, Beijing, 1988.
Outline of Rational Utilization and Conservation of Energy in China, Bureau of Energy Conservation State Planning Commission, Beijing, June 1987.
China Coal Industry Yearbook, Ministry of Coal In-dustry, People's Republic of China, Beijing, 1983, 1984, 1985 and 2000.
Energy in China 1989, Ministry of Energy, People's Republic of China, Beijing, 1990.
China: A Statistics Survey 1975-1984, State Statistical Bureau, Beijing, 1985.
China Petro-Chemical Corporation (SINOPEC) An-nual Report, SINOPEC, Beijing, 1987.
Almanac of China's Foreign Economic Relations and Trade, The Editorial Board of the Almanac, Beijing, 1986.
Sources for Biofuels and waste:
IEA secretariat estimates.
Colombia
Sources 1992 to 2013:
Unidad de Planeaçion Minero Energética (UPME) Online statistics, Ministerio de Minas y Energía, vari-ous editions up to 2012.
Direct communication with the Ministry of Mines and Energy, Energy Information Department, Bogotá.
Statistics 1996-2013, Sistema de Información Eléctrico Colombiano, Ministry of Mines and Energy, online statistics, various editions up to 2013.
SIEE, OLADE.
IEA secretariat estimates.
Sources up to 1991:
Boletin Minero-Energético, Ministerio de Minas y Energía, Bogotá, December 1991.
Estadísticas Minero-Energéticas 1940-1990, Ministerio de Minas y Energía, Bogotá, 1990.
Estadísticas Básicas del Sector Carbón, Carbocol, Oficina de Planeación, Bogotá, various editions from 1980 to 1988.
Colombia Estadística 1985, DANE, Bogotá, 1970 to 1983 and 1987.
Empresa Colombiana de Petróleos, Informe Anual, Empresa Colombiana de Petróleos, Bogotá, 1979, 1980, 1981 and 1985.
Estadísticas de la Industria Petrolera Colombiana Bogota 1979-1984, Empresa Colombiana de Petróleos, Bogotá, 1985.
Informe Estadístico Sector Eléctrico Colombiano, Government of Colombia, Bogotá, 1987 and 1988.

56 - ENERGY STATISTICS OF NON-OECD COUNTRIES: DATABASE DOCUMENTATION (2015 revised edition)
INTERNATIONAL ENERGY AGENCY
La Electrificacion en Colombia 1984-1985, Instituto Colombiano de Energía Electrica, Bogotá, 1986.
Balances Energéticos 1975-1986, Ministerio de Mi-nas y Energía, Bogotá, 1987.
Energía y Minas Para el Progreso Social 1982-1986, Ministerio de Minas y Energía, Bogotá, 1987.
Sources for Biofuels and waste:
Ministry of Mines and Energy, Energy Information Department, Bogotá.
Congo
In this edition, time series for the period 2000-2012 were revised based on new energy balances received from the Ministry of Energy. Breaks in time series may occur between 1999 and 2000.
The Imboulou Hydro Plant (120MW) began operating in May 2011. This may lead to breaks in time series for hydro power production and consumption between 2010 and 2011.
Sources 1971 to 2013:
Rapport annuel SIE-Congo 2014
Direct communication with the Agence de Régulation de l’Aval Pétrolier, Brazzaville, 2008 to 2013.
Les chiffres caractéristiques de la Société Nationale d’Électricité 2005-2011, SNE, Brazzaville.
Direct communication with the Ministère de l'Energie et de l'Hydraulique, Brazzaville, 2000 to 2013.
IEA secretariat estimates.
Sources for Biofuels and waste:
Rapport annuel SIE-Congo 2014IEA secretariat esti-mates based on 1991 data from Forests and Biomass Sub-sector in Africa, African Energy Programme of the African Development Bank, Abidjan, 1996.
Costa Rica
Sources up to 2013:
Direct communication with the Ministerio del Ambi-ente y Energía, San José.
SIEE, OLADE.
IEA secretariat estimates.
Côte d’Ivoire
Member of the SIE-Afrique project.
In the 2014 edition, new information regarding the clas-sification of kerosene type jet fuel and other kerosene produced in Cote d’Ivoire since 1971 became available. Time series for these products were revised accordingly.
Sources 2009 to 2013 :
Direct communication with the Direction de l’Energie, Abidjan.
IEA secretariat estimates.
Sources 2005 to 2008:
WEC-IEA Joint Energy Reporting Format for Africa, questionnaire submitted by the Direction de l’Energie, Abidjan.
Direct communication with the Direction de l’Energie, Abidjan.
IEA secretariat estimates.
Sources 2002 to 2004:
Direct communication with the Ministry of Mines and Energy, Abidjan, 2005-2006, and IEA secretariat estimates.
Sources 1992 to 2001:
Direct communication to the IEA secretariat from oil industry and the Ministry of Energy, Abidjan, July 2003.
Direct communication to the IEA secretariat from SIR, Société Ivoirienne de Raffinage, 2004.
La Côte d'Ivoire en chiffres, Ministère de l'Economie et des Finances, Abidjan, 1996-97 edition.
L'Energie en Afrique, IEPE/ENDA, Paris, 1995, in turn sourced from the Ministère des Mines et de l'Energie, Abidjan.
The UN Energy Statistics Database.
Sources up to 1991:
Etudes & Conjoncture 1982-1986, Ministère de l'Economie et des Finances, Direction de la Planifica-tion et de la Prévision, Abidjan, 1987.
Sources for Biofuels and waste:
IEA secretariat estimates based on 1991 data from Forests and Biomass Sub-sector in Africa, African Energy Programme of the African Development Bank, Abidjan, 1996.

ENERGY STATISTICS OF NON-OECD COUNTRIES: DATABASE DOCUMENTATION (2015 revised edition) - 57
INTERNATIONAL ENERGY AGENCY
Croatia
Data for Croatia are available starting in 1990. Prior to that, they are included in Former Yugoslavia.
In this edition, revisions were applied due to new information available on electricity used in the transport sector in Croatia. The time series previously reported under electricity consumption in transport: non-specified, has now been assigned to rail transport. This affects data from 1990 onward. Non-specified transformation of natural gas reported from 2007 refers to natural gas used by refineries for hydrogen production.
Breaks in time series may appear between 2007 and 2008 as transit data of electricity trade are not availa-ble for years prior to 2008.
Sources 1990 to 2013:
Direct communication with the Energy Institute “Hrvoje Požar”, Zagreb.
Direct communication with the Central Bureau of Sta-tistics, Zagreb.
Joint IEA/Eurostat/UNECE annual energy questionnaires.
IEA secretariat estimates.
Cuba
Breaks in time series in the early 90s are assumed to be due to the codification into law of the embargo imposed on Cuba, in 1992. Breaks in time series may also occur between 2001 and 2002.
Figures for crude oil include additives added to reduce viscosity.
Sources up to 2013:
Anuario Estadístico de Cuba, Oficina Nacional de Estadísticas, Havana, various editions from 1998 to 2014.
Estadísticas Energéticas en la Revolución, Oficina National de Estadísticas, Havana, September 2009 edition.
SIEE, OLADE.
Compendio estadístico de energía de Cuba 1989, Comité Estatal de Estadísticas, Havana, 1989.
Anuario Estadístico de Cuba, Comité Estatal de Estadísticas, Havana, various editions from 1978 to 1987.
IEA secretariat estimates.
Sources for Biofuels and waste:
SIEE, OLADE.
Anuario Estadístico de Cuba, Oficina Nacional de Estadísticas, Havana, various editions from 1998 to 2014.
Curaçao
The Netherlands Antilles was dissolved on 10 October 2010, resulting in two new constituent countries, Curaçao and Sint Maarten, with the remaining islands joining the Netherlands as special municipalities. In this edition, the methodology for accounting for the energy statistics of the Netherland Antilles has been revised in order to follow the above-mentioned geographical changes. From 2012 onwards, data now account for the energy statistics of Curaçao Island only. Prior to 2012, data remain unchanged and still cover the entire territory of the former Netherland Antilles.
As the Isla Refinery in Curaçao did not operate to its maximum capacity in 2010, a break in time series might occur in that year for crude oil and oil products.
Sources 1997 to 2013:
Informe de Gestión Anual, PDVSA - Petróleos de Venezuela, S.A., various editions up to 2013.
The Economy of Curaçao and Sint Maarten in Data and Charts, Yearly Overview 2004-2013, Centrale Bank van Curaçao en Sint Maarten, Willemstad.
Statistical indicators 1998-2010, Central Bank of Netherlands Antilles, Willemstad.
Direct communication with the Isla Refinery, Emmas-tad, Curaçao, up to 2008.
Statistical Information, Central Bureau of Statistics, Fort Amsterdam, up to 2008.
IEA secretariat estimates.
Cyprus
Note by Turkey:
The information in this document with reference to « Cyprus » relates to the southern part of the Island. There is no single authority representing both Turkish and Greek Cypriot people on the Island. Turkey

58 - ENERGY STATISTICS OF NON-OECD COUNTRIES: DATABASE DOCUMENTATION (2015 revised edition)
INTERNATIONAL ENERGY AGENCY
recognizes the Turkish Republic of Northern Cyprus (TRNC). Until a lasting and equitable solution is found within the context of the United Nations, Turkey shall preserve its position concerning the “Cyprus issue”
Note by all the European Union Member States of the OECD and the European Union:
The Republic of Cyprus is recognized by all members of the United Nations with the exception of Turkey. The information in this document relates to the area under the effective control of the Government of the Republic of Cyprus.
Time series data from 2009-2010 for primary solid biofuels were revised based on newly available infor-mation. Breaks in time series may occur between 2008 and 2009 for these products.
Sources 1994 to 2013:
Direct communication with the statistical service of Cyprus, Nicosia.
Joint IEA/Eurostat/UNECE annual energy questionnaires.
Electricity Authority of Cyprus Annual Report 1996, Electricity Authority of Cyprus, Nicosia, 1997.
Sources up to 1993:
Electricity Authority of Cyprus Annual Report 1988, 1992, Electricity Authority of Cyprus, Nicosia, 1989 and 1993.
Industrial Statistics 1988, Ministry of Finance, De-partment of Statistics, Nicosia, 1989.
Sources for Biofuels and waste:
Joint IEA/Eurostat/UNECE annual energy question-naires and IEA secretariat estimates.
Note: Data on electricity generation from solar thermal and heat production from municipal waste and wood were submitted for the first time from the year 2004.
Democratic People’s Republic of Korea
Time series data for 2011 for primary coals were re-vised based on new information received in 2014. This may lead to breaks in the time series between 2010 and 2011 and differences in trends compared to previous editions for some products.
Sources 1971 to 2013:
Direct communication with Korea’s National Statisti-cal Office and Korea’s Energy Economics Institute, 2002 to 2014.
The UN Energy Statistics Database.
IEA secretariat estimates.
Sources for Biofuels and waste:
The UN Energy Statistics Database.
Forestry Statistics, FAO, Rome, 2015.
IEA secretariat estimates.
Democratic Republic of the Congo
Member of the SIE-Afrique project.
In this edition, based on new information, time series for production of natural gas were moved to imports. Differences in trends may be observed compared to previous editions.
In the 2014 edition, time series for the period 2000-2009 were revised based on new energy balances re-ceived from the Ministry of Energy. Breaks in time series may occur between 1999 and 2000.
In the 2014 edition, new information regarding the energy content of solid biofuels became available. Time series from 2000 were revised accordingly.
Sources up to 2013:
Direct communication with the Ministère de l’Energie, Kinshasa Gombe.
Commission Nationale de l’Energie, Ministère de l’Energie, Kinshasa Gombe, 2005.
WEC-IEA Joint Energy Reporting Format for Africa, 1999 to 2000.
The UN Energy Statistics Database.
L'Energie en Afrique, IEPE/ENDA, Paris, 1995, in turn sourced from the Annuaire Statistique Energétique 1990, Communauté Economique des Pays des Grands Lacs, Bujumbura, 1990.
IEA secretariat estimates. Sources for Biofuels and waste:
IEA secretariat estimates based on 1991 data from Forests and Biomass Sub-sector in Africa, African

ENERGY STATISTICS OF NON-OECD COUNTRIES: DATABASE DOCUMENTATION (2015 revised edition) - 59
INTERNATIONAL ENERGY AGENCY
Energy Programme of the African Development Bank, Abidjan, 1996.
Dominican Republic
Natural gas, solid biomass and electricity data have been revised according to the Dominican Republic energy balance revisions published by OLADE.
In 2014 the national energy balance was adopted as a primary data source. This could lead to breaks in time series between 1997 and 1998 for some flows.
Sources 1971 to 2013:
Balance energia neta, Comisión nacional de energía, Santo Domingo various editions up to 2014
Importación de petróleo y derivados, Ministre de In-dustria y Comercio (MIC), Santo Domingo, various editions up to 2012.
Capacidad instalada y generación del SENI por año, según tecnología, 2000-2010, Oficina Nacional de Estadística, Santo Domingo.
SIEE, OLADE.
The LNG Industry, International Group of Liquefied Natural Gas Importers (GIIGNL), Levallois, various editions up to 2012.
IEA secretariat estimates.
Ecuador
Crude oil production and export data do not include field condensate. Field condensate quantities are in-cluded with natural gas liquids.
Ecuador has revised historical oil products data. This may lead to different trends compared to previous editions of this publication.
In the 2015 edition new information became available regarding production and consumption of refinery fuel. This may lead to breaks in time series between 2012 and 2013 (2011 and 2012) for some oil products.
Sources 1999 to 2013:
Direct communication with the Ministerio Coordina-dor de Sectores Estratégicos, Quito.
Direct communication with the Ministerio de Recursos Naturales No Renovables, Quito, up to 2013.
Direct communication with the Ministerio de Minas y Petróleos, Quito, up to 2011.Balance Energético
Nacional – Resumen, Ministerio Coordinador de Sec-tores Estratégicos, Quito, various editions up to 2014.
Estadística del Sector Eléctrico Ecuatoriano, CO-NELEC, Consejo Nacional de Electricidad, Quito, various editions up to 2013.
Informe Estadístico, & Informe Cifras Petroleras, Pe-troecuador, Empresa Estatal Petróleos del Ecuador, Quito, various editions up to 2013.
Reporte del Sector Petrolero, Banco Central del Ecuador, Quito, various editions up to 2013.
SIEE, OLADE.
IEA secretariat estimates.
Sources 1990 to 1998:
SIEE, OLADE.
Sources up to 1989:
Ministerio de Energía y Minas.
Cuentas Nacionales, Banco Central del Ecuador, Qui-to, various editions from 1982 to 1987.
Memoria 1980-1984, Banco Central del Ecuador, Quito, 1985.
Ecuadorian Energy Balances 1974-1986, Instituto Nacional de Energía, Quito, 1987.
Informacion Estadística Mensual, No. 1610, Instituto Nacional de Energía, Quito, 1988.
Plan Maestro de Electrificación de Ecuador, Ministe-rio de Energía y Minas, Quito, 1989.
Sources for Biofuels and waste:
SIEE, OLADE.
Egypt
Data are reported on a fiscal year basis. Data for 2013 correspond to 1 July 2013-30 June 2014.
Stock changes may include informal trade.
International marine bunkers are calculated as a resid-ual between supply and consumption for the period 2004-2013. The IEA secretariat has been notified by an external source that sales and consumption of ma-rine bunkers may be significantly lower than our es-timates. In this edition the Secretariat has decided to continue using the estimation methodology since no new data have been received from Egypt.

60 - ENERGY STATISTICS OF NON-OECD COUNTRIES: DATABASE DOCUMENTATION (2015 revised edition)
INTERNATIONAL ENERGY AGENCY
Sources 1992 to 2013:
Direct communication with the Organisation for Energy Planning, Cairo.
WEC-IEA Joint Energy Reporting Format for Africa, 2000 to 2012.
Direct submission to the IEA secretariat from the Ministry of Petroleum, Cairo.
Annual Report 1995, 1997, 1998, 1999, Ministry of Petroleum, Egyptian General Petroleum Corporation, Cairo, 1996, 1998 to 2000.
Annual Report of Electricity Statistics 1996/1997 to 2010/2011, Ministry of Electricity and Energy, Egyptian Electricity Holding Company, Cairo, 1998 to 2012.
Arab Oil and Gas, The Arab Petroleum Research Center, Paris, October 1997.
Middle East Economic Survey, Middle East Petroleum and Economic Publications, Nicosia, February 1994, June 1996, March 1998.
A Survey of the Egyptian Oil Industry 1993, Embassy of the United States of America in Cairo, Cairo, 1994.
IEA secretariat estimates.
Sources up to 1991:
Annual Report of Electricity Statistics 1990/1991, Ministry of Electricity and Energy, Egyptian Electrici-ty Authority, Cairo, 1992.
Statistical Yearbook of the Arab Republic of Egypt, Central Agency for Public Mobilisation and Statistics, Cairo, 1977 to 1986.
L'Electricité, l'Energie, et le Pétrole, République Arabe d'Egypte, Organisme Général de l'Information, Cairo, 1990.
Annual Report, The Egyptian General Petroleum Cor-poration, Cairo, 1985.
Sources for Biofuels and waste:
The UN Energy Statistics Database
IEA secretariat estimates.
El Salvador
El Salvador shut down its only refinery in 2012.
Sources 1971 to 2013:
Balances Energeticos, Consejo Nacional de Energia (CNE), San Salvador, various editions from 2007 to 2013.
Boletín de Estadísticas, Superintendencia General de Electricidad y Telecomunicaciones (SIGET), San Salvador, various editions from 1998 to 2013.
Centroamérica: estadísticas de hidrocarburos, 2012. Comisión Económica para América Latina y el Caribe (CEPAL), various editions from 2009-2012.
Direct communication with the Ministerio de Economía, Dirección de Hidrocarburos y Minas, San Salvador.
Direct communication with the Consejo Nacional de Energia El Salvador (CNE), San Salvador.
SIEE, OLADE.
IEA secretariat estimates.
Sources for Biofuels and waste:
SIEE, OLADE.
Eritrea
Data for Eritrea are available from 1992. Prior to that, they are included in Ethiopia.
Solid biofuels consumption data have been periodical-ly re-estimated by Eritrea. This may result in breaks in time series for this product.
Sources 1992 to 2013:
Direct Communication with the Ministry of Energy and Mines, Asmara.
IEA secretariat estimates.
Ethiopia
Ethiopia energy data include Eritrea from 1971 to 1991. From 1992, the two countries are reported separately.
Data are reported according to the Ethiopian financial year, which runs from July 1st to June 30th of the next year. .
Sources 1992 to 2013:
Direct communication with the Ministry of Water and Energy, Addis Ababa, since 2012.
Existing Power Plants, Ethiopian Electric Power Cor-poration, online database, 2014.

ENERGY STATISTICS OF NON-OECD COUNTRIES: DATABASE DOCUMENTATION (2015 revised edition) - 61
INTERNATIONAL ENERGY AGENCY
Biomass Energy Strategy Formulation for Ethiopia, European Union Energy initiative, in cooperation with the Ethiopian Ministry for Water and Energy, Germa-ny, 2013
Direct communication with the Ministry of Mines and Energy, Addis Ababa, 2004 to 2011.
Direct communication with the Energy Development Follow-up and Expansion Department of the Ministry of Infrastructure, Addis Ababa, 2004 and 2005.
Direct communication with the Ministry of Finance and Economic Development, Addis Ababa, 1998 to 2003.
The UN Energy Statistics Database.
IEA secretariat estimates.
Sources up to 1991:
Ten Years of Petroleum Imports, Refinery Products, and Exports, Ministry of Mines & Energy, Addis Ab-aba, 1989.
Energy Balance for the Year 1984, Ministry of Mines & Energy, Addis Ababa, 1985.
1983 Annual Report, National Bank of Ethiopia, Addis Ababa, 1984.
Quarterly Bulletin, National Bank of Ethiopia, Addis Ababa, various editions from 1980 to 1985.
Sources for Biofuels and waste:
Biomass Data 2007-2012, Ministry of Water and Energy, Addis Ababa, 2012.
IEA secretariat estimates up to 2006 based on 1992 data from Eshetu and Bogale, Power Restructuring in Ethiopia, AFREPREN, Nairobi, 1996.
Former Yugoslav Republic of Macedonia
Data for FYR of Macedonia are available starting in 1990. Prior to that, they are included in Former Yugoslavia.
The FYR of Macedonia has changed the methodology for reporting autoproducer heat consumption for own use in 2010, which can lead to breaks in time series between 2009 and 2010.
Sources 1990 to 2013:
Direct communication with the State Statistical Office of Macedonia, Department for Environment, Energy and Transport, Skopje.
Joint IEA/Eurostat/UNECE annual energy questionnaires.
IEA secretariat estimates.
Sources for Biofuels and waste:
Joint IEA/Eurostat/UNECE annual energy question-naires, IEA secretariat estimates,
UN Energy Statistics Database and Forestry Statistics, FAO, Rome, 2000.
Gabon
Sources 1992 to 2013:
Statistiques économiques, Banque des Etats de l’Afrique Centrale (BEAC), online database, 2011.
Annuaire Statistique du Gabon, Ministère de l’économie, du commerce, de l’industrie et du tou-risme, Libreville, 2001 to 2007 and 2004 to 2008, 2011.
Direct communication with the Direction Générale de L'Energie, Libreville, 2003 to 2008.
Rapport annuel de la SEEG, Société d’Énergie et d’Eau du Gabon, Libreville, various editions from 2000 to 2012.
Direct communication with the Société Gabonaise de Raffinage, Port Gentil, 1997, 2000 to 2006, 2008 to 2009.
Tableau de Bord de l'Economie, Situation 1997, Pers-pectives 1998-1999, Direction Générale de l'Econo-mie, Ministère des Finance, de l'Economie, du Budget et des participations, chargé de la privatisation, May 1998.
Rapport d'Activité, Banque Gabonaise de Dévelop-pement, Libreville, 1985, 1990, 1992 and 1993.
The UN Energy Statistics Database.
IEA secretariat estimates.
Sources up to 1991:
Tableau de Bord de l'Economie, Situation 1983 Perspective 1984-85, Ministère de l'Economie et des Finances, Direction Générale de l'Economie, Libreville, 1984.

62 - ENERGY STATISTICS OF NON-OECD COUNTRIES: DATABASE DOCUMENTATION (2015 revised edition)
INTERNATIONAL ENERGY AGENCY
Sources for Biofuels and waste:
IEA secretariat estimates based on 1991 data from Forests and Biomass Sub-sector in Africa, African Energy Programme of the African Development Bank, Abidjan, 1996.
Georgia
Data for Georgia are available starting in 1990. Prior to that, they are included in Former Soviet Union.
Heat production has stopped in 2011 due to the shut-down of combined heat and power plants.
Time series data from 1990 to 2012 for coal were re-vised in 2014 due to the reclassification of other bitumi-nous to sub-bituminus coal based on newly available information.
Data on international marine bunkers for Georgia are not currently available, however upcoming local surveys are planned and should make this information available in future years.
The gathering of energy data as well as the comple-tion of the questionnaires is now the responsibility of the National Statistical Office (GEOSTAT), whereas it used to be the responsibility of the Energy Efficien-cy Centre. This may lead to breaks in time series be-tween 2012 and 2013.
Sources 2013:
Direct communication with GEOSTAT. The National Statistical Office started submitting Joint IEA/Eurostat/UNECE questionnaires in 2015 (2013 data).
Sources 2008 to 2012:
Direct communication with the Energy Efficiency Centre Georgia, Tbilisi.
Sources for 2013:
Joint IEA/Eurostat/UNECE annual energy question-naires. Oil, Natural gas, Coal, Electricity and heat, Renewables, submitted by the National Statistics Office of Georgia, Tbilisi.
IEA secretariat estimates.
Sources 1990 to 2008:
Official Energy Balance of Georgia 1990-1999, 2000-2008, Ministry of Economy and Ministry of Energy, Tbilisi.
IEA secretariat estimates.
Ghana
Primary solid biomass figures for 2000-2012 were revised in the 2015 edition, as new information be-came available. Breaks in time series might occur be-tween 1999 and 2000.
Data were revised for electricity, oil products and bio-fuels until 2000 and from 2009 to 2012 based on new information received from the Energy Commission. Breaks in time series may occur in the time series for these products.
Sources 1992 to 2013:
Energy Statistics 2000-2013, Energy Commission, Accra, 2013.
Direct communication with the Energy Commission, Accra, 2004 and since 2009.
Detailed Statistics of Petroleum Products Consumption 1999-2008, National Petroleum Authority, Accra, 2009.
National Energy Statistics, Ministry of Energy and Mines, Accra, 2000.
Quarterly Digest of Statistics, Government of Ghana, Statistical Services, Accra, March 1990, March 1991, March 1992, March 1995.
Energy Balances, Volta River Authority, Accra, vari-ous editions from 1970 to 1985.
IEA secretariat estimates.
Sources for Biofuels and waste:
Ministry of Mines and Energy, the UN Energy Statis-tics Database.
IEA secretariat estimates.
Gibraltar
In this edition, time series for residual fuel oil and gas/diesel oil consumed as international marine bunkers were revised based on newly available information.
Sources up to 2013:
Abstract of Statistics, Government of Gibraltar, Gibraltar, various editions up to 2013.
Gibraltar Port Authority, Gibraltar, 2015.Gibraltar Electricity Authority, Gibraltar, 2008.
IEA secretariat estimates.
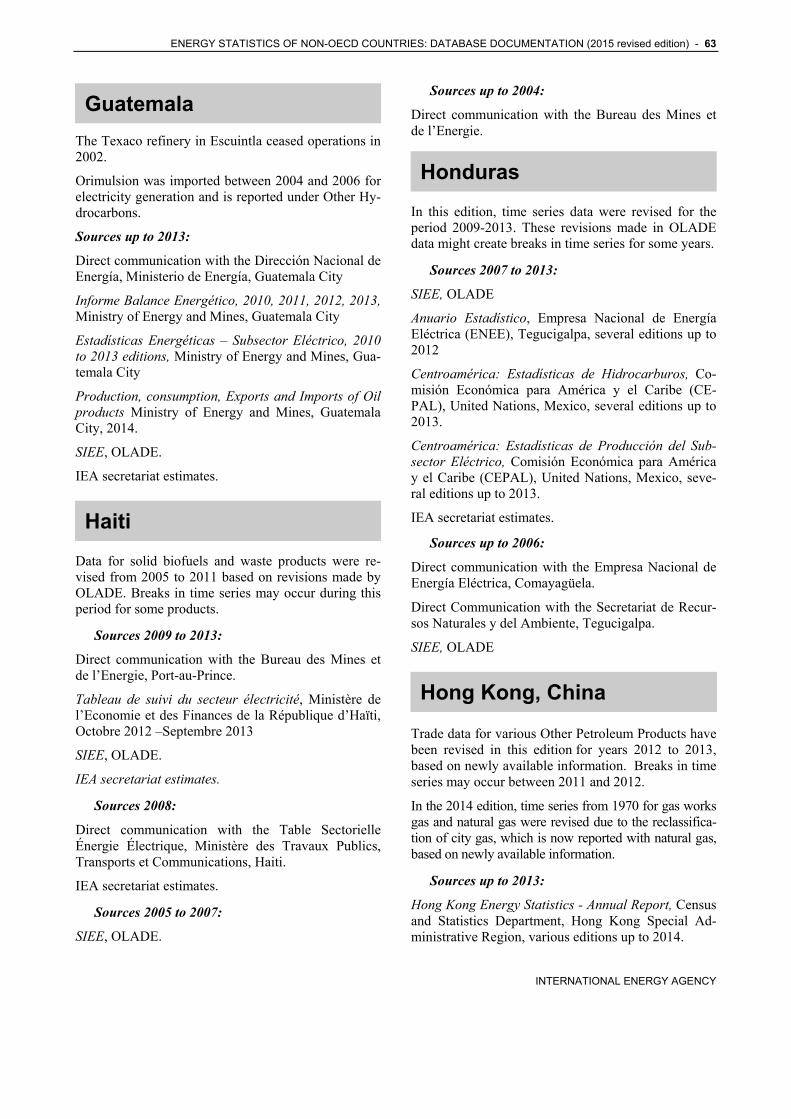
ENERGY STATISTICS OF NON-OECD COUNTRIES: DATABASE DOCUMENTATION (2015 revised edition) - 63
INTERNATIONAL ENERGY AGENCY
Guatemala
The Texaco refinery in Escuintla ceased operations in 2002.
Orimulsion was imported between 2004 and 2006 for electricity generation and is reported under Other Hy-drocarbons.
Sources up to 2013:
Direct communication with the Dirección Nacional de Energía, Ministerio de Energía, Guatemala City
Informe Balance Energético, 2010, 2011, 2012, 2013, Ministry of Energy and Mines, Guatemala City
Estadísticas Energéticas – Subsector Eléctrico, 2010 to 2013 editions, Ministry of Energy and Mines, Gua-temala City
Production, consumption, Exports and Imports of Oil products Ministry of Energy and Mines, Guatemala City, 2014.
SIEE, OLADE.
IEA secretariat estimates.
Haiti
Data for solid biofuels and waste products were re-vised from 2005 to 2011 based on revisions made by OLADE. Breaks in time series may occur during this period for some products.
Sources 2009 to 2013:
Direct communication with the Bureau des Mines et de l’Energie, Port-au-Prince.
Tableau de suivi du secteur électricité, Ministère de l’Economie et des Finances de la République d’Haïti, Octobre 2012 –Septembre 2013
SIEE, OLADE.
IEA secretariat estimates.
Sources 2008:
Direct communication with the Table Sectorielle Énergie Électrique, Ministère des Travaux Publics, Transports et Communications, Haiti.
IEA secretariat estimates.
Sources 2005 to 2007:
SIEE, OLADE.
Sources up to 2004:
Direct communication with the Bureau des Mines et de l’Energie.
Honduras
In this edition, time series data were revised for the period 2009-2013. These revisions made in OLADE data might create breaks in time series for some years.
Sources 2007 to 2013:
SIEE, OLADE
Anuario Estadístico, Empresa Nacional de Energía Eléctrica (ENEE), Tegucigalpa, several editions up to 2012
Centroamérica: Estadísticas de Hidrocarburos, Co-misión Económica para América y el Caribe (CE-PAL), United Nations, Mexico, several editions up to 2013.
Centroamérica: Estadísticas de Producción del Sub-sector Eléctrico, Comisión Económica para América y el Caribe (CEPAL), United Nations, Mexico, seve-ral editions up to 2013.
IEA secretariat estimates.
Sources up to 2006:
Direct communication with the Empresa Nacional de Energía Eléctrica, Comayagüela.
Direct Communication with the Secretariat de Recur-sos Naturales y del Ambiente, Tegucigalpa.
SIEE, OLADE
Hong Kong, China
Trade data for various Other Petroleum Products have been revised in this edition for years 2012 to 2013, based on newly available information. Breaks in time series may occur between 2011 and 2012.
In the 2014 edition, time series from 1970 for gas works gas and natural gas were revised due to the reclassifica-tion of city gas, which is now reported with natural gas, based on newly available information.
Sources up to 2013:
Hong Kong Energy Statistics - Annual Report, Census and Statistics Department, Hong Kong Special Ad-ministrative Region, various editions up to 2014.

64 - ENERGY STATISTICS OF NON-OECD COUNTRIES: DATABASE DOCUMENTATION (2015 revised edition)
INTERNATIONAL ENERGY AGENCY
Hong Kong Merchandise Trade Statistics – Domestic Exports and Re-exports/ Imports, Census and Statis-tics Department, Hong Kong Special Administrative Region, various editions up to December 2014.
Direct communication with The Hongkong Electric Company, Ltd, Hong Kong.
China Light & Power - Annual Report, China Light & Power Group, Hong Kong, several editions up to 2014.
China Light & Power – Facility Performance Statis-tics, China Light & Power Group, Hong Kong, several editions up to 2014.
Hong Kong Monthly Digest of Statistics, Census and Statistics Department, Hong Kong, various editions to 1994.
Towngas -Annual Report, The Hong Kong and China Gas Company Ltd., Hong Kong, several editions up to 2013.
Sources for Biofuels and waste:
The UN Energy Statistics Database, Hong Kong En-ergy Statistics - Annual Report 2003, and IEA secretar-iat estimates.
Hong Kong Energy End-use Data, EMSD, The Elec-trical & Mechanical Services Department, Govern-ment of Hong Kong, several editions up to 2013.
India
Data are reported on a fiscal year basis. Data for 2013 correspond to April 1st, 2013 – March 30th, 2014.
Observations:
Coal
In this edition, significant revisions of the net calorific values of the different types of coal have been made for the whole time series, based on official data as well as IEA and other expert estimates. As a result, there may be significant changes for the coal data when presented in energy units, as well as in the cal-culated efficiency of coal fired power generation. Da-ta on the production and consumption of secondary coal products may have also been revised as a result.
From 2008, due to a notable discrepancy between of-ficial coal imports from India and coal exports to In-dia as reported by trade partners, imports of coking coal and non-coking coal are estimated by the IEA secretariat, based on trade partners’ data. The break-down of non-coking coal imports between bituminous
coal and sub-bituminous coal is estimated from 2008. This could lead to breaks in time series between 2007 and 2008.
Coking coal figures for India do not align with IEA definitions as they include production of non-metallurgical coking coal reported by India. Figures may be revised in future editions to include only washed coking coal.
Due to data limitations, IEA secretariat estimates are used for some products and flows, including supply and demand of coke oven gas and blast furnace gas. Coke oven coke production is estimated from 2006 based on growth of blast furnace iron production, as official production data do not include production from small private producers.
Oil
Information on stock changes of crude oil and oil products, available from the JODI database from April 2011, was added to the 2014 edition. Breaks in time series may appear in stock changes between 2010 and 2011.
In the 2014 edition, based on revisions performed by the Ministry of Petroleum and Gas, refinery intake was split between crude oil and refinery feedstocks from 1999. The refinery feedstocks reported by the IEA secretariat correspond to the quantities officially reported as “other inputs” to Reliance Refineries. They do not include additives and refinery feedstocks to other Indian refineries. These missing inputs could reach up to 2.5 million tonnes.
In the 2014 edition, data for diesel consumption were revised based on an official survey on the end use of diesel retail sales, see references below. The IEA secre-tariat classifies the diesel used in mobile phone towers and non-industry power generators as input to autopro-ducer electricity generation. A corresponding electricity output is estimated.
No NGL production is officially reported by India. The NGL production estimated by the IEA secretariat corresponds to the production of oil products from gas separation plants, known in India as “fractionators”. In the IEA methodology, the output of oil products from gas separation plants comes from an input of NGL and the separation process is shown in the trans-fer row. Prior to 2005-06, the split of fractionator out-put between petroleum products is estimated by the IEA secretariat.
No breakdown of refinery fuel by products is current-ly officially available. In this edition, refinery gas

ENERGY STATISTICS OF NON-OECD COUNTRIES: DATABASE DOCUMENTATION (2015 revised edition) - 65
INTERNATIONAL ENERGY AGENCY
production has been estimated based on expected re-finery output for the years 2009-2013. In addition, refinery gas may also include other oil products used, such as residual fuel oil, in Indian refineries and not only refinery gas, as per IEA definitions.
Due to notable breaks in official data for fuel oil, con-sumption of fuel oil in international marine bunkers is estimated from 1990 based on industry sources, and final consumption of fuel oil is estimated from 2004 based on 2003 data.
Natural gas
In the 2014 edition, natural gas imports for India were revised from 2008 based on Indian Customs data, in order to include all LNG importers.
No data are officially available on the sectoral con-sumption of re-gasified LNG and city gas. The break-down is estimated by the IEA secretariat.
Renewables
Due to data limitations, use of biogas produced in family biogas plants for cooking is currently not esti-mated by the IEA secretariat.
Data for biofuels production are based on USDA-estimates for the calendar year.
Only information on total on-grid generation from renewables is officially available. The breakdown between sources was estimated by the IEA secretariat using official data on capacities from MNRE from 2007. Total off-grid generation and split by sources are estimated based on capacities from 2007 onward.
According to newly available information, estimates of solar thermal output up to 2012 may include sys-tems that were out of operation. For this reason, a break in the time series might occur between 2012 and 2013.
In this edition, estimates of the production and con-sumption of charcoal have been added for the whole time series, as well as the respective inputs of fuel-wood to charcoal production plants.
Electricity
Data for total electricity generation include estimates for electricity generation from diesel by non-industrial autoproducers as well as off-grid electricity genera-tion from renewable energy.
In this edition, data on the electricity consumption by industrial sub-sector have been added for the years
2008-2012. 2013 data have been estimated by the IEA secretariat.
Sources 1992 to 2013:
Direct communication with the Central Statistical Of-fice, Ministry of Statistics and Programme Implemen-tation, Government of India, New Delhi.
Energy Statistics, Central Statistical Office, Ministry of Statistics and Programme Implementation, New Delhi, various editions up to 2013-14.
Monthly Abstract of Statistics, Ministry of Planning, Central Statistics Organisation, Department of Statistics, New Delhi, various editions from 1984 to 2000.
Coal
Direct communication with the Coal Controller’s Office, Ministry of Coal, Government of India, Kolkata.
Coal Directory of India, Coal Controller's Office, Ministry of Coal, Kolkata, various editions up to 2013-2014.
Annual Review of Coal Statistics, Coal Controller's Office, Ministry of Coal, Kolkata, various editions from 1993-1994 to 1998-1999.
Oil and Natural Gas
Direct communication with the Economic Division and Petroleum Planning and Analysis Cell, Ministry of Petroleum and Natural Gas, Government of India, New Delhi.
Indian Petroleum and Natural Gas Statistics, Ministry of Petroleum and Natural Gas, New Delhi, various editions from 2000-01 to 2013-14.
Annual Report 1993-1994, 1998-1999, Ministry of Petroleum and Natural Gas, New Delhi, 1995, 2000.
Petroleum and Natural Gas data, website of Petrole-um Planning and Analysis Cell, Ministry of Petroleum and Natural Gas, New Delhi, www.ppac.org, accessed on 08.04.2015.
All India Study on Sectoral Demand of Diesel and Petrol, Petroleum Planning and Analysis Cell, Minis-try of Petroleum and Gas, New Delhi, January 2014.
Report of the Working Group on Fertilizer Industry for the Twelfth Plan (2012-12 to 2016-17), Depart-ment of Fertilizers, Ministry of Chemical & Fertiliz-ers, Government of India, New Delhi, 2012.
“Vision 2030”, Natural Gas Infrastructure in India, Report by Industry Group for Petroleum & Natural

66 - ENERGY STATISTICS OF NON-OECD COUNTRIES: DATABASE DOCUMENTATION (2015 revised edition)
INTERNATIONAL ENERGY AGENCY
Gas Regulatory Board, Petroleum & Natural Gas Regulatory Board, New Delhi, May 2013.
Report of the Inter-Ministerial Committee on Policy for Pooling of Natural Gas Prices and Pool Operat-ing Guidelines, Planning Commission, Government of India, New Delhi, August 2011.
LNG imports, website of the Department of Commerce, Ministry of Commerce and Industry, New Delhi, http://commerce.nic.in/, accessed on 08.04.2015.
Commodity-wise traffic handled at major ports 2002-03 to 2012-13 (p), website of the Ministry of Ship-ping, New Delhi, shipping.nic.in, accessed on 08.04.2015.
Joint Oil Data Initiative (JODI) online database.
India – On the Move, World Bunkering, The Interna-tional Bunker Industry Association, London, Spring 2012.
Renewables
Direct communication with the Ministry of New and Renewable Energy, Government of India, New Delhi.
Physical Targets and Achievements During the 11th Plan, Ministry of New and Renewable Energy, Open Government Data Platform India, data.gov.in.
Renewable Energy in India: Progress, Vision and Strategy, Ministry of New and Renewable Energy, 2010.
Solar Water Heaters in India: Market Assessment studies and surveys for different sectors and demand segments, report by GreenTech Knowledge Solutions, submitted to Project Management Unit, Global Solar Water Heating Project, Ministry of New and Renewa-ble Energy, January 2010.
Annual Report 1994-1996, 1998-1999, Ministry of Energy, Department of Non-Conventional Energy, New Delhi, 1996 and 1999.
Solar Heat Worldwide, AEE - Institute for Sustainable Technologies, Gleisdorf, various editions up to 2014.
India – Biofuels Annual 2014, Gain Report, USDA Foreign Agriculture Service, New Dehli, January 2014.
Energy Data Directory, Yearbook "TEDDY", and An-nual Report, The Energy and Resources Institute "TERI", New Delhi, 1986-1988, 1990, 1994-2000, 2014-15.India’s Energy Sector, July 1995, Center for Monitoring Indian Economy PVT Ltd., Bombay, 1995.
Monthly Review of the Indian Economy, Center for Monitoring Indian Economy PVT Ltd., New Delhi, various issues from 1994 to June 1999.
Electricity
Direct communication with the Central Electricity Authority, Ministry of Power, Government of India, New Delhi.
Growth of Electricity Sector in India from 1947-2013, Central Electricity Authority, Ministry of Power, New Delhi, July 2015.
All India Electricity Statistics General Review 1998-99, 2000-01 to 2008-09, 2011-12, Central Electricity Authority, Ministry of Power, New Delhi, 2000, 2002 to 2010, 2015.
Monthly Generation Review, March 2014, Central Electricity Authority, Ministry of Power, New Delhi, 2014.
Annual Survey of Industries Volume-I 2008-2009 to 2012-13. Ministry of Statistics and Programme Im-plementation, Central Statistics Office, Kolkata.
Sources up to 1991:
Indian Oil Corporation Limited 1987-88 Annual Re-port, Indian Oil Corporation Limited, New Delhi, 1989-1992.
Report 1986-87, Ministry of Energy, Department of Coal, New Delhi, 1981 to 1987.
Annual Report 1986-1987, Ministry of Energy, Depart-ment of Non-Conventional Energy, New Delhi, 1987.
Economic Survey, Ministry of Finance, New Delhi, various editions from 1975 to 1986.
Statistical Outline of India, Ministry of Finance, New Delhi, 1983, 1984, 1986, 1987.
Monthly Coal Bulletin, vol xxxvi no.2., Ministry of Labour, Directorate General of Mines Safety, New Delhi, February 1986.
General Review, Public Electricity Supply, India Sta-tistics, Central Electricity Authority, New Delhi, 1982 to 1985.
Sources for Biofuels and waste:
The UN Energy Statistics Database.
Forestry Statistics, FAO,Rome, 2015.
IEA secretariat estimates, based on a per capita aver-age consumption from various surveys and direct

ENERGY STATISTICS OF NON-OECD COUNTRIES: DATABASE DOCUMENTATION (2015 revised edition) - 67
INTERNATIONAL ENERGY AGENCY
communication with the former Ministry of Non-conventional Energy Sources.
Indonesia
In this edition, electricity consumption for the agricul-tural sector is estimated by the IEA secretariat for 2005-2013. This may lead to breaks in time series between 2004-2005.
Discrepancies exist between official data for coal trade in Indonesia. Export figures from 2011 are based on Customs (BPS) data.
Non-specified industry consumption, high in official data, is re-estimated by the IEA secretariat.
Because of these changes, breaks in time series may occur between 2010 and 2011, and changes in trends may occur compared to previous publications.
The production and allocation of coal among the vari-ous coal products between 2000 and 2013 are estimat-ed by the IEA secretariat due to data collection limita-tions and discrepancies in trade data.
Sources 2008 to 2013:
Direct communication with the Centre for Data and Information Energy (PUSDATIN), Ministry of Ener-gy and Mineral Resources, Jakarta.
Statistik, Minyak & Gas Bumi, Directorate General of Oil and Gas, Ministry of Energy and Mineral Re-sources (ESDM), Jakarta, various editions up to 2013.
Handbook of Energy & Economic Statistics of Indo-nesia, Centre for Energy Information, Ministry of Ener-gy and Mineral Resources (ESDM), Jakarta, various editions up to 2014.
Trade data on coal, charcoal for 1999-2013, website of the Central Bureau of Statistics of the Republic of Indonesia.
Irrigation management to increase agriculture pro-duction. Ministry of Agriculture Republic of Indone-sia, Jakarta, 2012.
PLN Statistics, PT.PLN (Persero), Jakarta, various edi-tions up to 2013.
Direct communication with PT PLN (Persero), Jakarta.
Direct communication with the Indonesia Coal Mining Association, Jakarta.
IEA secretariat estimates.
Sources 1992 to 2007:
Indonesia Mineral and Coal Statistics, Directorate of Coal and Mineral Resources, Jakarta, 1998 to 2007.
Statistics on Electricity and Energy, 1998 to 2004, Directorate General of Electricity and Energy Utilisa-tion, Jakarta, 1999 to 2005.
Oil and Gas Statistics of Indonesia, Directorate General Oil and Gas, Jakarta, various editions 1981 to 2007.
The Petroleum Report Indonesia, various editions, U.S. Embassy in Jakarta, Jakarta, 1986 to 2008.
Oil and Gas Data Information, 6th Edition, Directorate General Oil and Gas, Jakarta, 2002.
Statistik Perminyakan Indonesia 1995 to 1999, Indo-nesia Oil and Gas Statistics, Directorate General of Oil and Gas, Jakarta, 2001.
Neraca energy 2000, Energy Balance of Indonesia 2000, Asean Center for Energy.
Mining and Energy Yearbook, 1998, Ministry of Mines and Energy, Jakarta, 1998.
APEC annual energy statistics questionnaires.
Direct communication with Directorate General of Coal and Mineral Resources, Directorate General Oil and Gas, and Directorate General of Electricity and Energy Utilisation of the Ministry of Energy and Mineral Resources.
Direct communication with the Indonesian Institute for Energy Economics, 2004 and 2005.
Direct communication with the ASEAN Centre for Energy, 2005.
Sources up to 1991:
Indonesian Financial Statistics, Bank of Indonesia, Jakarta, 1982.
Indikator Ekonomi 1980-1985, Biro Pusat Statistik, Jakarta, 1986.
Statistical Yearbook of Indonesia, Biro Pusat Statistik, Jakarta, 1978 to 1984 and 1992.
Statistik Pertambangan Umum, 1973-1985, Biro Pusat Statistik, Jakarta, 1986.
Energy Planning for Development in Indonesia, Di-rectorate General for Power, Ministry of Mines and Energy, Jakarta, 1981.
Commercial Information, Electric Power Corporation, Perusahaan Umum Listrik Negara, Jakarta, 1984, 1985.

68 - ENERGY STATISTICS OF NON-OECD COUNTRIES: DATABASE DOCUMENTATION (2015 revised edition)
INTERNATIONAL ENERGY AGENCY
Sources for Biofuels and waste:
Annual GAIN Report, United States Department of Agriculture, 2012
The UN Energy Statistics Database and IEA secretar-iat estimates.
Direct communication with Indonesian Biofuel Pro-ducer Association (APROBI), Jakarta.
Islamic Republic of Iran
Data are reported according to the Iranian calendar year. Data for 2013 correspond to 20 March 2013 – 19 March 2014.
Crude oil production and export data do not include field condensate. Field condensate quantities are in-cluded with natural gas liquids.
Statistical differences in the Islamic Republic of Iran statistics and balances can include stock change for some coal and oil products.
More detailed information for the consumption of coke oven coke became available for 2009-2012. Breaks in time series may occur between 2008 and 2009.
Sources for 2013:
Annual Statistical Bulletin, Organization of Petroleum Exporting Countries (OPEC), Vienna, various editions up to 2013.
Natural Gas in the World, Cedigaz, Paris, various editions up to 2013.
BP Statistical Review of World Energy 2014.
World Development Indicators, The World Bank, Washington, various editions up to 2013.
IEA secretariat estimates.
Sources 1999 to 2012:
Direct communication with the Ministry of Energy, Teheran.
Energy Balance of Iran, Department of Energy, Teheran, various editions up to the Iranian year 1391, Teheran.
IEA secretariat estimates.
Sources 1992 to 1998:
Direct communication with the Ministry of Energy, Office of Deputy Minister for Energy, Teheran, 1998.
Direct communication with the Ministry of Petroleum, Teheran, 1999.
Electric Power in Iran, Ministry of Energy, Power Planning Bureau, Statistics Section, Teheran, 1992.
Sources up to 1991:
Electric Power in Iran, Ministry of Energy, Power Planning Bureau, Statistics Section, Teheran, 1967 to 1977, 1988, 1990, 1991.
Ministry of Energy, Office of Deputy Minister for Energy, Teheran, 1971 to 1991.
Sources for Biofuels and waste:
The UN Energy Statistics Database; Forestry Statistics, FAO, Rome, 2000.
IEA secretariat estimates.
Direct communications with the Ministry of Energy, Teheran.
Iraq
Crude oil production and export data do not include field condensate. Field condensate quantities are in-cluded with natural gas liquids.
Crude oil export data include back-blending of fuel oil.
Sources 1998 to 2013:
Online Statistics, Iraq Ministry of Oil.
Direct communication with the Ministry of Oil, Min-istry of Electricity, Ministry of Planning and Devel-opment Cooperation and with the Central Organization for Statistics and Information Technology.
Annual Statistical Bulletin, Organization of Petroleum Exporting Countries (OPEC), Vienna, various editions up to 2013.
Annual Statistical Report, Organization of Arab Petro-leum Exporting Countries (OAPEC), Kuwait, various editions up to 2013.
Joint Oil Data Initiative (JODI) online database.
Statistical Bulletin, Arab Union of Producers, Trans-porters and Distributors of Electricity (AUPTDE), Amman, various editions up to 2013.
Iraq Weekly Status Report, US Department of State 2003 to 2004.

ENERGY STATISTICS OF NON-OECD COUNTRIES: DATABASE DOCUMENTATION (2015 revised edition) - 69
INTERNATIONAL ENERGY AGENCY
IEA secretariat estimates.Sources up to 1997:
The UN Energy Statistics Database.
IEA secretariat estimates.
Jamaica
In this edition, new information became available on industrial consumption of oil products and electricity. This may lead to breaks in time series between 2007 and 2008 data as well as differences with previous editions.
Sources 2007 to 2013:
National energy balance & various statistics, Ministry of Science, Technology, Energy and Mining of Jamai-ca, Kingston, 2012-2013.
Annual report, Jamaica Public Service Company, Kingston, 2012-2013.
SIEE, OLADE.
Petroleum Industry Consumption Statistics Jamaica 2003-2008, Petroleum Corporation of Jamaica, Kingston.
Import Statistics 2006-2007, Petrojam limited, Kingston
Direct communication with the Office of Utilities Regulation, Kingston, 2008.
IEA secretariat estimates.
Sources 1991 to 2006:
SIEE, OLADE.
IEA secretariat estimates.
Sources up to 1990:
National Energy Outlook 1985-1989, Petroleum Cor-poration of Jamaica, Economics and Planning Divi-sion, Kingston, 1985.
Energy and Economic Review, Petroleum Corporation of Jamaica, Energy Economics Department, Kingston, September 1986, December 1986 and March 1987.
Production Statistics 1988, Planning Institute of Jamaica, Kingston, 1989.
Statistical Digest, Research and Development Divi-sion, Bank of Jamaica, Kingston, 1984, 1985, 1986, 1989, 1990.
Sources for Biofuels and waste:
SIEE, OLADE.
Jordan
Due to an attack on a major natural gas pipeline be-tween Egypt and Jordan during the revolution in Egypt, Jordan relied much more on fuel oil and diesel for power generation from 2011 onwards.
Sources 2005 to 2013:
Direct communication with the Ministry of Energy and Mineral Resources, Amman.
Annual Report, National Electric Power Company, Amman, various editions up to 2014.
IEA secretariat estimates.
Sources 1992 to 2004:
Direct communication with the National Electric Power Company, Amman.
Annual Report, National Electric Power Company, Amman, 1996, 1997, 1999 to 2004.
Annual Report 1992, 1993, Jordan Electricity Authority, Amman, 1993, 1994.
Energy and Electricity in Jordan 1992, 1993, 1994, 1995, Jordan Electricity Authority, Amman, 1993 to 1996.
Statistical Yearbook, 1994, Department of Statistics, Amman, 1995.
44th Annual Report for the year ending 31st December 1999, Jordan Petroleum Refinery Company, Amman, 2000.
IEA secretariat estimates.
Sources up to 1991:
Monthly Statistical Bulletin, Central Bank of Jordan, Department of Research Studies, Amman, various issues.
Statistical Yearbook, Department of Statistics, Amman, 1985, 1986 and 1988.
1986 Annual Report, Ministry of Energy and Mineral Resources, Amman, 1987.
1989 Annual Report, Ministry of Energy and Mineral Resources, Amman, 1990.
Sources for Biofuels and waste:
Forestry Statistics, FAO, Rome, 2000.
IEA secretariat estimates.

70 - ENERGY STATISTICS OF NON-OECD COUNTRIES: DATABASE DOCUMENTATION (2015 revised edition)
INTERNATIONAL ENERGY AGENCY
Kazakhstan
Data for Kazakhstan are available starting in 1990. Prior to that, they are included in Former Soviet Union.
As a result of important work done by the Statistical Of-fice of Kazakhstan, the IEA secretariat was able to switch to the Joint IEA/Eurostat/UNECE questionnaires as a primary source for Kazakhstan’s data from 2012 onwards. Breaks in time series may appear between 2011 and 2012 as a result of this change.
In 2010, Kazakhstan became a member of a Customs Union with Russia and Belarus. Breaks in trade time series appear from 2009 to 2012 as the Customs shifted from one accounting system to another.
Kazakhstan’s coal data are normally not disaggregated by coal type. The disaggregation presented in the IEA energy balances is achieved by considering the typical end uses for different types of coals. This may lead to large statistical differences for some types of coal.
Natural gas production excludes re-injection but, due to data limitations, may include gas vented or flared.
In order to be consistent with the Customs Union agreements between Russia and Kazakhstan, natural gas production and exports include raw gas produc-tion from the Karachaganak field (not marketable gas as per IEA definition).
Own use may include gas vented or flared.
Natural gas trade data have been revised by Kazakhstan leading to large statistical differences for 2012 and 2013.
Sources for 2013:
Direct communication with the Agency on Statistics of the Republic of Kazakhstan, Astana.
Joint IEA/Eurostat/UNECE annual energy question-naires 2013.
IEA secretariat estimates.
Sources 1993 to 2011:
Direct communication with the Agency on Statistics of the Republic of Kazakhstan, Astana.
Fuel and Energy Balance of Kazakhstan Republic, Agency on Statistics of the Republic of Kazakhstan, Astana, various editions up to 2010.
Joint IEA/Eurostat/UNECE annual energy question-naires, 1993, 1995, 1997 to 2009.
Statistical Yearbook “Kazakhstan in 2009”, Agency on Statistics of the Republic of Kazakhstan, Astana, 2010.
IEA secretariat estimates.
Sources 1990 to 1992:
IEA secretariat estimates.
Sources for Biofuels and waste:
Fuel and Energy Balance of Kazakhstan Republic, Agency on Statistics of the Republic of Kazakhstan, Astana, various editions up to 2010.
Forestry Statistics, FAO, Rome, 2000.
IEA secretariat estimates.
Kenya
As of 2001, electricity data are reported on a fiscal year basis, beginning on the 1st of July and ending on the 30th June of the subsequent year.
Stock changes for lubricants may include informal trade.
Sources 2005 to 2013:
Economic Survey, Central Bureau of Statistics, Nairobi, various editions up to 2014.
Direct communication with AFREPREN and Petrole-um Institute of East Africa, Nairobi, up to 2008.
Kenya, Facts and figures, 2006 Edition, Central Bu-reau of Statistics, Nairobi.
Annual Report and Accounts, 2006/07 to 2013/14 the Kenya Power & Lighting Company Limited, Nairobi.
IEA secretariat estimates.
Sources 1992 to 2004:
Direct communication with the Ministry of Energy, Nairobi.
Economic Survey, 1995 to 2004, Central Bureau of Statistics, Nairobi.
Annual Report and Accounts, 2001/02, 2002/03, 2003/2004, 2004, 2005, the Kenya Power & Lighting Company Limited, Nairobi.
The UN Energy Statistics Database.
Sources up to 1991:
Economic Survey, Government of Kenya, Nairobi, 1989.

ENERGY STATISTICS OF NON-OECD COUNTRIES: DATABASE DOCUMENTATION (2015 revised edition) - 71
INTERNATIONAL ENERGY AGENCY
Economic Survey 1991, Ministry of Planning and National Development, Central Bureau of Statistics, Nairobi, 1992.
Kenya Statistical Digest, Ministry of Planning and National Development, Central Bureau of Statistics, Nairobi, 1988.
Sources for Biofuels and waste:
Data for 2000 are based on research carried out by the Ministry of Energy on consumption of solid biofuels. The results of this research were published as part of a National Energy Policy initiative.
IEA secretariat estimates based on 1991 data from Forests and Biomass Sub-sector in Africa, African Energy Programme of the African Development Bank, Abidjan, 1996.
Kosovo
Data for Kosovo are available starting in 2000. Prior to that, they are included in Serbia.
2011 is the first year when electricity transit trade data are available. As a result, a break in time series occurs between 2010 and 2011.
In 2011, a desulphurization unit operated in Kosovo for a few months only. As a result, breaks in time se-ries occur between 2010-2011 and 2011-2012.
Sources 2011-2013:
Direct communication with the Ministry of Energy and Mining, Pristina, Kosovo.
Joint IEA/Eurostat/UNECE annual energy questionnaires.
Sources 2003 to 2010:
Kosovo National Energy Balances, Ministry of Energy and Mining Department of Strategy, Standards and Statistics from 2003 to 2010.
IEA secretariat estimates
Sources 2000 to 2002:
IEA secretariat estimates.
Kuwait
Crude oil production and export data do not include field condensate. Field condensate quantities are in-cluded with natural gas liquids.
Data for crude oil production include 50 per cent of the output of the Neutral Zone.
Information for the use of ethane in the petrochemical sector is available from 2008 onward. This may lead to breaks in time series for ethane and naphtha pro-duction and consumption between 2007 and 2008.
Sources 1992 to 2013:
Statistical Bulletin, Arab Union of Producers, Trans-porters and Distributors of Electricity (AUPTDE), Amman, 2011 to 2014.
Direct communication with the Ministry of Oil, Economic Affairs, Energy Research, Safat, 2005, 2007 to 2014.
Annual Electrical Statistics, Ministry of Electricity and Water, Safat, various editions up to 2009.
Annual Statistical Bulletin, Organization of Petroleum Exporting Countries (OPEC), Vienna, various editions up to 2014.
Annual Statistical Report, Organization of Arab Petro-leum Exporting Countries (OAPEC), Kuwait, various editions up to 2014.
Direct communication to the IEA secretariat from the Ministry of Oil, Safat, the Ministry of Planning and the Ministry of Electricity & Water, Kuwait City.
Monthly Digest of Statistics, Ministry of Planning, Central Statistical Office, Kuwait, 1999.
A Survey of the Kuwait Oil Industry, Embassy of the United States of America in Kuwait City, Kuwait, 1993.
Twelfth Annual Report 1991-1992, Kuwait Petroleum Corporation, Kuwait, 1993.
The UN Energy Statistics Database.
IEA secretariat estimates.
Sources up to 1991:
Quarterly Statistical Bulletin, Central Bank of Kuwait, Kuwait, various editions from 1986 and 1987.
The Kuwaiti Economy, Central Bank of Kuwait, Kuwait, various editions from 1980 to 1985.
Annual Statistical Abstract, Ministry of Planning, Central Statistical Office, Kuwait, 1986 and 1989.
Monthly Digest of Statistics, Ministry of Planning, Central Statistical Office, Kuwait, various editions from 1986 to 1990.
Economic and Financial Bulletin Monthly, Central Bank of Kuwait, Kuwait, various editions from 1983 to 1986.
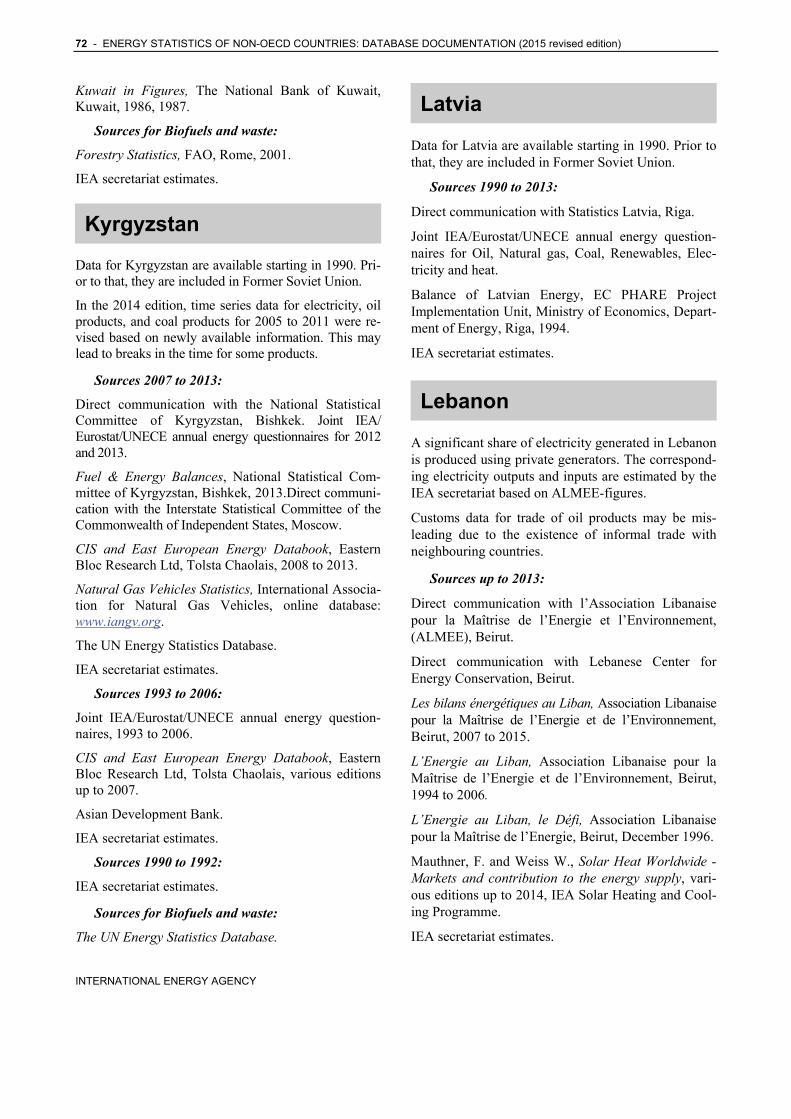
72 - ENERGY STATISTICS OF NON-OECD COUNTRIES: DATABASE DOCUMENTATION (2015 revised edition)
INTERNATIONAL ENERGY AGENCY
Kuwait in Figures, The National Bank of Kuwait, Kuwait, 1986, 1987.
Sources for Biofuels and waste:
Forestry Statistics, FAO, Rome, 2001.
IEA secretariat estimates.
Kyrgyzstan
Data for Kyrgyzstan are available starting in 1990. Pri-or to that, they are included in Former Soviet Union.
In the 2014 edition, time series data for electricity, oil products, and coal products for 2005 to 2011 were re-vised based on newly available information. This may lead to breaks in the time for some products.
Sources 2007 to 2013:
Direct communication with the National Statistical Committee of Kyrgyzstan, Bishkek. Joint IEA/Eurostat/UNECE annual energy questionnaires for 2012 and 2013.
Fuel & Energy Balances, National Statistical Com-mittee of Kyrgyzstan, Bishkek, 2013.Direct communi-cation with the Interstate Statistical Committee of the Commonwealth of Independent States, Moscow.
CIS and East European Energy Databook, Eastern Bloc Research Ltd, Tolsta Chaolais, 2008 to 2013.
Natural Gas Vehicles Statistics, International Associa-tion for Natural Gas Vehicles, online database: www.iangv.org.
The UN Energy Statistics Database.
IEA secretariat estimates.
Sources 1993 to 2006:
Joint IEA/Eurostat/UNECE annual energy question-naires, 1993 to 2006.
CIS and East European Energy Databook, Eastern Bloc Research Ltd, Tolsta Chaolais, various editions up to 2007.
Asian Development Bank.
IEA secretariat estimates.
Sources 1990 to 1992:
IEA secretariat estimates.
Sources for Biofuels and waste:
The UN Energy Statistics Database.
Latvia
Data for Latvia are available starting in 1990. Prior to that, they are included in Former Soviet Union.
Sources 1990 to 2013:
Direct communication with Statistics Latvia, Riga.
Joint IEA/Eurostat/UNECE annual energy question-naires for Oil, Natural gas, Coal, Renewables, Elec-tricity and heat.
Balance of Latvian Energy, EC PHARE Project Implementation Unit, Ministry of Economics, Depart-ment of Energy, Riga, 1994.
IEA secretariat estimates.
Lebanon
A significant share of electricity generated in Lebanon is produced using private generators. The correspond-ing electricity outputs and inputs are estimated by the IEA secretariat based on ALMEE-figures.
Customs data for trade of oil products may be mis-leading due to the existence of informal trade with neighbouring countries.
Sources up to 2013:
Direct communication with l’Association Libanaise pour la Maîtrise de l’Energie et l’Environnement, (ALMEE), Beirut.
Direct communication with Lebanese Center for Energy Conservation, Beirut.
Les bilans énergétiques au Liban, Association Libanaise pour la Maîtrise de l’Energie et de l’Environnement, Beirut, 2007 to 2015.
L’Energie au Liban, Association Libanaise pour la Maîtrise de l’Energie et de l’Environnement, Beirut, 1994 to 2006.
L’Energie au Liban, le Défi, Association Libanaise pour la Maîtrise de l’Energie, Beirut, December 1996.
Mauthner, F. and Weiss W., Solar Heat Worldwide - Markets and contribution to the energy supply, vari-ous editions up to 2014, IEA Solar Heating and Cool-ing Programme.
IEA secretariat estimates.

ENERGY STATISTICS OF NON-OECD COUNTRIES: DATABASE DOCUMENTATION (2015 revised edition) - 73
INTERNATIONAL ENERGY AGENCY
Sources for Biofuels and waste:
Le marché du solaire thermique au Liban, Associa-tion Libanaise pour la Maîtrise de l’Energie et de l’Environnement, Beirut, 2010.
Forestry Statistics, FAO, Rome, 2014.
IEA secretariat estimates.
Libya
Crude oil production and export data do not include field condensate. Field condensate quantities are in-cluded with natural gas liquids.
New information on oil and electricity is available from 2006. Breaks in time series may occur between 2005 and 2006.
Sources 1971 to 2013:
Statistical Bulletin, Central Bank of Libya,Tripoli, various editions up to 2014.
Direct communication with the Ministry of Electricity and Renewable Energy, Tripoli.
Annual Statistical Bulletin, Organization of Petroleum Exporting Countries (OPEC), Vienna, various editions up to 2013.
Annual Statistical Report, Organization of Arab Petro-leum Exporting Countries (OAPEC), Kuwait, various editions up to 2013.
Natural Gas in the World, Cedigaz, Paris, various editions up to 2013.
Statistical Bulletin, Arab Union of Producers, Trans-porters and Distributors of Electricity (AUPTDE), Amman, various editions up to 2013.
Annual Report, 2008, General Electricity Company (GECOL), Tripoli.
Statistiques d’Electricité du COMELEC, 2006, 2007, Comité Maghrébin de l’Electricité.
Statistical Abstract of Libya, 19th vol., Government of Libya, Tripoli, 1983.
IEA secretariat estimates.
Sources for Biofuels and waste:
The UN Energy Statistics Database.
IEA secretariat estimates.
Lithuania
Data for Lithuania are available starting in 1990. Prior to that, they are included in Former Soviet Union.
Lithuania shut down its only nuclear power plant in 2009 (Ignalina nuclear power plant).
In 2013 Lithuania started an industrial and municipal waste incinerator, which may lead to breaks in time series for these products.
Sources 1990 to 2013:
Direct communication with Statistics Lithuania, Vilnius.
Joint IEA/Eurostat/UNECE annual energy questionnaires.
Malaysia
For natural gas production from the Joint-Development Areas (JDA) with Thailand and with Indonesia, Malaysia reports only the production that corresponds to Malaysia. The rest is being reported as imports. For the JDA with Viet Nam, the production reported includes all the gas produced.
Data for various individual oil products (e.g. naphtha, lubricants, bitumen, etc.) had been estimated since 2010, however these estimates are no longer consid-ered appropriate and have been replaced with actual data from Malaysia which only presents these quanti-ties in aggregate form under the category other non-specified oil products.
From 2009, electricity generation from co-generators, small renewable power producers and self-generators is available. As a consequence, breaks in time series may appear for electricity between 2008 and 2009.
LPG data may include ethane.
Sources 2000 to 2013:
Direct communication with the Energy Commission, formerly known as Malaysia Energy Centre (PTM), Putrajaya.
National Energy Balance, Malaysia, Energy Commis-sion, Putrajaya, 2009 to 2013.
Electricity Supply Industry in Malaysia, Performance and Statistical Information, Malaysia Energy Comis-sion, Putrajaya, 2009 to 2013.
Electricity Supply Statistics, Malaysia Energy Infor-mation Hub, website: meih.st.gov.my, 2015.

74 - ENERGY STATISTICS OF NON-OECD COUNTRIES: DATABASE DOCUMENTATION (2015 revised edition)
INTERNATIONAL ENERGY AGENCY
Monthly exports of oil palm products, Malaysia Palm Oil Board, Kuala Lumpur.
APEC annual energy questionnaires, 2009, 2011.
National Energy Balance Malaysia, Ministry of Energy, Water and Communication, Kuala Lumpur, 2002 to 2008.
Sources up to 2000:
Direct communication with Petroliam Nacional Berhad, Kuala Lumpur, April 2001.
Sources for Biofuels and waste:
Monthly exports of oil palm products, Malaysia Palm Oil Board, Kuala Lumpur.
The UN Energy Statistics Database.
Forestry Statistics, FAO, Rome, 2002.
IEA secretariat estimates.
Malta
Good collaboration with Malta was re-established in 2015. Revised data were submitted by Malta for 2011 and 2012 to correct errors that had been noted be-fore. Differences in trends from previous editions may result because of this.
In 2011, a new power generation station fuelled by biogas became operational in Malta. This may lead to breaks in time series for some products and flows.
Sources 1971 to 2013:
Direct communication with the Central Office of Sta-tistics, Valletta.
Joint IEA/Eurostat/UNECE annual energy question-naire on Oil, 1995 to 1998, 2000, 2001, 2005 to 2012.
Joint IEA/Eurostat/UNECE annual energy question-naire on Electricity and heat, 1994 to 1998, 2000, 2001, 2003, and 2005 to 2012.
Joint IEA/Eurostat/UNECE annual energy question-naire on Renewables, 2011, 2012.
Joint IEA/Eurostat/UNECE annual questionnaire on Coal, 1994, 1995.
Solar Heat Worldwide, AEE - Institute for Sustainable Technologies, Gleisdorf, various editions up to 2010.
IEA secretariat estimates.
Sources for Biofuels and waste:
Joint IEA/Eurostat/UNECE annual energy question-naire on Renewables, 2011 to 2013.
Mauritius
Sources 1971 to 2013:
Direct communication with the Ministry of Public Utilities, Statistics Unit, Port Louis.
Website of the Statistics Mauritius under the Ministry of Public Utilities, statsmauritius.gov.mu.
Energy and Water Statistics 2013, Statistics Mauri-tius, Port Louis.
Moldova
Data for Moldova are available starting in 1990. Prior to that, they are included in Former Soviet Union.
Official figures on natural gas imports, natural gas inputs to power plants, electricity production and con-sumption are modified by the IEA secretariat to in-clude estimates for supply and demand for the autono-mous region of Stînga Nistrului (also known as the Pridnestrovian Moldavian Republic or Transnistria). Other energy production or consumption from this region is not included in the Moldovan data. This may lead to breaks in the time series for some products.
Due to the inclusion of estimated data in the Moldova energy balance, indicators for per capita energy con-sumption or energy intensity may appear inconsistent with expected trends.
In 2013, the National Bureau of Statistics revised data submitted through Joint IEA/Eurostat /UNECE question-naires from 2005 based on the International Recom-mendations for Energy Statistics. This may lead to breaks in time series for some products.
In 2014, the National Bureau of Statistics revised data submitted through Joint IEA/Eurostat /UNECE question-naires from 1993 for heat, and from 2012 for aviation bunkers, based on the International Recommendations for Energy Statistics. This may lead to breaks in time series for some products.
In 2014, solid biofuels production and consumption data were revised based on new surveys conducted in 2014. Breaks in time series between 2009 and 2010 may result because of this.

ENERGY STATISTICS OF NON-OECD COUNTRIES: DATABASE DOCUMENTATION (2015 revised edition) - 75
INTERNATIONAL ENERGY AGENCY
Sources 2008 to 2013:
For Moldova, excluding Transnistria:
Direct communication with the National Bureau of Statistics of the Republic of Moldova, Chisinau.
Joint IEA/Eurostat/UNECE annual energy question-naires on Coal, Oil Natural gas, Electricity and heat and Renewables
For natural gas imports:
Direct communication with State Statistics Service of Ukraine.
For Transnistria electricity production:
Website of Ministry of Economic Development of Transdniestrian Moldovian Republic, www.mepmr.org
IEA secretariat estimates.
Sources 1992 to 2008:
Joint IEA/Eurostat/UNECE annual energy questionnaire on Electricity and heat, 1991 to 2008.
Joint IEA/Eurostat/UNECE annual energy questionnaire on Natural gas, 1991 to 2008.
Joint IEA/Eurostat/UNECE annual energy questionnaire on Coal, 1992 to 2008.
Joint IEA/Eurostat/UNECE annual energy questionnaire on Oil, 1993 to 1998, 2001 to 2008.
Direct communication with the Ministry of Industry and Energy, July 1992.
CIS and East European Energy Databook, Eastern Bloc Research Ltd, Tolsta Chaolais, various editions up to 2011.
IEA secretariat estimates.
Sources 1990 to 1991:
IEA secretariat estimates.
Sources for Biofuels and waste:
Joint IEA/Eurostat/UNECE Renewable questionnaire.
The UN Energy Statistics Database.
IEA secretariat estimates.
Mongolia
Data for Mongolia are available starting in 1985. Prior to that, they are included in Other Asia.
New data became available in 2015 which allowed a disaggregation of coal by type. In addition time series were revised from 2005 forward. Breaks in time series
between 2004 and 2005 may result as well as differ-ences in trends from previous editions.
Sources 1985 to 2013:
Mongolian Statistical Yearbook, National Statistical Office, Ulaanbaatar, various editions up to 2013.
Balance of Coal & Coal Exports, Mongolian Statisti-cal Information Service, National Statistical Office, Ulaanbaatar, online statistical service: www.1212.mn.
Mongolian Statistical Bulletin, December 2009, Na-tional Statistical Office, Ulaanbaatar, 2009.
Asian Development Bank online database.
IEA secretariat estimates.
Sources for Biofuels and waste:
Forestry Statistics, FAO, Rome, 2014.
IEA secretariat estimates.
Montenegro
Data for Montenegro are available starting in 2005. Between 1990 and 2004, they are included in Serbia. Prior to 1990, they are included in Former Yugoslavia.
Breaks in time series appearing in solid biofuels be-tween 2010 and 2011 can be explained by a new survey carried out by Montenegro.
Sources 2005 to 2012:
Direct communication with the Statistical Office of Montenegro (MONSTAT), Podgorica.
Joint IEA/Eurostat/UNECE annual energy questionnaires on Gas, Oil, Renewables, Coal, Electricity and heat.
Morocco
A new refinery began operations in 2009 which can accommodate new feedstocks and additives. This may lead to breaks in time series between 2009 and 2010.
Sources 1992 to 2013:
Direct communication with the Ministère de l'Energie et des Mines, Direction des Mines, Rabat.
Annuaire Statistique du Maroc, Haut-Commissariat au Plan, Direction de la Statistique, Rabat, 1980, 1984, 1986 to 2011.
Electricity consumption by economic sector from di-rect communication with the Office National de l’Electricité, Casablanca.

76 - ENERGY STATISTICS OF NON-OECD COUNTRIES: DATABASE DOCUMENTATION (2015 revised edition)
INTERNATIONAL ENERGY AGENCY
Sources up to 1991:
Rapport d'Activité 1992, Office National de l'Electri-cité, Casablanca, 1993.
Le Maroc en Chiffres 1986, Ministère du Plan, Direc-tion de la Statistique, Rabat, 1987.
Rapport Annuel, Office National de Recherches et d'Exploitations Pétrolieres, Maroc, 1984.
Rapport d'Activité du Secteur Pétrolier 1983, Minis-tère de l'Energie et des Mines, Direction de l'Energie, Rabat, 1984.
Rapport sur les Données Energétiques Nationales 1979-1981, Ministère de l'Energie et des Mines, Rabat, 1982.
Sources for Biofuels and waste:
Direct communication with the Ministère de l'Energie et des Mines, Direction des Mines, Rabat.
The UN Energy Statistics Database.
IEA secretariat estimates.
Mozambique
Sources 1992 to 2013:
Direct communication with Ministério da Energia, Maputo and the National Petroleum Institute.
Annual Statistical Yearbook 1993, 1994, 1995, Eskom, Johannesburg, 1994, 1995, 1996, citing Electricidade de Mozambique, Maputo, as source.
The UN Energy Statistics Database.
IEA secretariat estimates.
Sources up to 1991:
IEA secretariat estimates.
Sources for Biofuels and waste:
Direct communication with Ministério da Energia, Maputo.
IEA secretariat estimates.
Myanmar
Some data are reported on a fiscal year basis, begin-ning on the 1st of April and ending on the 31th March of the subsequent year.
Sources 1992 to 2013:
Direct communication with IEEJ, Tokyo, 2010-2014.
Selected Indicators, Myanmar Central Statistical Organisation website: www.csostat.gov.mm.
Joint Oil Data Initiative (JODI) online database.
Oil and Thailand, Ministry of Energy, Department of Alternative Energy Development and Efficiency, 2007 to 2013.
Direct communication with the Ministry of Energy, Planning Department, Rangoon, 2006-2007.
Review of the Financial Economic and Social Condi-tions, Ministry of National Planning and Economic Development, Central Statistical Organization, Rangoon, 1995, 1996.
Statistical Yearbook, Ministry of National Planning and Economic Development, Central Statistical Organization, Rangoon, 1995, 1996.
The UN Energy Statistics Database.
The ASEAN Energy Statistics Database.
Asian Development Bank online database.
IEA secretariat estimates.
Sources up to 1991:
Sectoral Energy Demand in Myanmar, UNDP Eco-nomic and Social Commission for Asia and the Pacific, Bangkok, 1992.
Selected Monthly Economic Indicators, paper no. 3, Ministry of Planning and Finance, Central Statistical Organization, Rangoon, 1989.
Sources for Biofuels and waste:
Wood data have been submitted by the Ministry of Energy, from 1985 to 2003.
IEA secretariat estimates based on 1990 data from UNDP Sixth Country Programme Union of Myanmar, World Bank, Programme Sectoral Review of Energy, by Sousing et. al., Washington, D.C., 1991.
Namibia
Data for Namibia are available starting in 1991. Prior to that, data are included in Other Africa.
In this edition, new energy data became available for Namibia. This may lead to differences in trends com-pared to previous editions.

ENERGY STATISTICS OF NON-OECD COUNTRIES: DATABASE DOCUMENTATION (2015 revised edition) - 77
INTERNATIONAL ENERGY AGENCY
Sources 1991 to 2013:
Namibia Energy Balance 2000-2013. Electricity Con-trol Board, Windhoek.
Direct communications with the Ministry of Mines and Energy, Windhoek.
NamPower Annual Reports 2000-2013, Namibia Power Corporation, Windhoek. Note: NamPower data are published on a fiscal year basis (July to June)
Mauthner, F. and Weiss W., Solar Heat Worldwide - Markets and contribution to the energy supply, vari-ous editions up to 2014, IEA Solar Heating and Cool-ing Programme.
IEA secretariat estimates.
Sources for Biofuels and waste:
IEA secretariat estimates.
Nepal
Data are reported on a fiscal year basis.
Sources up to 2013:
Energy Sector Synopsis Report, Water and Energy Com-mission Secretariat (WECS), Kathmandu, July 2010.
A Year in Review, Nepal Electricity Authority, Durbar Marg, Kathmandu, various editions up to fiscal year 2013/14.
Imports and Sales of Petroleum Products, Nepal Oil Corporation Limited, Kathmandu, various editions up to 2013.
Direct communication with the Water and Energy Commission Secretariat (WECS), Ministry of Water Resources, Kathmandu.
IEA secretariat estimates.
Sources for Biofuels and waste:
Water and Energy Commission Secretariat (WECS), Ministry of Water Resources, Kathmandu.
Sources up to 1996:
The UN Energy Statistics Database.
Nicaragua
Sources up to 2013:
Estadísticas de los Hidrocarburos, Ministerio de Energía y Minas, Managua, 2008 to 2013.
Generación Bruta por Tipo de Planta, Instituto Nicaragüense de Energía, Managua, 2014.
Consumo de Combustible por Tipo de Planta, Institu-to Nicaragüense de Energía, Managua, 2014.
Balance Energético Nacional, Ministerio de Energía y Minas, Managua, 2006 to 2007.
Balance Energético Nacional, Comisión Nacional de Energía (CNE), Dirección de Políticas Energéticas, Managua, 2000 to 2005.
Estadísticas des Suministro de los Hidrocarburos, Insti-tuto Nicaragüense de Energía, Managua, 1999 to 2004.
Informe Anual 1996: Datos Estadísticos del Sector Electrico, INE, Managua, 1999.
SIEE, OLADE.
Sources for Biofuels and waste:
SIEE, OLADE.
Balance Energetico Nacional, Comision Nacional de Energia (CNE), Managua, 1999 to 2007.
Niger
In this edition, data for Niger became available from 2000 to 2013. Prior to 2000, data for Niger are pre-sented in Other Africa.
Stock change may include statistical difference for Crude Oil.
Sources up to 2013:
Direct communication with the Ministry of Energy and Oil.
IEA secretariat estimates
Sources for Biofuels and waste:
Ministry of Energy and Oil
IEA secretariat estimates
Nigeria
Crude oil production and export data may include field condensate.
Statistical differences may include oil products smug-gled to or from neighbouring countries.

78 - ENERGY STATISTICS OF NON-OECD COUNTRIES: DATABASE DOCUMENTATION (2015 revised edition)
INTERNATIONAL ENERGY AGENCY
Inputs of motor gasoline and gas/diesel to back-up electricity generation, as well as the associated elec-tricity outputs, which may be substantial in Nigeria, may not be captured.
In this edition, new information became available in-dicating that on-grid power generation has been fuelled by natural gas for many years. This may lead to breaks in time series between 1996 and 1997 as well as differences in trends compared to previous editions for some oil products.
Sources 1992 to 2013:
Direct communication with the Energy Commission of Nigeria, Abuja.
Annual Petroleum Bulletin, 1998 to 2013, Nigerian National Petroleum Corporation (NNPC), Abuja.
Statistical Bulletin, Central Bank of Nigeria, Abuja, 2003 to 2013.
Natural Gas in the World, Cedigaz, Paris, various editions up to 2013.
Annual Statistical Bulletin, Organization of Petroleum Exporting Countries (OPEC), Vienna, various editions up to 2013.
Monthly Petroleum Bulletin for 2000, Nigerian Na-tional Petroleum Corporation (NNPC), Abuja.
Annual Report and Statement of Accounts 1995, Cen-tral Bank of Nigeria, Lagos, 1996.
Nigerian Petroleum News, Energy Publications, monthly reports, various issues up to May 1998.
IEA secretariat estimates.
Sources up to 1991:
Annual Report and Statement of Accounts, Central Bank of Nigeria, Lagos, various editions from 1981 to 1987.
Basic Energy Statistics for Nigeria, Nigerian National Petroleum Corporation, Lagos, 1984.
NNPC Annual Statistical Bulletin, Nigerian National Petroleum Corporation, Lagos, 1983 to 1987.
The Economic and Financial Review, Central Bank of Nigeria, Lagos, various editions.
Sources for Biofuels and waste:
IEA secretariat estimates based on 1991 data from Forests and Biomass Sub-sector in Africa, African Energy Programme of the African Development Bank, Abidjan, 1996.
Oman
In this edition, fuel oil data are revised to better reflect marine bunker fuel consumption, and the intercon-nected nature of the Mina-Al-Fahal and Sohar oil re-fineries. Therefore breaks in time series may occur for some products between 2007 and 2008.
Natural gas shows a break in time series for some flows between 2006 and 2007 due to a new methodol-ogy applied in both supply and demand.
Electricity output shows a break in time series be-tween 2004 and 2005 as a national data source be-came available.
Sources 2005 to 2013:
Statistical Yearbook, National Centre for Statistics and Information (NSCI), various editions from 1999 to 2014, (Formerly Ministry of National Economy).
Online statistics, Sultanate of Oman Ministry of Oil and Gas.
Annual report, Authority for Electricity Regulation, Oman, various editions from 2005 to 2013.
Annual report, Oman LNG Company, various edi-tions from 2009 to 2013.
Annual Report, Central Bank of Oman, various edi-tions up to 2013, Muscat,.
Natural Gas in the World, Cedigaz, Paris, various edi-tions up to 2013.
Annual Statistical Report, Organization of Arab Petro-leum Exporting Countries (OAPEC), Kuwait, various editions up to 2013.
The LNG Industry, International Group of Liquefied Natural Gas Importers (GIIGNL), Levallois, 2005-2008.
Sources 1992-2004:
Direct communication with the Ministry of National Economy, Muscat.
Direct communication with the Ministry of Oil and Gas, Muscat.
Direct communication with the Ministry of Petroleum and Minerals, Muscat, 1997, 1998, and 1999.
Direct communication with the Ministry of Electricity & Water, Office of the Under Secretary, Ruwi, 1998 to 2001.

ENERGY STATISTICS OF NON-OECD COUNTRIES: DATABASE DOCUMENTATION (2015 revised edition) - 79
INTERNATIONAL ENERGY AGENCY
Quarterly Bulletin December 1994, Central Bank of Oman, Muscat, 1995.
Annual Report, Central Bank of Oman, Muscat, 1993.
Statistical Yearbook, 1994, 1995, 1996, 1997, Minis-try of Development, Muscat, 1995 to 1998.
IEA secretariat estimates.
Sources up to 1991:
Quarterly Bulletin, Central Bank of Oman, Muscat, 1986, 1987, 1989 and 1995.
Annual Report to His Majesty the Sultan of Oman, Department of Information and Public Affairs, Petrol-eum Development, Muscat, 1981, 1982, and 1984.
Oman Facts and Figures 1986, Directorate General of National Statistics, Development Council, Technical Secretariat, Muscat, 1987.
Quarterly Bulletin on Main Economic Indicators, Di-rectorate General of National Statistics, Muscat, 1989.
Statistical Yearbook, Directorate General of National Statistics, Development Council, Muscat, 1985, 1986, 1988 and 1992.
Pakistan
Time series data for natural gas for the years 2004-2007 were revised in 2009 due to the inclusion of the North-West Frontier Province data (now called KPK) and Pakistan Steel Mills. Breaks in time series may occur between 2003 and 2004.
Own use of electricity by industries with autoproducer electricity plants may not be captured.
For bitumen and lubricants, data for stock variations may include unreported trade or consumption.
Sources 1992 to 2013:
Energy Yearbook, Hydrocarbon Development Institute of Pakistan, Ministry of Petroleum and Natural Re-sources, Islamabad, various editions from 1979 to 2013.
Pakistan Economic Survey 1994-1995, 1996, 1997, Government of Pakistan, Finance Division, Islamabad, 1995, 1997, 1998.
Statistical Supplement 1993/1994, Finance Division, Economic Adviser's Wing, Government of Pakistan, Islamabad, 1995.
Natural Gas in the World, Cedigaz, Paris, various editions up to 2014.
IEA secretariat estimates.Sources up to 1991:
Monthly Statistical Bulletin, no. 12, Federal Bureau of Statistics, Islamabad, December 1989.
1986 Bulletin, The State Bank of Pakistan, Islamabad, 1987.
Sources for Biofuels and waste:
IEA secretariat estimates based on 1991 data from Household Energy Strategy Study (HESS) of 1991.
Panama
International aviation bunkers figures for jet kerosene may include exports. The national administration is working to revise time series for jet kerosene.
From 2003 onwards there has been no output of oil products due to refinery closure.
Sources up to 2013:
SIEE, OLADE.
Compendio Estadístico Energético 1970-2013, Minis-terio de Economía y Finanzas, Comisión de Política Energética, Panama.Boletín Estadístico Marítimo Por-tuario, Autoridad Maritima de Panama (AMP), Pana-ma, 2007 to 2013, http://www.amp.gob.pa. Annual re-port, Canal de Panamá, Panama, 2012.
U.S. Energy Information Administration (EIA), web-site, marine bunkers data from 2001 to 2006.
Paraguay
The Itaipu hydroelectric plant, operating since 1984 and located on the Paraná River (which forms the border of Brazil and Paraguay) was formed as a joint venture between Eletrobrás and the Paraguayan gov-ernment. Production is shared equally between Brazil and Paraguay.
From 2006 onwards, there has been no output of oil products, due to refinery closure.
Sources 1971 to 2013:
Balance Energético Nacional, 1971-2013, Vice-ministerio de Energía y Minas, Ministerio de Obras Públicas y Comunicaciones, San Lorenzo.
Direct communication with the Ministerio de Obras Públicas y Comunicaciones, San Lorenzo.

80 - ENERGY STATISTICS OF NON-OECD COUNTRIES: DATABASE DOCUMENTATION (2015 revised edition)
INTERNATIONAL ENERGY AGENCY
Sources for Biofuels and waste:
Direct communication with the Non-Conventional Energy Department of Ministerio de Obras Públicas y Comunicaciones, San Lorenzo.
Peru
Liquid biofuels are included in the energy balances from 2010 onwards.
Sources 1971 to 2013:
Direct communication with the Ministerio de Energía y Minas, Oficina Técnica de Energía, Lima.
Balance Nacional de Energía, Ministerio de Energía y Minas, Lima, various editions up to 2012.
Organismo Supervisor de la Inversión en Energía y Minería, Hidrocarburos Estadisticas 2012.
SIEE, OLADE.
IEA secretariat estimates.
Philippines
Sources 1990 to 2013:
Energy Commodity Account (ECA) and Overall Ener-gy Balance (OEB), 1990-2008, 2010-2013 submitted by the Department of Energy, Manila.
Direct communication with the Department of Energy, Manila.
APEC annual energy statistics questionnaires.
Annual Report, Semirara Mining Corporation, 2006-2013.
Annual steel production 1980-2013, World Steel As-sociation, www.worldsteel.org/statistics/.Philippines Energy Bulletin 1996, 1997, 1998, 1999.
IEA secretariat estimates.
Sources up to 1989:
Direct communication with the Office of Energy Affairs, Manila.
APEC Energy Statistics 1994, Tokyo, October 1996.
1990 Power Development Program (1990-2005), Na-tional Power Corporation, Manila, 1990.
Philippine Medium-term Energy Plan 1988-1992, Office of Energy Affairs, Manila, 1989.
Philippine Statistical Yearbook 1977-1983, National Economic and Development Authority, Manila.
1985 and 1989 Annual Report, National Power Corp-oration, Manila, 1986, 1990.
Philippine Economic Indicators, National Economic and Development Authority, Manila, various editions of 1985.
Accomplishment Report: Energy Self-Reliance 1973-1983, Ministry of Energy, Manila, 1984.
Industrial Energy Profiles 1972-1979, vol. 1-4, Minis-try of Energy, Manila, 1980.
National Energy Program, Ministry of Energy, Manila, 1982-1987 and 1986-1990.
Philippine Statistics 1974-1981, Ministry of Energy, Manila, 1982.
Energy Statistics, National Economic and Develop-ment Authority, Manila, 1983.
Quarterly Review, Office of Energy Affairs, Manila, various editions.
UN Energy Statistics Database.
IEA secretariat estimates.
Qatar
Crude oil production and export data do not include field condensate.
Natural gas liquids (NGL) include field condensates, propane, butane and ethane production from natural gas processing plants. NGL produced from liquefied natural gas production plants and gas-to-liquids plants may be excluded.
Propane and butane from natural gas processing plants are transferred to LPG. Ethane from natural gas pro-cessing plants is transferred to ethane.
Information for the use of LPG and ethane in the pet-rochemical sector is from 2005 onward. This may lead to breaks in time series for these products between 2004 and 2005
Electricity production from autoproducers includes generation by desalination plants since 1988. Own use of electricity includes use by desalination plants since a breakdown is not available. Electricity consumption in industry includes electricity consumption by the energy sector.

ENERGY STATISTICS OF NON-OECD COUNTRIES: DATABASE DOCUMENTATION (2015 revised edition) - 81
INTERNATIONAL ENERGY AGENCY
Sources 1992 to 2013:
Direct communication with Qatar Statistical Authority, Doha.
Direct communication with Qatar Petroleum, Doha.
Direct communication with National Minerals Infor-mation Center, U.S Geological Survey.
Qatar in Figures, Qatar Statistics Authority. Doha, 2011-2014 editions.
Annual Statistical Abstract, Qatar Statistics Authority, 1994 to 2012.
Statistics Report, Kahramaa, Qatar General Electricity and Water Corporation, Doha, editions 2005 to 2008, 2010 to 2013.
JODI extended database, www.jodi.org.
Statistical Bulletin, Arab Union of Electricity, 2011-2013.
Annual Report 2004-2013, Qatar Petroleum, Doha.
Natural Gas in the World, Cedigaz, Paris, various editions up to 2014.
The LNG Industry, International Group of Liquefied Natural Gas Importers (GIIGNL), various editions up to 2014.
Statistics Archives, World Steel Association, www.worldsteel.org.
The UN Energy Statistics Database.
IEA secretariat estimates.
Sources up to 1991:
Qatar General Petroleum Corporation 1981-1985, General Petroleum Corporation, Doha, 1986.
Economic Survey of Qatar 1990, Ministry of Econo-my and Commerce, Department of Economic Affairs, Doha, 1991.
Statistical Report 1987 Electricity & Water, Ministry of Electricity, Doha, 1988.
State of Qatar Seventh Annual Report 1983, Qatar Monetary Agency, Department of Research and Statistics, Doha, 1984.
Sources for Biofuels and waste:
Forestry Statistics, FAO, Rome, 2000.
IEA secretariat estimates.
Romania
Romania’s methodology for estimating indigenous pro-duction of geothermal energy differs from the one that IEA has adopted. Therefore, data comparisons between Romania and other countries might be misleading.
Data on quantities of coke oven coke used in blast furnaces do not correspond to the official submission of the national administration, as they have been esti-mated by the IEA secretariat to ensure a carbon bal-ance in the blast furnace transformation.
Sources 1992 to 2013:
Direct communication with the National Institute of Statistics, Bucharest.
Joint IEA/Eurostat/UNECE annual energy questionnaires.
Buletin Statistic de Informare Publica, Comisia Na-tionala Pentru Statistica, Bucharest, various editions up to June 1995.
Renel Information Bulletin, Romanian Electricity Au-thority, Bucharest, 1990, 1991, 1992, 1993, 1994.
Sources up to 1991:
Anuarul Statistic al Republicii Socialiste Romania, Comisia Nationala Pentru Statistica, Bucharest, 1984, 1985, 1986, 1990, 1991.
Sources for Biofuels and waste:
Joint IEA/Eurostat/UNECE annual energy question-naires.
IEA secretariat estimates.
Russian Federation
Data for the Russian Federation are available starting in 1990. Prior to that, they are included in Former So-viet Union.
Annual statistics are based on annual joint IEA/Eurostat/UNECE questionnaires submissions received from Rosstat, the official data provider to the IEA. Data may differ from secondary sources, and discrep-ancies are being investigated.
In 2007, the Federal State Statistics Service intro-duced a new classification, the Russian Classification of Economic Activities (OKVED), oriented towards harmonization with the Statistical Classification of

82 - ENERGY STATISTICS OF NON-OECD COUNTRIES: DATABASE DOCUMENTATION (2015 revised edition)
INTERNATIONAL ENERGY AGENCY
Economic Activities in the European Community (NACE Rev.1). Data for the years prior to 2005 were submitted to the IEA secretariat according to the Russian Classification of the Industries of the Econo-my (OKONKH). Therefore, breaks in time series for final consumption sectors may occur between 2004 and 2005.
Condensate data provided by Rosstat are published separately from Crude Oil under NGL. Jetkerosene output is confidential and estimated based on histori-cal refinery throughput growth rate. No information on Vacuum Gas Oil is available. LPG refinery output may include output from gas separation plants. Naph-tha exports are reported by Rosstat from 2011, and are significantly lower than in secondary sources. As a consequence domestic consumption of naphtha calcu-lated as residual in the Russian balance is likely to be overestimated. Information on international marine bunker consumption is submitted from 2010. with high fluctuation in time series. Jetkerosene consump-tion split between international and domestic aviation is unknown. By default consumption is equally split between the two flows.
In 2013, all consumption data were estimated by the Secretariat.
From 2009, all data concerning LNG trade and LNG production have been estimated by the Secretariat.
Oil and gas extraction includes natural gas consumed by oil refineries.
Coal statistics provided by Rosstat may differ from those collected by Rosinformugol. Blast furnace gas values since 2012 utilise a different methodology to that of prior years (where heat from other sources than blast furnace gas had been attributed to blast furnace gas). Some coal trade from partners of the Customs Union has been estimated by the IEA secretariat and additionally removed from indigenous production where it may be reported in data of other organisations.
The 2013 data for Electricity and Heat show a sub-stantial drop in the efficiency of autoproducer heat plants fuelled by Natural Gas as well as a decrease in production and consumption of heat. All the figures were confirmed by the Russian authorities.
Heat from other sources is produced from recovered waste heat.
Sources 1990 to 2013:
Direct communication with the Department of For-eign Statistics and International Cooperation from the
Federal State Statistics Service (Rosstat), Moscow, Russian Federation.
Joint IEA/Eurostat/UNECE annual energy questionnaires.
Energy trade: direct communication with the Federal State Statistics Service, July 1994.
Statistical Yearbook of Russia 1994. The State Commit-tee of Statistics, Moscow, 1994.
The Russian Federation in 1992, Statistical Yearbook, The Federal State Statistics Service, Moscow, 1993.
Russian Federation External Trade, annual and quar-terly various editions, the Federal State Statistics Service, Moscow.
Statistical Bulletin, various editions, The State Com-mittee of Statistics of the CIS, Moscow, 1993, 1994.
Statistical Bulletin N° 3, The Federal State Statistics Service, Moscow, 1992.
Fuel and Energy Balance of Russia 1990, The Federal State Statistics Service, Moscow, 1991.
Energetika, Energo-Atomisdat, Moscow, 1981 to 1987.
IEA secretariat estimates.
Sources for Biofuels and waste:
The Federal State Statistics Service.
IEA secretariat estimates.
Saudi Arabia
Crude oil production and export data do not include field condensate. Field condensate quantities are in-cluded with natural gas liquids.
Data for crude oil production include 50 per cent of the output of the Neutral Zone.
Natural gas consumption for oil and gas extraction may include quantities used in oil refineries.
New data became available in 2015 allowing the es-timation of natural gas consumption as a feedstock in ammonia and methanol manufacture from 1990 to 2013. The remaining natural gas consumption has been allocated to the non-specified Industry sector. Breaks in time series may occur between 1989 and 1990 for this reason.
Electricity production from autoproducers includes generation by desalination plants since 1979.
ENERGY STATISTICS OF NON-OECD COUNTRIES: DATABASE DOCUMENTATION (2015 revised edition) - 83
INTERNATIONAL ENERGY AGENCY
Sources 1992 to 2013:
Annual Reports, Saudi ARAMCO, Dhahran, various editions up to 2014.
Annual Report, Saudi Arabian Monetary Agency, Re-search and Statistics Department, Riyadh, various edi-tions up to 2014.
Joint Oil Data Initiative (JODI) online database.
Direct communication with the Saudi Electricity Company.
Ministry of Petroleum and Mineral Resources, 2009.
Middle East Petroleum Databook, FACTS Global Energy Group, Singapore, 2009 and 2010.
Electricity Growth and Development in the Kingdom of Saudi Arabia up to the year from 1416H. (1996G.), 1420 H (1999/2000G) and 1423/1424 H (2003G), Ministry of Industry and Electricity, Riyadh, 1997, 1998, 1999, 2004.
Annual Statistical Report, Organization of Arab Petro-leum Exporting Countries (OAPEC), Kuwait, various editions up to 2014.
Annual Statistical Bulletin, Organization of Petroleum Exporting Countries (OPEC), Vienna, various editions up to 2014.
Nitrogen statistics and information, U.S. Geological Survey, http://www.usgs.gov.
Direct communication from the Central Department of Statistics of the Ministry of Planning and oil indus-try sources.
A Survey of the Saudi Arabian Oil Industry 1993, Embassy of the United States of America in Riyadh, Riyadh, January 1994.
IEA secretariat estimates.
Sources up to 1991:
Annual Reports, Saudi ARAMCO, various editions.
Petroleum Statistical Bulletin 1983, Ministry of Petro-leum and Mineral Resources, Riyadh, 1984.
Achievement of the Development Plans 1970-1984, Ministry of Planning, Riyadh, 1985.
The 1st, 2nd, 3rd and 4th Development Plans, Minis-try of Planning, Riyadh, 1970, 1975, 1980 and 1985.
Annual Report, Saudi Arabian Monetary Agency, Re-search and Statistics Department, Riyadh, 1984, 1985, 1986, 1988, 1989.
Statistical Summary, Saudi Arabian Monetary Agency, Research and Statistics Department, Riyadh, 1986.
Sources for Biofuels and waste:
Forestry Statistics, FAO, Rome, 2000.
IEA secretariat estimates.
Senegal
Member of the SIE-Afrique project.
In the 2014 edition the time series for solid biofuels have been revised from 2009 based on newly availa-ble information. Breaks in time series may occur be-tween 2008 and 2009.
Sources 2009 to 2013:
Direct communication with the Ministère de l’Energie, des Mines, Dakar.
Bilans énergétiques du Sénégal 2009 to 2013, Direc-tion de l’Energie, Dakar.
IEA secretariat estimates.
Sources 2008:
Bulletin mensuel des statistiques économiques, Agence national de la Statistique et de la Démographie (ANSD), Dakar, March 2009.
Direct communication with the Ministère de l’Energie, Dakar.
Sources 2000 to 2007:
Bilans énergétiques du Sénégal 2003, 2004, 2005, 2006, Direction de l’Energie, Dakar.
IEA secretariat estimates.
Sources 1992 to 1999:
Direct communication with the Ministère de l’Energie, des Mines et de l’Industrie, Direction de l’Energie, Dakar, 1997 to 2002.
Direct communication with the Ministère de l’Energie, des Mines et de l’Hydraulique, Comité National des Hydrocarbures, Dakar, 2002.
Direct communication from oil industry sources, So-ciété Africaine de raffinage.
Direct communication from electricity industry sources, SENELEC.

84 - ENERGY STATISTICS OF NON-OECD COUNTRIES: DATABASE DOCUMENTATION (2015 revised edition)
INTERNATIONAL ENERGY AGENCY
Report of Senegal on the Inventory of Greenhouse Gases Sources, Ministère de l'Environnement et de la Protection de la Nature, Dakar, 1994.
Direct communication to the IEA secretariat from ENDA - Energy Program, Dakar, 1997.
The UN Energy Statistics Database.
Sources up to 1991:
Situation Economique 1985, Ministère de l'Economie et des Finances, Direction de la Statistique, Senegal, 1986.
Sources for Biofuels and waste:
IEA secretariat estimates based on 1994 data from Forests and Biomass Sub-sector in Africa, African Energy Programme of the African Development Bank, Abidjan, 1996, and from direct communication with ENDA, Senegal.
Serbia
Data for Serbia are available starting in 1990. Prior to that, they are included in Former Yugoslavia.
Serbia energy data include Montenegro until 2004 and The United Nations Interim Administration Mission in Kosovo until 1999.
The Ministry of Mining and Energy of Republic of Serbia is currently in the process of revising time series for energy statistics. Important revisions were made in the past two years, in particular for renewables.
Breaks in time series for oil products and natural gas may appear between 2006 and 2007 due to newly available data for 2007 (see Sources).
Sources 1990 to 2013:
Direct communication with the Ministry of Mining and Energy, Belgrade.
Direct communication with the Statistical Office of the Republic of Serbia, Belgrade.
Joint IEA/Eurostat/UNECE annual energy questionnaires.
Pilot study: Energy Balances (2007 and 2008) - Oil and Derivates of Oil, Natural Gas, Geothermal Energy and Energy Balance of the Republic of Serbia, Statistical Office of the Republic of Serbia, Belgrade, 2009.
Direct communication with the Federal Ministry of Economy, Belgrade, 2001 and 2002.
IEA secretariat estimates.
Sources for Biofuels and waste:
Direct communication with the Ministry of Mining and Energy, Belgrade.
Joint IEA/Eurostat/UNECE annual energy question-naires on Renewables, 2004 to 2013.
IEA secretariat estimates.
Singapore
The IEA secretariat, the Energy Market Authority and the National Climate Change Secretariat (NCCS) are working closely together on improving data quality for Singapore. Efforts are continuing on this project, therefore breaks in time series between 2008 and 2009 and differences in trends when compared to previous publications may occur for some products.
In this edition, the IEA secretariat has revised oil con-sumption data based on official data for 2011.
In addition, the IEA secretariat incorporated data new-ly released by the Energy Market Authority, in partic-ular refinery inputs and outputs obtained from the re-fineries through the Joint Energy and Emissions Sta-tistics Survey from 2009.
Some key products and flows are aggregated by Singapore, to avoid breach of confidentiality.
From 2009, Singapore publishes splits of refinery output between light, middle and heavy distillates and residuum only. Further breakdown between products is estimated by the IEA secretariat. Singapore aggre-gates petrochemical and refinery consumption. The split between refining and petrochemical consumption is estimated by the IEA secretariat.
Refinery input is broken down between crude oil and feedstocks. Splits of feedstock by product are not pro-vided by Singapore. By default, IEA estimates that feedstocks come from naphtha, gas/diesel and fuel oil in equal proportions.
Other data remain aggregated due to lack of data availa-bility. Electricity consumption in the industry sector from 2005 includes electricity consumption by refiner-ies. Electricity consumption in transport includes all electricity consumption at airport terminals. Municipal waste production and consumption may include biogas.
Refinery gas production and consumption may in-clude syngas produced by the petrochemical sector.
Due to Singapore’s large trade volume in comparison to its final consumption, slight misalignment of trade

ENERGY STATISTICS OF NON-OECD COUNTRIES: DATABASE DOCUMENTATION (2015 revised edition) - 85
INTERNATIONAL ENERGY AGENCY
figures can have a significant impact on the energy balance of Singapore. The IEA secretariat has adjust-ed total imports of crude oil, gas/diesel and fuel oil from 2009 to match demand.
A new coal-fired power plant started operations in 2013. This might lead to breaks in time series between 2012-2013.
Further revisions are expected in future editions, as energy data coverage is further extended by Singapore.
Sources 1992 to 2013:
Direct communication with the Energy Market Au-thority, Singapore, from 2009.
Direct communication with the National Climate Change Secretariat (NCCS), Singapore, from 2013.
Direct communication with the Solar Energy Re-search Institute of Singapore, 2011.
Singapore Energy Statistics, Energy Market Authori-ty, Singapore, various editions up to 2014.
Monthly oil statistics, IE Singapore, 2011-2014.
Yearbook of Statistics Singapore, Department of Statis-tics, Singapore, various editions up to 2014.
Bunker sales, website of The Maritime and Port Au-thority of Singapore: www.mpa.gov.sg.
Motor Vehicle Population by Type of Fuel Used, web-site of the Land Transport Authority: www.lta.gov.sg.
Solid Waste Management Statistics, website of The Ministry of the Environment and Water Resources: http://app.mewr.gov.sg/.
Singapore Trade Statistics, International Enterprise Singapore, Singapore, various CD-ROM editions up to 2011.
Argus Fundamentals, Argus Media, various editions up to 2012.
Asia Pacific Databook, FACTS Global Energy, Singapore, various editions up to 2013.
The Strategist Oil Report, Singapore, various issues up to March 1999.
Petroleum in Singapore 1993/1994, Petroleum Intelli-gence Weekly, Singapore, 1994.
AEEMTRC, 1996.
Direct submissions from oil industry sources up to 1996.
The UN Energy Statistics Database.
IEA secretariat estimates.
Sources up to 1991:
Monthly Digest of Statistics, Department of Statistics, Singapore, various editions from 1987 to 1989.
Yearbook of Statistics Singapore 1975/1985, Depart-ment of Statistics, Singapore, 1986.
ASEAN Oil Movements and Factors Affecting In-tra-ASEAN Oil Trade, Institute of Southeast Asian Studies, Singapore, 1988.
The Changing Structure of the Oil Market and Its Im-plications for Singapore's Oil Industry, Institute of Southeast Asian Studies, Singapore, 1988.
Public Utilities Board Annual Report (1986 and 1989), Public Utilities Board, Singapore, 1987 and 1990.
Sources for Biofuels and waste:
Singapore Energy Statistics, Energy Market Authori-ty, Singapore, 2013 edition.
The UN Energy Statistics Database.
IEA secretariat estimates.
South Africa
Outputs from gas-to-liquids and coal-to-liquids plants are presented in the “Transfers” flow.
New information became available in 2015 which allowed the separation of non-energy use of coal in Coal to Liquids (CTL) plants from the coal used for energy purposes in these same plants. Non-energy conversion efficiencies for CTL plants in South Africa are assumed to be 60%. This new methodology may lead to breaks in time series between 2010 and 2011 for these products and flows.
Breaks in time series may occur for anthracite and coking coal between 2009 and 2010 as new infor-mation became available. Prior to 2010, coking coal data may include anthracite.
Coking coal, coke oven coke, coke oven gas, gas works gas and blast furnace gas production and con-sumption have been estimated using reported crude steel production figures.
Breaks in time series may occur for consumption of natural gas in industrial sectors between 2009 and 2010 as new information became available.
Reported quantities of synthetic fuels output may not include quantities from PetroSA.

86 - ENERGY STATISTICS OF NON-OECD COUNTRIES: DATABASE DOCUMENTATION (2015 revised edition)
INTERNATIONAL ENERGY AGENCY
Sources 2010 to 2013:
Direct communication with the Department of Ener-gy, Pretoria, South Africa.
Energy statistics: Supply and demand of petroleum products, Department of Energy, Pretoria, South Africa.
Statistical release on electricity generated and avail-able for distribution, Statistics South Africa, Pretoria.
South African Statistics, Statistics South Africa, Preto-ria, various editions up to 2014.
Joint Oil Data Initiative (JODI) online database.
Annual Reports, South Africa Petroleum Industry Association (SAPIA), Sandton.
Integrated Annual Reports, Electricity Supply Com-mission (ESKOM), South Africa.
Analyst Book, SASOL Limited Group, Johannesburg, various editions up to 2013.
Natural Gas in the World, Cedigaz, Paris, various editions up to 2014.
Integrated Annual Reports, PetroSA, Parow, various editions up to 2013. World Steel Association online statistics database.
Mauthner, F. and Weiss W., Solar Heat Worldwide - Markets and contribution to the energy supply, vari-ous editions up to 2014, IEA Solar Heating and Cool-ing Programme.
IEA secretariat estimates.
Sources 1992 to 2009:
Energy balances submitted to the IEA secretariat from the Department of Minerals and Energy, 2003 to 2009.
Electricity generated and available for distribution, Statistics South Africa, Pretoria, various editions up to 2009.
Direct submission from the Institute for Energy Studies, Rand Afrikaans University, Pretoria, 1998 to 2001.
Digest of South African Energy Statistics 1998.
Direct submissions from the Energy Research Insti-tute, University of Cape Town.
ESKOM Annual Report, Electricity Supply Commis-sion (ESKOM), South Africa, 1989 to 1994.
Statistical Yearbook, Electricity Supply Commission (ESKOM), South Africa, 1983 to 1994.
South Africa’s Mineral Industry, Department of Mineral and Energy Affairs, Braamfontein, 1995.
South African Energy Statistics, 1950-1993, Department of Mineral and Energy Affairs, Pretoria, 1995.
Wholesale Trade Sales of Petroleum Products, Central Statistical Service, Pretoria, 1995.
South African Coal Statistics 1994, South African Coal Report, Randburg, 1995.
Energy Balances in South Africa 1970-1993, Energy Research Institute, Plumstead, 1995.
Sources up to 1991:
Statistical News Release 1981-1985, Central Statisti-cal Service, South Africa, various editions from 1986 to 1989.
Annual Report Energy Affairs 1985, Department of Mineral and Energy Affairs, Pretoria, 1986.
Energy Projections for South Africa (1985 Balance), Institute for Energy Studies, Rand Afrikaans Universi-ty, South Africa, 1986.
Sources for Biofuels and waste:
South African Energy Statistics 1950-1989, No. 1, National Energy Council, Pretoria, 1989.
IEA secretariat estimates.
South Sudan
Data for South Sudan are available from 2012. Prior to 2012, they are included in Sudan.
Crude oil production and exports were halted for most of 2012, and only continued in April 2013. Both pro-duction and exports have been estimated by the IEA Secretariat for the years 2012 and 2013.
Sources 2012 to 2013:
AFREC Energy questionnaire, African Energy Com-mission, 2015.
Former Soviet Union
Data for individual countries of the Former Soviet Union are available starting in 1990, and most of the information on 1990 and 1991 was estimated by the IEA secretariat. Because of large breaks in reporting occurring in the early 1990’s, breaks in time series may occur in 1990 for all regional totals.
Coal production statistics refer to unwashed and unscreened coal up to 1990. IEA coal statistics

ENERGY STATISTICS OF NON-OECD COUNTRIES: DATABASE DOCUMENTATION (2015 revised edition) - 87
INTERNATIONAL ENERGY AGENCY
normally refer to coal after washing and screening for the removal of inorganic matter. Also, see notes under ‘Classification of Fuel Uses’ and ‘Heat’, in section I.1, Issues of data quality.
The commodity balances presented for the Former Soviet Union include IEA secretariat estimates of fuel consumption in the main categories of transformation. These estimates are based on secondary sources and on isolated references in FSU literature.
In older editions of this publication, intra-FSU trade was excluded.
Sources up to 1989:
Statistical Yearbook, The State Committee for Statistics of the USSR, Moscow, various editions from 1980 to 1989.
External Trade of the Independent Republics and the Baltic States, 1990 and 1991, the State Committee of Statistics of the CIS, Moscow, 1992.
External Trade of the USSR, annual and quarterly, various editions, The State Committee of Statistics of the USSR, Moscow, 1986 to 1990.
CIR Staff Paper no. 14, 28, 29, 30, 32 and 36, Center for International Research, U.S. Bureau of the Census, Washington, 1986, 1987 and 1988.
Yearbook on Foreign Trade, The Ministry of Foreign Trade, Moscow, 1986.
Sri Lanka
Breaks in time series may occur between 1999 and 2000 due to newly available energy balances provided by the Sri Lanka Sustainable Energy Authority in 2009.
Stock change may include statistical difference for cer-tain secondary oil products.
Refinery losses may include own use of refinery fuel.
Sources 1992 to 2013:
Direct communication with the Sri Lanka Sustainable Energy Authority, Colombo.
Sri Lanka Energy Balances 2000-2013, Sri Lanka Sus-tainable Energy Authority, Colombo.
Economic and Social Statistics of Sri Lanka 2011-2014, Central Bank of Sri Lanka, Colombo.
Statistical Digest 2013, Ceylon Electricity Board, Colombo.
Direct communication with the Department of Census and Statistics, 2003 to 2006.
Annual Report 1993, Central Bank of Sri Lanka, Colombo, July 1994.
Direct communication with the Ceylon Electricity Board, Sri Lanka Energy Balances, 1994.
The UN Energy Statistics Database.
IEA secretariat estimates.
Sources up to 1991:
Energy Balance Sheet 1991, 1992, Energy Unit, Ceylon Electricity Board, Colombo, 1992, 1993.
Bulletin 1989, Central Bank of Sri Lanka, Colombo, July 1989.
Bulletin (monthly), Central Bank of Sri Lanka, Colombo, May 1992.
Sectoral Energy Demand in Sri Lanka, UNDP Eco-nomic and Social Commission for Asia and the Pacific, Bangkok, 1992.
External Trade Statistics 1992, Government of Sri Lanka, Colombo, 1993.
Sources for Biofuels and waste:
Energy Conservation Fund and Ceylon Electricity Board.
Sudan
South Sudan became an independent country on 9 July 2011. From 2012 data for South Sudan are re-ported separately and therefore, breaks in the time series may occur between 2011 and 2012 for Sudan data.
Sources 1992 to 2013:
Direct communication with the Ministry of Petroleum, Khartoum.
AFREC energy questionnaire, African Energy Com-mission, 2013.
Sudanese Petroleum Corporation Statistics, Ministry of Petroleum, Khartoum, May 2012.
Sudan Energy Handbook 2006, Ministry of Energy and Mines, Khartoum.
IEA secretariat estimates.
Sources up to 1991:
Foreign Trade Statistical Digest 1990, Government of Sudan, Khartoum, 1991.

88 - ENERGY STATISTICS OF NON-OECD COUNTRIES: DATABASE DOCUMENTATION (2015 revised edition)
INTERNATIONAL ENERGY AGENCY
Sources for Biofuels and waste:
IEA secretariat estimates based on 1990 data from Bha-gavan (ed.) Energy Utilities and Institutions in Africa, AFREPREN, Nairobi, 1996.
Syrian Arab Republic
Due to the on-going conflict in Syria, no official gov-ernment data sources were available for 2012 and 2013. Data in this year’s edition are primarily based on secondary sources, media reports and IEA secretar-iat estimates.
Imports of crude oil and secondary oil products may include informal imports.
Sources 1992 to 2013:
Annual Statistical Report, Organization of Arab Petro-leum Exporting Countries (OAPEC), Kuwait, various editions up to 2014.
Natural Gas in the World, Cedigaz, Paris, various editions up to 2014.
Direct Communication with the Ministry of Petroleum and Mineral Resources, 2012.
Statistical Abstract, Office of the Prime Minister, Central Bureau of Statistics, Damascus, various edi-tions up to 2011.
Statistical Bulletin, Arab Union of Producers, Trans-porters and Distributors of Electricity (AUPTDE), Amman, various editions up to 2013.
The UN Energy Statistics Database (until 2007).
Quarterly Bulletin, Central Bank of Syria, Research Department, Damascus, 2001.
IEA secretariat estimates.
Sources up to 1991:
Quarterly Bulletin, Central Bank of Syria, Research Department, Damascus, 1984.
Sources for Biofuels and waste:
Forestry Statistics, FAO, Rome, 2000.
IEA secretariat estimates.
Chinese Taipei
Data for the period 1982-2009 were revised in 2012 based on new balances submitted by the Bureau of Energy. Breaks in time series may occur between 1981 and 1982.
Breaks in time series may occur between 2010 and 2011 as more detailed information became available for refinery feedstocks and oil products.
Sources 1982 to 2013:
Energy Balances in Taiwan 2013, Bureau of Energy, Ministry of Economic Affairs, Taipei, various editions up to 2014.
Direct communication with the electricity utilities.
Yearbook of Energy Statistics, Ministry of Trade, In-dustry and Energy, Taipei, 1996.
Sources up to 1981:
The Energy Situation in Taiwan, Ministry of Econom-ic Affairs, Energy Committee, Taipei, 1986, 1987, 1988 and 1992.
Industry of Free China 1975-1985, Council for Eco-nomic Planning and Development, Taipei, 1986.
Taiwan Statistical Data Book 1954-1985, Council for Economic Planning and Development, Taipei, 1986.
Energy Policy for the Taiwan Area, Ministry of Eco-nomic Affairs, Energy Committee, Taipei, 1984.
Energy Balances in Taiwan, Ministry of Economic Affairs, Taipei, 1980 to 1981.
Sources for Biofuels and waste:
Energy Balances in Taiwan, Bureau of Energy,Ministry of Economic Affairs, Taipei.
The UN Energy Statistics Database.
IEA secretariat estimates.
Tajikistan
Data for Tajikistan are available starting in 1990. Prior to that, they are included in Former Soviet Union.
Sources 1990 to 2013:
Online statistics, Statistical Agency under the Presi-dent of the Republic of Tajikistan.
Tajikistan in Figures, Statistical Agency under the President of Tajikistan, various editions up to 2014.
Energy and Communal Services in Kyrgyzstan and Tajikistan: A Poverty and Social Impact Assessment. UNDP Bratislava Regional Centre 2011
CIS and East European Energy Databook, Eastern Bloc Research Ltd, Tolsta Chaolais, various editions up to 2013.
Asian Development Bank Statistics, various editions up to 2014.

ENERGY STATISTICS OF NON-OECD COUNTRIES: DATABASE DOCUMENTATION (2015 revised edition) - 89
INTERNATIONAL ENERGY AGENCY
Direct communication with the State Committee on Statistics, Republic of Tajikistan, Dushanbe.
Joint IEA/Eurostat/UNECE annual energy question-naires, 1991 to 2007.
Natural Gas Vehicles Statistics, International Associa-tion for Natural Gas Vehicles, online database: www.iangv.org.
Industry of Tajikistan, Statistics, the State Committee on Statistics of the Republic of Tajikistan, 2004.
IEA secretariat estimates.
Tanzania
Some of the official data (EWURA) are reported on a fiscal year basis. Data for 2013 correspond to July 1st, 2013 – June 30th, 2014.
Sources up to 2013:
The Economic Survey, the Ministry of Finance, Dar Es Salaam, 2010-2013.
Annual Report, Bank of Tanzania, Dar Es Salaam, 2001, 2003, 2006-2014.
EWURA Annual Report, Energy and Water Utilities Reg-ulatory Authority of the United Republic of Tanzania, Dar Es Salaam, 2007 to 2014.
Annual Report, Orca Exploration Group Inc., 2007 to 2013.
SAPP Annual Report 2008, Southern African Power Pool, online statistics, 2010-2011.
The Economic Survey, The President’s Office - Plan-ning and Privatization, Dar Es Salaam, 2003-2007.
Direct communication with the Ministry of Energy and Minerals and the electricity utility.
Tanzanian Economic Trends, Economic Research Bureau, University of Dar-es-Salaam, 1991.
IEA secretariat estimates.
Sources for Biofuels and waste:
IEA secretariat estimates based on 1990 data from Energy Statistics Yearbook 1990, SADC, Luanda, 1992.
Thailand
Data for naphtha, lubricants, refinery gas and non-specified oil products are not published by the Minis-try of Energy and are estimated by the IEA secretariat.
Data for production, own use and non-energy use of natural gas may include propane, butane and ethane produced in gas separation plants.
Stock changes may include statistical difference for certain products.
In the 2014 edition, new information became available for the consumption of anthracite and lignite coal in in-dustry. Breaks in time series may occur between 2011 and 2012.
Sources for 2012 up to 2013:
Thailand Energy Statistics, Ministry of Energy, De-partment of Alternative Energy Development and Ef-ficiency, Bangkok, various editions up to 2014.
Thailand Energy Balance Table, Ministry of Energy, Department of Alternative Energy Development and Efficiency, Bangkok, various editions up to 2014
Thailand Alternative Energy Situation, Ministry of Energy, Department of Alternative Energy Develop-ment and Efficiency, Bangkok, various editions up to 2014.
Thailand Energy Efficiency Situation, Ministry of En-ergy, Department of Alternative Energy Development and Efficiency, Bangkok, various editions up to 2014.
Energy Statistics of Thailand, Ministry of Energy, Energy Policy & Planning Office, Bangkok, various editions up to 2014.
Key Statistical Data, Electricity Generation Authority of Thailand, online database: http://www.egat.co.th.
Thailand’s Petroleum & Petrochemical Statistics, Petroleum Institute of Thailand, Bangkok, various editions up to 2014.
Direct communication with the Petroleum Institute of Thailand, Bangkok, 2014.
Sources for 2002 to 2012:
Thailand Energy Situation, Ministry of Energy, Department of Alternative Energy Development and Efficiency, various editions up to 2012.
Key Statistical Data, Electricity Generation Authority of Thailand, online database: http://www.egat.co.th.
Thailand Alternative Energy Situation, Ministry of Energy, Department of Alternative Energy Develop-ment and Efficiency, various editions up to 2012.
Electric Power in Thailand, Ministry of Energy, Department of Alternative Energy Development and Efficiency, various editions up to 2012.
90 - ENERGY STATISTICS OF NON-OECD COUNTRIES: DATABASE DOCUMENTATION (2015 revised edition)
INTERNATIONAL ENERGY AGENCY
Oil in Thailand, Ministry of Energy, Department of Alternative Energy Development and Efficiency, var-ious editions up to 2012.
Direct communication with the Petroleum Institute of Thailand, Bangkok, 2008 to 2012.
IEA secretariat estimates.
Sources up to 2001:
Electric Power in Thailand, Ministry of Science, Technology and Energy, National Energy Administra-tion, Bangkok, 1985, 1986, 1988 to 2001.
Oil in Thailand, Ministry of Science, Technology and Energy, National Energy Administration, Bangkok, 1979 to 2001.
Thailand Energy Situation, Ministry of Science, Tech-nology and Energy, National Energy Administration, Bangkok, 1978 to 2001.
Sources for Biofuels and waste:
Thailand Energy Situation, Ministry of Energy, Department of Alternative Energy Development and Efficiency, 2002 to 2010.
Thailand Alternative Energy Situation, Ministry of Energy, Department of Alternative Energy Develop-ment and Efficiency, 2009-2010.
IEA secretariat estimates.
Togo
Member of the SIE-Afrique project.
Official data were submitted by Togo in 2014 for the years 2009-2012. Breaks in time series between 2008 and 2009 or differences in trends compared to previous publications may occur for this reason. The IEA con-tinues to work with the Ministère des Mines et de l'En-ergie in Togo to better understand the reasons for the breaks in time series and to reassess the historical data.
Sources 1999 to 2013:
Direct communication with the Ministère de l'Equi-pement, des Mines, de l’Energie et des Postes et Télé-communications, Lomé.
Bilans Energétiques du Togo, 1999 to 2012.
IEA Secretariat estimates.
Sources up to 1998:
IEA secretariat estimates.
Trinidad and Tobago
In the 2014 edition, natural gas time series from 2000 were revised based on newly available information on the definition of production of natural gas used by Trin-idad and Tobago (gross versus marketed production).
Sources 1992 to 2013:
Direct communication with the Ministry of Energy and Energy Affairs, Port of Spain.
Energy Industry Consolidated Monthly Bulletins, Ministry of Energy and Energy Affairs, Government of the Republic of Trinidad and Tobago, Port of Spain, various editions up to 2014.
Downstream Gas Industry Annual Report, Ministry of Energy and Energy Affairs, Government of the Republic of Trinidad and Tobago, Port of Spain, vari-ous editions up to 2014.
Annual Economic Survey, Central Bank of Trinidad and Tobago, Port of Spain, 1995 to 2014.
SIEE, OLADE.
Natural Gas in the World, Cedigaz, Paris, various editions up to 2013.
The LNG Industry, GIIGNL – International Group of Liquefied Natural Gas Importers, Paris, various edi-tions up to 2014.
Petroleum Industry Monthly Bulletin, Ministry of Energy and Natural Resources, Port of Spain, various issues up to 1999.
Sources up to 1991:
Annual Statistical Digest, Central Statistical Office, Port of Spain, 1983, 1984.
History and Forecast, Electricity Commission, Port of Spain, 1987.
Annual Report, Ministry of Energy and Natural Resources, Port of Spain, 1985, 1986.
The National Energy Balances 1979-1983, Ministry of Energy and Natural Resources, Port of Spain, 1984.
Trinidad and Tobago Electricity Commission Annual Report, Trinidad and Tobago Electricity Commission, Port of Spain, 1984, 1985.
Sources for Biofuels and waste:
SIEE, OLADE.
Forestry Statistics, FAO , Rome.
ENERGY STATISTICS OF NON-OECD COUNTRIES: DATABASE DOCUMENTATION (2015 revised edition) - 91
INTERNATIONAL ENERGY AGENCY
Tunisia
New information for lubricants and bitumen became available in 2015. Breaks in time series may occur between 2009 and 2010.
A significant increase in crude oil production was re-ported for 2007 due to the start-up of several new de-velopment wells and the beginning of production of the Oudna field.
A shutdown of the Bizerte refinery occurred between March 2010 and June 2011, resulting in breaks in time series for crude oil and oil products for the years 2009 to 2011.
Sources 1992 to 2013:
Direct communication with the Observatoire National de l'Energie, Agence Nationale pour la Maîtrise de l'Energie, Tunis.
Joint IEA/Eurostat/UNECE annual energy question-naires.
Rapport Annuel 2011, Société Tunisienne de l’Electricité et du Gaz, Tunis.
Société Tunisienne des Industries de Raffinage, 2009 online statistics, 2008 to 2009.
Statistiques d’Electricité du COMELEC, 2006, 2007, Comité Maghrébin de l’Electricité.
Sources up to 1991:
Bilan Energétique de l'Année 1991, Banque Centrale de Tunisie, Tunis, September 1992.
Rapport d'Activité 1990, Observatoire National de l'Ener-gie, Agence pour la Maîtrise de l'Energie, Tunis, 1991.
Rapport Annuel 1990, Banque Centrale de Tunisie, Tunis, 1991.
Activités du Secteur Pétrolier en Tunisie, Banque Centrale de Tunisie, Tunis, 1987.
Statistiques Financières, Banque Centrale de Tunisie, Tunis, 1986.
Entreprise Tunisienne d'Activités Pétrolières (ETAP), Tunis, 1987.
Annuaire Statistique de la Tunisie, Institut National de la Statistique, Ministère du Plan, Tunis, 1985, 1986.
L'Economie de la Tunisie en Chiffres, Institut Natio-nal de la Statistique, Tunis, 1984, 1985.
Activités et Comptes de Gestion, Société Tunisienne de l'Electricité et du Gaz, Tunis, 1987.
Sources for Biofuels and waste:
IEA secretariat estimates based on 1991 data from Ana-lyse du Bilan de Bois d’Energie et Identification d’un Plan d’Action, Ministry of Agriculture, Tunis, 1998.
Turkmenistan
Data for Turkmenistan are available starting in 1990. Prior to that, they are included in Former Soviet Union.
In 2015 new information became available indicating that previous data on refinery gas production was in fact production of kerosene. Differences in trends with previous editions may occur as a result of this change.
Sources up to 2013:
CIS and East European Energy Databook, Eastern Bloc Research Ltd, David Cameron Wilson, various editions up to 2014.
Asian Development Bank online database.
Natural Gas in the World, Cedigaz, Paris, various editions up to 2014.
Direct communication with the National Institute on Statistics and Forecasting of Turkmenistan, November 1999 and January 2001.
IEA secretariat estimates.
Ukraine
Data for Ukraine are available starting in 1990. Prior to that, they are included in Former Soviet Union.
The IEA secretariat and State Statistics Committee of Ukraine are working closely and intensively on the improvement of data quality. Therefore, breaks in time series may occur between 2006 and 2007.
The data for the stock draw and statistical difference of natural gas in 2010 are a consequence of the ac-counting method chosen by the Ukrainian administra-tion to reflect the ruling of the Stockholm Arbitration Tribunal of March 30, 2010.
For the period 2007 to 2012 the transparency of data may be reduced because of confidentiality issues. For instance: peat includes lignite; other kerosene includes aviation fuels (aviation gasoline, gasoline-type jet fuel and kerosene-type jet fuel); other products include petroleum coke.

92 - ENERGY STATISTICS OF NON-OECD COUNTRIES: DATABASE DOCUMENTATION (2015 revised edition)
INTERNATIONAL ENERGY AGENCY
Large statistical differences still exist for some oil products such as transport fuels and LPG. These are due to identified reporting issues in Ukraine. The Ukraine State Statistical Committee continues to work with data reporters to try and resolve these issues.
Information on electricity used for pumped hydro is available from 2012 only.
Charcoal production includes pyrolysis and calculated traditional methods of production from 2008.
Due to a plant closure in 2008, a stock of lignite/peat became available, without details about its consumption. This may lead to breaks in time series and high statis-tical difference for 2008.
Bituminous coal “From other sources” refers to coal mined in informal sector.
Official Ukrainian coal statistics refer to unwashed and unscreened coal prior to 1995. IEA statistics nor-mally refer to coal after washing and screening for the removal of inorganic matter. Therefore, the IEA re-vised Ukrainian coal supply and demand statistics downward to reflect levels of washed coal.
Sources 2007 to 2013:
Direct communication with the State Statistics Com-mittee of Ukraine, Kiev
Joint IEA/Eurostat/UNECE annual energy question-naires.
Sources 1992 to 2006:
Joint IEA/Eurostat/UNECE annual energy question-naires.
Direct communication with the Ministry of Statistics, the Coal Ministry, the National Dispatching Company, 1995.
Coal: Direct communications with the State Mining University of Ukraine, 1995, 1996.
Natural gas: Direct communication with Ukrgazprom, February 1995.
Direct communication with the Ministry of Statistics of the Ukraine, July 1994.
Ukraine in 1992, Statistical Handbook, Ministry of Statistics of the Ukraine, Kiev, 1993.
Ukraine Power Demand and Supply Options, The World Bank, Washington, 1993.
Power Industry in Ukraine, Ministry of Power and Electrification, Kiev, 1994.
Energy Issues Paper, Ministry of Economy, March 1995.
Ukraine Energy Sector Statistical Review 1993, 1994, 1995, 1996, 1997, The World Bank Regional Office, Kiev, 1994, 1995, 1996, 1997, 1998.
Global Energy Saving Strategy for Ukraine, Commis-sion of the European Communities, TACIS, Madrid, July 1995.
IEA secretariat estimates.
Sources 1990 to 1991:
IEA secretariat estimates.
Sources for Biofuels and waste:
Statistical Office in Kiev, The World Bank and IEA secretariat estimates.
United Arab Emirates
Crude oil production and export data do not include field condensate. Field condensate quantities are in-cluded with natural gas liquids.
In 2013, time series on electricity imports and exports were revised due to new information available on in-ternational trade at the interconnectors for the United Arab Emirates. This may lead to revisions to these time series from 2007.
Sources 1993 to 2013:
Annual Statistical Bulletin, Organization of Petroleum Exporting Countries (OPEC), Vienna, various editions up to 2013.
Annual Statistical Report, Organization of Arab Petro-leum Exporting Countries (OAPEC), Kuwait, various editions up to 2014.
Natural Gas in the World, Cedigaz, Paris, various editions up to 2014.
Statistical Bulletin, Arab Union of Producers, Trans-porters and Distributors of Electricity (AUPTDE), Amman, various editions up to 2014.
Statistical Report 1998-2013, Abu Dhabi Water & Electric Company (ADWEC), Abu Dhabi, 2013.
Annual Report, Regulation & Supervision Bureau of Abu Dhabi, Abu Dhabi, various editions up to 2012.
Statistical Yearbook 1995, 1996, 1998, Department of Planning, Abu Dhabi, 1998, 2001.
Direct communication with the National Bureau of Statistics of the United Arab Emirates, Abu Dhabi.
Direct communication with the Ministry of Electricity and Water, Abu Dhabi, March 2001.
The UN Energy Statistics Database.

ENERGY STATISTICS OF NON-OECD COUNTRIES: DATABASE DOCUMENTATION (2015 revised edition) - 93
INTERNATIONAL ENERGY AGENCY
IEA secretariat estimates.
Sources up to 1992:
Annual Report 1998, Ministry of Electricity & Water, Dubai.
Abu Dhabi National Oil Company, 1985 Annual Re-port, Abu Dhabi National Oil Company, Abu Dhabi, 1986.
United Arab Emirates Statistical Review 1981, Ministry of Petroleum and Mineral Resources, Abu Dhabi, 1982.
Annual Statistical Abstract, Ministry of Planning, Central Statistical Department, Abu Dhabi, various editions from 1980 to 1993.
Sources for Biofuels and waste:
Forestry Statistics, FAO, Rome, 2001.
IEA secretariat estimates.
Initial National Communication to the United Nations Framework Convention on Climate Change, Ministry of Energy, United Arab Emirates, 2006.
Uruguay
The pronounced growth in production of biofuels and waste from 2007 to 2010 is a result of the develop-ment of the pulp and paper industry.
The power produced from the Salto Grande hydroelec-tric plant, located on the Uruguay River between Con-cordia in Argentina and Salto in Uruguay is equally shared between the two countries. Exports include power produced in Salto Grande and exported to Argentina.
The increased imports and decreased production of oil products in 2011 are due to a refinery shutdown, which happened between September 2011 and January 2012.
Sources 1990 to 2013:
Direct communication with Ministerio de Industria, Energía y Minería, Montevideo.
Balance Energético Nacional, Ministerio de Industria, Energía y Minería, Dirección Nacional de Energía, Montevideo, 1971 to 2013.
Sources for Biofuels and waste:
Dirección Nacional de Energía, Ministerio de Indus-tria, Energía y Minería, Montevideo.
SIEE, OLADE.
IEA secretariat estimates.
Uzbekistan
Data for Uzbekistan are available starting in 1990. Prior to that, they are included in Former Soviet Union.
Sources 1990 to 2013:
Asian Development Bank online database.
CIS and East European Energy Databook, Eastern Bloc Research Ltd, Tolsta Chaolais, various editions up to 2014.
Direct communication with the Interstate Statistical Committee of the Commonwealth of Independent States.
Direct communications to the IEA secretariat from the Institute of Power Engineering and Automation, Academy of Sciences of Uzbekistan 1994, 1996, 1998 to 2003.
Joint IEA/Eurostat/UNECE annual energy question-naires, 1995 to 1997.
IEA secretariat estimates.
Venezuela
In 2015, new information on the production and con-sumption of refinery gas since 2007 became available. For this reason, breaks in time series may occur be-tween 2006 and 2007.
Data for crude oil production are obtained from Petró-leos de Venezuela S.A. (PDVSA) with an estimate of lease condensate removed. Crude oil production data are comparable to data reported by the Organization of the Petroleum Exporting Countries (OPEC) and the Organización Latino Americana de Energia (OLADE); however, some other sources of information report lower crude oil production, noting other components may be included in the crude oil production data re-ported in the above sources.
Revised data for the years 2005-2011 were provided by OLADE for Venezuela. These revisions may lead to breaks in time series between 2004 and 2005 and dif-ferences in trends in comparison to previous editions.
Lease condensate quantities are included in the prod-uct NGL from 2000. This may lead to breaks in time series for some products between 1999 and 2000.
Sources up to 2013:
Natural Gas in the World, Cedigaz, Paris, various editions up to 2014.

94 - ENERGY STATISTICS OF NON-OECD COUNTRIES: DATABASE DOCUMENTATION (2015 revised edition)
INTERNATIONAL ENERGY AGENCY
Estadísticas consolidadas, Cámara Venezolana de la Industria Eléctrica, 1996 to 2007.
Oficina de operatión de sistemas interconectados Venezuela, 2008.
Petróleo y Otros Datos Estadísticos, Dirección General Sectorial de Hidrocarburos, Caracas, 1993 to 2004, 2007 to 2008.
Balance Energético de Venezuela, Dirección de Plani-ficación Energética, Ministerio de Energía y Minas, Caracas, 1971 to 2005.
Estadísticas consolidadas, Cámara Venezolana de la Industria Eléctrica, 2006.
Transformando la energía en desarrollo social, CVG EDELCA Informe Anual 2006.
Petróleo y Otros Datos Estadísticos, Dirección General Sectorial de Hidrocarburos, Dirección de Planificación y Economía de Hidrocarburos, Caracas, 1983 to 1991.
Balance Energético Consolidado de Venezuela 1970- 1984, Ministerio de Energía y Minas, Dirección General Sectorial de Energía, División de Programa-ción Energetica, Caracas, 1986.
Compendio Estadístico del Sector Eléctrico, Ministerio de Energía y Minas, Dirección de Electricidad, Carbón y Otras Energías, Caracas, 1984, 1989, 1990, 1991.
Memoria y Cuenta, Ministerio de Energía y Minas, Caracas, 1991.
Petróleos de Venezuela S.A. 1985 Annual Report, Pe-tróleos de Venezuela, Caracas, 1991.
SIEE, OLADE.
IEA secretariat estimates.
Sources for Biofuels and waste:
The UN Energy Statistics Database.
Viet Nam
Data for stock changes may contain statistical differ-ences for some energy products.
Sources 1992 to 2013:
Direct communications with the Institute of Energy and the Ministry of Industry and Trade, Hanoi.
Vietnam Energy Balance Tables, General Directorate of Energy, Ministry of Industry and Trade, Hanoi, various editions up to 2012.
Statistical Yearbook of Vietnam & Statistical Hand-book, General Statistics Office of Vietnam (GSO), Hanoi, various editions up to 2014.
Yearbook, Vietnam Energy (Năng Lượng Việt Nam), Hanoi, 2012.
Annual Report 2006, Petrovietnam, Vietnam national Oil and Gas Group.
Direct communications with the Center for Energy-Environment Research and Development, Pathumthami, 1997 to 1999.
Sectoral Energy Demand in Vietnam, UNDP Economic and Social Commission for Asia and the Pacific, Bangkok, 1992.
Energy Commodity Account of Vietnam 1992, Asian Development Bank, Manila, 1994.
World Economic Problems (20), National Centre for Social Sciences of the S.R. Vietnam, Institute of World Economy, Hanoi, 1993.
Vietnam Energy Review, Institute of Energy, Hanoi, 1995, 1997, 1998.
APEC annual energy statistics questionnaires.
IEA secretariat estimates.
Sources for Biofuels and waste:
IEA secretariat estimates based on 1992 data from Vietnam Rural and Household Energy Issues and Op-tions: Report No. 161/94, The World Bank, ESMAP, Washington, D.C., 1994.
Yemen
Oil and gas pipeline sabotage was reported in 2012 due to unrest in Yemen. Breaks in time series between 2011 and 2012 as well as between 2012 and 2013 may be observed because of this.
Sources 1992 to 2013:
Statistical Yearbook, Central Statistical Organization, Sana’a, various editions up to 2014.
Household Budget Survey 2005/2006, Central Statis-tical Organization, Sana’a.
Petroleum Subsidies in Yemen, IFPRI, 2011.
Online database, The International Association for Natural Gas (Cedigaz). 2009 to 2013.

ENERGY STATISTICS OF NON-OECD COUNTRIES: DATABASE DOCUMENTATION (2015 revised edition) - 95
INTERNATIONAL ENERGY AGENCY
Petroleum Exploration and Production Authority online statistics, 2008 to 2011.
Yemen Petroleum Company, online statistics, 2010.
Statistical Bulletin, Arab Union of Producers, Trans-porters and Distributors of Electricity (AUPTDE), Amman, various editions up to 2012.
Oil & Gas in Figures 2001 – 2007, Ministry of Oil & Minerals, Statistics Technical Committee, Yemen, 2008.
Oil, Gas and Minerals Statistics, Annual Bulletin 2001, 2002, 2003, 2004, 2005 and 2006, Ministry of Oil & Minerals, Statistics Technical Committee, Yemen, 2001 to 2007.
Direct communications to the IEA secretariat from the Yemen General Oil and Gas Corporation, the Public Electricity Corporation, and the National Information Center, Sana’a, 2001.
Statistical Indicators in the Electricity Sector, Ministry of Planning and Development, Central Statistical Or-ganization, Yemen, 1993.
IEA secretariat estimates.
Sources up to 1991:
Statistical Yearbook, Government of Yemen Arab Republic, Yemen, 1988.
Sources for Biofuels and waste:
The UN Energy Statistics Database.
Forestry Statistics, FAO, Rome, 2000.
IEA secretariat estimates.
Former Yugoslavia
Data for individual countries of the Former Yugoslavia are available starting in 1990, and most of the infor-mation on 1990 and 1991 was estimated by the IEA secretariat. Because of large breaks in reporting which occurred in the early 1990’s, breaks in time series may occur in 1990 for all regional totals.
Sources up to 1989:
Statisticki Godisnjak Yugoslavije, Socijalisticka Fed-erativna Rebublika Jugoslavija, Savezni Zavod Za Statistiku, Beograd, 1985 to 1991.
Indeks, Socijalisticka Federativna Rebublika Jugoslavija, Beograd, 1990, 1991, 1992.
Zambia
A fire damaged the sole oil refinery (Indeni) in Zambia in 2000. Therefore, breaks in time series may occur between 1999 and 2000, as well as between 2000 and 2001.
In this edition new information on refinery yields was obtained and applied to the refinery production from 2001 to 2013. This may result in change in refinery production trends from previous editions.
Sources 1971 to 2013:
Energy Sector Report 2008, 2010, 2013. Energy Regu-lation Board, Lusaka.
Petroleum Industry Statistics, Energy Regulation Board, Lusaka. Various editions up to 2013.
Institutional Framework and Storage and Transporta-tion Infrastructure of the Zambian Petroleum Supply Chain (DRAFT), Government of the Republic of Zambia, 2007.
Economic Report 2003, Ministry of Finance, Lusaka.
Energy Statistics Bulletin 1980-1999, The Department of Energy, Lusaka, 2000.
AFREPREN, 2002.
Annual Statistical Yearbook 1993, 1994, 1995 (Con-sumption in Zambia 1978-1983), Eskom, Lusaka, 1984.
IEA secretariat estimates.
Sources for Biofuels and waste:
IEA secretariat estimates based on 1991 data from Forests and Biomass Sub-sector in Africa, African Energy Programme of the African Development Bank, Abidjan, 1996.
Zimbabwe
In this edition new information on road fuel imports was obtained. Breaks in time series may occur be-tween 2010 and 2011 because of this.
Sources 2006 to 2013:
Direct communication with the Ministry of Energy and Power Development, Harare, 2015
Direct communication with the Zimbabwe Statistical Office (ZimStat), Harare, 2014.

96 - ENERGY STATISTICS OF NON-OECD COUNTRIES: DATABASE DOCUMENTATION (2015 revised edition)
INTERNATIONAL ENERGY AGENCY
Annual Report, Zimbabwe Power Company (ZPC), Harare, various editions from 2010 up to 2012.
Sources 1996 to 2005:
Direct communication with the Ministry of Energy and Power Development, 2007, 2012.
Direct communication with the Zimbabwe Electricity Supply Authority (ZESA), 2003, 2005, 2006.
African Economic Outlook 2004, OECD, Paris, 2004.
Direct communication to the IEA secretariat from the Department of Energy Resources and Development, February 2002, AFREPREN, 2002.
Direct communication to the IEA secretariat from the Ministry of Environment and Tourism, Harare, 1999, 2000.
Direct communication to the IEA secretariat from the electricity utility.
Electricity Statistics Information, Central Statistical Office, Causeway, February 1998.
IEA secretariat estimates.
Sources 1992 to 1995:
Eskom Annual Statistical Yearbook 1993, 1994, 1995, Johannesburg, 1994, 1995, 1996, citing Zimbabwe Electricity Supply Authority, Harare as source.
The UN Energy Statistics Database.
Sources up to 1991:
Zimbabwe Statistical Yearbook 1986, Central Statisti-cal Office, Harare, 1990.
Quarterly Digest of Statistics, Central Statistical Of-fice, Harare, 1990.
Zimbabwe Electricity Supply Authority Annual Re-port, Zimbabwe Electricity Supply Authority, Harare, 1986 to 1991.
Sources for Biofuels and waste:
IEA secretariat estimates based on 1991 data from Forests and Biomass Sub-sector in Africa, African Energy Programme of the African Development Bank, Abidjan, 1996.
Other Africa
Time series for this region are obtained by summing data corresponding to individual countries (see lists in section I.5, Geographical coverage). As a conse-quence, intra-regional trade is included as part of total trade. Therefore, trade is likely to be overstated.
The UN Statistics Division database is the main data source for the countries not listed individually and included in the region Other Africa. In this edition only UN data for the period 2011-2012 were uploaded which may create breaks in time series between 2010 and 2011.
In this edition data for Bagasse use in the transformation sector in autoproducer electricity plants, main activity producer CHP plants and autoproducer CHP plants be-came available for the years 2011-2013. This may lead to breaks in time series between 2010 and 2011.
In this edition, data for Niger are no longer included in Other Africa for the period 2000-2013. This may lead to breaks in time series between 1999 and 2000.
Sources up to 2013
The UN Energy Statistics Database.
IEA secretariat estimates.
Other Asia
Time series for this region are obtained by summing data corresponding to individual countries (see lists in section I.5, Geographical coverage). As a conse-quence, intra-regional trade is included as part of total trade. Therefore, trade is likely to be overstated.
In this edition only UN data for the period 2011-2012 were uploaded which may create breaks in time series between 2010 and 2011.
Sources up to 2013
The UN Energy Statistics Database.
IEA secretariat estimates.
Sources for Natural Gas exports from East Timor
Australia’s energy data submissions to IEA
Other Non-OECD Americas
Time series for this region are obtained by summing data corresponding to individual countries (see lists in section I.5, Geographical coverage). As a conse-quence, intra-regional trade is included as part of total trade. Therefore, trade is likely to be overstated.
The refinery in Aruba was shut down in September 2012. This may lead to breaks in time series from 2011-2013.

ENERGY STATISTICS OF NON-OECD COUNTRIES: DATABASE DOCUMENTATION (2015 revised edition) - 97
INTERNATIONAL ENERGY AGENCY
In this edition only UN data for the period 2011-2012 were uploaded which may create breaks in time series between 2010 and 2011.
In this edition energy data for Bonaire, Saba, Saint Eustratius and Sint Maarten are included in Other Non-OECD Americas for the period 2012-2013.
Sources up to 2013
Annual Statistical Digest of the Central Bank of Aruba.
The UN Energy Statistics Database.
IEA secretariat estimates.

98 - ENERGY STATISTICS OF NON-OECD COUNTRIES: DATABASE DOCUMENTATION (2015 revised edition)
INTERNATIONAL ENERGY AGENCY
7. ISSUES OF DATA QUALITY
Methodology
Considerable effort has been made to ensure that the data presented in this publication adhere to the IEA definitions reported in section I.2, Table Descriptions, and section I.3, Definitions of energy sources. These definitions are used by most of the international or-ganisations that collect energy statistics.
Nevertheless, energy statistics at the national level are often collected using criteria and definitions which differ, sometimes considerably, from those of interna-tional organisations. The IEA secretariat has identified these differences and, where possible, adjusted the data to meet international definitions.
Recognised anomalies occurring in specific countries are presented in section II, Country notes and sources. Country notes present the most important deviations from the IEA methodology and are by no means a comprehensive list of anomalies by country.
Estimation
In addition to adjustments compensating for differ-ences in definitions, estimations1 are sometimes re-quired to complete major aggregates, when key statis-tics are missing.
The IEA secretariat has aimed to provide all the ele-ments of commodity balances down to the level of final consumption, for all countries and years. Providing all the elements of supply, as well as all inputs and outputs of the main transformation activities (such as oil refining and electricity generation), has often required estima-
1. Data may not include all informal and/or illegal trade, production or consumption of energy products, although the IEA secretariat makes efforts to estimate these where reliable information is available.
tions. Estimations have been generally made after consultation with national statistical offices, oil com-panies, electricity utilities and national energy experts.
Time series and political changes
Commodity balances for the individual countries of the Former Soviet Union and the Former Yugoslavia start in 1990 and are not available for previous years. Estonia is included in Former Soviet Union prior to 1990 and in OECD Total from 1990 onwards. Slove-nia is included in Former Yugoslavia until 1990 and in OECD Total from 1990 onwards. These balances are generally based on official submissions, but esti-mations have also been made by the IEA secretariat.
Data for Kosovo are available starting in 2000. Be-tween 1990 and 1999, data for Kosovo are included in Serbia. Prior to 1990, they are included in Former Yugoslavia. Data for Montenegro are available starting in 2005. Between 1990 and 2004, data for Montenegro are included in Serbia. Prior to 1990, they are includ-ed in Former Yugoslavia.
The Netherlands Antilles was dissolved on 10 October 2010 resulting in two new ‘constituent countries’ (Cu-raçao and Sint Maarten) with the other islands joining The Netherlands as ‘special municipalities’. However, due to lack of detailed data the IEA secretariat’s data and estimates under the ‘Netherlands Antilles’ still refer to the whole territory of the Netherlands Antilles as it was known prior to 10 October 2010, up to 2011. From 2012 data refer only to the island of Curaçao. The other islands of the former Netherlands Antilles are added to Other Non-OECD Americas from 2012.
On 9 July, 2011 South Sudan became an independent country. Data are presented for South Sudan for the first time in this edition.
ENERGY STATISTICS OF NON-OECD COUNTRIES: DATABASE DOCUMENTATION (2015 revised edition) - 99
INTERNATIONAL ENERGY AGENCY
Energy statistics for some countries undergo con-tinuous changes in their coverage or methodology. Consequently, breaks in time series are considered to be unavoidable.
The IEA secretariat reviews its databases each year. In the light of new assessments, important revisions may be made to time series of individual countries during the course of this review. Therefore, some data in this publication have been substantially revised with re-spect to previous editions. Please always consult sec-tion II, Country notes and sources.
Classification of fuel uses
National statistical sources often lack adequate infor-mation on the consumption of fuels in different cate-gories of end use. Many countries do not conduct an-nual surveys of consumption in the main sectors of economic activity, and published data may be based on out-of-date surveys. Therefore, sectoral disaggre-gation of consumption should generally be interpreted with caution.
In transition economies (countries of non-OECD Eu-rope and Eurasia) and in China, the sectoral classifica-tion of fuel consumption before the reforms of the 1990s significantly differed from that of market econ-omies. Sectoral consumption was defined according to the economic branch of the user, rather than according to the purpose or use of the fuel. For example, con-sumption of gasoline in the vehicle fleet of an enter-prise attached to the economic branch ‘Iron and steel’ was classified as consumption in the ‘Iron and steel’ industry itself.
Where possible, data have been adjusted to fit interna-tional classifications. For example, all gasoline is as-sumed to be consumed in transport. However, it has not been possible to reclassify products other than gasoline and jet fuel as easily, and few other adjust-ments have been made to the other products.
Imports and exports
For a given product, imports and exports may not sum up to zero at the world level for a number of reasons. Fuels may be classified differently (i.e. fuel oil ex-ports may be reported as refinery feedstocks by the importing country; NGL exports may be reported as LPG by the importing country, etc.). Other possible reasons include discrepancies in conversion factors, inclusion of international bunkers in exports, timing
differences, data reported on a fiscal year basis instead of calendar year for certain countries, and under-reporting of imports and exports for fiscal reasons.
Specific issues by fuel
Oil
The IEA secretariat collects comprehensive statistics for oil supply and use, including oil for own use of refineries, oil delivered to international bunkers, and oil used as petrochemical feedstock. National statistics often do not report all these amounts.
Reported production of refined products may refer to net rather than gross refinery output; consumption of oil products may be limited to sales to domestic markets, and may not include deliveries to international ship-ping or aircraft. Oil consumed as petrochemical feed-stock in integrated refinery/petrochemical complexes is often not included in available official statistics.
Where possible, the IEA secretariat has estimated those unreported data, in consultation with the oil in-dustry. In the absence of any other indication, refinery fuel use is estimated to be a percentage (e.g. 5%) of refinery throughput, and where possible, split between refinery gas and fuel oil. For a description of some ad-justments made to the sectoral consumption of oil products, see prior section ‘Classification of fuel uses’.
Natural gas
Natural gas should be comprised mainly of methane; other gases, such as ethane and heavier hydrocarbons, should be reported under the heading of ‘oil’. The IEA defines natural gas production as the marketable production, i.e. net of field losses, flaring, venting and re-injection.
However, the lack of adequate definitions makes it difficult or impossible to identify all quantities of gas at all different stages of its separation into dry gas (methane) and heavier fractions. National data for natu-ral gas do not always explicitly show separate quanti-ties for field losses, flaring, venting and re-injection.
Natural gas supply and demand statistics are normally reported in volumetric units, and it is difficult to ob-tain accurate data on the calorific value. In the absence of specific information, the IEA generally applies an average gross calorific value of 38 TJ/million m3.
Reliable consumption data for natural gas at a dis-aggregated level are often difficult to find. This is es-pecially true for some of the largest natural gas con-suming countries in the Middle East. Therefore,

100 - ENERGY STATISTICS OF NON-OECD COUNTRIES: DATABASE DOCUMENTATION (2015 revised edition)
INTERNATIONAL ENERGY AGENCY
industrial use of natural gas for these countries is fre-quently missing from the data published here.
Electricity
The IEA classification shows ‘main activity produc-ers’ separately from ‘autoproducers’ of electricity and heat. As defined in section I.2, Table Descriptions, an autoproducer of electricity is an establishment which, in addition to its main activities, generates electricity wholly or partly for its own use. For non-OECD coun-tries, data on autoproducers are not always reported. In such cases, the quantities of fuels used as input to electricity are included under the appropriate end-use sector.
When statistics of production of electricity from bio-fuels and waste are available, they are included in to-tal electricity production. However, these data are not comprehensive; for example, much of the electricity generated from waste biomass in sugar refining facili-ties remains unreported.
When unreported, inputs of fuels for electricity gener-ation are estimated using information on electricity output, fuel efficiency and type of generation capacity.
Heat
For heat, transition economies (countries of non-OECD Europe and Eurasia) and China used to adopt a different methodology from that adopted in market economies. They allocated the transformation of pri-mary fuels (coal, oil and gas) by industry into heat for consumption on site to the transformation activity ‘heat production’, not to industrial consumption, as in the IEA methodology2. The transformation output of Heat was then allocated to the various end use sectors. The losses occurring in the transformation of fuels into heat in industry were not included in final con-sumption of industry.
Although a number of countries have recently switched to the practice of international organisations, this important issue reduces the possibility of cross-country comparisons for sectoral end use consumption between transition economies and market economies.
Biofuels and Waste
The IEA publishes data on production, domestic sup-ply and consumption of biofuels and waste for all non-OECD countries and all regions.
2. For autoproducer plants, the international methodology restricts the inclusion of heat in transformation processes to that sold to third par-ties. See definition in section I.2, Table Descriptions.
Data are often based on secondary sources and may be of variable quality, which makes comparisons be-tween countries difficult. For many countries, histori-cal data are derived from surveys which were often irregular, irreconcilable and conducted at a local ra-ther than national level.
Where historical series were incomplete or unavaila-ble, they were estimated using a methodology con-sistent with the projection framework of the IEA’s 1998 edition of World Energy Outlook (September 1998). First, nation-wide domestic supply per capita of biofuels and wastes was compiled or estimated for 1995. Then, per capita supply for the years 1971 to 1994 was estimated using a log/log equation with ei-ther GDP per capita or percentage of urban population as exogenous variables, depending on the region. Fi-nally, supply of total biofuels and waste after 1996 was estimated assuming a growth rate either constant, equal to the population growth rate, or based on the 1971-1994 trend.
Those estimated time series should be treated very cautiously. The chart below provides a broad indica-tion of the estimation methodology and of the data quality by region.
Region Main source of data
Data quality
Exogenous variables
Africa FAO database and AfDB
low population growth rate
Non-OECD Americas
national and OLADE
high none
Asia surveys high to low
population growth rate
Non-OECD Europe and Eurasia
questionnaires and FAO
high to medium
none
Middle East FAO medium to low
none
Given the importance of vegetal fuels in the energy picture of many developing countries, balances down to final consumption by end-use for individual prod-ucts or product categories have been compiled for all countries. Data for the years 2012 and 2013 are shown in the Annual tables. Time series for charcoal produc-tion are shown in the Summary tables.
The IEA hopes that the inclusion of these data will encourage national administrations and other agencies active in the field to enhance the level and quality of data collection and coverage for biofuels and waste. More details on the methodology used by each coun-try may be provided on request and comments are welcome.

ENERGY STATISTICS OF NON-OECD COUNTRIES: DATABASE DOCUMENTATION (2015 revised edition) - 101
INTERNATIONAL ENERGY AGENCY
8. UNITS AND CONVERSIONS General conversion factors for energy
To: TJ Gcal Mtoe MBtu GWh
From: multiply by:
terajoule (TJ) 1 2.388x10² 2.388x10⁻⁵ 9.478x10² 2.778x10⁻¹
gigacalorie (Gcal) 4.187x10⁻³ 1 1.000x10⁻⁷ 3.968 1.163x10⁻³
million tonnes of oil equivalent (Mtoe)
4.187x10⁴ 1.000x10⁷ 1 3.968x10⁷ 1.163x10⁴
million British thermal units (MBtu)
1.055x10⁻³ 2.520x10⁻¹ 2.520x10⁻⁸ 1 2.931x10⁻⁴
gigawatt hour (GWh) 3.600 8.598x10² 8.598x10⁻⁵ 3.412x10³ 1
Conversion factors for mass
To: kg t lt st lb
From: multiply by:
kilogramme (kg) 1 1.000x10⁻³ 9.842x10⁻⁴ 1.102x10⁻³ 2.205
tonne (t) 1.000x10³ 1 9.842x10⁻¹ 1.102 2.205x10³
long ton (lt) 1.016x10³ 1.016 1 1.120 2.240x10³
short ton (st) 9.072x10² 9.072x10⁻¹ 8.929x10⁻¹ 1 2.000x10³
pound (lb) 4.536x10⁻¹ 4.536x10⁻⁴ 4.464x10⁻⁴ 5.000x10⁻⁴ 1
Conversion factors for volume
To: gal U.S. gal U.K. bbl ft3 l m3
From: multiply by:
U.S. gallon (gal U.S.) 1 8.327x10⁻¹ 2.381x10⁻² 1.337x10⁻¹ 3.785 3.785x10⁻³
U.K. gallon (gal U.K.) 1.201 1 2.859x10⁻² 1.605x10⁻¹ 4.546 4.546x10⁻³
barrel (bbl) 4.200x101 3.497x101 1 5.615 1.590x10² 1.590x10⁻¹
cubic foot (ft3) 7.481 6.229 1.781x10⁻¹ 1 2.832x101 2.832x10⁻²
litre (l) 2.642x10⁻¹ 2.200x10⁻¹ 6.290x10⁻³ 3.531x10⁻² 1 1.000x10⁻³
cubic metre (m3) 2.642x10² 2.200x10² 6.290 3.531x101 1.000x10³ 1
102 - ENERGY STATISTICS OF NON-OECD COUNTRIES: DATABASE DOCUMENTATION (2015 revised edition)
INTERNATIONAL ENERGY AGENCY
9. ABBREVIATIONS
Btu: British thermal unit GWh: gigawatt hour kcal: kilocalorie kg: kilogramme kJ: kilojoule kt: kilotonne Mt: million tonnes m3: cubic metre t: metric ton = tonne = 1000 kg TJ: terajoule toe: tonne of oil equivalent = 107 kcal
CHP: combined heat and power GCV: gross calorific value GDP gross domestic product HHV: higher heating value = GCV LHV: lower heating value = NCV NCV: net calorific value PPP: purchasing power parity TFC: total final consumption TPES: total primary energy supply AfDB: African Development Bank EU-28: European Union - 28 FAO: Food and Agriculture Organisation of the United Nations IEA: International Energy Agency OECD: Organisation for Economic Co-operation and Development OLADE: Organización Latinoamericana de Energía UN: United Nations UNECE: United Nations Economic Commission for Europe IPCC: Intergovernmental Panel on Climate Change ISIC: International Standard Industrial Classification UNIPEDE: International Union of Producers and Distributors of Electrical Energy e estimated .. not available - nil x not applicable