Embed Size (px)
Citation preview
ELECTRICITY RESOURCE ADEQUACY: RELIABILITY, SCARCITY, AND
OPERATING RESERVE DEMAND CURVES
William W. Hogan
Mossavar-Rahmani Center for Business and Government
John F. Kennedy School of Government Harvard University
Cambridge, Massachusetts 02138
26th USAEE/IAEE Annual North American Conference Dual Plenary Session: Electricity Investment, Reliability and Environmental Effects
Ann Arbor, MI September 26, 2006
1
ELECTRICITY MARKET Overcoming Market Failure In the case of wholesale electricity markets, the choice between a pure market and central administrative solutions is a false dichotomy. • With current technology and system configuration, central administrative interventions are
necessary.
o Limited control and metering.
o Balancing, Dispatch and Security constraints. • Not all administrative interventions are equivalent.
o Vicious circles.
Zonal pricing ► constrained-on and -off payments ► misplaced investment ► integrated resource procurements ► the ISO as the “utilities’ utility.”
o Virtuous circles.
Nodal pricing ► bid-based, security-constrained economic dispatch ► financial transmission rights.
2
ELECTRICITY MARKET Missing Money Incomplete scarcity pricing leaves “missing money.” This creates poor operational and investment incentives. There is a need for administrative intervention. • Installed Capacity. Assuming it is impossible to provide adequate scarcity pricing, interventions
focus on installed capacity requirements.
o Emphasis on physical capacity and planning targets. This seems natural and innocuous, but the physical perspective leads to a host of market design problems.
o Requirement for longer-term regulatory commitments and decisions. Substantial payments must come through the regulatory decision, investment requires the commitment.
o Assumes there is some method for defining and ensuring transmission deliverability. If we knew how to do this, everything would be easier. But the electricity network makes this difficult.
o Experience reveals unintended consequences and renews interest in better scarcity pricing. • Scarcity Pricing. Suspending disbelief, consider better scarcity pricing.
o An “energy only” market without an installed capacity requirement, but with alternative regulatory requirements.
o Or “belts and suspenders” with better scarcity pricing that supports an installed capacity
system.
3
CommercialIncentives
ReliabilityRules
NetworkInteractions
Open AccessNon-Discrimination
EPAct 1992
Successful Market Design Challenge
SMD
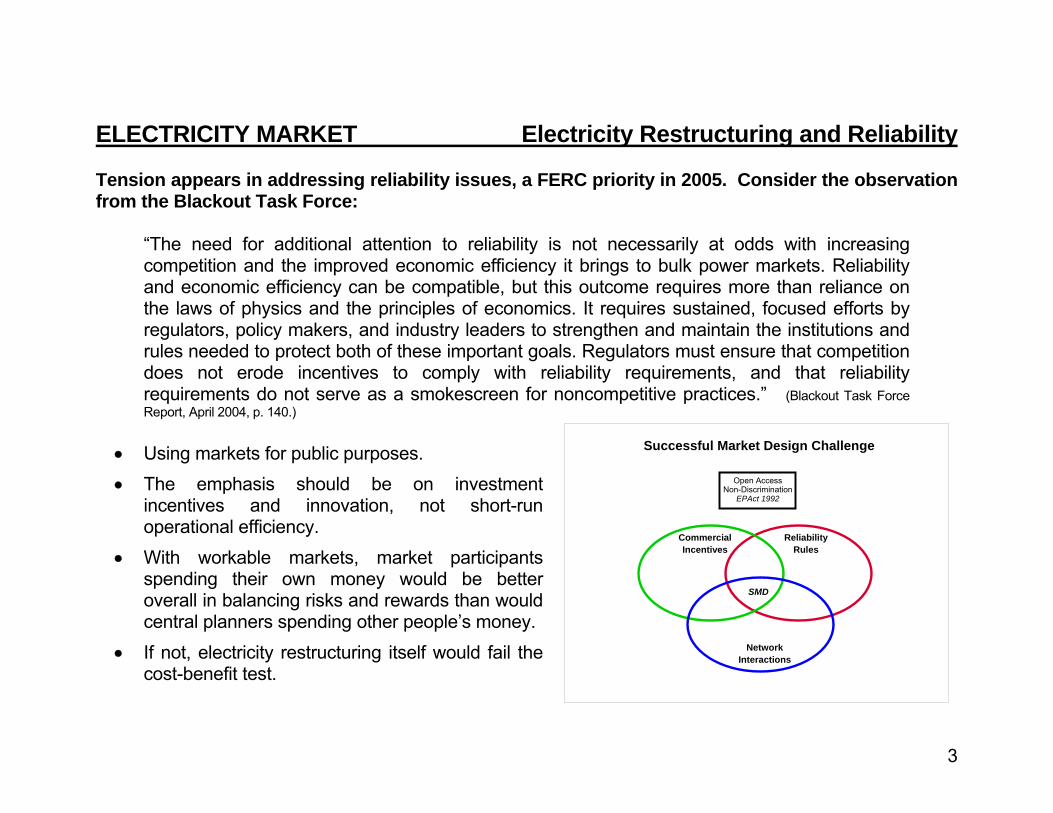
ELECTRICITY MARKET Electricity Restructuring and Reliability Tension appears in addressing reliability issues, a FERC priority in 2005. Consider the observation from the Blackout Task Force:
“The need for additional attention to reliability is not necessarily at odds with increasing competition and the improved economic efficiency it brings to bulk power markets. Reliability and economic efficiency can be compatible, but this outcome requires more than reliance on the laws of physics and the principles of economics. It requires sustained, focused efforts by regulators, policy makers, and industry leaders to strengthen and maintain the institutions and rules needed to protect both of these important goals. Regulators must ensure that competition does not erode incentives to comply with reliability requirements, and that reliability requirements do not serve as a smokescreen for noncompetitive practices.” (Blackout Task Force Report, April 2004, p. 140.)
• Using markets for public purposes. • The emphasis should be on investment
incentives and innovation, not short-run operational efficiency.
• With workable markets, market participants spending their own money would be better overall in balancing risks and rewards than would central planners spending other people’s money.
• If not, electricity restructuring itself would fail the cost-benefit test.

4
ELECTRICITY MARKET Market Interface Principles The North American Electric Reliability Council (NERC) enumerated market interface principles.
Market Interface Principles “Recognizing that bulk electric system reliability and electricity markets are inseparable and mutually interdependent, all Organization Standards shall be consistent with the Market Interface Principles. Consideration of the Market Interface Principles is intended to assure Organization Standards are written such that they achieve their reliability objective without causing undue restrictions or adverse impacts on competitive electricity markets.
1. The planning and operation of bulk electric systems shall recognize that reliability is an
essential requirement of a robust North American economy. 2. An Organization Standard shall not give any market participant an unfair competitive
advantage. 3. An Organization Standard shall neither mandate nor prohibit any specific market structure. 4. An Organization Standard shall not preclude market solutions to achieving compliance with that
standard. 5. An Organization Standard shall not require the public disclosure of commercially sensitive
information. All market participants shall have equal opportunity to access commercially non-sensitive information that is required for compliance with reliability standards.”
(NERC, “Reliability and Market Interface Principles,” February 25, 2002, ftp://ftp.nerc.com/pub/sys/all_updl/tsc/stf/ReliabilityandMarketInterfacePrinciples.pdf )
5
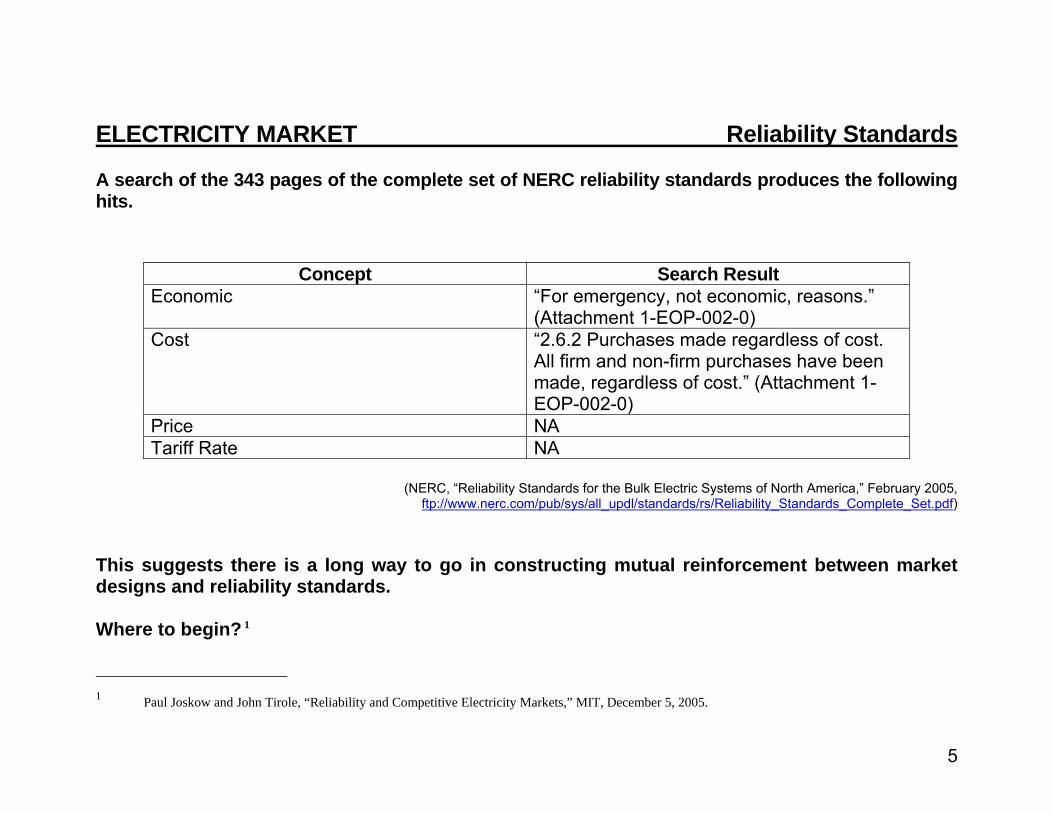
ELECTRICITY MARKET Reliability Standards A search of the 343 pages of the complete set of NERC reliability standards produces the following hits.
Concept Search Result Economic “For emergency, not economic, reasons.”
(Attachment 1-EOP-002-0) Cost “2.6.2 Purchases made regardless of cost.
All firm and non-firm purchases have been made, regardless of cost.” (Attachment 1-EOP-002-0)
Price NA Tariff Rate NA
(NERC, “Reliability Standards for the Bulk Electric Systems of North America,” February 2005,
ftp://www.nerc.com/pub/sys/all_updl/standards/rs/Reliability_Standards_Complete_Set.pdf) This suggests there is a long way to go in constructing mutual reinforcement between market designs and reliability standards. Where to begin? 1
1 Paul Joskow and John Tirole, “Reliability and Competitive Electricity Markets,” MIT, December 5, 2005.

6
ELECTRICITY MARKET Focus on Balancing Markets First
The solution to open access and non-discrimination inherently involves market design. Good design begins with the real-time market, and works backward. A common failure mode starts with the forward market, without specifying the rules and prices that would apply in real time.
False Starts for the Electricity Market
Operations
Rules &Pricing
Scheduling &CommitmentInvestment Balancing
Day, Week, Month, ...Ahead
Real-TimeDispatch & Balancing
Begin Design Here
XBegin Design Here
Market expectations determine incentives. Start at the end.Work backward, not forward, in setting market design.
7
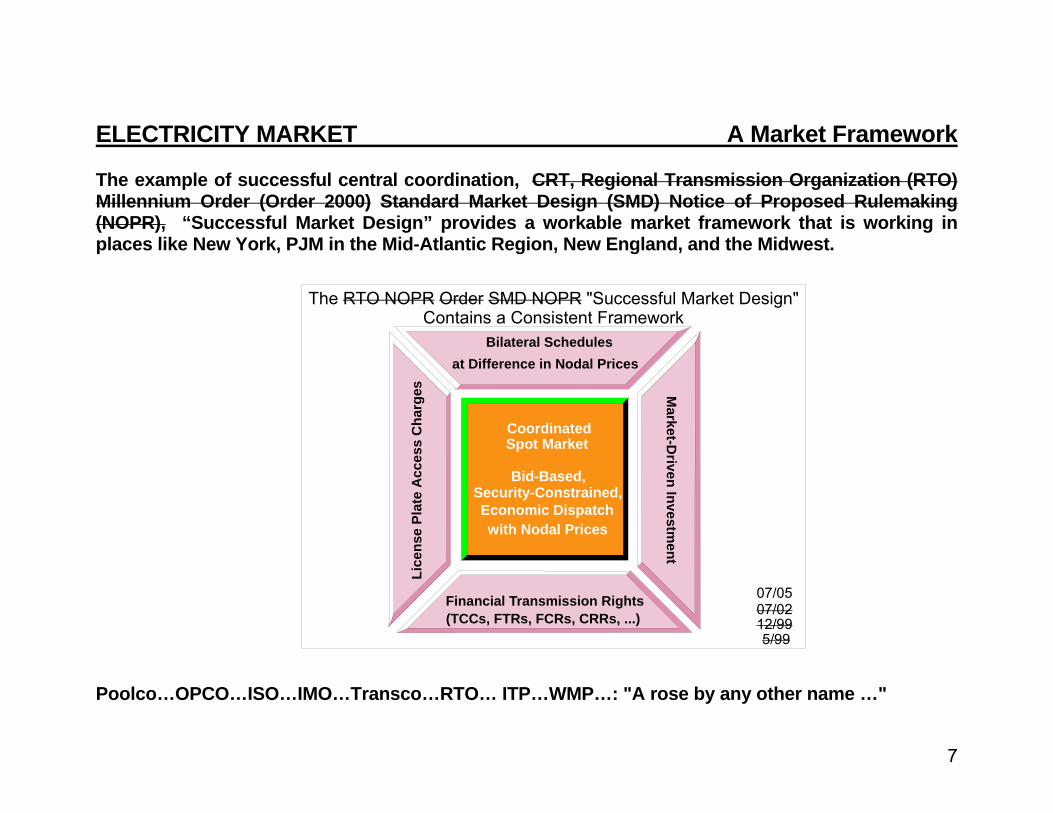
ELECTRICITY MARKET A Market Framework The example of successful central coordination, CRT, Regional Transmission Organization (RTO) Millennium Order (Order 2000) Standard Market Design (SMD) Notice of Proposed Rulemaking (NOPR), “Successful Market Design” provides a workable market framework that is working in places like New York, PJM in the Mid-Atlantic Region, New England, and the Midwest.
Poolco…OPCO…ISO…IMO…Transco…RTO… ITP…WMP…: "A rose by any other name …"
CoordinatedSpot Market
Bid-Based,Security-Constrained,Economic Dispatchwith Nodal Prices
The RTO NOPR Order SMD NOPR "Successful Market Design" Contains a Consistent Framework
07/05
Bilateral Schedules
Financial Transmission Rights
Lice
nse
Plat
e A
cces
s C
harg
es Market-D
riven Investment
at Difference in Nodal Prices
(TCCs, FTRs, FCRs, CRRs, ...)5/99
12/9907/02
8
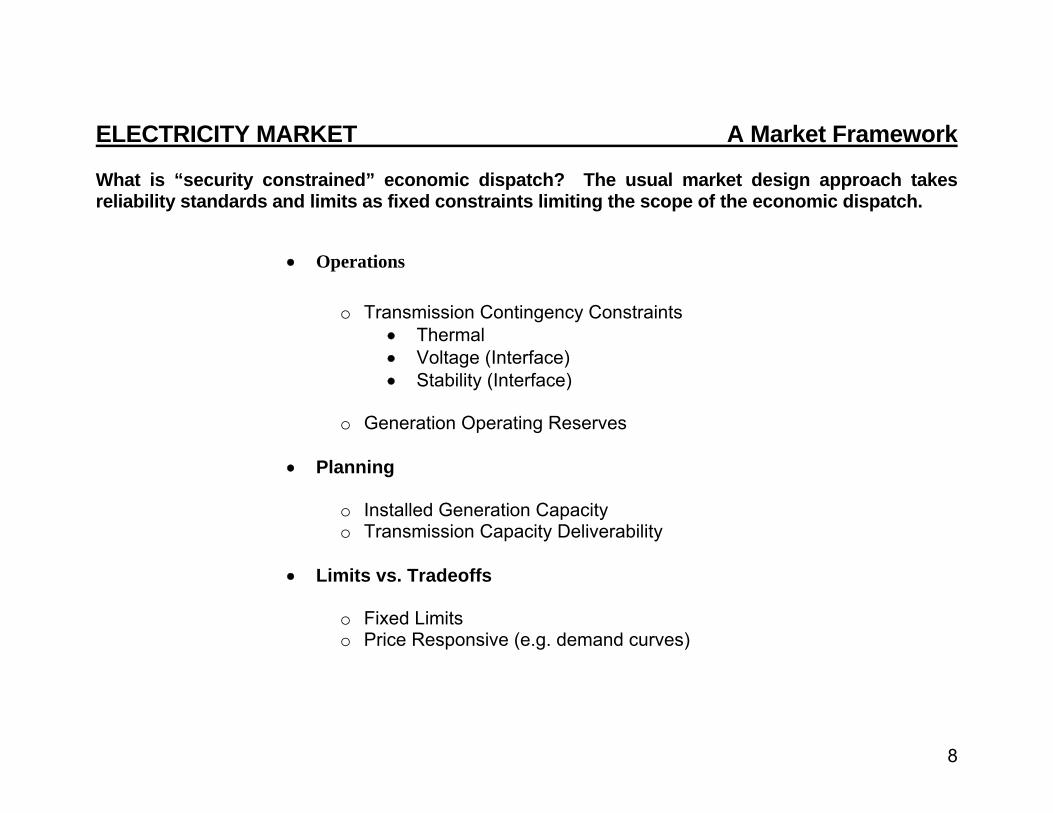
ELECTRICITY MARKET A Market Framework What is “security constrained” economic dispatch? The usual market design approach takes reliability standards and limits as fixed constraints limiting the scope of the economic dispatch.
• Operations
o Transmission Contingency Constraints • Thermal • Voltage (Interface) • Stability (Interface)
o Generation Operating Reserves
• Planning
o Installed Generation Capacity o Transmission Capacity Deliverability
• Limits vs. Tradeoffs
o Fixed Limits o Price Responsive (e.g. demand curves)
9
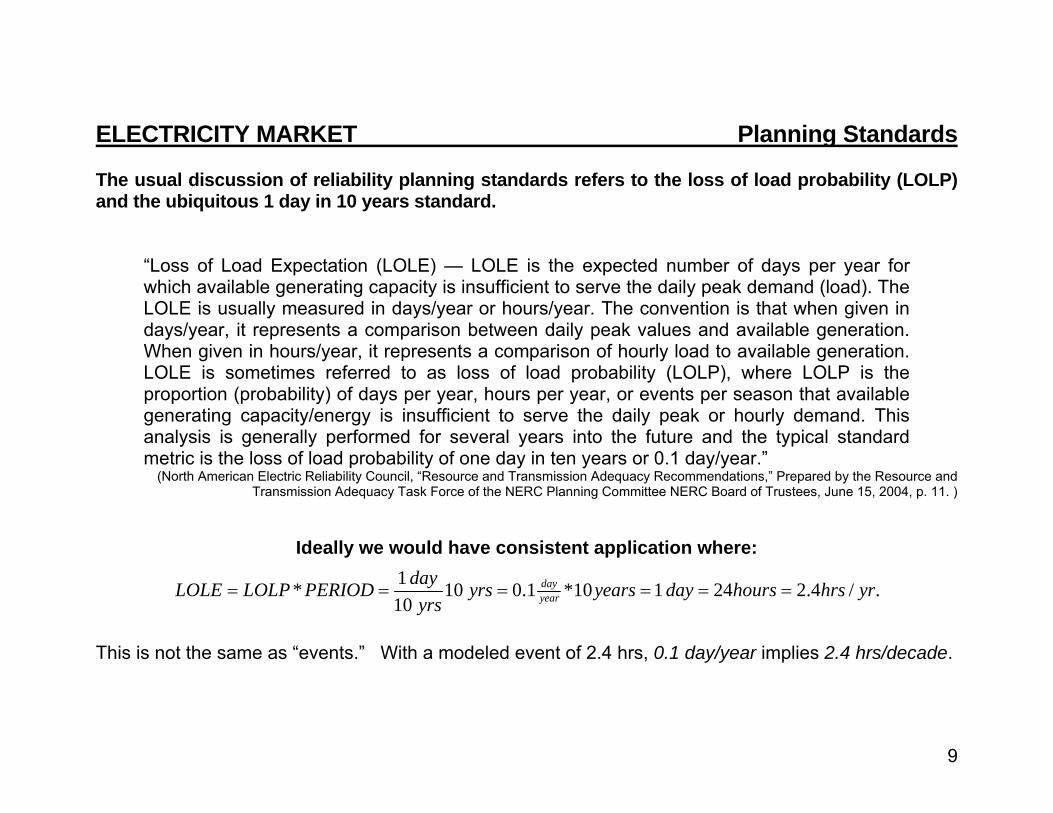
ELECTRICITY MARKET Planning Standards The usual discussion of reliability planning standards refers to the loss of load probability (LOLP) and the ubiquitous 1 day in 10 years standard.
“Loss of Load Expectation (LOLE) — LOLE is the expected number of days per year for which available generating capacity is insufficient to serve the daily peak demand (load). The LOLE is usually measured in days/year or hours/year. The convention is that when given in days/year, it represents a comparison between daily peak values and available generation. When given in hours/year, it represents a comparison of hourly load to available generation. LOLE is sometimes referred to as loss of load probability (LOLP), where LOLP is the proportion (probability) of days per year, hours per year, or events per season that available generating capacity/energy is insufficient to serve the daily peak or hourly demand. This analysis is generally performed for several years into the future and the typical standard metric is the loss of load probability of one day in ten years or 0.1 day/year.”
(North American Electric Reliability Council, “Resource and Transmission Adequacy Recommendations,” Prepared by the Resource and Transmission Adequacy Task Force of the NERC Planning Committee NERC Board of Trustees, June 15, 2004, p. 11. )
Ideally we would have consistent application where:
1* 10 0.1 *10 1 24 2.4 / .10
dayyear
dayLOLE LOLP PERIOD yrs years day hours hrs yryrs
= = = = = =
This is not the same as “events.” With a modeled event of 2.4 hrs, 0.1 day/year implies 2.4 hrs/decade.
10
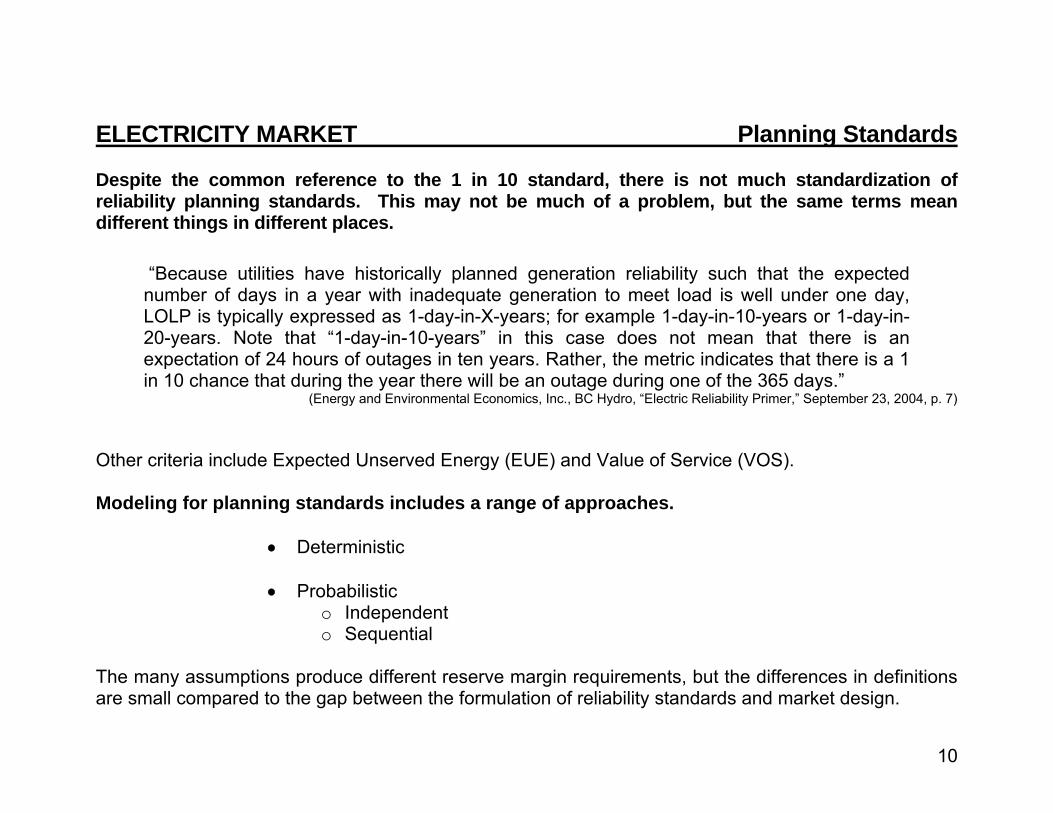
ELECTRICITY MARKET Planning Standards Despite the common reference to the 1 in 10 standard, there is not much standardization of reliability planning standards. This may not be much of a problem, but the same terms mean different things in different places.
“Because utilities have historically planned generation reliability such that the expected number of days in a year with inadequate generation to meet load is well under one day, LOLP is typically expressed as 1-day-in-X-years; for example 1-day-in-10-years or 1-day-in-20-years. Note that “1-day-in-10-years” in this case does not mean that there is an expectation of 24 hours of outages in ten years. Rather, the metric indicates that there is a 1 in 10 chance that during the year there will be an outage during one of the 365 days.”
(Energy and Environmental Economics, Inc., BC Hydro, “Electric Reliability Primer,” September 23, 2004, p. 7) Other criteria include Expected Unserved Energy (EUE) and Value of Service (VOS). Modeling for planning standards includes a range of approaches.
• Deterministic • Probabilistic
o Independent o Sequential
The many assumptions produce different reserve margin requirements, but the differences in definitions are small compared to the gap between the formulation of reliability standards and market design.
11
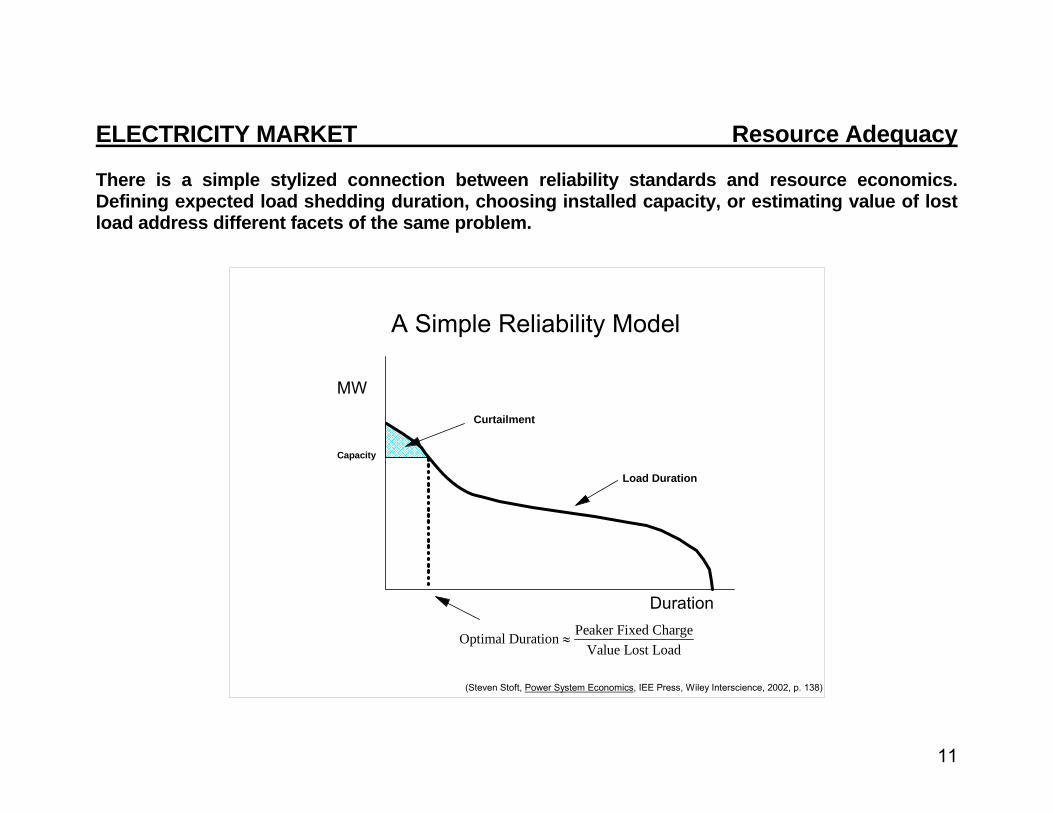
MW
A Simple Reliability Model
Duration
Capacity
Load Duration
Curtailment
Peaker Fixed ChargeOptimal DurationValue Lost Load
≈
(Steven Stoft, Power System Economics, IEE Press, Wiley Interscience, 2002, p. 138)
ELECTRICITY MARKET Resource Adequacy There is a simple stylized connection between reliability standards and resource economics. Defining expected load shedding duration, choosing installed capacity, or estimating value of lost load address different facets of the same problem.
12
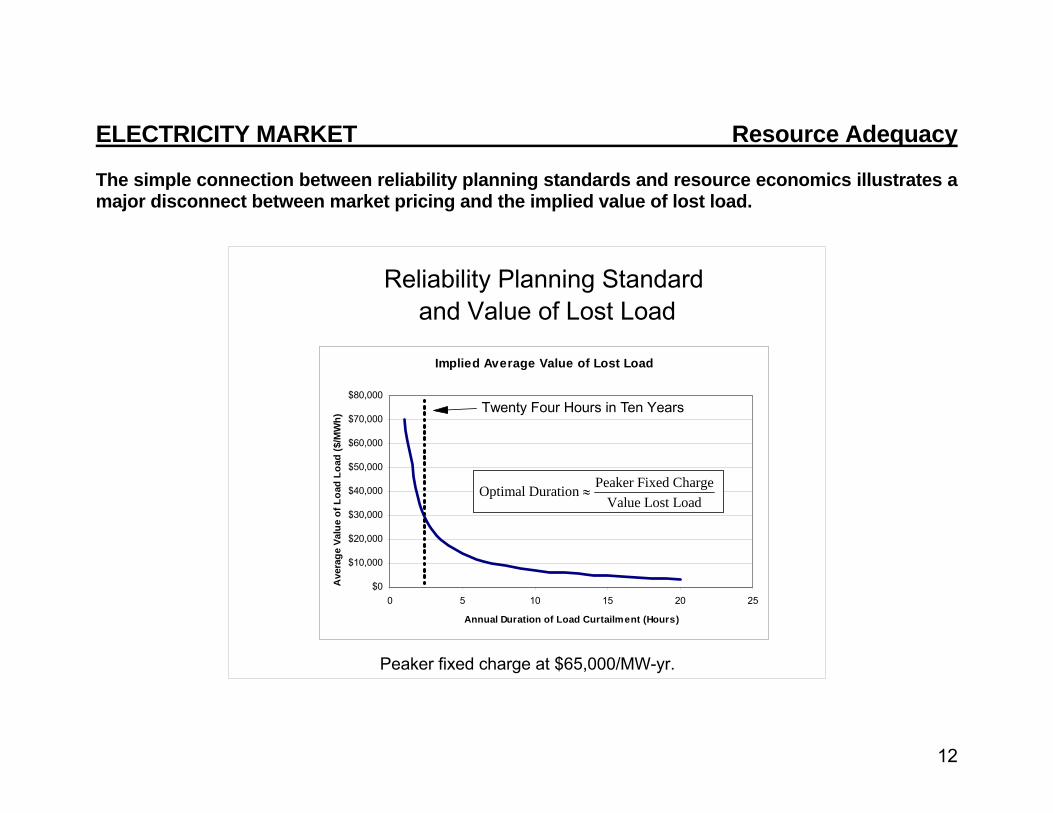
ELECTRICITY MARKET Resource Adequacy The simple connection between reliability planning standards and resource economics illustrates a major disconnect between market pricing and the implied value of lost load.
Reliability Planning Standard and Value of Lost Load
Peaker fixed charge at $65,000/MW-yr.
Implied Average Value of Lost Load
$0
$10,000
$20,000
$30,000
$40,000
$50,000
$60,000
$70,000
$80,000
0 5 10 15 20 25
Annual Duration of Load Curtailment (Hours)
Ave
rage
Val
ue o
f Loa
d Lo
ad ($
/MW
h)
Twenty Four Hours in Ten Years
Peaker Fixed ChargeOptimal DurationValue Lost Load
≈
13
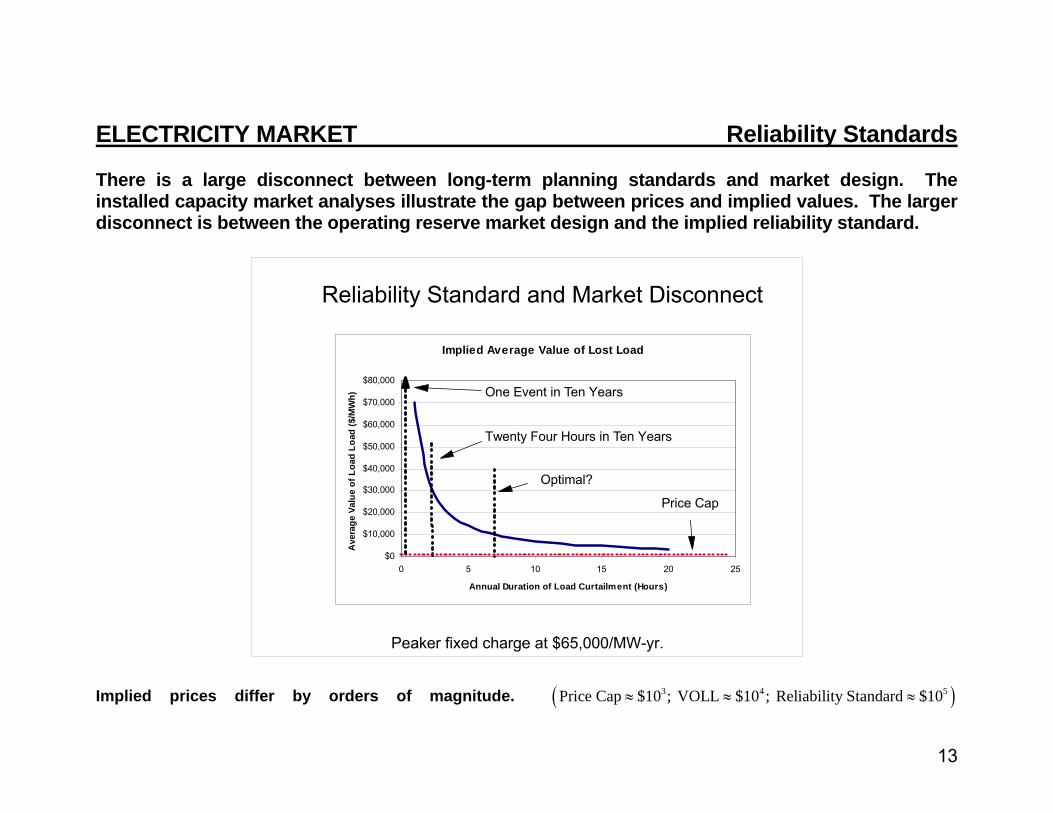
ELECTRICITY MARKET Reliability Standards There is a large disconnect between long-term planning standards and market design. The installed capacity market analyses illustrate the gap between prices and implied values. The larger disconnect is between the operating reserve market design and the implied reliability standard. Implied prices differ by orders of magnitude. ( )3 4 5Price Cap $10 ; VOLL $10 ; Reliability Standard $10≈ ≈ ≈
Reliability Standard and Market Disconnect
Peaker fixed charge at $65,000/MW-yr.
Implied Average Value of Lost Load
$0
$10,000
$20,000
$30,000
$40,000
$50,000
$60,000
$70,000
$80,000
0 5 10 15 20 25
Annual Duration of Load Curtailment (Hours)
Ave
rage
Val
ue o
f Loa
d Lo
ad ($
/MW
h)
Twenty Four Hours in Ten Years
Optimal?
Price Cap
One Event in Ten Years
14
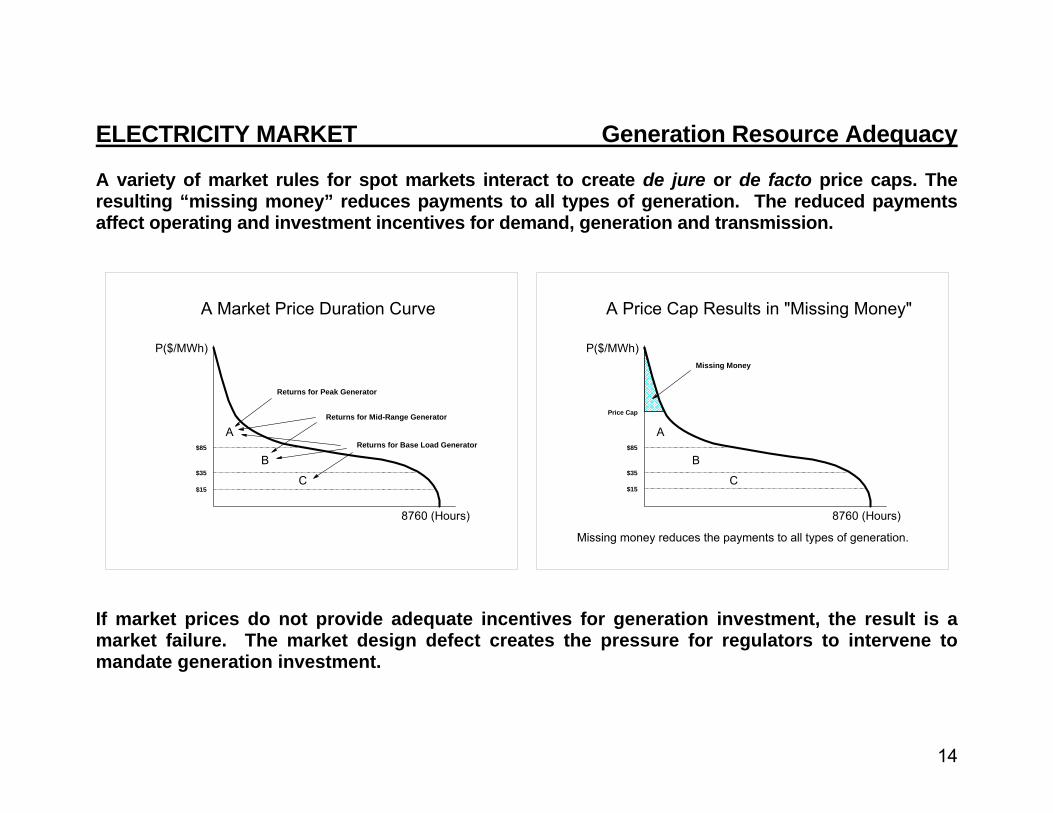
ELECTRICITY MARKET Generation Resource Adequacy A variety of market rules for spot markets interact to create de jure or de facto price caps. The resulting “missing money” reduces payments to all types of generation. The reduced payments affect operating and investment incentives for demand, generation and transmission.
If market prices do not provide adequate incentives for generation investment, the result is a market failure. The market design defect creates the pressure for regulators to intervene to mandate generation investment.
P($/MWh)
A Market Price Duration Curve
8760 (Hours)
$35
$15
$85
A
B
C
Returns for Peak Generator
Returns for Mid-Range Generator
Returns for Base Load Generator
P($/MWh)
A Price Cap Results in "Missing Money"
8760 (Hours)
$35
$15
$85
A
B
C
Price Cap
Missing Money
Missing money reduces the payments to all types of generation.
15
ELECTRICITY MARKET Generation Resource Adequacy The obvious solution was to create a regulatory requirement that load serving entities purchase sufficient installed generation capacity to meet the projected load plus an adequate reserve margin. • Installed Capacity (ICAP) requirements through short-tem auctions or deficiency charges.
A regulatory requirement to obtain “capacity” for peak load plus a reserve margin.
o PJM daily requirement. o NYISO monthly requirement. o ISONE monthly requirement.
• The apparently obvious solution has not worked. ICAP is seen as a failed model. But it
won’t go away. Reforms of these reforms followed with further interventions.
o Locational variant (LICAP) in NYSIO with local installed reserve demand curve. o Peaking Unit Safe Harbor (PUSH) model for controlled exercise of market power in ISONE. o Reliability Must Run (RMR) and Out of Market (OOM) purchases, everywhere.
FERC recognizes the growing pressure for RMR contracts and similar interventions as part of the problem, not the solution.
16
ELECTRICITY MARKET Generation Resource Adequacy The latest reforms of resource adequacy reforms move substantially in the direction of greater prescription and mandates from the central planners. • ISONE LICAP Proposal (August 31, 2004). FCM Settlement Proposal (March 6, 2006).
o LICAP: Locational Demand Curve. FCM: Fixed demand with pricing restrictions. o Zonal Transfer Limits. o LICAP: Month-Ahead Requirements. FCM: Three-year-Ahead Requirements. o Rules for Demand, Generation and Transmission Tradeoffs.
• PJM Reliability Pricing Model (RPM) Proposal (August 31, 2005).
o Locational Variable Resource Requirement (VRR). o Zonal Transfer Limits. o Four-year-Ahead Requirements. o Rules for Demand, Generation and Transmission Tradeoffs.
Both proposals face substantial opposition over jurisdictional, cost and complexity issues. However, given the defects in the electricity market designs, the direction established in these proposals is natural and inevitable. Given the assumptions, many of the elements of the proposals are logical and sophisticated. But the programs are unlikely to be enough to meet the objectives. And not all the pieces fit, or are even yet defined. More prescriptions will follow.
17
ELECTRICITY MARKET Generation Resource Adequacy Given the expanding prescriptions of generation resources adequacy programs built on installed capacity requirements, there is a greater willingness to step back and look at the assumptions. • Focus on the market failure.
o Missing money arises from de facto price caps. o A market-based resource adequacy program would not slide down the slippery slope.
• An energy only market alternative with no installed capacity mandate.
o Texas White Paper and PUC Staff proposal. (July 2005). o MISO White Paper and Staff proposal (August 2005).
• An “energy only” market alternative with compatible interventions.
o Target operating conditions rather than planning standards. o Create a workable electricity spot market without the missing money. o Design other compatible interventions with hedging and market power mitigation to address
the problems that motivated the de facto price caps. o Think “market based” rather than “command and control.”
18
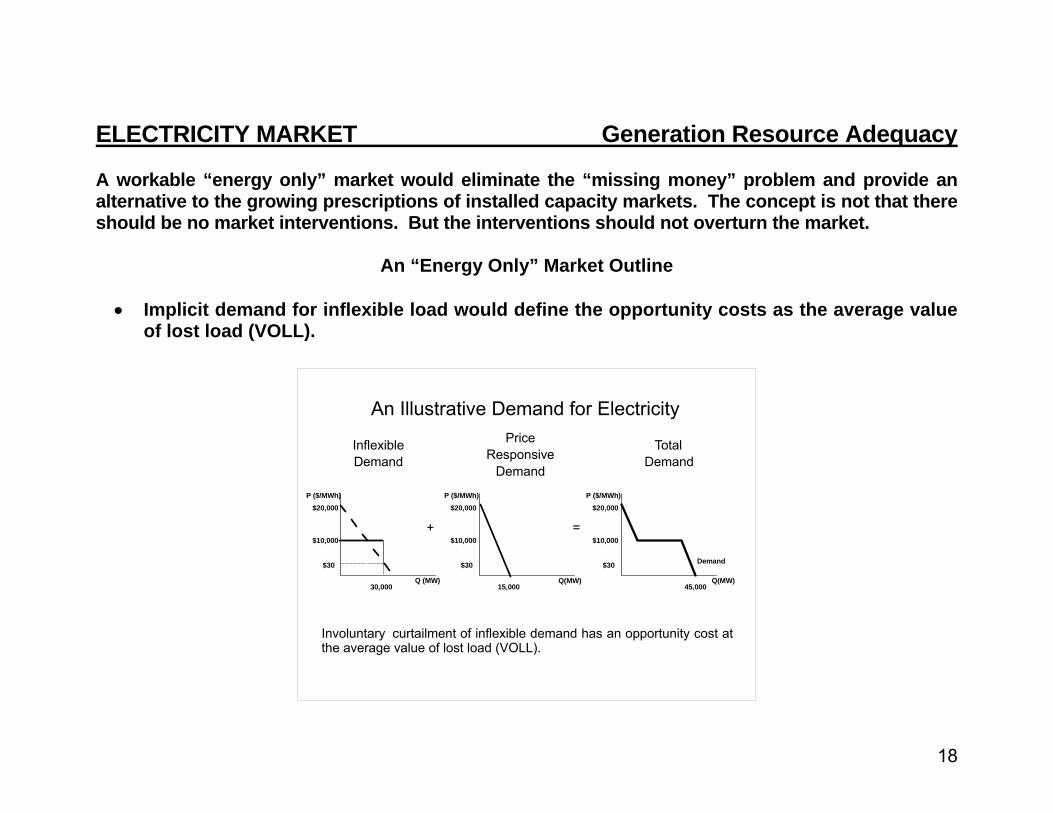
ELECTRICITY MARKET Generation Resource Adequacy A workable “energy only” market would eliminate the “missing money” problem and provide an alternative to the growing prescriptions of installed capacity markets. The concept is not that there should be no market interventions. But the interventions should not overturn the market.
An “Energy Only” Market Outline • Implicit demand for inflexible load would define the opportunity costs as the average value
of lost load (VOLL).
An Illustrative Demand for Electricity
P ($/MWh)
Q (MW)
$20,000
$10,000
$30
Q(MW)
P ($/MWh)$20,000
$10,000
$30
Q(MW)
Demand
P ($/MWh)$20,000
$10,000
$30
+ =
InflexibleDemand
PriceResponsive
Demand
30,000 15,000 45,000
TotalDemand
Involuntary curtailment of inflexible demand has an opportunity cost at the average value of lost load (VOLL).
19
ELECTRICITY MARKET Generation Resource Adequacy
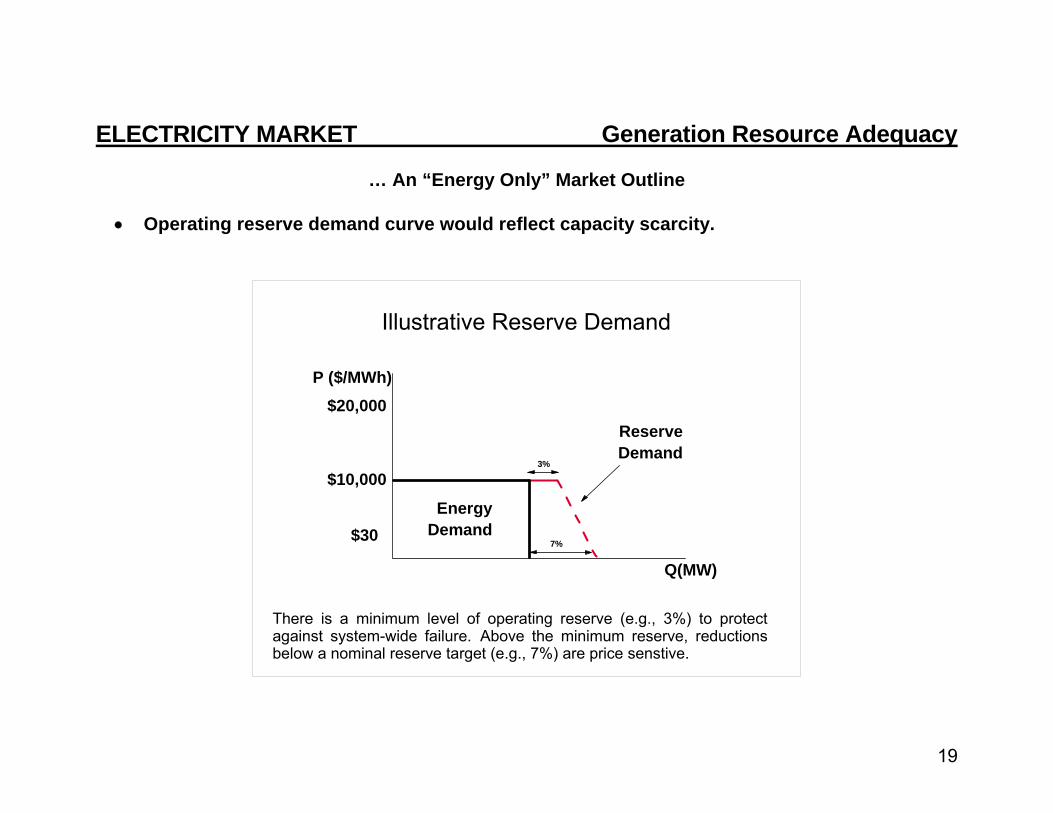
… An “Energy Only” Market Outline • Operating reserve demand curve would reflect capacity scarcity.
Illustrative Reserve Demand
Q(MW)
ReserveDemand
P ($/MWh)$20,000
$10,000
$30
There is a minimum level of operating reserve (e.g., 3%) to protect against system-wide failure. Above the minimum reserve, reductions below a nominal reserve target (e.g., 7%) are price senstive.
3%
7%
EnergyDemand
20
ELECTRICITY MARKET Generation Resource Adequacy
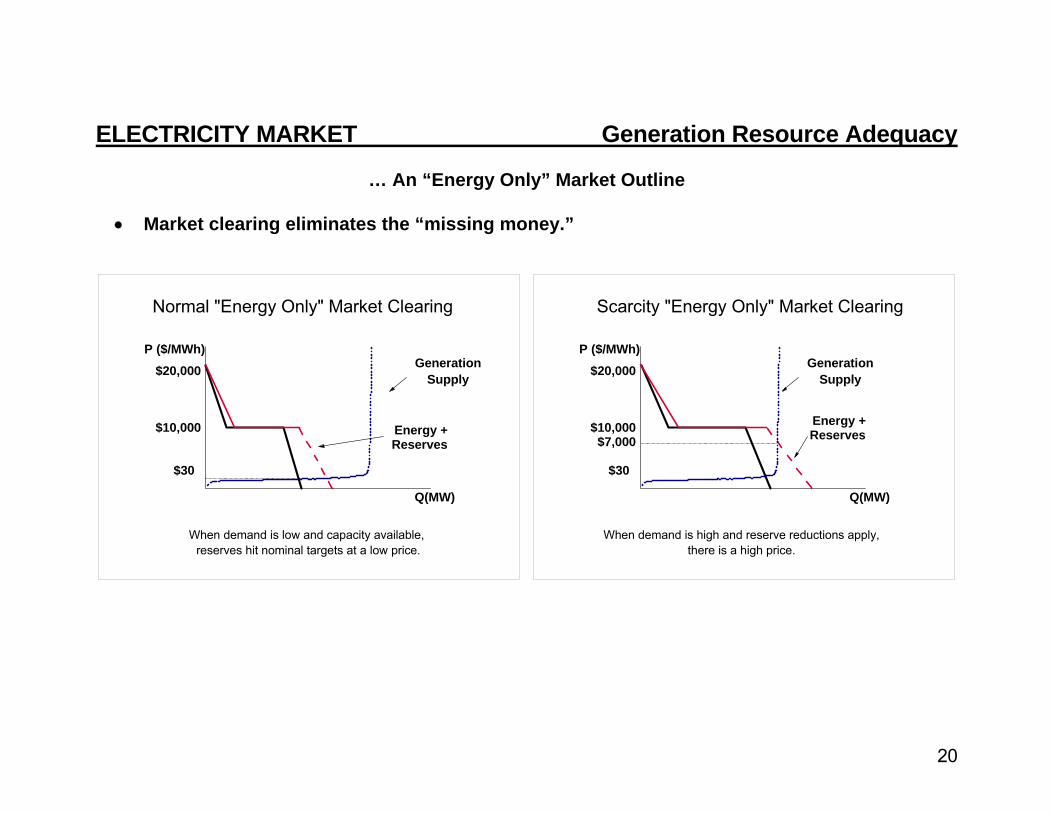
… An “Energy Only” Market Outline • Market clearing eliminates the “missing money.”
Normal "Energy Only" Market Clearing
Q(MW)
Energy + Reserves
P ($/MWh)$20,000
$10,000
$30
When demand is low and capacity available, reserves hit nominal targets at a low price.
GenerationSupply
Scarcity "Energy Only" Market Clearing
Q(MW)
Energy + Reserves
P ($/MWh)$20,000
$10,000
$30
When demand is high and reserve reductions apply,there is a high price.
GenerationSupply
$7,000
21
ELECTRICITY MARKET Generation Resource Adequacy
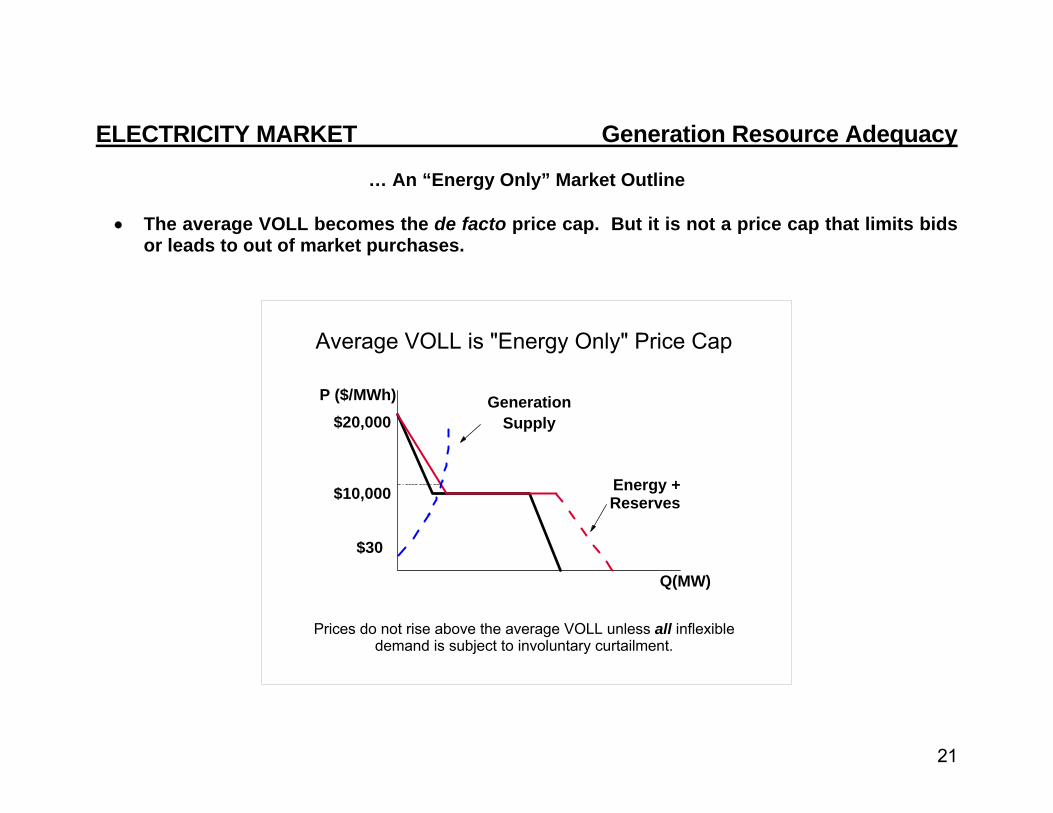
… An “Energy Only” Market Outline • The average VOLL becomes the de facto price cap. But it is not a price cap that limits bids
or leads to out of market purchases.
Average VOLL is "Energy Only" Price Cap
Q(MW)
Energy + Reserves
P ($/MWh)$20,000
$10,000
$30
Prices do not rise above the average VOLL unless all inflexible demand is subject to involuntary curtailment.
GenerationSupply

22
ELECTRICITY MARKET Generation Resource Adequacy
… An “Energy Only” Market Outline • Energy only market issues.
o Electricity Network Effects. Can this work in a network?
o Demand Response. How can there be scarcity pricing without a demand response?
o Reliability. What is the impact on reliability?
o Missing Markets. How do we deal with other ancillary services?
o Market Power. What would be required to mitigate market power?
o Inadequate Contracting. How can the market for investment work without adequate
contracting?
23
ELECTRICITY MARKET Generation Resource Adequacy
… An “Energy Only” Market Outline • “Energy only” market outline.
o Electricity Network Effects. Can this work in a network?
Most of the design is conventional The operating reserve demand curve can be included in the network in the same way as operating reserve requirements (e.g., NYISO).
o Demand Response. How can there be scarcity pricing without a demand response?
More demand response would be better, but the analysis applies to whatever demand response exists, and the operating reserve demand curve ensures some price response. The resulting scarcity pricing provides incentives for more demand response.
o Reliability. What is the impact on reliability?
The loss of load probability is evaluated in real time. The resulting average may be more or less than the planning standard. However, the generic planning standard is largely disconnected from markets and forecasting abilities. Where there is no alternative, the planning standard approach looks appealing. But with better scarcity pricing focused on the real reliability problem in real time, the planning standard is difficult to justify.

24
ELECTRICITY MARKET Generation Resource Adequacy
… An “Energy Only” Market Outline • “Energy only” market outline.
o Missing Markets. How do we deal with other ancillary services?
Voltage support, reactive power, black start and so on, would remain as issues requiring attention to assure adequate and efficient supply. However, improved scarcity pricing for energy and operating reserves should not make these problems more difficult, and might make them easier.
o Market Power. What would be required to mitigate market power?
Hedging contracts would help, but are unlikely to be sufficient. Market power mitigation through offer caps is consistent with the design, assuming the mitigation implementation allows for scarcity pricing when operating reserves are scarce.
25
ELECTRICITY MARKET Generation Resource Adequacy
… An “Energy Only” Market Outline • “Energy only” market outline.
o Inadequate Contracting. How can the market for investment work without adequate
contracting?
Without forward hedges, regulators are unlikely to accept scarcity pricing. And investors are unlikely to believe regulators won’t intervene if high prices appear. Market participants may not enter into enough forward hedges to create counterparties for forward contracts that could support capacity investment. Accepting these reasons, some intervention is required.
A compatible intervention would be some form of mandatory load hedging (MLH).
• Hedges required for default load. • Utilize financial contracts for energy at the load location. • No explicit connection to “physical” capacity or transmission deliverability. • Certification limited to credit requirements. • E.g.: New Jersey Basic Generation Service (BGS) auction. • Liquidated damages contracts are part of the solution, not part of the problem. • Intermediaries would extend the forward contract horizon. • Forward contracts would support infrastructure investment.
26
ELECTRICITY MARKET Summary
… An “Energy Only” Market Outline Summary • “Energy only” market outline.
o Address “missing money” problem through scarcity pricing.
o Mitigate market power through offer caps.
o Hedge with mandatory financial contracts for energy at the load location.
o Avoid most or all RMR and OOM requirements.
o Avoid central mandates for generation capacity, demand and transmission tradeoffs.
o Remove perverse incentives for operations during critical scarcity periods.
o Use existing performance monitoring for settlements and operating reserves.
o Avoid special rules restricting electricity market access during scarcity conditions. • “Belts and suspenders” insurance.
o Better scarcity pricing makes an installed capacity system easier and less important.
o Operating incentives cover everything, not just capacity accepted in a forward auction.
27
ELECTRICITY MARKET Operating Reserve Locational fixed operating reserve minimums are already familiar practice. The detailed operating rules during reserve scarcity involve many steps. Improved scarcity pricing would accompany introduction of an operating reserve demand curve under dispatch based pricing. Consider a simplified setting. • Dispatched-Based Pricing. Interpret the actual dispatch result as the solution of the reliable
economic dispatch problem. Calculate consistent prices from the simplified model.
• Single Period. Unit commitment decisions made as though just before the start of the period. Uncertain outcomes determined after the commitment decision, with only redispatch or emergency actions such as curtailment over the short operating period (e.g. less than an hour).
• Single Reserve Class. Model operating reserves as committed and synchronized.
• DC Network Approximation. Focus on role of reserves but set context of simultaneous dispatch of energy and reserves. A network model for energy, but a zonal model for reserves.
The purpose here is to pursue a further development of the properties of a market model that expands locational reserve requirements to include operating reserve demand curve(s). The NYISO market design includes locational operating reserve demand curves. The ISONE market design plan calls for locational operating reserve requirements with violation penalties that operate like a demand curve.2 2 Independent Market Advisor, to the New York ISO, “2004 State of the Market Report New York ISO,” NYISO, July 2005, p. 59. ISO New England, “2006 Wholesale Markets Plan,” September 2005, pp. 16-17.
28
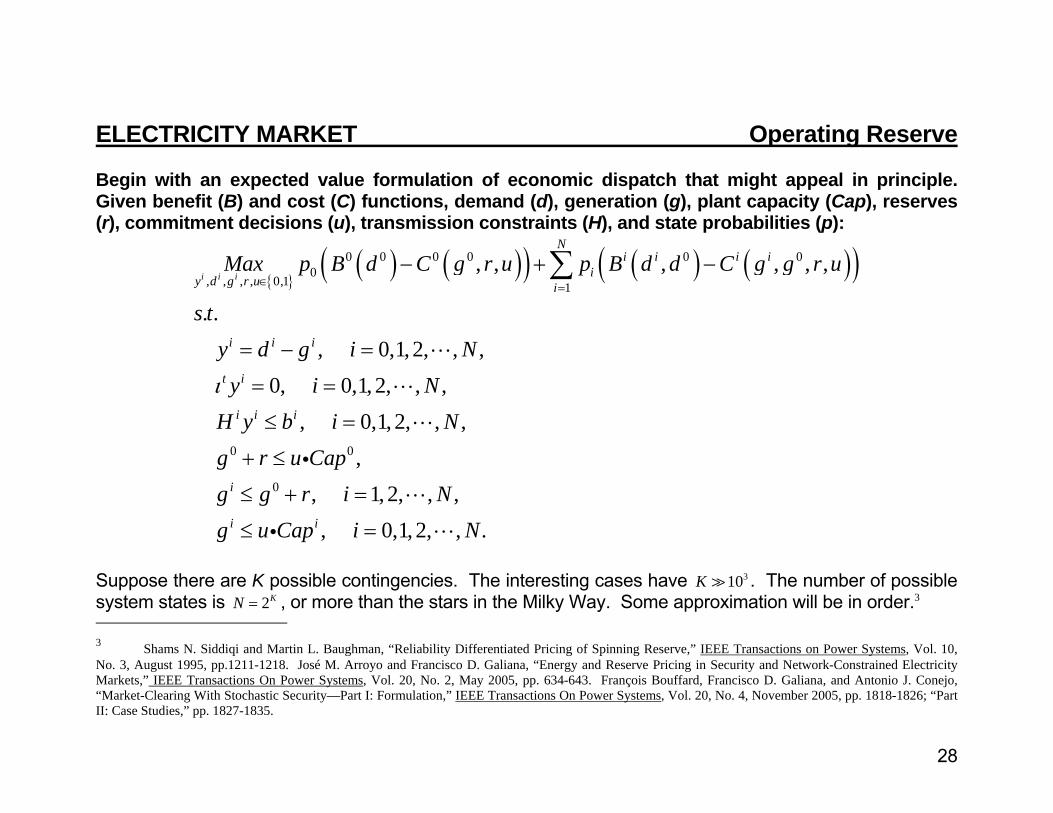
ELECTRICITY MARKET Operating Reserve Begin with an expected value formulation of economic dispatch that might appeal in principle. Given benefit (B) and cost (C) functions, demand (d), generation (g), plant capacity (Cap), reserves (r), commitment decisions (u), transmission constraints (H), and state probabilities (p):
{ }( ) ( )( ) ( ) ( )( )0 0 0 0 0 0
0, , , , 0,1 1
0 0
0
, , , , , ,
. ., 0,1,2, , ,
0, 0,1, 2, , ,, 0,1, 2, , ,
,, 1, 2, , ,, 0,1, 2, , .
i i i
Ni i i i
iy d g r u i
i i i
t i
i i i
i
i i
Max p B d C g r u p B d d C g g r u
s ty d g i Ny i N
H y b i Ng r u Capg g r i Ng u Cap i N
ι
∈ =
− + −
= − =
= =
≤ =
+ ≤
≤ + =
≤ =
∑
i
i
Suppose there are K possible contingencies. The interesting cases have 310K . The number of possible system states is 2KN = , or more than the stars in the Milky Way. Some approximation will be in order.3 3 Shams N. Siddiqi and Martin L. Baughman, “Reliability Differentiated Pricing of Spinning Reserve,” IEEE Transactions on Power Systems, Vol. 10, No. 3, August 1995, pp.1211-1218. José M. Arroyo and Francisco D. Galiana, “Energy and Reserve Pricing in Security and Network-Constrained Electricity Markets,” IEEE Transactions On Power Systems, Vol. 20, No. 2, May 2005, pp. 634-643. François Bouffard, Francisco D. Galiana, and Antonio J. Conejo, “Market-Clearing With Stochastic Security—Part I: Formulation,” IEEE Transactions On Power Systems, Vol. 20, No. 4, November 2005, pp. 1818-1826; “Part II: Case Studies,” pp. 1827-1835.
29
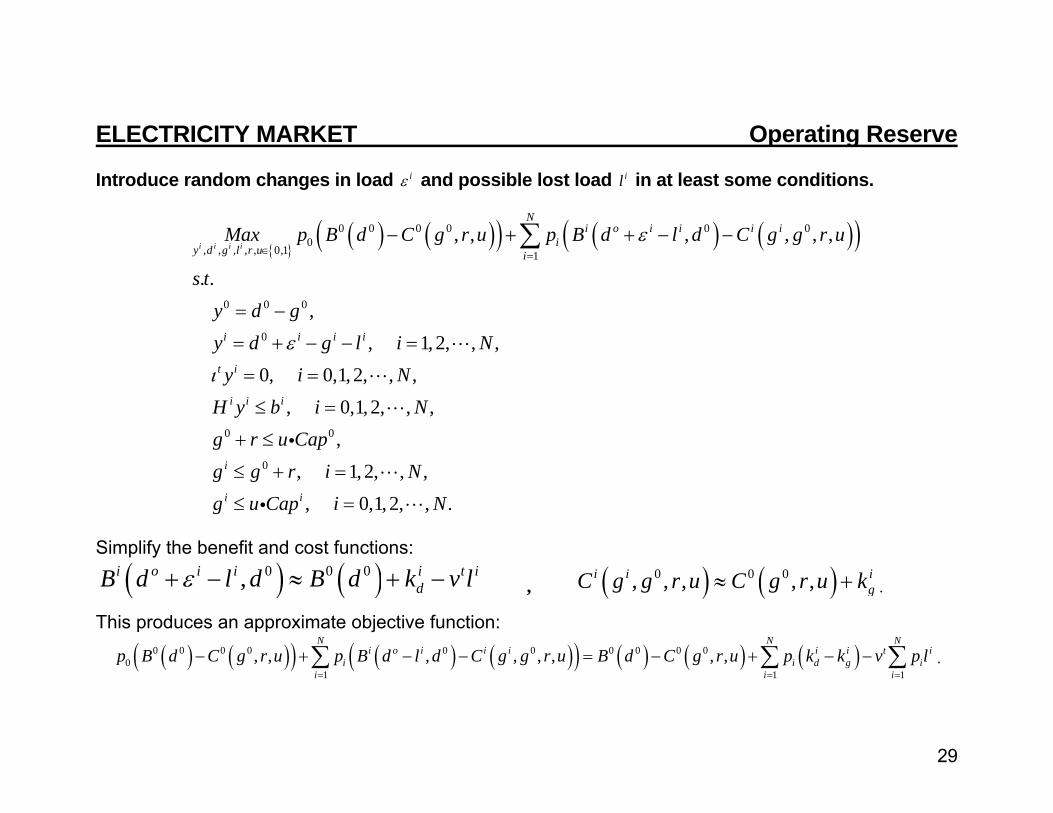
ELECTRICITY MARKET Operating Reserve Introduce random changes in load iε and possible lost load il in at least some conditions.
{ }( ) ( )( ) ( ) ( )( )0 0 0 0 0 0
0, , , , , 0,1 1
0 0 0
0
0 0
0
, , , , , ,
. .,
, 1, 2, , ,0, 0,1, 2, , ,
, 0,1,2, , ,,
, 1, 2, , ,, 0,1, 2, , .
i i i i
Ni o i i i i
iy d g l r u i
i i i i
t i
i i i
i
i i
Max p B d C g r u p B d l d C g g r u
s ty d gy d g l i Ny i N
H y b i Ng r u Capg g r i Ng u Cap i N
ε
ε
ι
∈ =
− + + − −
= −
= + − − =
= =
≤ =
+ ≤
≤ + =
≤ =
∑
i
i
Simplify the benefit and cost functions:
( ) ( )0 0 0,i o i i i t idB d l d B d k v lε+ − ≈ + − , ( ) ( )0 0 0, , , , ,i i i
gC g g r u C g r u k≈ + .
This produces an approximate objective function:
( ) ( )( ) ( ) ( )( ) ( ) ( ) ( )0 0 0 0 0 0 0 0 0 00
1 1 1, , , , , , , ,
N N Ni o i i i i i t i
i i d g ii i i
p B d C g r u p B d l d C g g r u B d C g r u p k k v p l= = =
− + − − = − + − −∑ ∑ ∑ .
30
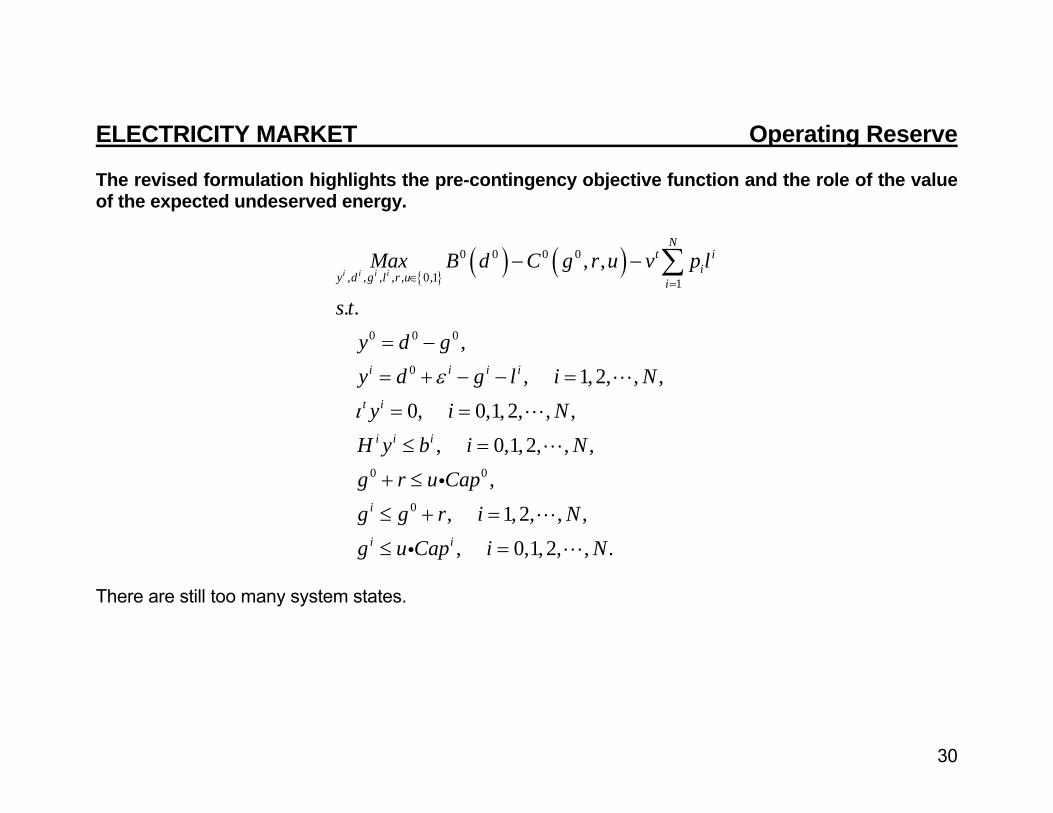
ELECTRICITY MARKET Operating Reserve The revised formulation highlights the pre-contingency objective function and the role of the value of the expected undeserved energy.
{ }( ) ( )0 0 0 0
, , , , , 0,1 1
0 0 0
0
0 0
0
, ,
. .,
, 1, 2, , ,0, 0,1, 2, , ,
, 0,1,2, , ,,
, 1, 2, , ,, 0,1, 2, , .
i i i i
Nt i
iy d g l r u i
i i i i
t i
i i i
i
i i
Max B d C g r u v p l
s ty d gy d g l i Ny i N
H y b i Ng r u Capg g r i Ng u Cap i N
ε
ι
∈ =
− −
= −
= + − − =
= =
≤ =
+ ≤
≤ + =
≤ =
∑
i
i
There are still too many system states.
31
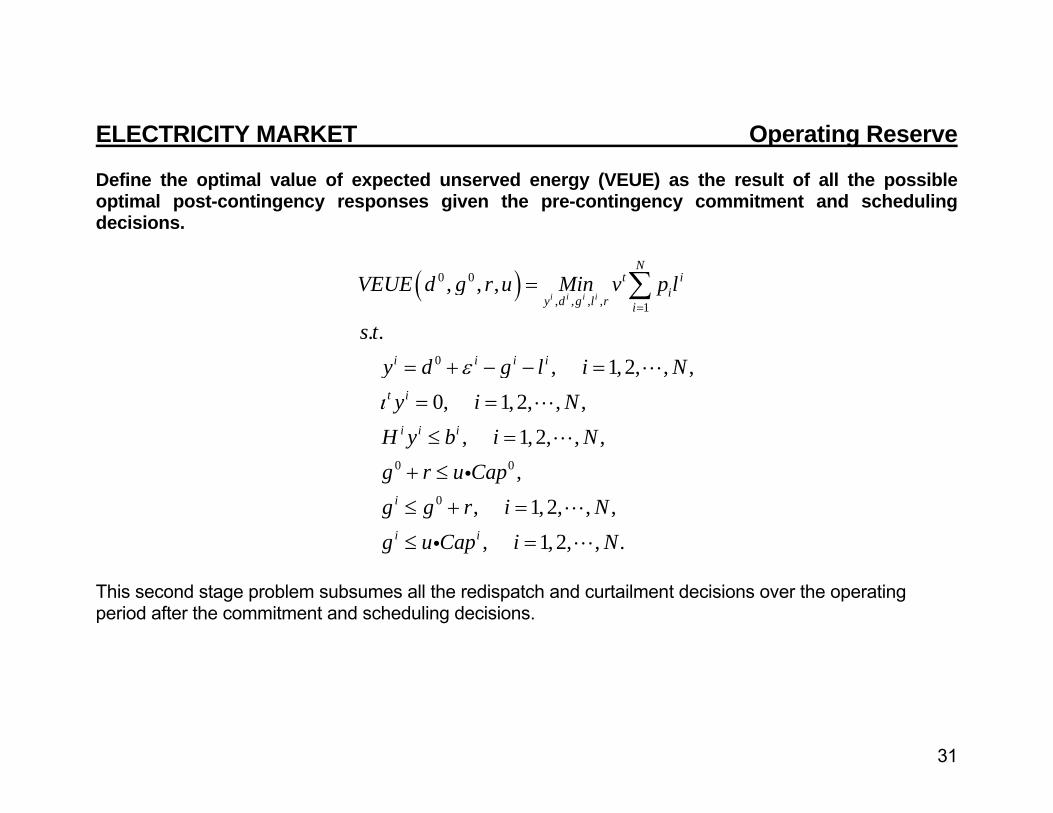
ELECTRICITY MARKET Operating Reserve Define the optimal value of expected unserved energy (VEUE) as the result of all the possible optimal post-contingency responses given the pre-contingency commitment and scheduling decisions.
( )0 0
, , , , 1
0
0 0
0
, , ,
. ., 1, 2, , ,
0, 1, 2, , ,, 1, 2, , ,
,, 1, 2, , ,, 1, 2, , .
i i i i
Nt i
iy d g l r i
i i i i
t i
i i i
i
i i
VEUE d g r u Min v p l
s ty d g l i Ny i N
H y b i Ng r u Capg g r i Ng u Cap i N
ε
ι
=
=
= + − − =
= =
≤ =
+ ≤
≤ + =
≤ =
∑
i
i
This second stage problem subsumes all the redispatch and curtailment decisions over the operating period after the commitment and scheduling decisions.
32
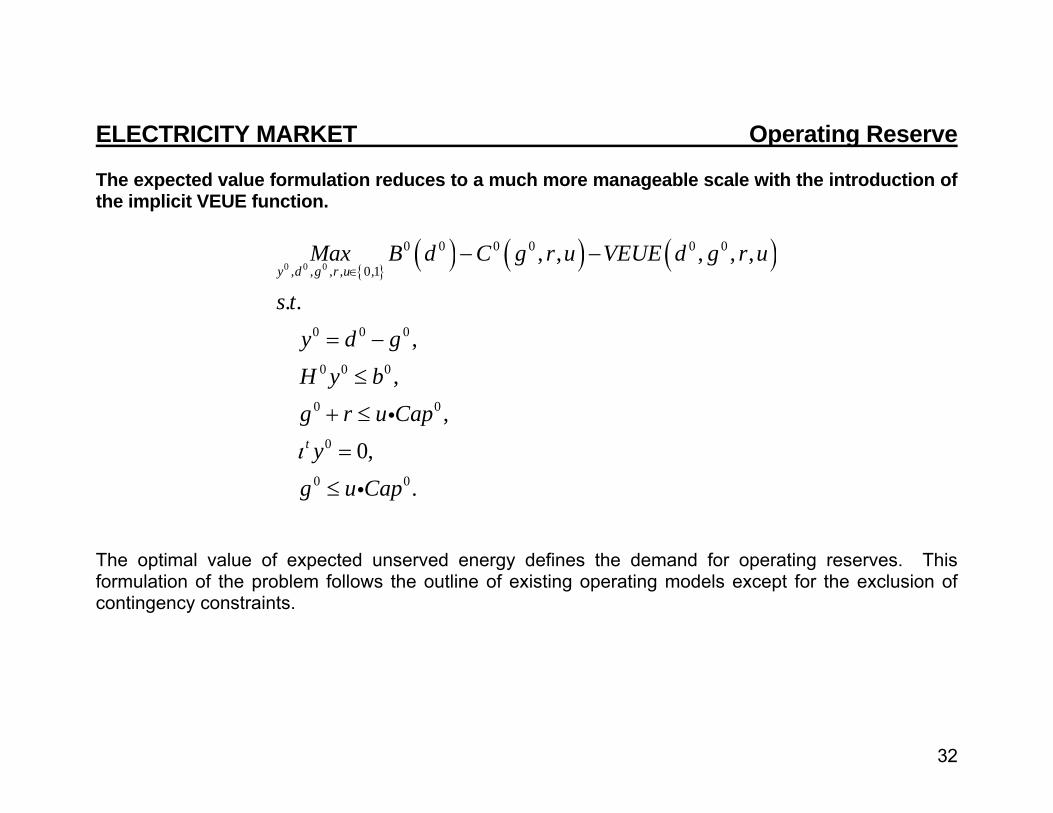
ELECTRICITY MARKET Operating Reserve The expected value formulation reduces to a much more manageable scale with the introduction of the implicit VEUE function.
{ }( ) ( ) ( )0 0 0
0 0 0 0 0 0
, , , , 0,1
0 0 0
0 0 0
0 0
0
0 0
, , , , ,
. .,
,,
0,.
y d g r u
t
Max B d C g r u VEUE d g r u
s ty d gH y bg r u Cap
yg u Capι
∈− −
= −
≤
+ ≤
=
≤
i
i
The optimal value of expected unserved energy defines the demand for operating reserves. This formulation of the problem follows the outline of existing operating models except for the exclusion of contingency constraints.
33
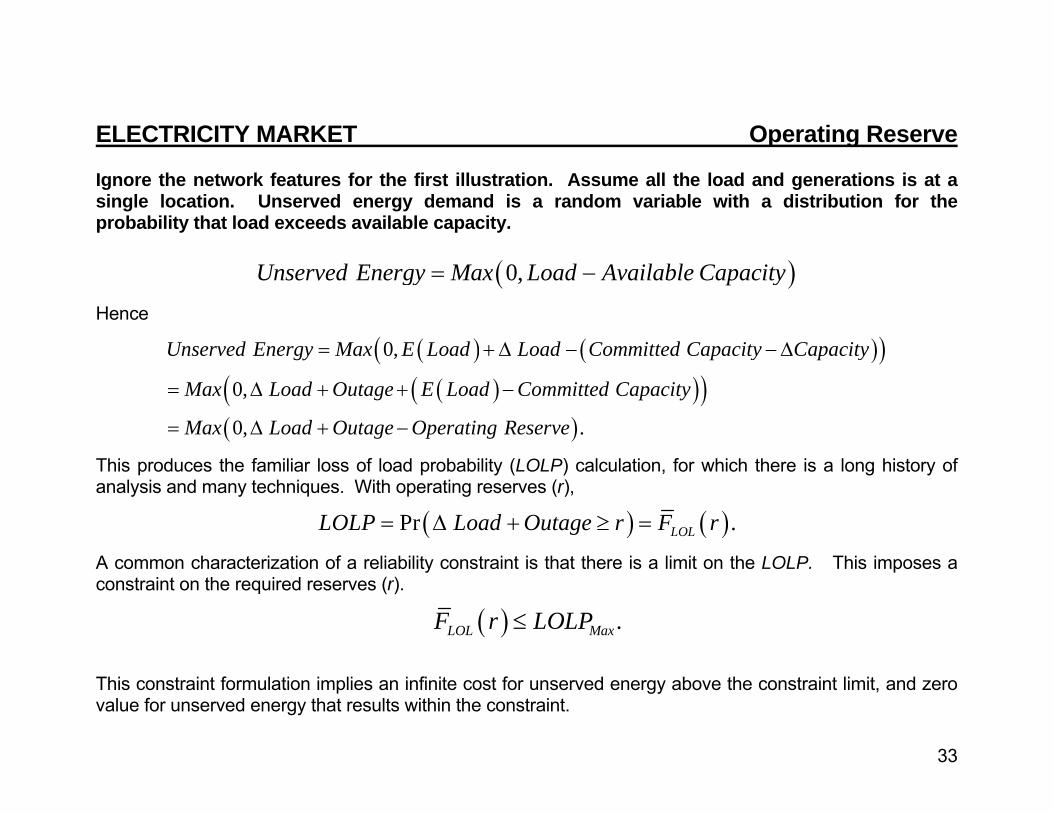
ELECTRICITY MARKET Operating Reserve Ignore the network features for the first illustration. Assume all the load and generations is at a single location. Unserved energy demand is a random variable with a distribution for the probability that load exceeds available capacity.
( )0,Unserved Energy Max Load Available Capacity= −
Hence
( ) ( )( )( )( )( )
( )
0,
0,
0, .
Unserved Energy Max E Load Load Committed Capacity Capacity
Max Load Outage E Load Committed Capacity
Max Load Outage Operating Reserve
= + Δ − −Δ
= Δ + + −
= Δ + −
This produces the familiar loss of load probability (LOLP) calculation, for which there is a long history of analysis and many techniques. With operating reserves (r),
( ) ( )Pr .LOLLOLP Load Outage r F r= Δ + ≥ =
A common characterization of a reliability constraint is that there is a limit on the LOLP. This imposes a constraint on the required reserves (r).
( ) .LOL MaxF r LOLP≤
This constraint formulation implies an infinite cost for unserved energy above the constraint limit, and zero value for unserved energy that results within the constraint.
34
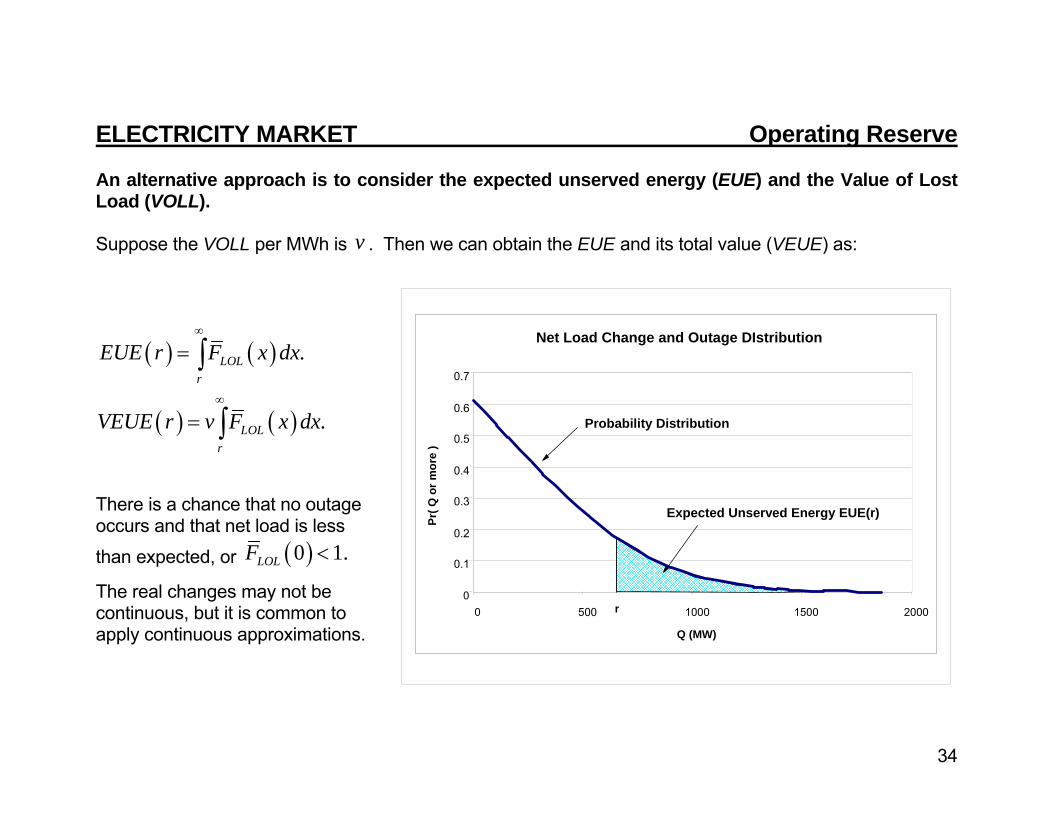
ELECTRICITY MARKET Operating Reserve An alternative approach is to consider the expected unserved energy (EUE) and the Value of Lost Load (VOLL). Suppose the VOLL per MWh is v . Then we can obtain the EUE and its total value (VEUE) as:
( ) ( )
( ) ( )
.
.
LOLr
LOLr
EUE r F x dx
VEUE r v F x dx
∞
∞
=
=
∫
∫
There is a chance that no outage occurs and that net load is less
than expected, or ( )0 1.LOLF <
The real changes may not be continuous, but it is common to apply continuous approximations.
Net Load Change and Outage DIstribution
0
0.1
0.2
0.3
0.4
0.5
0.6
0.7
0 500 1000 1500 2000
Q (MW)
Pr( Q
or m
ore
)
r
Expected Unserved Energy EUE(r)
Probability Distribution
35
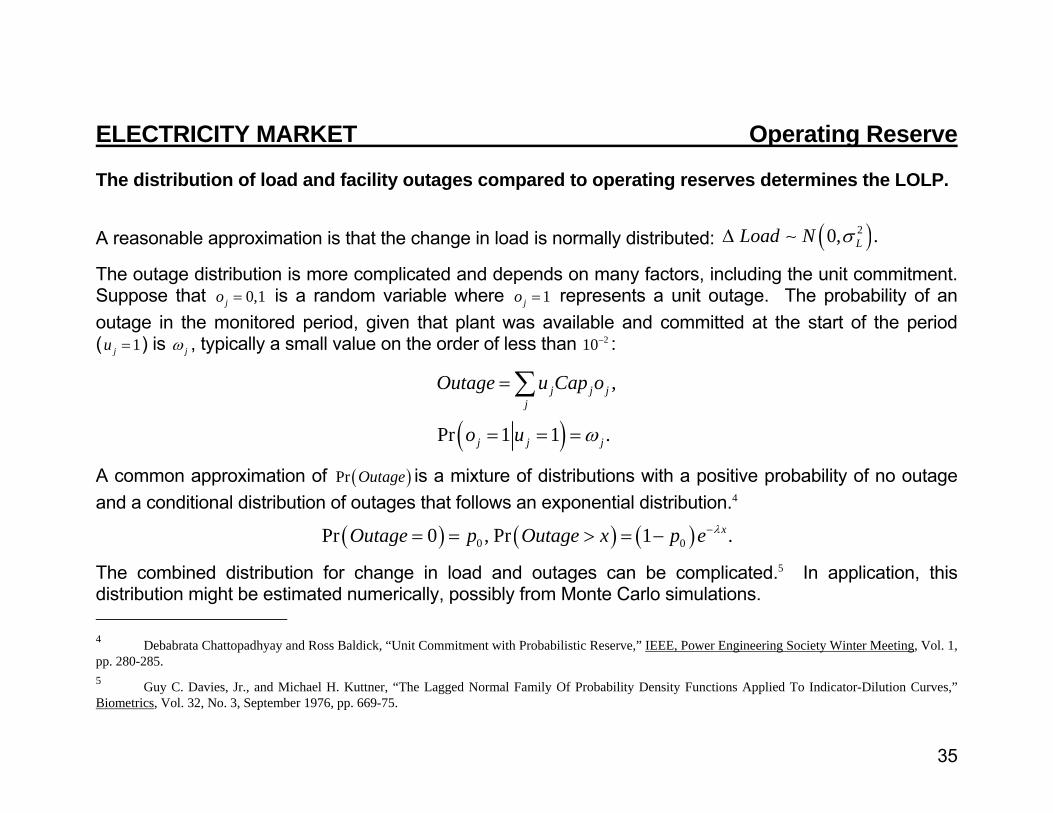
ELECTRICITY MARKET Operating Reserve The distribution of load and facility outages compared to operating reserves determines the LOLP.
A reasonable approximation is that the change in load is normally distributed: ( )20, .LLoad N σΔ ∼
The outage distribution is more complicated and depends on many factors, including the unit commitment. Suppose that 0,1jo = is a random variable where 1jo = represents a unit outage. The probability of an outage in the monitored period, given that plant was available and committed at the start of the period ( 1ju = ) is jω , typically a small value on the order of less than 210− :
( )
,
Pr 1 1 .
j j jj
j j j
Outage u Cap o
o u ω
=
= = =
∑
A common approximation of ( )Pr Outage is a mixture of distributions with a positive probability of no outage and a conditional distribution of outages that follows an exponential distribution.4
( ) ( ) ( )0 0Pr 0 , Pr 1 .xOutage p Outage x p e λ−= = > = −
The combined distribution for change in load and outages can be complicated.5 In application, this distribution might be estimated numerically, possibly from Monte Carlo simulations. 4 Debabrata Chattopadhyay and Ross Baldick, “Unit Commitment with Probabilistic Reserve,” IEEE, Power Engineering Society Winter Meeting, Vol. 1, pp. 280-285. 5 Guy C. Davies, Jr., and Michael H. Kuttner, “The Lagged Normal Family Of Probability Density Functions Applied To Indicator-Dilution Curves,” Biometrics, Vol. 32, No. 3, September 1976, pp. 669-75.
36
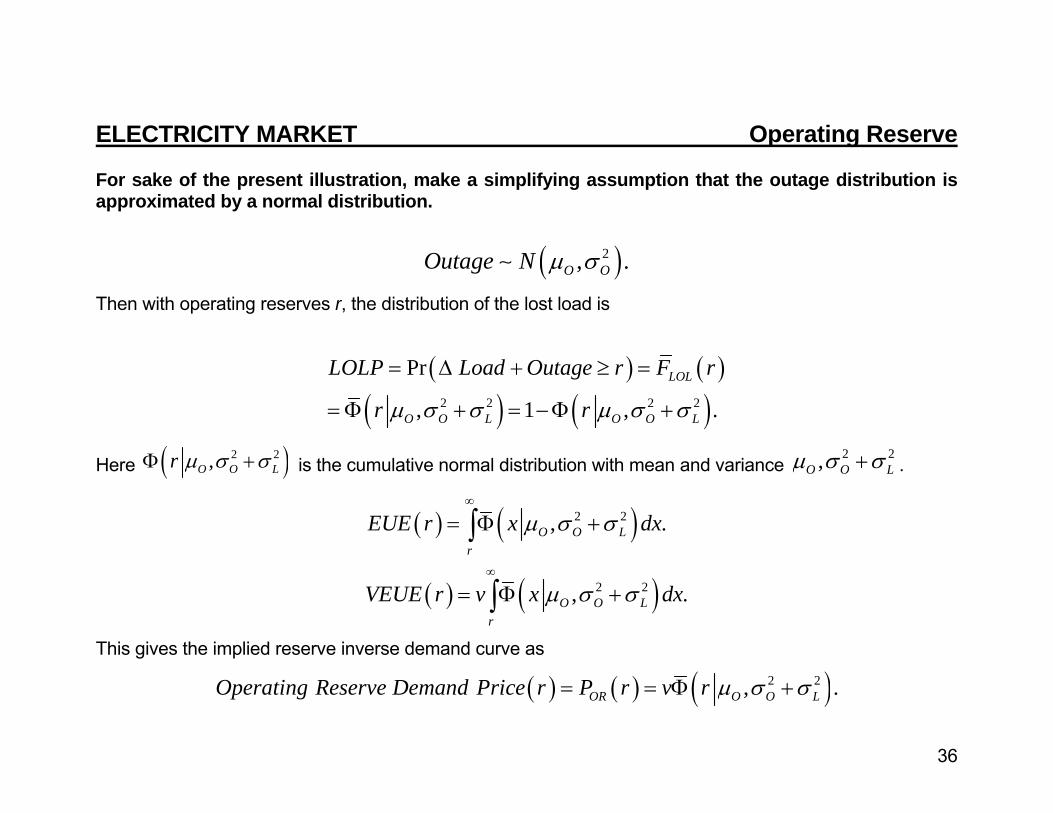
ELECTRICITY MARKET Operating Reserve For sake of the present illustration, make a simplifying assumption that the outage distribution is approximated by a normal distribution.
( )2, .O OOutage N μ σ∼
Then with operating reserves r, the distribution of the lost load is
( ) ( )( ) ( )2 2 2 2
Pr
, 1 , .LOL
O O L O O L
LOLP Load Outage r F r
r rμ σ σ μ σ σ
= Δ + ≥ =
= Φ + = −Φ +
Here ( )2 2,O O Lr μ σ σΦ + is the cumulative normal distribution with mean and variance 2 2,O O Lμ σ σ+ .
( ) ( )
( ) ( )
2 2
2 2
, .
, .
O O Lr
O O Lr
EUE r x dx
VEUE r v x dx
μ σ σ
μ σ σ
∞
∞
= Φ +
= Φ +
∫
∫
This gives the implied reserve inverse demand curve as
( ) ( ) ( )2 2, .OR O O LOperating Reserve Demand Price r P r v r μ σ σ= = Φ +
37
Operating Reserve Demand
0
1,000
2,000
3,000
4,000
5,000
6,000
7,000
0.00% 1.00% 2.00% 3.00% 4.00% 5.00% 6.00%
Q (% of load)
P ($
/MW
h)Marginal VEUE
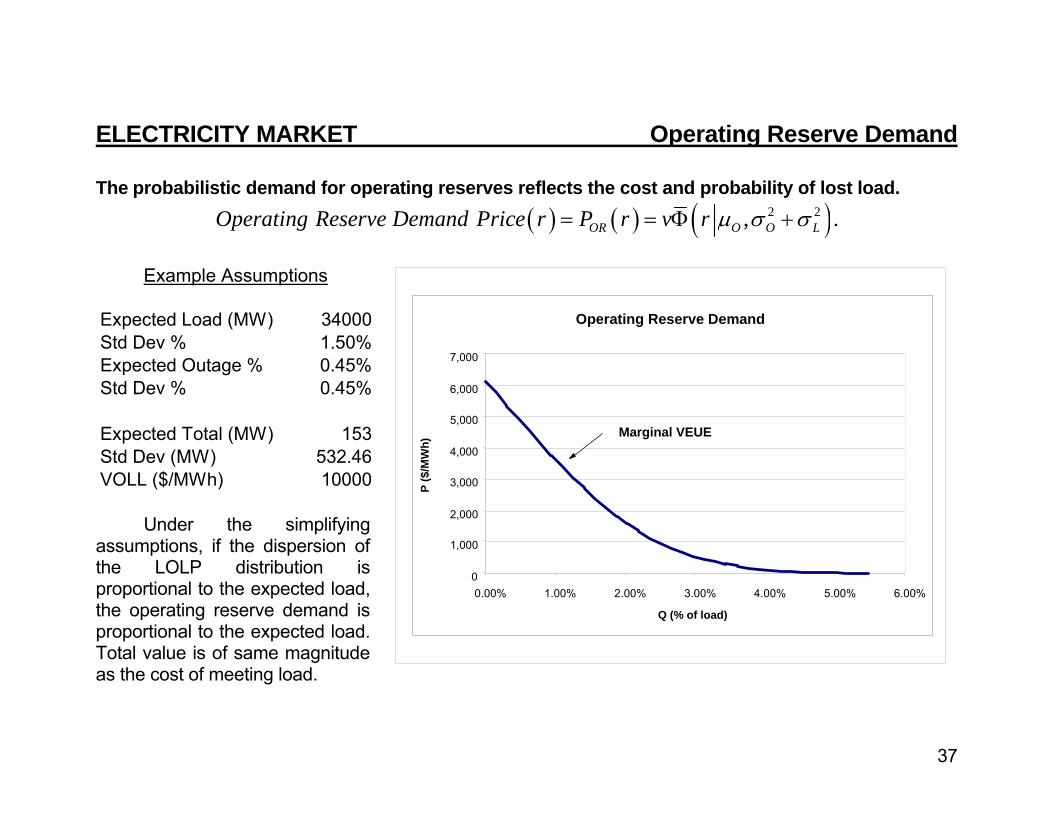
ELECTRICITY MARKET Operating Reserve Demand The probabilistic demand for operating reserves reflects the cost and probability of lost load.
( ) ( ) ( )2 2, .OR O O LOperating Reserve Demand Price r P r v r μ σ σ= = Φ +
Example Assumptions Expected Load (MW) 34000Std Dev % 1.50%Expected Outage % 0.45%Std Dev % 0.45%
Expected Total (MW) 153Std Dev (MW) 532.46VOLL ($/MWh) 10000
Under the simplifying assumptions, if the dispersion of the LOLP distribution is proportional to the expected load, the operating reserve demand is proportional to the expected load. Total value is of same magnitude as the cost of meeting load.
38
Operating Reserve Demand
0
2,000
4,000
6,000
8,000
10,000
12,000
0 500 1000 1500 2000 2500
Q (MW)
P ($
/MW
h)Security Minimum
Marginal VEUE
Demand=Minimum + Marginal VEUE
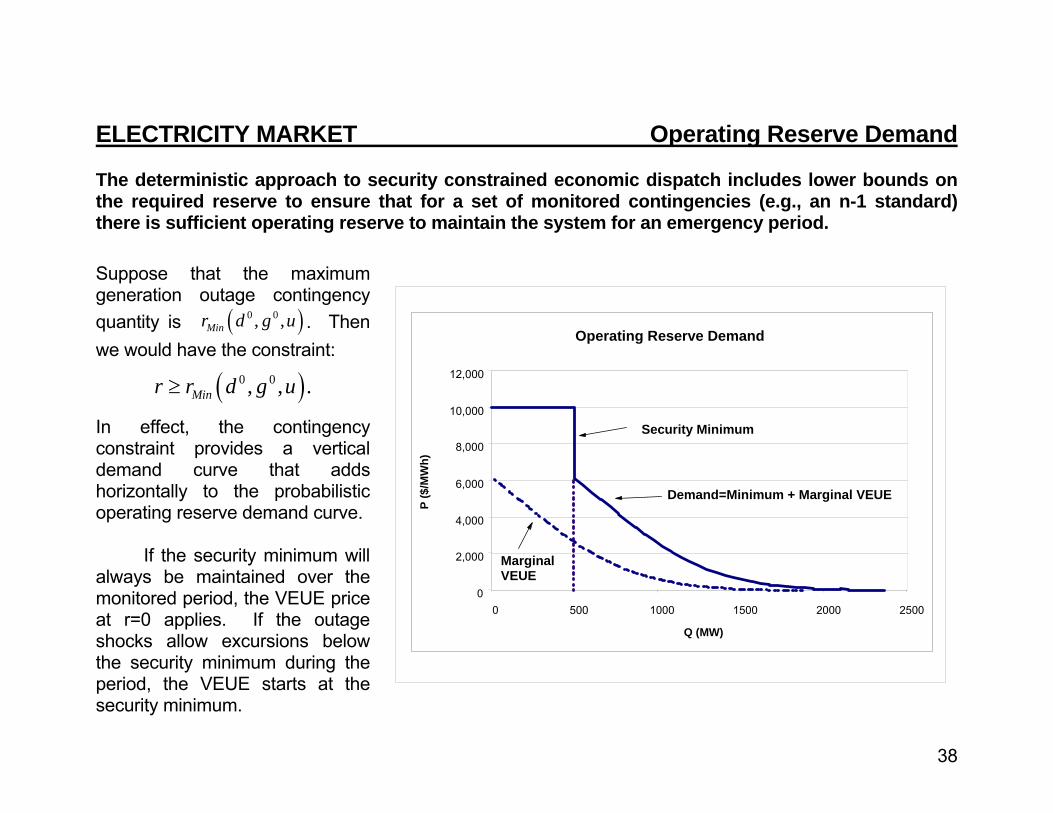
ELECTRICITY MARKET Operating Reserve Demand The deterministic approach to security constrained economic dispatch includes lower bounds on the required reserve to ensure that for a set of monitored contingencies (e.g., an n-1 standard) there is sufficient operating reserve to maintain the system for an emergency period. Suppose that the maximum generation outage contingency quantity is ( )0 0, ,Minr d g u . Then we would have the constraint:
( )0 0, , .Minr r d g u≥
In effect, the contingency constraint provides a vertical demand curve that adds horizontally to the probabilistic operating reserve demand curve.
If the security minimum will always be maintained over the monitored period, the VEUE price at r=0 applies. If the outage shocks allow excursions below the security minimum during the period, the VEUE starts at the security minimum.
39
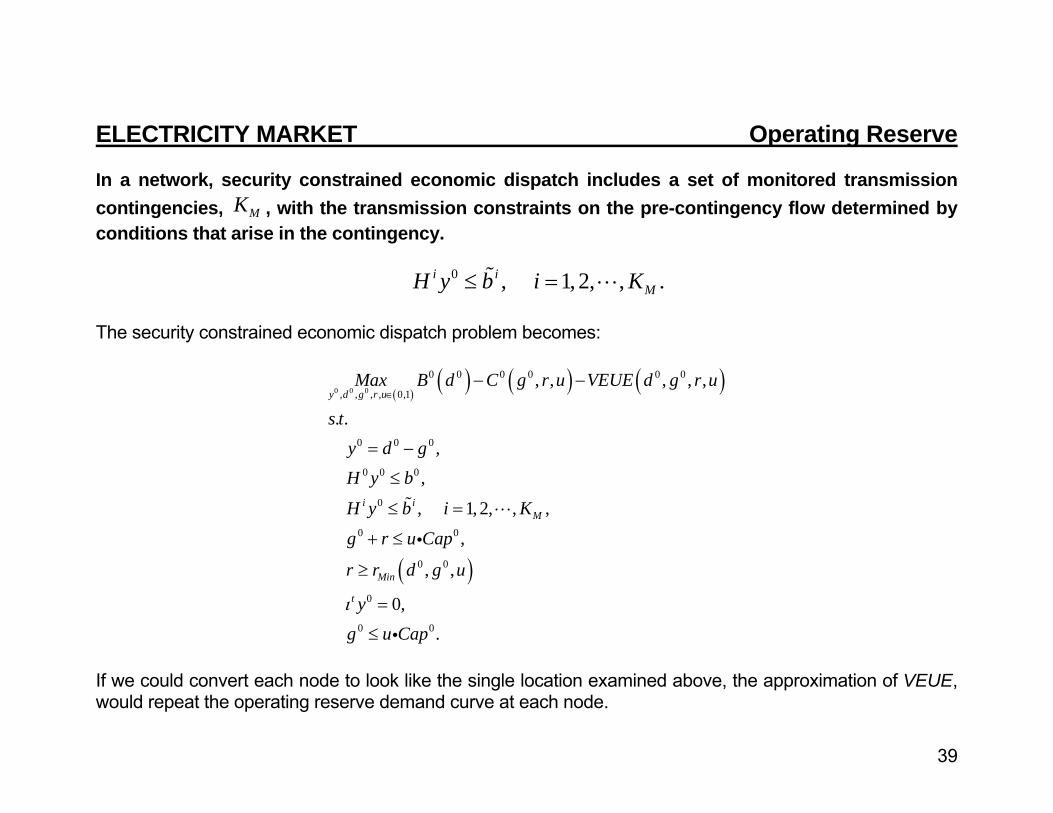
ELECTRICITY MARKET Operating Reserve In a network, security constrained economic dispatch includes a set of monitored transmission contingencies, MK , with the transmission constraints on the pre-contingency flow determined by conditions that arise in the contingency.
0 , 1, 2, , .i iMH y b i K≤ =
The security constrained economic dispatch problem becomes:
( )( ) ( ) ( )
( )
0 0 0
0 0 0 0 0 0
, , , , 0,1
0 0 0
0 0 0
0
0 0
0 0
0
0 0
, , , , ,
. .,
,
, 1, 2, , ,
,
, ,
0,.
y d g r u
i iM
Min
t
Max B d C g r u VEUE d g r u
s ty d gH y b
H y b i K
g r u Cap
r r d g u
yg u Capι
∈− −
= −
≤
≤ =
+ ≤
≥
=
≤
i
i
If we could convert each node to look like the single location examined above, the approximation of VEUE, would repeat the operating reserve demand curve at each node.
40
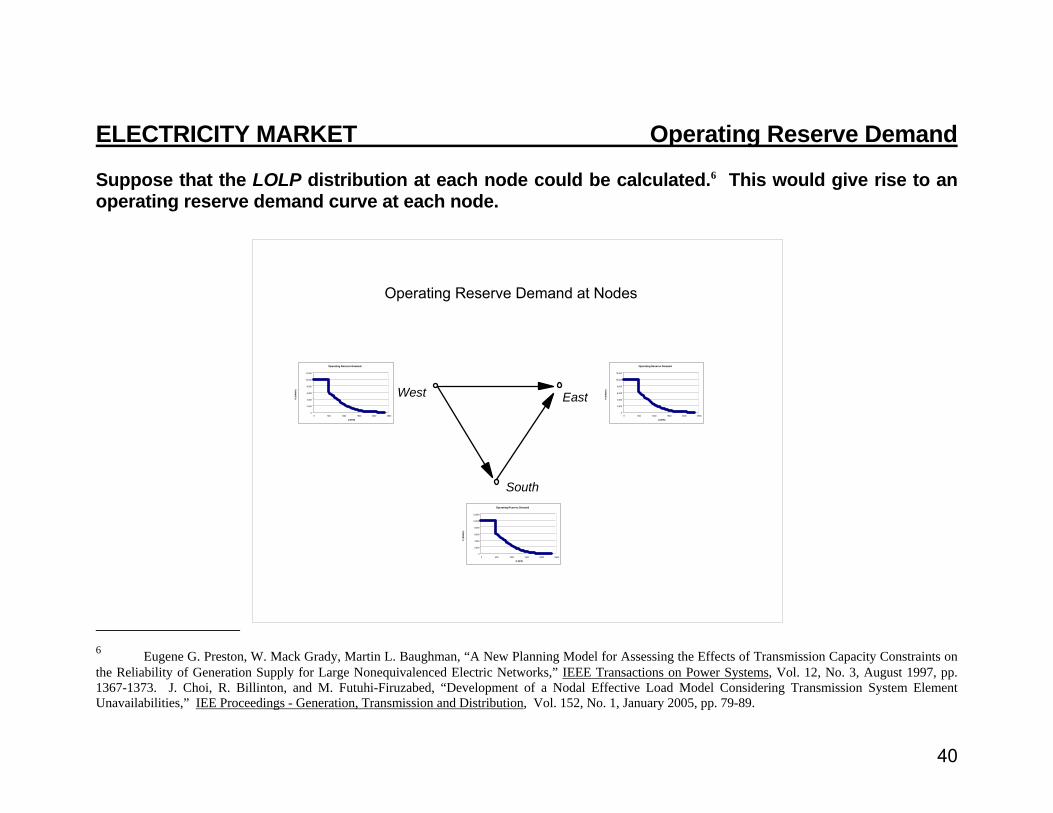
ELECTRICITY MARKET Operating Reserve Demand Suppose that the LOLP distribution at each node could be calculated.6 This would give rise to an operating reserve demand curve at each node.
6 Eugene G. Preston, W. Mack Grady, Martin L. Baughman, “A New Planning Model for Assessing the Effects of Transmission Capacity Constraints on the Reliability of Generation Supply for Large Nonequivalenced Electric Networks,” IEEE Transactions on Power Systems, Vol. 12, No. 3, August 1997, pp. 1367-1373. J. Choi, R. Billinton, and M. Futuhi-Firuzabed, “Development of a Nodal Effective Load Model Considering Transmission System Element Unavailabilities,” IEE Proceedings - Generation, Transmission and Distribution, Vol. 152, No. 1, January 2005, pp. 79-89.
West
South
East
Operating Reserve Demand at Nodes
Operating Reserve Demand
0
2,000
4,000
6,000
8,000
10,000
12,000
0 500 1000 1500 2000 2500
Q (MW)
P ($
/MW
h)
Operating Reserve Demand
0
2,000
4,000
6,000
8,000
10,000
12,000
0 500 1000 1500 2000 2500
Q (MW)
P ($
/MW
h)
Operating Reserve Demand
0
2,000
4,000
6,000
8,000
10,000
12,000
0 500 1000 1500 2000 2500
Q (MW)
P ($
/MW
h)
41
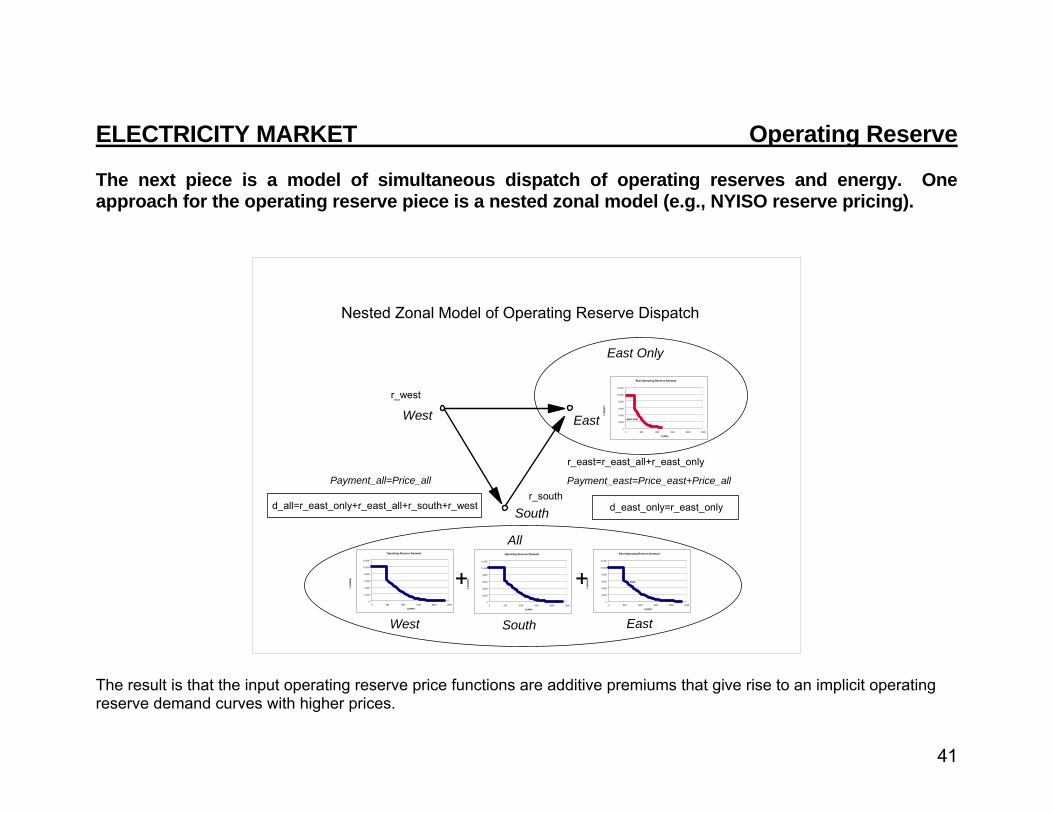
ELECTRICITY MARKET Operating Reserve The next piece is a model of simultaneous dispatch of operating reserves and energy. One approach for the operating reserve piece is a nested zonal model (e.g., NYISO reserve pricing).
West
South
East
Nested Zonal Model of Operating Reserve Dispatch
Operating Reserve Demand
0
2,000
4,000
6,000
8,000
10,000
12,000
0 500 1000 1500 2000 2500
Q (MW)
P ($
/MW
h)
Operating Reserve Demand
0
2,000
4,000
6,000
8,000
10,000
12,000
0 500 1000 1500 2000 2500
Q (MW)
P ($
/MW
h)
East Operating Reserve Demand
0
2,000
4,000
6,000
8,000
10,000
12,000
0 500 1000 1500 2000 2500
Q (MW)
P ($
/MW
h)
Total
East Only
All
++
West South East
r_west
r_southd_east_only=r_east_only
r_east=r_east_all+r_east_only
d_all=r_east_only+r_east_all+r_south+r_west
East Operating Reserve Demand
0
2,000
4,000
6,000
8,000
10,000
12,000
0 500 1000 1500 2000 2500
Q (MW)
P ($
/MW
h)
East Only
Payment_east=Price_east+Price_allPayment_all=Price_all
The result is that the input operating reserve price functions are additive premiums that give rise to an implicit operating reserve demand curves with higher prices.
42
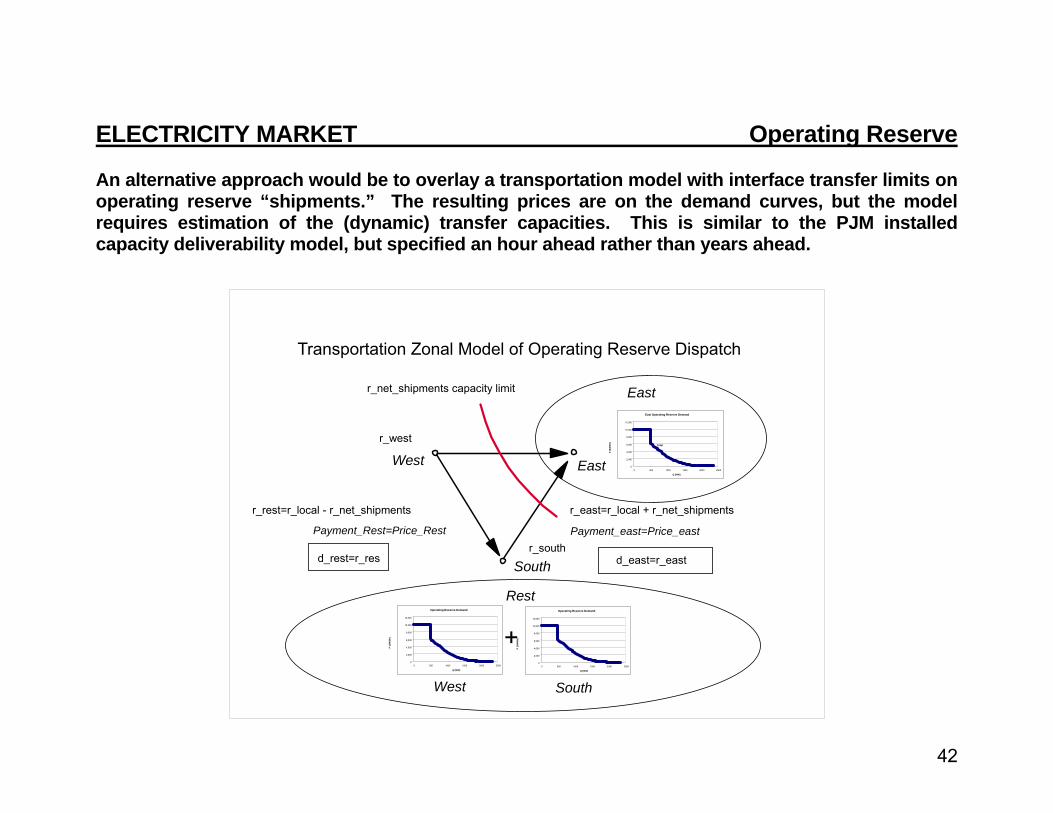
ELECTRICITY MARKET Operating Reserve An alternative approach would be to overlay a transportation model with interface transfer limits on operating reserve “shipments.” The resulting prices are on the demand curves, but the model requires estimation of the (dynamic) transfer capacities. This is similar to the PJM installed capacity deliverability model, but specified an hour ahead rather than years ahead.
West
South
East
Transportation Zonal Model of Operating Reserve Dispatch
Operating Reserve Demand
0
2,000
4,000
6,000
8,000
10,000
12,000
0 500 1000 1500 2000 2500
Q (MW)
P ($
/MW
h)
Operating Reserve Demand
0
2,000
4,000
6,000
8,000
10,000
12,000
0 500 1000 1500 2000 2500
Q (MW)
P ($
/MW
h)
East Operating Reserve Demand
0
2,000
4,000
6,000
8,000
10,000
12,000
0 500 1000 1500 2000 2500
Q (MW)
P ($
/MW
h)
Total
East
Rest
+
West South
r_west
r_southd_east=r_east
r_east=r_local + r_net_shipments
d_rest=r_res
Payment_east=Price_eastPayment_Rest=Price_Rest
r_net_shipments capacity limit
r_rest=r_local - r_net_shipments
43
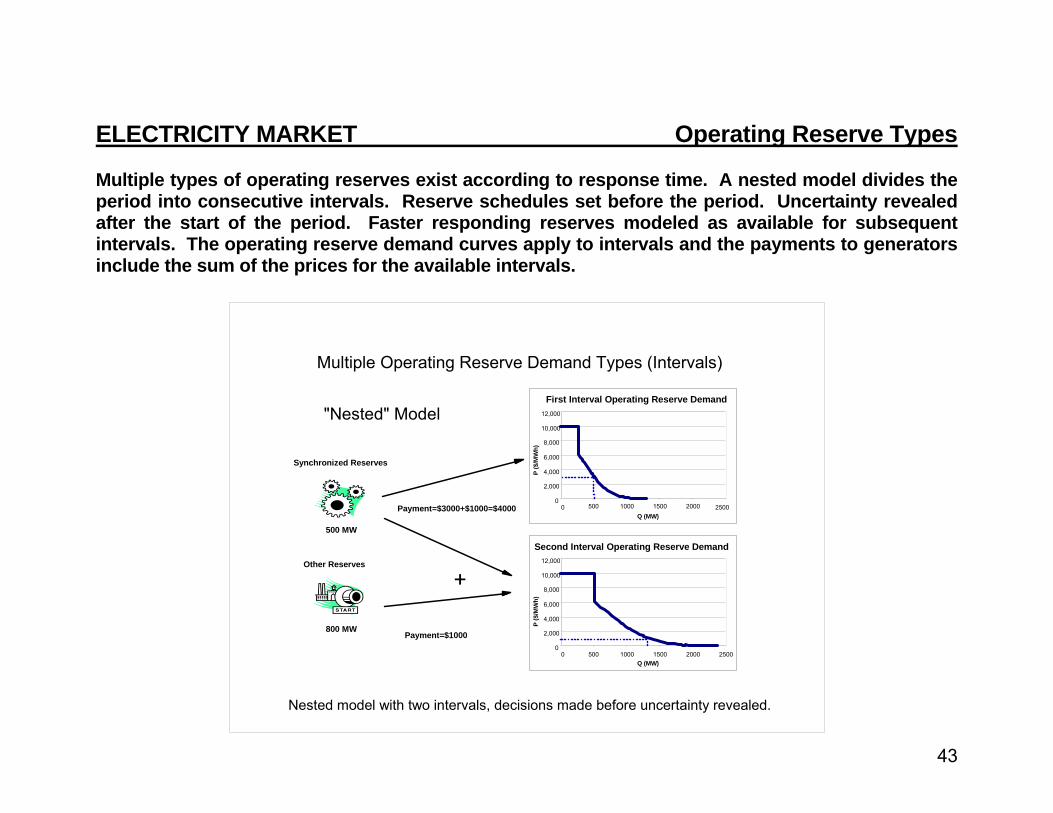
ELECTRICITY MARKET Operating Reserve Types Multiple types of operating reserves exist according to response time. A nested model divides the period into consecutive intervals. Reserve schedules set before the period. Uncertainty revealed after the start of the period. Faster responding reserves modeled as available for subsequent intervals. The operating reserve demand curves apply to intervals and the payments to generators include the sum of the prices for the available intervals.
Multiple Operating Reserve Demand Types (Intervals)
Synchronized Reserves
Other Reserves
+
Payment=$3000+$1000=$4000
800 MW
First Interval Operating Reserve Demand
0
2,000
4,000
6,000
8,000
10,000
12,000
0 500 1000 1500 2000 2500Q (MW)
P ($
/MW
h)
Second Interval Operating Reserve Demand
0
2,000
4,000
6,000
8,000
10,000
12,000
0 500 1000 1500 2000 2500Q (MW)
P ($
/MW
h)
Payment=$1000
"Nested" Model
500 MW
Nested model with two intervals, decisions made before uncertainty revealed.
44
ELECTRICITY MARKET Operating Reserve Compared to a perfect model, there are many simplifying assumptions needed to specify and operating reserve demand curve. Compared to what is done in current market designs, using the operating reserve demand framework for consistent dispatch-based pricing should be an improvement. The sketch of the operating reserve demand curve(s) in a network could be extended. • Empirical Estimation. Use existing LOLP models or LOLP extensions with networks to estimate
approximate LOLP distributions at nodes.
• Multiple Periods. Incorporate multiple periods of commitment and response time. Handled through the usual supply limits on ramping.
• Operating Rules. Incorporate up and down ramp rates, deratings, emergency procedures, etc.
• Pricing incidence. Charging participants for impact on operating reserve costs, with any balance included in uplift.
• Minimum Uplift Pricing. Dispatch-based pricing that resolves inconsistencies by minimizing the total value of the price discrepancies.
• …
45
ELECTRICITY MARKET Appendix
Supplemental material • Transmission Deliverability.
46
ELECTRICITY MARKET Transmission Capacity Planning standards call for generation capacity deliverability. This reliability venue raises again the problematic determination of the total transfer capability (TTC) of the transmission system.
“The Transfer Capability between two areas is typically assessed or determined by modeling a generation excess in the “from” area at a specific source point(s) and a generation deficiency in the “to” area at a specific sink point(s). The increased source level at which the loading on a transmission element is at its normal rating (with no contingencies) or its emergency rating (with an outage of a generation unit or a transmission element) is be defined as the incremental Transfer Capability. Selection of the specific source and sink points will impact the calculated ‘power transfer distribution factors’ and various transmission facility loadings to determine the AFC/ATC values and to determine the anticipated impact of a Transmission Service Request on specific Flowgates. Therefore, the posted AFC/ATC, as well as the evaluation of a transmission service request, is greatly influenced by the selection of these points. Transmission service sold based on a set of source/sink points that do not correspond to the generation that moves for the schedule results in inaccurate ATC values.”
(NERC, “Long-Term AFC/ATC Task Force Final Report,” Revised April 14, 2005, Appendix B, p. 1) Many applications of the interface TTC in multi-zone reliability calculations are treated as transportation models in the contract path mode. In other words, the loop effects are ignored and the power transfer distribution factors are dropped. The subsequent reliability simulations compute “capacity” dispatch and flows for loss of load calculations as though the contact path model applied. (For example, see New York State Reliability Council, “New York Control Area Installed Capacity Requirements For The Period May 2005
Through April 2006,” L.L.C. Executive Committee Resolution And Technical Study Report, December 10, 2004, p. 32.)
47
Minimum Capacity Required in C iWithout Violating Reliability Criterion of 0.1 per year
O
2200 MW Import Capability into Connecticut
Pool Benefit
CTL is the difference bRegional ICAP and LICAP requirement
8500
6300
7900
Isolated Capacity R i
Regional ICAP R i
Minimum Locational ICAP R i
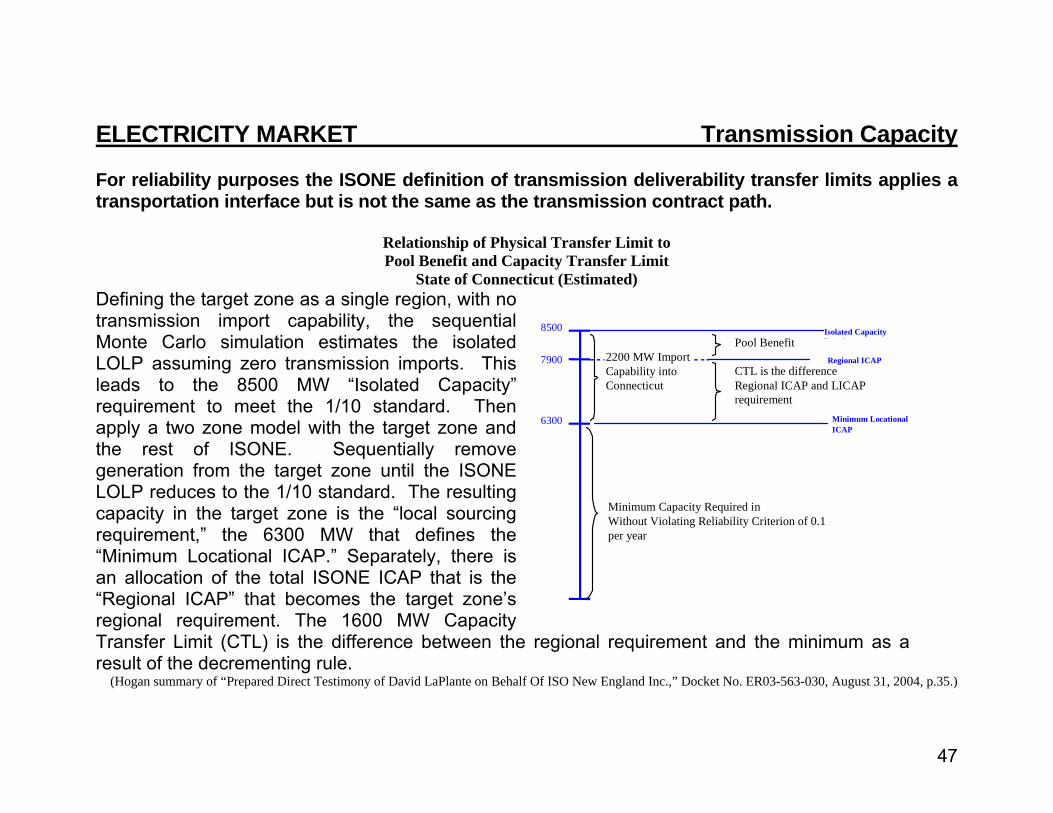
ELECTRICITY MARKET Transmission Capacity For reliability purposes the ISONE definition of transmission deliverability transfer limits applies a transportation interface but is not the same as the transmission contract path.
Relationship of Physical Transfer Limit to Pool Benefit and Capacity Transfer Limit
State of Connecticut (Estimated) Defining the target zone as a single region, with no transmission import capability, the sequential Monte Carlo simulation estimates the isolated LOLP assuming zero transmission imports. This leads to the 8500 MW “Isolated Capacity” requirement to meet the 1/10 standard. Then apply a two zone model with the target zone and the rest of ISONE. Sequentially remove generation from the target zone until the ISONE LOLP reduces to the 1/10 standard. The resulting capacity in the target zone is the “local sourcing requirement,” the 6300 MW that defines the “Minimum Locational ICAP.” Separately, there is an allocation of the total ISONE ICAP that is the “Regional ICAP” that becomes the target zone’s regional requirement. The 1600 MW Capacity Transfer Limit (CTL) is the difference between the regional requirement and the minimum as a result of the decrementing rule.
(Hogan summary of “Prepared Direct Testimony of David LaPlante on Behalf Of ISO New England Inc.,” Docket No. ER03-563-030, August 31, 2004, p.35.)
48
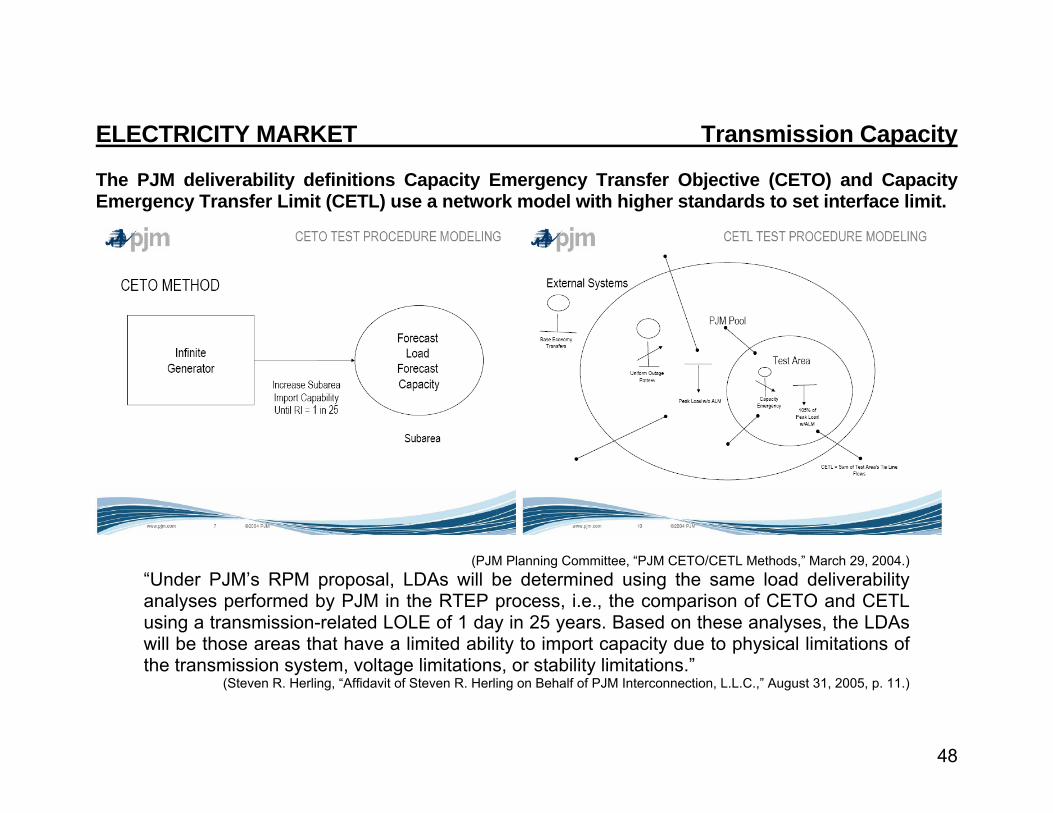
ELECTRICITY MARKET Transmission Capacity The PJM deliverability definitions Capacity Emergency Transfer Objective (CETO) and Capacity Emergency Transfer Limit (CETL) use a network model with higher standards to set interface limit.
(PJM Planning Committee, “PJM CETO/CETL Methods,” March 29, 2004.)
“Under PJM’s RPM proposal, LDAs will be determined using the same load deliverability analyses performed by PJM in the RTEP process, i.e., the comparison of CETO and CETL using a transmission-related LOLE of 1 day in 25 years. Based on these analyses, the LDAs will be those areas that have a limited ability to import capacity due to physical limitations of the transmission system, voltage limitations, or stability limitations.”
(Steven R. Herling, “Affidavit of Steven R. Herling on Behalf of PJM Interconnection, L.L.C.,” August 31, 2005, p. 11.)
49
ELECTRICITY MARKET Planning Standards The differences between ISONE and PJM deliverability definitions reflect an underlying problem in establishing long term planning standards. Comparison with the challenge of long term transmission rights illustrates the difficulty.
“Selection of the specific source and sink points will impact the calculated ‘power transfer distribution factors’ and various transmission facility loadings to determine the AFC/ATC values and to determine the anticipated impact of a Transmission Service Request on specific Flowgates. Therefore, the posted AFC/ATC, as well as the evaluation of a transmission service request, is greatly influenced by the selection of these points. Transmission service sold based on a set of source/sink points that do not correspond to the generation that moves for the schedule results in inaccurate ATC values.”
(NERC, “Long-Term AFC/ATC Task Force Final Report,” Revised April 14, 2005, Appendix B, p. 1) Since “deliverability” depends very much on how the system would be used, reliability planning standards make conservative assumptions to allow simplified calculations like the two zone transportation models with a single interface. This problem is difficult. If we need long term planning standards, there may be no other workable approach.
50
ELECTRICITY MARKET Operating Reserve Requirements Operating reserve standards typically specify inflexible requirements, often tied to the largest contingency. The PJM case is illustrative.
“5) a) The Mid-Atlantic Spinning Reserve Zone Requirement is defined as that amount of 10- minute reserve that must be synchronized to the grid. Mid-Atlantic Area Council (MAAC) standards currently set that amount at 75% of the largest contingency in that Spinning Reserve Zone provided that double the remaining 25% is available as non-synchronized 10- minute reserves. b) The Western Spinning Reserve Zone Requirement is defined as 1.5% of the peak load forecast of the Western Spinning Reserve Market Area for that day. c) The Northern Illinois Spinning Reserve Zone Requirement is defined as 50% of ComEd’s load ratio share of the largest system contingency within MAIN. d) The Southern Spinning Reserve Zone Requirement is defined as the Dominion load ratio share of the largest system contingency within VACAR, minus the available 15 minute quick start capability within the Southern Spinning Reserve Zone.”
(PJM, “Synchronized Reserve Market Business Rules,” Revised July 14, 2005, p. 2, http://www.pjm.com/committees/members/downloads/20050714-item3b-synchronized-reserve-mrkt-bus-rules.pdf )
51
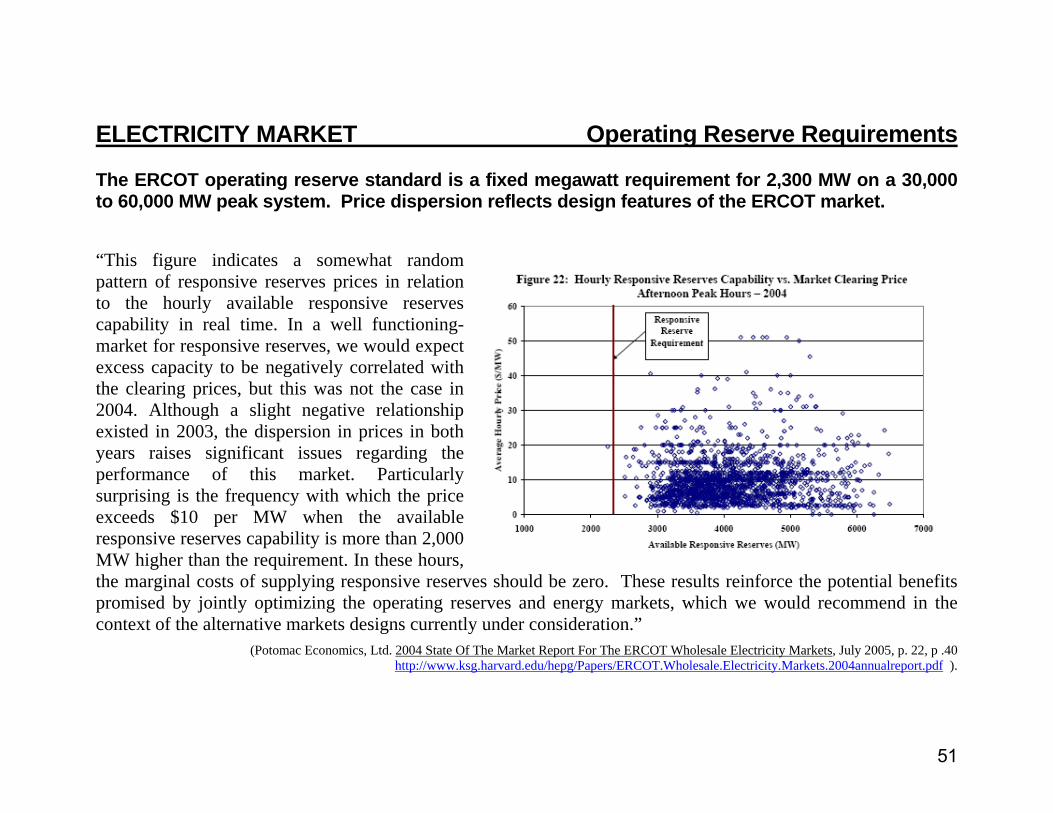
ELECTRICITY MARKET Operating Reserve Requirements The ERCOT operating reserve standard is a fixed megawatt requirement for 2,300 MW on a 30,000 to 60,000 MW peak system. Price dispersion reflects design features of the ERCOT market. “This figure indicates a somewhat random pattern of responsive reserves prices in relation to the hourly available responsive reserves capability in real time. In a well functioning-market for responsive reserves, we would expect excess capacity to be negatively correlated with the clearing prices, but this was not the case in 2004. Although a slight negative relationship existed in 2003, the dispersion in prices in both years raises significant issues regarding the performance of this market. Particularly surprising is the frequency with which the price exceeds $10 per MW when the available responsive reserves capability is more than 2,000 MW higher than the requirement. In these hours, the marginal costs of supplying responsive reserves should be zero. These results reinforce the potential benefits promised by jointly optimizing the operating reserves and energy markets, which we would recommend in the context of the alternative markets designs currently under consideration.”
(Potomac Economics, Ltd. 2004 State Of The Market Report For The ERCOT Wholesale Electricity Markets, July 2005, p. 22, p .40 http://www.ksg.harvard.edu/hepg/Papers/ERCOT.Wholesale.Electricity.Markets.2004annualreport.pdf ).
52
ELECTRICITY MARKET Generation Resource Adequacy The call for intervention to assure generation investment commitments interacts with the mandatory investments in transmission under the central plan. “ … recent generation retirements have highlighted a fundamental problem with the long-term planning of the transmission system. The load deliverability analysis performed in the RTEP process requires as input the generation resources that will be available to support delivery of imported energy to load. Uncertainty in the generation resource availability for future years creates a significant amount of uncertainty in the future regional transmission plan. Since reliability is a fundamental requirement, this planning uncertainty cannot be sustained. To correct this problem, the PJM region needs to return to a longer-term forward capacity obligation to commit generation for future years. A four-year forward commitment period is needed for generation capacity obligations to ensure that the five-year PJM RTEP has adequate forward information on generation conditions, so that proper planning and coordination of transmission upgrades can be assured.” (Andrew L. Ott, “Affidavit of Andrew l. Ott on Behalf Of PJM Interconnection, L.L.C.,” PJM RPM Proposal, August 31, 2005, p. 12.)

53
William W. Hogan is the Raymond Plank Professor of Global Energy Policy, John F. Kennedy School of Government, Harvard University and a Director of LECG, LLC. This paper draws on work for the Harvard Electricity Policy Group and the Harvard-Japan Project on Energy and the Environment. The author is or has been a consultant on electric market reform and transmission issues for Allegheny Electric Global Market, American Electric Power, American National Power, Australian Gas Light Company, Avista Energy, Barclays, Brazil Power Exchange Administrator (ASMAE), British National Grid Company, California Independent Energy Producers Association, California Independent System Operator, Calpine Corporation, Canadian Imperial Bank of Commerce, Centerpoint Energy, Central Maine Power Company, Chubu Electric Power Company, Citigroup, Comision Reguladora De Energia (CRE, Mexico), Commonwealth Edison Company, Conectiv, Constellation Power Source, Coral Power, Credit First Suisse Boston, Detroit Edison Company, Deutsche Bank, Duquesne Light Company, Dynegy, Edison Electric Institute, Edison Mission Energy, Electricity Corporation of New Zealand, Electric Power Supply Association, El Paso Electric, GPU Inc. (and the Supporting Companies of PJM), GPU PowerNet Pty Ltd., GWF Energy, Independent Energy Producers Assn, ISO New England, Luz del Sur, Maine Public Advocate, Maine Public Utilities Commission, Merrill Lynch, Midwest ISO, Mirant Corporation, JP Morgan, Morgan Stanley Capital Group, National Independent Energy Producers, New England Power Company, New York Independent System Operator, New York Power Pool, New York Utilities Collaborative, Niagara Mohawk Corporation, NRG Energy, Inc., Ontario IMO, Pepco, Pinpoint Power, PJM Office of Interconnection, PPL Corporation, Public Service Electric & Gas Company, Reliant Energy, Rhode Island Public Utilities Commission, San Diego Gas & Electric Corporation, Sempra Energy, SPP, Texas Genco, Texas Utilities Co, Tokyo Electric Power Company, Toronto Dominion Bank, TransÉnergie, Transpower of New Zealand, Westbrook Power, Western Power Trading Forum, Williams Energy Group, and Wisconsin Electric Power Company. The author benefited from comments by Jim Bushnell, Michael Cadwalader, Keith Casey, John Chandley, Debabrata Chattopadhyay, Ross Baldick, Steve Greenleaf, Andrew Hartshorn, Scott Harvey, Lorenzo Kristov, Yakout Mansour, Dmitri Perekhodtsev, Susan Pope, Mark Rothleder, Roy Shanker, Anjali Sheffrin, and Shams Siddiqi, among others. The views presented here are not necessarily attributable to any of those mentioned, and any remaining errors are solely the responsibility of the author. (Related papers can be found on the web at www.whogan.com).