Embed Size (px)
Citation preview

ELECTRICITY SECTOR REFORMIN ONTARIO
Presentation by:
Garry McKeever, Senior Policy Advisor
Office of Energy Supply and Conservation
Ontario Ministry of Energy
Energy and Environmental Innovations
Kleinburg
Tuesday, November 16, 2004

2
Overview of Presentation
Ontario’s Supply/Demand Challenge
Replacing Coal-Fired Generation
Electricity Sector Reform Strategy
Results and Next Steps

3
Ontario’s Supply/Demand Situation:Short-Term
Recent IMO supply adequacy reports show that short-term reserve margins in 2004 are higher than they were in 2003. These improved reserve margins are driven by the return to service of some nuclear units, as well as recent and planned capacity additions.
Recent or soon to be completed resource additions include: TransAlta (Sarnia) – 510 MW In-Service: March 2003 Pickering A Unit 4 – 515 MW In-Service: September 2003 Bruce A Unit 4 – 770 MW In-Service: November 2003 Bruce A Unit 3 – 770 MW In-Service: January 2004 Imperial Oil (Sarnia) – 98 MW In-Service: June 2004 Brighton Beach (Windsor) – 578 MW In-Service: July 2004 Pickering A Unit 1 – 515 MW In-Service: Expected September 2005
Total Resource Additions (30-Month Tracking): 3,756 MW

4
Ontario’s Supply/Demand Situation:Long-Term
Lenders have clearly become unwilling to finance expansion of generation companies selling into the spot market. Many lenders are now requiring that a large percentage (more than 50% or even all) of a project’s output must be sold in advance on contract.
The increasing age of Ontario’s generation infrastructure is also emerging as a potential issue as much of the existing capacity reaches or exceeds its nominal life.
Rising energy prices are a challenge facing all jurisdictions, and all “consumers” will need to adapt and reposition themselves within this new environment. How to use less energy? How to use energy more wisely?

5
Comparison of Electricity Cost for Residential Customers Comparison of Electricity Cost for Residential Customers Using 1000 kWh per MonthUsing 1000 kWh per Month
0
5
10
15
20
25
30M
an
ito
ba
Qu
eb
ec
Bri
tis
h C
olu
mb
ia
Ne
wfo
un
dla
nd
Ore
go
n
Te
nn
es
se
e
Sa
sk
atc
he
wa
n
Ne
w B
run
sw
ick
On
tari
o
Wa
sh
ing
ton
No
va
Sc
oti
a
Illin
ois
Flo
rid
a
Te
xa
s
Alb
ert
a
Pri
nc
e E
dw
ard
Isla
nd
Mic
hig
an
Ma
ss
ac
hu
se
tts
Ca
lifo
rnia
Ne
w Y
ork
Cd
n C
ents
per
kW
h
6
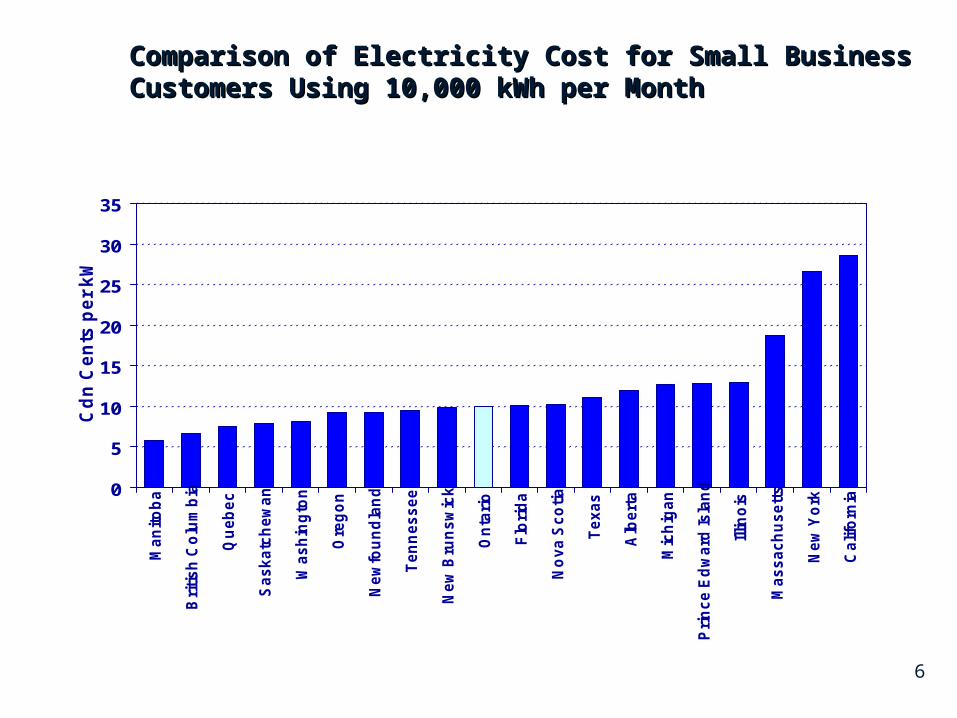
Comparison of Electricity Cost for Small Business Customers Comparison of Electricity Cost for Small Business Customers Using 10,000 kWh per MonthUsing 10,000 kWh per Month
0
5
10
15
20
25
30
35
Ma
nit
ob
a
Bri
tis
h C
olu
mb
ia
Qu
eb
ec
Sa
sk
atc
he
wa
n
Wa
sh
ing
ton
Ore
go
n
Ne
wfo
un
dla
nd
Te
nn
es
se
e
Ne
w B
run
sw
ick
On
tari
o
Flo
rid
a
No
va
Sc
oti
a
Te
xa
s
Alb
ert
a
Mic
hig
an
Pri
nc
e E
dw
ard
Is
lan
d
Illin
ois
Ma
ss
ac
hu
se
tts
Ne
w Y
ork
Ca
lifo
rnia
Cd
n C
en
ts p
er
kW
h

7
Supply and Conservation Challenges
Enormous investments required in generation to the year 2020: The replacement of coal plants (7,500 MW) Potential retirement of nuclear plants (up to 10,000 MW) Load growth (6,500 MW)
The Challenge: 24,000 MW / $25-$40 billion
Key Drivers: Task Force on Electricity Conservation and Supply OPG Review Committee Ontario Energy Board’s “Smart Metering” Review

Projected Demand Growth andBaseline Generation Capacity
0
5
10
15
20
25
30
35
40
20
04
20
05
20
06
20
07
20
08
20
09
20
10
20
11
20
12
20
13
20
14
20
15
20
16
20
17
20
18
20
19
20
20
Th
ou
san
ds
of
Me
ga
wa
tts
Existing Resources Gas Additions Summer Peak Required Capacity

Ontario’s Current Generation Mix
Oil
1%Biomass/Other
1%Natural Gas8%
Coal25%
Hydro25%
Nuclear40%
Total: 154 TWh

Tx- InterconnectionsTx- Interconnections
Minnesota ~ 90 MW in
~ 140 MW out
Michigan~ 1700 MW in
~ 2100 MW out
New York~ 1700 MW in~ 2200 MW out
Québec~1450 MW in~ 825 MW out
Ontario’s Peak Load~ 25,600 MW
Manitoba~325 MW in
~275 MW out
10Source: Hydro One
11
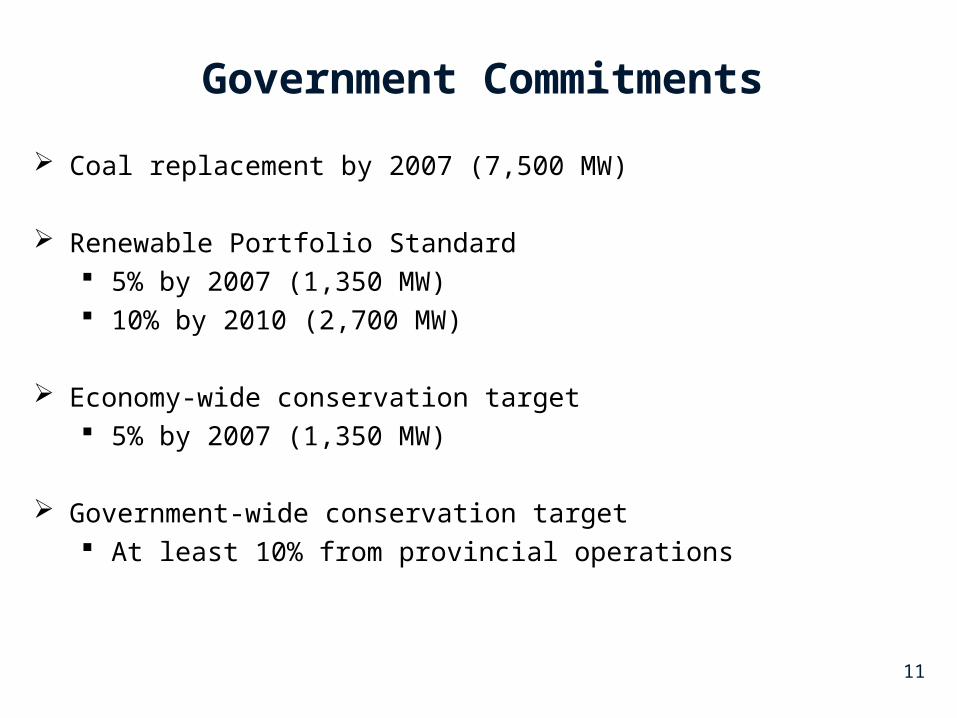
Government Commitments
Coal replacement by 2007 (7,500 MW)
Renewable Portfolio Standard 5% by 2007 (1,350 MW) 10% by 2010 (2,700 MW)
Economy-wide conservation target 5% by 2007 (1,350 MW)
Government-wide conservation target At least 10% from provincial operations
12
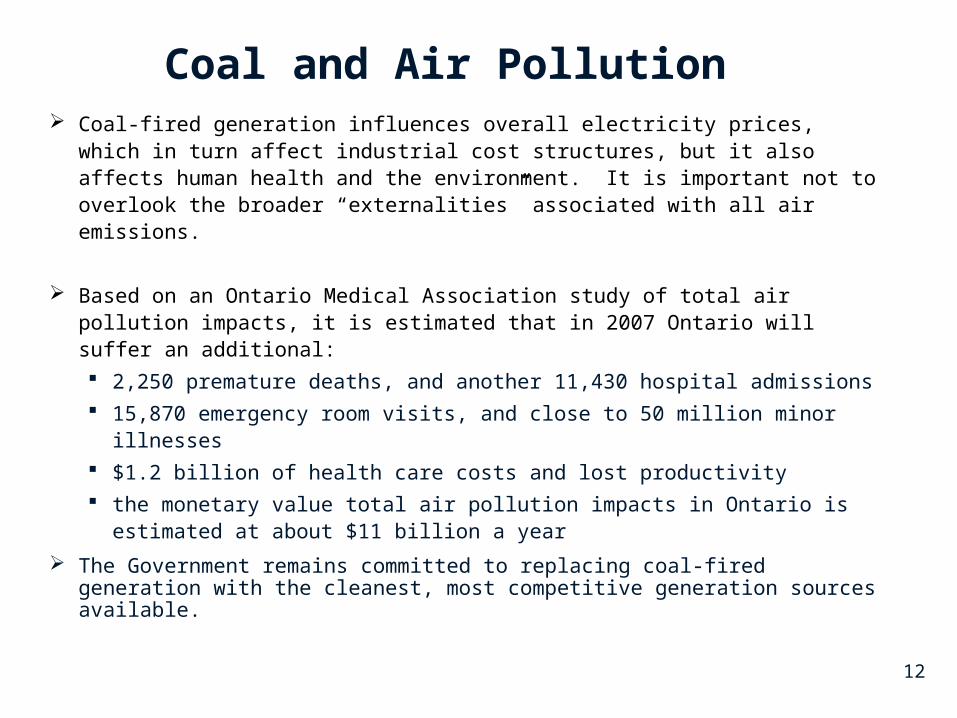
Coal and Air Pollution
Coal-fired generation influences overall electricity prices, which in turn affect industrial cost structures, but it also affects human health and the environment. It is important not to overlook the broader “externalities” associated with all air emissions.
Based on an Ontario Medical Association study of total air pollution impacts, it is estimated that in 2007 Ontario will suffer an additional:
2,250 premature deaths, and another 11,430 hospital admissions
15,870 emergency room visits, and close to 50 million minor illnesses
$1.2 billion of health care costs and lost productivity
the monetary value total air pollution impacts in Ontario is estimated at about $11 billion a year
The Government remains committed to replacing coal-fired generation with the cleanest, most competitive generation sources available.

1311
OntarioOntario
U.S. MidwestU.S. MidwestU.S. NortheastU.S. Northeast
Source: Canadian Geographic May/June 2000

14
Major Contributors to Ontario’s EmissionsMajor Contributors to Ontario’s Emissions
Ontario's SO2 - 2001
USA 50%
Transportation 2.5%
Electricity 12.5%
Miscellaneous 0.5%
Residential /Commercial 1.0%
Industry 33.5%
Ontario's Nox - 2001
Transportation 31.5%
Electricity 7.5%
Miscellaneous 1.5%
Residential /Commercial 2.5%
Industry7.0%
USA 50%

15
Sector Reform Legislation: Timing and Process
Interim pricing legislation (4.7 ¢/kWh and 5.5 ¢/kWh) – Fall 2003.
Sector reform legislation to establish a new electricity sector structure, introduced June 15, 2004.
Standing Committee on Social Policy held consultations over the summer.
Intent is that legislation will be passed this Fall.
Intent is also that the new sector structure would be in place and operational by early/mid-2005.

Electricity Sector Reform:Institutional Structure
CompetitiveGenerators
LargeConsumers
SmallConsumers
Fixed-PriceGenerators
(e.g., OPG Nuclear and Baseload Hydro)
IndependentElectricity
System Operator
(IESO)
AnnualRatePlan
Ontario Power Authority• Prepares system plan• Contracts for new supply and DSM• Manages annual rate plan• Houses Conservation Bureau
Ontario Energy Board• Guarantees public input/fairness• Approves prices for price
regulated generators; oversees contracts for new supply
Ministry of Energy• Determines technology mix/goals• Sets targets for conservation; renewables
EnergyRetailers
All consumers would benefit from the increased stability that this blended supply mix would provide.
Fixed prices for a large part of the energy consumed in the province would keep overall prices stable.

17
Short- and Medium-Term Results
Rate Cap Exit Strategy
Independent Price-Setting Mechanism
Pickering “A” Review Panel Report
Public Sector Salary Disclosure and FOI (H1/OPG)
Conservation Action Team
OPG Financial/Operational Audit
OPG Review Committee (Manley/Epp/Godsoe)
Electricity Sector Reform – Bill 100 (Ontario Power Authority)

18
Supply, Supply, Supply
Two interim RFPs for new supply and demand management: 300 MW Renewables RFP ($500-$700 million) 2,500 MW Supply/Demand Management RFP ($2.5-$2.8 billion)
Niagara tunnel project to expand generation capacity at Sir Adam Beck Generating Station ($600 million)– Increase of 1.6 TWh of clean electricity per year– Estimated 4.5 years for construction; possible in-service date 2009
Pickering A, Unit 1 Refurbishment ($975 million - $1billion) Potential restart of Bruce Units 1 and 2 (1,540 MW) Manitoba/Ontario Clean Energy Transfer Initiative ($5.5 billion) Interprovincial/US Interties and Reliability Future Generation Portfolio Mix/Balance