Embed Size (px)
Citation preview

Statistical Review of World Energy2021 | 70th edition
Electricity63 Generation 65 Generation by fuel

63bp Statistical Review of World Energy 2021
ElectricityElectricity generation*
Terawatt-hours 2010 2011 2012 2013 2014 2015 2016 2017 2018 2019 2020
Growth rate per annumShare20202020 2009-19
Canada 607.0 638.3 636.5 655.7 647.6 659.3 663.7 660.1 655.8 648.7 643.9 -1.0% 0.6% 2.4%Mexico 275.6 292.1 296.4 297.1 303.3 310.3 319.4 325.1 335.1 322.6 313.2 -3.2% 1.9% 1.2%US 4394.3 4363.4 4310.6 4330.3 4363.3 4348.7 4347.9 4302.5 4461.6 4411.2 4286.6 -3.1% 0.5% 16.0%Total North America 5276.8 5293.8 5243.5 5283.1 5314.2 5318.4 5331.1 5287.7 5452.5 5382.4 5243.6 -2.8% 0.6% 19.5%Argentina 126.0 129.5 136.0 139.4 138.6 145.4 147.2 145.6 146.8 139.5 142.5 1.9% 1.3% 0.5%Brazil 515.8 531.8 552.5 570.8 590.5 581.2 578.9 589.3 601.4 626.3 620.1 -1.3% 3.0% 2.3%Chile 61.3 65.2 69.7 73.0 71.6 74.5 77.7 78.6 82.3 83.6 84.3 0.5% 3.4% 0.3%Colombia 64.7 66.2 67.7 69.8 72.7 75.0 74.4 75.1 78.3 80.0 75.0 -6.5% 2.4% 0.3%Ecuador 19.5 20.5 22.8 23.3 24.3 26.0 27.3 28.0 29.7 32.9 32.0 -2.7% 6.0% 0.1%Peru 35.9 38.8 41.0 43.3 45.5 48.3 51.7 52.7 54.9 57.0 52.7 -7.7% 5.6% 0.2%Trinidad & Tobago 8.5 8.8 9.1 9.5 9.9 10.3 10.0 9.9 9.2 9.7 9.0 -7.0% 2.2% ◆
Venezuela 116.7 122.9 127.9 130.0 128.3 123.8 113.8 109.4 105.1 89.8 58.4 -35.1% -3.2% 0.2%Other S. & Cent. America 192.1 197.5 204.6 208.4 205.7 212.1 224.5 218.1 223.2 220.3 208.7 -5.5% 1.6% 0.8%Total S. & Cent. America 1140.5 1181.1 1231.4 1267.6 1287.3 1296.6 1305.6 1306.8 1330.9 1339.0 1282.8 -4.5% 2.1% 4.8%Austria 71.1 65.9 72.4 68.0 65.1 64.9 68.3 71.3 68.6 74.2 71.7 -3.6% 0.7% 0.3%Belgium 95.2 90.2 82.9 83.5 72.6 69.8 85.8 86.8 75.1 93.7 90.4 -3.8% 0.3% 0.3%Czech Republic 85.9 87.6 87.6 87.1 86.0 83.9 83.3 87.0 88.0 87.0 81.4 -6.6% 0.6% 0.3%Finland 81.1 73.7 70.5 71.4 68.2 69.2 69.2 67.9 70.6 69.0 68.8 -0.6% -0.5% 0.3%France 569.3 565.0 565.2 575.5 564.9 571.8 556.2 554.0 574.0 562.8 524.9 -7.0% 0.5% 2.0%Germany 633.1 613.1 630.1 638.7 627.8 647.6 649.7 652.9 642.9 609.4 571.9 -6.4% 0.2% 2.1%Greece 57.4 59.4 61.0 57.2 50.5 51.9 54.4 55.3 53.3 45.5 42.6 -6.6% -3.0% 0.2%Hungary 37.4 36.0 34.6 30.3 29.4 30.4 31.9 32.9 32.0 34.2 34.6 1.1% -0.5% 0.1%Italy 302.1 302.6 299.3 289.8 279.8 283.0 289.8 295.8 289.7 293.9 282.7 -4.0% ◆ 1.1%Netherlands 118.1 113.0 102.5 100.9 103.4 110.1 115.2 117.3 114.1 121.1 122.4 0.8% 0.6% 0.5%Norway 123.6 127.6 147.7 134.0 142.0 144.5 149.0 149.4 147.1 134.9 154.5 14.2% 0.2% 0.6%Poland 157.7 163.5 162.1 164.6 159.1 164.9 166.6 170.5 170.0 164.0 157.8 -4.0% 0.8% 0.6%Portugal 54.1 52.5 46.6 51.7 52.8 52.4 60.3 59.4 59.6 53.2 54.1 1.5% 0.6% 0.2%Romania 61.0 62.2 59.0 58.9 63.3 66.3 65.1 64.3 64.8 59.5 56.2 -5.7% 0.3% 0.2%Spain 300.4 291.8 297.6 285.3 278.8 281.0 274.6 275.6 274.5 267.5 255.8 -4.7% -1.0% 1.0%Sweden 148.3 151.2 166.3 153.2 153.7 162.1 156.1 164.3 163.4 168.4 169.2 0.2% 2.1% 0.6%Switzerland 68.0 64.8 70.0 70.4 72.0 66.3 61.9 61.8 67.6 72.1 70.4 -2.5% 0.5% 0.3%Turkey 211.2 229.4 239.5 240.2 252.0 261.8 274.4 297.3 304.8 303.9 305.4 0.2% 4.5% 1.1%Ukraine 188.8 194.9 198.9 194.4 182.8 163.7 164.6 156.0 159.9 154.1 149.0 -3.6% -1.2% 0.6%United Kingdom 382.1 368.0 363.9 358.3 338.1 338.9 339.2 338.2 332.8 324.8 312.8 -4.0% -1.5% 1.2%Other Europe 320.0 307.1 295.4 309.2 297.2 298.2 305.9 303.2 312.8 299.0 294.7 -1.7% -0.2% 1.1%Total Europe 4065.8 4019.4 4053.1 4022.2 3939.2 3982.7 4021.4 4061.3 4065.5 3992.1 3871.3 -3.3% 0.2% 14.4%Azerbaijan 18.7 20.3 23.0 23.4 24.7 24.7 25.0 24.3 25.2 26.1 22.8 -12.7% 3.3% 0.1%Belarus 34.9 32.2 30.8 31.5 34.7 34.2 33.6 34.5 38.9 40.5 38.7 -4.6% 2.9% 0.1%Kazakhstan 82.6 86.6 90.6 92.6 94.6 91.6 94.6 103.1 107.3 106.5 109.2 2.2% 3.1% 0.4%Russian Federation 1038.0 1054.9 1069.3 1059.1 1064.2 1067.5 1091.0 1091.2 1109.2 1118.1 1085.4 -3.2% 1.2% 4.0%Turkmenistan 16.7 17.2 17.8 18.9 20.1 21.5 22.6 22.8 24.2 25.4 26.6 4.4% 4.7% 0.1%Uzbekistan 51.9 52.8 53.0 54.9 55.4 57.3 59.1 60.8 62.9 63.1 65.0 2.7% 2.3% 0.2%Other CIS 41.1 44.6 46.0 43.3 44.1 44.0 43.5 46.3 48.6 49.2 49.4 0.3% 2.3% 0.2%Total CIS 1284.0 1308.5 1330.4 1323.7 1337.9 1340.9 1369.3 1383.0 1416.4 1428.8 1397.1 -2.5% 1.5% 5.2%Iran 235.7 235.6 248.8 258.9 273.5 279.5 286.1 305.2 314.4 318.7 331.6 3.8% 3.7% 1.2%Iraq 41.7 42.2 47.8 62.1 71.2 75.3 86.3 93.6 100.2 131.9 131.3 -0.7% 12.3% 0.5%Israel 58.5 59.3 63.0 61.4 61.3 64.3 67.4 67.7 69.3 72.3 74.3 2.4% 2.7% 0.3%Kuwait 57.1 57.5 62.7 61.0 65.1 68.3 70.1 72.9 74.2 75.2 74.9 -0.7% 3.5% 0.3%Oman 19.8 21.9 25.0 26.2 29.1 32.8 34.2 36.1 37.7 38.3 38.9 1.1% 7.6% 0.1%Qatar 28.1 30.7 34.8 34.7 38.7 41.5 42.3 45.6 47.9 49.9 50.5 1.1% 7.5% 0.2%Saudi Arabia 240.1 250.1 272.1 284.5 312.3 338.8 345.5 349.5 344.0 343.7 340.9 -1.1% 4.7% 1.3%United Arab Emirates 93.9 99.1 106.2 110.0 116.5 127.4 129.6 134.6 136.0 138.5 138.4 -0.3% 4.9% 0.5%Other Middle East 98.7 93.4 88.3 83.7 83.5 81.8 82.1 85.4 83.7 85.2 84.4 -1.2% -0.6% 0.3%Total Middle East 873.7 889.7 948.6 982.4 1051.4 1109.7 1143.7 1190.5 1207.4 1253.6 1265.2 0.6% 4.5% 4.7%Algeria 45.7 53.1 57.4 59.9 64.2 68.8 71.0 76.0 76.7 81.5 78.8 -3.6% 6.6% 0.3%Egypt 144.4 149.6 162.8 165.1 171.2 181.8 188.2 193.2 199.4 200.6 198.6 -1.2% 4.1% 0.7%Morocco 23.7 25.4 27.7 28.1 29.3 30.3 30.7 31.6 34.4 40.1 38.2 -5.2% 6.4% 0.1%South Africa 259.6 262.5 257.9 256.1 254.8 250.1 252.7 255.1 256.3 252.6 239.5 -5.5% 0.1% 0.9%Other Africa 198.8 198.9 215.3 234.8 248.4 257.3 253.9 268.9 280.3 288.6 288.9 -0.2% 4.9% 1.1%Total Africa 672.3 689.4 721.1 744.0 767.9 788.4 796.5 824.8 847.2 863.4 843.9 -2.5% 3.2% 3.1%Australia 251.0 256.3 250.7 249.6 247.6 254.0 258.2 259.0 262.6 265.9 265.2 -0.5% 0.6% 1.0%Bangladesh 40.8 44.2 48.7 54.4 57.4 61.8 70.0 73.4 81.1 89.7 89.1 -0.9% 9.2% 0.3%China 4207.2 4713.0 4987.6 5431.6 5794.5 5814.6 6133.2 6604.4 7166.1 7503.4 7779.1 3.4% 7.3% 29.0%China Hong Kong SAR 38.3 39.1 38.8 39.1 39.8 38.0 38.2 37.0 36.5 36.9 35.2 -4.8% -0.5% 0.1%India 937.5 1034.0 1091.8 1146.1 1262.2 1317.3 1401.7 1471.3 1579.2 1603.7 1560.9 -2.9% 6.2% 5.8%Indonesia 169.8 183.4 200.3 216.2 228.6 234.0 247.9 254.7 267.1 278.9 275.2 -1.6% 5.9% 1.0%Japan 1156.0 1104.2 1106.9 1087.8 1062.7 1030.1 1035.1 1042.1 1053.2 1030.3 1004.8 -2.7% -0.8% 3.7%Malaysia 125.0 127.1 134.1 141.0 147.5 150.1 156.7 160.6 170.6 171.5 159.6 -7.2% 4.0% 0.6%New Zealand 44.9 44.4 44.2 43.3 43.7 44.4 43.8 43.2 44.4 44.8 44.2 -1.7% 0.3% 0.2%Pakistan 99.4 100.6 99.5 101.0 106.3 110.5 116.0 127.7 138.3 138.6 137.8 -0.9% 3.4% 0.5%Philippines 67.7 69.2 72.9 75.3 77.3 82.4 90.8 94.4 99.8 106.0 101.8 -4.3% 5.5% 0.4%Singapore 45.4 46.0 46.9 48.0 49.3 50.3 51.6 52.2 52.9 54.1 53.1 -2.2% 2.6% 0.2%South Korea 495.0 518.2 531.2 537.2 540.4 547.8 561.0 576.4 592.9 585.3 574.0 -2.2% 2.6% 2.1%Sri Lanka 10.8 11.6 11.9 12.0 12.9 13.2 14.4 15.0 16.2 16.8 16.9 ◆ 5.3% 0.1%Taiwan 247.1 252.2 250.4 252.3 260.0 258.1 264.1 270.3 275.5 274.1 279.8 1.8% 1.8% 1.0%Thailand 157.6 153.3 169.0 168.6 173.8 177.8 179.8 176.7 177.6 186.5 176.4 -5.7% 2.5% 0.7%Vietnam 91.7 101.5 115.1 124.5 141.3 157.9 175.7 191.6 209.2 227.5 234.5 2.8% 10.9% 0.9%Other Asia Pacific 72.5 76.8 78.2 84.5 88.6 91.4 109.3 119.7 116.0 127.5 131.8 3.1% 6.9% 0.5%Total Asia Pacific 8257.7 8875.1 9278.1 9812.3 10333.7 10433.9 10947.6 11569.8 12339.3 12741.6 12919.3 1.1% 5.4% 48.2%Total World 21570.7 22257.0 22806.3 23435.2 24031.7 24270.5 24915.2 25623.9 26659.1 27001.0 26823.2 -0.9% 2.9% 100.0%of which: OECD 11062.8 11014.3 11023.7 11015.6 10956.6 11005.0 11082.8 11119.5 11312.8 11168.4 10880.8 -2.8% 0.5% 40.6%
Non-OECD 10507.9 11242.7 11782.6 12419.7 13075.2 13265.5 13832.4 14504.4 15346.4 15832.5 15942.4 0.4% 5.1% 59.4%European Union 2982.6 2931.3 2932.3 2912.9 2851.1 2899.1 2920.1 2952.4 2937.5 2892.5 2770.6 -4.5% 0.2% 10.3%
* Based on gross output. ◆ Less than 0.05%.Note: Growth rates are adjusted for leap years.

64 bp Statistical Review of World Energy 2021
At a global level, coal is the dominant fuel for power generation, however its share fell 1.3 percentage points to 35.1% in 2020, the lowest level in our data series. The share of renewables rose to record levels last year (11.7%), with the combined share of renewables and gas-fired power (35.1%) equalling coal for the first time. Europe’s share of renewables in power generation reached 23.8%, surpassing nuclear energy and making Europe the first region where renewables are the dominant source of power generation.
Natural gas is the dominant fuel used for power generation in North America, CIS, the Middle East and Africa. More than half of the power in South and Central America is hydroelectricity, while in Asia, coal comprises 57% of the generation mix – a far higher share than any other region. In Europe, renewables (including biopower) are the largest source of power generation with 23.8% for the first time, overtaking nuclear on 21.6%. Generation in Europe is spread fairly evenly between renewables, nuclear, gas (19.6%) and hydro (16.9%).
Regional electricity generation by fuel 2020Percentage
Oil Natural gas Coal
Nuclear Hydroelectricity Renewables
Other (includes sources not specified elsewhere e.g. pumped hydro, non-renewable waste and statistical differences)
0
100
80
60
40
10
70
50
30
90
20
Asia PacificAfricaMiddle EastEurope CISS. & Cent. AmericaNorth America
Renewables share of power generation by regionPercentage
20
15
10
5
World Asia Pacific Africa Middle East CIS Europe S. & Cent. America North America
00 04 10 12 16 1802 06 08 14 20
25
0
Share of global electricity generation by fuelPercentage
Hydroelectricity Nuclear energy Renewables
Oil Coal Natural gas
Other
2088 9692 0400 08 1612
50
10
20
30
40
0
65bp Statistical Review of World Energy 2021
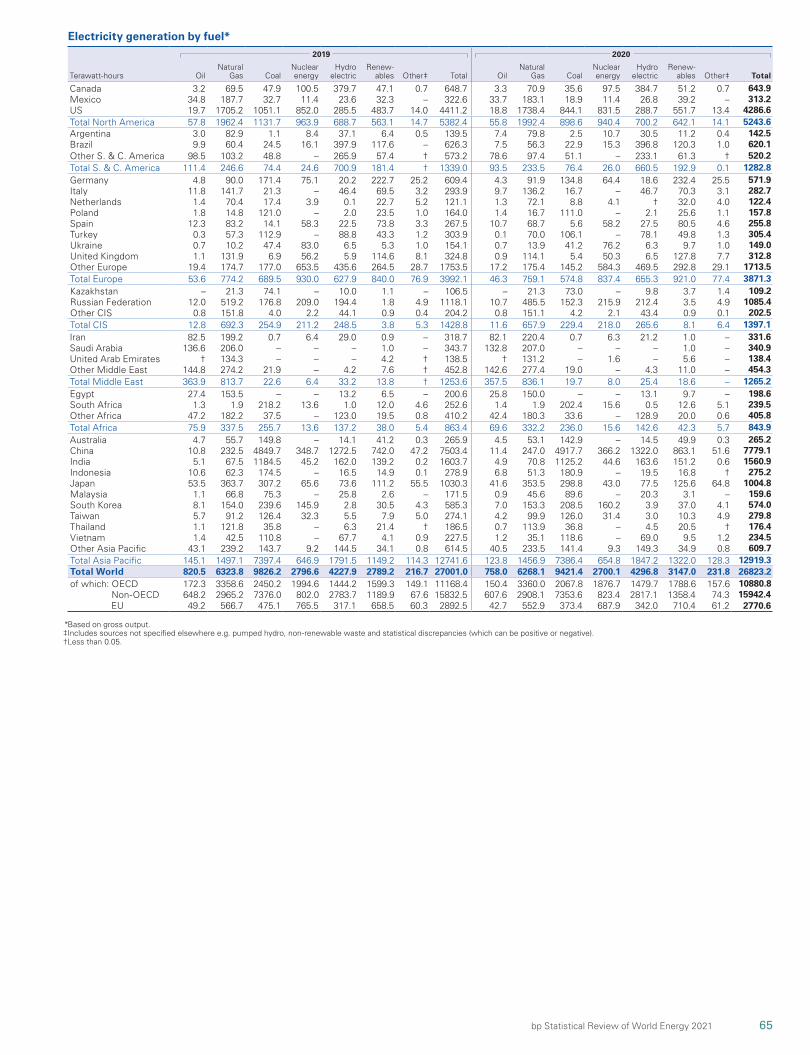
Electricity generation by fuel*
2019 2020
Terawatt-hours OilNatural
Gas CoalNuclear energy
Hydro electric
Renew- ables Other‡ Total Oil
Natural Gas Coal
Nuclear energy
Hydro electric
Renew- ables Other‡ Total
Canada 3.2 69.5 47.9 100.5 379.7 47.1 0.7 648.7 3.3 70.9 35.6 97.5 384.7 51.2 0.7 643.9Mexico 34.8 187.7 32.7 11.4 23.6 32.3 – 322.6 33.7 183.1 18.9 11.4 26.8 39.2 – 313.2US 19.7 1705.2 1051.1 852.0 285.5 483.7 14.0 4411.2 18.8 1738.4 844.1 831.5 288.7 551.7 13.4 4286.6Total North America 57.8 1962.4 1131.7 963.9 688.7 563.1 14.7 5382.4 55.8 1992.4 898.6 940.4 700.2 642.1 14.1 5243.6Argentina 3.0 82.9 1.1 8.4 37.1 6.4 0.5 139.5 7.4 79.8 2.5 10.7 30.5 11.2 0.4 142.5Brazil 9.9 60.4 24.5 16.1 397.9 117.6 – 626.3 7.5 56.3 22.9 15.3 396.8 120.3 1.0 620.1Other S. & C. America 98.5 103.2 48.8 – 265.9 57.4 † 573.2 78.6 97.4 51.1 – 233.1 61.3 † 520.2Total S. & C. America 111.4 246.6 74.4 24.6 700.9 181.4 † 1339.0 93.5 233.5 76.4 26.0 660.5 192.9 0.1 1282.8Germany 4.8 90.0 171.4 75.1 20.2 222.7 25.2 609.4 4.3 91.9 134.8 64.4 18.6 232.4 25.5 571.9Italy 11.8 141.7 21.3 – 46.4 69.5 3.2 293.9 9.7 136.2 16.7 – 46.7 70.3 3.1 282.7Netherlands 1.4 70.4 17.4 3.9 0.1 22.7 5.2 121.1 1.3 72.1 8.8 4.1 † 32.0 4.0 122.4Poland 1.8 14.8 121.0 – 2.0 23.5 1.0 164.0 1.4 16.7 111.0 – 2.1 25.6 1.1 157.8Spain 12.3 83.2 14.1 58.3 22.5 73.8 3.3 267.5 10.7 68.7 5.6 58.2 27.5 80.5 4.6 255.8Turkey 0.3 57.3 112.9 – 88.8 43.3 1.2 303.9 0.1 70.0 106.1 – 78.1 49.8 1.3 305.4Ukraine 0.7 10.2 47.4 83.0 6.5 5.3 1.0 154.1 0.7 13.9 41.2 76.2 6.3 9.7 1.0 149.0United Kingdom 1.1 131.9 6.9 56.2 5.9 114.6 8.1 324.8 0.9 114.1 5.4 50.3 6.5 127.8 7.7 312.8Other Europe 19.4 174.7 177.0 653.5 435.6 264.5 28.7 1753.5 17.2 175.4 145.2 584.3 469.5 292.8 29.1 1713.5Total Europe 53.6 774.2 689.5 930.0 627.9 840.0 76.9 3992.1 46.3 759.1 574.8 837.4 655.3 921.0 77.4 3871.3Kazakhstan – 21.3 74.1 – 10.0 1.1 – 106.5 – 21.3 73.0 – 9.8 3.7 1.4 109.2Russian Federation 12.0 519.2 176.8 209.0 194.4 1.8 4.9 1118.1 10.7 485.5 152.3 215.9 212.4 3.5 4.9 1085.4Other CIS 0.8 151.8 4.0 2.2 44.1 0.9 0.4 204.2 0.8 151.1 4.2 2.1 43.4 0.9 0.1 202.5Total CIS 12.8 692.3 254.9 211.2 248.5 3.8 5.3 1428.8 11.6 657.9 229.4 218.0 265.6 8.1 6.4 1397.1Iran 82.5 199.2 0.7 6.4 29.0 0.9 – 318.7 82.1 220.4 0.7 6.3 21.2 1.0 – 331.6Saudi Arabia 136.6 206.0 – – – 1.0 – 343.7 132.8 207.0 – – – 1.0 – 340.9United Arab Emirates † 134.3 – – – 4.2 † 138.5 † 131.2 – 1.6 – 5.6 – 138.4Other Middle East 144.8 274.2 21.9 – 4.2 7.6 † 452.8 142.6 277.4 19.0 – 4.3 11.0 – 454.3Total Middle East 363.9 813.7 22.6 6.4 33.2 13.8 † 1253.6 357.5 836.1 19.7 8.0 25.4 18.6 – 1265.2Egypt 27.4 153.5 – – 13.2 6.5 – 200.6 25.8 150.0 – – 13.1 9.7 – 198.6South Africa 1.3 1.9 218.2 13.6 1.0 12.0 4.6 252.6 1.4 1.9 202.4 15.6 0.5 12.6 5.1 239.5Other Africa 47.2 182.2 37.5 – 123.0 19.5 0.8 410.2 42.4 180.3 33.6 – 128.9 20.0 0.6 405.8Total Africa 75.9 337.5 255.7 13.6 137.2 38.0 5.4 863.4 69.6 332.2 236.0 15.6 142.6 42.3 5.7 843.9Australia 4.7 55.7 149.8 – 14.1 41.2 0.3 265.9 4.5 53.1 142.9 – 14.5 49.9 0.3 265.2China 10.8 232.5 4849.7 348.7 1272.5 742.0 47.2 7503.4 11.4 247.0 4917.7 366.2 1322.0 863.1 51.6 7779.1India 5.1 67.5 1184.5 45.2 162.0 139.2 0.2 1603.7 4.9 70.8 1125.2 44.6 163.6 151.2 0.6 1560.9Indonesia 10.6 62.3 174.5 – 16.5 14.9 0.1 278.9 6.8 51.3 180.9 – 19.5 16.8 † 275.2Japan 53.5 363.7 307.2 65.6 73.6 111.2 55.5 1030.3 41.6 353.5 298.8 43.0 77.5 125.6 64.8 1004.8Malaysia 1.1 66.8 75.3 – 25.8 2.6 – 171.5 0.9 45.6 89.6 – 20.3 3.1 – 159.6South Korea 8.1 154.0 239.6 145.9 2.8 30.5 4.3 585.3 7.0 153.3 208.5 160.2 3.9 37.0 4.1 574.0Taiwan 5.7 91.2 126.4 32.3 5.5 7.9 5.0 274.1 4.2 99.9 126.0 31.4 3.0 10.3 4.9 279.8Thailand 1.1 121.8 35.8 – 6.3 21.4 † 186.5 0.7 113.9 36.8 – 4.5 20.5 † 176.4Vietnam 1.4 42.5 110.8 – 67.7 4.1 0.9 227.5 1.2 35.1 118.6 – 69.0 9.5 1.2 234.5Other Asia Pacific 43.1 239.2 143.7 9.2 144.5 34.1 0.8 614.5 40.5 233.5 141.4 9.3 149.3 34.9 0.8 609.7Total Asia Pacific 145.1 1497.1 7397.4 646.9 1791.5 1149.2 114.3 12741.6 123.8 1456.9 7386.4 654.8 1847.2 1322.0 128.3 12919.3Total World 820.5 6323.8 9826.2 2796.6 4227.9 2789.2 216.7 27001.0 758.0 6268.1 9421.4 2700.1 4296.8 3147.0 231.8 26823.2of which: OECD 172.3 3358.6 2450.2 1994.6 1444.2 1599.3 149.1 11168.4 150.4 3360.0 2067.8 1876.7 1479.7 1788.6 157.6 10880.8
Non-OECD 648.2 2965.2 7376.0 802.0 2783.7 1189.9 67.6 15832.5 607.6 2908.1 7353.6 823.4 2817.1 1358.4 74.3 15942.4EU 49.2 566.7 475.1 765.5 317.1 658.5 60.3 2892.5 42.7 552.9 373.4 687.9 342.0 710.4 61.2 2770.6
*Based on gross output. ‡Includes sources not specified elsewhere e.g. pumped hydro, non-renewable waste and statistical discrepancies (which can be positive or negative). †Less than 0.05.