Embed Size (px)
Citation preview

AFRPL-TR-72-26
ELECTROLYTIC IGNITION SYSTEM, FOR A MILLIPOUND THRUSTER
(CONTRACT F04611-70-C-0070)
FINAL REPORT
JUNE, 1972
by
C.T. BROWN
UNITED AIRCRAFT RESEARCH LABORATORIES
UNITED AIRCRAFT CORPORATION
EAST HARTFORD, CONNECTICUT
"Approved for public release; distribution unlimited."
AIR FORCE ROCKET PROPULSION LABORATORYDIRECTOR OF LABORATORIES
AIR FORCE SYSTEMS COMMANDUNITED STATES AIR FORCE
EDWARDS, CALIFORNIA 93523
NATIONAL TECHNICALINFORMATION SERVICE Details of illusfrations in'... ,this document may be better tstudied on microfiche

- -' !~ iWHITE SwlICfl
~. . .........°....°. . *...
en U. S. Government drawings, specifications, or other
data are used for any purpose other than a definitely related
Government procurement operation, the Government thereby
incurs no responsibility nor any obligation whatsoever, and
the fact that the Government may have formulated, furnished,
or in any way supplied the said drawings, specifications, or'other data, is not to be regarded by implication or otherwkse,
or in any manner licensing the Lolder or any other person or
corporation, or conveying any r:,ghts or permission to manu-facture,use, or sell any patented invention that may in any
way be related thexeto."
a

Security Classification
DOCUMENT CONTROL DATA -R&D(Security claeeliication of title, body of abetract and Indexing annotation must be entered when the overall report te claesilied),ORIGINATIP G ACTIVITY (Corpore author) '2s. RErPORT SErCURITY C LASSIFICATION/
Unclassified
SGROUP
United Aircraft Research Laboratories3. REPORT TITLE
Electrolytic Ignition System for A Millipound Thruster
4. DESCRIPTIVE NOTES (Type of report and Inclusive dales)
Final ReportS AUTHOR(S) (Lest nane. first name. Initial)
Brown, Charles T.
6. REPORT DATE 7a. TOTAL NO. OF PAGES 7b. NO. OF REFS
June. 1972 168 12as. CONTRACT OR GRANT NO. $a. ORIGINATOR'S REPORT NUMBER(S)
Fo4611-70-C-0070b. PROJECT NO. AFRPL-TR-72-26
C. 9b. OTHR a SPORT NO($) (Any othor nsabere that may bo aaliedable report)
d.10. A V A IL ABILITY/LIMITATION NOTICES
Approved for public release; distribution unlimited
I], SUPPL EMENTARY NOTES 12. SPONSORING MILITARY ACTIVITYAir Force Rocket Propulsion LaboratoryEdwards Air Force BaseEdwards, California 93523
13. ABSTRACT
The United Aircraft Research Laboratories have conducted a research programunder Contract FO4611-70-C-0070, which had as its objective the development ofan electrolytic ignition system for monopropellant-fueled millipound thrusters.The total program included: (a) the study of the mechanism of electrolytic de-composition of two hydrazine-based monopropellants; (b) optimization of electrolysicell design based on data from (a);(c) electrolysis cell fabrication based on thedesign in (b); and (d) life tests on a millipound thruster incorporating theelectrolysis cell.
The electrochemical decomposition of hydrazine-based monopropellants wasstudied as a function of propellant composition and electrode materials. It wasfound that a 77% hydrazine-23% hydrazine azide composition yielded the highestheat output with the lowest power input provided platinum was used as an anode andeither platinum or 3014SS was used as the cathode. The power requirements are afunction of the electrical conductivity of the propellant.
-Performance data was obtained on prototype engines incorporating theelectrolytic ignition concept. Measurements were made at atmospheric pressureusing both steady-state and pulsed ignition modes with 77% hydrazine-23% hydrazineazide as the propellant. The final test engine was run for a period exceeding one
DD IJA. 1473 UnclassifiedSecurity Classification

UnclassifiedSecurity Classification
14. Kiy o"0, LINK A LINK 8 LINK C__________________ _________________ NLE WT KOLB WT ROLEt W?
Electrolytic IgnitionMonopropellantsHydrazineHydrazine Azide
Millipound Thrusters
INSTRUCTIONS1. ORIGINATING ACTIVITY: Enter the name end address Imposed by security classification, using standard statementsof the contractor, subcontractor. grantee. Department of De- such as:fense activity or other organiztion (cotporate author) issuing (1) "Qualified requesters may obtain copies of thisthe report. report from DDC."2o. REPORr SECUITY CLASSIFICATION: Enter the over- (2) "Foreign announcement and dissonstion of thisall security classification of the report. 1sdicate wliether report b nno t and dl••ro& to"Restricted Data" is included. Marking It to be in scccrd- reort by DDC is not authorized."ance with appropriate security regulatioes. (3) "U. S. Govsmnmen agencies may obtain copies of2b. GROUP: Automatic downgrading Is specified In DoD Di- ths rport directly from DDC. Other qualified DDCrective 5200. 10 and Armed Forces Industrial Manual. Enter users shall requect throughthe group number. Also, when applicable, show that optionalmarkings have been used for Group 3 and Group 4 as author- (4) "U. S. military agencies may obtain copies of thisized. report directly from DDC Other qualified users3. RFEPORT TITLE: Enter the complete report title in all shall request through
s.pitni Ietter-. Titles in all cases should be unclasaified.If n m..sninrful title cannot be selected without clsslfica-ihon. show lile classification in all capitals In parenthesis (5) "All distribution of this report Is controlled. Qual-immediotev fnilowing the title. eIled DDC users shallf ue t through4. DESCRIPTIVE NOTES; If appropriate, enter the type of .9"
tsport, e.g.. interim, progress, summary, annual, or final. If the report has been frnished to the Office of TechnicalGive the iclusive dates when a specific reporting period Is Services, Department of Commerce, for sale to the public, ndi-covered, cat* this fact and enter the price, It known.
.5. AUTI'IOR(S): Enter the nam(*) of author(s) as shown on IL SUPPLB4ENTARY NOTES: Use for additional explane-or in the report. Ente lost name, first name, middle Initial, tory notes.If mnilitary, show rank end branch of service. The name ofthe principal :ithor is an absolute minimum requirement. 12. SONSORING MILITARY ACTIVITY: Erier the name ofthe departmental project office or laboratory sponsoring (peyr6. REPORT DATE: Enter the date of the report as day, fng for) the research and d arlopmert. Include addess.month, year; or month, year. If more than one date appearson the report, use date of publication. 13. ABSTRACT: Enter an abstract giving a brief and factual
summary of the document Indicative of the report, even though7.. TOTAL NUMBER OF PAGES: The total page count it may also appear elsewhere In the body of the technical r-should follow normal pagination procedures, Le., enter ne por if additional apace to required, a continuation sheet shallnumber of pages containing information, be attad.7b. NUMBER OF REFERENCES Enter the total number of It is highly desirable that the abstract of classified reportnreferences cited in the report, be unclassified. Each paragraph of the abstract shall end with8s. CONTRACT OR GRANT NUMBER: If appropriste, enter an Indication of the military security clasasifiction of the in-the applicable number of the contract or grant under which formation in the paragraph, represented as (TS). (s). (C). or (U)the report was written. There Is no limitation on the length of the abstract. How-8b, Sc, & 8d. PROJECT NUMBER. Enter the appropriate ever, the suggested length is from 150 to 225 words.military department identification, such as project number.subproject number, system numbers, tak number, etc. 14. KEY WORDS: Key words at technically meaninful tomu
or short phrases that characterlze a report and may be used at9.. ORIGINATOR'S REPORT NUIM IER(S): Enter the offi- Index entries for cataloging the report. Key words must becial report number by which the document will be identified selected so that no security classlilcatton is required. Identi-and controlled by the originating activi~y. This- number must fiera. such as equipment model designation, trade name, militstrybe unique to this report. project code name, geographic location, may be used as key9b, OTHER REPORT NUMBER(S): If the report has been words but will be followed by an indication of technical con-ssigneI sny other report numbers (either by the originator text. The assignment of links, rles, and weights Ia optionalor by the xpon.sor), also enter this number(s),
10. AVAILABILITY/LIh([TATION NOTICES: Enter any limn-vilti ins on further dissemination of the report, other than those
D D F 1473 (BACK) Unclassified

A
hour using sixty cold starts. No degradation in performance was noted. The zengine thrust was in the range 35-50 millipounds and characteristic velocitiesin the range 3800-ioo ft/sec were achieved. ignition delay times were on theorder of 30-70 msec, and the specific impulse was in the range Cf 190-205 sec.The energy requirement for ignitio (cold start) is 15-30 watt-sec using apeak power of 100-130 watts.
r

: AFRPL-TR-72-26
ELECTROLYTIC IGNITION SYSTEM FOR A MILLIPOUND THRUSTER
FINAL REPORT(Contract 104611-70-C-0070)
June, 1972
C. T. Brown- - , , _..._ _
United -Aircraft Research Laboratories
L)L'
"Approved for public release; distribution unlimited"
Air Force Rocket Propulsion Laboratory
Director of LaboratoriesAir Force Systems CoirnandUnited States Air Force
Edwards, California 93523

AFF--T -72-26
FOREWORD
The work described in this report was performed at the United Aircraft
Research Laboratories, East Hartford, Connecticut, for the Air Force Rocket
Propulsion Laboratcry under Contract F0h611-70-C-0070 initiated July 15, 1970and ending June 15, 1972.
Those who participated in the performance of the work under this contractwere: Dr. C. T. Brown, Principal Investigator; Mr. D. G. McMahon, Program
Manager and Chief, Chemical Sciences Section: Mr. S. Russell; Mr. T. Fondrk;
and Mrs. I. Reed of UARL.
This work was conducted under the technical management of Captain Doug.as
D. Huxtable atid Captain Ronald J. Meetin AFRPL/LKDP, of Edwards Air Force Base,
Edwards, California. This technical report has been reviewed and is approved.
Ronald J. Meetin, Captain, USAFProject Engineer
ii
1k
'I

AFRPL-TR-72-26,
ABSTRACT
The United Aircraft Research Laboratories have conducted a research program
under Contract F04611-70-C-0070, which had as its objective the development of an
electrolytic ignition system for monopropellant-fueled millipound thrusters. The
total program included: (a) The study of the mechanism of electrolytic decompo-
sition of two hydrazine-based monopropellants; (b) optimization of electrolysiscell design based on data from (a); (c) electrolysis cell fabrication based onthe design in (b); and (d) life tests on a millipound thruster incorporating the
electrolysis cell.
The electrochemical decomposition of hydrazine-based monopropellants was
studied as a function of propellant composition and electrode materials. It wasfound that a 77% hydrazine-23% hydrazine azide composition yielded the highestheat output with the lowest power input provided platinum was used as an anodeand either platinum or 304SS was used as the cathode. The power requirements area function of the electrical conductivity of the propellant.
Performance data was obtained on prototype engines incorporating the electro-lytic igniti6n concept. Measurements were made at atmospheric pressure using both
steady-state and pulsed ignition modes with 77% hydrazine-23% hydrazine azide asthe propellant. The final test engine was run for a period exceeding one hourusing sixty cold starts. No degradation in performance was noted. The engine
thrust was in the range 35-50 millipounds and characteristic velocities in the
range 3800-4100 ft/sec were achieved. Ignition delay times were on the order of30-70 msec, and the specific impulse was in the range of 190-205 sec. The energyrequirement for ignition (cold start) is 15-30 watt-sec using a peak power of100-130 watts.
iii

(THIS PAGE IS BLANK)
iv

AFRPL-TR-72-26
TABLE OF CONTENTS
PAGE
FOREWORD .............. ................................. ii
ABSTRACT . . . . . . . . . . . . . . . . . . . . . . . . . . . . . . . . ii
TABLE OF CONTENTS ........... ............................. v
LIST OF TABLES ........... .............................. ... vi
LIST OF FIGUES .... .................................... ix
LIST OF SYMBOLS . . . ........... ......... .. xiv
SECTION I - INTRODUCTION ......... ......................... .1..
SECTION II - MECHANISM OP ELECTROCHEMICAL DECOMPOSITION ......... 3
1. lectrical Condactivity of Candidate Electrolytes 3........3
2. Polarization i, Electrodes ........ .................... 5
3. Electrolysis and Pr'-Iuct Analysis ........ ................ 16
SECTION III - DESIGN AND OPTIMILATION OF THE ELECTROLYTIC CELL ... ...... 22
1. Heat Release and Material Compatibility .... ............. ... 22
2. Electrode Configurations and Preliminary Engine Design ......... 27
SECTION IV - DESIGN, FABRICATION, AND EVALUATION OF PROTOTYPE MILLIPOUND
THRUSTERS .... ... ........................ 0
1. Prototype Desisn and Fabrication ..... ................ 4o
2. Preliminary Engine Evaluation ....... ................. 41
SECTION V - SUMARY A4UD CONCLUSIONS ........ .................... i7
REFERENCES .............. ................................ 52
TABLES I - XL . . . . . . . . . . . . . . . . . . . . . . . . . . . . . . 53
FIGURES 1-75
v

AFRPL-TR-72-26
LIST OF TABLES
Table Number Title
I Specific Conauctance of Selected Hydrazine-Base
Propellants
II Order of Anodic Polarization at an Overpotential
of 1000mv
III Order of Cathodic Polarization at an Overpotential
of 1000mv
IV Comparison of Anodic and Cathodic Polarization of
Stainless Steels in 77% Hydrazine - 23% Hydra-zine Azide
V Anodic Polarization of AM350, 304SS, PyrolyticGraphite and Platinum as a Function of Azide
Concentration
VI Cathodic Polarization of AM350, 304SS and Platinumas a Function of Azide Concentration
VII Comparison of Anodic and Cathodic Polarization inAzide and Nitrate Propellants
VIII Order of Cathodic Polarization at a Constant
Current of 50ma
IX Order of Anodic Polarization &t a Constant Current
of 50ma
x Total Overpotential at 50ma/cm2 in 77% Hydrazine -
23% Hydrazine Azide
XI Polarization as a functio n of Azide ConcentrationAt 50ma
7p
XII Comparison of Polarization in Hydrazine-HydrazineAzide and Hydrazinle-Hydrazine Nitrate ata Constant Current of 50ma
XIII Electrolysis of Hydrazine Azide-Gas Analysis
XIV Polarization Data Electrolysis Cell

AFRPL-TR-72-26
LIST OF TABLES (CONTINUED)
Table Number Title
XV Efficiency of Heat Production Based on the Amountof N5H5 Decomposed
XVI Polarization Characteristics of Several ElectrodeCombinations
XVII Resistance-Free Polarization of Several ElectrodeCombinations
XVIII Equilibrium Decomposition Rates of 77% Hydrazine-23% Hydrazine Azide at 300 0 K
XIX Comparison of Compatibility Data
XX Indicated Activation Energies for Hydrazine andHydrazine Azide Decomposition
XXI E-actrolytic Engine Performance Data (CS-3)
XXII Electrolytic Engine Performance Data (FP-1-TB)
XXIII Electrolytic Engine Performance Data for Engines(FP-2) and (FP-3)
XXIV ResisLar.-e Measurements in Electrolytic IgnitionCells
XXV Results of Resistance Measurements in ElectrolyticIgnition Cells
XXVI FP-4 Engine Performance Data
XXVII Performance of FP-4 Engine as a Function of EngineModification
XXVIII FP-.4 Engine Temperature Profile
XXIX Energy and Power Requirements (Engine ConfigurationFP-4)
vii

AFRPL-TR-72-26 /
Table Number Title
YXX Performance Data and Energy Requirements
(Engine Configuration FP-5)
XXXI Performance Data (Engine Configuration FP-5A)
XXXII Performance Data (Engine Configuration FP-5B)
XXXIII Engine Performance Data (In order of Initial
Cell Temperature)(Engine Configuration FP-5B)
XXXIV Durability Tests - Duty Cycle
XXXV Performance Data-Prototype Engine #3 (Manual
Runs)
XXXVI Performance Data-Prototype Engine #3(Duty Cycle
Runs)
XXXVII Performance Data-Prototype Engine #5 (ManualRuns)
XXXVIII Performance Data-Prototype Engine #5(Duty CycleRuns)
XXXIX Prototype Engine #5 Power and Energy Require-
ments
XL Performance Data-Prototype Engine #6
i
viii

AFRPL-TR-72-26
LIST OF FIGURES
Figure Number Title
1 Temperature Dependence of Electrical Conductivity
in Hydrazine Solution
2 Electrode Polarization Apparatus
3 Anodic Polarization of 17-7PH in Hydrazine-Base
Propellants
4 Anodic Polarization of 304SS in Hydrazine-BasePropellants
Anodic Polarization of A4l350 in Hydrazine-Base
Propellants
6 Anodic Polarization of HS1414 in }Hydrazine-BasePropellants
7 Anodic Polarization of Platinum in Hydrazine-Base
Propellants
8 Anodic Polarization of Graphite in Hydrazine-BasePropellants
9 Anodic Polarization of AAllO0 in Hydrazine-BasePropellants
10 Anodic Polarization of AA6061-T6 in Hydrazine-Base.Propellants
11 Anodic Polarization of Nickel, Platinum, and
Inconel in 77% Hydrazine - 23% Hydrazine Azide
12 Cathodic Polarization of 17-TPH in Hydrazine-BasePropellants
13 Cathodic Polarization of 304SS in Hydrazine-BasePropellants
ix

AFRPL-TR-72-26
LIST OF FIGURES(CONTINUED)
Figure Number Title
14 Cathodic Polarization of AM350 in Hydrazine-Base
Propellants
15 Cathodic Polarization of HS1414 in Hydrazine-Base
Propellants
16 Cathodic Polarization of Platinum in Hydrazine-Base
Propellants
17 Cathodic Polarization of Graphite in Hydrazine-BasePropellants
18 Cathodic Polarization of AAllO0 in Hydrazine-PasePropellants
19 Cathodic Polarization of AA6061-T6 in Hydrazine-
Base Propellants
20 Cathodic Polarization of Nickel, Platinum, andInconel in 77% Hydrazine - 23% Hydrazine Azide
21 Anodic Polarization of 17-7PH in 77% Hydrazine-
23% Hydrazine Azile
22 Cathodic Polarization of AM350 in 77% Hydrazine-23% Hydrazine Azide
23 Anodic Polarization of AM350 in 77% 12H4 - 23%N515 and 88% N2H-12% N 5H5
24 Anodic Polarization of Graphite in 77% Hydrazine-23% Hydrazine Azide
25 Cathodic Polarization of Graphite in 77, Hydrazine23% Hydrazine Azide
26 Anodic Polarization of 304SS as a Function of Azide
Concentration
27 Aixodic Polarization of AM350 as a Function of AzideConcentration
x

AFRPL-TR-72-26
LIST OF FIGURES (CONTINUED)
Figure Number Title
28 Anodic Polarization of Platinum as a Function ofAzide Concentration
29 Anodic Polarization of Pyrolytic Graphite as aFunction of Azide Concentration
30 Cathodic Polarization of 304SS as a Function of
Azide Concentration
31 Cathodic Polarization of AM350 as A Function of
Azide Concentration
32 Cathodic Polarization of Platinum as a Function ofAzide Concentration
33 Cathodic Current Density vs Azide Concentrationat n = 1000 mv
34 Anodic Current Density vs Azide Concentrationat n = 1000 mv
35 Anodic Polarization of 304SS in 6% Hydrazine
Nitrate and in 4.8% Hydrazine Azide
36 Anodic Polarization of AM350 in 6% Hydrazine
Nitrate and in 4.8% Hydrazine Azide
37 Anodic Polarization of Platinum in 6% Hyd.-azine
Nitrate and in 4.8% Hydrazine Azide
38 Anodic Polarization of Pyrolytic Graphite in 6%
Hydrazine Nitrate and in 4.8% Hydrazine Azide
39 Cathodic Polarization of 304SS in 6% 'iydrazineNitrate and in 4.8% Hydrazine Azid,.
40 Cathodic Polarization of AM350 in 6% Hydrazine andin 4.8% Hydrazine Azide
41 Cathodic Polarization of Platinum in 6% HydrazineNitrate and in 4.8% Hydrazine Azide
42 Potential-Time Relationships at 100 ma in 77%
14214-23% N5H543 Electrolysis Cell
1,4 Chromatography Apparatusxi

AFRPL-TR-72-26
LIST OF FIGURES (CONTINUED)
Figure Number Title
45 Heating Rates as a Function of Electrode Materials
46 Electrode Configuration No. 1
47 Electrode Configuration No. 2
48 Electrode Configuration With Horizontal Flat
Screens
49 Electrode Configuration with Parallel V- rtical Plates
50 Engine Configurations CS-1 and CS-3
51 Engine Configuration CS-2TB
52 Fuel Delivery System (With Flow-Measuring Device)
53 Engine Test Apparatus
54 Characteristic Exhaust Velocity vs Propellant Flow(Engine Configuration CS-3)
55 Engine Configuration with Horizontal Flat Screens
and Thermal Bed
56 Engine Configuration FP-2
57 Chamber Pressure as a Function of Time
58 Characteristic Exhaust Velocity vs Propellant Flow
59 Engine Configuration FP-3
6o Characteristic Exhaust Velocity vs Propellant WeightFlow
61 Electrolytic Cell (Configuration FP-4)
62 Engine Configuration FP-4
63 Engine Temperature Profile Configuration FP-4
xii
/
AFRPL-TR-72-26
LIST OF FIGURES (CONTINUED)
Figure Number Title
64 Current and Pressure as Functions of Time for
Engine Configuration FP-5
65 C*%rrent and Pressure as Functions of Time for
Engine Configuration FP-5
66 Current and Fiessure as Functions of Time for
Engine Configuration FP-5
67 Engine Configuration FP-5
68 Pressure-Time Relationship as a Function of
Temperature (Engine Configuration FP=5B)
69 Preliminary Design for Prototype MillipoundThruster
70a Millipound Thruster - Exploded View
70b Millipound Thruster - Exploded View
71 Millipound Thruster
72 Duty Cycle Programmer and Power Supplies
73 Base Point Performance Data Engine #3
74 Base Point Performance Data Engine #5
75 Base Point .Performance Data Engine #6
xiii

AFRPL-TR-72-26
LIST OF SYMBOLS
At Area of Throat (in 2 )
CF Thrust coefficient
C* Characteristic Velocity (ft/sec)
AE Activation Energy (kcal/mole)
F Thrust (lbs) or (mlbs)
Isp Specific Impulse (sec)
I Current (amps)
i Current Density (ma/cm2 )
PC Chamber Pressure (psia)R Gas Constant (cal/OK/mole)
Te Chamber Temperature (OF)
T Absolute Temperature (OK)
tg0 Pressure rise time (msec)
tlo Pressure tail-off time (msec)
n Overpotential (my)
K Specific conductivity (ohms-lcm-l)
Mass Flow rate (lbs/sec)
xiv

AFRPL-TR-72-26
SECTION I
INTRODUCTION
The advantages of monopropellants over bipropellants for specific rocket engineapplications have long been recognized. These advantages include the simplicity andreliability of the system resulting from elimination of problems and inefficienciesassociated with residual fuel or oxidizer at other than the design mixture ratio forbipropellant systems. Consequently, a considerable amount of research and develop-ment has been carried on during the past fifteen years to develop suitable monopro-pellants. This work has included studies of the quaternary ammonium salts (cavea-type (compounds), hydrogen peroxide, n-propyl nitrate, tetranitromethane, hydrazineand a variety of other materials. In most instances, however, the simultaneousrequirements of high performance and low shock sensitivity have eliminated manycandidate propellants.
Among the various candidate monopropellants, hydrazine was recognized early inits use as presenting a good compromise between the requirements of performance andsafety. Initial work was hampered by the need for relatively high bed temperaturesto initiate the hydrazine decomposition in a reaction chamber. Interest consequentlylagged. However, the development of spontaneous low-temperature catalysts for mono-propellant hydrazine has stimulated a considerable resurgence of interest during thepast decade in the use of hydrazine and hydrazine-based mixtures as monopropellantsfor various applications in thrusters and gas generators and has lead to the recentsuccessful use of hydrazine monopropellant thrusters for satellite station-keepingoperations.
One major problem remaining with the low-temperature catalyst for hydrazine-based monopropellants is the present requirement for substantial amounts of criticalnoble metals in systems which must achieve multiple cold starts. A number ofalternatives to the use of noble metal catalysts for ignition have been suggested.In particular, the need for rapid ignition with high reliability over a wide rangeof temperatures and engine sizes has resulted in interest in the development of anelectrochemical means of ignition for hydrazine-based monopropellants in smallthrusters. The development of an electrochemical ignition system circumvents problemsassociated with catalyst degradation caused by spallation, sintering, crystalliteformation, and poisoning. In addition, such an ignition method has a potentialadvantage of reduced chamber volume. An ignition system of this general type hasbeen demonstrated on a small scale (Ref. 1), but substantial design information wasstill needed before an optimized system could be fabricated and tested.
A more complete technical program directed toward obtaining such design informa-tion has been completed during the past year and a half at UARL under Contract FOh611-70-C-0070. The program had as its objective, the development of a millipound thrusterusing electrolytic decomposition of the propellant as the ignition device. Theprogram comprised three phases which are: Phase I, Study of the mechanism of electro-chemical decomposition of the propellants; Phase iI, Design and Optimization of an
1

AFRPL-TR-72-26
electrolytic cell based on the data obtained in Phase I; and Phase III, Fabricationand evaluation of an electrolytically ignited .millipound thruster designed forpropellant flow rates in the range 1 to 4 x lO14lbs/sec. Mhe results for thesePhases are discussed in the following sections of this report.
2

AFRPL-TR-72-26. 4
SECTION II
PHASE I: MECHANISM OF ELECTROCHEMICAL DECOMPOSITION
The Phase I experimental program comprised three basic studies: (1) the
evaluation of the ohmic losses that result from the resistivity (conductivity) ofthe propellants used; (2) the determination of polarization effects on variouselectrode materials as a function of the propellant/electrolyte used; and (3)electrolysis of propellant/electrolyte in order to determine the decompositionproducts formed and thus provide a basis for evaluating the theoretical heat outputarising from the electrolysis.
1. ELECTRICAL CONDUCTIVITY OF CANDIDATE ELECTROLYTES
The electrolytic ignition concept is based on providing the heat for ignitionby utilizing the heat of decomposition of the propellant. The rate of decompositionis a direct function of the current flow through the propellant; that is,current isthe driving force for the process.
In order to achieve rapid ignition and at the same time minimize power it isnecessary to have an electrolyte with as high an electrical conductivity as possible.Ohmic heating can represent a large power loss in the cell, and low conductivityseverely limits the current available for direct-low temperature decomposition ofthe electrolyte.
Since the specific conductivity of pure hydrazine is on the order of 10-6ohms-1 cm- 1 (ie, a resistivity of one million ohms per centimeter) (Ref. 2), itobviously cannot be used directly in an electrolytic cell. In order to raise theconductivity, it is necessary to use hydrazine-salt mixtures. Since little or noconductivity data was available on hydrazine-salt mixtures, this parameter wasdetermined for electrolytes of interest.
a. Experimental Approach
(1) Materials
For the determination of electrolytic conductance, platinum electrodes were used.The electrodes consisted of two parallel sheets of platinum foil (each approximately-one cm ); in order to aid in eliminating polarization effects due to the current, theelectrodes were coated with a layer of finely divided platinum black.
The specific conductances of the following materials were determined: propellantgrade hydrazine, hydrazine + 2% ammonium nitrate, and two solutions of hydrazine andhydrazine azide, one containing 23% hydrazine azide and the other containing 2%hydrazine azide. The nitrate solution was prepared by adding two weight percent ofammonium nitrate to propellant grade hydrazine. The 2% hydrazine azide solution wasprepared by dilution of 23% hydrazine azide solution.
3
I
AFRPL-TR-72-26
[
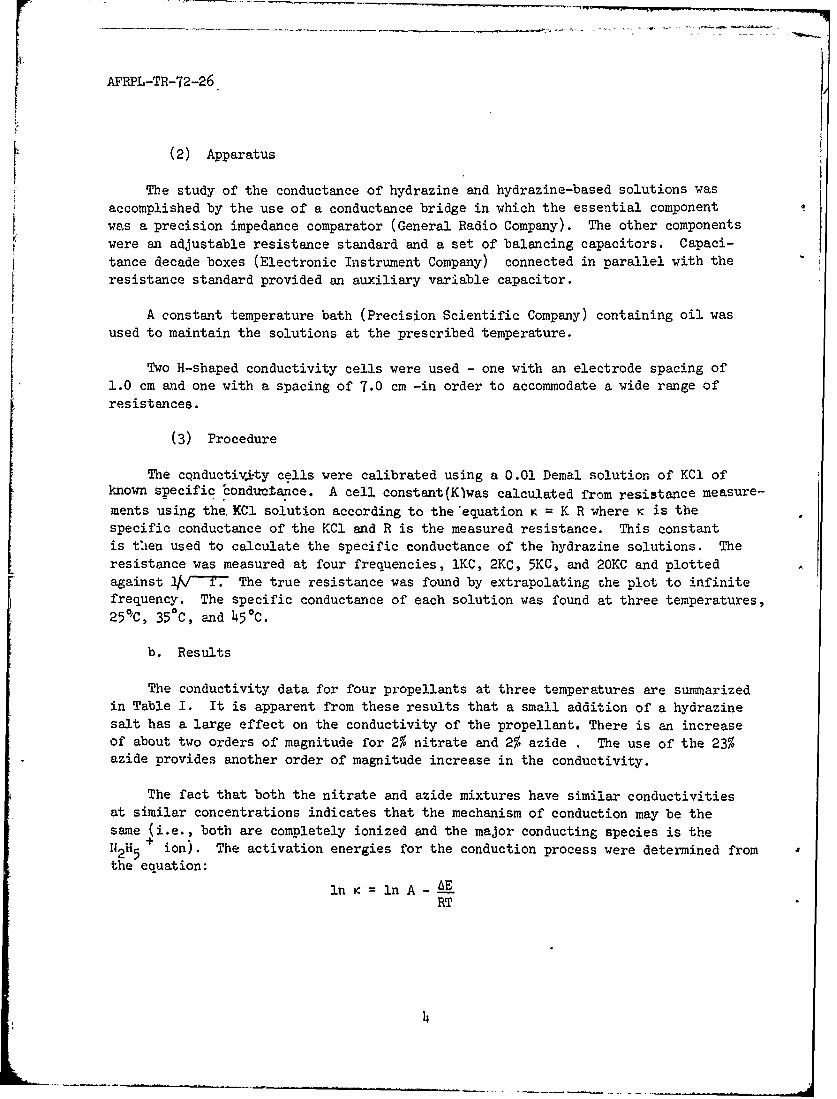
(2) Apparatus
The study of the conductance of hydrazine and hydrazine-based solutions wasaccomplished by the use of a conductance bridge in which the essential componentwas a precision impedance comparator (General Radio Company). The other componentswere an adjustable resistance standard and a set of balancing capacitors. Capaci-tance decade boxes (Electronic Instrument Company) connected in parallel with theresistance standard provided an auxiliary variable capacitor.
A constant temperature bath (Precision Scientific Company) containing oil wasused to maintain the solutions at the prescribed temperature.
Two H-shaped conductivity cells were used - one with an electrode spacing of1.0 cm and one with a spacing of 7.0 cm -in order to accommodate a wide range ofresistances.
(3) Procedure
The cqnductiv.ity cells were calibrated using a 0.01 Demal solution of KC1 ofknown specific bonductance. A cell constant(K)was calculated from resista.ce measure-
ments using the. KCl solution according to the equation K = K R where K is thespecific conductance of the KC and R is the measured resistance. This constantis then used to calculate the specific conductance of the hydrazine solutions. Theresistance was measured at four frequencies, 1KC, 2KC, 5KC, and 20KC and plottedagainst f1T7 The true resistance was found by extrapolating che plot to infinitefrequency. The specific conductance of each solution was found at three temperatures,250'C, 35*C, and h5 0 C.
b. Results
The conductivity data for four propellants at three temperatures are summarizedin Table I. It is apparent from these results that a small addition of a hydrazinesalt has a large effect on the conductivity of the propellant. There is an increaseof about two orders of magnitude for 2% nitrate and 2% azide . The use of the 23%azide provides another order of magnitude increase in the conductivity.
The fact that both the nitrate and azide mixtures have similar conductivitiesat similar concentrations indicates that the mechanism of conduction may be thesame (i.e., both are completely ionized and the major conducting species is the
142H5 + ion). The activation energies for the conduction process were determined fromthe equation:
ln K = ln A - AERT

AFRPL-TR-72-26
where AE is the energy of activation for conduction in cal/mole, K is the specific
conductivity in ohm ~ cA and R is the gas constant expressed in cal/deg K/mole,A is an empirical constant, and T is the temperature in deg K. A plot of log Kversus l/T yields a slope of -AE/2.303 R and thus AE can be calculated. The valuesfor the energies of activation obtained from plots of log K versus l/T using datafrom Table I and illustrated in Fig. 1 are 10.0, 1.6, 2.9, and 1.3 kcal/mole forN2H4 , N2H4 - 2% N14NO 3 , N2H4 - 2% N5 H5 and N2 H4 - 23% N5H5 , respectively. Althougfthe high value of 2.9 for the 2% N5H5 is unexplained, it is apparent that thevalues for the energies of activation for the propellants containing the twoadditives studied are all substantially smaller than the value of 10 kcal/molemeasured for N2H4. These results add further credence to the premise that theconduction mechanisms are similar for these additives. It is not necessary toscreen a further large group of additives for the sole purpose of finding one whichwill greatly increase the conductivity of the propellant.
The use of the azide additive is preferred over the nitrate, since the azide
decomposition products should be the same as those for neat hydrazine. Otheradditives such as nitrates would be expected to yield a wide variety of products.
Thus the use of an electrolyte such as the 77% N2H4 - 23% N5H5 mixture can beexpected to conduct sufficiently to maximize the current flow for a given appliedvoltage and minimize the ohmic losses in the cell.
The second major factor that can-contribute to an increase in power requirementsis the extra voltage that must be used to increase polarization effects at theelectrode-electrolyte interface where current is flowing. The following section ofthe report describes studies that were per:formed in this important area
2. POLARIZATION OF ELECTRODES
Electrode polarization or voltage loss (overvoltage) due to electrode-electrolyteeffects becomes important as the internal resistance effects are minimized. Thepolarization effects are due to a slow step in the electron transfer reaction inthe vicinity of the electrode surface (activation polarization) or to slow diffusionof a reacting species into the electrolyte-electrode zone (diffusion polarization).
The latter case is usually important when the reacting species is present in lowconcentrations in an electrochemically inert solvent. This solvent can be anelectrolyte whose ionic species are not discharged in the normal range of appliedpotentials. Since the source of reactants in this case is hydrazine azide, which ispresent in excess, there should be little or no diffusion polarization.
The preferred methods for electrode reaction studies are based on potentiostatic
tcontrolled potential) or galvanostatic (controlled current) teci.niques. In eithercase, a noncurrent-carrying reference electrodejis used to monitor potential changesat the anode and cathode separately. In the studies reported herein, a stable rever-sible reference electrode developed earlier at UARL was used.
5

AFRPL-TR-72-26
Potentiostatic devices are used to maintain a set potential between the
reference electrode and the electrode under study and provide the current necessary
to maintain this potential. The system can be rapidly scanned and it is particularly
applicable to anode polarization studies where, for example, the presence of an
oxide film or other protective films on the anode is easily detected as a plateau
in the current-voltage curves. The applied voltage in excess of the natural voltage
of the system can thus be measured in terms of the current flow through the cell.
This excess voltage may be termed the voltage loss due to reactions at the electrode
surface. Another voltage loss which may also be present near the electrode surfaceis due to pseudo-resistances that'occur because of films that form on the surface
of the electrode or the layers of non-reacting ions that may build up near the
electrode surface.*
Measurements of pseudo-resistance effects were accomplished in this program byapplying a known constant current to the cell (galvanostatic techniques). Thecircuit is opened by means of a mercury-wetted reed switch and the potential decay is
noted as a function of time using an oscilloscope as a recorder. Since transition
times for resistance effects are on the order of lO-5sec, while decay of the potentialdue to capacitance effects in the electrolyte layer near the electrode surface and/ordiffusion of reactant species requires times of the order of 10- to l - sec, both
effects are determined in the same experiment.
Descriptions of both the potentiostatic and constant current devices are
contained in subsequent paragraphs.
a. Experimental Approach
(1) Materials
The electrolytes used were propellant grade hydrazine, 77% hydrazine - 23%
hydrazine azide and two dilutions of the latter containing 12% hydrazine azide and4.8% hydrazine azide. Hydrazine with additions of 5% and 6% ammonium nitrate wasalso used.
The first set of electrodes tested were flat plate electrodes of known surface
area (approximately 2 cm2). Each was spot welded to a wire of the same material.Electrode materials used were platinum; the stainless steels, AM350, 304SS and 17-7PH;two aluminum alloys, AA11O0 and AA6061-T6; HS1414, a gold-nickel brazing alloy;
nickel; and Inconel 600. (The latter two materials were tested in 77% hydrazine -
23% hydrazine azide only).
The second set of electrodes were rods of varying diameters. They wereadjusted in the cell so that a surface area of 2 cm2 was obtained in all cases.Materials for these electrodes were the three stainless steels cited above and twogrades of graphite-pyrolytic and spectrographic.
(2) Apparatus
6

AFRPL-TR-72-26
The cell used in polarization experiments is shown in Fig. 2 (Item 1). This
cell consists of three compartments, and was designed to eliminate electrolyte
resistance effects through the use of a Luggen probe, which consists of a capillary
tube extending from the center compartment to one of the side compartments. Thus,
problems due to the wide range in conductivity of electrolytes should not effect the
results of polarization experiments. A fritted disk below the center chamber allows
nitrogen to be bubbled constantly through the solution in the cell. Three electrodes
are used: (1) the test or working electrode in the center chamber; (2) the counter-
electrode which was -always a spectrographic grade graphite rod located in one side
chamber; and (3) a saturated calomel reference electrode in the other side chamber
which fixes the potential of the electrode with respect to the hydrazine-containing
electrolyte. The solution in the cell was maintained at a constant temperature,
28°C,by immersion in an oil bath [Precision Scientific Company (Fig. 2,Item 10)
Current-voltage relationships were measured by means of a Wenking potentiostat(Fig. 2, Item 8), a Wavetek Model 116 Function Generator (Fig. 2, Item 7) and a DCOffset Device (Fig. 2 Item 6). A triangular wave output from the function generator
was fed to the potentiostat to provide the control signal between the referencingand working electrodes. The initial voltage of the triangular wave output was setby means of the DC offset device. The voltage range and sweep rate were set by means
of the function generator amplitude and frequency controls, respectively. Thepotentiostat automatically provides the current flow between the working and counterelectrode necessary to maintain the potential difference between the reference andworking electrodes. The reference ve-rsus working potential was monitored using aKiethly Model 200B Vacuum Tube Voltmeter (Fig. 2, Item 5) and the current-voltagerelationships were recorded using a Tektronix Type 536, X-Y oscilloscope using TypeG differential plug-in units (Fig. 2, Item 9). Permanent records of the traces .Teremade using a C-12 Polaroid camera assembly.
Potential-time relationships .,ere made using a regulated power supply [Dressen
and Barnes model 62-112 (Fig. 2, Item 4)] in conjunction with a decade resistor[General Radio (Fig. 2, Item 2)] to maintain a constant cell current. A mercury-wetted reed switch (Fig. 2, Item 3) was used as a triggering device for the currentoutput. The oscilloscope was used to record the voltage-time relationship using theType G differential plug-in unit for voltage, and a Type T, time base generator, plug-in unit for time.
(3) Procedure
(a) Current-voltage
The cell was filled with 40 ml of the electrolyte solution and placed in the oilbath at 28 C. The electrodes were immersed in the electrolyte to the proper depth andconnected to the potentiostat and voltmeter. The function generator was always set togive a triangular wave pattern, a span of one volt, and a frequency of 0.03 cycles persecond equivalent to a scanning rate of 400 mv/min. The initial voltage was set to therest potential of the cell using the DC offset device. Once vertical and horizontal
7

AFRPL-TR-72-26
adjustments on the oscilloscope had be2n Made, a five-minute picture was taken for
both the anodic and cathodic process.
From the pictures, po-inrs were plotted of the overpotential versus the loga-
rithm of the current density (milliamps/cm?)* provide a direct comparison of the
different electrodes and electrolyte solutions,
(b) Potential-Time
The cell was set up in the same manner as for the current-voltage runs,and-leads
were connected from the electrodes to the voltmeter and regulated power supply. The
leads from the power supply were connected to the working and counter electrodes with
polarity appropriately adjusted to make either anodic or cathode runs. Currents of
10 ma, 50 ma, 75 ma, and 100 ma were set by the power supply and a resistance box foreach of the currents used. The horizontal time control on the oscilloscope was setat 0.05 millisec/cm or less in order to give a smooth curve. The mercury-wettedreed switch assembly is provided with a time delay which first triggers the oscillo-
scope and after 0.8 milliseconds connects the power supply to the cell. Pictures of
the traces wereusing a 10-second exposure.
(c) Potentiostatic Results
(1) Preliminary Survey
The potentiostatic technique, described above, is a rapid method for deter-mining the voltage losses of a giVen electrode-electrolyte combination due to
reactions taking place at the electrode surface. Effects of the bulk electrolytesuch as electrical conductivity, are eliminated since the experiments are run very
rapidly and the pctential is measured very close to the electrode surface.
These experiren- ,s were designed to determine the best electrode-electrolytecombiniation3 in term. of voltage losses for both the anodic (oxidation) and cathodic(reduction)pr.-cesses.
The anodic polarization curves'for the eight materials and three electrolytesused in the initial studies are illustrated in Figs. 3-10. Later data obtained for
Inconel 600 and nickel in 77% hydrazine-23% hydrazine azide are shown in Fig. 11.Using the criterion that the best electrode-electrolyte combination is the one thatprovides the ,neximum current at the minimum overpotential (applied voltage) it is
possible to draw several general inferences in terms of both the electrolyte and the
electrode material. The current density achieved at an applied potential of one
volt (lOOmv) was used in order to compare the relative merits of candidate anode
materials for eacl. electrolyte studied. This data is summarized in Table II.
8

AFRPL-TR-72-2 6
With only one or two exceptions the materials fall into three distinct groups;first Pt, HS1414, Ni and graphite; second, the stainless steels (17-7PH, A4350,and 304SS) and Inconel 600; and, third, the two aluminum alloys. The first group
represent metals with good polarization characteristics as anodes in all threeelectrolytes. (The only exception to this is graphite in propellant grade hydrazine.)
The remaining two groups of metals do not appear to have good anodic properties.
This is especially true of the aluminum alloys.
With respect to the electrolyte used, the anodic polarization increases inthe order hydrazine - 23% hydrazine azide; hydrazine - 5% hydrazine nitrate; andpropellant grade hydrazine. Exceptions to this effect are noted for the polariza-tion of the aluminum alloys which show very little difference in all threeelectrolytes. (Figs. 9 & 10) It also appears that 17-7PH is less polarized in thenitrate propellant than in the azide. (Fig. 3)
The general shape of the polarization curves provides information on the effect
of the electrode surface on the electrochemical processes. The formation ordissolution of films on the electrode surface is usually indicated when current
plateaus or peaks are noted. The relative smoothness of the anodic plarizationplots in hydrazine azide and hydrazine nitrate indicates a lack of surface inhibitationof the anodic decomposition process. Slight dips exist in the hydrazine curves
for 17-7PH (Fig. 3) and graphite (Fig. 8) at an overpotential of about 500 my
indicating the formation of an intermediate species on these surfaces. A pronounceddouble oxidation peak is noted on AA6061-T6 in hydrazine nitrate (Fig. 10) indica-ting very complex reaction on this surface. The processon AAllO0 also appearsto be highly inhibited since there is a sharp break in the plots at an overpotentialof about 400 mv. The presence of slight dips in the polarization curves, even atrelatively high current densities, causes doubt as to the usefulness of the material
under study, since the film formation indicated may become more pronounced over long
periods of use.
The cathodic polarization curves for the materials studied in the threeelectrolytes are illustrated in Figs. 12-20 and include the results for nickel and
Inconel. A .summary of the cathodic current densities at an overpotential of lO00mvis shown in Table III. The data in Table III indicates that the cathodic processis in general less inhibited in hydrazine 23% - hydrazine azide than in the other two
electrolytes with the exceptions of 17-7PH (as previously noted) and AM350.
The grouping of material in a given electrolyte is much different than in thecase of anodic polarization. For instance the polarization of the stainless steelsand the aluminum alloys may now be grouped together in the case of hydrazine -23% hydrazine azide. The current densities at lO00 mv are also much higher whenthese materials are used as cathodes rather than anodes. It should also be notedthat graphite as a cathode is no better than the stainless steels, while it
9

AFRPL-TR-72-26
exhibits much smaller polarizations effects than these materials when used as ananode. Platinum, nickel, and Inconel 600 (Fig. 20) all exhibit low cathodicpolarizations.
The shapes of the polarization curves in hydrazine - 23% hydrazine azide
indicate a marked inhibiting effect at lower current densities for 17-7PH (Fig. 12)2HS1414 (Fig. 15) and graphite(Fig. 17) and a definite plateau for AAll00 (Fig. 18).
Less pronounced dips in the polarization curves are also present in the case of304SS (Fig. 13) and AM350 (Fig. 14). As mentioned above the presence of thesevariations in the polarization curves indicates that there may be soma difficultiesinvolving the long--term usefulness of these materials even though the overall polari-
zation is low.
The materials that may be useful as cathodes include platinum and, with somequalifications, 17-7PH, AM350 and 304SS. The aluminum alloy AA6061-T6 has notbeen considered since its melting point (i.e., 12000F) is probably too low for use inan engine. The aluminum alloys were primarily used in these studies for comparisonwith the precious metals and the iron and nickel base alloys. Materials withpronounced plateaus Tere eliminated since the presence of strongly adhering surfacefilms was felt to be undesirable.
As a result of the preliminary survey, further testing was limited tohydrazine-23% hydrazine azide as the electrolyte and platinum, the stainless steelsand graphite as the electrode materials. Platinum consistently exhibited the bestcharacteristics as both anode and cathode, but it is an expensive material. The
stainless steels may be good cathode materials if the surface effects noted above arenot pronounced. Graphite may be a good alternative to platinum as an anode.
The stainless steels and graphite were investigated in more detail by comparingelectrode geometry and surface cleaning effects and by using pyrclytic graphite aswell as spectrographic grade graphite. The former material has a more regularsurface than the spectrographic grade.
All materials were cleaned with fine emery paper followed by detergent cleaning,rinsing with deionized water, and air'drying.
(2) Stainless Steel: Surface and Geometry Effects
Current voltage polarization data was obtained using rod electrodes in a 23%hydrazine azide solution in the ssme manner as previously described. Comparison ofthe data between cleaned rod and flat plate electrodes show that anodic polarizationof 304SS and AM350 is similar in the two cases, but that the 17-TPH rod stock wasmuch less polarized than flat plate stock. The polarization plots shown in
10

AFRPL-TR-72-26
Fig. 21 for 17-7PH include data for the flat plate stock cleaned in the same
manner as the rod stock as described above. The initial polarization of the17-7 PH rod stock is very high up to an overpotential of about 600 mv . Followingthis point, there is an abrupt rise in current which accounts for the improved
behavior. This curve indicates existence of a passive film which is removed at
high overpotentials. Repeated runs yielded erratic results. In some casesthe passive state was retained up to overpotentials of 1200 my, while in others
a high current was obtained after 600 my. Apparently, there is a condition of
unstable passivity in this electrode-electrolyte combination which makes the
usefulness of 17-7 PH doubtful.
Cathodic polarization of stainless steel rod electrodes in 77% hydrazine -23%hydrazine azide indicates similar behavior for 304SS compared to the flat plate
stock but erratic results for 17-7 PH. The polarization on AM350 showed slight
improvement when the flat plate stock, previously used, was cleaned in the samemanner as the rod. The cathodic polarization curves for AM350 are shown in Fig. 22.
The shapes of the three curves are similar, but the rod stock indicates a limiting
current at 88 ma.
The data for AM350 and 17-7 PH rod stock was repeated many times and in mcstcases inconsiatent data was obtained. The cathodic data for AM350 varied overa fairly limited range (1.e., from 50-90 ma/cm2 at n = 1000 my) with no regularpattern. However, the anodic AM350 data fell into two distinct groups, one set atabout 17 ma/cm2 and the other at about 50 ma/cm2 . A summary of this data isshown in Table IV. Typical current-voltage curves for the two cases taken directlyfrom the oscilloscope traces are shown in Fig. 23B. Traces similar to these werealso obtained for 17-7 PH in both the anodic and cathodic case. It was found thatcleaning of AM350 prior to use could, in most cases, yield a much lower polarization,but 17-7 PH yielded inconsistent results in spite of the use of cleaning procedures.Therefore, 17-7 PH was eliminated from future studies.
(3) Pyrolytic versus Spectrographic Graphite
The anodic and cathodic polarization curves for spectrographic grade andpyrolytic graphite in 23% azide solution are shown in Figs. 24 and 25, respectively.,The anodic polarization of the two types of graphite are similar, but pyrolyticgraphite indicates a 35 percent improvement in current density at an overpotentialof 1000 my.
The cathodic polarization is extremely high for both graphites and shows adefinite "passivation" plateau in each case. (The more regular surface ofpyrolytic graphite is more strongly affected than is that of spectrographic grade.)Because of this behavior, graphite has been eliminated as a candidate cathodematerial.
11

AFRPL-TR-72 -?6
(4) Effect of Azide Concentration
The polarization curves of 304SS, AM350, platinum and pyrolytic graphitewere measured as a function of azide concentration to ascertain if there is
an optimum concentration in which polarization and conductivity effects can be
traded off. The optimization of these effects would be important in a practicalignition cell configuration where resistance effects will play an important partin determining the power necessary to achieve ignition.
The anodic polarizations of 304SS, AM350, platinum and pyrolytic graphite as
a function of azide concentration are shown in Figs. 26 through 29. The anodiccurrent densities achieved at an overpotential of 1000 my for each material at thethree azide concentrations studied are summarized in Table V. The anodic data indi-cate that the polarization of pyrolytic graphite compares favorably with platinumand that pyrolytic graphite can probably be used as an anode material in an
electrolytic cell. It is also apparent that the anodic polarization is a much
stronger function of azide concentration for platinum and pyrolytic graphite thanfor either 304SS or AM350 and that the polarization for the latter two materialsare linear functions of azide concentration. This behavior is shown in Fig. 34,which is a plot of current density at an overpotential of 1000 my versus azideconcentration.
It is also interesting to note that AM350as an anode exhibits (Fig. 27) acrossover point where the polarization is independent of azide concentration (about8 ma/cm2 atn = 700 my) and that the reaction is strongly inhibited at higher azideconcentrations at overpotentials less than 700 my.
It was also found that the anodic behavior of AM350 was considerably differentin 23% azide than previously measured (compare data in Table V with data in Table IV).The latter case was due to passivity, as previously shown in Fig. 23B. However,proper cleaning of AM350 surface using the procedure described above followed by
repeated runs yielded consistent current densities on the order of 50 ma/cm2 at=l000 my. The same anodic polarization behavior for AM350 was also observed in
12% and 4.8% azide, as shown in Fig. 23A.
The cathodic polarization of 304SS, AM350, and platinum as a function of azideconcentration is shown in Figs. 30 through 32. The cathodic current densitiesachieved at an overpotential of 1000 mv for each material at the three azideconcentrations studied are summarized in Table VI, and plots of the currentdensity data versus azide concentration are shown in Fig. 33. The data for 304SSand AM350 are almost linear functions of azide concentration. The data for platinumindicate an irregular behavior as evidenced by the extremely low value at an azideconcentration of 12%. The cathodic data for platinum at 12% azide was repeated manytimes and found to be between 35 and 40 ma/cm2 at r = 1000 my in each case. If the
12
5 j

AFRPL-TR-72-2 6
data at 12% aside is ignored, however, the slopes of linear plots for all threeelectrode materials are identical (i.e.,.z 4 ma/cm2/% azide) indicating a similarconcentration-controlled process in each case. It is apparent from the abovedata that the 304SS and AM350 are comparable to platinum as a cathode for theelectrolytic cell and that there is no optimum azide concentration below 23%. Eventhough there is some irregular behavior as a function of azide concentration, noneis beneficial. It appears that the most promising electrolyte would be 23%azide, the concentration corresponding to the lowest melting point of any hydrazine-hydrazine azide solution.
As a corollary to this investigation, an evaluation of the relative merits ofa nitrate and azide electrolyte was also made. Polarization data was obtained forplatinum, pyrolytic graphite, 304SS and AM350 in hydrazine - 6% hydrazine nitrate.This nitrate concentration is equivalent on a mole basis to a 4.8% hydrazine azideconcentration. Since the cathodic process is expected to be the same for both azideand nitrate electrolytes (i.e., the discharge of the N2H5 ion),the cathode polari-zation should be similar in both cases. The polarization for the anodic processshould be different, since the N- ion is being discharged in the case of the azideand the NO- ion in the case of te nitrate.
3The anodic polarization curves are illustrated in Figs. 25 through 38 for
304SS, AM350, platinum, and pyrolytic graphite. A comparison of the currentdensities at an overpotential of 1000 mv is summarized in Table VII. On thebasis of this data, it is apparent that the anodic polarization of all of the mater-ials except platinum is significantly different in the two electrolytes. Evidently,platinum can catalyze the reaction of both the azide and nitrate anions equallywell. The AM350 is less polarized in the azide propellant, while 304SS and pyrolyticgraphite are less polarized in nitrate.
Cathodic polarization curves for 304SS, AM350, and platinum are illustrated inFigs. 39 to 41. The current densities at an overpotential of 1000 mv are summarizedin Table VII. The cathodic polarization of AM350 and platinum were similar in bothelectrolytes as anticipated, since the N2H ion is involved in the cathodicreaction in both cases. The cathodic polarization of pyrolytic graphite was notincluded, since it has been shown to be highly polarized in all cases. Thecathodic polarization in the two electrolytes was somewhat different for 3oSS, butnot enough to rule out the likelihood that both cathodic processes are the same.
There does not seem to be any clear-cut advantage for either propellant atthese concentrations levels. No consistant pattern for N2 H 5 + and either N- orNO discharge was demonstrated by these experiments. However, it is known hatpropellants with high nitrate concentrations are quite unstable and would probablynot have an advantage over the 23% azide. (For example, a 20% nitrate solutioncould not be used in the conductivity experiments because of its rapid decompositionin the presence of platinum).
13

AFRPL-TR-72-26
c. Potential-Time Results at Constant Current
The potentiostatic current-voltage data previously discussed were obtained by
rapidly scanning over a voltage range and, therefore, primarily indicates transient
effects. This technique is most applicable to the characterization of surface
effects and provides a rapid means of surveying a large number of electrode materials.
An alternative approach, the steady-state constant-current experiment, employing
potential-time measurement at constant applied current more closely represents actual
conditions of propellant electrolysis. By measuring the rapid potential rise upon
application of the constant current and also determining the total steady-state over-
potential, it is possible to obtain data in three important areas: (a) an initial
rapid ( <10-5 sec) rise in potential corresponds to resistance effects uncompensatedby the Luggen Probe (i.e., surface resistances as opposed to electrolyte resistivity);
(b) the slope of the succeeding potential time curve yields information on the sequence
of processes taking place as the electrode-electrolyte interface is charged; and
(c) the true resistance-free total polarization at constant current can be obtained.
Potential-time measurements at constant applied current were taken for the
original eight electrode materials in the hydrazine azide and hydrazine nitrate
electrolytes. The measurements were obtained in less than 0.1 msec by rapidly applying afixed current to the experimental cell and recording the potential-time relationshipon an oscilliscope. Potential-time data was obtained at 1, 5, 10, 25, and 50 ma inhydrazine-23% hydrazine azide and hydrazine-5% hydrazine nitrate. Subsequent runswith the rod electrodes were made at 10, 50, 75, and 100 ma. The resulting maximumcurrent densities were approximately 25 ma/cm# in the azide and nitrate.
The total resistance-free polarization data at constant current was adjusted forvariation in electrode surface area. The order of preference of materials as bothanodes and cathodes is based on mv/ma/cm2 since all materials were run at a constantcurrent in spite of differences in electrode surface area. The relative order ofpreference for cathode and anode materials based cn this parameter is summarized inTable VIII and IX for azide and nitrate. The data for the anodic potential-timefunction is generally the same as the anodic current-voltage data in Table II.However, the cathodic potential-time data is considerably different than the current-voltage data in Table III. Graphite,ISl414 and the stainless steels, with the exceptionof 17-7PH, show about the same performance level at constant current. That is thecathodic surface effects previously noted on these materials do not have as mucheffect on the performance of graphite operated at steady-state while 17-7TPH is con-siderably reduced in performance compared tv the other materials tested under theseconditions. These results confirm the suspiclon that 17-7PH may become completelypassivated when used on a prolonged basis, while this effect was not noted for AM350,304SS and graphite.
14

AFRPL-TR-72- 26
Typical potential-time traces are shown in Fig. 42 for AM350, 304SS and pyro-lytic graphite in 23% azide. During anodic polarization, no uncompensated resistanceeffects were noted for any material studied in the azide or nitrate electrolytes.Resistance effects in propellant grade hydrazine were so large that it was impossibleto use this technique and obtain reliable data.
Cathodic resistance effects were noted in the case of 304SS only. In theexample shown in Fig. 42, half of the total overpotential at 100 ma (50 ma/cm2 ) isdue to uncompensated resistance. Cleaning techniques were applied to 304SS to noavail; the resistance effect was always present.
In most cases, the potential transients were found to have a simple logarithmicrelationship with time. On occasion, a curve similar to that shown for the anodicpolarization of 304SS (Fig. 42) was obtained where the initial portion of thepotential-time curve is linear. This portion of the curve may be due to chargingof the electrode-electrolyte interface or removal of species adsorbed on theelectrode surface and represents a voltage loss in addition to those due to electro-lyte resistivity and the actual electrochemical discharge of a reacting ionic species.This effect was always present in the case of the anodic polarization of 304SS andcould not be eliminated. It was found that this linear portion of the curve wassometime's present for AM350 and 17-7PH.
A series of experiments were run in 23% azide to determine the IR drop andpolarization characteristics of several materials using the oscillographic recordingtechnique. A summary of this data for both the anodic and cathodic process is slownin Table X. Experiments in which cathodic and/or anodic deposits were electrolyti-cally placed on the surface prior .to anodic and cathodic polarization, respectively,show that these deposits result in abnormally high polarizations due to the extracurrent necessary to remove these deposits before normal polarization sets in. Thiseffect is particularly evident for anodic polarization of AM350 and 17-7PH. (Theoverpotential value of 1100 my for 17-7PH shown in Table X is apparently due to acathodic deposit, even though it was not deliberately placed on the surface). Thesematerials seemed to yield inconsistent results. It is now evident that theseresults were due to the prior polarization history of the electrodes. In each casethe initial linear portion of the -otential-time curve was present when this highoverpotential was noted for AM350 and 17-7PH. However, it has been found thatplatinum, 3o0SS, both anodic and cathodic, and pyrolytic graphite during anodicpolarization only, are not subject to this prior history and are, therefore, morereliable electrodes (pyrolytic graphite as an anode only) for use in an electrolyticcell.
Constant-current total-overpotenrLal data were also cbtained as a function ofazide and nitrate concentrations and are summarized in Tables XI and XII. In general,those results confirm the current-voltage data. Platinum and pyrolytic graphite aresuperior to the stainless steel as anodes at all concentraticas, but the difference
15
______ ~-w Id

AFRP-TR-72-26
diminishes as the concentration is lowered. There is little difference between
platinum, AM350 and 304SS as cathodes; however, based upon the equilibrium dataplatinum is best at both 12% and 4.8% azide. This latter data does not confirm the
current-voltage results which show high platinum polarization at 12% azide, but theconstant current data is considered more reliable for the purpose of designing allelectrolytic cell.
The polarization data for the 6% nitrate and the 4.8% azide is summarized inTable XII for a constant current of 50 ma (25 ma/cm2 ). The cathodic polarizationis similar in both electrolytes for Pt, 304SS,and AM350, but the data for pyrolyticgraphite indicates a somewhat higher polarization in hydrazine nitrate. The latteris not surprising, since the cathodic process on graphite has always been highlyinhibited. It is possible that both azide and nitrate are preferentially adsorbedon the graphite surface or even react chemically with the graphite. The cathodicprocess is expected to be the same in both cases since both electrolytes containthe N2H! ion.
The anodic data indicates a large polarization difference in the two electro-lytes for both platinum and pyrolytic graphite. The anodic process for 30hSS andAM350 is similar for both electrolytes, indicating that the anodic process in thiscase is independent of the anodic species involved in the reaction or that only oneanodic species is Dresent in both electrolytes.
The above anodic data does not correspond to the current-voltage results summ-arized in Table VII. In the latter case, the anodic polarization of platinum wasalmost the same in azide and nitrate, while the rest of the electrodes indicatedlarge anodic differences.
The polarization studies indicated that materials such as platinum and graphiteare only slightly polarized when used as anodes and that 304SS and platinum are onlyslightly polarized when used as cathodes. All other materials either indicated ahigh polarization or, under certain circumstances, were passivated. It was alsodetermined that the lowest polarization effects were achieved when the 775 N2114-23% N5H5 was used as the electrolyte.
Since heat production is a function of the decomposition products of theelectrolysis reaction, electrolysis experiments were performed to determine thecomposition of these products as a function of tne electrode material used. Thefollowing section describes these experiments.
3. ELECTROLYSIS A14D PRODUCT ANALYSIS
Electrolysis experiments were performed using a dual-column chromatograph toanalyze gaseous and liquid products from both anode and cathode compartments forspecially con3tructed cells. On the basis of this product analysis, the relativeproportions of nitrogen, hydrogen, and ammonia were determined.
16

AFRPL-TR-72-26
The electrochemical reactions for the decomposition of hydrazine azide (N5H5 )may be written as follows:
Ionization of N5H5 :
N5H5 N2H5 + N3 (i)
Anode:
2N3 -> 3N2 + 2e- (2)
Cathode with no NH3 decomposition:
2N2H5+ + 2e-* 2NH3 + N2 + 2H2 (3)
Cathode with complete NH3 decomposition:
2 N2H5+ + 2e 4 2N2 + 5H2 (4)
Overall with no NH3 decomposition:
2 N5H 5s4 2NH 3 + 4N2 + 2H2 (5)
Overall with complete NH3 decomposition:
2N5H5 -* 5N2 + 2 (6)
A generalized overall reaction for the decomposition of N5H5 me.y be written as:
2N5H5 -* 2(1 - x)NH 3 + (4 + x)N2 + (2 + 3x)H2 (7)
where x is the fraction of NH3 decomposed. This equation is analogous to thegeneralized N2H decomposition reaction which is:
3N2H4 4 4 (l - x)NH3 + 6x H2 + (1 + 2x)N2 (8)
The difference between the two decomposition reactions is the cathodic discharge of+the N2H5 ion in N51'5 which requires the formation of H2 in all cases, even ifthere is no catalytic decomposition of NH3. For N2H the overall reaction can yieldNH3 and N2 as the only products.
These equations indicate that four moles of gas should be formed per Faradaypassed (assuming 100 percent Faradaic efficiency) if no ammonia is decomposed.This case corresponds to a 2/1 ratio of N2/H2 . Five moles of gas will be producedper Faraday if all the ammonia is decomposed, corresponding to a 1/1 raiio of 112 /H2.
117

AFRPL-TR-72-26
Reactions other than those above can be written. J. J. Lander has postulated a
large number of possible reactions for the electrolytic decomposition of hydrazine,
hydrazine-water, hydrazine-hydrazine nitrate, and hydrazine-hydrazine azide in aseries of three reports (Refs. 3 - 5). Some of the more attractive reactions in
Ref. 5, involving hydrazine-hydrazine azide mixtures, are as follows:
N H -> N H + 3/2 N2 + 1/2 H (9)
where the cathodic reaction is:
N2 H4H + + e 1/2 H2 + N2H4 (10)
and
2N5H5 - 2NH3 + 3N2 + N2H4 (11)
where the cathodic reaction is:
N2H H+ + e - NH3 + 1/2 N2H (12)
In the above reactions (9 and 11) the total moles of gas per Faraday would
be 2.0 for the case where hydrogen was the only cathodic product, corresponding toa 3/1 N2/H2 ratio and 2.5 for the case where ammonia is the only cathodic product
and is not further decomposed. If all the NH3 is decomposed the total number of
moles per Faraday would be 3.5 corresponding to a 1.33/1 ratio of N2 /H2. Thus allthe more practical reactions that involve the direct electrolysis of azide resultin a total of more than one mole of gas per Faraday and N2/H2 ratios in excess of one.
If it is assumed that the reactions that take place are primarily due to thehydrazine (and water contained in the propellant) and that the azide ion is notdischarged, but only provides high electrical conductivity, then the following
reactions may be used:
Anodic
N2 H + 40H--> N2 + 4H20 + he (13)
Cathodic 4H20 + he -- 2H2 + 40H- (.4)
Overall N2H -> 2H2 + N2 (15)
The total moles per Faraday is only 0.75 and the nitrogen/hydrogen ratio willbe 0.5.
a. Experimental Approach

I
AFRPL-TR-72-26
(1) Materials
Rod type electrodes of stainless steel and graphite and flat plate platinumelectrodes previously described were used in these experiments.
In addition to the test electrolyte, 77% N2H4-23% N5H5 several standard
solutions were used to calibrate the chromatograph. These were: hydrazine, hydrazineplus 1%, 5%, and 10% water; and hydrazine plus 1%, 5%, and 10% ammonia.
(2) Apparatus
The cell used for electrolysis is shown in Fig. 43. It consists of twocells joined by a glass frit (Fig. 43, Item 5), each cell having a gas inlet (Fig. 43,Item 8) located at the bottom. A rubber septem (Fig. 43, Item 4) for taking liquidsamples, a reference electrode (Fig. 43, Item 3), and a working electrode (Fig. 43,Item 2) are fitted into the three openings of each cell. Lines from anode andcathode compartments of the cell are connected to a chromatograph by means of aspecial valving system. This system permits gas samples to be taken from onecompartment while the other compartment is being vented.
The gas chromatograph used in these tests (Fig. 44) wa developed at UnitedAircraft Research Laboratories and consists of two adsorption columns connectedin series. One column separates gaseous ammonia, water, and hydrazine. The othercolumn separates the permanent gases - H2 , N2 , and 02.
The carrier gas used in this chromatograph is 91.5% He - 8.5% H2 at apressure of 50 psig and a flow rate of 170 cc/min. The carrier gas flows through aheat exchanger coil which serves to equilibrate its temperature with that of the hot-wire detectors before flowing through the reference chambers. From there the carriergas flows through a heated inlet which is used to vaporize liquid samples and thenthrough a 10 cc sample lrp section of an automatic gas sampling valve(Beckman 102396).The sample is swept thrcgh the first column maintained at a temperature of 110-115 C.At this temperature, H2 , N2 , and 02 are not retained, while ammonia, water, andhydrazine are separated in that order. Each component gives rise to a separatepeak on the recorder corresponding to the output of the first detector.
After the gases have emerged from the sample side of the detector, they entera second column which separates the H2 , 02, and N2 into its components at 30-32 C.
. The oven (Fig. 44, Item 1) is a Blue-M model OV8A modified with a circulatingfan and a themistor-Triac-IC temperature controller.
The control unit of the chromatograph (Fig. 44, Item 2) consists of a powersupply and attenuators for the detector output. The recorder is a Hewlett-PackardModel 7100 B dual-pen strip chart recorder with built-in integrator.
19
__________ A

AFRPL-TR-72-2 6
A Kiethly Model 600 B vacuum tube volt meter is used to measure restpotential of the cell and operating potential during electrolysis. The power supply(Harrison Labs Model 6201 A) provides a constant current to the cell in conjunctionwith a General Radio decade resistor.
(3) Procedure
Calibration curves for liquid and gas samples were obtained using standardsolutions for liquid samples and flowmeter calibrations for gas samples.
For any liquid a one microliter sample was taken with a Hamilton microlitersyringe and injected into the ru-r septum of the heated inlet; the plunger wasdepressed and withdrawn after five seconds. The peaks were recorded on the striPchart recorder and peak heights or areas calculated. Gas samples consist of mixturesof either nitrogen or hydrogen and the helium-hydrogen carrier gas.
In taking a gas sample, the gas mixtures were passed through the cellvalving system (Fig. 40, Item I) and then through the 10 cc sample loop section ofthe automatic gas sampling valve. The sample switch on the chromatograph controlunit opens the sample loop to the chromatograph. Peaks corresponding to nitrogen,hydrogen and ammonia are recorded, and areas and peak heights are calculated.Calibration curves were constructed by plotting the known percent of water, ammonia,or N2 and H2, versus peak height and peak area.
During actual test operations, each compartment of the cell was filledwith 20 ml of 77% hydrazine - 23% hydrazine azide. The electrodes were set inplace and lines were connected from the valving system to the cell.
First, a liquid blank sample was taken with the microliter syringe. Thehelium-hydrogen carrier gas was then bubbled through the cell in order to remove allair. Gas samples from the cathode compartment were taken by means of the automaticgas sampling valve until the nitrogen and oxygen peaks had gone down sufficientlyto insure replicate runs. The last run before electrolysis was the cathode gasblank. Leads were then connected from the power supply and voltmeter to theelectrodes, and rest voltages for anode and cathode were recorded. A current of30 ma with a resistance of 200 R was set by means of the power supply. After theonset of electrolysis, gas samples from the cathode compartment were taken at 10minutes, 25 minutes, and 40 minutes and from the anode compartment at 55 minutes,70 minutes, and 85 minutes. Then, liquid samples were taken from anode and cathodecompartments just prior to termination of electrolysis. Cell voltages duringelectrolysis were also recorded.
The percents of ammonia, nitrogen, and hydrogen for blank and electrolysisruns were determined from the calibration curves. From these results, the percentincrease for each component was found and the total percents of ammonia, nitrogenand hydrogen produced were determined. This procedure was followed for each of thefollowing electrodes: platinum, pyrolytic graphite rod, 304SS rod, and AM-350 rod.
20

AFRPL-TR-72-26
b. Results
The gas analysis and the polarization of each electrode couple are summarizedin Tables XIII and XIV, respectively. The gas analyses show that the value for thefraction of ammonia decomposed, x, using the equations derived earlier in this sectionis zero for 304SS, AM350, and pyrolytic graphite, and is unity for platinum. Therelative proportions for H2, N2 , and NH3 (where applicable) are in good agreementwith the values predicted using the overall azide reaction (7). Apparently platinumcatalyzes the thermal decomposition of NH3 while the remainder of the materials donot. The total over-potentials (Table XIV) using identical materials for bothanode and cathode indicate that platinum would be the best electrode material. Ifplatinum were excluded, the best electrode couple would be pyrolytic graphite as ananode and 304SS as a cathode for a total cell voltage of 1.01v at 30 ma/cm2 . Ifplatinum were used as a cathode with a pyrolytic graphite as an anode, the totalpclarization would be 0.97v.
The differences in potential between the Pt couple, and 304SS as a cathodewith graphite as an anode are not large enough to be significant. The choice ofelectrode combinations using these three materials must be bnsed on physical andcorrosion characteristics in actual use as the electrodes in aworK±ing device:
The heat release will be the highest if 304SS is used as a -athode andplatinum or graphite as an anode since these combinations provide the lowest over-potential and the largest proportion of amonia during electrolysis.
21

AFRPL-TR-72-26
SECTION IIIPHASE II - DESIGN AND OPTIMIZATION OF THE ELECTROLV.I'C CELL
The most promising electrode materials and propellant compositions selectedas a result of the electrochemical measurements of Phase I were studied further in
Phase II. These are Platinum, Pyrolytic graphite and 304 stainless steel as
electrode materials and 77% hydrazine-23% hydrazine azide as the propellant. The
objective of this second (and longest) phase of the experimental program was to
design an engine/electrolytic cell combination that would provide rapid ignition,
require low power input, and yield high combustion efficiency
The design goals for the electrolytic engine as stated in the contract were:
(a) chamber pressure during steady state +6%(b) ignition delay 50 msec (max)
(c) tail-off 25 msec(max)(d) chamber pressure 40-200 psia
(e) cold start 40 F(f) characteristic velocity 4000 ft/sec(g) mass flow rate 1-4 x10⁻⁴ lbsisec(h) thrust level 20-80 millipounds
Ignition delay is defined as the time required to go from 10 of equilibriumchamber pressure to 90% of equilibrium pressure. Tail-off is defined as the timerequired to go from 90% of equilibrium chamber pressure to 10% of equilibriumchamber pressure. The cold start temperature is defined as the initial bed(electrolytic cell) and propellant temperatures which are the same unless otherwisespecified.
In order to meet these objectives, the experimental program for the second
phase was devoted to: (1) preliminary measurement of heat release using differentelectrode combinations with the hydrazine - 23% hydrazine azide propellant, and the
evaluation of the compatibility of several materials with the azide propellant,(2) the design of several different electrode configurations, (3) the incorporationof these designs into an engine-like device for testing, and (4) preliminary testing
of each design for the evaluation of the power required, the sequence of fuel injec-tion and power application, the combustion efficiency achieved in each device, and theeffect of propellant temperature. Also included in item (3) were the evaluation ofthermal beds and the use of catalysts in conjunction with these electrode designs.
The following paragraphs summarize the results of these studies which led toan optimum engine design that would be applicable to an extended testing cycle.
1. PRELIMINARY EVALUATION OF HEAT RELEASE AN4D MATERIAL COMPATIBILITY
a. Heat Release as a Function of Electrode Material
In order to evaluate the electrode materials in terms of heat release, hydrazine-
22

AFRPL-TR-72-26
23% hydrazine azide was electrolyzed at high currents in an insulated (lucite) cellhaving a capacity of 10 cc and an electrode spacing of 1.4 cm. Heating rates andpolarization characteristics were determined for the following electrode combina-
tions at cell currents up to 8 amps (i.e., up to 1 amp/cm2 ):
Anode Cathode
Graphite Platinum
Graphite 304S3Graphite Graphite
Platinum 304SSPlatinum Platinum
The tests run with this cell were designed to determine the relative heating
i efficiencies of the above electrode combinations and to determine the relativecontribution of N5H5 decomposition heating and of resistance heating in the cell.
The cell configuration was such that large resistance effects were present. Polar-ization data was acquired in order to determine possible interaction between theanode and cathode processes under physical conditions much different from those
used in the earlier electrode polarization studies. These interactionscoupled with the much higher current densities to be used in a practical cell design
would influence the ultimate selection of electrode materials for the electrolyticdecomposition engine.
The heating rates, as determined by the temperature rise of the electrolyte,for the various electrode combinations at a constant electrolysis current of 6 ampsare illustrated in Fig. b5. Even though these rates do not begin to approach thoserequired for a practical ignition system, the relative rates are extremely importantin determining the proper electrode combinations to be used in a practical cell
design. It is apparent that the most rapid heating is achieved when platinum isused in the cell. The platinum-platinum combination appears to yield the bestheating rates, but shows little advantage over the platinum-304SS or graphite-platinum combinations.
The possibility was considered that the difference in heating rates illustratedin Fig. 45 might be due to the difference in the heat capacities of the materialsused. Platinum has a heat capacity of 0.03 cal/g/OC as compared to 0.12 cal/g/oCfor 304SS and 0.25 cal/g/°C for graphite. The electrodes used were 0.005 in. thickplatinum foil weighing about 3 grams, 0.05 in. thick 304SS weighing about 18 grams,and 0.125 in. thick graphite weighing about 17 grams. Thus the total cal/0 C requiredfor each of the electrodes used is 4.2, 2.1, and 0.09 for graphite, 304SS andplatinum, respectively. Since the Pt-C, Pt-3OhSS and Pt-Pt combinations showa similar heating rate, it is difficult to ascribe the differences to heat capacityeffects. Therefore, electrolysis efficiency appeared to be a major considerationin the rate at which the electrolyte is heated.
23

AFRPL-TR-72-26
The heat released due to hydrazine azide decomposition is based on a calculatedvalue of 619 cal/gram N5H5. Chromatographic analysis was used to determine theamount of hydrazine azide consumed during each run. These results were then usedto calculate the amount of heat that should have been released by electrolysisof that amount of hydrazine azide. The efficiency of the electrolytic processcdn also be determined by comparing the analytical results with the amount ofN5H 5 that should have been decomposed using a value of 1290 ampere-seconds/g N5H5,and assuming a 100 percent current efficiency. This value is based on reactionsconfirmed by electrolysis at low currents as reported in Section II of this report.The heat release data is summarized in Table XV. The current efficiency of thedecomposition process is also included in this table. In the cases where Pt wasused for both electrodes or where the Pt-C combination was used, an apparentor indicated efficiency on the order of 400 percent was achieved. Much lowerefficiencies were achieved for the other combinations, the worst case being C-C.
12R heating was calculated from the IR voltage drop for each electrode-combina-
tion at the current levels studied. These values, expressed in calories, are also
include in Table XV. In each case where platinum was used, the I2R heating was of
the same order of magnitude as the decomposition heating - about 50 percent of the
total heat evolved. Thus the real heating efficiency for N51 decomposition is
about 50 percent. The trends should be enhanced when a cell configuration is used
which more closely approximates an actual engine configuration. That is, the heating
efficiency should increase in a smaller cell and the 12R losses should be decreased.
The polarization characteristics of each electrode combination are summarizedin Table XVI. The resistance-free polarization, polarization due to IR drop andthe total polarization are tabulated for each electrode and for the whole cell.The IR drop is 60-80 percent of the total polarization of the cell. Thus,the major factor in reducing power requirements is minimization of this effect.For an electrode gap of 0.040 in. (0.1 cm) and a surface area of 5 cm2 the resistanceof the cell will be about 0.1 ohm rather than the 0.9 to 1.2 ohm experienced inthe large cell. Since the IR drop can be adjusted by adjusting cell dimensions,the most important parameter remaining is the IR-free polarization of the cell.For convenience, the IR-free polarization of each electrode combination is summarizedin Table XVII. The experimental results (as shown in Table XVII) indicate that thePt anode-304SS cathode is the electrode combination which experiences the least electrodepolarization as a function of cell current. It appears that in a cell with closeelectrode spacing, as opposed to the larger cells used in the polarization studiessummarized in Section II of this report, there is a large interaction between thetwo electrodes. This interaction is magnified at higher currents. The resultsindicate that the electrochemical restrictions on this system are different than
24

AFRPL-TR-72-26
those concerned with heat production, and a trade-off exists between the electrodecombination that yields the maximum heat output (Pt-Pt) and the combination thatrequires the least power as a function of current (Pt-304SS). The Pt-304SScombination appeared to be the most attractive since its heat output is not much
lower than that for Pt-Pt.
Thermodynamic calculations were also carried out in an attempt to predict thepower necessary to raise the electrolyte (propellant) to the self-ignition temperatureof approximately 900 F. According to the equation for the decomposition of hydrazine
azide:
2N5 H5 . 2( 1 - x) NH3 + (4 + x) N2 + (2 + 3x) H2
(where x is the fraction of NH3 decomposed) the heat release on decomposition ofazide will be 46.4 kcal/mole if x = 0 and 35.4 kcal/mole if x = 1. The theoreticalheat output will thus be 619 cal/g of N5H5 decomposed assuming no NH3 decomposition.The heat necessary to bring the propellant temperature from ambient to 900 F isestimated to be 495 cal/g. This value is based on the heat capacity of hydrazinesince heat capacity data is not available for the 77% hydrazine-23% hydrazine azidemixture. The heat necessary to bring one gram of propellant to 900 F is equivalentto the passage of approximately 0.800 Faradays/mole or 1,030 amp-sec/g through thecell. This reauirement may also be expressed in terms of power needed using theconversion factor that 860 cal is equivalent to one watt-hour. Thus, 0.52 w-hrs/gis required to heat the propellant to 900 F.
This power requirement does not take into account any resistance heating andis based on standard heats of formation at 298 K so that it does not reflect the
additional heat produced as the temperature increases. Also by using small cellvolumes, it is possible to reduce the actual power to levels about a factor of 100
less than that given above, (i.e., about 180 watt-sec).
b. Material Compatibility
Besides evaluating materials for use as electrodes for the electrolyticprocess (Phase I), it was also necessary to evaluate the compatibility of materialsto be used for other engine parts. In this case materials that indicate a highpolarization using the hydrazine- hydrazine azide propellant are desirable.
The ability of a material to accelerate or retard the decomposition ofhydrazine- based propellant on its surface can be measured electrochemically bydetermining the equilibrium rate of decomposition on an electrode surface duringlong-term, steady-state measurements. Potentiostatic techniques, previously describedcan be used for these measurements. During these measurements is it also possibleto estimate the rates at which metals or alloys are dissolved in the propellant.
25

AFRPL-TR-72-26 .
This technique has been used with propellant grade hydrazine with results that compare
favorably with longer term gas evolution data.
Equilibrium polarization data as opposed to fast voltage sweeps have been
obtained for platinum, pyrolytic graphite, 3ohSS, AM350, and 17-7PH in the tempera-ture range 27-107 C ( 1-225 F). The linear portion of the log i versus overpotentialplots at high overpotentials were extrapolated to zero overpotential to obtain the
catalytic decomposition currents for each material as a function of temperature.Since it has been established that one Faraday is requirel to decompose one mole of
N5H5 it is possible to calculate a decomposition rate .n terms of weight per unitsurface area per unit time for each combination of variables. The data thus obtainedis summarized in Table XVIII.
Data for the decomposition rate for propellant grade hydrazine is alsoincluded for comparison in Table XVIII. It will be noted that the decompositionrates on Pt and graphite are about an order of magnitude greater for the azide thanfor propellant grade hydrazine. However, the decomposition rates on the stainlesssteels (which may be used for construction material) are not very different in thetwo propellants.
The validity of this method was established by comparing the UARL results(where possible) with literature values of decomposition based on long-term gasevolution data. This comparison is shown in Table XIX, where Ref. 6 and 7 arethe UARL data. The general agreement is quite good with the exception of theAu-Ni brazing alloy where the UARL data is about an order of magnitude greater thanthe literature value obtained in Ref. 9.
The decomposition rates were plotted against reciprocal temperature and theslopes were used to calculate the activation energies. The anodic plots yielded a,.-good straight line function for 304SS, 17-7PH platinum, and pyrolytic graphite,but erratic results were obtained for AM350 at higher temperatures.. The erraticanodic behavior of AM350 is consistent with previous experience with this alloy.The cathodic plots were all reasonably good straight line functions. The values foranodic and cathodic activition energies are summarized in Table XX. Anodicactivation energies derived from previous measurements in propellant grade hydrazinein the temperature range 120-140 F are included in Table XX for comparison. Theactivation energies are consistent with the anodic and cathodic polarizationresults reported in Section II of this report and are surprisingly low for thecathodic process (with the exception of 304SS). The anodic activation energies arealso very low for platinum and pyrolytic graphite. The "catalytic" effect ofplatinum and graphite in hydrazine azide and the lack thereof on 30 4SS suggestthat the latter may not be the best cathodic material to use in the electrolyticcell but is a good candidate as a material for other cell parts. The compatibilityof the azide does not appear to be much worse than that of propellant grade hydrazinefor the stainless steels, indicating that materials used for engine constructionwith hydrazine as a fuel may also be practical for use with hydrazine azide.
26

AFRPL-TR-72-26
On the basis of qualitative results for the dissolution of metals in hydrazine
and hydrazine-hydrazine azide it appears that the stainless ste4ls' and" nickelare attacked and form a pink to red colored complex in hydrazine-based propellants.This is only trueif they are used as anodes however. Analysis of the solutionsafter electrolysis has shown that nickel is preferentially dissolved from the stain-less steels and is the cause of the pink to red color. This effect is not noted ifthe material is used as a cathode. The same results were obtained when Inconel 600was used as a cathode. It thus appears that the stainless steels and Inconel 600can be used as construction materials in the engine provided they are not exposed toanodic currents.
Heating rates as a function of electrode material appear to be maximized whenthe Pt-Pt combination is used for both anode and cathode% however, the platinum-graphite and platinum - 304SS combinations also indicate good heating rates whenplatinum is used as the cathode in this first case and as an anode in the second.
Polariiation characteristics are such that the platinum-304SS combination
requires the least power. However, the differences between the heat output axia powerrequirement is not that much different for the two combinations. The pl'atinum-graphite combination requires more power than the other combinations mentioned above
and will not be further considered.
The material compatibility studies hav' shown that the stainless steels andInconel 600 react similarly in the presence of both neat hydrazine and the 77ohydrazine - 23% hydrazine azide propellants. The more active mate.'ials such asplatinum indicate propellant decomposition rates in the presence of the azide pro-
pellant at least an order of magnitude greater than in the presence of neat hydra-zinc. Inconel 600 and 304SS will probably be satisfactory materials of constructionprovided they are not exposed to anodic currents. This condition can be achievedif the chamber and nozzle are connected to the cathode side of the electrolytic cell.
2. ELECTRODE CONFIGURATIONS AND PRELIMINARY ENGINE DESIGN
a. Electrolytic Cell Design Requirements
Design concepts for several electrode configurations were generated prior tofabrication of an electrolytic cell. All the configurations were designed to fulfillcertain basic requirements that were felt to be necessary to achieve rapid and sustainedignition. These requirements were:
(1) a large ratio of electrode surface area to propellant voliune(2) immediate and uniform dispersion of the propellant through the volume
between the electrodes
(3) maximum thermal insulation of the cell from the engine body(It) a finite and steady pressure drop across the electrode chamber
The maximum current per unit of applied voltage will flo!w" through a cell ofminimum electrode spacing. Maximum electrode area results in a low effective current
27

AFRPL-TR-72-26
density (i.e., low polarization) for a given current flow. A cell design that willsatisfy those requirements will result in aminimum power requirement from both theelectrochemical and thermal aspects of the ignition process since the amount of heat
released depends on the amount of flow per unit time, and the heat required to achieveignition is minimized at low propellant volumes. Therefore, propellant volume mustbe limited in accord with achievable electrode current densities and attainableelectrode surface areas. It is also evident that the amount of metal in the electrodemust be kept small to avoid an additional undesirable heat sink. Utilization of finewire screens or other large-surface structures that can be closely spaced is thereby
indicated. Isolation of the electrodes from the body of the engine is also necessaryin order to minimize heat loss due to conduction.
To- prevent flooding of one region of the electrolytic cell and starving ofanother, it is necessary to ensure a uniform distribution of propellant across the
entering face of the electrode structure. Uniform dispersion makes most efficient
use of available electrode surface area and contributes to a smooth flow of propellantthrough the electrcde structure. These factors afford the possibility for most rapid
propellant ignition. Uniform propellant distribution can be enhanced through the useof a poious matrix that is also an insulator. Dispersion may also be accomplishedwith porous metal plates which act as part of one or more electrodes.
In order to provide suitable, steady flow rates of propellant under desired fluid
driving pressures it is necessary to control the overall porosity of the electrode
structure. This can be regulated by the choice of mesh and gauge sizes for electrodes,insulators, etc. Open-gas passages through the electrode structure must be sustainedat all times in crder to prevent the blowing out of raw fuel with the out-rushinggases. Both these design critiera should provide a steady-state back pressure thatwill provide smooth combustion of the propellant.
b. Basic Electrode Configurations
Several electrode configurations were designed and constructed. Four of theseconfigurations are illustrated in Figs. 46-49. In the electrode configurations shown,electrode surface area was kept high and electrode bulk was minimized by using finescreens and wires and hollow tubes.Spacing between the electrodes was kept to a mini-mum. Electrical insulating materials were used to insure positive separation ofelectrodes, as well as to help limit the volume of entrained propellant. In the firstconfiguration, Fig. 46 fine metal screer or thin metal felt was spirally coiled withglass cloth interlayers. In the second configuration, Fig. 117, small-gauge platinumwire which served as one electrode was isolated by a fence of fine ceramic rods from
a hollow nickel tube which served as the other electrode. In addition, a glass linerwas used to minimize heat loss to the outer metal shell in this configuration.
The third electrode configuration, shown schematically in Fig. 48comprised 100-mesh nickel screen electrodes which were flame sprayed with porous alumina. Thealumina insluation was found to be very adherent and did not spall when the screenswere bent. A small piece of nickel metal'felt 0.020 inch'tnick was pressed intothe lower screen and was positioned directly over the fuel inlet tube. The felt bhusforces the fuel to spread in a horizontal plane as it enters the electrode assembly.
28

AFRPL-TR-72-26
A stacked screen oi parallel plate configuration using alumina insulators isillustrated in Fig. 49. The fuel dispersion configuration (lower left-hand corner
of the figure) is basically the same as that used previously (Fig. 48). However,the plate configuration has the advantage of ease of construction as well asproviding a simple means of varying bed length by using plates of different lengths.
The electrodes may also be connected in series and parallel combinations to accomo-date various available voltages and current requirements.
c. Preliminary Engine Design and Testing
(1) Coiled Screens
Initial evaluation of the design concepts was performed using the coiledscreen concept shown in Fig. 46. The test engines incorporating variations of thecoiled screen concepts are shown in Figs. 50 and 51 and are designated CS-l, CS-2TB,and CS-3.
Platinum screens were used in combination with glass cloth insulation ir thefirst of the three engines (CS-l). In the second and third engines, nickel screens
were used with Refrasil cloth. The design of the second (CS-2TB) engine differedslightly from the others in that provisions were incorporated for a packed granular
bed immediately after the electrolysis chamber. Its function was to serve as athermal bed to enforce the complete decomposition of fuel droplets or vapors shouldthese get beyond the electrolysis chamber. The third engine, CS-3, differed in that
the cloth insulation was che ]ly pre-treated with partially reduced molybdenumtrioxide and ruthenium metal. These catalytic materials were used to study therelative effects of treated and non-treated cloth insulators on the ignition proper-
ties of the.propellant.
In order to perform ignition tests on these engines, it was necessary to
construct a propellant delivery system, provide for automatic data acquisition andprovide power to the electrolysis unit. The propellant delivery system is shown inschematic form in Fig. 52. Propellant is delivered by means of nitrogen pressure.Flow rate is monitored using a calibrated sight glass. The volume of this devicewas sufficient for several seconds of running time and was reloaded from the fueltank between runs. All materials in the system were 304SS, glass or nylon tubing.Two filters are used to protect the inlet tube to the engine. The latter had an IDof 0.023 in. or 0.010 in. depending on the engine use. The upstream filter was capableof removing particles down to 70 microns in diameter and the downstream filter waseffective down to 10 microns. The solenoid valve was especially designed forcontinuous duty for hydrazine and operates from a 28 volt-DC supply. All data wererecorded on a Visicorder equipped with seven input channels. These input channelswere used to record chamber pressure, engine current, engine voltage, chamber andouter wall temperatures and solenoid valve actuation (i.e., time of propellant flow).A 40-volt, 10 amp D.C. power supply was used to provide power to the cell. In allconfigurations, the body of the engine was the electrical connection for the cathode,
29

AFRPL-TR-72-26
and the fuel inlet was the electrical connection for the anode. The fuel delivery
system, engine mount and data recording system are shown in Fig. 53.
The first successful engine ignition was achieved using the electrode configura-
tion shown in Fig. 46 which was incorporated in engine CS-1 (Fig. 50). Current,
'voltage, and chamber pressure were recorded on a high-speed visicorder, but for
these tests no provision was made for internal temperature measurement. In order to
effect rapid vaporization of the propellant, voltage was applied to the cell priorto initiation of propellant flow. For the first test, an applied potential of 5
volts was chosen. About 30 sec after initiation of propellant flow, the current
rose to 8 amps (40 watts). At this point, hydrazine vapors were seen at the
engine exhaust. The voltage and propellant flow were terminated and the system was
held in this condition for 2.5 minutes. Voltage was again applied by slowly raising
the voltage from zero in 0.5 volt steps, but in the absence of propellant flow. At
2v the current rose suddenly to 4 amps (8 watts) and ignition occurred. Ignition
was sustained for about 30 sec until all the residual propellant in the engine was
exhausted. During ignition, the chamber pressure rose rapidly to 80 psia followed
by a slower, rise to 110 psia. Because ignition occurred in the absence of propellant
flow, it was not possible to determine the true mass flow rate. The delay in igni-tion after the initiation of propellant flow was probably due to flooding of the
internal structure of the electrode assembly. The onset of ignition after a "soaking"
period was probably due to a redistribution of the propellant in the electrode
structure so that maximum vaporation could occurcoupled with the fact that the engine
was, in effect, preheated by the initial power application.
A second set of engine tests were run using the original electrode configuration
but with the following modifications:
(a) A screen was added to the top of the electrode assembly just below the
combustion chamber since some glass cloth was injected into the throat during the first
test.
(b) A glass (later nickel) porous plate was inserted at the inlet, or lower
side of the electrode assembly, to help disperse the fluid flow (and thus prevent
flooding).
This new configuration was tested and short ignition bursts were achieved, but
a major problem was encountered through improper control of propellant flow which'
alternately flooded and starved the cell. Flooding was associated with ejection of
vapor from the throat followed by good vaporization which resulted in ignition
followed by ignition cut-off and then a repeat of the flooding condition. The short
ignition periods were encouraging because they were accompanied by rapid pressure
rise. The power requirement for this configuration was 16 watts (2v at 8 amp).
30

AFRPL-TR-72-26
Another series of tests was run using the platinum wire configuration of Fig. 47which was designed to elimiinate construction problems with the screen and glasscloth. The performance during these tests was similar to the second series of tests(described in the preceding paragraph) indicating that this configuration also hadproblems due to inadequate control of propellant flow. Since the coiled screenconfiguration used in the earlier engine test was simpler to construct, the platinumwire configuration of Fig. 47 was not used in subsequent tests. Tests were alsoconducted with an engine comprising a coiled screen electrolytic cell followedby a thermal bed composed of alumina granules (engine configuration CS-2TB, Fig. 51).It was determined that the use of a thermal bed (alumina granules) in engine CS-2TB (Fig. 48) did not significantly improve the performance of this general type ofengine. It was also noted that thers were no differences in performance when eithernickel or platinum screens were used.
As these preliminary tests progressed, it became more apparent that ignitionwas instantaneous only when the engine was in a pre-heated condition (in excess of200 F). This heat was probably derived from prior electrolysis or a previousignition that had been slowly achieved. In a new engine configuration (CS-3,Fig. 47) it was then demonstrated that instantaneous ignitions could be obtained atroom temperature if the glass cloth insulation used in this configuration was pre-impregnated with a partially reduced form of molybdenum trioxide or the incorporationof other catalytic materials such as ruthenium metal. (The amount of metal added wassufficiently small that the cloth retained its electrical insulating properties).Under these circumstances no ignition occurred without power on; delayed ignition(1-2 secs) occurred if power was turned on after the bed was pre-soaked withpropellanu; instantaneous ignition occurred when power was turned on before orsimultaneously with propellant flow. The burn continued in all cases after powerwaE turned off as long "a§ fuel was supplied.
Preliminary data was also obtained on C* versus propellant flow for engineconfiguration C-3. This data is summarized in Table XXI, and is shown graphicallyin Fig. 54. It will be noted that C* appears to approach a maximum at about
2 x l0-4' lb/sec propellant flow, which corresponds to a 40 millipound thruster.
The ignition delay and tail-off for the preceding engine designs were very long.Ignition delays were on the order.of 200-300 milliseconds (Table XXI) whereas tL- .
target was 50 milliseconds. In general, the performance was encouraging, but theseengine designs were such that maximum c6mbustion efficiency could only be obtainedat low mass flow rates and correspondingly low thrust.
The use of coiled screen concepts resulted in several difficulties. Shorting ofelectrodes became a common problem due to distortion of the entire assembly athigher temperatures. It was also found that only the lower part of the coils nearthe inlet were effective electrically since almost all the heat was produced in thislower zone. The remainder of the coils functioned more like a thermal bed. The useof high surface area was negated by the fact that the only effective current (at lowcurrent density) was over a very small portion of the entire assembly. Fuel distribu-tion was therefore correspondingly poor since this concept depended on vertical wicking
31

AFRPL-TR-72-26
of the propellant in the glass cloth insulation.
(2) Flat Plate Configurations
After the tests described in the preceding paragraphs, electrode assemblies
and engines were built on a flat plate concept in an attempt to avoid the fuel
distribution and low effective current problems. The basic
flat plate concept shown in Fig. 48 was incorporated into the basic engine shellas shown in Figs. 55 and 56, and these configurations were designated FP-lTB andFP-2. Configuration FP-lTB was a combination of a flat plate and coiled screen
design, while the FP-2 was a simple 2-plate electrolysis cell with the bottom plate
insulated from the engine body. The coiled screens acted as a thermal bed. No
impregnated catalyst was used in these engines.
A series of eight runs were made using the engine configuration FP-lTB, fourof which yielded sufficient data to be reported. The results of these runs are
summarized in Table XXII. Runs 24-3 and 24-5 yielded C* values in excess of
3,000 ft/sec at mass flow rates of 1.3 x l0 - 4 and 1.2 x l0- lbs/sec respectively.Plots of chamber pressure vs time and C* vs flow rate are shown in Figs. 57 and
58 respectively. The rise times were at least a factor of two less than any
previously measured. These data indicated that good fuel dispersion was beingachieved resulting in much more efficient combustion and rapid ignition. The
structural integrity of the electrode assemblies was also maintained. Cold starts
were achieved in all cases without the use of catalytic materials.
These results r~presented a distinct improvement over those achieved using the
coiled screen concept and consequently the remaining development work was concen-
trated on variations of the flat plate concept. The combustion efficiency was stilllow at this point and it was also necessary to operate at very low flow rates whichresulted in thrust levels on the order of 20 millipounds. The low combustionefficiency was tentatively attributed to excessive thermal losses in the bed abovethe plates and subsequent engines were designed to minimize these heat losses.
Engine configuration FP-2 (Fig. 56) and a further modification designatedFP-3 were constructed to evaluate the effectiveness of thermal beds and also to
provide cells that were more structurally sound. The flame-sprayed alumina used inconfiguration FP-lTB was abandoned since the alumina had a tendency to spall off athigh temperatures. The use of nickel as an electrode material was also abandoned
because of excessive corrosion.
Engine modification FP-2 (Fig. 56) was constructed with the bottom of the enginethreaded for ease of assembly. A threaded retaining ring was used to secure the two
electrode screens (304SS) and the Refrasil insulators. With this type of construc-tion electrical shorts and degradation of the insulators were eliminated even aftermany engine firings.
In the modification of this engine design designated FP-3(Fig. 59),acone-shapedpressure plate was used to minimize thermal losses from the screens. Also
32

AFRPL-TR-72-26
as many screens as desired could be stacked to provide a thermal bed configuration.
The retaining ring used in these configurations allowed the adjustment ofcompression on the refrasil separator so that the fuel could disperse evenly through-
out the cell volume.
A series of over thirty runs were made using engine configuration FP-2 and ten
runs were made.using engine configuration FP-3. (The latter engine was used without
the thermal screens in order to obtain base line data for comparison with FP-2 whichhad a flat pressure plate). Selected data from the two series of runs are shown in
Table XXIII. A plot of C* versus mass flow rate is illustrated in Fig. 60.
In general, the data is similar to that achieved in earlier tests using engine
FP-lTB (Table XXII). However, with the FP-2 and FP-3 configurations cold starts
were obtained and rapid pulsing was possible without loss of performance. In some
cases as many as ten pulses were made with no appreciable degradation in performance.
For instance, Run 6-5-1, the first pulse (2 sec) of a series indicates a C* of 2200
ft/sec run 6-5-10 (not shown in Table XXIII) indicates a C* of 2000 ft/sec. In
some cases an improvement in performance during successive pulses was noted. For
example, runs 5-3A-1 and 5-3A-3 shown in Table XXIII represent the first and third
pulses each of about 2 sec duration for the FP-2 engine which was started cold. The
third pulse indicates an improvement in performance. In most cases the duty cycle
was 2 sec on and 6 sec off.
The plot shown in Fig. 58 indicates a high performance level at low flow rates.The basic engine size using two screens is equivalent to about a 20 millipound enginewhich can be operated at efficiency levels on the order of 90-95 percent. The data
for engine FP-lTB is also included in Fig. 60 for comparison at flow rates on theorder of 2 x l0- lbs/sec. This engine (with the thermal bed) did not provide as hi.h
an efficiency as did the FP-2 or FP-3 configurations, but at flow rates near 1 x l0 - '
lbs/sec its performance was on a par with FP-2. FP-3 was not run at lower flow rates,but tne data at the higher flow rates indicate better performance than the other con-
figurations. Thus the change in design resulted in a higher C* at higher flow rates
and it appears that some of this increase in C* occurred because the cone-shaped
pressure plate reduced heat losses in the cell.
d. Advanced Engine Design and Testing
All the flat plate designs used screen electrodes that allowed the product gases
to pass vertically through the cell possibly carrying undecomposed propellant intothe chamber before the self-decomposition temperature was achieved. Low performance
at higher propellant flows would be explained in this way. As a result a new cell
design was used, which made it necessary to eliminate the conical support for structural
purposes. This cel. configuration (FP-4) is shown in Fig. 61. In this configurationthe fuel inlet is brazed to a platinum plate, and serves as the anodic electricalconnection to the cell. The anode is electrically and thermally insulated from the
body of the engine by a nonporous alumina disc and an alumina tube in the inlet
33

AFRPL-TR-72-26
pressure fitting. The cathode is a stainless steel screen which is wide enough tomake good annular contact with the engine body. Thus the engine body serves as thecathode electrical contact. The nonporous alumina disk on top of the screen forcesthe hot gases to travel laterally through the cell and thus increases the residencetime iri the engine. The gases then pass along the engine wall, through the holes inthe retainer and into the chamber.
(1) Optimization of Cell Dimensions
In configuration FP-6 the propellant had to spread in a lateral direction, andthe volume of the free space in the matrix was a limiting factor to effectivepropellant distribution. [In earlier configurations (FP-1 through FP-3) the pro-pellant could easily pass right through the entire cell]. Because of these newconsiderations, the effect of the matrix (i.e., Refrasil) on the resistivity of thecell was studied since the resistivity in the matrix is the factor which primarilycontrols the current flow and thus the heat production in the cell.
An AC bridge was used for determining the resistance so that resistance cOul4..be measured without simultaneously decomposing the electrolyte. Propellant was addedto two cells of different diameters by means of a micro-burette that could be readto the nearest 0.01 cc. Resistances were measured and plotted as a function ofpropellant volume. A distinct break in the curve indicated when the cell was justfilled. The resistance at this point is at a minimum value without the cell beingflooded. (In the flooded condition, excess propellant is present which is not inthe direct current path between the electrode and through the pores of the matrix).
The matrix in each cell was 0.016 in. thick Refrasil. The diameters of thetwo cells used were 1.0 in. and 0.5 in., respectively. The data obtained from theexperiments are summarized in Tables XXIV and XXV. By knowing the free volume in thecell (measured as described above) the equivalent volume in the absence of theRefrasil it was possible to calculate the porosity of the Refrasil - i.e., 29% (TableXXV). When the measured resistance of the filled cell was compared to the resistanceof the electrolyte in the total cell volume (again in the absence of the Refrasil)
resistance factor for Refrasil of given thickness and diameter was obtained (i.e.,52.5 for the 1.0 in. cell, but only 17.5 for the 0.5 in. cell).
In addition to the above resistance factors (which decrease with cell diameter),the mass of propellant which must be heated was also reduced by a factor of four in
going from a 1.0 in. to"0.5 in. cell diameter, and the time to fill the cell was reducedby the same factor. This last parameter coupled with the rate at which the resistancechanges with the volume of the propellant in the cell may be the primary factor govern-ing the igntion delay. As shown in Table XXV, the resistance of the 1.0 in. cell ismore than ten ohms when the cell is nearly full and approaching the flooded conditionof 0.06 cc of propellant. Thus the current is limited to a little over two amps if a28v DC power source is used. When the resistance has dropped to less than 2 ohms(i.e., the current is greater than 14 amps at 28v DC), the cell is flooded. However,the 0.5 in. diameter cell has a resistance of 4.4 ohms when it is only two-thirds full
34$

AFRPL-TR-72-26.
(i.e., 0.01 cc). The current flow at 28v at this point is 6.5 amps. This current
level has been found to be sufficient to achieve the ignition provided the cell is
not in a flooded condition.
The experiments and results described in the preceding paragraphs provideimportant design criteria for the electrolytic cell. The cell diameter must be smallenough to reduce the resistance factor of the matrix to a point where low resistances(and thus high current flow) can be achieved before the cell is flooded. The mini-mum diameter to be used is determined by the ability to control propellant flow toprevent flooding prior to ignition. If the inherent ignition delay is 50 msec, thecell volume must be 0.01 cc for a propellant flow rate of 5 x l0-4 lbs/sec.
These results indicate that the volume of the electrolytic cell must be matchedto the mass flow rate used.
The smaller cell diameters in the engines used previously'(FP-1 through FP-3)were 0.25 in. to 0.30 in. aid at the mass flow rate of 2 x 10 -lbs/sec are flooded inless time than it takes for ignition to occur. The optimum cell diameter for thisflow rate is 0.5 in.
(2) Evaluation of Heat Losses
Based on the foregoing evaluation of ei'lect of cell dimensions, a 0.5 in. diameterengine was constructed and tested for performance. Details of this engine design(FP-4) are illustrated in Fig. 62. This design incorporates the cell shown inFig. 61. This particular test cell was constructed to provide ease of access tothe electrolytic cell by the use of a threaded pressure cap and a base of Qne-piececonstruction. The electrolytic cell was held in place by means of a threaded cap,beveled at the bottom. The beveled portion of the cap was provided with four holesto allow the hot gases to reach the chamber.
The mass of the engine was much larger than would be used in a flight-weightconfiguration; however, the high heat capacity (i.e., large heat loss )provided ameans for separating effects of low chamber pressure as a result of heat losses fromthe effects of actual combustion efficiency in the cell.
Performance data was obtained using the FP-i engine described above for a varietyof mass flow rates, and is summarized in 'able XXVI. The engine started
easily with little or no condc.ised vapors at the nozzle. The pressure response wassmooth. It was also notea that the rise time was strictly a function of the height
of the current peak at ignition. The power input was limited to 8 amps and 40 voltsby the power supply used in these experiments. Using the FP- configuration thecurrent dropped to a nominal level of 0.2 to 0.5 amps. However, the engine continuedto function after the power has been turned off. The duration of the current pulsewas of the order of 200-300 msec. The rise time of the current peak could becorrelated wich the rise time of the pressure. If the engine was pulsed on a shortduty cycle, it was not necessary to apply power again. The minimum off-time before
35

AFRPL-TR-72-26
power must be used again was not determined since this particular experimentalengine had a high heat capacity.
It will be noted from Table XXVI that the apparent performance of the engineincorporating the FP-4 cell is much less than desired. However, with the exceptionof runs at very high flow rates, the efficiency of the engine appears to be constantover a flow range from about 1.5 x l0 - 4 to almost 5 x l0 - 4 lbs/sec. Both the lowvalues of C* and the apparent small dependence of C* on mass flow rate are due tolarge thermal losses in the cell. This fact was confirmed by adding thermal beds anda catalyst bed downstream from the cell and operating the engine at the same flowrate (Table XXVII). The most striking information was obtained through the use of anactive catalyst bed downstream of the electrolytic cell. The fact that the charac-teristic velocity is the same with and without a catalyst (Runs 1-4 and 3-1, TableXXVII) indicates that the complete conversion of N2Hh to product gases had been
achieved in the electrolysis process and that the low pressures were due to tremendousheat losses across the electrolysis cell itself.
The temperature profile of the FP-4 engine was measured using two configurations.The data is summarized in Table XXVIII and illustrated in Fig. 63. In the firstconfiguration the thermocouple was placed directly above the cathode screen bydrilling holes in the bottom of the retainer and the alumina disk. The presence of thethermocouple thus effects the residence time in the bed since the hot gases can passdirectly through the cell without lateral motion toward the sides. Thus a decreasein performance is expected. It will be noted that, at this point, the temperature was1500 F, even though the engine was firing erratically and condensed vapors were presentat the nozzle. The remainder of the temperature measurements were taken using thenormal cell configuration with the thermocouple positioned as shown in Fig. "2. Thetemperature profiles were encouraging since extrapolation of the curve in u. 63 tothe center of the bed (i.e., the bottom of the porous separator) indicates combustiontemeratures on the order of 1800 F in an engine in which the geometry of the bed hadbeen disturbed due to the presence of the thermocouple. The temperature measurementsin the chamber indicate a smooth profile except at the top of the engine where addi-tional heat losses occurred. The temperature at the top of the bed (i.e., on top ofthe retaine--) in the normal engine was between 800 and 1000OF depending on flow rate,while only about 200 to 300°F in the chamber itself. These measurements confirm thefact that very efficient combustion was taking place in the electrolytic cell andtne major problem was heat loss across the cell itself due to the high heat conduc-
tion in the engine.
(3) Analysis of Power Requirements
An analysis was made of the power requirements for ignition using engine configura-tion FP-4. It was found that the area of the clirrent-time curves for the cell could beused to accurately determine the number of coulombs (ampere-sec) passed thrcugh thecell during the ignition process. This information coupled with applied voltage datayields the total energy required for the ignition process.
36

AFRPL-TR-72-26
Typical current and pressure-time traces are shown for runs 2-1A, 27-9A, and 5-9B in
Figs. 64-66, respectively. Fig. 64 illustrates the case in which the propellant flowrate is too low for the engine size, resulting in abroad current peak and an initial
pressure spike considerably higher than the equilibrium pressure. The latter effectis due to a flow surge when the propellant feed valve is opened. Fig. 65 illustratesT.e case when the propellant flow is too high. A large residual current is noted afterignition indicating excess propellant in the cell at all times. Proper flow and rapid
ignition is shown in Fig. 66. The total energy required is low and there is almostno residual current. It is possible then to determine optimum flow by monitoring
current as a function of time for any size engine.
The energy and power data for seie-al runs on engine configuration FP-4 aresummarized in Table XXIX. When the flow rate of the propellant is closely matched tcthe capacity of the cell, the current pulse width and the residual current afterignition (voltage on) both decrease resulting in a reduction of the energy required.At flow rates on the order of 4.0 to 4.5 x 10⁻⁴ lbs/sec the total ignition energyrequirements are only 30 to 40 watt-sec. The peak power in most cases is in the
300-400 watt range.
The total ignition energy requirements of the electrolytic engine are quite lowcompared to the electrothermal engine concept as described, for example, in Ref. 12.In the latter case a one-minute warmup is required at a continuous drain of 5 watts
prior to initiation of propellant flow resulting in a total energy requirement of
300 watt-sec. Thus the electrolytic system is an order of magnitude better on anenergy basis.
(4) Final Engine EvaluationBecause of the high thermal losses in the FP-4 engine configuration a new
engine was built (FP-5) which incorporates the same electrolytic cell design asshown in Fig. 4, but has a much smaller total mass (Fig. 67). The cell is encasedin a stainless steel shell with 0.03 in. walls and an outside diameter of 0.5 in.
The upper alumina disk of the cell contacts the top of the engine so that the com-bustion chamber has an annular configuration. The nozzle is offset near one edgeof the engine top. The height of the engine exclusive of the fuel inlet is 0.2 in.wiich is essentially the height of the cell itself. However, the diameter of the cellis about 0.4 in. so that the cell capacity and thus the optimum flow rate is slightlysmaller than the FP-4 configuration.
Performance and power requirement data for the new engine are summarized inTable XXX. The characteristic velocity of the engine (using the same cell configura-tion as FP-4) rose to the 3800-11100 ft/sec range at a mass flow rate of about2 x l0 - lbs/sec (40 millipound thrust). Thus, the low apparent efficienciesexperienced with the FP-4 configuration were, as expected due to excessive thermallosses.
The energy requiremerts for the FF-5 engine were slightly higher than those for
37

AFRPL-TR-72-26
engine FP-4 but were still in the 50-60 watt-sec range. The rise time was poor,but
this effect was traced to poor fuel distribution in the cell due to uneven pressureof the top alumina disk (lucalox) on the cathode screen and thus on the Befrasil.
Failure of the top alumina disk was also noted. Even compression on the Refrasil isrequired to eliminate the fuel pockets that allow excess fuel in the cell. Thiscondition appeared to be the major cause of excessive rise-times.
Because of the difficulties outlined above, engine configuration FP-5 wasmodified by replacing the alumina insulators with fused quartz. This material hasmuch better thermal characteristics than the alumina and is less prone to failure fromthermal shock. In addition, the fuel inlet was shortened so that the fitting whichseals and insulates the inlet tube from the rest of the engine (not shown in Fig.67)was only 0.25 in. from the bottom of the cell. This was done to decrease the residualfuel volume between the solenoid valve and the cell. This residual fuel is wicked
into the Refrasil after the valve is closed and contributes to the long pressure
tailoff times. In the previous design this fitting was located ab6ut 1.5 in.from thecell. The remainder of the parts were identical to those used in engine configura-
tion FP-5. A series of over thirty runs was made on the modified engine (FP-5A)using mass flow rates in the range of 1.0 to 3.5 x lO-4 lbs/sec and engine operatingtimes of 100 msec to 30 sec. No degradation in performance was noted and there wereno part failures. The total accumulated firing time was 13 minutes. The perfor-mance data for the engine configuration FP-5A is summarized in Table XXXI. Althoughthe ta-il"off- time improved considerably (averaging about 130 msec), it was stillgreater than desired. The rise time was somewhat improved, but the data was scatteredwith the exception of the data at the high end of the flow rate range where severalruns indicated rise times of less than 100 msec. In the mass flow rate range ofabout 1.0 to 3.0 x l0 - 4 lbs/sec, the characteristic velocity (C*) was, with a fewexceptiono nearly constant in the range 2700-2900 ft/sec. As noted previously, thistype of performance has been traced to excessive heat loss which is apparently verycritical for these small thrust engines.
In order to minimize heat loss a second modification, FP-5B, was made to the
basic FP-5 configuration. The design was changed by placing the insulated fitting for
the inlet tube 1.0 in. from the bottom of the engine and reducing the thickness ofthe engine wall from 0.030 in. to 0.010 in. The fuel inlet valve was also placedto within 2.0 in..of the bottom of the engine.
The results of the tests on this engine configuration are summarized in TableXXXII. Data were obtained in the mass flow range of about 1.0 to 2.0 x I0h lbs/sec.In this flow range the characteristic velocity was in the range 3800-4100 ft/sec forroom temperature starts. The C* versus a data is included in Fig. 60 for comparisonwith the other configurations. The rise time was improved in some cases but Jngeneral the tail-off time was poor (probably due to excessi'e inlet volume). However,the improvement in combustion efficiency (to about 90-95% of theoretical)substantiatesthe fact that excessive heat losses wcre the cause cf the low combustion efficiency in
the previous engine designs.
38

AFRPL-TR-72-26
(5) Effect of Propellant and Bed Temperatures
The data accumulated using engine FP-5B was also used to evaluate theeffect of reduced propellant and cell temperatures on rise time and combustionefficiency. Tests were also run under conditions where the cell temperature was
considerably different from room temperature.
The results of these tests are summarized in Table XXXIII. The data havebeen arranged in order of increasing cell temperature and includes four tests atinitial cell temperatures in the -55 to -15 F range, four tests at room tempera-
ture (72).
There is a trend toward lower rise times as the bed temperature is increased.
The scatter in the rise time data and variations in the mass flow rate used make itdifficult to draw quantitative conclusions, but the increase in propellant tempera-ture from 32 F to 72 F when the bed temperature was raised from -15 F to 72 F didnot appear to have a significant effect on the rise time. It is difficult toseparate the two effects (i.e., bed temperature from propellant temperature) but ingeneral, it appears that the heat transfer from the engine has a significant effecton the rise time.
A comparison of two typical pressure-time traces is shown in Fig. 68. Theupper trace, run at an initial engine and propellant temperature of 72 F is thatof run 1-11-3C (Table XXX); the lower trace (Run 1-11-4) was run at a propellanttemperature of 32 F and a cell temperature of -15 F. The major difference in thetwo traces are the longer rise time at reduced temperature (130 msec) compared toroom temperature (60 msec) and the gradual increase in pressure after tne initialpressure rise at low initial temperature. The latter effect can be directlycorrelated with the initial cell temperature (i.e., the lower the temperature thelonger the time required to reach the final equilibrium pressure). This effectwould not be as extreme under normal operating conditions, since the cell tempera-tures used in these experiments were extremely low.
As a result of the Phase II effort it was found that a flat plate electrolyticcell concept was the most reliable. Mechanical difficulties were minimized and theflat plates coupled with a glass cloth separator provided the means for proper fueldistribution in the cell. By reducing the mass of the engine it was possible tominimize heat losses which were the major contributor to low combustion efficiency.As a result it was possible to repeatedly achieve rapid ignition (50-70 msec igni-tion delay) and characteristic velocities in the 3900-4100 ft/sec range. Totalignition energy requirements were in the 30-40 watt-sec range at 40v. PeaK powerwas in the 300-400 watt range with a power pulse duration of about 100 msec. Thebasic design parameters using the flat plate concept described above were incor-porated into a more sophisticated engine to be used in durability tests as describedin the following paragraphs.
39

AFRPL-TR-72-26
SECTION IV
DESIGN, FABRICATION, AND EVALUATION OFA PROTOTYPE MILLIPOUND THRUSTER
The results of the tests on the experimental engine described in Section IIIestablished the feasibility of the electrolytic ignition concept. The test seriesleading to the development of the FP-5B configuration demonstrated that this designis capable of sustained, efficient propellant combustion at a thrust level of 40
millipounds. The FP-5B design was consequently used as the basis for a more advancedprototype engine that could be used for extensive testing for reliability andendurance. The assembly procedure outlined below was developed by assembling andtesting six experimental engines of the same basic design.
1. PROTOTYPE DESIGN AND FABRICATION
The prototype engine design differs from the FP-5B configuration in that aconical nozzle has been added. An annular perforated retainer ring was also addedfor cell compression and as a mount for the top quartz insulator and platinum electrode.A sketch of this design is shown in Fig. 69. As mentioned above, the design is basedon the flat plate electrolytic cell concept using platinum electrodes and Refrasil(woven-high temperature glass cloth) as the electrolyte matrix. The top and bottominsulators are fused quartz. The latter material has been shown to withstand thermalcycling without cracking. The insulators serve a dual purpose in that they electri-cally insulate the electrodes and provide thermal isolation of the electrolytic cellfrom the body of the engine. The top insulator is also used to maintain an evenpressure on the cell so that the Refrasil is compressed equally over its entire area.This even distribution of pressure is necessary to provide proper fuel distributionthroughout the volume of the cell. if this condition is not achieved, pockets developbetween the Refrasil and the electrodes and uneven fuel combustion results. The topinsulator is held in a center position by a retainer ring which is provided with holesfor gas passage from the outer circumference of the cell to the engine chamber. Thenozzle is of standard conical design with a 60:1 expansion ratio. The throat diameter
is .024 in.
The inlet portion of the engine design is comprised of a standard A/N fittingwith insulated ferrules (not shown in Fig. 69). An alumina tube insulator separates
the injector tube from an outer tube which is welded to the fitting body and the bottomof the chamber. The alumina tube serves to minimize heat losses through the fittingwhich is large compared to the size of the engine. This insulating device is necessary
since the inlet tube is brazed directly to the bottom platinum electrode and is, at
present, the electrical connection for this electrode.
Originally the top electrode was to be spot-welded to the inner chamber wall asshown in Fig. 69. However, the final design was changed so that the platinum electrodewas spot-welded in four places to the retainer ring. The support plate shown in Fig.69was eliminated.
40

AFRPL-TR-72-26
The disassembled engine is shown in Figs. 70A and B. Subassemblies are also shownwith their constituent parts. The inlet section of the engine is composed of theinlet tube (.010 in. ID Inconel 600)which is gold-nickel brazed into a hole in thebottom platinum electrode (70-9, 70-11, and 70-3). The inlet fitting and stand-offtube (70-13) is gold-nickel brazed to the bottom of the chamber (70-1). The aluminatube insulator (70-12) is inserted in the inlet stand-off, and the lower electrodeassembly is inserted through the lower quartz insulator (70-2), which in turn fitsinto the bottom of the chamber. The inlet tube extends through the bottom fitting.An adaptor tube (70-10). is gold-nickel brazed to the inlet tube to match the ID ofthe inlet fitting. The tube is sealed in the fitting using a high temperature sili-cone ferrule. The inlet tube and lower electrode are thus insulated from the bodyof the engine. The lower electrode is 0.080 in. smaller in diameter than the lowerquartz insulator.
The 0.016 in. thick glass cloth electrolyte matrix (70-4) is placed on the lower
electrode and is held in place and compressed 0.002 in. by the upper electrode assembly
(70-5). This assembly comprises the Inconel retainer ring which is grooved to fitthe upper quartz insulator (70-6). The upper platinum electrode (70-7) is spot-welded in four places to the retainer ring for electrical contact to the engine body.The four contact points are sufficient for structural integrity and minimize thermalpaths from the upper electrode to the engine body. The entire assembly is posi-tioned with proper compression and is then spot-welded to the inside of the chamberwalls. The nozzle (70-8) is inserted in the chamber so that it rests on theretainer ring and is welded in position. The nozzle flange is 0.0625 in. above the top
of the chamber to protect the nozzle during the welding process.
2. PRELIMINARY ENGINE EVALUATION
Each assembled engine was tested both manually and by means of a programmerwhich automatically actuated the inlet valve according to the duty cycle prescribedin the contract. The duty cycle is shown in Table XXXIV. The duty cycle was designedto provide testing data that would include a large number of cold starts, fast pulseoperation as well as longer steady-state runs and a total engine time of at least onehour. A close-up of the third experimental engine mounted on the test stand is shownin Fig. 71. A platinum/platinum-10% rhodium thermocouple was used to measure chambertemperature (above the upper quartz insulator and retainer ring) and a chromelalumelthermocouple was used to measure the outer skin temperature of the chamber oppositethe electrolytic cell. The recording instrumentation for the two temperatures,pressure, current, and voltage is shown in Fig. 53. The tape unit, programmer, andpower supplies are shown in Fir. 72.
a. Prototype Engines No.. 1 through No. 3
The first prototype engine was assembled and welded according to thesketch shown in Fig. 69. Engine No. I was constructed using a fusion weld to fastenthe nozzle piece to the main engine chamber. The inlet tube was 0.010 in. ID. The
141

AFRPL-TR-72-26
engine could not be operated due to blockage in the cell which prevented propellantflow. The blockage was not in the inlet tube itself, but was due to excessivecompaction of the glass fiber matrix which blocked the inlet at its junction withthe lower platinum electrode. Engine No. 2 was constructed in the same manner asEngine No. 1, but a 0.023 in. ID inlet was used. The same problem of inlet blockage
occurred in this engine. On inspection of the engine it was determined that theproblem was not a function of the inlet diameter, but was due to shrinkage of thechamber walls because of the excessive heat during the fusion welding process.Independent experiments on the compression properties of the glass cloth indicatedthat complete blockage of the cloth was obtained when original 0.016 in. thickness wasreduced to 0.012 in.
Engine No. 3 was also fusion welded. Rather than preloading the nozzle pieceto achieve a slight compaction of the glass cloth, the nozzle piece was raised 0.010 in.above the retainer ring prior to welding to allow for material shrinkage. Successfulignitions were obtained on this engine but pressure fluctuations were noted duringsteady-state operation indicating a loose fit which allowed pockets of propellantto form between the glass cloth and the electrodes. H.owever, the engine was testedusing several steady-state manual runs and several runs using portions of the dutycycle. Twenty-seven cold starts and 11.6 min. on-time were accumulated on this engine.
The performance data for the manual runs is summarized in Table XXXV. In themass flow rate range 1.7 to 3.2 x 10 - h lbs/sec the characteristic velocity rangedfrom about 3000 ft/sec to 3800 ft/sec. These preliminary runs indicated that thebest flow rate for the engine was about 2.3 x lO- lbs/sec (Run 2-13-3). At thisflow a characteristic velocity of 3600 ft/sec was obtained indicating a combustionefficiency of 83 percent based on a theoretical value of 4340 ft/sec.The rise timefor (700F) dold starts were generally long, but a rise time of 70 misec wasobtained for the optimum run.
The engine tests were continued using the duty cycle. The inlet pressure was95 psia and the resulting chamber pressures were generally in the range of 49-53 psiaindicating a pressure drop of about 40 to 45 psia across the inlet and theelectrolytic cell. The duty cycle data is summarized in Table XXXVI. In this caseno attempt was made to run through the entire duty cycle. Checks were made usingeach part of the duty cycle and the operation of the engine was further checked byperiodically repeating the base point runs.
The performance of the engine improved during the running of the first two basepoints, and cycle #1 (50 msec on-50 msec off). However,when cycle #2 (100 msec on-6 sec off) was tried ignition occurred in the inlet tube resulting in a failure ofthe seal in the inlet fitting. The propylene-ethylene seal melted due to excessiveheat in the inlet tube. The heat was the resutlt of heat transfer from the hot engineduring the six-second periods when there was no propellant flow to-cool the inlet.As a result, combustion takes place in the inlet tube causing a choking effect. Theheat of combustion in the tube eventually destroys the inlet system. This thermalsoak-bac: behavior is due to poor heat transfer away from the inlet tube during the
long off time. The experimental engine is not provided with a heat sink and the inlet
h2

AFRPL-TR-72-26
tube is thermally insulated by the alumina tubing which electrically isolates theinlet and lower electrode from the engine chamber. The inlet seal was replaced
with silicone which has a higher softening point, but this also melted during thesecond test using cycle #2. This part of the duty cycle was thus not used duringthe additional tests.
The engine was also tested using cycles #5, 7, and 8. The performance wasgood in these cases, but after the first eight runs using cycle #7 the rise-timeswere longer than desired. However, good performance with a short rise-time wasobtained when the base point (#) was repeated after these runs. After a two-weekperiod the engine was tested manually (Runs 3-2-1 through 3-2-3) but ignition wasdifficult to achieve. Another base point (#5) was then run, but it was obviousthat performance had deteriorated to the point where further testing was notwarranted.
Upon engine disassembly it was noted that arcing had occurred from the pointwhere the inlet tube is brazed into the lower platinum electrode. The center ofthe glass matrix and the upper platinum electrode had been melted so that good fueldispersion was no longer possible. The engine failure was probably due to increasedloss of fuel dispersion as the center portion of the glass matrix eroded awayduring each firing.
The improvement in engine performance found in the earlier runs and thesubsequent degradation in performance can be seen from Fig. 73 by examining the1st and 100th of the 250-msec pulses of the five base-points run using engine #3.It is apparent that performance was improved in the base-point series #1 through#3, the chamber pressure was reduced somewhat in base-point #4 and the pressureresponse was very poor in base-point #5. In a given run the 100th pulse shows ahigher pressure, smoother equilibrium pressure and a faster rise time than thefirst pulse in the series. The tail-off time was about the same in all cases.
b. Prototype Engines No. 4 through No. 6.The assembly procedure for prototype engines No. 4 through No. 6 was
changed to minimize the cell matrix compression problem encountered in the previousengines. Proper compression was achieved by positioning the retainer ring upperelectrode assembly under the proper load and spot welding it to the inner chamberwall. The matrix, under proper compression, was thus fixed in place prior to thefinal welding of the nozzle assembly to the chamber. The latter operation wasaccomplished by means of electron beam welding in order to minimize the thermalexpansion and subsequent contraction of the chamber.
Engine /4. was an immediate failure. No propellant flow could be obtained. Theproblem was traced to electrical arcing across the cell which melted the upper plati-num electrode at its center opposite the injector tube. The molten platinum pluggedthe inlet. The arcing apparently occurred due to the protrusion of the inlet tubeand the center portion of the lower electrode. The electrode gap at this point wasso reduced that arcing occurred at hO v in the absence of propellant. The lower
43

AFRPL-TR-72-26
tube is thermally insulated by the alumina tubing which electrically isolates theinlet and lower electrode from the engine chamber. The inlet seal was replacedwith silicone which has a higher softening point, but this also melted during thesecond test using cycle #2. This part of the duty cycle was thus not used during
the additional tests.
The engine was also tested using cycles #5, 7, and 8. The performance was
good in these cases, but after the first eight runs using cycle #7 the rise-timeswere longer than desired. However, good performance with a short rise-time wasobtained when the base point (4) was repeated after these runs. After a two-week
period the engine was tested manually (Runs 3-2-1 through 3-2-3) but ignition wasdifficult to achieve. Another base point (#5) was then run, but it was obviousthat performance had deteriorated to the point where further testing was not
warranted.
Upon engine disassembly it was noted that arcing had occurred from the pointwhere the inlet tube is brazed into the lower platinum electrode. The center ofthe glass matrix and the upper platinum electrode had been melted so that good fueldispersion was no longer possible. The engine failure was probably due to increased
loss of fuel dispersion as the center portion of the glass matrix eroded awayduring each firing.
The improvement in engine performance found in the earlier runs and thesubsequent degradation in performance can be seen from Fig. 73 by examining the1st and 100th of the 250-msec pulses of the five base-points run using engine #3.It is apparent that performance was improved in the base-point series #1 through
73, the chamber pressure was reduced somewhat in base-point #4 and the pressureresponse was very poor in base-point 5. In a given run the 100th piulse shows ahigher pressure, smoother equilibrium pressure and a f'aster rise time than thefirst pulse in the series. The tail-off time was about the same in all cases.
b. Prototype Engines No. 4 through No. 6.The assembly procedure for prototype engines No. 4 through No. 6 was
changed to minimize the cell matrix compression problem encountered in the previousengines. Proper compression was achieved by positioning the retainer ring upper
electrode assembly under the proper load and spot welding it to the inner chamberwall. The matrix, under proper compression, was thus fixed in place prior to thefinal welding of the nozzle assembly to the chamber. The latter operation wasaccomplished by means of electron beam welding in order to minimize the thermalexpansion and subsequent contraction of the chamber.
Engine A" was an immediate failure. No propellant flow could be obtained. Theproblem was traced to electrical arcing across the cell which melted the upper plati-num electrode at its center opposite the injector tube. The molten platinum pluggedthe inlet. The arcing apparently occurred due to the protrusion of the inlet tubeand the center portion of the lower electrode. The electrode gap at this point was
so reduced that arcing occurred at 40 v in the absence of propellant. The lower
43

AFRPL-TR-72-26
electrode assembly of Engine No. 5 was redesigned so that the inlet tube and center
portion of the electrode were recessed in a tapered hole in the center of the bottomquartz insulating disk. This engine was run for a total on-time of 13.7 minutesand 47 cold starts were obtained.
During the 26 preliminary runs (Table XX=VII) the engine performance improvedconsiderably. Rise times decreased from about 250 msec to around 50-70 msec. Thecharacteristic velocity improved from about 2400 ft/sec to 3300-3500 ft/sec. Themass flow rate was varied between 1.0 to 3.0 x 10⁻⁴ lbs/sec and run times werevaried from 3 to 20 sec. The optimum flow rate was about 2 x l0 lb/sec whichgave a thrust of 40 millipounds.
Duty cycle runs included two base points and ten runs each of cycle #1 and #3.Cycle #2 was deleted because of previous thermal soak-back problems. As shown inTable XXXVIII,the performance was very stable and, in fact, improved slightly duringthe runs. Characteristic velocities in the 4100-4200 ft/sec range (92-95% efficiency)were consistently achieved as well as rise times as low as 20 msec. (Rise timesare not reported in many cases due to programmer malfunction.) The chamber tempera-tures reported in Table XXXVIII are substantially below the actual combustiontemperature due to heat losses near the nozzle where the thermocouple was placed.The outside wall temperature near the combustion zone was about 1500 F indicatingan internal temperature in the 1800-1900 F range. The estimate of the temperatureprofile across the chamber wall was based on the internal tempierature measurementstaken during Phase II of the program as shown in Table XXVIII and Fig. 63.
The engine performed consistently until the last run of cycle #3 when a slightreduction in the characteristic velocity was noted. During the second base pointrun large pressure fluctuations occurred in the h4th-250 msec pulse near the end ofthe cycle. When cycle #5 was run (50 msec on - 450 msec off) the engine was hot atthe bottom of the chamber below the electrolytic cell, and the cell developed anopen circuit preventing further ignition. The failure was due to melting of thegold-nickel braze (m.p. 1740 F) between the inlet tube and the lower platinumelectrode which resulted in the open circuit since the inlet tube is one of theexternal electrical connections.
The power requirements for engine No. 5 were evaluated and are summarized inTable XXXIX. The peak power is about one-third of that required with the prelimi-nary engines used during the Phase II portion of the work (i.e., 100-130 watts).The initial energy peak required is only 15-35 watt-sec. The total energy is largerdue to current tail-off in the first one or two seconds of operation correspondingto the current-time relationship shown in Fig. 65. This higher energy requirementcan be eliminated by turning the voltage off just after the initial current peak.However, the voltage was left on during the entire run.
The first and last 250 msec pulses are shown in Fig. 74 for the two basepoints run using Engine No. 5. The performance characteristics are similar to
44

AFRPL-TR-72-26
those for Engine No. 3, but the rise times were shorter in most cases. The engine
failure prevented accumulation of a large total on-time, so a sixth engine was
constructed for testing.
Engine No. 6 was constructed in the same manner as engine No. 5, but a gold-
platinum braze (20% Pt) was used to join the inlet tube to the lower platinum
electrode. The melting point for this braze material is 2170 F or about 100 F
above the maximum theoretical combustion temperature.
Engine No. 6 was run successfully for a total on-time of 3650 sec. These runs
were accomplished over a period of five days and were terminated only because the
supply of azide propellant was exhausted. The engine was subjected to sixty (60)
cold starts at 70 F using both manual runs (for preliminary testing) and portions
of the programmed duty cycle. The only portion of the dutby cycle not used was
cycle #2 in which thermal soak-back occurred. Cold starts at 70 F were used for
convenience (essentially room temperature) since the contract requirements for
ignition at 40 F had already been established (P.39) and little difference was
seen between ignition at 40 F and 70 F propellant temperatures.
The data for Engine No. 6 is summarized in Table XL. The majority of the time
on the engine was accumulated using cycle #7 (10 sec on-100 sec off). Every fifth
run using this cycle was reported, since 173 runs were made and the performance
data did not change to any appreciable extent.
The base point cycle was run periodically with little noticable change in
performance. The first and one-hundreth pulses in selected base point runs
and the associated data are illustrated in Fig. 75. The only variation in per-
formance noted was the appearance of relatively large pressure fluctuations during
base point runs 2 and 3. These fluctuations were also apparent in some runs using
cycle #3 (30 sec runs) and cycle #6 (3 sec runs) which were run during the total on-time period of about 400-700 sec. These fluctuations did not occur in subsequent
runs, as Fig. 75 indicates for base point runs 4 and 9. The total time on the engineat each base point illustrated in Fig. 75 is: base point 1B, 40 sec; base point 2,440 sec; base point 3, 720 sec; base point 4B, 2450 sec; and base point 9, 3600 sec.
There is a slight downward trend in the equilibrium pressure as time is built
up on the engine. This effect is a direct result of a decrease in propellant flow
rate (i.e., the combustion efficiency has not changed) due to increased back pressure
in the engine. The inlet pressure was 75 psia for all the runs reported in Table
XL, so the pressure drop across the engine increased from 26 psia to 31 psia
indicating compaction of the glass cloth separator in the electrolytic cell. This
5 psia change is very low, but is the only significant change noted during the
entire test period.
45

AFRPL-TR-72-26
The temperatures measured during the engine test are not a true indication
of engine performance. The chamber thermocouple is considerably removed from theengine "bed", which in this case is the electrolytic cell. At equilibrium the
chamber temperature is essentially the same as the outside wall temperature near
the combustion zone, i.e., the cell matrix. Thus the temperature drop across thechamber wall is essentially the same as the gas temperature drop from the cell,chrough the annular retainer ring to the chamber. Previous measurements reported
in Section III of this report have shown that the temperature drop through the cell
is on the order of 400-600 F so the actual combustion temperature must be in the
1800-2000 F range.
The power requirements for the engine are identical to those shown for Engine
No. 5 (Table XXXIX). The peak power is on the order of 100-120 watts while the peak
energy requirement is on the order of 15-30 watt-sec. In some cases there is aresidual current after the main current peak which results in an increase in thetotal energy requirement to about 100-170 watt-sec. As pointed out earlier, this
effect can be avoided by terminating the applied voltage immediately after ignition.
This lack of applied voltage at this point .n no way effects engine performance.The voltage was terminated during runs 8-9 ant 8-10 (Table XL) and the data fromthese runs is similar to those obtained with the voltage applied throughout the
entire tun (i.e., runs 8-1 through 8-4 as well as 8-11 and 8-12).
The termination of the voltage with no effect on performance is an importantconcept in that the actual energy requirements are then very low. The effect alsoshows that the engine is actually operating in a thermal mode immediately after
the current pulse. and can be pulsed without further application of power as long
as the cell temperature is sufficiently high. It has been determined that this
particular engine design is capable of restart without power application up to sixminutes if the engine has previously reached an equilibrium temperature. This
off-period allows ample time to charge a capacitor at a low power level. Capacitordischarge can then be used without using the main power supply for the 100-120 watts
peak power required for ignition.
Engine No. 6 represents a completely successful test for durability and
performance. The engine was run for a total on-time of one hour using sixty cold(70 F) starts. The ignition delay time was on the order of 30-70 msec; thecharacteristic velocity was 3800-4000 ft/sec which is 90-95% of theoretical. Powerrequirements were 100-120 watts peak and the total energy required was 15-30 watt-
sec. The engine ran at a thrust level of 40 millipouros using a mass flow rate of
2 x 10 4 lb/sec. Pressure fluctuations were at a minimum in all cases.
hs6

AFRPL-TR-72-26
SECTION V
SUMMARY AND CONCLUSIONS
1. PHASE I
In the course of the work done on Phase I of Contract F04611-70-C-0070,
experimental investigations were carried out on selected propellants as candidate
electrolytes and on various electrodes to determine their usefulness in an electro-
lytic ignition system for millipound thrusters.
Electrical conductivity data was obtained as a function of temperature between
25 C and 45 C, for propellant grade hydrazine, hydrazine-2% hydrazine nitrate,hydrazine-2% hydrazine azide, and hydrazine-23% hydrazine azide. This data is quite
important since ohmic losses due to poor electrolyte conductivity in the electrolytic
cell is one of the primary factors in cell design.
Voltage losses due to slow electrochemical processes at the electrode-electrolyte
interface also effect the design and performance of the electrolytic ignition cell.
For this reason polarization studies (measurements of voltage losses under con-ditions of current flow) were carried out on platinum, pyrolytic, and spectrographic
grade graphite, three types of stainless steel; AM350, 17-7PH, and 304SS, two
aluminum alloys, AAllO0, and AA6061-T6; a gold-nickel brazing alloy, HS1414, nickel;
and Inconel 600. The electrolytes used in these studies included propellant grade
hydrazine, hydrazine-5%, hydrazine nitrate, and hydrazine-23% hydrazine azide.
Preliminary electrolysis experiments (at low currents) were carried out and an
analysis was made of the products of the electrolysis reaction. These experiments were
designed to determine the theoretical heat output. Hydrazine-23% hydrazine azidewas the only electrolyte used in these studies.
The results of the conductivity studies showed that the addition of small amounts
of hydrazine-based salts enhances the conductivity of propellant grade hydrazine by
at least two orders of magnitude. Both 2% hydrazine nitrate and 2% hydrazine azide
additions showed conductivities of 3.0 x 10⁻² and 3.5 x 10⁻² ohms-lcm -1 at 25 C
compared to 1.6 x lO "4 ohms'lcm-l for propellant grade hydrazine at the same tem-perature. The addition of 23% hydrazine azide yielded a conductivity value of1.8 x 10-1 ohm'1 cm 1 , another factor of ten better than obtained with the lowpercentage additions.
The polarization results were evaluated in terms of both transient and steady-
state effects. The former studies were designed to determine if any films wereformed on the surface of the electrodes that would impeJe or stop the electro-chemical process. The cell used in the experimental apparatus was designed to
47

AFRPL-TR-72-26
eliminate any effects due to differences in the conductivities of the electrolytesused. It was found that all electrodes were highly polarized in propellant gradehydrazine and that the aluminum alloys performed very poorly as anodes in all theelectrolytes studied. Almost without exception the best performance of all electrodes,anodic or cathodic, was obtained using the 23% hydrazine azide solution.
In hydrazine-23% hydrazine azide, platinum was found to be the least polarizedmaterial, as both an anode and a cathode. However, pyrolytic graphite behaved ina similar manner to platinum as an anode.
The three stainless steels were relatively poor anodes but good cathodes withsome notable reservations. The anodic and cathodic behavior of I7-7PH was un-
predictable and often indicated very high polarization. The cathodic behavior ofA.M350 was similar, although not to as great an extent. 304SS was the only low costcathodic material that showed consistent performance,
Steady-state experiments were designed to evaluate electrode surface resistanceeffects which are independent of electrolytic resistivity and to compare totalvoltage losses at a steady current input to the cell. In general, the steady-stateresults confirmed those obtained in the transient studies. The only true electroderesistance effects obtained were found under conditions of cathodic polarization
of 3O4SS.
The effect of hydrazine azide concentration was also studied in the range of2 to 23 weight percent azide to determine whether there was an optimum concentrationat which minimum polarization could be attained. However, the lowest polarizationwas always found at the 23% hydrazine azide level. The polarizations of the stain-less steels were found to be linear functions of azide concentration while therelationship between polarization and azide concentration for platinum and graphitewas irregular.
The products of electrolysis of hydrazine-23% hydrazine azide were determinedusing platinum, pyrolytic graphite, AM350, and 3C4SS. In all cases nitxogen wasthe only anodic product. The cathodic products for graphite, AM350, and 304SSwere ammonia, nitrogen, and hydrogen in proportions consistent with the reaction:
2N2H5+ + 2e -- N2 + 2112 + 2N11 3
indicating no ammonia decomposition, and thus producing the highest heat outputpossible for the reaction. The cathodic process on platinum yielded nitrogen andhydrogen only, indicating catalytic decomposition of amnmonia on the platinum surface,and thus a lower heat output.
The power input data for tile cell indicates that the lowest polarization isachieved using platinum as either an anode or a cathode, 304SS as a cathode and
48

AFRPL-TR-72-26
graphite as an anode. Any combination of these materials yield about the sameresults. Thus final selection of materials from this group depends on physicaland corrosion properties.
On the basis of the above results, the following conclusions have been
reached:
(a) Hydrazine-23% hydrazine azide is the best electrolytestudied.
(b) Either platinum or pyrolytic graphite should be used asthe anode of the electrolytic cell.
(c) 304 Stainless steel or platinum should be used .as thecathode for the cell.
2. PHASE IIIn the course of the work done in Phase II, four different electrode con-
figurations were developed and three of these were tested in preliminary enginedesigns. The design requirements for the electrolytic cell design included thrustlevels in the 20-80 millipound range, mass flow rates in the range 1-4 x 10⁻⁴ lbs/sec,chamber rressure of 40-200 psia, a cold start temperature of 40 F minimum, a 50millisecond ignition delay time, a 25 millisecond tail-off time and a characteristicvelocity of 4000 ft/sec.
The mechanical design requirements necessary to achieve the above performanceparametees include:
(a) A large ratio of electrode surface area to propellantvolume.
(b) Immediate and uniform dispersal of the propellant throughthe volume between the electrodes.
(c) Maximum thermal isolation of the cell from the engine body
(d) A finite and steady pressure drop across the electrode chamber.
Two of the original electrode configurations were extensively evaluated.These were coiled screen electrodes using a woven glass cloth as an electrolyte matrixand electrode separator, and flat plate configurations using the same glass clothseparator material. Variations of these configurations included the use cf thermalb , flame sprayed alumina electrodes,and the use of MoC 3 or ruthenium promotorsie;- ignated in the glass cloth separators.
Using the coiled screen concept it was possible to obtain a characteristicvelocity (C*) of about 3800 ft/sec, but only at a flow rate of about 2 x 10⁻⁴ lbs/sec.Cold starts could only be achieved using glass cloth separators impregnated with apromotor. The rise-times and tail-off times were also large and averaged about
49

AFRPL-TR-72-26
250 msec and 500 msec respectively. Shorting of electrodes was also a commonproblem, and the use of thermal beds had little or no effect on engine performance.
Flat plate configurations were found to be much more structurally reliablethan the coiled screens. The use of insulated electrodes considerably improvedthe rise times. The use of a simple two-plate cell resulted in characteristicvelocities up to 4100 ft/sec at flow rates of about 1 x lO-4 lbs/sec and risetimes on the order of 150 msec. Cold starts were achieved without the use of anycatalytic materials. The construction of the cell was modified to include aluminadisks above and below the cell for the.rnal isolation and to ensure that the pro-pellant would flow toward the sides of the engine. A retainer ring was used tocompress the glass cloth evenly and thus ensure even fuel distribution. Thealumina disks were eventually replaced with quartz which has better thermal shockresistance.
This flat-plate cell design was used to determine the optimum cell dimensionsand to evaluate the heat losses and power requirements. It was found that the cellvolume was a critical factor in determining optimum mass flow rates and the powerthat can be achieved. The latter determines the rate of heat input. The optimumcell diameter for a 0.016 in. electrode spacing and a flow rate of about 2 x 10⁻⁴ 1b/secwas found to be 0.50 in.
By measuring the temperature profile in a preliminary engine incorporatingthe cell design described above, it was determined that heat losses in the chamberand the top of the engine were primary causesof low characteristic velocities. Thefinal engine design incorporated the same cell configuration but the engine itselfwas reduced in mass using 0.010 in. to 0.020 in. walls with a total engine height of
0.040 in. This engine was run at a flow rate of 2 x 10- lbs/sec with characteristicvelocities in the range of 3900-4100 ft/sec and rise times in the 50-70 msec range.
The power requirements of the preliminary engine are minimized when the mass
flow rate and cell volume are matched so that filling occurs in a time less thanthe ignition delay time. Voltage is applied prior to initiation of fuel flow.When fuel is introduced a current pulse of about 100 msec duration occurs just priorto ignition. The energy required for ignition was about 30-40 watt-sec at 40 vand peak currents of 8-10 amps. Peak power was in the 300-400 watt range.
The final engine design incorporated a flat-plate design using two platinumelectrodes, a glass cloth separator, and two quartz disks to insulate the cell fromthe engine body. The cell was slightly compressed using the top of the engine as aretainer. The fuel inlet tube was brazed into the bottom platinum electrode so thatfuel would impact the glass cloth separator and spread throughout the cell prior toand during the ignition process. Once ignition was achieved further applicationof power was not necessary and wai needed for cold starts only. The engine ranat a combustion efficiency of 90-951 and the chamber pressure was smooth withfluctuations less than ±10%.
This basic engine concept was used to design an engine for extensive testingusing the duty cycle prescribed in the AFRPL contract.
50

AFRPL-TR-72-26
3. PHASE III
Six engines were constructed for testing during this phase of the program.The major problem areas encountered during test were associated with the degreeof compaction of the glass cloth electrolyte matrix, electrical arcing between theelectrodes at the point where the inlet tube is brazed to the lower electrode,melting of the braze at the same point due to high combustion temperatures, andthermal soak-back when using short ignition pulses and long off-times with a hotengine.
Excessive compaction of the glass cloth was avoided by placing a slight stresson the glass cloth using the upper electrode assembly and then spot welding theretainer ring to the inside of the chamber wall prior to welding of the nozzleassembly to the chamber. The maximum compaction was set at 0.002"in. for maximumfuel distribution and minimum back pressure.
Electrical arcing was eliminated by recessing the center of the lower electrodein a tapered hole in the bottom quartz insulating disk. The increased spacing atthe junction of the inlet tube with the lower electrode (about 0.003 in.greater thanthe rest of the electrode) was sufficient to prevent arcing up to an appliedvoltage of at least 42 volts.
Efficient engine operation resulted in cell temperatures in the 1800-1900 Frange. These temperatures are above the melting point oI the gold-nickel braze(20% Ni) initially used to fasten the inlet tube to the lower platinum electrode(mp 1740 F). Failure of this braze was corrected through the use of a gold-20%platinum braze which melts at 2060 F.
Of the six engines constructed, only one incorporated all the modificationsnoted above. This engine ran for a total of one hour on-time using sixty coldstarts. The pressure rise time was on the order of 30-70 milliseconds, thecharacteristic velocity range was 3800-4000 ft/sec, while the peak power require-ment for cold starts was 100-120 watts. The energy requirement was 15-30 watt-secduring ignition. This engine was run at a thrust level of 35-38 millipoundsusing a throat area of 4.94 x lO 4 in2 and a thrust coefficient of 1.6. The
specific impui.se was in the range 190-205 sec.
The tests show that the electrolytic ignition concept can be successfullyapplied to low thrust level engines at performance levels romparable to those ofcatalytic engrines, with no degradation in performance over flie time period tested.
Further development of this concept is recommended: in the areas o* (1)improvement of heat-transler characteristics, (2) further reduction of powerrequirements, (3) alternate cell design in order to achieve higher thrust levels,and (4) adaptation to other monopropellants.
51

AFRPL-TR-72-26
REFERENCES
1. Breen, B.P., M. Gerstein and M. A. McLain: Electrolytic Ignition System forMonopropellants. AFRPL-TR-69-247 Final Report, January, 1970.
2. Andrieth, L.F., and B. A. Ogg: The Chemistry of Hydrazine. John Wiley & Sons,Inc., New York, 1951.
3. Lander, J. J.: Analysis of Electrolytic Hydrazine Decomposition. Report to
AFRPL, June, 1970.
4. Lander, J.J.: Electrolysis of Hydrazine Solutions. Report to AFRPL, September,
1970.
5. Lander, J.J.: Electrolysis of Hydrazine-Hydrazine Azide. Report to AFRPL,February, 1971.
6. Brown, C.T.: Electrochemical Measurement of Corrosion in Hydrazine, UARL Report
UAR-H214, September, 1969.
7. Brown, C.T.: Electrochemical Measurement of the Decomposition or Hydrazine onSelected Materials. UARL Report UAR-H282, November, 1969.
8. Axworthy, A.E., et.al: Research on Hydrazine Decomposition. Technical ReportAFRPL-TR-68-138, July, 1968.
9. Dee, L.A. et.al: The Catalytic Decomposition of Hydrazine on Gold, Nickel, anda Gold-Nickel Brazing Alloy. Technical Report AFRPL-TR-69-77, 1969,
10. Hollywood, L.P., et al: Storage tests of Nitrogen Tetroxide and Hydrazine inAluminum Containers. NASA Technical Report 32-1-39, January, 1967.
11. Rockenfeller, J.D.; Materials Compatibility with Hydrazine-Based Monopropellants.CPIA Pub. No. 176, Vol. 1, pp 457-466, October, 1968.
12. Pugmire, T.K.,et.al: Electrothermal Hydrazine Engine Performance. AIAA/SAE 7thPropulsion Joint Specialist Conference, June, 1971. Paper No. 71-760.
52

AFRPL-TR-72-26
TABLEI
SPECIFIC CONDUCTANCE OF SELECTED HYDRAZINE-BASE PROPELLANTS
Sample Temperature Specific 1Conductance(00 (OHMff CM 1)
Propellant Grade Hydrazine 250 0.000163if II II 350 0.00026o11 If If 450 ~ 0.000477
98% 112H4 + 2% 1NV0N3 11250 0.02861I I II fl350 0.03038it it It 450 0.03201
7% N2H4 + 23% N5H5 2500191ot It If 350 0.20022
if 11 it 450 0.22191
98% N2H4 + 2% N5H5 250 0.03124+If I It 350 0.03562it It It 450 0.0486
53

TAB3LE Il
ORDER OF ANODIC POLARIZATION AT AN OVERPOTENTIhL OF lOO0mv
112144 23% N5H5 X H4 5% N2115;'i 3
Material cd. (ma/cm2) Material c.l. (ma/cm2 ) Material c.d. (na/cmr)
Pt 150 HS1414 70 HS1414 1.2
Hsl4l4 120 pt 35 Pt 1.0
Nickel 10oo
c 66 c 24 17-TPH 0.40
304ss 19 17-7011 24 Al350 0.35
A1,1350 16 304ss 8.0 C 0.28
17-7P1 5.5 A14350 7.4 3o2~ss 0.13
Inconel 600 3.4
AA6061-T6 0.11 AA606l-T6 0.019 AA1100 0.052
AA1100 0.012 AA11.0O 0.016 AA606l-T6 0.043
54$

AFRPL-TR-72-26
TABLE III
ORDER OF CATHODIC POLARIZATION AT AN OVERPOTENTIAL OF lO00mv
14 - 23% N5H5 N 4 - 5% N2H5NO3 N2 14
Material c.d.(ma/cm2) Material c.d.(ma/cm2 ) Material c.d.(ma/cm2 )
Pt 170 HS1414 103 C 0.56
HS1414 125 17-7PH 102 17-7PH 0.34
Nickel 125 - -
inconel 120 - -
17-7PH 86 AM350 70 HS1414 0.19
3o4SS 70 Pt 33 Pt 0.19
AA6061-T6 50 C .6 AM350 0.17
AA1100 48 304Ss 6.2 AA1100 0.13
AM350 48 AAIIO0 1.5 3o4SS 0.08
C 32 AA6061-T6 0.88 AA6061-T6 0.08
55

AFRPL-TR-72-26
TABLE IV
COMPARISON OF ANODIC AND CATHODIC POLARIZATION OF STAINLESS
STEELS IN 77% HYDRAZINE - 23% HYDRAZINE AZTDE
Current Density (ma/cm2 ) at r = ±1000 mv304SS AM350 17-7PH
Material Condition Anode Cathode Anode Cathode Anode Cathode
Rod-Cleaned 18 85 17 88 44 78
Plate-Uncleaned 3.9 70 16 48 5.5 86
Plate-Cleaned 19 70 17 68 5.5 20
TABLE V
ANODIC POLARIZATION OF AM350, 304SS,PYROLYTIC GRAPHITE AND PLATINUM AS
A FUNCTION OF AZIDE CONCENTRATION
Current density (ma/cm2 ) at n = 1000mv
% Azide 30SS AM350 Pt PLC
23 18 54 100 92
12 4.9 32 78 70
4.8 1.3 21 27 26
>6

TABLE VI
CATHODIC POLARIZATION OF AM350,304ss AND PLATINUM AS A FUNCTION
OF AZIDE CONCENTRATION
Current density (ma/cm2) at T, -1000 my
% Azide. 304ss PM350 Pt
23 85 90 95
12 45 47 39
4.8 13 18 27
TABLE VII
COMPARISON OF ANODIC AND CATHODICPOLARIZATION IN AZIDE AND NITRATE PROPELLANTS
Current Density (ma/cm2) at rj=±1000 my92.5% N2Hh - 4.8% N5H5 94% NPH4 -_6% N2H5N0j
Material Anodic Cathod-ic Anodic Cathodic
PI-350 21 18 7.4 15
304SS 1.3 13 7.5 24
Pyrolytic Graphite 26 -- 55 --
Platinum 27 28 21; 23
57

AFRPL-TR-72-26
TABLE VIII
ORDER OF CATHODIC POLARIZATION AT A CONSTANT CURRENT OF 5Oma
N2114 - 23% N5H5 NAH - 5% N2H5N03
Total Totalc.d. Polarization c.d. Polarization
Material (ma/cm2) (mv/ma/cm2 ) Material (ma/cm2 ) (mv/ma/cm2)
Pt 31.8 11.3 Pt 31.8 18.9
C 25.0 18.8 HslI4l4. 22.6 23.9
3o~ss 20.0 19.0 3o4ss 20.0 2.
AM350 20.0 19.0 C 25.0 27.2
HS141l4 22.5 19.5 17-7PH 24~.7 32.4
17-7PH 23.6 26.6 AM350 19.4~ 36.0
AA6o6l-T6 21.0 88 AA1100 15.8 177
AA1100 17.0 127 AA6061-T6 21.8 179
58

AFRPL-TR-72-26.
TABLE IX
ORDER OF ANODIC POLARIZATION AT A CONSTANT CURRENT OF 5Oma
N2H4 23% N H5 N2H - 5% N2H5NO3
Total Total
c.d. Polarization c.d. Polarization
Material (ma/cm2) (mv/ma/cm2) Material (ma/cm2) (mv/ma/cm2 )
Pt 31.8 14.8 Pt .31.8 18.2
C 25.0 23.2 C 25.0 26.4
HS1414 22.5 24.1 Hs14l4 22.6 28.8
3o4ss 20.0 40.0 3o4ss 20.0 38.0
17-7PH 23.6 46.6 17-.7.PH 24.7 52.6
AM350 20.0 47.5 P14350 19.4 53.6
AA6o6l-T6 21.0 95 AA6o61-T6 21.8 229
AA1100 17.0 135 AA1100 15.8 247
59

.AFRPL-TR-72-2
00
*,-o 0)
0c
.1-4
0 0 0II I II C C\i I
00 0 0 )0 00 0 00H 0 c 0 0 0 0 c'u C>c
~H H
000
HC 1 i (1H 4) ) -
0, H
4 _r
PL4 r) CY).1- P
H 0W
(~4-)
0*1- 0C'))
£0 0314,
4.1 1-
0
_00000 0)0 00 00C)0 00> 0 0 00 0 C\0 0 N 0 _r 0 _t.C' 10
C\ C\ \e NAIN\t IP tf\ H L\ r- 0 H LC\ Lrl
H- (D-)34.) 44,
n 0 P44.) 0CYU 4aS ~0 t -H
6o

AFRPL-TR-72-26
TABLE XI
POLARIZATION AS A FUNCTION OF AZIDE CONCENTRATION AT 50ma
mv/ma/cm2
Cathodic
Material 23% Azide 12% Azide 4.8% Azide
Pt 12.6 16.0 24.8
Py C -- -- 45.6
304SS 17.0 24.8 35.2
AM350 19.1 21.6 26.4
AnodicMaterial 23% Azide 12% Azide 4.8% Azide
Pt 21.5 22.8 35.2
Py C 15.8 27.2 21.2
304SS 51.8 50.0 57.5
AM350 37.0 30.0 41.5
61

AFRPL-TR-72-26
TABLE XII
COMPARISON OF POLARIZATION IN HYDRAZINE-HYDRAZINE AZIDE
AND HYDRAZINE-HYDRAZINE NITRATE AT A CONSTANT CURRENT OF 50ma
Cathodic
4.8% Azide 6.0% Nlitrate
Material n (mv) mv/ma/cm 2 n (my) mv/ma/cm 2
Pt 620 24.8 540 21.6PyC 114o 45.6 1550 62.030SS 880 35.2 920 36.8AM350 660 26.4 720 28.8
Anodic
4.8% Azide 6.0% Nitrate
Material n (my) mv/ma/cm 2 r (my) mv/ma/cm 2
Pt 880 35.2 350 14.0PyC 530 21.2 1020 40.9301SS 1110 57.5 . 1550 62.0A1350 iOho 41.5 1050 42.0
62
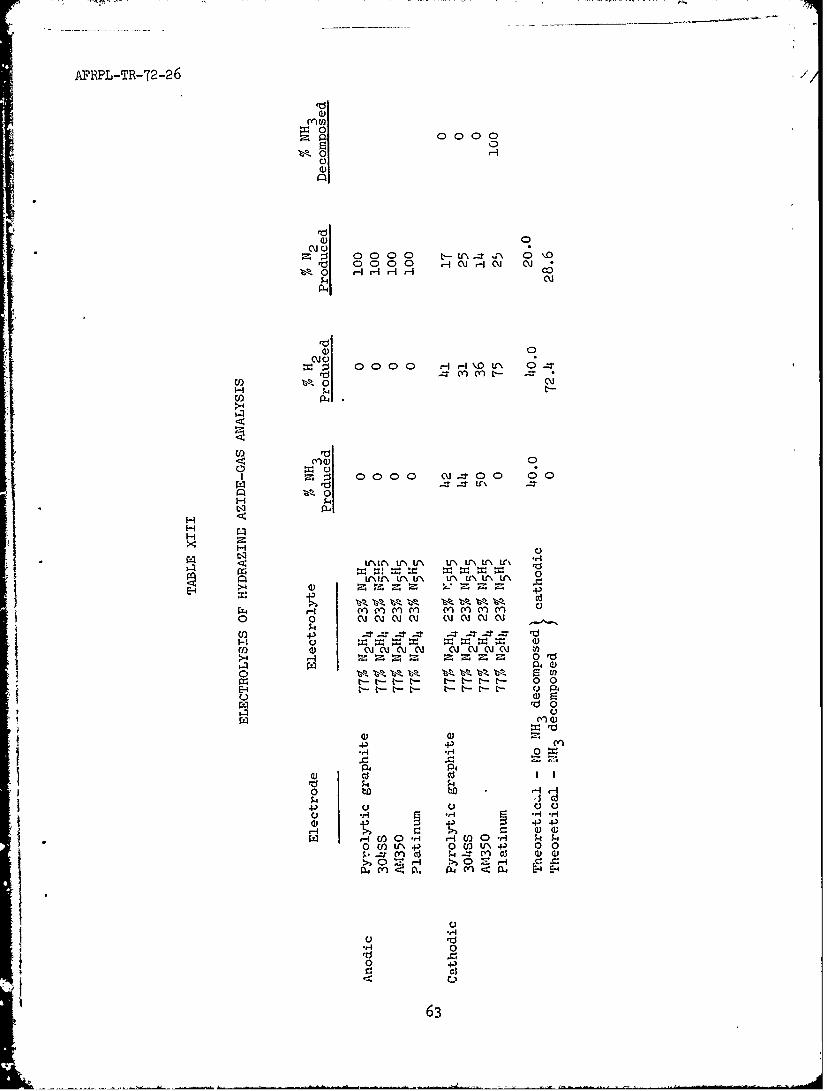
AFRPL-TR-7r2-26
00
'rda) 0
C~ 0000L~~ \0 0 000 H C~j HiC C~j
I A0 H rIHHH-C~j
a1) 0CQ ci
:3 0 )000 HHrI\.LA 0r\ -
Cl) LA 0 C'.,H 4
CP4
U) ooo god
r1\
00
z i4O1-4 z C2~ 4.
0) 4.)
(1)W Cj ~j ~j j ~j ~j ~jC~-zt>4 0 I31.p.a

AFRPL-TR-712..26 /
o H "
c~ 0 0 00 \ H Hr H~ 0 C~ o c
m _: 0 Hq U\ \0 _:r
+ + + I + + I
:>f~ + + ++ + +H
4-3 0 0 0 0 0 0 0 C0(ai 0 0 0 0 00 0 0ri cm cUi C\j N' CM CM CUj CU
U) 4.)0> *,-) C)f :r4 c) *,o C) *
't rI 0- Ht 0- 'tI 0- 'tIO .r £ 0 r
04 t 0 P4) H
H4 14P
O- W bs C c d d i C d
04 0 H H 0 ~* rW\ !f () (1) Y 4Y) 4
(D >>

AFRPL-TR-72-26
(a00
cH H- Q'l -t c'o
co '10 :tC0 P4'
ol
00
\.O C C 0 0 \.8
co or to
02
v LfN# rl - o ~
0 C" ~ ~
02. (L) \C 0 \0 0 \0 0 \D
6-' 00
bD
cP4 0. o
rx4 E0 0
4'0 01
4 .) 4. .0 C) C)
a4 4 P 04-V6t5

AFRPL-TR-72 -26
4-) 4-) 0 ) m A _z A U'\ t- LAj C4 0
H H QH C 6 C
0
431 ) 0) 0) 0 0 C) ) 0) ) 0) 0) C
w ~ m0 0 Y) 0 -\ _CD Lr co LA t-jt~
0H
QL# (1)4 LA\ C) C) L A C) A LA C C
"0i L (- l O\ H CM t- H- LA C%~ LA -
(f) H-Ia)J ~ C H C C; CM Cl H H C) CML) HI-
1-t -
P; LA C) C)\ LA C) C LA\ LA\ C) LA C)H 4)4-3 01 C) 0 N\ %- M H L l 0 C 0
L)
0
4-3
o) N) C C) C) C) C) 0) 0) C )*.-cqz C) 0l _ t r 0 UN 0)'0 ~ ~ ~ C
0
CC.
C/) 0 n~ ) C C) C) L r)4 ) C C) C; ) C
0 4343) C)q nl H L -1 -ZCo-
H H 0 '
0 E4
0
C) C) ) C) ) C) C) C) C) C
4-) o*
46-,
000c
C) 431 C) H3 4-I C) H '. .C C ) ) C
04-4I
Cl '~2 CD Cl o fl C )l CO C '~ C
E1
1
").4 '-4 ., -1A*4 C) C) 1 i C) UI., 4 0.) ol . P 4- 1 V A.) () U )
Ct ,, cc .1
'-4 H H H H C) C) )66

AFRPL-TR-226
GOO
-. 00
0 uC f
4 P
0
0
0 Lr 0N C\N .
0 0 0 0
0 U
E1
67

AFRPLTR-72,26
TABLE XVIII
EQUILIBRIUM DECOMPOSITION RATESOF 77% HYDRAZINE-23% HYDRAZINE AZIDE AT 3000K
idecomp N5H5 Decomposition 42H4 Decompositionfor N5H5 Rate At 3000K Rate at 3221KM aterial (ma/cm2 ) (g/cm2 /year . (g/cm2 /year)
Pt 12.0 276.5 26.1
Graphite 4.0 91.0 7.84
AM350 0.094 0.214 0.112
304SS 0.14 0.320 0.020
17-7PH 0.019 0.043 0.015
68

AFRPL-TR-72-26
TABLE XIX
COMPARISON OF COMPATIBILITY DATA
(Electrochemical vs. Storageand Gas Evolution Methods)
Decomposition
Time of Rate
Material Temp. (OF) Exposure (hr) mgN2{4/cm2/year Reference
304SS 288 75.5 22.2 8304SS 160 1 62.5 6&7304ss 16o 24 67.5 6&7304SS 140 1 31.2 6&7304SS 140 5 11.2 6&7304SS 120 1 19.8 6&7304SS 120 5 9.1 6&7304SS 120 24 2.6 6&7
Au-Ni 140 24 409 9(Hs1414)Au-Ni 140 1 3350 6&7Au-Ni 140 24 3300 6&7Au-Ni 120 1 2080 6&7Au-Ni 120 24 2060 6&7
AA6061-T6 85 1440 0.32 10AA6o61-T6 120 1 0.88 6&7AA6061-T6 120 5 0.065 6&7a6061-T6 .6o 1 0.78 6&7AA6061-T6 i60 20 0.26 6&7AA6o61-T6 160 67 0.34 6&7
AA1100 140 72 1.17 11AA1100 i,0 1 8.85 6&7AA1100 140 5 1.60 6&7iaAllO0 120 1 10.9 6&7AA.1O0 120 24 0.95 9?7
69
Ii ......... ...-J

AFRPL-TR-72-26
TABLE XX
INDICATED ACTIVATION ENERGIES FOR HYDRAZINE
AND HYDRAZINE AZIDE DECOMPOSITION
(Kcal/mole)
Mzterial 77% N2H-23% N5H 5 N2Hh
Cathodic Anodic Anodic
304SS 3.4 7.3 5.1
AM350 0.8 7.6 5.0
17-711 1.14 9.0
Platinum 0.5 o.6
Pyrolytic - 2.3Graphite
HS1141h - 1.3
AE. applies over the following temperature range:
77% N2 114-23% N5if5 Temperature Range 27 - 107 C300 - 380 K81 - 225 F
N21f, Tei.perature Range 49 - 71 C322 - 341120 - 140 F
70

AFRPL-TR-72-26
*-..H C'J (A C 4 C A' .4 Cfl A
0 010 0 0 0 0 0
Fj 00 0 000 00 000 \0 H mr H nr ON m~ m
(Y)(1 m M m M _t H CM mM CM
1_ 0 0 0' \
4-)C\ CY) CM c C-J CMI
0 0 O 000000 m0 0 0
00
'4-1
Cd a)
0H H,1.
0 0 0 0 0 00i Cd d )
4)k
W 0CUS ' o)
*ri C) 4-I\ -PU\S\L\ U\ l N 0 0 0
"4 ODOc-Ic OD -I rI - H * Nt N 0),~rn :4CM Q)I C E-0
P rH H H~l HN H H HC~J CM 0N041 ~ ~ ~ ~ ~ - 0 (N \ ") M 4 0
71)

AFRPL-TR-72 -26
S 0 Cim CUj CV
000 0 0 0~CI] U-\ mr tf\ 0
.t C\J CD O\r H cm H- H
00 0 0
1: ) 0 0 0 0D0 0 0 0-r U- Cj I:-
C.) .43 ~ r H
HC
H rxmP-E-1
C.)d
Hfi
0Po ()+4 0 0 0 0
E-1 4 ' - :* .t -
C.) kOC .0 OD O
*40
-rlG fl 4.D CO
00
H 4tH Mr tC' L-' 100 P tH;;O0
1: 4O ~ Cj
~~-'72

AFRPL-TR-72-26
TABLE XXIII
ELECTROLYTIC ENGINE PERFORMANCE DATA FOR ENGINES (FP-2) AND (FP-3)
Run # Pc C is F t90 tl0
(psia) (ft/sec) (ib-sec/ib). (mlb). (msec) (msec) (ib/sec)xlO 4)
5-IA-2 39 1966 98 23 250 900 2.21
5-2A-1 33 3014 150 18 1500 900 1.22
5-3A-1 30 3755 187 16 150 1800 0.69
5-3A-3 33 4131 205 18 100 2200 0.69
5-4A 27 2296 114 15 100 2100 1.31
5-5A 48 2571 128 27 200 150 2.08
5-8A 63 1475 73 35 250 4OO 4.76
6-4-i 39 1889 94 22 150 40 2.30
6-5-1 42 2176 108 23 200 300 2.15
10-3 * 64 2580 128 35.4 50 700 3.0
lO-4* 43 2600 129 23.6 300 400 2.0
1O-5A* 46 2520 125 25.4 250 400 2.2
All runs made at 24 volts and 0.5 amp
*These runs made with engine configuration FP-3.
Cold Start Temperature: 70 F
73

AFRPL-TR-72-26 //
TABLE XXIV
RESISTANCE MEASUREMENTS IN ELECTROLYTICIGNITION CELLS
1.0 Inch Cell 0.5 Inch Cell
Volume of Propellant Resistance Volume of Propellant Resistanceadded (cC), (ohms) added (cc) (ohms)
0.0105 290.1
0.02 162.0 0.01 4.40.04 12.5 *0.015 2.50.045 8.1 0.02 2.80.050 5.5 0.06 2.10.055 3.2 0.12 1.8
*0.06 2.1
0.08 1.40.10 1.1o.12 0.7
* Volume of propellant in flooded * Volume of propellant incell flooded cell
74

AFRPL-TR-72-26
TABLE XXV
RESULTS OF RESISTANCE MEASUREMENTS IN ELECTROLYTIC IGNITION CELLS
1.0 Inch Cell
Total Volume 0.206 cm3
Fuel Volume 0.06 cm3 (65 mg propellant)
Porosity 29%
Resistance of electrolytein open cell (at 2 x 10⁻¹ ohm l
cm.q 1) - o.o4 ohm
Resistance of full cell (withmatrix)
2.1 ohms
Resistance Factor 52.5
Time to fill cell at 5 x lO"lbs/sec (0.20 cc/sec) 300 msec
0.5 Inch Cell
Total Volume = 0.0515 cm3
Fuel Volume 0.015 cm3 or 16 mg propellant
Porosity 29%
Resistance of electrolyte inop. n cell (at 2 x 10⁻¹ ohm-1
) 0.16
Resistance of full cell (with
matrix) - 2.8 ohms
Resistance Factor - 17.5
Time to fill cell at 5 x 10 4
lbs/sec 75 msec
75
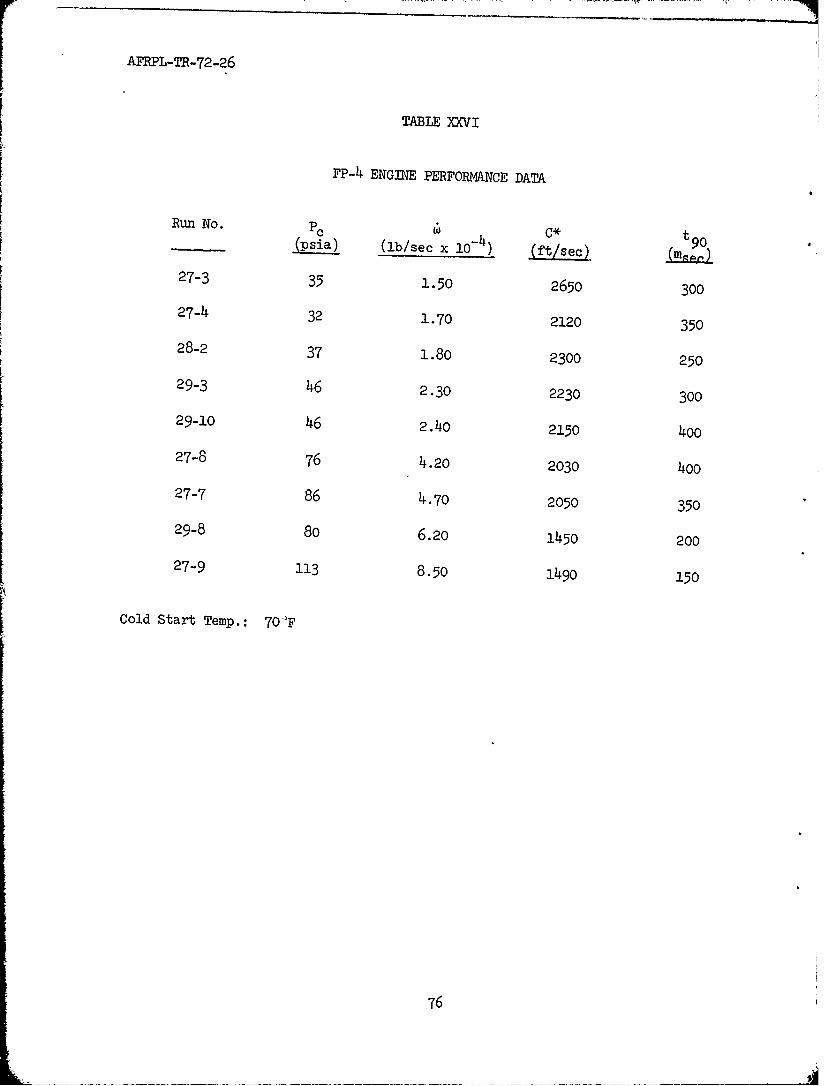
AFRPL-TR-72-26
TABLE XXVI
FP-4 ENGINE PERFORMANCE DATA
Run No. l C*(pi) (ib/sec x 10-4 ) (f/c. 9
27-3 35 1.50 2650 300
27-4 32 1.70 2120 350
28-2 37 1.80 2300 250
29-3 46 2.30 2230 300
29-10 46 2.40 2150 400
27-8 76 4.20 2030 4oo
27-7 86 4.70 2050 350
29-8 80 6.20 1450 200
27-9 113 8.50 149o 150
Cold Start Temp.: 70>F
76
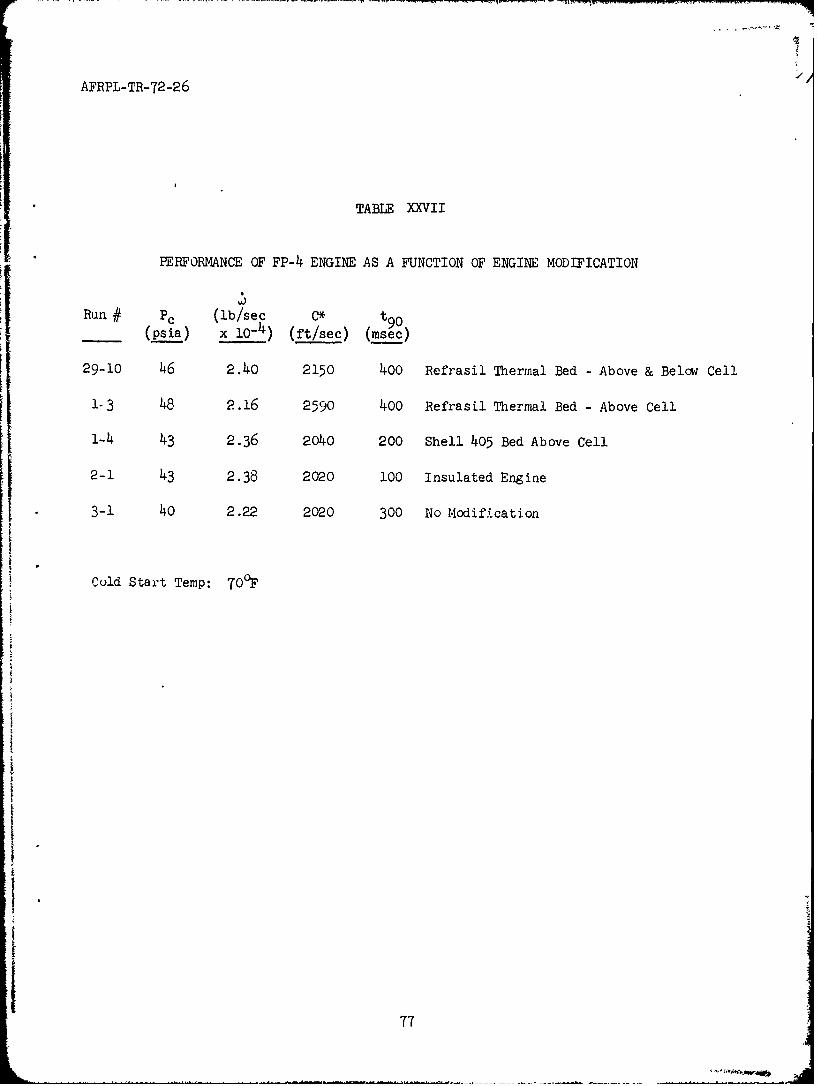
AFRPL-TR-72-26
TABLE XXVII
PERFORMANCE OF FP-4 ENGINE AS A FUNCTION OF ENGINE MODIFICATION
Run # Pc (lb/sec C* t90(psia) x lO-4 ) (ft/sec) (msec)
29-10 46 2.40 2150 400 Refrasil Thermal Bed - Above & Below Cell
1-3 48 2.16 2590 400 Refrasil Thermal Bed - Above Cell
1-4 43 2.36 2040 200 Shell 405 Bed Above Cell
2-1 43 2.38 2020 100 Insulated Engine
3-1 40 2.22 2020 300 No Modification
Cold Start Temp: 70°F
77

AFRPL-TR-72-26
TABLE )0(VIII
FP-4+ ENGINJE TE14PERATIY-RE PROFILE
Distance ofRun # Thermocouple k) Equilibriumn PC Total Run Time 0*
From Cell (lb/sec Temperature
(m__) x 1-4 (OF) (psia) (sec) (ft/sec)
3-1 In cell 2.2 1500 4o 6.4 2020
5-3 0 2.3 820 43 10.2 2100
5-8 0 3.8 990 80 8.1 2360
5-4 3 2.2 860 46 17.2 2340
5-5 10 2.2 610 43 15.6 21,)0
5-6 15 2.2 610 43 17.0 2100
5-9 154.3 650 'Il 4.7 2400
5-7 17 2.0 300 4o 16.d 2240
78

AFRPL-TR-72-26
TABLE XXIX
ENERGY AND POWER REQUIREMENTS(ENGINE CONFIGURATION FP-4)
Run # Ipeak Pulse Width Total Ignition Energy Peak Power(lbs/sec x l0-4 ) (amps) (msec) (watt-sec) (watts)
27-9A 8.50 8.4 570 105 320
27-9C 8.50 9.2 500 100 360
29-8A 6.20 7.0 300 19 280
2-1A 2.38 5.8 530 56 240
5-8B 3.80 8.8 220 41 360
5-9B 4.60 10.4 130 27 400
79

AFRPL- TR-72 -26
f 0 0l
0 Co C
.,44
Cl 0 0- 0
0Eli 0r
H~Lf (Y)a 0 ~
4-3
00
0) 0
U " C 1- H
80

AFRPL-TR-72-26
TABLE XXXI
PERFORMANCE DATA
(ENGINE CONFIGURATION FP-5A)
w Pc C* t90 10
hun# (lbs/secxlO-4 ) (psia) (ft/sec) (msec) (msec)
29-1OB 1.10 29 2910 240 120
2b-5B 1.10 28 2810 280 180
29-10A 1.10 29 2890 100 160
30-1B 1.20 37 3340
30-1A 1.30 33 2940
29-4B 1.30 33 2850 360 110
29-4A 1.30 33 276c lO 270
29-5B 1.40 37 2890 330 120
29-IB 1.4o 37 2870 410 14029-IA 1.40 37 2850 160 120
28-7B 1.40 35 2700 170 200
28-7A 1.50 33 2 460 310 100
29-5A 1.50 37 2720 460 110
28-11 1.6o 37 2520 16o 130
28-13B 1.70 4o 2660 380 130
20-3B 1.70 44 2860 160 120
29-3A 1.70 45 2900 - -
29-6B 1.70 46 2960 350 110
28-12 1.80 44 2760 190 130
29-6A 1.80 42 2620 130 160
29-3C 1.80 42 2550 i60 130
30-2 1.90 50 2970 100 220
28-13C 1.90 44 2580 560 1ho
28-14C 2.00 54 3010 500 230
2b-14A 2.00 49 2720 - 120
26-14B 2.10 50 2620 310 180
29-8B 2.20 60 301o0 270 120
29-8A 2.30 55 2700 80 130
29-9B 2.40 60 2820 50 130
29-9C 2.40 60 2820 60 120
29-2 2.60 65 2830 - -
29-lB 2.80 67 26b0 150 110
81i

AFRPL-TR-72-26
TABLE XXXII
PERFORMANCE DATA(ENGINE CONFIGURXATION FP-5B)
Cold Start
PC C* Isp t90 l0 Temp
Run# (lbs/secxlO- ) (psia) (ft/sec, (sec) (msec) (msec) OF
11-12(HS) 1.02 37 4060 202 10 120 156
10-5B 1.14 41 4030 200 110 420 72
12-1(CS) 1.46 46 3550 176 170 320 -55li-11 1.46 49 3720 185 180 180 7711-13(HS) 1.74 62 3990 198 35 140 173
12-2 1 79 68 4210 209 i::0 - 72
ll-10B(HS) 1.88 70 4140 206 170 200 296
I!-9B(CS) 1.92 68 3950 196 80 210 -151-10(CS) 1.97 6y 3800 189 120 200 -25
i0-5(CS) 1.99 73 411o 20Lt 80 - 113
11-5(CS) 2.03 68 3750 186 170 200 -1511-7 2.08 73 3890 193 60 220 72
11-3C 2.08 74 3980 198 60 240 72
II-4(cs) 2.08 68 3630 180 130 210 -1511-6 2.11 73 3860 192 160 320 72
11-15(HS) 2.42 69 3190 159 90 420 134
Theoretical Characteristic Velocity (C*)= 4340 ft/sec
Theoret> nl Specific Impulse (Isp) = 246 sec
82

AFRPL-TR-.7'2-2-6
0 ) O0 0 0 0 0
U)
OH -. -
H 9
0
P9 a
04)
4-J) \0
(Y-0 2
S4-)
'-~.0
z. 4)1S4a ILIII-4 -
Lr\ ~ ~ ~ ~ ~ - L4 NC'O ''J\ nP
4 14
U U) (1
N*

AFR~PL-TR-72-26 *
-4 H LC~ H 0(' H Y
0 $4
E-0
00
4
0) 0) riri r
0 I rI C 0-)0 1 CQ I- I- 0 0 0 4-I~~~~~- O O H I H I 0
o OOJ0 o :~4HO00
* III Io4 1 o 0
I If c 0 00 0
-1 1- rI i0 E- C4> B Ir (L)LQ) 4-4 A
0 0o 0 - 0 0-H , 0 -1 ' C; HD I (D-4A
10 4)ra1 0 .1D H p,4
E -4 In (nO I )0 ) 0 o0)~~. C0 V). 0 ~ )
I aI I I*
I II I mU 00 a)FArj OCri V)
I Ig Cd E-4
I I I I P4
4-) H-
10 0
Hd Ccj C) c-
CA*
814

AFRPL-TR--7 2-26
0C\L C') LA\ if% m'
.)-. 0 0 0 0 0 0 0 0 0 0m~ Cuj co _ t~- co Cj UN \D0 O\
t* ri LA H LI Cuj H \.0 0 M t-- 00- Cuj m' mY m~ m~ Cuj (n~ m" (Vn cu
*ri
0C0 0 0 C0 0C 0 I ;4I
*" 0 - Cuj -- r _: I V\ I I I4.
H ) V4:r)\ r
W
4>
4)
0
04 0
4.' (fl H- Cuj (Y Cul I H- Cuj I Ip
1 4)
E-1-
41)
* 5g.4-,W4-'4 Cuj Cu Cuj H mf Cuj mV CC) O '. 0
Cu)
f-40
0U-T- (Y Y4() (n' UN 0 0 m~ 0 \10 4- 4'ml~) 1 LA\ UN \D0 U\ UN LA UN _T 4-)
+)
0 4)
$4 ca
0 '0 Cu m4 CO .LA \ 0- 0- uN 0
-. Cuj H Cuj Cuj C'1 C Cu C Cu CuU)
H- Cul CY -4 LA\ H CujI 1 1 I I I I Hq CujLA\ LAI LA J\ LA \.0 \.0 I I
H H H H Cui Cu, CulI I I I I I I I
x CN CM Cu cm Cu Cu Cu M m m
85

r AFRPL-TR-72-26
00000 000000000
0 0) 0 C0 000000 (D'1 10o1 0 1 Cn0000CN II I
4-) 1CVJ I H I r-I ~ '2L~ nI
('
0 DC 0 00Cd0 1 0 00000000 I
I- JC'4~
00
C))
E-4 W 4
0 00 0 c 0 000(
0 0
CI 0
0 00 0r01 L0 -\ 0 H CJ'Y C)0 iLr\Lu\ C\ c OLr(\\ 0d 00 L\0 ),o uL L\ t2-
0)+) 4-)
"I : r 04
.04-
-r r 1 , )L \0 D Z
I~HHCJ C'J Hv H H) a\ 0i H
860

AFRPL-TR-72-26
4~I 0000000000000000000000000
DO01 -l~\0 \ i j'iA H HH-I J HHHN H HH H HH HHfI qH CH -i H r 4 H H H H- H .- H H H H H H H H H- H H
C4) 000 0 0 0 0 00 0 0 0 0 0
L04' 0 0000 000 00 00 000000 (Y0 4
0
0 -- 0 t- CO V\ -. 0m t- O t- 0 0 -IT 0 o CO j \0 C \ C -.o o () cmJ H -0 aE-4 ~ ~ ~ ~ U ( _rM J0rI \oMr- MMMH H HHH r CjTCn_ -
0 4.-i (Y (l r-i LAj M m C-) \ 00 tY - -Y CY CY) M . \O Lm m~ m A \0 . H cxi (n t-) Hncn0Ua)
00
30 a) Q D CM 0 0 0 0 00 O\ '-I 0 0 -. r CMO H H N~ m~ \ 0 \ mV w (yC)' CxMU )
- .i U ( H H C ' J H H H H H C' t-:H.6C ' JE- iU)r- - -
0H
0 HC-L4-C~LAHH A\O~ C~a' HHHH H4H
iiiY c Y - r z L-U 0i tilI gill cn Ns 0\. \.o ar . r , : HCjc -M 0 0 0 0 0 0 mV V mU U 0 N(n-t- L\ .\L\ e rUN_:rz *AH H H H H H H H H H H H H )
1111 11 l ii 1111 1111 1ca
87i

r ~ ~AFEPL-TR-72 -26 )-'
0 -P 0 C~ E- I C 00OCONNNOJ I IO 0C lJIom
p4)
UI 0r\Ot I 0 -\ Lr 0LAU- \ 0 a - Ln~ L\Hr-
CM ClH C C C ~iC IOCII M
P4
'Y c m cocco co J ~-~~- ~ \U
a)
4oo o lia i i ao Il~li( 10
4'4
0 0
X U)x * ... 00000000000000000000 En2
C'4-1 1 HC H ' H0 C H HCiC \D t-o oC) 0 _ r p -
a4-
-A 3 ) U-\~U 1:: 000 0 0 0 0 0 C 0 0 $4)~~±i 0LA~' N M nM MM MM M\C' U\ 4lllll~~(~' -)
Cc 14 4'E; a,
14 P4k
.,-I (V fj)0. Ui Y - 1 _ - t- : n (Y) Cl l (11 \4.) 4-)
-4 -4r-4 0
0 (0 H- C0 \D 0 X'\ ^j (7\ H- VN' IC r\ (\ 0 JD r0 H D ~ \UUf) I :70 (0 coco0 Lo 0 ( o00 '3\'X) 0 ,c c
.k04.)M C ~ -4 \H H J H HH-H H M.
*00
c~iiga a 111 111 1 aga n

AFRPL-TR-72-2 6
P )4) C\J LI mV 0) co _-rlev 4- H C\j m H CMj mY
4
co ON 00 Y) Y y
00 _r C. \0 m~ E HH- H H- H- H-
>4
\O 4-; t\ \0 ur\ Ur\ H0' CMj N 0 NM 0 0 (Y
X4a H H- H- H- Hi H- 4
A 0
00
LA)
0(1) 0 0 LA0Ul t'
E-44
005
pq
Cd
a))
89

43
AFRPL-TR-72-26 4
0 -4
P 4 & 1 ti'cI 1 4C . 4 A .C4
04) 0O00000O\C 00 000000000000 00
HH o\ - r r\riM 0- -t\ g - - 0 HHH 0 0 )r -I t
\0 00001 0 000 0000 000000 0 00
00I00000000000000000000000
04-3 cO (Y) (V) (Y) (Y) (Y) CVY) (\J (Yo () (Y) mO (n CY) (n (n mV (V) (Y) CV) CV) o (Y') 01COC
0 C,
b4--I C . C; (s C3( W-qI LA LAO rLA 00 L A (Y) n HY- (n Hn LA co LA cLA LA LA LA(ALnA A
-1 4)- 0 .f U
A U) U)
tx U H r 0' C t 0 LC A H C\ L A UU L\ L\0 L\f LA UN"0 r LV 4-
_:t 0U'HHCI~ H:1 t-(HHHHHID\.HH t: HIr.CtL
Ucc
C,)
4434-)
90

AFRPL-TR-72-26
a) p
94-
4.'4
4-1
a
M, In *n C) * * r 1 .;( ; 1 C .;1 ;C ;
U\ 5.mCUNC ~(VCl0 00 o 00 ~0 C0 1000 00 N09400U\"00Nvc c -IL\NH0U D00 o0c
r4 0000000000 000000 000000000004' I \D - Lr\Cn 0 D N JC4J c ~ m _-:T I z 0-7\ : : I -
__ I : _I - : LA LU\ Lf\-S I M -4 LA ---t M M M
0 00000)0 0C)0 00 00 00000000
4r-j I I _zr.tHH- i' -Hi Hi \H \JDU
42)U) 0000000000 000000 000000000000
\* \. \0_rra\www\ L\ Lr \0\0 NC'\0 co H00LC'\CLr\ 0 V L C'J\U~ 43 . (Y) (Y) __r -1 m~ (Y) mf mV (n (\M mV) -.1 : tf\ .: 0G\ WU t- u''\ \ A\O I-- t- I-- t-
43 ) 000 0 00 m~ t- 00 0 00000 0
U)U
0),
U) (a
LIr4 L' Lr\ U -\ir m H- H Ln' LI'. Lr\ LI'\a~~ U) U 0f
a\. 0 0 0 0 0 0 00 0\. 0~ t) - t- tL C- C'- 0 ' \')U.- I.'0 0 ) 'o -0o
.3 0 U , . 10 X0HD oH H 4H 0\. 0 30 Th .7\0.3\ 9\
H 4) m)14 c m 1 ir \0 - o a\H _ N D -1-4 1 m-1 U\ - -1w rnm -r -
91

AFRPL-TR....2..26
(D
43
$;4
C)d
a) (Y; (U C, C)
4 :T 0:z ) C) 0 0
H- HH HH H*HIH
C) -C) C C) 0 o0U00 00 0 0 0 C0000 0 0 0
U HH UI H- LAHHHH-r-T-I rH N H H - H HHC IH N H
C-,
-C) 2 000 0 0 OO~ 00000000C 00C0 00 07\ 0' -rC , r DU\U re) C~ 'IQ \ \Z 1-4 ($
0 1000 0 0 ~ ooo Oco 00 0 0000
0--1 H00 r f U H - C H -z 1 \ O c J \ Y :
M) 100\ 0, 0 M00 0 0 0 N\J 00 ~ 0\0 r0 0
C) HaY) 0r H 'HH1H cooj) oc0W E-4 \0o Ho
r 0" 0 1 1 1U
CJ0 P4- 040D 40 0 04 -t. AA I "~ I( 04
., VCI UNl~'( Hi' H H-
H -: LAr\
- : A ur I;3 IU)* Ir
0\ - -i 0\00C) 4'~
0z N - ' )- N) H-TU ) 0 - .
U)H 04U HY
co)H U)
Z) U)0 U)0 -
HA xi 14 14' H LAH . I A H -I I
U4-
43 41
Sco $0 a) colcoco 10, 1 LA H-
92

AFRPL-TR-72 -26
a)-,
4-3
;-4
4.)U)
4.) 4-'
0
1- -H riririH - - - C\H HH A(Y) (n \M 0 U) U)
0.~ 0 0 00 0 00 00 V00 1000\ fU\0 00 ('1 0 Ir 5-i 5
OD I 000 00 N00 \0 oLA0 m1- l\ H0ULA V)(Y 00 0 100 Lr V oLAODoC. N (n C -U (Y C\ -T LA C~ju'r)CY1 LY H ( 'i) mc1 00 m m m I C~LA- I _-x -'r
r-IC I(' r- r- -i ) -iH H HCi H1(j-i-1r- -ir- I C- I (? -i~
0 4
H ~ 00100000000000000000000 000 000
H ~ H \0 \H tH -E 0mrHc 0NC - -- m0 -Tt-C-H I\ :
C\U)4. 0000000000000-,000 000000 000 0000
* 4. L\ \1- \D 0n c L A H \0 -*E-0\- Cf\ 0A coC\0 \ D c-u C\ LA LA' m\ '0 _:: (n O
bnH 0000000000000000000000 00('0 I 004-I) HN00L-HA:H0 D c)HHH :rHHH:rE- HH 0 H\0 o THmHHiU L DHLA\'.0 ~jCC
0~ 44 t A [-s:E-\ 0 1 1 - 0\ - 0 J :-NU r AL\ r 00 _rCjt -
w P4 CCl0 4 0 u -IP4
Im -4 LA\ LALAL LA LI fl L
ciP4 r '.0'. L'o \o i L -LA\ LALA'0\.Di T Cj \0 .O~0 'A .- -) q'L 0, C)\
-. LA C- LA 0 r 1r- ~ M m m - r i\1010 E-0
93 4

AFRPL-TR-72-26 FG
TEMPERAYURE DEPENDENCE OF ELECTRICAL CONDUCTIVITY IN HYDRAZINE SOLUTION
E
E
0z0
Uh
o -NM2H 4
0 - N2 H 4 -2% NH 4NOa - N2 H4 -27oN 5 H3
N 2 H4 -23% NSH5
3.03.14 3.18 3.22 3.26 3.30 3.34 3.38
1/T X 103_ OK- 1

4FRPL-TR-72-26 FIG. 2
0 A
z
w Ln
C,,
,, ,-
,
0:
w w w -c- m -V~
CLI___ 'cc
FTJ/
RL-70-29 1-A
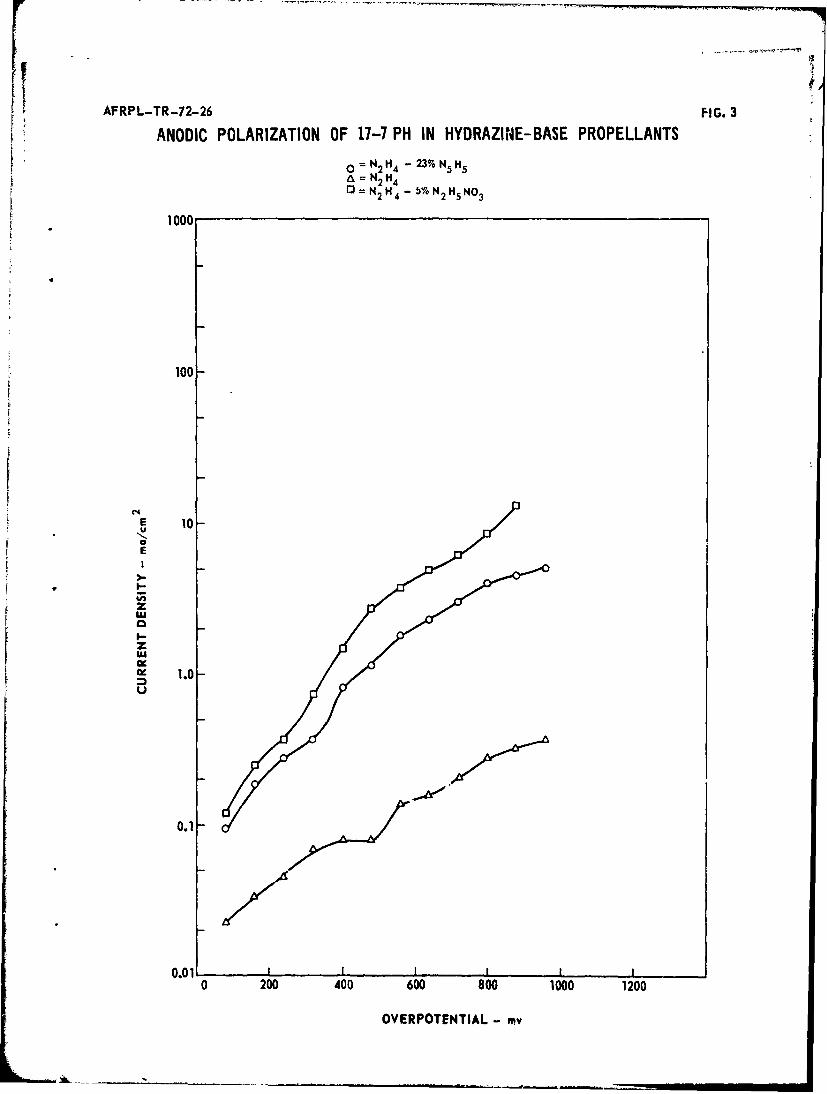
AFRPL-TR-72-26 FIG. 3
ANODIC POLARIZATION OF 17-7 PH IN HYDRAZINE-BASE PROPELLANTS
= N2 H4 - 23% N5 H5, N 2 H42H4 - 5%N 2 H5 NO 3
1000
100-
0.4E 10-0
E
* ~ I-
z'U
0.1
I-z
S 1.0
0.1
0.O1 i II !
0 200 400 600 800 1000 1200
OVERPOTENTIAL- mv

AFRPL-TR-72-26 FIG. 4
ANODIC POLARIZATION OF 304SS IN HYDRAZINE-BASE PROPELLANTS
o = N2 H 4 - 23% N5 H5A =N 2 H4
O =N 2 H4 -5% N 2 H5 NO 3
1000
100
N(-.E 10
u
E
i
lzce 1.0
0.1
0.01
0 200 400 600 800 1000 1200
OVERPOTENTIAL - my

AFPRL-..TR-..72-.265
ANODIC POLARIZATION OF AM 350 IN HYDRAZINE- BASE PROPELLANTS
oH4 -2% 5 H54 = N2 H413 = N2 H4 - 5% N2 H5 N0 3
10
E
mu0
t
mu
0.01
0.001
0 200 400 600 800 1000 1200
OVERPOTENTIAL - mv

.- RPL-TR-72-26 FIG. 6
ANODIC POLARIZATION OF HS 1414 IN HYDRAZINE-BASE PROPELLANTS
0 =N2H4 - 23%NsH5vA = N2H 4
C3 N2 H4 -5%N 2 H 5 NO 3
1000
100
Eu 10
E
wzIaFz
w
0 1.11F
0.1 -
0.01 20 ,
0 200 400 600 800 1000 1200
OVERPOTENTIAL - mv

AFRPL-TR-72-26 FIG. 7ANODIC POLARIZATION OF PLATINUM IN HYDRAZINE-BASE*-PROPELLANTS
[ o0=H 2H4 -23%N 5 H5A= N2H40= N2 H4 -5% N2 H5 N0 3
100
100
0 1.0-
0.01
0 200 400 600 800 1000 1200
OVERPOTENTIAL - my

AFRPL-TR-72. 2 6 FIG. 8ANODIC POLARIZATION OF GRAPHITE IN HYDRAZINE-BASE PROPELLANTS
o =N 2 H4 - 23%N 5 H 5
A =N 2 H 4
0' N2 H4 -5%N 2 H5 NO 3
1000
100
C,'E 100
ELI
z
1.0
u
0.1
0.010 200 400 600 800 1000 1200
OVERPOTENTIAL - mv

AFRPL - rR-72-26 FiG. 1
ANODIC POLARIZATION OF AA 1100 IN HYDRAZINE- BASE PROPELLANTS
a NH-. 23" N H;A N H:
N: H1 - 5 N:HtNO
LU
uiI n
0.00
200 .00 600 goo 1000 12?,)
OVERPOTENTIAL
I--

AFRPL-TR-72-26 FIG. 10
ANODIC POLARIZATION OF AA 6061-T6 IN HYDRAZINE-BASE PROPELLANTS
0 =N 2H4 - 23% N5 H5A = N2 H4
0 =N 2 H4 -5%N 2 H5 No 3
10
I-
1.0
Le0.0I
u
E
0.0001
0 200 400 600 800 1000 1200
OVERPOTENTIAL -

4AFRPL-TR-72-26 FIG. 11
ANODIC POLARIZATION OF NICKEL, PLATINUM, AND INCONELIN 71% HYDRAZINE-23% HYDRAZINE AZIDE
0 =PLATINUM
0 = INCONEL
100 A = NICKEL
E
adI--r
0.10 200 400 600 800 1000 1200
OVER POTENTIAL-mv

AFRPL-TR-72-26 FIG. 12
CATHODIC POLARIZATION OF 17-7 PH IN HYDRAZINE-BASE PROPELLANTS
0 =N H - 23%N H
A =N 2H 4
S=N 2 H4 - 5% N2 H5 NO3
1000
100
E 10
E
I-
I-
:3 1.0 /
0.1
0.01I0 -200 -400 -600 -800 -1000 -1200
OVERPOTENTIAL - mv

AFRPL-TR-72-26 FIG. 13
CATHODIC POLARIZATION OF 304 SS IN HYDRAZINE-BASE PROPELLANTS
0 = N2 H4 - 23% N 5 H5a = N2 H4
- = N 2 H4 - 5% N2 H5 NO 3
1000
100
.E
a
1.-
0.1
0.01
0 -200 -400 -600 -800 -1000 -1200
OVERPOTENTIAL - my

AFRPL-TR-72-26 FIG. 14
CATHODIC POLARIZATION OF AM 350 IN HYDRAZINE-BASE PROPELLANTS
o = N2 H4 -23% N5 H 5A = N2 H4o = N2 H 4 -5% N2 H5 N0 3
1000
100
NN 10
E
:3 1.
0.1
0.01 L
0 -200 -400 -600 -800 -1000 10
OVERPOTENTIAL - mv

AFRPL-TR-72-26 FIG. 15
CATHODIC POLARIZATION OF HS 1414 IN HYDRAZINE-BASE PROPELLANTS
O =N 2 M4 - 23% N5 H5 .S=N 2 H4
0 =N 2 H4 -5%N 2 H5 Ho 3
100 II
10
0.0
ulo
w
0 -200 -400 -600 -800 -1000 -1200OVERPOTENTIAL -mo
Iu

AFRPL-TR-72-26 FIG. 16
CATHODIC IWLARI7ATION OF PLATINUM IN HYDRAZINE-BASE PROPELLANTS, = O=NH -23%N H
21 A-Ni5A, 0 =N 2 H4 -5%N 2 H5 NO3\ 1000
100
4 u 10 -
E
S1.0!
S0.
aI_ -z
I. 1.0 -
0.1-
0.01 -I .. , I...
0 -200 -400 -600 -800 -1000 -1200
OVERPOTENTIAL - my

AFPRL-TR-7 2- 26 FIG. 17
CATHODIC POLARIZATION OF GRAPHITE IN HYDRAZINE-BASE PROPELLANTSO = N2 H4 - 23% N5 H 5
A= N2 H4r =N 2 H4 -5% N2H5NO3
1000
100
E 10
E
u
0.1
0 -200 -400 -600 -800 -1000 -1200
OVERPOTENTIAL - mv

AF.RPL-TR-72-26 FIG. 16
CATHODIC POLARIZATION OF AA 1100 IN HYDRAZINE-BASE PROPELLANTS
O =N2 H4 -23%N 5 H5A =N 2 H 4
0 =N 2 H4 -5%N 2 H5 NO3100
10
E 1.0U
a
B_ -z
0.
u
0.01
L
0.001 I I I I I
0 -200 -400 -600 -800 -1000 -1200OVERPOTENTIAL - mv

AFPRL-TR-72-26 FIG. 19
CATHODIC POLARIZATION OF AA6061-T6 IN HYDRAZINE-BASE PROPELLANTSO =N2 H4 -23%N 5 H5
= N2 H4100 D=N 2 H4 -5%N 2 H5 No3
10
10.
1.0E
OVRPTNTA/-m
0.10u
0.01
0.001 .. .. ..1....-0 -200 -400 -600 -800 -1000 -1200
OVERPOTENTIAL - my

AFRPL-TR-72-.6 FIG. 20
CATHODIC POLARIZATION OF NICKEL, PLATINUM, AND INCONEL
IN 77% HYDRAZINE-23% HYDRAZINE AZIDE
1000
0 = PLATINUM
o - INCONEL
A NICKEL
100
E
lu
10
U!
1.- 1
0-200 -400 -600 -800 -1I000 -1200
OVERPOTENTIAL-mv

FIG. 21
AFR-PL-TR-72-26
'
ANODIC POLARIZATION OF 17-7PH
IN 77% HYDRAZINE-23% HYDRAZINE AZIDE
0 17-7PH ROD, CLEANED
3 17-7P, FLAT PLATE0 17-7PH, FLAT PLATE, CLEANED
100
10
EU
.1.O1.0
I,-
IT - I'U
U
0.0 200 400 600 800 1000 1200
OVERPOTENTIAL - mv

AFRPL-TR-72-26 FIG. 22
CATHODIC POLARIZATION OF AM 350IN 77% HYDRAZINE-23% HYDRAZINE AZIDE
O AM 350 ROD, CLEANED0 AM 350, FLAT PLATEA AM 350, FLAT PLATE, CLEANED
100
10
E
,/C9
c-I--
U 1.0
0.1 I I I0 -200 -400 -600 -80u - Iuuu - iiUO
OVERPOTENTIAL - mv

AFRPL-TR-72-26 FIG. 23
= 4
ccc
o -oz
C144
zI-b
U')
0 Lu
c IwU
occ c
C-,l

AFRPL-TR-72-26 FIG. 24
ANODIC POLARIZATION OF GRAPHITE IN 77% HYDRAZINE-23% HYDRAZINE AZIDE
0 SPECTROGRAPHIC GRAPHITEo PYROLYTIC GRAPHITE
1000
100
EU-
102
I--
I-u I
1.0-
0.11 I I I I I0 200 400 600 800 1000 1200
OVERPOTENTIAL - my
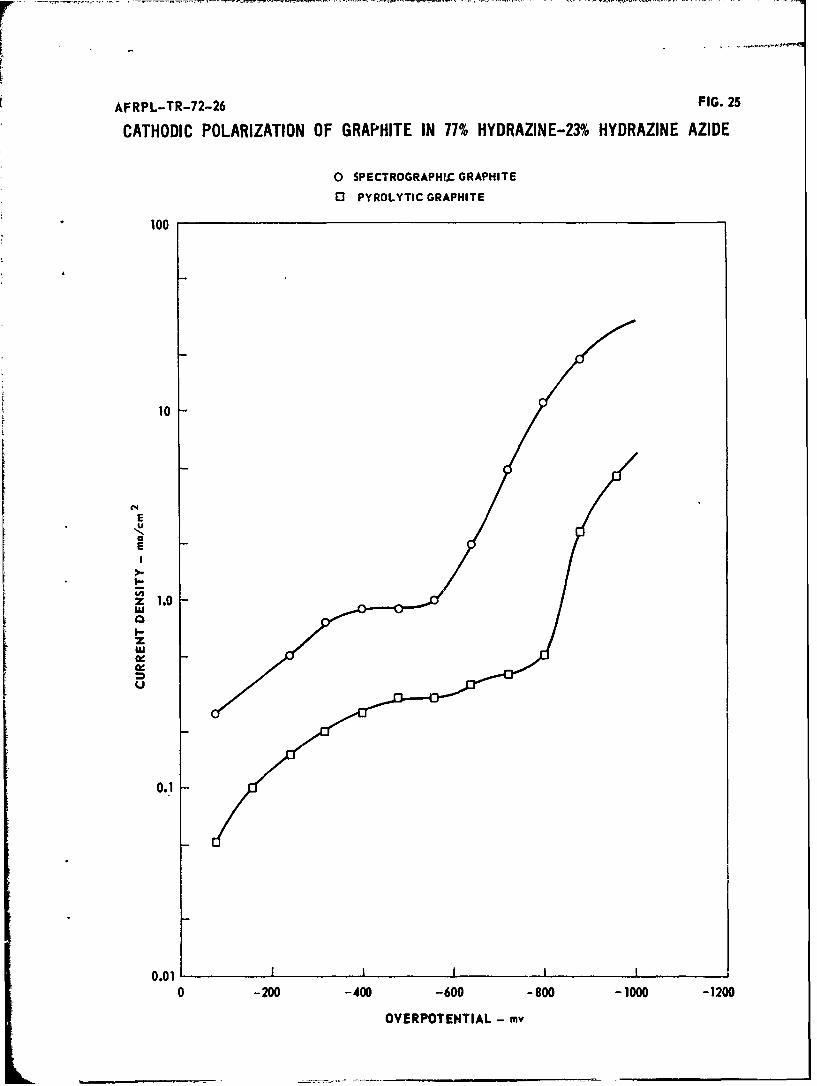
AFRPL-TR-72-26 FIG. 25
CATHODIC POLARIZATION OF GRAPHITE IN 77% HYDRAZINE-23% HYDRAZINE AZIDE
o SPECTROGRAPHIC GRAPHITE
o PYROLYTIC GRAPHITE
100
10
-1.0
u
0.1
0.01I I -
0 -200 -400 -600 -800 -1000 -1200
OVERPOTENTIAL - my

prAFRPL-TR-72-26 FIG. 26
ANODIC POLARIZATION OF 304 SS AS A FUNCTION OF AZIDE CONCENTRATION
o 77% HYDRAZINE-23% HYDRAZINE AZIDE
o3 88% HYDRAZINE-1217 HYDRAZINE AZIDES95.2% HYDRAZINE-8% HYDRAZINE AZIDE
100
10-
NE
E
zlic
0.1-
0.010 200 400 600 800 1000 1200
OVERPOTENTIAL - my

AFRPL-TR-72-26 FIG. 27
ANODIC POLARIZATION OF AM 350 AS A FUNCTION OF AZIDE CONCENTRATIONO 77% KYDRAZINE - 23% HYDRAZINE AZIDE
o 88% HYDRAZINE - 12% HYDRAZINE AZIDE
A 95.2% HYDRAZINE-4.8% HYDRAZINE AZIDE
H 1000
100
E
a
I
S10"II.-
lz
1.0
0.1.
0 '200 400 600 800 1000 1200
OVERPOTENTIAL - mv

AFR PL-TR-72-26 FIG. 28
ANODIC POLARIZATION OF PLATINUM AS A FUNCTION OF AZIDE CONCENTRATION
o 77% HYDRAZINE - 23% HYDRAZINE AZIDE
0 85% HYDRAZINE - 12% HYDRAZINE AZIDE
A 95.2% HYDRAZINE-4B% HYDRAZINE AZIDE
1000
100
EI
Z 10
z
LI
1.0
0.11
0 200 400 600 800 1000 1200
OVERPOTENTIAL - my

AFRPL-TR-72-26 FIG. 29
ANODIC POLARIZATION OF PYROLYTIC GRAPHITEAS A FUNCTION OF AZIDE CONCENTRATION
O 77% HYDRAZINE - 23% HYDRAZINE AZIDE0 88% HYDRAZINE -12% HYDRAZINE AZIDE
A 95.2% HYDRAZIHE - 4,8% HYDRAZINE AZIDE
1000
100
II
7) 10zw
u
1.0
0 .1 0 1
0 200 400 600 800 1000 1200
OVERPOTENTIAL - my

APR PL-TR-72-26 FIG. 30
CATHODIC POLARIZATION OF 304SS AS A FUNCTION OF AZIDE CONCENTRATION0 77% HYDRAZNE- 23% HYDRAZINE AZIDE
O3 88% HYDRAZINE - 12%. HYDRAZINE AZIDE
100a 95,2% HYDRAZINE - 4s8% HYDRAZINE AZIDE
100
100
z 1.0
0.
0 -200 -400 -600 -800 -1000 -1200
OVERPOTENTIAL -mv

AFRPL-TR-72-26FG.3
CATHODIC POLARIZATION OF AM 350 AS A FUNCTION OF AZIDE CONCENTRATIONo 77% HYDRAZINE-23% HYDRAZINE AZIDE
0 88% HYDRAZINE -12% HYDRAZINE AZIDE
a 95.2% HYDRAZINE -4.8% HYDRAZINE AZIDE
1000
100
C-
E
E
10
0.10 -200 -400 -600 -800 -1000 -1200
OVERPOTENTIAL - mv

AFRPL-TR-72-26 FIG. 32
CATHODIC POLARIZATION OF PLATINUM AS A FUNCTION OF AZIDE CONCENTRATION0 77% HYDRAZINE -23% HYDRAZINE AZIDE088% HYDRAZINE - 12% HYDRAZINE AZIDEA 95,2% HYDRAZINE- 4.8% HYDRAZINE AZIDE
1000
100 -
~10ui
! I-,
lzi "i
1.0 i
0.1- I I0 -200 -400 -600 -800 -1000 -1200
OVERPOTENTIAL - my

AFRPL-TR-72-26 FIG. 33CATHODIC CURRENT DENSITY VS AZIDE CONCENTRATION
AT ~=1000 myo 304 SS0 AM 350
APLATINUM
125
100
EQ
00
so-
5-
00
0 5 10 i5 20 25
N5 H CONCENTRATION (%)

AFRPL-TR-72-26 FIG. 34
ANODIC CURRENT DENSITY VS AZIDE CONCENTRATIONAT ij7 1000 my
O 3045St PLATINUM0 AM 350 0) PYROLI TIC GR~APHITE
125
100
4 75
7- 50
25
00 5 10 15 20 25
N5H5 CONCENTRATION(%

AFRPL-TR-72-26 FIG. 35ANODIC POLARIZATION OF 304 SS IN 6% HYDRAZINE NITRATE
AND IN 4.8% HYDRAZINE AZIDE
o 94 HYDRAZINE - 6% HYDRAZINE NITRATEo 95.2% HYDRAZINE - 4.8% HYDRAZINE AZ IDE
100
10
* E
~4
I-
0.010w0 0 0 0 0010
OVROE-IL-m

AFRPL-TR-72-26 FIG. 36
ANODIC POLARIZATION OF AM 350 IN 6% HYDRAZINE NITRATEAND IN 4.8% HYDRAZINE AZIDE
0 94% HYDRAZINE - 6% HYDRAZINE NITRATE
3 9542% HYDRAZINE - 4.8% HYDRAZINE AZIDE
1000
100
C'4
E
LU
ae
i -
:-
u
0.1
zk- I
0.1 II I I II
0 200 400 600 800 1000 1200
OVERPOTENTIAL - my

AFRPL-TR-72-26 FIG. 37
ANODIC POLARIZATION OF PLATINUM IN 6% HYDRAZINE NITRATEAND IN 4.8%/ HYDRAZINE AZIDE
0 94% HYDRAZINE - 6% HYDRAZINE NITRATE03 95.2% HYDRAZINE - 4.8% HYDRAZINE AZIDE
1000
100
N.E
10
UA
1.0
0.1 I
0 200 400 600 800 1000 1200
OVERPOTENTIAL - my

AFRPL-TR-72-1 FIG. 38ANODIC P-OLARIZATION OF PYROLYTIC GRAPHITE IN 6% HYDRAZINE NITRATE
AND IN 4.8% HYDRAZINE AZIDE
0 94% HYDRAZINE - 6% HYDRAZINE NITRATE0 95.2% HYDRAZINE - 4.8% HYDRAZINE AZIDE
1000
100-
E~
E
V)10
lz
1.0
0.1III0 200 400 600 800 1000 1200
OVERPOTENTIAL - my

AFRPL-TR-72-26 FIG. 39
CATHODIC POLARIZATION OF 304SS IN 6% HYDRAZINE NITRATEAND IN 4.8% HYDRAZINE AZIDEO 94% HYDRAZINE - 6% HYDRAZINE NITRATE
f-0 95,2% HYDRAZINE - 4.8% HYDRAZINE AZIDE
1000
100
EU
N,a
10
0
0.1 I0 -200 -400 -600 -800 -1000 -1200
OVERPOTENTIAL -m
OVEROT__TIA -__

AFRPL-TR-72-26 FIG. 40CATHODIC POLARIZATION OFAM350 IN 6% HYDRAZINE
AND IN 4.8% HYDRAZINE AZIDEo 94% HYDRAZINE - 6% HYDRAZINE NITRATE
o 95.2% HYDRAZINE-4.8% HYDRAZINE AZIDE
1000
100
E
U-
I
z
1.0
0.1 I0 -200 -400 -600 -800 -1000 -1200
OVERPOTENTIAL - mv

I IAFRPL-TR-72-26 FIG. 41
CATHODIC POLARIZATION OF PLATINUM IN 6% HYDRAZINE NITRATEAND IN 4.8% HYDRAZINE AZIDE
0 94% HYDRAZINE - 6% HYDRAZINE NITRATE
0 95.2% HYDRAZINE -4.8% HYDRAZINE AZIDE
1000
100
C4Eu
0S
I-
10,.,
ui
1.0
o.10-200 -400 -600 -800 - 1000 - 1200
OVERPOTENTIAL - mv

APBPL-TR-2-36 FIG. 4 2
POTENTIAL-TIME RELATIONSHIPS AT 100 ma IN 'W 142H.,-23c . N5H5GRAPH-ITE-ANODIC GF<APHT 2-CATHODIC
10 viiiiiiiiimi 500 mV u n wT ocoummmmo
0.5 msec 0.5 sc
AM350-ANODIC Ai.',-- DO-CATHODIC
EWUE!IEEE
*fa uftu' UE EUEXEWSWEC~omm*umrmm.uuE200 mV 200 mV
0.5 msec
30-ISS -ANOD IC -CATHODIC
500 mv200 mV*~~~~LUEE T E r-~
EI~i~~ m.....*useu

AFRPL-TR-72-26 FIG 4 3ELECTROLYSIS CELL
A/
I.. VA VIGbYSE
1~~~~A WOKN LETOE
f l. STNADCLMEtLCRD1. RUBBER3 SYSTEM
8. WORINGLETROE
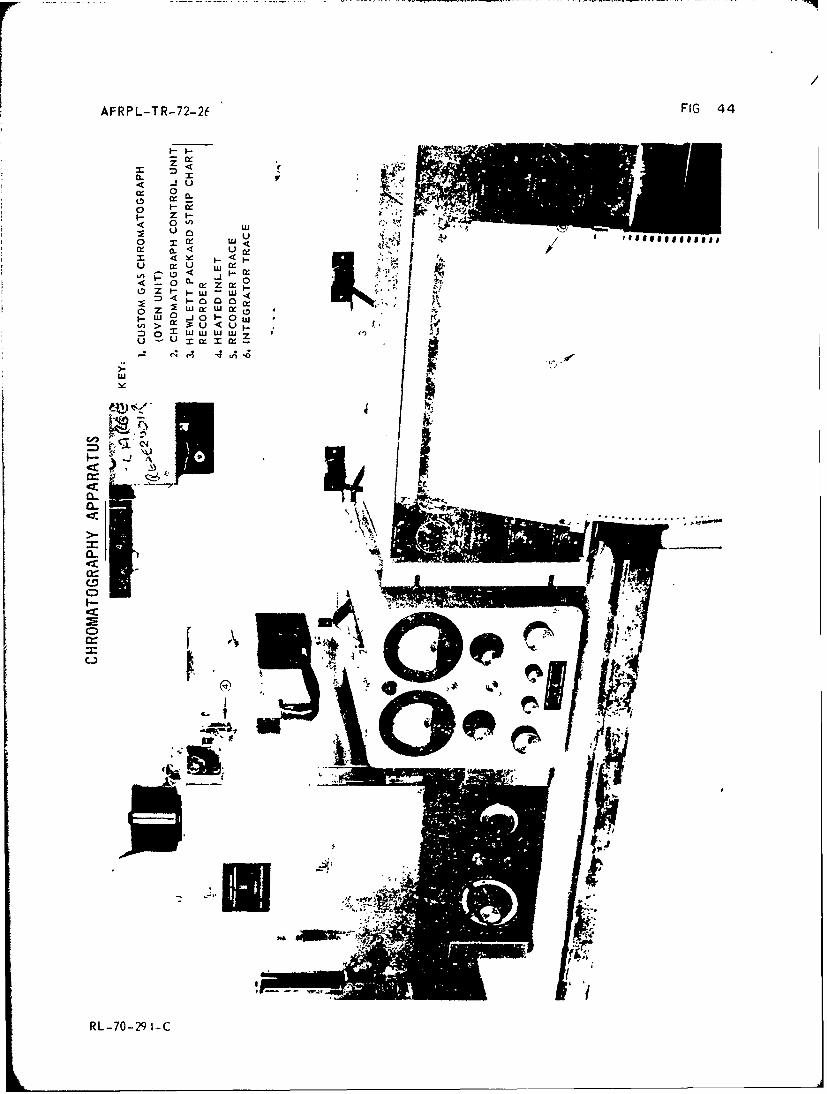
AFRPL-TR-72-26 FIG 44
o LnU- a
o crzc
U -j o I
0 W 0 L
0-
.. . . . . .
RL-70-29 i-C

AFRPL-TR-72-26 FIG. 45
HEATING RATES AS A FUNCTION OF ELECTRODE MATERIALS
(CURRENT - 6.0 AMPS)
1000
KEY:500
ANODE CATHODE
() GRAPHITE PLATINUM
[3 GRAPHITE 304 SS
GRAPHITE GRAPHITE
0 PLATINUM 304 SS
V PLATINUM PL ATINUM
200
20 -
10 I Iv
0 20 40 60 80 100 120TEMP- 0 C

AFRPL-TR-72-26 FIG. 46
ELECTRODE CONFIGURATION NO. I
OUTER SPIRAL (ANODE)
GLASS CLOTH
::::B0-- INNER SPIRAL (CATHODE)
CENTER CATHODE TUBE SLOTTED TO TAKE INNER SPIRAL
KEY:
E CATHODE SHELL
00. CATHODE SCREEN
* 0Zo ANODE SCREEN0
*
0
0 GLASS CLOTH
0 040
)0
HORIZONTAL CROSS-SECTION
X
xox
/ /\POROS GLSS F!" RTICAL CROSS-SECTION
* S
* 5
-SHELL CONTACTS OUTER SPIRAL (AIJ'DE.

AFRPL-TR-72-26 FIG. 47
ELECTRODE CONFIGURATION NO. 2
KEY:*PLATINUM WIRE
(Ist ELECTRODE)MNICKEL TUBE
(2nd ELECTRODE)
o ALUMINA RODCGLASS LINER
MSTEEL SHELL
UMPOROUS NICKEL
HORIZONTAL CROSS-SECTION
VERTICAL CROSS SECTION
PLATINUM W:RES (CATHODE)
NICKEL TUBE (ANODE)
.. .. . ... .... .. . . .. . ... .. . . . .. .. 4-,

AFR PL-TR-72-26FIG. 47
ELECTRODE CONFIGURATION NO. 2
KEY:PLATINUM WIRE
(lst ELECTRODE)MNICKEL TUBE
(2nd ELECTRODE)o ALUMINA ROD
MGLASS LINER
MSTEEL SHELL
UIPOROUS NICKEL
HORIZONTAL CROSS-SECTION
VERTICAL CROSS SECTION
PLATINUM WIRES (CATHODE)
NICKEL TUBE (ANODE)

AFRPL-TR-72-26 FIG. 48
0
~w u uLu j w 0- w
W 11 ZUDT':
Lu 0
C.,> C.
u
zioZ
o 0
= zw
Lu U..0w
C5,
-LJ
Lai

AFRPL-TR-72-26 FIG. 49
ELECTRODE CONFIGURATION WITH PARALLEL VERTICAL PLATES
.. 1ST ELECTRODE
,-Z.-T EMP ERATU RE
SENSOR
PRESSURE
2ND ELECTRODE---' SENSOR
(COMMON WITHENGINE WALL)
I oi
STACKED SCREENS
(COATED WITH FLAMESPRAYED POROUS ALUMINA)

AFRPL-TR-72-26 FIG. 50
'ENGINE CONFIGURATIONS CS-1 AND CS-3
ELECTRODE LEAD (ELECTRODE #1)
SEALANT
ELECTRICAL INSULATOR SLEEVE
NOZZLE
PRESSURE SENSOR
["TEMPERATURE SENSOR -
SHELL COMMON WITH_//ELECTRODE =2
[LC R 0 ELECTRODES-SPIRALLED
SCREENS SEPARATED
BY GLASS CLOTH
TFUEL INLET

AFRPL-TR-72-.26 FIG.. 51
ENGINE CONFIGURATION CS-2TB
ELECTRODE LEAD (ELECTRODE #1)
GLASS TUBE
NOZZLE
-TEMPERATURE SENSOR
PRESSURE SENSOR
COILED SCREEN SUPPORT. PARTICLE RAP
SHELL COMMON WITHELECTRODE #
'1 SPIRALLED SCREEN ELECTRODESSEPARATED BY REFRASIL CLOTH
FUEL INLET

r:1G.5AFRPL-TR-72-26
I.5
> >
U. U.
U. U.
0 0
%n-
UJ
00
UJuuj
U..
U-I
0z-iwU.K

kFRPL-TR-72-26 FIG. 53
a--0to
C-,CL
LUj
I.-I
I r.
u U.
ww-J
ZI 0
w >
0ow
0
RL -7 - 6;1

AFRPL-TR -72-26 FlIG. 54
CDC
-i-
ce.
CA'
z IL()
0
w
w LL
C4.

AFRPL-TR-72-26 FIG. 55
ENGINE CONFIGURATION WITH HORIZONTAL FLATSCREENS AND THERMAL BED
(FP-ITB)
ITHERMOCOUPLE
PRESSURE SENSOR -- ---
....... lll, _-- --- GLASS CLOTH
1,----- -COILED SCREENnllllT I III 'T'
/ FLAT SCREEN
FLAME SPRAY FLAT SCREEN WITHDENSE CENTER SPOT

AFRPL-TR-72-26
FG.5
ENGINE CONFIGURATION FP-2
ELECTRICAL LEADTO 1st ELECTRODE
NOZZLE
PRESSURESENSOR
------------ TEMPERATURESENSOR
THREADED RETAINING RING
MEAL PRESSURE PLATE
1st ELECTRODEPOROUS INSULATING SEPARATOR.-2n ELECTRODE (ELECTRICALLY THERMAL
IN COMMON WITH FUEL INLET LINE) I/ SPACER
THERMAL INSULATINGSPACER
/FUEL INLET
00 0 0

AFRPL-TR-72-26 F .5
,140
/ (.4
LU I4
- I (4
C) /C4 m
'I IIZ
LU /
C-,
4% a
-S. D
-S.4
= - --
vis0

AFRPL-TR-72-26 FI G. 58
u i
0.
z L
w 0/
-
0 / 0
C/ xo I
LL. 0
-LJ
- 44
LLII
LI
4cVw Q
Lr) D3 /IAU-

AFRPL-TR-72-26 FIG. 59
ENGINE CONFIGURATION FP-3
ELECTRICAL LEADTO 15 ELECTRODE
NOZZLE
PRESSURESENSOR
TEMPERATURE
SENSOR
THREADED RETAINING RING-/
CERAMIC COLLAR
THERMAL INSULATING
T SCREN
SPACERS
1 st ELECTRODE
2n d ELECTRODE (ELECTRICALLYIN COMMON WITH FUEL INLET LINE)
FUEL INLET

AFRPL-TR-72-26 FI G. 60
0
0
LL.
I-
m
1- 00
-J 03 -
w UIn
CA,
0~.J
-JI IU.
4c1 0
C-
0
CD 0
0 0
(C.,, II) .
LLk0
IO
0n 0 0C0oC40
(33S, iA) .

AFRPL-.TR-72-26 FI G. 61
ELECTROLYTIC CELL(CONFIGURATION FP-4)
NON-POROUS INSULATORDISC
CATHODE (55)(IN ELECTRICALCONTACT WIiHENGMtE WALL)
*.o.*..*.*.* ...... POROUS SEPARATOR
S*.~. .**.***.. .... .... ... ANODE (Ptl
NON-POROUS_______________________ AAAINSULAL. TOR DISC
GOLD-NICKEL BRAZE
TUBE
FUEL IN

AFRPL-TR-72-26 FIG. 62
ENGINE CONFIGURATION FP-4
RUBBER PRESSURE SEAL
PRESSURE TAP
NOZZLE
THREADED CAP
CRUSH SEAL
THERMOCOUPLE
,,,GAS ORIFICES IN RETAINING CUP
THREADED RETAINING CUP
ENGINE BED
SEE FIG 61
GOLD-NICKEL BRAZE
NON-POROUS INSULATOR
I -- RUBBER PRESSURE SEAL
FUEL IN

AFRPL-TR-72-26 FIG. 63
Uuv 0
N e40
x x
00
ww
w w EE
w0 0
LL u
iz ti.c) 0
CL 0
LU
7- 0
LL.
UJ IX 0
zz
0 -I I I v

AFRPL-TR-72-26 FIG. 64
gfnSS8cd
IIIII I I
Ln
0I-
z
cc
0
C. w
zCD LU"
0w
U- u
I-. zo >0 L
ox
z XIm° -
0
0
u
z
wC-- II
1NIIl

II
I U,0crU-
2w
ui LA
%w 00.
It - rz0
Luu
2pA
w- I--
wz
IN~I

AFRPL-TR-72-.26 F .6
3snfSS3Sd
LI.
C)
Li
CD,
LU
U-LU
'U
0
U- u
IItLUI
CL
oz 4A
INiLJ

AFRPLTR-72-26 FIG. 67
ul 'U'U
x N
U 'U
J-t w 'U
UlUI JI- '
LL.
Cl
0U-
z
C.C)
wwz(
LU 4 U
LU,
'u L
Z-~ J

AFRPL-TR-72-26 _______D_____ FIG. 68
0n
0-
LI
LL.0
zzI^ I U. .
-L 0
00
z '
LUJ
LUJ
0.0
0 0 0 D 0 C0o o % 0 ' C-(4
YISd - 3snfSSbd

AFRPL-TR-72-26 FI G. 69
PRELIMINARY DESIGN FOR PROTOTYPE MILLIPOUND THRUSTER
(SCALE - 4X)
SPACER (REFRASIL)
ELECTRODE (120 X 120 MESH SCREEN)ELECTRODE (PLATINUM) (MAT'L-IK,(O 600, HAYNES 25, PLATINUM)
INSULATOR (QUARTZ)- SPACER (INCO 600)
CHAMBER (INCO600) NOZZLE (INCONEL 600)
JTHERMOCOUPLE
,PRESSURE TAPINJECTOR TUBE-/
(INCO 600)
INSULATOR (QUARTZ)
\.FUSION WELD
SUPPORT PLATE (INCO 600)FI
ACTUAL SIZE

AFRPL- TR-72 -26 FIG. 70*
JTOM.ePf 0 iue bleOo~
IILi
-.-
a-
RL 72

AFRPL-TR-72-26 FIG. 70 B
MILLIPOUND THRUSTER-EXPLODED VIEW
KEY
O ENGINE CHAMBER
@LOWER QUARTZ INSULATOR
INLET TUBE AND LOWER PLATINUM ELECTRODE (ANODE)
® REFRASIL (GLASS) ELECTROLYTE MATRIX
© RETAINER RING-QUARTZ AND UPPER PLATINUM ELECTRODE ASSEMBLY (CATHODE)
@UPPER QUARTZ INSULATOR
UPPERUARTINUM EL O ®, AND RETAINING RING ARE PARTS CONSTITUTING@U UPPER P LAT IN UM E LECT RODE
(CATHODE)
80 NOZZLE
0 INLET TUBE
@ LARGER TUBING ADAPTOR FITTED TO @ TO MATCH INLET TO ID OF FITTING @
6j LOWER PLATINUM ELECTRODE WITH HOLE FOR FUEL INLET
( ALUMINA INSULATOR TO ELECTRICALLY INSULATE LOWER ELECTRODE
ASSEMBLY FROM ENGINE BODY
( INLET FITTING
1) GOLD-NICKEL BRAZING RINGS USED TO SEAL LOWER ELECTRODE
AND ADAPTER @ TO INLET TUBE @

AFRPL-TR-72-26 FIG. 71
a~c. e
0
-ENGINE CASE AND NOZZLE2INSUL-ATED INLET
,3,COMBUSTION CHAMBER THERMOCOUPLE.~PRESSURE TAP
) PRESSURE TRANSDUJCER
-6,1 SOLINOID VALVE
7 CH4AmBR WALL THERMOCOUPLE
L
RI -72-68-B

AFRPL-TR-72-26 FIG 72
0.ce'a ' op
0.p
3
0-
C-)
D0
0~0
-J-LL,
0 .
D -
0U
=w W
w > :
a. >. Z
> >

AFRPL-TR-72-26 FIG. 73BASE POINT PERFOR1MANCE DATA ./
ENGINE #3
(250 msec PULSES)
BASE POINT PC t90 t10 C.(ft/sec)
l IST PULSE 47 50 250 -
- 10 0TH PULSE s0 50 250 3680
#2 - 1ST PULSE 42 60 200 -
- 10 0TH PULSE 53 40 200 3980
#3 *1ST PULSE 49 70 150 -
10 0TH PULSE 5:) 50 150 4330
#4 - 1ST PULSE 51 100 200 -
- 10 0TH PULSE 53 60 200 4060
1 ST PULSE
-i00TH PULSE
BP 1 BP "2
70 P$10
S iI I I I
500 msec 500 msec
BP 3 BP4 BPU5
2.4 psia
500 msec 500 msec 500 msecTIME

AFRPL-TR-72-26 FIG. 74
BASE POINT PERFORMANCE DATA
ENGINE :5
(250 msec PULSES)
BASE POINT PC (pslo) 90 '10s C*(ft 'sec,
(me)(msec)
;: - 1ST PULSE 48 30 250 -
- 10 0TH PULSE 53 30 250 3870
.:2 - 1ST PULSE 49 50 250 -- 4 3 RD PULSE 49 50 150 3310
IST PULSE
... lCOTH PULSE
BP# IBP42
70 Pl
500 mscc 500 msec
TIME

AFRPL-TR-72-26 BASE POINT PERFORMANCE DATA FIG. 75
ENGINE #6(250 msec PULSES)
BASt POINT C t90 10(psia) (m9ec) (msec ) (ft 'sec) Ibs secx10"
I - 1ST PULSE 46 40 240 3760 1.95
- 100 TH PULSE 48.5 40 260 3960 1.95
t2- 1S T PULSE 44.5 40 170 3440 2.06
- 100 TH PULSE 47.5 40 310 3670 2.06
03- 1S T PULSE 40 50 340 3210 1.98
- 10 0TH PULSE 46 50 400 3700 1.98
-4- 1ST PULSE 43 30 160 3860 1.77
- 100 T H PULSE 45.5 30 210 4090 1.77
.9- I ST PULSE 42 50 240 3900 1.71- 100TH PULSE 44.5 50 180 4140 1.71
IST PULSE BP-I BP::2
.. !- 100 TH PULSE
45 psia
500 msec 500 msec
BP ,:3 BP .. 4 8P ::
I I IIj I I L I _
500 msec S00 msec S0.) msec
TIME