Embed Size (px)
Citation preview

HAL Id: hal-01660253https://hal.archives-ouvertes.fr/hal-01660253
Submitted on 31 Dec 2017
HAL is a multi-disciplinary open accessarchive for the deposit and dissemination of sci-entific research documents, whether they are pub-lished or not. The documents may come fromteaching and research institutions in France orabroad, or from public or private research centers.
L’archive ouverte pluridisciplinaire HAL, estdestinée au dépôt et à la diffusion de documentsscientifiques de niveau recherche, publiés ou non,émanant des établissements d’enseignement et derecherche français ou étrangers, des laboratoirespublics ou privés.
Electromobilité : Bilan et perspectivesYannick Perez
To cite this version:Yannick Perez. Electromobilité : Bilan et perspectives. Séminaire invité Sciences Politiques, Jan 2017,Paris, France. <hal-01660253>

Electromobilité : Bilan et perspectives
Yannick PerezArmand Peugeot Chair
(CentraleSupélec & Essec Business School)[email protected]

Motivations (1)
• EVs are very broad and interesting economic subject to study.
• Regulation driven change : more and more stringent rules toward CO2 emission per manufacturer fleet – Dieselgate shows that it is really difficult objective
• Urban Local pollution standards are also becoming stronger – No old diesel car (or buses or trucks) in some polluted
cities (Paris more than 10 years old)
– Tendency to have smart cities projects with only electric engines
– If not today, in 5 years…
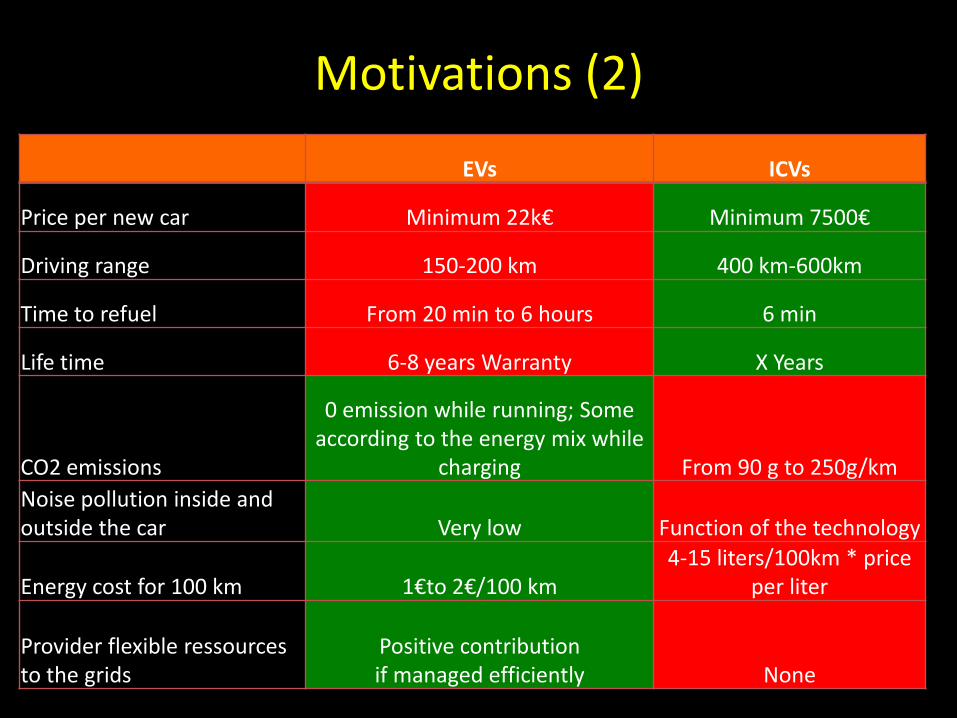
Motivations (2)
EVs ICVs
Price per new car Minimum 22k€ Minimum 7500€
Driving range 150-200 km 400 km-600km
Time to refuel From 20 min to 6 hours 6 min
Life time 6-8 years Warranty X Years
CO2 emissions
0 emission while running; Some according to the energy mix while
charging From 90 g to 250g/km
Noise pollution inside and outside the car Very low Function of the technology
Energy cost for 100 km 1€to 2€/100 km 4-15 liters/100km * price
per liter
Provider flexible ressources to the grids
Positive contribution if managed efficiently None

Motivation (3) Evs enjoy a Double dynamic: Increase in ENERGY DENSITY & decrease of COST
Source: IEA Global EV Outlook 2016
4


Motivations (4)
Distribution of the Thermal car uses per day in France
80% trips < 60km Mean = 12 km 24 km/Day

Motivation (5)

Current deployment in continental France (June 2016)
• Number of Electric (EV) and plug-in electric vehicles (PHEV) registered
Number of public charging points installed
Almost 90 000 vehicles registered in more than 13 000
towns (85% are EV)
More than 14 000 public charging points located in
almost 2 000 towns
EV and PHEV: only 0,2% of the total French car fleet… but a
sharp growth since 2010
Increase of private owners higher than companies
Source: Enedis, AAADAta, Gireve

The Energy Transition Law sets an ambitious target of 7 million charging points by 2030, and 1 million by 2020
104 626 charging points in June 2016
625 MVA of installed capacity in June 2016
Annual growth
rate 2015-2016 +56%
Annual growth
rate 2015-2016 +62%
Installed capacity is growing faster than the number of charging points due to the development of quick public charging points
The number of public charging points should be increased almost fourfold by 2020 (14 000 to 55 000)
Installed capacity of the public charging points will grow even faster
14 509 public points in June 2016
55 000 public points in 2019
Normal charging (up to 7,4 kW)
Quick charging (22 kW)
Fast charging (43 kW and more)
Public
Residential
Office

And the window of opportunity is open …

Sales
Scenario Powertrain 2020 2025 2030
BIPE Green Constraint BEV 1 351 434 2 270 912 3 401 518
Bloomberg BEV 936 455 3 745 819 13 110 368
BIPE Green Constraint PHEV 1 265 130 4 171 103 8 457 032
Bloomberg PHEV 1 404 682 4 214 047 7 959 866
GLOBAL EV FORECAST COMPARISON

BUT

Motivation (6)
• EV drawbacks are partially due to Market Failures
– Positive externalities are not paid at real value
• CO2 reduction : How much, in terms of grams and € ?

EVs emit less CO2 than conventional cars
126
136 129
136
122 124
114
133
117
137
66
130
90 84
76
48 50
34
16 10
28
56
22
38 36
24
8 14
2 6
0
20
40
60
80
100
120
140
160
EU 28 Poland UK Germany Italy Spain Portugal Austria France Sweden
Average of CO2 of new cars Average of CO2 EVs (2010)
Average of CO2 EVs (2015) Average of CO2 EVs (2035)Ref Scenario 2013
2021 Goal 95 gr
● With the 2010 carbon
intensity, a typical EV
emits about 66g
CO2/km
● EVs will be even
cleaner in the future
as the power sector
continues to
decarbonise by 2050
EURELECTRIC smart charging paper, 2015

• EV drawbacks are partially due to Market Failures
– Positive externalities are not paid at real value
• CO2 reduction => CO2 markets are not efficient : 4-10 euros per ton for
2 units per year
• Health benefits by reducing toxic emission => measures?
Motivations (6)

• EV drawbacks are partially due to Market Failures
– Positive externalities are not paid at real value
• CO2 reduction => CO2 markets are not efficient
• Health benefits by reducing toxic emission => measures?
• Oil import reduction => saving for purchaser, benefit for society
in terms of independence?
• Industrial/Services job and local wealth creations
– Need more precise evaluation of Willingness to Pay for
Electric vehicles characteristics in different environments
Motivations (6)
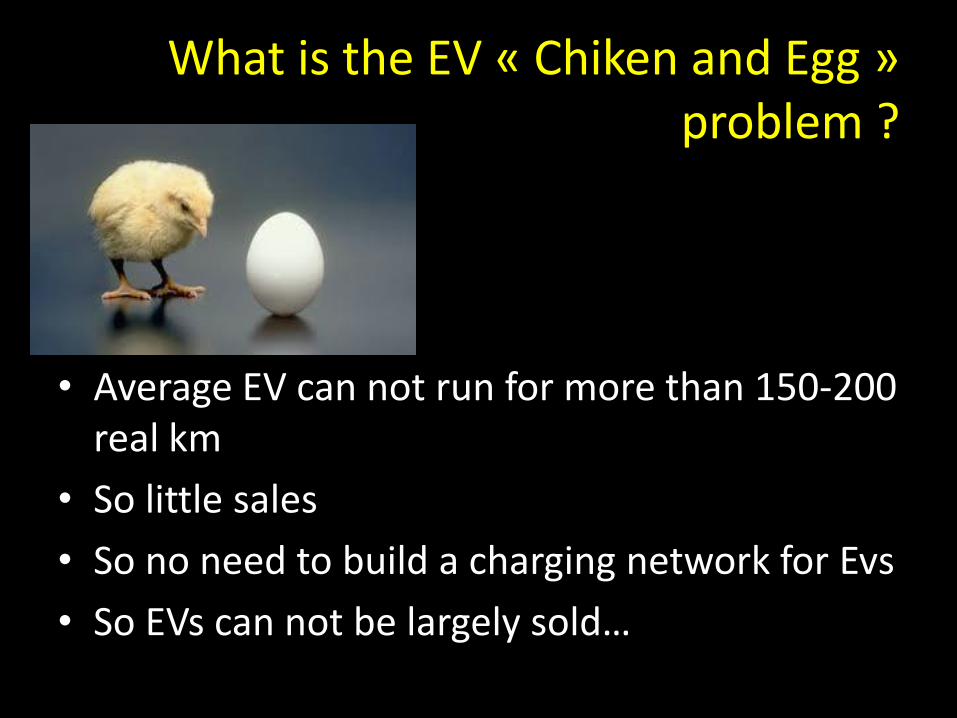
What is the EV « Chiken and Egg » problem ?
• Average EV can not run for more than 150-200 real km
• So little sales
• So no need to build a charging network for Evs
• So EVs can not be largely sold…

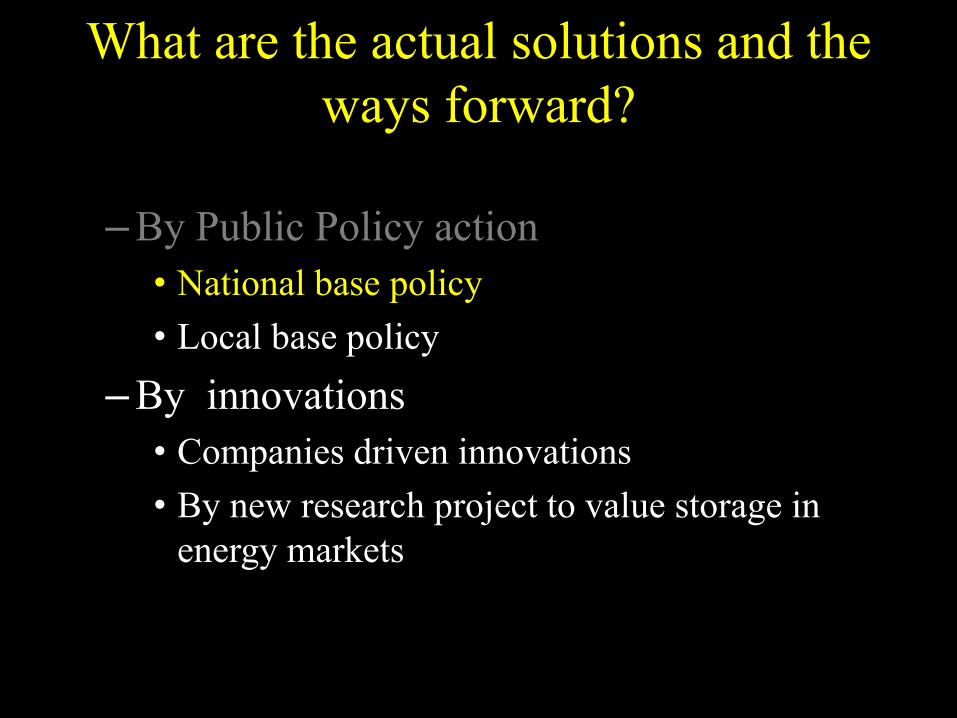
What are the actual solutions and the
ways forward?
– By Public Policy action
• National base policy
• Local base policy
– By innovations
• Companies driven innovations
• By new research project to value storage
flexibility in energy markets

Disclaimer

Only successfull cases are treated here!
• Better place is not treated
• PSA 1941- 1996 experiment with EVs
• …
Tesla Motors designs and sells high performance, super efficient electric cars. Tesla Motors cars join style, acceleration, and handling with advanced technologies that make them the quickest and the most energy-efficient cars on the planet. (Tesla Motors, Mission)

And not dealing with deep history of innovation…

What are the actual solutions and the
ways forward?
– By Public Policy action
• National base policy
• Local base policy
– By innovations
• Companies driven innovations
• By new research project to value storage in
energy markets
What are the actual solutions and the
ways forward?
– By Public Policy action
• National base policy
• Local base policy
– By innovations
• Companies driven innovations
• By new research project to value storage in
energy markets
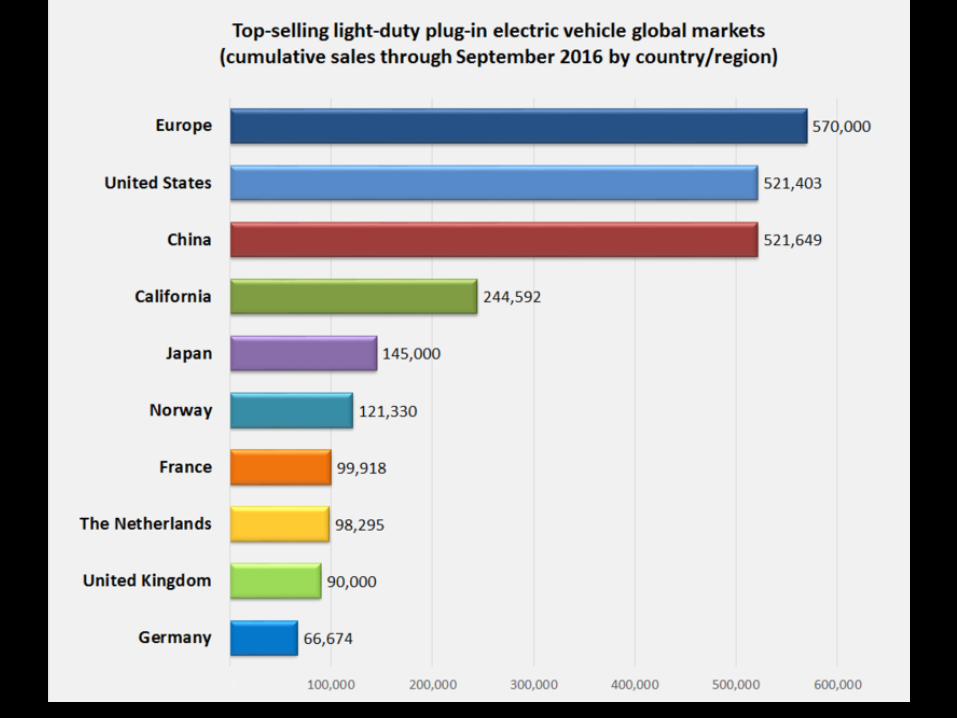
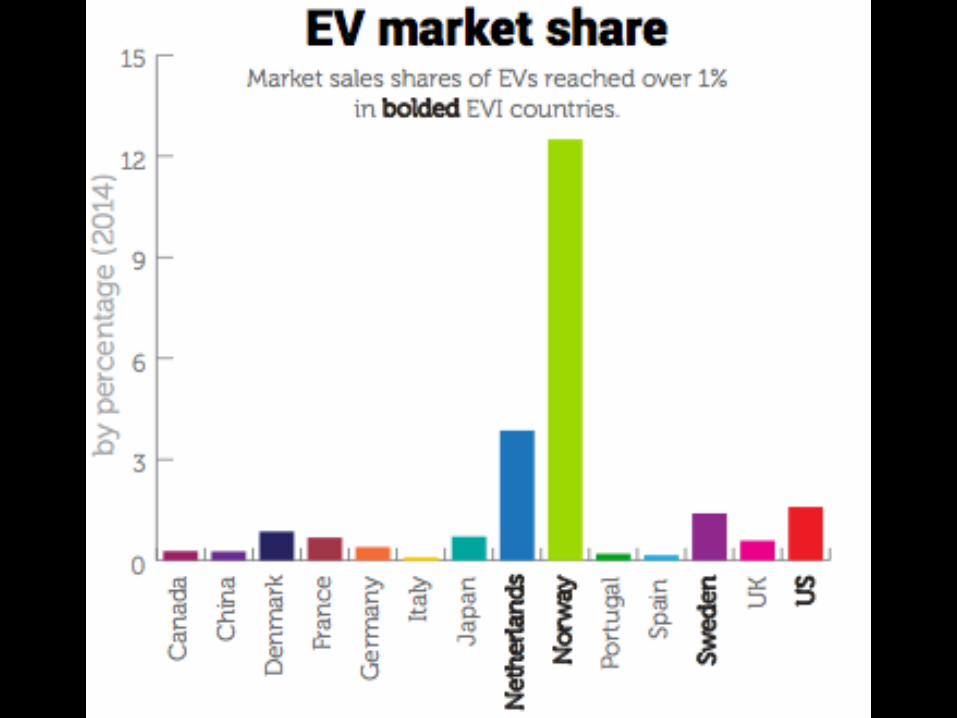

Norway as successful “Public Incentive” model?
Models breakdown by Fuel Source in Norway
Pl Model Sales
1 Tesla Model X 601
2 Toyota RAV4 581
3 BMW i3 520
4 Toyota Auris 492
5 Mitsubishi Outlander PHEV 427
6 Volkswagen Tiguan 416
7 Toyota Yaris 405
8 Volkswagen e-Golf 392
9 Volkswagen Golf GTE 358
10 Skoda Octavia 315
With 29% share of Evs in 2016. 33% September…

Package of Policies in Norway
1. Action toward demand stimulation – VAT tax exemption
– Highway fees exemption
– Local tax exemption
– Access to buses lane in cities
2. Building a safety network of Fast charging at the entry of main cities to secure last miles stress + on highways critical points
3. No action toward offer: no Norvegian EV manufacturers.

Limits of the Norvegian Model
• Cost of the public support
– Implicit valuation of pollution reduction, infrastructure building, health value, social innovation… are very high.
• The design of the demand side policy is biased in favour of expensive cars because the help is in % of the car price.

But it works even for smaller cars by effectively reducing the TOC

Limits of the Norvegian Model
• Cost of the public support
– Implicit valuation of pollution reduction, infrastructure building, health value, social innovation… are very high.
• The design of the demand side policy is biased in favour of expensive cars.
• How reproducible it can be by other countries?
• What policy after 2018?
• Ending Thermal Cars in 2030…

What are the actual solutions and the
ways forward?
– By Public Policy action
• National base policy
• Local base policy
– By innovations
• Companies driven innovations
• By new research project to value storage in
energy markets

Car sharing of EVs for « local urban » model ?
• A way to mitigate the TCO constraints => renting the asset (thermal and Electric cars)
• More than 1000 cities around the world are using Car sharing solutions to reduce urban congestions
• and few of them with EVs Fleets to reduce pollution
– local public experiments with a clear successful business model: Bolloré Autolib.

Driving forces
• Economically and politically: – Local Urban Emission limits (climate protection /
Urban Citizen claims), expansion of fluctuating RE and consistent user financing.
• Behaviourally: – ‘permanently online’, pragmatic multimodality (‘using
instead of possessing’) and the erosion of status of possession (+ ‘possessing instead of using’)

The parisian exemple
Economic organisation • Public private partnership
2011 for 180 M€: – Bolloré invest in the all
integrated service from Battery design, car, to IT system
– Local public authorities invest in charging stations (1 station – 4-7 plugs => 50k€)
– Secure the investment of Bolloré in case of losses.
– Initial goal was to be profitable in 2018 with 80 000 customers.
– 2013: More than 100 000… – Show off effect in Paris for EVs.
Infrastructures • 3 000 EV cars running • 1 000 charging stations (more
than 4 000 low intensity plugs) open 24h/365
• No parking fees / no waste of time looking for a place to park
• Smart App to find and book EV • No need to return at the initial
point • 120 € for annual fees + 5,5€ per
30 m of use • Each car is rented 6-7 times per
day => manage problem of over use…

Smart app overview

New business model to overcome TCO?
• New cities are buying Bolloré like solutions – Hanzu (China) – Mineapolis (USA) – London – Bordeaux – Lyon – Turin – Los Angeles / Rio de Janero… (avec PSA)
• NB: Big data are produced about real mobility practices and a lot of economic analysis will be needed…
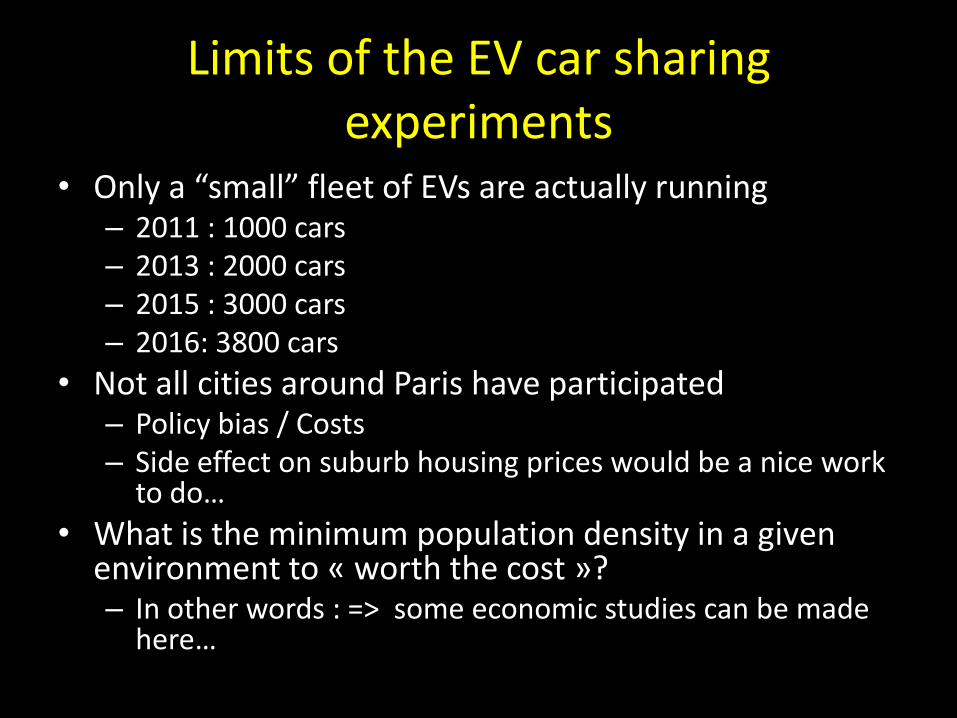
Limits of the EV car sharing experiments
• Only a “small” fleet of EVs are actually running – 2011 : 1000 cars – 2013 : 2000 cars – 2015 : 3000 cars – 2016: 3800 cars
• Not all cities around Paris have participated – Policy bias / Costs – Side effect on suburb housing prices would be a nice work
to do…
• What is the minimum population density in a given environment to « worth the cost »? – In other words : => some economic studies can be made
here…

Conclusion for Public policy design
• We have 2 interesting cases but a lot of innovation / creativity to define the optimal public policy (EU / Nation / Local) – Charging network decision?
– What is the optimal ratio: plug/car ?
– Level of involvement of public actors?
– Innovative actions still need to be made and analyzed • France Coupling of demand subsidy (6 300 € + 2700 if you
destroy an old diesel car)…
• Germany : zero subsidy and a nice counter example benchmark…

What are the actual solutions and the
ways forward?
– By Public Policy action
• National base policy
• Local base policy
– By innovations
• Companies driven innovations
• By new research project to value storage in
energy markets

What are the actual solutions and the
ways forward?
– By Public Policy action
• National base policy
• Local base policy
– By innovations
• Companies driven innovations
• By new research project to value storage in
energy markets

Tesla as the successful “Apple cars”
• The last start up since Ford in US Car industry : 2004 • Luxury high performance EV:
– Make a expensive full electric car with XXL battery (85kW) – Rely on "slow Moore's law.” Processor doubling in power
every 18 month, batteries doubled in power every 10 years.
– Model S, the sports sedan released in 2013, earned the distinction of Motor Trend Car of the Year
– In US market Model S outsold the Mercedes Benz S Class, the BMW 7 Series, and every other large luxury sedan in 2013.
– Model 3 SUV presales and sales start October 2016
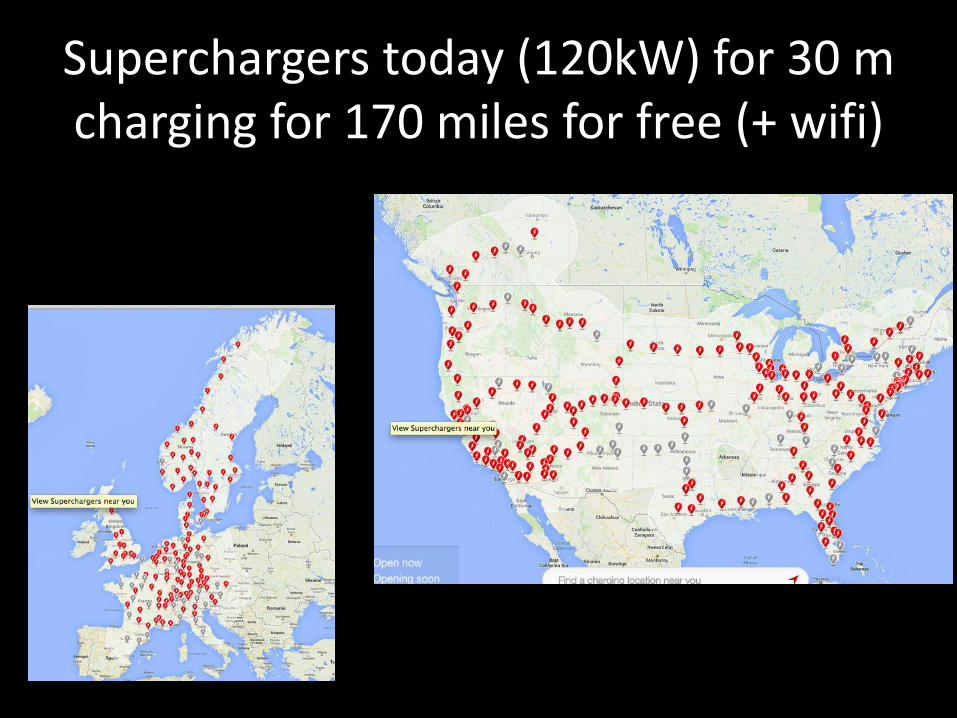
Superchargers today (120kW) for 30 m charging for 170 miles for free (+ wifi)
IT – Car- merging services

The limits of the TESLA model?
• Manufacturing Millions / Thousands?
• Setting the worldwide « superchargers » standard for XXL batteries is a challenge – How to cooperate with DSO / TSO to install
needed superchargers in all places?
• Response of large classical cars manufacturers – BMW / Audi… Toyota…
• New “Tesla vision” : PV + EV + Home Storage

What are the actual solutions and the
ways forward?
– By Public Policy action
• National base policy
• Local base policy
– By innovations
• Companies driven innovations
• By new research project to value storage
flexibility in energy markets

Why do we need more flexibility in electrical systems?

48
124207
210817
317895
670375
0
100000
200000
300000
400000
500000
600000
700000
800000
2012 2013 2014 April 2015
Total world EV sales
Today EV market & storage of energy seems…
2981
5060
7630
16089
31760
0
5000
10000
15000
20000
25000
30000
35000
2012 2013 2014 April 2015 total
Distributed Storage units to optimize in MWh

Loads
Productions décentralisées 95% 2
Renewable
On-site
Storage
Backup
Power
4
From Old days to EV smart grids issues
Generation
Distribution Transmission
3
Massive RES (5%)
1
EVs
Residential
Commercial
Industrial
Voltage issues and management opportunities
Frequency management opportunities

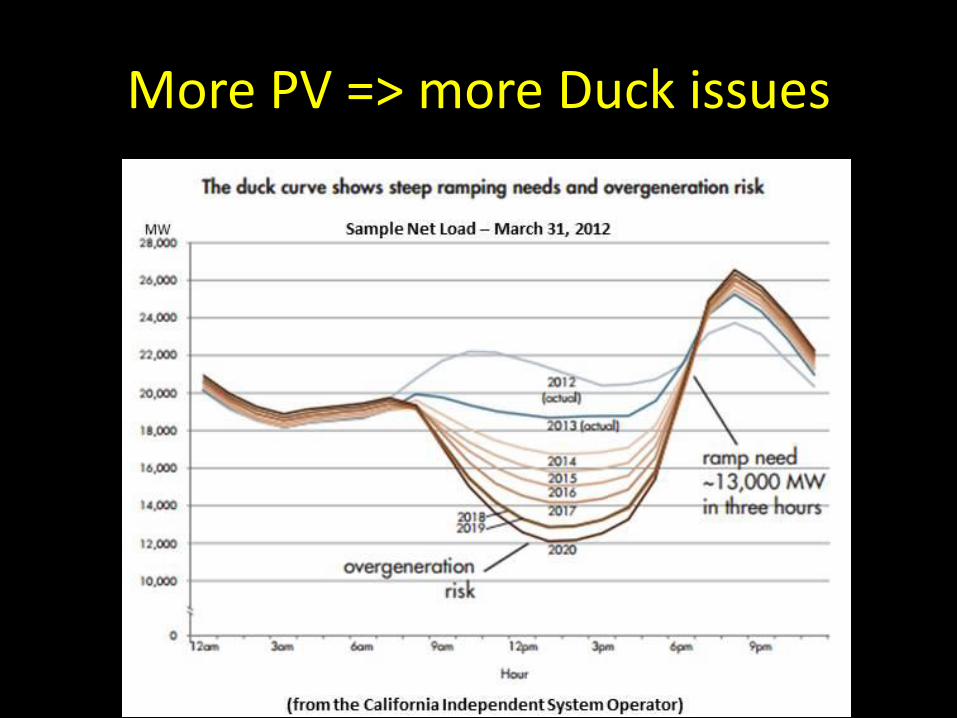
More PV => more Duck issues

More wind => more flexibility required

Interconnection
Hydroelectric
Nuclear Fuel/Gas
CCGT Wind Power Other Coal
30-september-2010 6-Februray-2013
MW MW
Wind 66.5%
15:50h
Wind 1%
17:45h
Wind
Wind
Gas
Gas
Interconnection Hydroelectric Nuclear Fuel/Gas
CCGT Wind Power Other Coal
The Spanish case
Source REE, ENAGAS 53

More wind => more costly flexibility required
Source: Holttinen et al. (2011)

Flexibility by market coordination

Traditional natural monopoly regulation:
– All services provided by long term contracts
– Fixed price for the length of the contract with the national minister or regulator
– Example in France, regulated tariffs for:
• T/D • Energy • Reserves • Renewables
• No Room for EV !
56
PJM as a “Grid services” future?

Traditional natural monopoly regulation without markets
– All services provided by long term contracts
– Fixed price for the length of the contract with the national minister or regulator
– Exemple in France, regulated tarifs for:
• T/D • Energy • Reserves • Renewables
• No Room for EV !
• Using markets to provide Grid services in liberalized electricity systems: – Introduction of markets
for: • Energy (MWh) • Capacity (MW) • Transmission Rights • Reserve Markets • Demand response • ...
• But Rules need to be recrafted accordingly !
57
PJM as a “Grid services” future?

Which possible markets?
Profitable markets for EVs:
• little amount of energy, quick responsiveness
• remuneration based on availability and not utilization
58
Load curve during a day and associated PJM markets
EV fleet for one Market or for Markets?

How to coordinate disperse storage unit as flexible ressources?
Combination of data 1+2+3
Into new algorithms (to be tested) to deliver « market like products to be traded on
energy markets »

Input 1: Definition of EV resources provision
60
Agrégateur
TSO
TSO or
DSO
Agrégateur
Vehicle-to-grid Vehicle-to-building

Input 2: Definition of EV Trips & needs
1. Commuting Privately owned Fleet – You go to work and return home: very predictable
and easy to capture.
2. Collective fleet 1. used in a coordinated way
• Postal / delivery services fleet / Last mile delivery
2. used in a uncoordinated way • Companies cars given to staff
• Renting cars companies
=> Trip definitions: when, how long, risk…

Input 3: design of Charging infrastructure

Input 3: design of Charging infrastructure

Strategies for charging : +/-

Combination of inputs and maths to create “bundle of valuable flexible resources”
for the energy markets
Times MW or MWh Services on market base if exist
Second MW - Frequency regulation - Voltage regulation - Quality of delivery
Hour MW Or MWh
- Terciary reserve market - Demand respons - Balancing services - Congestion management - Intraday-market - Coupling With RES - ...
Block orders MWh - Day head market - Effacement - Time of Use - Coupling with RES - ...
65

Case Studies

Revenus from grid services for EV
Frequency Regulation market revenus
16
Pilot project for em erging technologies in the
ancillary services m arkets

EV as frequency control resources
• Why do we need a steady frequency? – material performances
– risk of saturation for devices with magnetic circuits
• Who is responsible? – TSOs
• How? – Balancing production and demand at each moment
68
51 Hz
Production
Demand
49 Hz
Production
Demand
UP
DOWN

In other countries, values are function of market design-fleet characteristics and charging points
capacities
Sources Analyzed
region Participated market
Net Profit €/Month/Vehicle
Regulation power
Battery/ Vehicle constraints
Kempton and Tomic 2005
USA Regulation up and down 112-165 10-15 kW Electric drive vehicles
Tomic and Kempton 2007
USA, Four different
control areas
Regulation down (Th!nk City) Regulation down and up
(Toyota RAV4)
4.3 – 43 (Th!nk City) 6 – 64 (Toyota RAV4)
6.6 kW
100 Th!nk City vehicles (Nicd) ,252 Toyota
RAV4 (NiMH)
Larsen et.al. 2008 Denmark Secondary and Tertiary
control 6 – 160
power: 2 kW, 20 kW, 20 kW
EDV: Capacity: 5 kWh, 5 kWh, 20 kWh,
Camus et.al. 2009 Portugal Secondary and Tertiary
control 18 3.5 kW
Plug-in Hybrid and electric vehicles
Andresson et.al. 2010
Sweden/ Germany
Control energy market
30 – 80 (Germany, coal fired power
plants) 19 ; 7 (Sweden,
Hydro power plants)
3.5 kW
Plug-in hybrid EV (10 kWh , Maximum depth
of discharge 20 %) Charging and
discharging efficiency are 94 %.
V2G-Strategies 2011
Austria Secondary and Tertiary
control 7.32 – 63.94 10.5
Electric Vehicles (16 kWh, 24 kWh, 48 kWh)

Frequency remunerations for EV : PJM real case / France exploration
Charging point capacity (kW) Revenus /VE/ year Primary Secondary
3 0 179,4 €
3 3 310,7 €
3 7 505,7 €
3 22 1346,8 €
7 0 474,5 €
7 3 543,4 €
7 7 780 €
7 22 1448,2 €
1500 €/ year and per car in PJM Zone for only « frequency regulation market base Provision »
Sources: Codani, Petit & Perez 2016

A very nice contribution to TCO

Flexibility solution by contrats

Contractual solutions for VtoH
• Objectives of the House
manager
• Minimizing energy cost over time
• Maximizing auto consumption of
local renewable energies if
incentives are aligned
• Distribution grid services provision (optional)
• Sharing potential benefits with the consumers
DSO
Vehicle-to-home
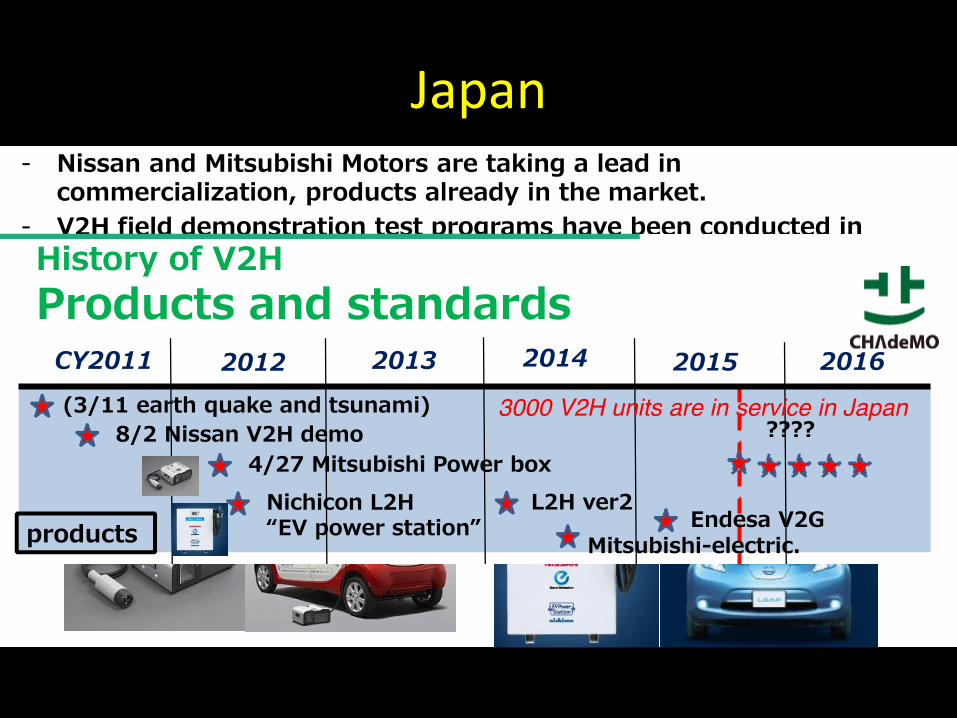
Japan

Contractual solutions for VtoB
• Objectives of the site manager
• Minimizing energy cost over time
• Maximizing auto consumption of local renewable energies
• Minimizing the peak demand
toward networks
• Limiting the investments in
networks reinforcements
• Sharing potential benefits with
the consumers / networks managers
TSO or
DSO
Agrégateur
Vehicle-to-building
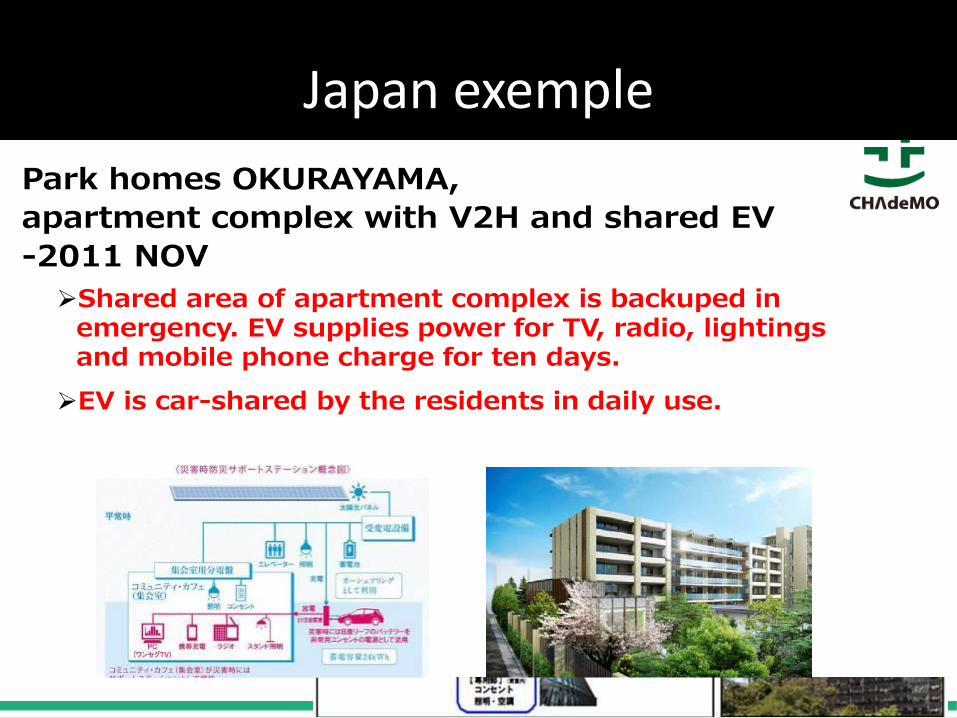
Japan exemple

Contractual solution with the Distribution Service Operator (DSO)
DSO services
5

Flexibility provision with EV fleets
• Not perfectly done yet… – VtoG experiment around the world (US / Denmark…) – Majors success with regulation power : mainly frequency
control.
• Expected benefits from coordination : – Costs savings / resources provision – Capacity reduction need (Less peak demand investment) – RES coupling: less grid stress – Demand response resources
• Main problems to overcome – Rules and Market regulation to adapt for EV Fleets – Communication standards (15118 / CHAdeMO…) to clarify
• Coordination via hydrids are probably part of the solution (spin-offs…)

To be added on the « benefit » of ownership
Including the 1. added costs of measurement
2. aggregation services cost 3. Marginal Battery degradation cost
Does it worth the cost?

Conclusion on innovations by companies and Spin-off
• Tesla is the promoter of a disruptive innovation from PV to storage (EV or home or building base)
• A lot of studies have to be made to promote new business models based on energy markets /contractual potentials.

Conclusions
4 incomplete solutions!

Predicting the future of EV is hard
If you were asked in the 1980s about having a camera in your phone…
what would you have imagined?


Selected Literature
• Codani Paul, Perez Yannick and Petit Marc 2016, Financial Shortfall for Electric Vehicles: economic impacts of Transmission System Operators market designs, Energy, Volume 113, pp 422-431.
• Eid Cherrelle, Codani Paul, Perez Yannick, Reneses Javier, Hakvoort Rudi, 2016, Managing electric flexibility from Distributed Energy Resources: A review of incentives for market design, Renewable and Sustainable Energy Reviews, 64 (2016) pp 237–247.
• Donada Carole and Perez Yannick 2016, Introduction to the special issue about « Electromobility at the crossroads ». International Journal of Automotive Technology and Management, Vol 16, N°1, pp 1-15, 2016.
• Donada Carole et Perez Yannick (eds) 2015, Electromobility : Challenging Issues. International Journal of Automotive Technology and Management. Vol. 15, No. 2.
• Codani Paul, Petit Marc and Perez Yannick, 2015, Participation of an Electric Vehicle fleet to primary frequency control in France, International Journal of Electric and Hybrid Vehicles, Vol 7, N°3, pp 233-249.
• Kempton Willett, Perez Yannick, and Petit Marc, 2014, Public Policy Strategies for Electric Vehicles and for Vehicle to Grid Power. Revue d’Economie Industrielle. N° 148, pp 263-291.