Embed Size (px)
Citation preview

ELECTRONIC PAPER
Particulate air pollution and panel studies in children: asystematic reviewD J Ward, J G Ayres. . . . . . . . . . . . . . . . . . . . . . . . . . . . . . . . . . . . . . . . . . . . . . . . . . . . . . . . . . . . . . . . . . . . . . . . . . . . . . . . . . . . . . . . . . . . . . . . . . . . . . . . . . . . . . . . . . . . . . . . . . . . . . .
See end of article forauthors’ affiliations. . . . . . . . . . . . . . . . . . . . . . .
Correspondence to:Professor J G Ayres, Deptof Environmental andOccupational Medicine,University of Aberdeen,Foresterhill Road,Aberdeen AB25 2ZP, UK;[email protected]
Accepted8 September 2003. . . . . . . . . . . . . . . . . . . . . . .
Occup Environ Med 2004;61:e13 (http://www.occenvmed.com/cgi/content/full/61/4/e13). doi: 10.1136/oem.2003.007088
Background: Panel studies have been used to investigate the short term effects of outdoor particulate airpollution across a wide range of environmental settings.Aims: To systematically review the results of such studies in children, estimate summary measures of effect,and investigate potential sources of heterogeneity.Methods: Studies were identified by searching electronic databases to June 2002, including those whereoutcomes and particulate level measurements were made at least daily for >8 weeks, and analysed usingan appropriate regression model. Study results were compared using forest plots, and fixed and randomeffects summary effect estimates obtained. Publication bias was considered using a funnel plot.Results: Twenty two studies were identified, all except two reporting PM10 (24 hour mean) .50 mg.m23.Reported effects of PM10 on PEF were widely spread and smaller than those for PM2.5 (fixed effectssummary: 20.012 v 20.063 l.min21 per mg.m23 rise). A similar pattern was evident for symptoms.Random effects models produced larger estimates. Overall, in between-study comparisons, panels ofchildren with diagnosed asthma or pre-existing respiratory symptoms appeared less affected by PM10
levels than those without, and effect estimates were larger where studies were conducted in higher ozoneconditions. Larger PM10 effect estimates were obtained from studies using generalised estimatingequations to model autocorrelation and where results were derived by pooling subject specific regressioncoefficients. A funnel plot of PM10 results for PEF was markedly asymmetrical.Conclusions: The majority of identified studies indicate an adverse effect of particulate air pollution that isgreater for PM2.5 than PM10. However, results show considerable heterogeneity and there is evidenceconsistent with publication bias, so limited confidence may be placed on summary estimates of effect. Thepossibility of interaction between particle and ozone effects merits further investigation, as does variabilitydue to analytical differences that alter the interpretation of final estimates.
The short term effect of particulate air pollutants on therespiratory morbidity of children has been the subject ofconsiderable investigation over the past decade.
However, while many epidemiological studies across variedenvironmental conditions (and hence exposure to differentco-pollutants and climatic conditions) have indicated anacute impact of particles on lung function and reportedrespiratory symptoms,1 2 a recent major collaborativeEuropean study failed to show any consistent effects inasthmatic 9 and 10 year olds.3 An accurate measure of thesize of any acute particulate effects is important in publichealth terms. Yet, doubts about the transferability ofindividual study estimates, and a possible lack of coherencebetween estimates, has prevented at least one previousattempt at quantifying these effects.4
Epidemiological studies have commonly been of ‘‘panel’’design, following a cohort prospectively with frequentobservations analysed using time series methods.5 Airpollutant levels are expressed as a series of time averagedobservations, so that the temporal relation between exposureand outcome is studied.6 The collection of individual leveloutcome data also means that hypothesis testing can providestrong evidence of associations at that level.7 8 As pollutantexposure is common to all members of the cohort, atraditional ‘‘control’’ group is not needed, each subject actingas his or her own control, and only covariates that vary acrosstime within an individual need be considered by theanalysis.6 9
Subjects are followed for a predetermined period duringwhich individuals typically record daily symptom and lung
function data (for example, peak expiratory flow, PEF) in adiary. Such studies generally aim to investigate the acuteeffects of pollutants across a typical range of environmentalconditions and may continue for many months. In this waythey are distinguished from ‘‘event studies’’,10 which seek todetermine the response to pollution episodes. This distinctionmay require a judgement based on study duration andenvironmental conditions, and is necessarily subjective andopen to interpretation.
The analysis of panel study data relates pollutant exposureto measures of outcome in regression models that account fortime varying confounders and serial correlation in thesedata.6 9 Regular observations of a continuous physiologicalmeasure such as PEF (as absolute values or some metric ofindividual change) are commonly fitted to linear models,while logistic regression may be preferred for symptomrecords producing a binary series of observations, either asthe simple occurrence of a symptom in an individual(prevalence) or the occurrence of new symptom episodes(incidence).6 8 Two broad analytical approaches are recog-nised. Either a group average outcome measure is derived foreach time point and the resulting time series regressed on thepredictors of interest,3 6 9 or the analysis is repeated for eachsubject with the same model predictors, and the resultingindividual effect estimates pooled to derive an overall averageeffect.10 11 In both cases, an adequate model will consider the
Abbreviations: FE, fixed effects; GEE, generalised estimating equations;OR, odds ratio; PEF, peak expiratory flow; PSA, particulate strongacidity; RE, random effects
1 of 12
www.occenvmed.com
on April 8, 2022 by guest. P
rotected by copyright.http://oem
.bmj.com
/O
ccup Environ M
ed: first published as 10.1136/oem.2003.007088 on 18 M
arch 2004. Dow
nloaded from

effects of trends in the diary data, meteorological indices andautocorrelation, but while additional time varying confoun-ders (for example, individual allergen exposures, frequencyof episodes of respiratory tract infection) have been suggestedfor inclusion,11 their adoption is far from universal. Theinclusion of appropriate trend terms and confounders withinthe model may themselves reduce autocorrelation within themodel residuals. However, two statistical approaches havebeen developed to control remaining effects. In the first,information regarding the prior levels of the outcome areincluded as a predictor in the final model,10 11 while thesecond involves the use of generalised estimating equations(GEE) to extend conventional regression models by model-ling their covariance structure.9 12 This approach theoreticallyprovides a more robust variance estimate (assuming anadequate sample size1), but assumes no bias in the regressioncoefficients (effect estimates).
This paper aims to review the results of panel studies thathave considered the effects of particulate air pollution on therespiratory health of children. We have used systematicmethods13–15 that minimise bias by establishing the searchstrategy, study inclusion and exclusion criteria, assessment ofstudy validity, and methods of data extraction prior toundertaking the review. Where appropriate, summary mea-sures of effect size were also derived. However, meta-analytical methods for observational studies are less welldeveloped than for clinical trials,13 and provide poorsummaries of effect where heterogeneity exists betweenstudies, providing apparently very precise, but spuriousresults.14 In such cases, exploration of factors related toheterogeneity may be of greater interest, and thus weconsidered aspects of the study populations, environmentalconditions encountered, and analytical approaches as sourcesof variability in this study. In addition, summary effectestimates may be biased if they result from a biased sample ofstudies in general, for example due to publication bias.14 16
The likelihood of such bias is thought to be related to studysize, and so we considered the possibility of publication biasin these terms.
METHODSFor the purposes of this review, the term ‘‘panel study’’ wasdefined as a prospective cohort study where individual levelobservations of lung function or respiratory symptoms, aswell as air pollutant records, were collected at least daily fornot less than eight weeks. Only studies that presented resultsfor children (under 18 years old) and particulate air pollution
as PMx (mass concentration of particles less than x mmaerodynamic diameter) derived using an appropriate regres-sion model that controlled for the impact of trend(s), weather(or at least temperature), and autocorrelation, were con-sidered for inclusion. Major bibliographic databases(Medline, Embase, Science Citation Index (Web of ScienceInterface)—the latter better representing environmentaljournals) were searched from 1966 (Medline) to June 2002using a broad strategy consisting of the truncated word termsair pollu$, PM$, partic$ (MESH thesaurus terms and textwords) combined (‘‘AND’’) with terms for longitudinal studydesign or the text words ‘‘panel’’ or ‘‘cohort’’. Results wererestricted by age, but further refinement (for example, byoutcome) was found to omit known studies. Consequently,this strategy resulted in a very large number of non-relevant‘‘hits’’. The search was complemented by inspecting thereference lists of the papers retrieved as well as reviews, handsearching major respiratory, epidemiological and environ-mental journals from 1996 onwards, and consulting booksand reports known to the authors.
While checklists for the assessment of study validity areavailable,17 these concentrate on study design and are noteasily applicable where studies are selected on the basis ofstudy type. Therefore all studies that collected and analyseddata in a manner consistent with the definition of a panelstudy offered above were given equal weight. However,information on analytical strategy (outcome measure, statis-tical methodology and consideration of trends, time varyingconfounders, and autocorrelation), population and settingwere collated in a structured way. Where possible, attemptswere made to express results in a uniform manner—that is,health effects were calculated per unit change (mg.m23)pollutant.
Study results, their relative size, precision, pattern ofeffects and degree of heterogeneity, were explored visuallyusing forest plots,13 15 which display both the mean andinterval effect size for a number of studies simultaneously,also indicating their relative size with a graphical marker(StatsDirect, version 2.2.0, Cambridge, UK). A statistical testof heterogeneity, Q-combinality (based on the x2 distribu-tion),18 was employed for all studies and groups based onanalytical strategy, study setting, and population. However,such tests have relatively poor power to detect deviationsfrom an assumption of homogeneity, and should not berelied on alone.14
Effect estimates for all studies, or subgroups thought toexplain heterogeneity in the results, were pooled to provide aweighted mean estimate of effect. The simplest approachemploys a weighting relative to the inverse of the variance ofeach study’s estimate. This approach (precision weighting)may be straightforwardly applied to lung function results.However, techniques for pooling results for dichotomousoutcomes from cohort studies are based on the difference in
Main messages
N Panel studies from varied settings report an adverseeffect of short term increases in particulate air pollutionon children’s respiratory health.
N The effects of particulate air pollution on PEF appear tobe greater for PM2.5 than PM10.
N Results are very heterogeneous, limiting the confidencethat may be placed on summary measures of effect.
N Effect estimates vary according to the study population,setting, and analytical approach, and appear to begreater in conditions of high ozone and where eithergeneralised estimating equations are used to modelautocorrelation, or overall results are obtained bypooling subject specific regression coefficients.
N There is evidence consistent with publication bias, atleast for PM10 and PEF.
Policy implications
N The degree of heterogeneity evident between panelstudy results questions the transferability of estimatedeffect sizes between locations or populations, and limitsthe use of summary measures in quantitative riskassessment.
N Further research is required to characterise the sub-population of children most at risk of particulate healtheffects, the impact of different analytical strategies onestimated effect size, and the possibility of interactionbetween particulates and ozone.
2 of 12 Electronic paper
www.occenvmed.com
on April 8, 2022 by guest. P
rotected by copyright.http://oem
.bmj.com
/O
ccup Environ M
ed: first published as 10.1136/oem.2003.007088 on 18 M
arch 2004. Dow
nloaded from

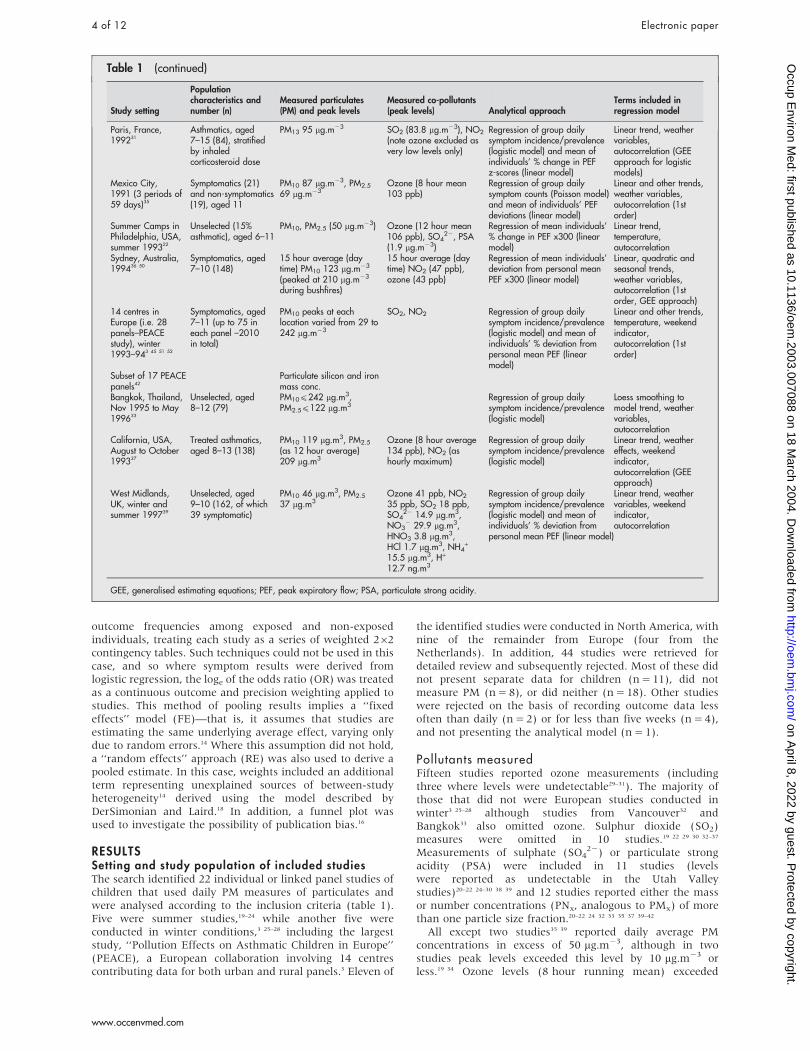
Table 1 Main characteristics of studies identified for inclusion in the review (n = 22); pollutant levels reported as 24 averagevalues unless specified otherwise
Study setting
Populationcharacteristics andnumber (n)
Measured particulates(PM) and peak levels
Measured co-pollutants(peak levels) Analytical approach
Terms included inregression model
Utah Valley, USA,Dec 1989 to Mar199029
Unselected, aged9–11 (41)
PM10 195 mg.m23 NO2 (note: very lowozone and undetectablePSA and H2SO4)
Regression of daily groupsymptom prevalence (logisticmodel) and mean ofindividuals’ daily PEFdeviations (linear model)
Linear trend,temperature,autocorrelation (GEEapproach for logisticmodels)
Utah Valley, USA,1990 to 199130
Symptomatic orasthmatic (39) andnon-symptomatic(40), aged 9–11
PM10 251 mg.m23
The Netherlands,winters of 1987–88to 1989–9026
Unselected, aged7–11 (up to 390)
PM10 174 mg.m23 SO2 (105 mg.m23), NO2,other aerosols includingHNO2 (10.6 mg.m23),SO4
22 (29.7 mg.m23),NO3
2 (36.8 mg.m23),PSA
Regression of daily groupsymptom incidence/prevalence(logistic model) and mean ofindividuals’ daily PEF z-scores(linear model)
Linear trend,temperature,autocorrelation (1storder)
The Netherlands,winter 1990 to199128
Symptomatic, aged6–12 (73)
Mexico City, 1991to 199240
Asthmatics, aged5–13 (71)
PM10 363 mg.m23,PM2.5 177 mg.m23
NO2, SO2 (200 ppb),hourly maximum ozone(370 ppb)
Regression of daily groupsymptom prevalence/medication use (logistic model)and mean of individuals’ dailyPEF z-scores (linear model)
Linear trend,temperature,autocorrelation (GEEapproach for logisticmodels)
Eastern Europe(Erfurt andWeimar, Germanyand Sokolov,Czech Republic),winters 1990 to199227 41 44 49
Asthmatics, aged6–15 (up to 163)
Sokolov: PM10
171 mg.m23, numberand mass conc. of fine(0.1–2.5 mm) andultrafine (10–100 nm)particles
Sokolov: SO2
(492 mg.m23), NO2,SO4
22 (30.2 mg.m23),PSA (7.71 mg.m23)
Regression of daily groupmean of individuals’ deviationin log symptom scores, logmedication use and PEF (linearmodels with weighted poolingby location)
Linear and quadratictrends, weathervariables, weekendindicator,autocorrelation (1dtorder)
Six Cities, USA,1984 to 198824 38
Unselected, aged6–10 (1844)
PM10 117 mg.m23,PM2.5 86 mg.m23
SO2 (82 ppb), NO2
(44 ppb), ozone (8 hourmean 87 ppb), SO4
22
(15 mg.m23), PSA(372 nmol.m23)
Regression of daily groupsymptom incidence withweighted pooling by location(logistic model with weightedpooling by location)
Complex non-lineartrends, temperature,autocorrelation (GEEapproach)
Uniontown,Pennsylvania,USA, summers1990 and199120 24
Symptomatics (71)and non-symptomatics(27), aged 9–11
PM10 83 mg.m23,PM2.1 88 mg.m23
12 hour average SO2
(44.9 ppb), ozone(87.5 ppb), SO4
22
(515 nmol.m23), PSA(676 nmol.m23)
Regression of daily groupsymptom prevalence (logisticmodel) and weighted mean ofindividual’s daily PEF deviations(linear model). Uniontownresults weighted by time spentoutdoors
Linear trend,temperature,autocorrelation (2ndorder in linear models,GEE approach forlogistic models)
State College,Pennsylvania, USA,summers 1990and 199121 24
Symptomatics (62)and non-symptomatics(46), aged 9–11
PM10 82.7 mg.m23,PM2.1 85.8 mg.m23
12 hour average SO2
(26.5 ppb), ozone(92.3 ppb), SO4
22
(481 nmol.m23), PSA(670 nmol.m23)
Surrey, UK,summer 199423
Unselected (9% withrecent wheeze), aged7–11 (154)
PM10 150 mg.m23 NOx, SO2, ozone (8hourly mean 128 ppb)
Two-stage weighted pooling ofsubject specific coefficientsderived from regression of eachsubject’s daily spirometry (linearmodel)
Linear trend, weathervariables,autocorrelation (1st
order)
The Netherlands,summer 199519
Chronically ill children(77% taking anti-asthma medication),aged 7–13 (61)
PM10 60.3 mg.m23 Ozone (8 hour mean111 ppb)
Two-stage weighted polling ofsubject specific coefficientsderived from regression of eachsubject’s daily symptomprevalence (logistic model) andPEF (linear model)
Linear trend,temperature, weekendindicator,autocorrelation (1storder)
Vancouver,Canada, 1990to 199232
Asthmatic (132) andnon-asthmatic (74),aged 6–13
PM10 159 mg.m23
and number concn forvarious particlefractions
Two-stage weighted polling ofsubject specific coefficientsderived from regression of eachsubject’s daily symptomprevalence (logistic model) andPEF (linear model)
Linear trend, weathervariables,autocorrelation (GEEapproach for logisticmodels)
The Netherlands,winters 1992–93to 1994–9525 43
Symptomatics (396)and non-symptomatics(399), aged 7–11,with and withoutbronchialhyperreactivity orincreased IgE levels
PM10 112 mg.m23 urbanand 242 mg.m23 rural
SO2 (urban152 mg.m23, rural43 mg.m23), NO2,SO4
22 (urban24 mg.m23, rural23 mg.m23)
Regression of daily groupsymptom prevalence (logisticmodel), mean of individuals’PEF deviations (linear model)and daily group prevalence of10% and 20% falls in PEF(logistic model)
Linear and other trends,temperature, weekendindicator,autocorrelation (1storder)
California, USA,Autumn 199534
Asthmatics, aged9–17 (25)
PM10 54 mg.m23 Ozone (8 hour mean110 ppb)
Two-stage weighted polling ofsubject specific coefficientsderived from regression of eachsubject’s daily symptomprevalence/severity (logisticmodel) and PEF (linear model)
Linear trend,temperature,autocorrelation (1storder, GEE approachfor logistic models)
Electronic paper 3 of 12
www.occenvmed.com
on April 8, 2022 by guest. P
rotected by copyright.http://oem
.bmj.com
/O
ccup Environ M
ed: first published as 10.1136/oem.2003.007088 on 18 M
arch 2004. Dow
nloaded from
outcome frequencies among exposed and non-exposedindividuals, treating each study as a series of weighted 262contingency tables. Such techniques could not be used in thiscase, and so where symptom results were derived fromlogistic regression, the loge of the odds ratio (OR) was treatedas a continuous outcome and precision weighting applied tostudies. This method of pooling results implies a ‘‘fixedeffects’’ model (FE)—that is, it assumes that studies areestimating the same underlying average effect, varying onlydue to random errors.14 Where this assumption did not hold,a ‘‘random effects’’ approach (RE) was also used to derive apooled estimate. In this case, weights included an additionalterm representing unexplained sources of between-studyheterogeneity14 derived using the model described byDerSimonian and Laird.18 In addition, a funnel plot wasused to investigate the possibility of publication bias.16
RESULTSSetting and study population of included studiesThe search identified 22 individual or linked panel studies ofchildren that used daily PM measures of particulates andwere analysed according to the inclusion criteria (table 1).Five were summer studies,19–24 while another five wereconducted in winter conditions,3 25–28 including the largeststudy, ‘‘Pollution Effects on Asthmatic Children in Europe’’(PEACE), a European collaboration involving 14 centrescontributing data for both urban and rural panels.3 Eleven of
the identified studies were conducted in North America, withnine of the remainder from Europe (four from theNetherlands). In addition, 44 studies were retrieved fordetailed review and subsequently rejected. Most of these didnot present separate data for children (n = 11), did notmeasure PM (n = 8), or did neither (n = 18). Other studieswere rejected on the basis of recording outcome data lessoften than daily (n = 2) or for less than five weeks (n = 4),and not presenting the analytical model (n = 1).
Pollutants measuredFifteen studies reported ozone measurements (includingthree where levels were undetectable29–31). The majority ofthose that did not were European studies conducted inwinter3 25–28 although studies from Vancouver32 andBangkok33 also omitted ozone. Sulphur dioxide (SO2)measures were omitted in 10 studies.19 22 29 30 32–37
Measurements of sulphate (SO422) or particulate strong
acidity (PSA) were included in 11 studies (levelswere reported as undetectable in the Utah Valleystudies)20–22 24–30 38 39 and 12 studies reported either the massor number concentrations (PNx, analogous to PMx) of morethan one particle size fraction.20–22 24 32 33 35 37 39–42
All except two studies35 39 reported daily average PMconcentrations in excess of 50 mg.m23, although in twostudies peak levels exceeded this level by 10 mg.m23 orless.19 34 Ozone levels (8 hour running mean) exceeded
Study setting
Populationcharacteristics andnumber (n)
Measured particulates(PM) and peak levels
Measured co-pollutants(peak levels) Analytical approach
Terms included inregression model
Paris, France,199231
Asthmatics, aged7–15 (84), stratifiedby inhaledcorticosteroid dose
PM13 95 mg.m23 SO2 (83.8 mg.m23), NO2
(note ozone excluded asvery low levels only)
Regression of group dailysymptom incidence/prevalence(logistic model) and mean ofindividuals’ % change in PEFz-scores (linear model)
Linear trend, weathervariables,autocorrelation (GEEapproach for logisticmodels)
Mexico City,1991 (3 periods of59 days)35
Symptomatics (21)and non-symptomatics(19), aged 11
PM10 87 mg.m23, PM2.5
69 mg.m23Ozone (8 hour mean103 ppb)
Regression of group dailysymptom counts (Poisson model)and mean of individuals’ PEFdeviations (linear model)
Linear and other trends,weather variables,autocorrelation (1storder)
Summer Camps inPhiladelphia, USA,summer 199322
Unselected (15%asthmatic), aged 6–11
PM10, PM2.5 (50 mg.m23) Ozone (12 hour mean106 ppb), SO4
22, PSA(1.9 mg.m23)
Regression of mean individuals’% change in PEF x300 (linearmodel)
Linear trend,temperature,autocorrelation
Sydney, Australia,199436 50
Symptomatics, aged7–10 (148)
15 hour average (daytime) PM10 123 mg.m23
(peaked at 210 mg.m23
during bushfires)
15 hour average (daytime) NO2 (47 ppb),ozone (43 ppb)
Regression of mean individuals’deviation from personal meanPEF x300 (linear model)
Linear, quadratic andseasonal trends,weather variables,autocorrelation (1storder, GEE approach)
14 centres inEurope (i.e. 28panels–PEACEstudy), winter1993–943 45 51 52
Symptomatics, aged7–11 (up to 75 ineach panel –2010in total)
PM10 peaks at eachlocation varied from 29 to242 mg.m23
SO2, NO2 Regression of group dailysymptom incidence/prevalence(logistic model) and mean ofindividuals’ % deviation frompersonal mean PEF (linearmodel)
Linear and other trends,temperature, weekendindicator,autocorrelation (1storder)
Subset of 17 PEACEpanels42
Particulate silicon and ironmass conc.
Bangkok, Thailand,Nov 1995 to May199633
Unselected, aged8–12 (79)
PM10(242 mg.m3,PM2.5(122 mg.m3
Regression of group dailysymptom incidence/prevalence(logistic model)
Loess smoothing tomodel trend, weathervariables,autocorrelation
California, USA,August to October199337
Treated asthmatics,aged 8–13 (138)
PM10 119 mg.m3, PM2.5
(as 12 hour average)209 mg.m3
Ozone (8 hour average134 ppb), NO2 (ashourly maximum)
Regression of group dailysymptom incidence/prevalence(logistic model)
Linear trend, weathereffects, weekendindicator,autocorrelation (GEEapproach)
West Midlands,UK, winter andsummer 199739
Unselected, aged9–10 (162, of which39 symptomatic)
PM10 46 mg.m3, PM2.5
37 mg.m3Ozone 41 ppb, NO2
35 ppb, SO2 18 ppb,SO4
22 14.9 mg.m3,NO3
2 29.9 mg.m3,HNO3 3.8 mg.m3,HCl 1.7 mg.m3, NH4
+
15.5 mg.m3, H+
12.7 ng.m3
Regression of group dailysymptom incidence/prevalence(logistic model) and mean ofindividuals’ % deviation frompersonal mean PEF (linear model)
Linear trend, weathervariables, weekendindicator,autocorrelation
GEE, generalised estimating equations; PEF, peak expiratory flow; PSA, particulate strong acidity.
Table 1 (continued)
4 of 12 Electronic paper
www.occenvmed.com
on April 8, 2022 by guest. P
rotected by copyright.http://oem
.bmj.com
/O
ccup Environ M
ed: first published as 10.1136/oem.2003.007088 on 18 M
arch 2004. Dow
nloaded from

50 ppb (100 mg.m23) in nine studies; six from NorthAmerica20–22 34 35 37 and three from elsewhere.19 23 36 In con-trast, only four studies reported 24 hour mean SO2
concentrations greater than 47 ppb (125 mg.m23); three fromEurope (including some settings within the PEACEstudy)3 25 27 and one from the USA.38
Study populationsThe age range of subjects typically spanned 6 to 11 years.Older children were included in nine studies; four extendingthe range to 13 years,19 32 37 40 two to 15 years,27 31 and one to17 years.34 The majority of studies (15) recruited panels ofchildren either diagnosed with asthma or with reported pre-existing respiratory symptoms (‘‘symptomatic subjects’’). Inseven studies, both symptomatic and non-symptomaticsubjects were recruited, although in only three were theresults presented in such a way as to permit a directcomparison of effects.25 30 39 Four studies presented analysesstratified by use of anti-asthma medication3 25 27 31 43–45 andtwo considered subgroups based on the presence of bronchialhyperreactivity and/or increased serum IgE concentra-tions.25 36 43
Analytical approach of included studiesA two stage analytical approach was adopted by fivestudies,19 23 32 34 the remainder employing a population daily
average outcome in their analyses. Potential autocorrelationeffects were modelled using GEEs in 11 studies; nineoriginating from North America20 21 29 30 32 34 37 38 40 (of whichtwo utilised a two stage analytical approach) and two fromelsewhere.31 36 While all adjusted their regression models forthe effects of weather, only 10 studies considered variablesother than a term for temperature alone.23 27 31–37 39 Dummyvariables denoting weekdays or schooldays were included inthe reported models from six studies,3 19 25 27 37 39 while threeconsidered outdoor pollen counts,19 23 36 one considered‘‘fever’’,27 and one time spent outdoors.36
Reported effect size; peak expiratory flowPollutant effects on lung function were a reported outcomemeasure in 19 studies (table 1) and the results for 15 of theseare presented in a summary forest plot (fig 1). The plotsdisplay the largest effect size obtained over various pollutantlags, excluding those for multiple day averages wherepossible. For PM10, a wide spread of results was observed(mean estimates from 20.16 to +0.01 l.min21 per mg.m23),all except one in an adverse direction. Results for PM2.5
showed a greater range of absolute values (mean estimates20.05 to 20.28 l.min21 per mg.m23) although their intervalestimates overlapped more closely. The results of four studiescould not be displayed in this manner. The first, from Surrey,UK, used spirometry and showed associations between
Figure 1 Mean and 95% confidence interval estimates of the impact of PM10 and PM2.5 on PEF expressed as l.min21 change per mg.m23 rise inpollutant. ‘‘Symptomatic’’ indicates subjects with pre-existing respiratory symptoms or asthma.
Electronic paper 5 of 12
www.occenvmed.com
on April 8, 2022 by guest. P
rotected by copyright.http://oem
.bmj.com
/O
ccup Environ M
ed: first published as 10.1136/oem.2003.007088 on 18 M
arch 2004. Dow
nloaded from

increased PM10 and falls in FEV1 and FVC (0.07 and 0.17 mlper mg.m23 respectively),23 while results from two others(Netherlands and Paris) could not be expressed as PEFchange. The Dutch study found that the odds of a significantPEF decline were increased with increased PM10,43 while theFrench study concluded that increased PM13 led to a PEF fallin mild, but not more severe, asthmatics (as judged byinhaled corticosteroid dose).31 Finally, no appropriate quan-titative data could be extracted from one paper.34
Results for PM10 from fig 1 were pooled to derive a FEsummary estimate (table 2). The forest plot suggested thatthe study results were not homogeneous, and formal testingof heterogeneity supported this view (table 2). An RE modelproduced a much greater estimated effect size, giving muchless weight to the PEACE study, and potential reasons forsuch variability were therefore explored.
These results were generally the ‘‘headline’’ or mainreported estimate for each study (typically the greatest effectsize found) and most related to either the same or previousday’s pollutant levels. Longer lags of two19 40 or three39 days,and results for moving average (four or five day30 32) levels arepresented by only five studies. Their exclusion did notmaterially affect the pooled estimate (table 2). Only threestudies employed a two stage analytical approach and theirpooled effect estimate (FE) was considerably greater thanthat for other studies.19 32 40 In addition, there was lessevidence of heterogeneity between results among thesestudies. The majority of studies primarily considered asth-matic or symptomatic children. However, the pooled estimate(FE) for other individuals derived from five studies22 26 29 30 39
suggested a greater pollutant effect among these children(table 2), although in only two was a direct comparisonbetween those with and without pre-existing respiratorysymptoms provided. Of these, the study conducted in theUtah Valley, USA indicated a greater effect among sympto-matic children,30 while the study from the UK West Midlandsdid not.39 Studies with high peak ozone levels (eight hourmean greater than 50 ppb) produced a pooled estimate (FE)greater than that for all studies as a whole19 22 35 (table 2).
Pooled results for PM2.5 (table 2, fig 1) suggest a greatereffect size per unit pollutant than for PM10 and reduced
heterogeneity among results (0.05 . p . 0.025), althoughthe summary estimate derived from a RE model was stillconsiderably greater than that from an FE approach. A directcomparison of the relative effects of these PM metrics wasavailable from four studies; in three, the impact of PM2.5 is(non-significantly) greater than that of PM10 per unitpollutant,35 39 40 while one study reports the reverse.22
Studies were mostly conducted in similar conditions of highozone, so the impact of environmental conditions was notexplored further. Visually there was little evidence that effectestimates were greater in studies recruiting asthmatic orsymptomatic children, indeed the largest estimate of effectwas obtained from a panel of unselected children.39
Reported effect size; symptomsResults for the 18 identified studies investigating pollutanteffects on reported symptoms are presented in two summaryforest plots (figs 2 and 3). The plots for PM10 and PM2.5
display the largest effect size obtained over various pollutantlags excluding those for multiple day averages wherepossible, and exclude one study that provided insufficientsymptom data for further analysis.35 For PM10, results wereagain widely spread (mean OR estimates range from 0.999 to1.014 per mg.m23 for cough and 0.998 to 1.034 for LRS) andapproximately half of all reported results were not them-selves statistically significant (more so in the case of LRS).
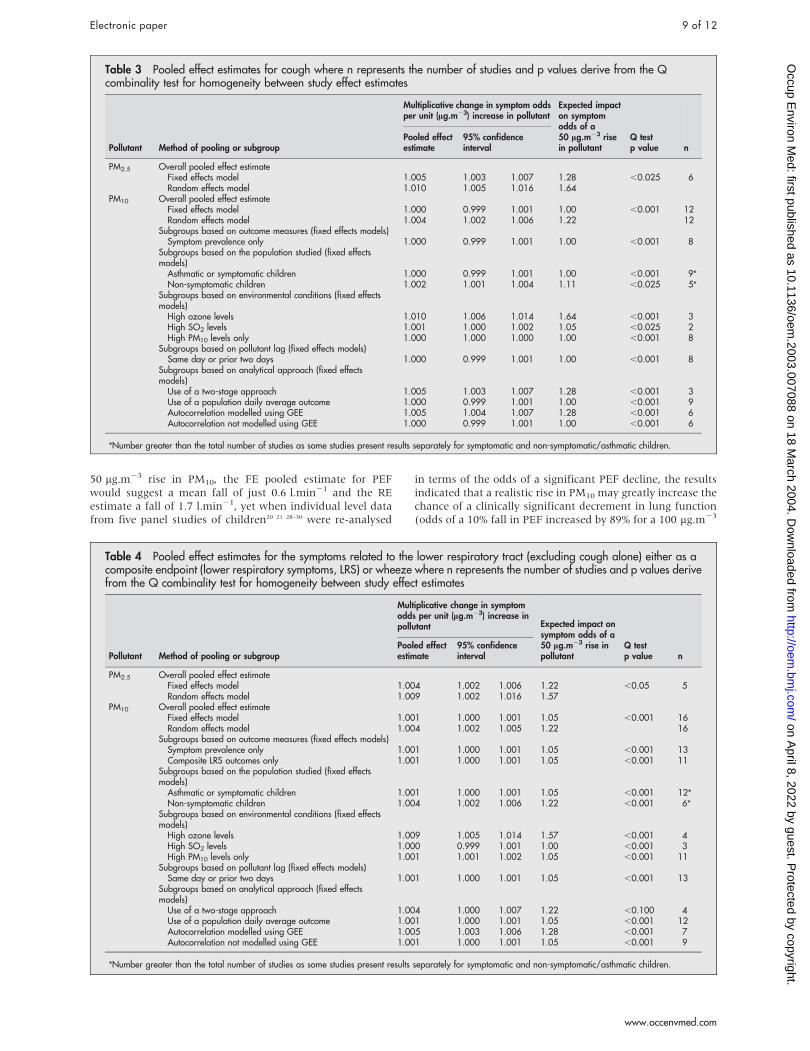
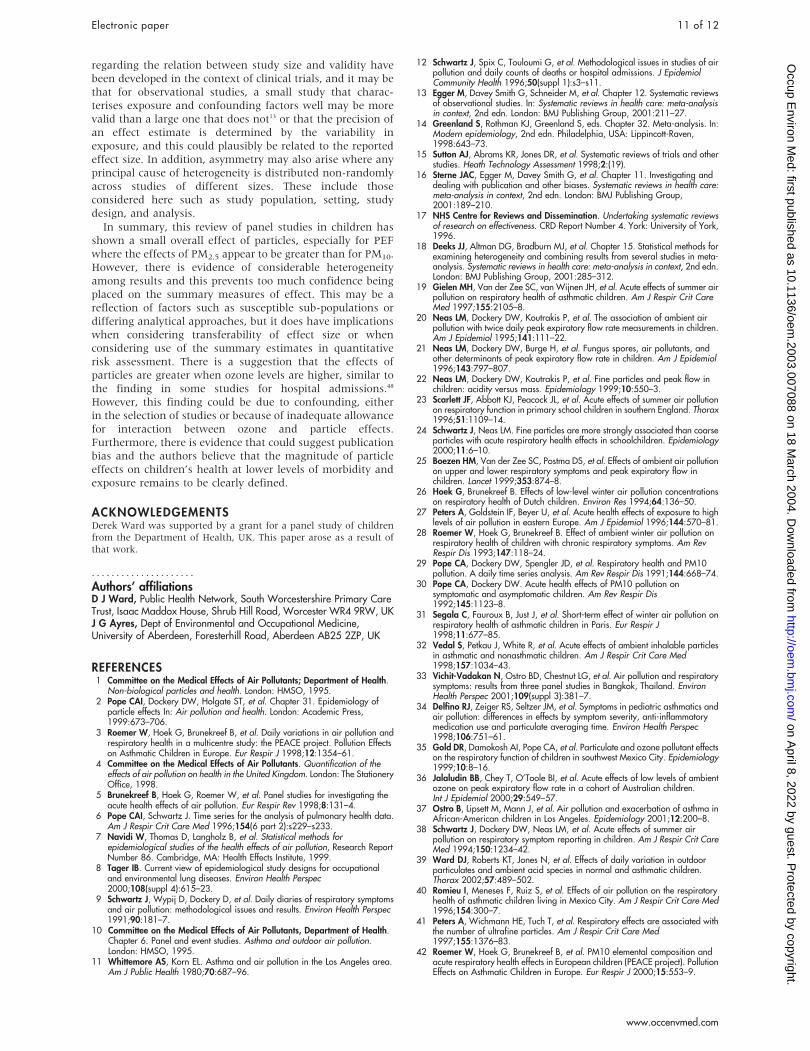
Pooling the results for PM10 (FE) suggests no overall effectfor cough, and a very small, but statistically significant(p , 0.05) effect for LRS (tables 3 and 4). In both cases, theprecision weighted mean is dominated by the results fromthe two large multicentre studies.3 38 However, the forestplots suggest considerable heterogeneity that was statisticallysignificant. Summary ORs from RE models show increasedeffect sizes, and potential sources of heterogeneity werefurther explored through subgroup analysis.
The pooled results for LRS include both studies reporting acomposite endpoint as well as those reporting the symptomwheeze alone. Excluding the latter (five studies28 32 37 39 40) didnot change the summary estimate (FE). For cough, eightstudies analysed the symptom records as prevalent data, theremainder converting the raw data to incident episodes. For
Table 2 Pooled effect estimates for peak expiratory flow (PEF), where n represents the number of studies and p values derivefrom the Q combinality test for homogeneity between study effect estimates
Pollutant Method of pooling or subgroup
Change in PEF (l.min21) per unit(mg.m23) increase in pollutant Expected impact on
PEF (l.min21) of a50 mg.m23 rise inpollutant
Q testp value n
Pooled effectestimate 95% confidence interval
PM2.5 Overall pooled effect estimateFixed effects model 20.063 20.091 20.034 23.15 ,0.05 5Random effects model 20.144 20.243 20.044 27.20
PM10 Overall pooled effect estimateFixed effects model 20.012 20.017 20.008 20.60 ,0.001 13Random effects model 20.033 20.047 20.019 21.65 13
Subgroups based on the population studied (fixed effectsmodels)
Asthmatic or symptomatic children 20.010 20.014 20.005 20.50 ,0.005 9*Non-symptomatic children 20.039 20.055 20.024 21.95 ,0.001 5*
Subgroups based on environmental conditions (fixed effectsmodels)
High ozone levels 20.041 20.074 20.009 22.05 ,0.025 3High SO2 levels 20.025 20.047 20.003 21.25 2 1High PM10 levels only 20.011 20.016 20.007 20.55 ,0.001 9
Subgroups based on pollutant lag (fixed effects models)Same day or prior day only 20.009 20.014 20.005 20.45 ,0.001 8
Subgroups based on analytical approach fixed effectsmodels)
Use of a two stage approach 20.033 20.054 20.013 21.65 ,0.025 3Use of a population daily average outcome 20.011 20.016 20.007 20.55 ,0.001 10
*Number greater than the total number of studies as some studies present results separately for symptomatic and non-symptomatic/asthmatic children.
6 of 12 Electronic paper
www.occenvmed.com
on April 8, 2022 by guest. P
rotected by copyright.http://oem
.bmj.com
/O
ccup Environ M
ed: first published as 10.1136/oem.2003.007088 on 18 M
arch 2004. Dow
nloaded from

LRS, almost all studies were analysed as prevalence. Omittingresults relating to incident data did not alter either FEsummary effect estimate (tables 3 and 4). As for PEF, theresults presented generally reflect the pollutant lag with thegreatest effect size. However, for cough, the results for onlyfour studies relate to lags greater than two days31 37 ormultiple day averages,32 38 and for LRS, all except three resultsrelate to the same or previous day’s pollutant levels.32 37 39 Theexclusion of these studies did not alter either summary effectestimate (tables 3 and 4). A two stage analytical approachwas used by four studies19 32 34 40 and pooling their results(FE) suggests a greater estimated effect size among thesestudies than for results as a whole. Importantly, for LRS therewas also less evidence of heterogeneity among these results(0.10 . p . 0.05, table 4). GEEs were used to modelautocorrelation effects in seven studies29232 37 38 40 and again,pooled results (FE) suggest a larger overall estimated effectsfor these studies, although heterogeneity remained.
Few studies presented results for children not selected onthe basis of asthma or pre-existing respiratory symptoms.However, those that did suggested greater pollutant effectsamong non-symptomatic children (tables 3 and 4), particu-larly for LRS,26 29 30 33 38 39 and for cough, their resultsappeared more homogeneous than for all studies
(0.025 . p . 0.01).26 30 38 39 43 Of just two studies that pre-sented direct comparisons of such children, one indicated asmall increased effect of PM10 on symptoms in children withasthma or pre-existing symptoms,30 while the other showedno difference for cough.43 Pooled results from studiesconducted in conditions of relatively high ozone suggest agreater impact of PM10 on both cough and LRS than forstudies as a whole, although there was little evidence ofhomogeneity between such studies reporting either outcome(tables 3 and 4).19 34 37 38 In contrast, results from panels withhigh SO2 levels (excluding PEACE3) showed little if anypollutant effect.27 38 43
Pooled results for PM2.5 suggest a greater effect size thanPM10, with reduced heterogeneity among results, particularlyfor LRS (0.05 . p . 0.025, tables 3 and 4, figs 2 and 3).Results obtained from RE models remained considerablygreater than those for FE models. Four studies each reportingresults for cough and LRS provide a direct comparisonbetween the effect size of PM10 and PM2.5. Results for PM2.5
were reported as (non-significantly) greater than for PM10
(per unit pollutant),39 40 approximately the same,24 38 and inone case lower (significantly so for cough).37 Again, studieswere mostly derived from settings experiencing high ozonelevels and environmental influences were not therefore
Figure 2 Mean and 95% confidence interval estimates of the impact of PM10 and PM2.5 on reported cough, expressed as the multiplicative change insymptom odds per mg.m23 rise in pollutant. ‘‘Symptomatic’’ indicates subjects with pre-existing respiratory symptoms or asthma and symptomsanalysed as prevalence data unless indicated otherwise (incidence).
Electronic paper 7 of 12
www.occenvmed.com
on April 8, 2022 by guest. P
rotected by copyright.http://oem
.bmj.com
/O
ccup Environ M
ed: first published as 10.1136/oem.2003.007088 on 18 M
arch 2004. Dow
nloaded from

explored. Only one study considered asthmatic or sympto-matic children for either outcome40 and its estimates were atthe lower end of the range of results; one of three non-significant results for LRS.
Funnel plot for PEF resultsThe possibility of publication bias was considered amongstudies contributing to the pooled estimate for PM10 and PEF(fig 1). The resulting funnel plot is markedly asymmetrical(fig 4), showing a strong association between increasingeffect size and decreasing size of the study estimate’sstandard error.
DISCUSSION AND CONCLUSIONSThis review identified a large number of relevant panelstudies reporting results for both PEF and symptoms, and
while the majority suggest an adverse effect of outdoorparticulate matter, their estimates of effect vary considerably.In general, comparisons between studies suggest a greatereffect size for PM2.5 per unit pollutant compared to PM10,especially for PEF results where this pattern is mirrored inthe available within-study comparisons, and while results forPM10 and cough were more often in the direction of adverseeffect than those for LRS, a FE pooling of the results forcough was not statistically significantly different from zero,while that for LRS was. Effect estimates for all outcomeswere small, in that the average change in lung function orincrease in symptom odds per unit pollutant rise were far lessthan those that would be considered clinically relevant in anindividual. However, pollutant levels vary by factors muchgreater than just unit changes and susceptibility to pollutanteffects are likely to vary within the general population. For a
Figure 3 Mean and 95% confidence interval estimates of the impact of PM10 and PM2.5 on reported LRS or wheeze (where indicated), expressed asthe multiplicative change in symptom odds per mg.m23 rise in pollutant. ‘‘Symptomatic’’ indicates subjects with pre-existing respiratory symptoms orasthma and symptoms analysed as prevalence data unless indicated otherwise (incidence).
8 of 12 Electronic paper
www.occenvmed.com
on April 8, 2022 by guest. P
rotected by copyright.http://oem
.bmj.com
/O
ccup Environ M
ed: first published as 10.1136/oem.2003.007088 on 18 M
arch 2004. Dow
nloaded from
50 mg.m23 rise in PM10, the FE pooled estimate for PEFwould suggest a mean fall of just 0.6 l.min21 and the REestimate a fall of 1.7 l.min21, yet when individual level datafrom five panel studies of children20 21 28–30 were re-analysed
in terms of the odds of a significant PEF decline, the resultsindicated that a realistic rise in PM10 may greatly increase thechance of a clinically significant decrement in lung function(odds of a 10% fall in PEF increased by 89% for a 100 mg.m23
Table 3 Pooled effect estimates for cough where n represents the number of studies and p values derive from the Qcombinality test for homogeneity between study effect estimates
Pollutant Method of pooling or subgroup
Multiplicative change in symptom oddsper unit (mg.m23) increase in pollutant
Expected impacton symptomodds of a50 mg.m23 risein pollutant
Q testp value n
Pooled effectestimate
95% confidenceinterval
PM2.5 Overall pooled effect estimateFixed effects model 1.005 1.003 1.007 1.28 ,0.025 6Random effects model 1.010 1.005 1.016 1.64
PM10 Overall pooled effect estimateFixed effects model 1.000 0.999 1.001 1.00 ,0.001 12Random effects model 1.004 1.002 1.006 1.22 12
Subgroups based on outcome measures (fixed effects models)Symptom prevalence only 1.000 0.999 1.001 1.00 ,0.001 8
Subgroups based on the population studied (fixed effectsmodels)
Asthmatic or symptomatic children 1.000 0.999 1.001 1.00 ,0.001 9*Non-symptomatic children 1.002 1.001 1.004 1.11 ,0.025 5*
Subgroups based on environmental conditions (fixed effectsmodels)
High ozone levels 1.010 1.006 1.014 1.64 ,0.001 3High SO2 levels 1.001 1.000 1.002 1.05 ,0.025 2High PM10 levels only 1.000 1.000 1.000 1.00 ,0.001 8
Subgroups based on pollutant lag (fixed effects models)Same day or prior two days 1.000 0.999 1.001 1.00 ,0.001 8
Subgroups based on analytical approach (fixed effectsmodels)
Use of a two-stage approach 1.005 1.003 1.007 1.28 ,0.001 3Use of a population daily average outcome 1.000 0.999 1.001 1.00 ,0.001 9Autocorrelation modelled using GEE 1.005 1.004 1.007 1.28 ,0.001 6Autocorrelation not modelled using GEE 1.000 0.999 1.001 1.00 ,0.001 6
*Number greater than the total number of studies as some studies present results separately for symptomatic and non-symptomatic/asthmatic children.
Table 4 Pooled effect estimates for the symptoms related to the lower respiratory tract (excluding cough alone) either as acomposite endpoint (lower respiratory symptoms, LRS) or wheeze where n represents the number of studies and p values derivefrom the Q combinality test for homogeneity between study effect estimates
Pollutant Method of pooling or subgroup
Multiplicative change in symptomodds per unit (mg.m23) increase inpollutant Expected impact on
symptom odds of a50 mg.m23 rise inpollutant
Q testp value n
Pooled effectestimate
95% confidenceinterval
PM2.5 Overall pooled effect estimateFixed effects model 1.004 1.002 1.006 1.22 ,0.05 5Random effects model 1.009 1.002 1.016 1.57
PM10 Overall pooled effect estimateFixed effects model 1.001 1.000 1.001 1.05 ,0.001 16Random effects model 1.004 1.002 1.005 1.22 16
Subgroups based on outcome measures (fixed effects models)Symptom prevalence only 1.001 1.000 1.001 1.05 ,0.001 13Composite LRS outcomes only 1.001 1.000 1.001 1.05 ,0.001 11
Subgroups based on the population studied (fixed effectsmodels)
Asthmatic or symptomatic children 1.001 1.000 1.001 1.05 ,0.001 12*Non-symptomatic children 1.004 1.002 1.006 1.22 ,0.001 6*
Subgroups based on environmental conditions (fixed effectsmodels)
High ozone levels 1.009 1.005 1.014 1.57 ,0.001 4High SO2 levels 1.000 0.999 1.001 1.00 ,0.001 3High PM10 levels only 1.001 1.001 1.002 1.05 ,0.001 11
Subgroups based on pollutant lag (fixed effects models)Same day or prior two days 1.001 1.000 1.001 1.05 ,0.001 13
Subgroups based on analytical approach (fixed effectsmodels)
Use of a two-stage approach 1.004 1.000 1.007 1.22 ,0.100 4Use of a population daily average outcome 1.001 1.000 1.001 1.05 ,0.001 12Autocorrelation modelled using GEE 1.005 1.003 1.006 1.28 ,0.001 7Autocorrelation not modelled using GEE 1.001 1.000 1.001 1.05 ,0.001 9
*Number greater than the total number of studies as some studies present results separately for symptomatic and non-symptomatic/asthmatic children.
Electronic paper 9 of 12
www.occenvmed.com
on April 8, 2022 by guest. P
rotected by copyright.http://oem
.bmj.com
/O
ccup Environ M
ed: first published as 10.1136/oem.2003.007088 on 18 M
arch 2004. Dow
nloaded from

rise).46 Additionally, if susceptibility to pollutants is notdistributed evenly within the population, then the meaneffect estimates described above could indicate that asusceptible subgroup might actually experience a muchgreater effect size. If say 10% of the population respond topollutants, then their mean effect size would be ten timesgreater than the population average results presented above.
A previous review of particulate health effects conductedbefore publication of the PEACE study,3 produced a muchgreater FE estimate for PEF and PM10 (0.008% decline permg.m23 rise).47 That review combined results for adults andchildren, considered studies where recording was lessfrequent than daily, and the authors used a set of assump-tions regarding particle equivalence to combine data usingdifferent particle metrics across different, predominantly USsettings. In contrast, six of the 13 studies used to derive theestimate for PM10 and PEF were from Europe, and thepattern of estimates suggest that the greatest estimates werederived from North America.
For all outcome PM combinations, an RE approach toderiving the pooled estimate produced a greater effect size.Such models aim to incorporate additional between-studyheterogeneity, but the cause of such variability remainsunexplained. Panel studies in themselves can contribute toheterogeneity because of variations in design, such asduration and timing of the study periods, inclusion criteriafor subjects (including age) and the degree of symptomatol-ogy. In addition, because of their shorter duration (comparedto time series studies) unmeasured time dependent con-founders may have an impact, or at least be less adequatelydealt with. Thus, the interpretation of RE estimates iscomplex, they cannot easily be generalised beyond thespecific set of included studies, and where they differmarkedly from FE estimates, may indicate a degree ofheterogeneity that makes summary estimation nonsensical.14
Exploring the potential reasons for variation in resultsindicated that analytical approach might play a part. Thegreater estimated effect size produced by studies thatmodelled autocorrelation using GEEs than those thatincluded additional regression terms incorporating informa-tion about past levels of the outcome was to be expected ontheoretical grounds. However, the greater effect size (andpossible reduced heterogeneity) among the minority ofstudies that adopted a two stage analytical approach is anew finding. Effect and interval estimates that derive fromthese different strategies may have quite different interpreta-tions. On the one hand, deriving a series of daily average
levels for the outcome of interest means that the final results(and confidence intervals) reflect only changes in thoseaverage levels. On the other hand, final results from a twostage analysis reflect the mean and spread of individualresponses to pollutants. A reanalysis of the West Midlands,UK data39 using a two stage approach with the same termsincorporated into the regression analyses, resulted in effectestimates for PEF that were much smaller than those fromthe original analyses (Ward and Ayres 2002, personalcommunication), the reverse of the pattern seen betweenstudies in this review. However, the interval estimates weregenerally reduced even further resulting in more ‘‘statisticallysignificant’’ results (for PM10 20.029 l.min21 per mg.m23
rise, 95% CI 20.070 to 0.011; for PM2.5 20.060 l.min21 permg.m23 rise, 95% CI 20.106 to 20.015). The generalisabilityof these observations is not known and requires thereanalysis of further datasets to provide additional within-study comparisons.
Further exploration of the observed variation in studyestimates also implicated aspects of the study setting andpanel selection. Pooled estimates suggest that studiesconducted in conditions of high peak ozone levels producedgreater PM10 estimates of effect for all outcomes than studiesin other settings. This finding could arise if the effects ofparticulates were enhanced in such circumstances or werequalitatively different in summertime. However, confoundingcould equally explain these results. This might occur ifstudies reporting these conditions generally also recruitedmore susceptible children or used a different analyticalapproach, because children spend more time outdoors insummer and are more affected by outdoor pollutants, orbecause the two pollutants are closely associated and theestimate for PM10 is not sufficiently corrected for the effectsof ozone. There was no indication of a similar pattern ofresults for PM2.5, although there were fewer studies toconsider and virtually all estimates were derived from NorthAmerican settings. Two-pollutant models are subject toproblems of collinearity and may be difficult to interpret.However, several studies have presented the results of modelsincorporating measures of fine or secondary particulatematter and ozone: two studies from Mexico showed apersisting effect of PM2.5 after controlling for ozone,35 40 andthe effect of summertime particulate sulphate on PEFpredominated over that of ozone in a study of children fromPhiladelphia.22 No similar data have been published for PM10,although results from the Harvard Six Cities Study reveal apersisting effect of PM2.5 on LRS, and coarse particles (PM2.5–10)on cough, in models that include both measures.24
Pooled estimates also suggested that effect estimates forPM10 derived from panels selected on the basis of a history ofasthma or asthmatic symptoms were smaller than thosederived from subjects without such a history. However, therewas considerable variation in the criteria used to selectchildren, ranging from children diagnosed as asthmatic onthe basis of reported wheeze, doctor diagnosed asthma, and/or chronic cough27 29–31 to those recruited with cough alone3 28
or with abnormal pulmonary function.32 40 In contrast, lessthan half of subjects from the panels in Pennsylvania 1990–91, reported no recent respiratory symptoms, although therewas no apparent intention to recruit a ‘‘symptomatic’’ cohortof children.20 21 24 Thus, the great variation in criteria for panelrecruitment makes the relative susceptibility of variousgroups hard to determine from between-study comparisonsand may contribute to the heterogeneity among results.
The pooled estimates presented in this review should beconsidered in the light of the markedly asymmetrical funnelplot obtained for the PM10 and PEF results. This raises thepossibility of publication bias, whereby small studies are lesslikely to be published if they have ‘‘negative’’ findings. Ideas
Figure 4 Funnel plot illustrating the relation between the size of eithersingle study or pooled effect estimates, and the precision (inverse ofstandard error, SE) of those estimates, for results contributing to thepooled estimates of the effect of PM10 on PEF (fig 1 and table 1).
10 of 12 Electronic paper
www.occenvmed.com
on April 8, 2022 by guest. P
rotected by copyright.http://oem
.bmj.com
/O
ccup Environ M
ed: first published as 10.1136/oem.2003.007088 on 18 M
arch 2004. Dow
nloaded from
regarding the relation between study size and validity havebeen developed in the context of clinical trials, and it may bethat for observational studies, a small study that charac-terises exposure and confounding factors well may be morevalid than a large one that does not13 or that the precision ofan effect estimate is determined by the variability inexposure, and this could plausibly be related to the reportedeffect size. In addition, asymmetry may also arise where anyprincipal cause of heterogeneity is distributed non-randomlyacross studies of different sizes. These include thoseconsidered here such as study population, setting, studydesign, and analysis.
In summary, this review of panel studies in children hasshown a small overall effect of particles, especially for PEFwhere the effects of PM2.5 appear to be greater than for PM10.However, there is evidence of considerable heterogeneityamong results and this prevents too much confidence beingplaced on the summary measures of effect. This may be areflection of factors such as susceptible sub-populations ordiffering analytical approaches, but it does have implicationswhen considering transferability of effect size or whenconsidering use of the summary estimates in quantitativerisk assessment. There is a suggestion that the effects ofparticles are greater when ozone levels are higher, similar tothe finding in some studies for hospital admissions.48
However, this finding could be due to confounding, eitherin the selection of studies or because of inadequate allowancefor interaction between ozone and particle effects.Furthermore, there is evidence that could suggest publicationbias and the authors believe that the magnitude of particleeffects on children’s health at lower levels of morbidity andexposure remains to be clearly defined.
ACKNOWLEDGEMENTSDerek Ward was supported by a grant for a panel study of childrenfrom the Department of Health, UK. This paper arose as a result ofthat work.
Authors’ affiliations. . . . . . . . . . . . . . . . . . . . .
D J Ward, Public Health Network, South Worcestershire Primary CareTrust, Isaac Maddox House, Shrub Hill Road, Worcester WR4 9RW, UKJ G Ayres, Dept of Environmental and Occupational Medicine,University of Aberdeen, Foresterhill Road, Aberdeen AB25 2ZP, UK
REFERENCES1 Committee on the Medical Effects of Air Pollutants; Department of Health.
Non-biological particles and health. London: HMSO, 1995.2 Pope CAI, Dockery DW, Holgate ST, et al. Chapter 31. Epidemiology of
particle effects In: Air pollution and health. London: Academic Press,1999:673–706.
3 Roemer W, Hoek G, Brunekreef B, et al. Daily variations in air pollution andrespiratory health in a multicentre study: the PEACE project. Pollution Effectson Asthmatic Children in Europe. Eur Respir J 1998;12:1354–61.
4 Committee on the Medical Effects of Air Pollutants. Quantification of theeffects of air pollution on health in the United Kingdom. London: The StationeryOffice, 1998.
5 Brunekreef B, Hoek G, Roemer W, et al. Panel studies for investigating theacute health effects of air pollution. Eur Respir Rev 1998;8:131–4.
6 Pope CAI, Schwartz J. Time series for the analysis of pulmonary health data.Am J Respir Crit Care Med 1996;154(6 part 2):s229–s233.
7 Navidi W, Thomas D, Langholz B, et al. Statistical methods forepidemiological studies of the health effects of air pollution, Research ReportNumber 86. Cambridge, MA: Health Effects Institute, 1999.
8 Tager IB. Current view of epidemiological study designs for occupationaland environmental lung diseases. Environ Health Perspec2000;108(suppl 4):615–23.
9 Schwartz J, Wypij D, Dockery D, et al. Daily diaries of respiratory symptomsand air pollution: methodological issues and results. Environ Health Perspec1991;90:181–7.
10 Committee on the Medical Effects of Air Pollutants, Department of Health.Chapter 6. Panel and event studies. Asthma and outdoor air pollution.London: HMSO, 1995.
11 Whittemore AS, Korn EL. Asthma and air pollution in the Los Angeles area.Am J Public Health 1980;70:687–96.
12 Schwartz J, Spix C, Touloumi G, et al. Methodological issues in studies of airpollution and daily counts of deaths or hospital admissions. J EpidemiolCommunity Health 1996;50(suppl 1):s3–s11.
13 Egger M, Davey Smith G, Schneider M, et al. Chapter 12. Systematic reviewsof observational studies. In: Systematic reviews in health care: meta-analysisin context, 2nd edn. London: BMJ Publishing Group, 2001:211–27.
14 Greenland S, Rothman KJ, Greenland S, eds. Chapter 32. Meta-analysis. In:Modern epidemiology, 2nd edn. Philadelphia, USA: Lippincott-Raven,1998:643–73.
15 Sutton AJ, Abrams KR, Jones DR, et al. Systematic reviews of trials and otherstudies. Heath Technology Assessment 1998;2:(19).
16 Sterne JAC, Egger M, Davey Smith G, et al. Chapter 11. Investigating anddealing with publication and other biases. Systematic reviews in health care:meta-analysis in context, 2nd edn. London: BMJ Publishing Group,2001:189–210.
17 NHS Centre for Reviews and Dissemination. Undertaking systematic reviewsof research on effectiveness. CRD Report Number 4. York: University of York,1996.
18 Deeks JJ, Altman DG, Bradburn MJ, et al. Chapter 15. Statistical methods forexamining heterogeneity and combining results from several studies in meta-analysis. Systematic reviews in health care: meta-analysis in context, 2nd edn.London: BMJ Publishing Group, 2001:285–312.
19 Gielen MH, Van der Zee SC, van Wijnen JH, et al. Acute effects of summer airpollution on respiratory health of asthmatic children. Am J Respir Crit CareMed 1997;155:2105–8.
20 Neas LM, Dockery DW, Koutrakis P, et al. The association of ambient airpollution with twice daily peak expiratory flow rate measurements in children.Am J Epidemiol 1995;141:111–22.
21 Neas LM, Dockery DW, Burge H, et al. Fungus spores, air pollutants, andother determinants of peak expiratory flow rate in children. Am J Epidemiol1996;143:797–807.
22 Neas LM, Dockery DW, Koutrakis P, et al. Fine particles and peak flow inchildren: acidity versus mass. Epidemiology 1999;10:550–3.
23 Scarlett JF, Abbott KJ, Peacock JL, et al. Acute effects of summer air pollutionon respiratory function in primary school children in southern England. Thorax1996;51:1109–14.
24 Schwartz J, Neas LM. Fine particles are more strongly associated than coarseparticles with acute respiratory health effects in schoolchildren. Epidemiology2000;11:6–10.
25 Boezen HM, Van der Zee SC, Postma DS, et al. Effects of ambient air pollutionon upper and lower respiratory symptoms and peak expiratory flow inchildren. Lancet 1999;353:874–8.
26 Hoek G, Brunekreef B. Effects of low-level winter air pollution concentrationson respiratory health of Dutch children. Environ Res 1994;64:136–50.
27 Peters A, Goldstein IF, Beyer U, et al. Acute health effects of exposure to highlevels of air pollution in eastern Europe. Am J Epidemiol 1996;144:570–81.
28 Roemer W, Hoek G, Brunekreef B. Effect of ambient winter air pollution onrespiratory health of children with chronic respiratory symptoms. Am RevRespir Dis 1993;147:118–24.
29 Pope CA, Dockery DW, Spengler JD, et al. Respiratory health and PM10pollution. A daily time series analysis. Am Rev Respir Dis 1991;144:668–74.
30 Pope CA, Dockery DW. Acute health effects of PM10 pollution onsymptomatic and asymptomatic children. Am Rev Respir Dis1992;145:1123–8.
31 Segala C, Fauroux B, Just J, et al. Short-term effect of winter air pollution onrespiratory health of asthmatic children in Paris. Eur Respir J1998;11:677–85.
32 Vedal S, Petkau J, White R, et al. Acute effects of ambient inhalable particlesin asthmatic and nonasthmatic children. Am J Respir Crit Care Med1998;157:1034–43.
33 Vichit-Vadakan N, Ostro BD, Chestnut LG, et al. Air pollution and respiratorysymptoms: results from three panel studies in Bangkok, Thailand. EnvironHealth Perspec 2001;109(suppl 3):381–7.
34 Delfino RJ, Zeiger RS, Seltzer JM, et al. Symptoms in pediatric asthmatics andair pollution: differences in effects by symptom severity, anti-inflammatorymedication use and particulate averaging time. Environ Health Perspec1998;106:751–61.
35 Gold DR, Damokosh AI, Pope CA, et al. Particulate and ozone pollutant effectson the respiratory function of children in southwest Mexico City. Epidemiology1999;10:8–16.
36 Jalaludin BB, Chey T, O’Toole BI, et al. Acute effects of low levels of ambientozone on peak expiratory flow rate in a cohort of Australian children.Int J Epidemiol 2000;29:549–57.
37 Ostro B, Lipsett M, Mann J, et al. Air pollution and exacerbation of asthma inAfrican-American children in Los Angeles. Epidemiology 2001;12:200–8.
38 Schwartz J, Dockery DW, Neas LM, et al. Acute effects of summer airpollution on respiratory symptom reporting in children. Am J Respir Crit CareMed 1994;150:1234–42.
39 Ward DJ, Roberts KT, Jones N, et al. Effects of daily variation in outdoorparticulates and ambient acid species in normal and asthmatic children.Thorax 2002;57:489–502.
40 Romieu I, Meneses F, Ruiz S, et al. Effects of air pollution on the respiratoryhealth of asthmatic children living in Mexico City. Am J Respir Crit Care Med1996;154:300–7.
41 Peters A, Wichmann HE, Tuch T, et al. Respiratory effects are associated withthe number of ultrafine particles. Am J Respir Crit Care Med1997;155:1376–83.
42 Roemer W, Hoek G, Brunekreef B, et al. PM10 elemental composition andacute respiratory health effects in European children (PEACE project). PollutionEffects on Asthmatic Children in Europe. Eur Respir J 2000;15:553–9.
Electronic paper 11 of 12
www.occenvmed.com
on April 8, 2022 by guest. P
rotected by copyright.http://oem
.bmj.com
/O
ccup Environ M
ed: first published as 10.1136/oem.2003.007088 on 18 M
arch 2004. Dow
nloaded from

43 Van der Zee SC, Hoek G, Boezen HM, et al. Acute effects of urban airpollution on respiratory health of children with and without chronic respiratorysymptoms. Occup Environ Med 1999;56:802–13.
44 Peters A, Dockery DW, Heinrich J, et al. Medication use modifies the healtheffects of particulate sulfate air pollution in children with asthma. EnvironHealth Perspec 1997;105:430–5.
45 Roemer W, Clench-Aas J, Englert N, et al. Inhomogeneity in response to airpollution in European children (PEACE project). Occup Environ Med1999;56:86–92.
46 Hoek G, Dockery DW, Pope CA, et al. Association between PM10 anddecrements in peak expiratory flow rates in children: reanalysis of data fromfive panel studies. Eur Respir J 1998;11:1307–11.
47 Dockery DW, Pope CAI. Acute respiratory effects of particulate air pollution.Ann Rev Public Health 1994;15:107–32.
48 Atkinson RW, Anderson HR, Sunyer J, et al. Acute effects of particulate airpollution on respiratory admissions. Am J Respir Crit Care Med2001;164:1860–6.
49 Peters A, Dockery DW, Heinrich J, et al. Short-term effects of particulate airpollution on respiratory morbidity in asthmatic children. Eur Respir J1997;10:872–9.
50 Jalaludin BB, Smith M, O’Toole BI, et al. Acute effects of bushfires on peakexpiratory flow rates in children with wheeze: a time series analysis.Aust N Z J Public Health 2000;24:174–7.
51 Roemer W, Hoek G, Brunekreef B, et al. Effects of short-term changes in urbanair pollution on the respiratory health of children with chronic respiratorysymptoms: the PEACE project: Introduction. Eur Respir Rev 1998;8:4–11.
52 Roemer W, Hoek G, Brunekreef B, et al. The PEACE project: generaldiscussion. Eur Respir Rev 1998;8:125–30.
12 of 12 Electronic paper
www.occenvmed.com
on April 8, 2022 by guest. P
rotected by copyright.http://oem
.bmj.com
/O
ccup Environ M
ed: first published as 10.1136/oem.2003.007088 on 18 M
arch 2004. Dow
nloaded from