Embed Size (px)
Citation preview
1
Electronic Supplementary Information (ESI)
An Aggregation-Induced Emission Luminophore with
Multi-stimuli Single- and Two-Photon Fluorescence
Switching and Large Two-Photon Absorption Cross Section
Bingjia Xu, Mingyuan, Xie, Jiajun He, Bin Xu, Zhenguo Chi,* Wenjing Tian, Long
Jiang, Fuli Zhao,* Siwei Liu, Yi Zhang, Zhizhan Xu, and Jiarui Xu
Experimental section
Materials and Measurements
1-Bromo-1,2,2-triphenylethene, 4-formylphenylboronic acid, tetrabutyl ammonium bromide
(TBAB), and 2-(4-methoxyphenyl)acetonitrile purchased from Alfa Aesar were used as
received. All reagents and chemicals purchased from Alfa Aesar were used as received.
Tetrahydrofuran (THF) was distilled from sodium/benzophenone. Ultra-pure water was used
in the experiments. All other solvents were purchased as analytical grade from Guangzhou
Dongzheng Company and used without further purification.
1H NMR and 13C NMR were measured on a Mercury-Plus 300 spectrometer with chemical
shifts reported as ppm (in CDCl3, TMS as internal standard). Mass spectra were measured
with Thermo spectrometers (DSQ). Elemental analyses (EA) were performed with an
Elementar Vario EL elemental analyzer. FT-IR spectra were obtained on a Nicolet NEXUS
670 spectrometer (KBr pellet).
UV-visible absorption spectra (UV) were determined on a Hitachi U-3900
spectrophotometer. Fluorescence spectra (PL) were measured on a Shimadzu RF-5301PC
spectrometer with a slit width of 3 nm for excitation and 3 nm for emission. Solid state PL
efficiencies were measured with an integrating sphere (Labsphere Inc.), with a 405 nm light as
Electronic Supplementary Material (ESI) for Chemical CommunicationsThis journal is © The Royal Society of Chemistry 2012
2
the excitation source and the laser was introduced into the sphere through the optical fiber.
Thermal behaviors were determined by differential scanning calorimetry (DSC) at heating and
cooling rate of 10 °C/min under N2 atmosphere using a NETZSCH thermal analyzer (DSC 204
F1). Time-resolved emission decay behaviors were measured on an Endinburgh Instruments
Ltd spectrometer (FLSP920). Wide-angle X-ray diffraction (WAXD) measurements were
performed by using a Bruker X-ray diffractometer (D8 ADVANCE, Germany) with an X-ray
source of Cu Kα (λ= 0.15406 nm) at 40 kV and 40 mA, at a scan rate of 4° (2θ) per 1min.
Ground samples were prepared by grinding using a mortar and pestle. Annealing experiments
were done on a hot-stage with automatic temperature control system. The water/THF mixtures
with different water fractions were prepared by slowly adding distilled water into the THF
solution of samples under ultrasound at room temperature. Scanning Electron Microscopy
(SEM) images were obtained on a HITACHI S4800 microscope operated at 15 kV
The two photon absorption experiments were demonstrated with a regenerative Ti: Sapphire
amplifier system (spectra Physics Hurricane) with a central wavelengths of 740 nm, pulse
duration of 125 fs and repetition rate of 1 kHz. The transmitted light was focused into a
synchroscan streak camera (Hamamatsu Model C1587) connected to a spectroscope.
The TPA cross section (σ) of ENPOMe was measured by the femtosecond open-aperture
Z-scan technique according to a previously described method.1 Figure S4 shows that the TPA
coefficient (β) was obtained by data fitting, and the related equation is given as follows: 2 2
0 03/ 2
0
[ ( ) /(1 / )]( , 1)
( 1)
meff
m
I t L z zT z S
mβ∞
=
+= =
+∑
where z is the distance between the sample and the focus; zo = kw02/2 is the diffraction
length of the beam; k = 2π/λ is the wave vector; λ is the laser wavelength; Leff = (1 - e-αL)/α,
where L is the sample length and α is the linear absorption coefficient; I0 ( t ) is the laser beam
irradiance within the sample; S = 1 - exp(-2ra2/wa
2) is the aperture linear transmittance, with
wa denoting the beam radius at the aperture in the linear regime and β is the nonlinear
absorption coefficient.2 The TPA cross section can be calculated using the equation
σ=hνβ/NAC, in which NA represents the Avogadro constant and C is the molar concentration of
the solute.
Single crystals of the compound were grown from acetonitrile/methanol mixtures. X-ray
Electronic Supplementary Material (ESI) for Chemical CommunicationsThis journal is © The Royal Society of Chemistry 2012
3
crystallographic intensity data were collected at 110 K using a Bruker Smart 1000 CCD
diffractometer equipped with graphite monochromated Enhance (Mo) X-ray source (λ =
0.71073 Å). The structures were solved by the direct methods following difference Fourier
syntheses, and refined by the full-matrix least-squares method against F02 using SHELXTL
software.3 Crystallographic data for the structure(s) reported in this paper have been deposited
with the Cambridge Crystallographic Data Centre as supplementary publication no. CCDC-
898288.
Synthesis
Br
B OHHO
HOO
Pd(PPh3)4 , K2CO3 (2M)TBAB, Toluene, 90oC
P4A
OC
CH3
N
Ethanol, N(n-Bu)4OH (0.8M)reflux
CO
CH3
N
ENPOMe
Scheme S1 The synthesis routes of the desired compounds.
Synthesis of P4A
The compound of P4A was synthesized as the literature method.4
Synthesis of ENPOMe
A solution of P4A (1.00 g, 2.77 mmol) and 2-(4-methoxyphenyl)acetonitrile (0.45 g, 3.05 mmol)
in ethanol (30 mL) was stirred at room temperature. Then terabutyl ammonium hydroxide solution
(0.8 M, 5 drops) was added and the mixture was heated to reflux for 2 hours precipitating a light
green solid. The reaction mixture was cooled to room temperature and filtered, washed with
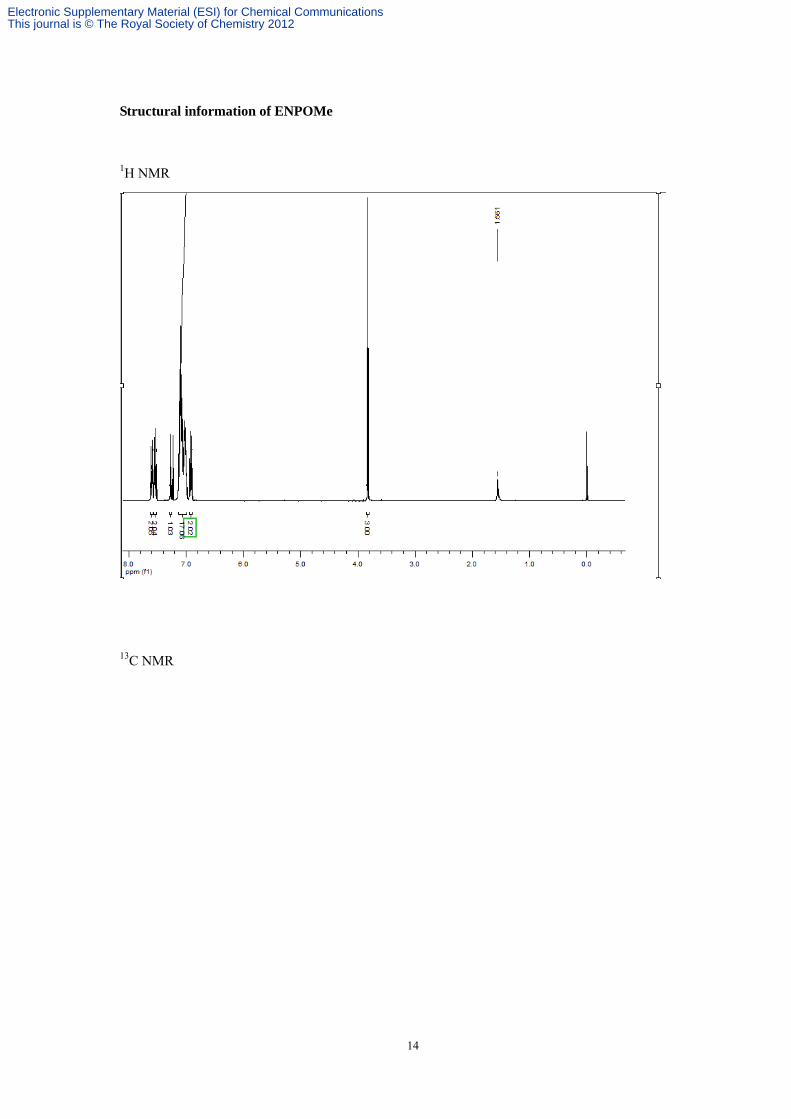
ethanol for several times obtaining a light green powder. Yield: 89% (1.21 g). 1H NMR (300 MHz,
CDCl3) δ(ppm): 7.63—7.58 (d, 2 H); 7.57—7.51 (d, 2 H); 7.29—7.26 (s, 1 H); 7.14—6.99 (m,
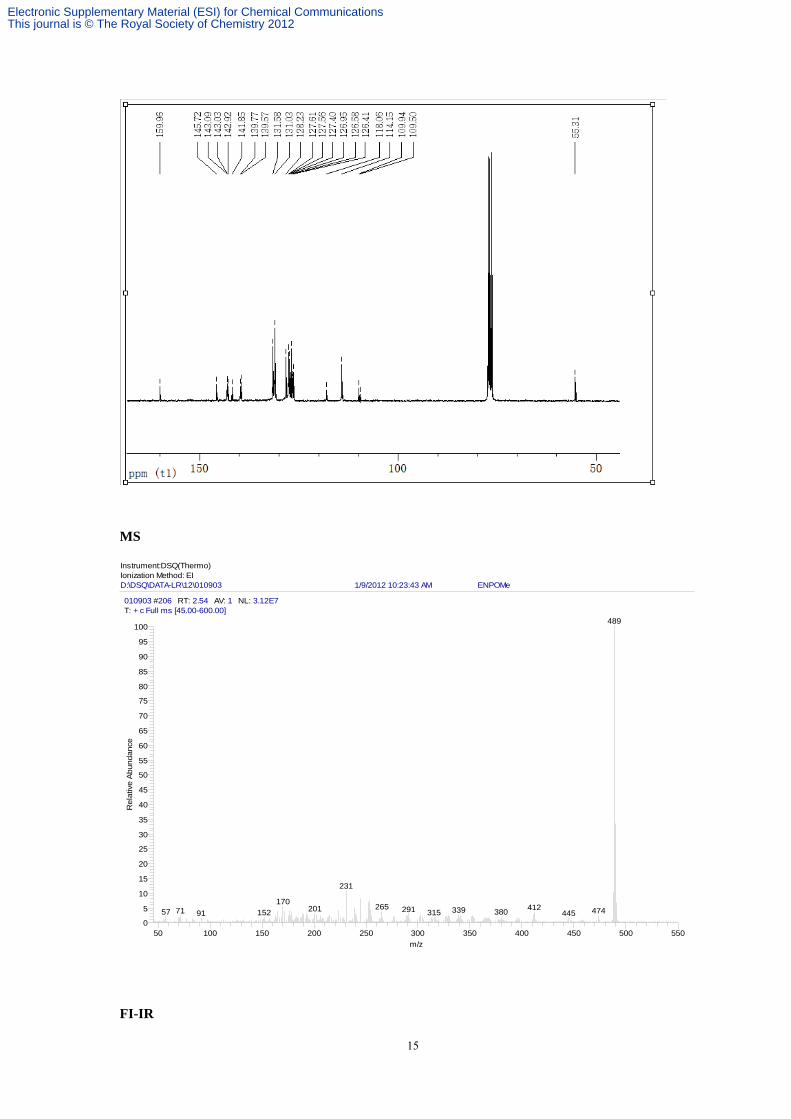
17 H); 6.95—6.89 (d, 2 H); 3.85—3.81 (s, 3 H). 13C NMR (75MHz, CDCl3) δ(ppm): 159.96,
145.72, 143.09, 143.03, 142.92, 141.85, 139.77, 139.57, 131.59, 131.02, 128.23, 127.61, 127.56,
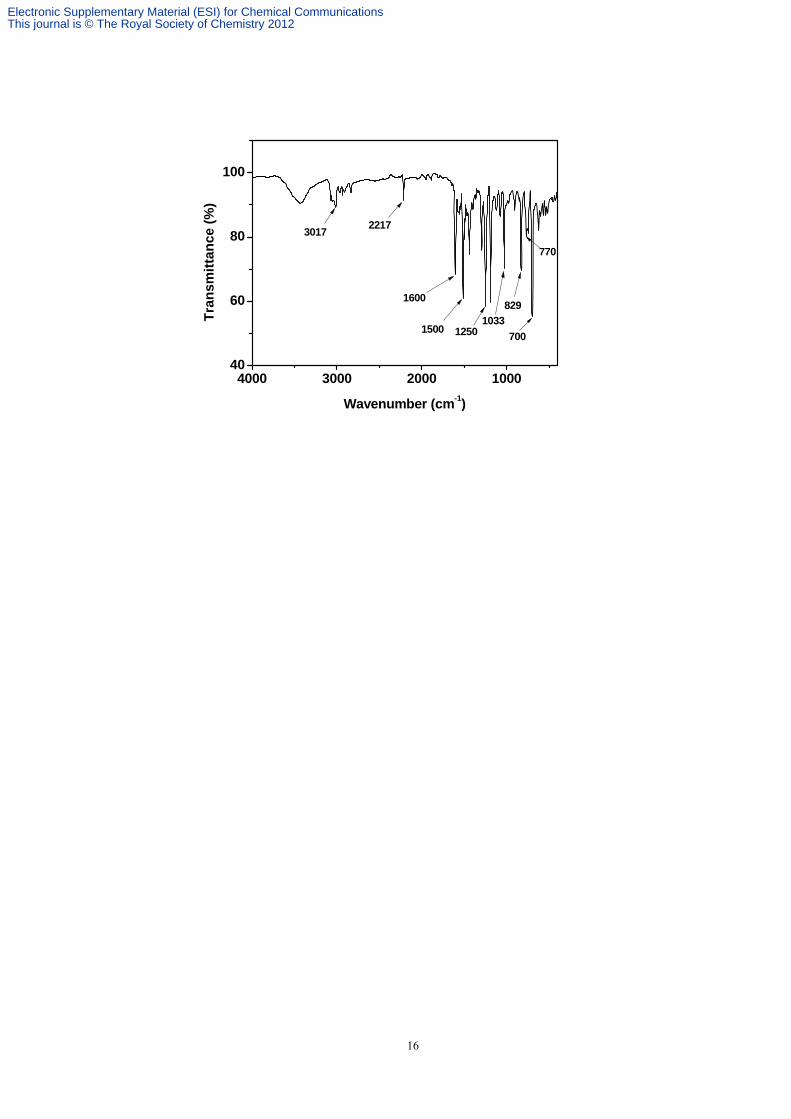
127.40, 126.95, 126.58, 126.41, 118.06, 114.15, 109.94, 109.50, 55.31. FT-IR (KBr) υ (cm-1):
3017, 2217, 1600, 1500, 1250, 1033, 829, 770, 700. EI-MS, m/z: [M]+ 489 , calcd for C36H27NO
489. Anal. calcd for C36H27NO: C 88.31, H 5.56, N 2.86, O 3.27; found: C 88.25, H 5.61, N 2.83,
Electronic Supplementary Material (ESI) for Chemical CommunicationsThis journal is © The Royal Society of Chemistry 2012
4
O 3.30.
References
1 B. Z. Tang, Y. H. Geng, J. W. Y. Lam, B. S. Li, X. B. Jing, X. H. Wang, F. S. Wang, A. B.
Pakhomov and X. X. Zhang, Chem. Mater., 1999, 11, 1581.
2 Q. Q. Li, S. S. Yu, Z. Li and J. G. Qin, J. Phys. Org. Chem., 2009, 22, 241.
3 Sheldrick, G. M. SHELX-97: Program for crystal structure solution and refinement, University
of Götingen, Götingen, Germany, 1997.
4 X. Q. Zhang, Z. G. Chi, H. Y. Li, B. J. Xu, X. F. Li, W. Zhou, S. W. Liu, Y. Zhang, J. R. Xu,
Chem.- Asian J. 2011, 6, 808.
Electronic Supplementary Material (ESI) for Chemical CommunicationsThis journal is © The Royal Society of Chemistry 2012
5
Figures and tables
350 450 550 6500
100
200
300
400 Water fraction (%)
Inte
nsity
(a.u
.)
Wavelength (nm)
0 10 20 30 40 50 60 70 80 90 98
0 20 40 60 80 1000
100
200
300
400
Inte
nsity
(a.u
.)
Water fraction (v%)
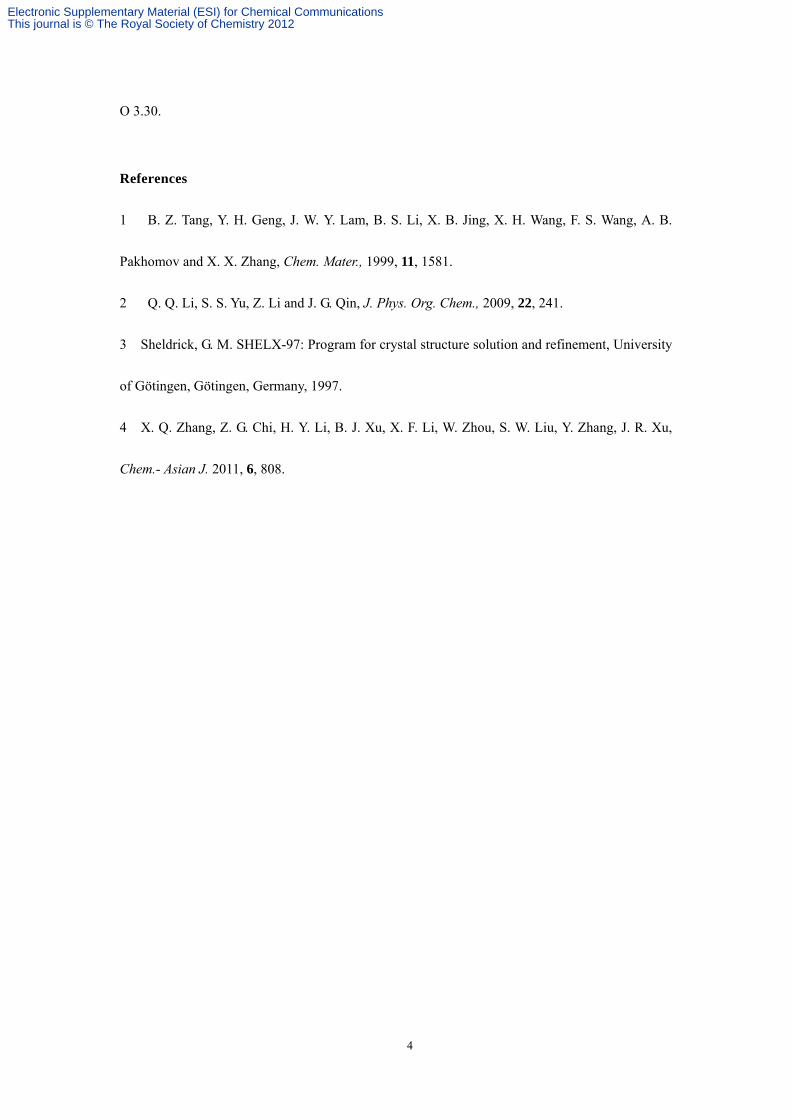
Figure S1. PL spectra of the dilute solutions of ENPOMe in water/THF mixtures with different
water fractions (concentration: 10 μM, excitation wavelength: 370 nm). The inset depicts changes
in PL peak intensity (up) and emission images of the compound in pure THF and 98% water
fraction mixtures under 365 nm UV illumination (10 μM) (down).
350 450 550 650 750
0.0
0.2
0.4
0.6
0.8
1.0
Water fraction (%)
Inte
nsity
(a.u
.)
Wavelength (nm)
0 70 80 90 98
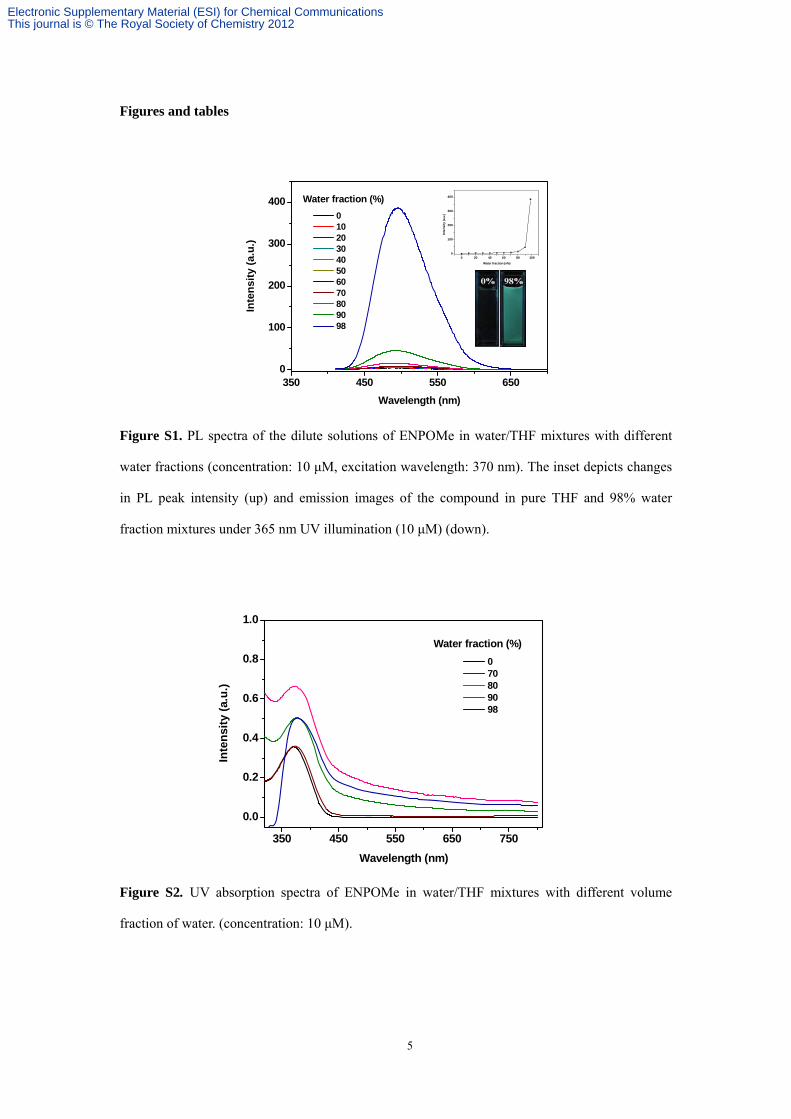
Figure S2. UV absorption spectra of ENPOMe in water/THF mixtures with different volume
fraction of water. (concentration: 10 μM).
Electronic Supplementary Material (ESI) for Chemical CommunicationsThis journal is © The Royal Society of Chemistry 2012
6
400 500 600 700 800
0
1000
2000
3000
4000
-0.2 -0.1 0.0 0.1 0.2 0.3 0.4-0.6
-0.4
-0.2
0.0
0.2
0.4
0.6
Log (P)
Log
(I)
ENOPMe Powder Linear Fit of the Sample
Y = 2.0292X - 0.1948
Inte
nsity
(a.u
.)
Wavelength (nm)
P
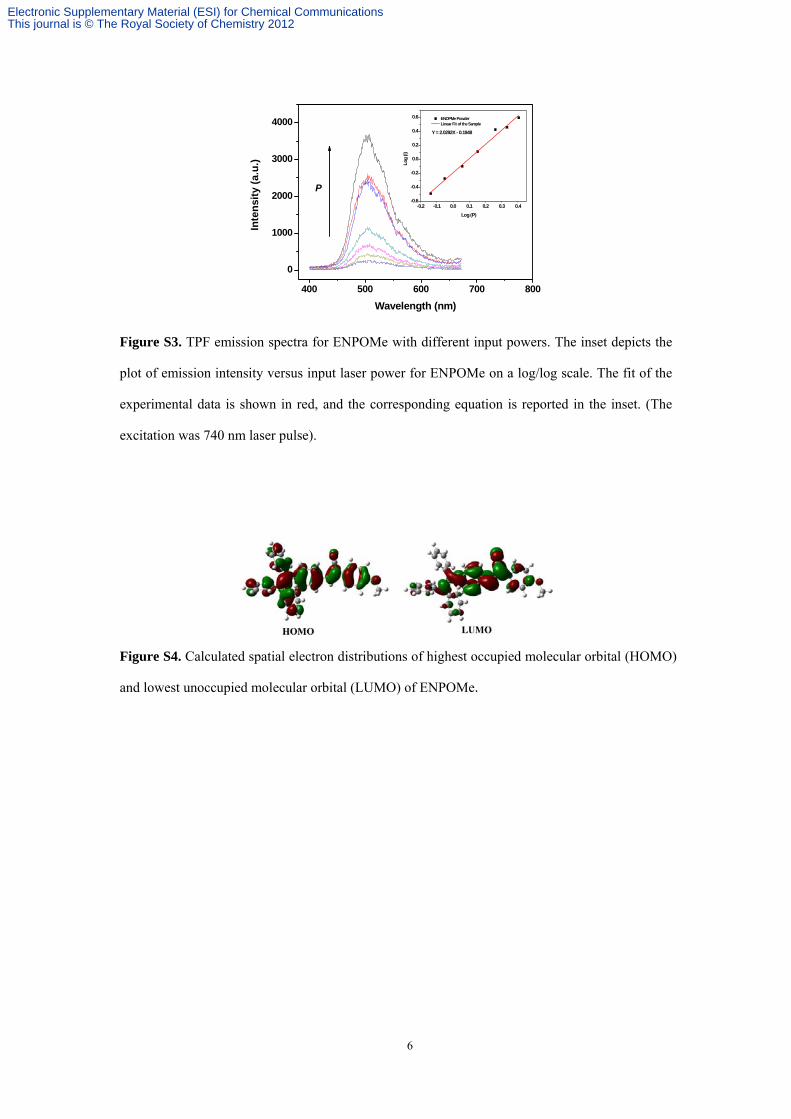
Figure S3. TPF emission spectra for ENPOMe with different input powers. The inset depicts the
plot of emission intensity versus input laser power for ENPOMe on a log/log scale. The fit of the
experimental data is shown in red, and the corresponding equation is reported in the inset. (The
excitation was 740 nm laser pulse).
Figure S4. Calculated spatial electron distributions of highest occupied molecular orbital (HOMO)
and lowest unoccupied molecular orbital (LUMO) of ENPOMe.
Electronic Supplementary Material (ESI) for Chemical CommunicationsThis journal is © The Royal Society of Chemistry 2012
7
450 550 650 7500
100
200
300
400
500
600
700
Water fraction (%)
Inte
nsity
(a.u
.)
Wavelength (nm)
0 70 80 90 98 0 20 40 60 80 100
0
100
200
300
400
500
600
700
Inte
nsity
(a.u
.)
Water fraction (v%)
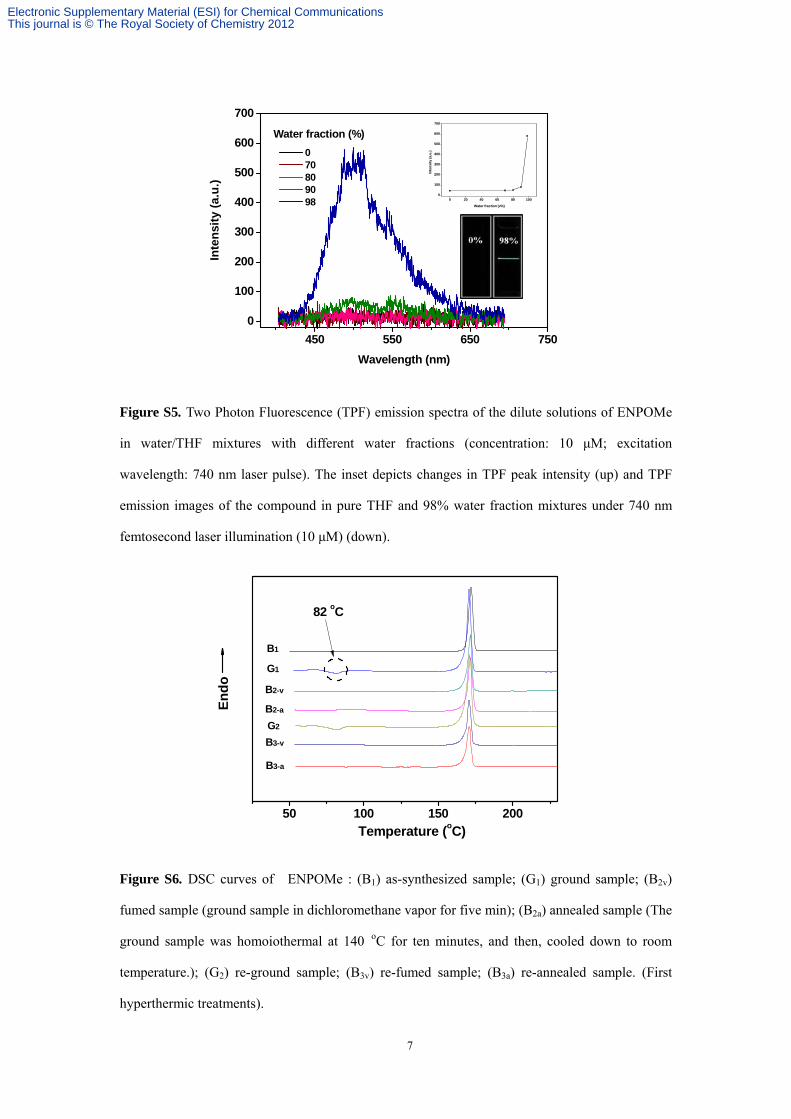
Figure S5. Two Photon Fluorescence (TPF) emission spectra of the dilute solutions of ENPOMe
in water/THF mixtures with different water fractions (concentration: 10 μM; excitation
wavelength: 740 nm laser pulse). The inset depicts changes in TPF peak intensity (up) and TPF
emission images of the compound in pure THF and 98% water fraction mixtures under 740 nm
femtosecond laser illumination (10 μM) (down).
50 100 150 200
Temperature (oC)
Endo
B3-a
B3-v
G2
B2-a
B2-v
G1
B1
82 oC
Figure S6. DSC curves of ENPOMe : (B1) as-synthesized sample; (G1) ground sample; (B2v)
fumed sample (ground sample in dichloromethane vapor for five min); (B2a) annealed sample (The
ground sample was homoiothermal at 140 oC for ten minutes, and then, cooled down to room
temperature.); (G2) re-ground sample; (B3v) re-fumed sample; (B3a) re-annealed sample. (First
hyperthermic treatments).
Electronic Supplementary Material (ESI) for Chemical CommunicationsThis journal is © The Royal Society of Chemistry 2012
8
0 10 20 30
Time (ns)
PL in
sten
sity
(a.u
.)
As-synthesized sample Ground sample
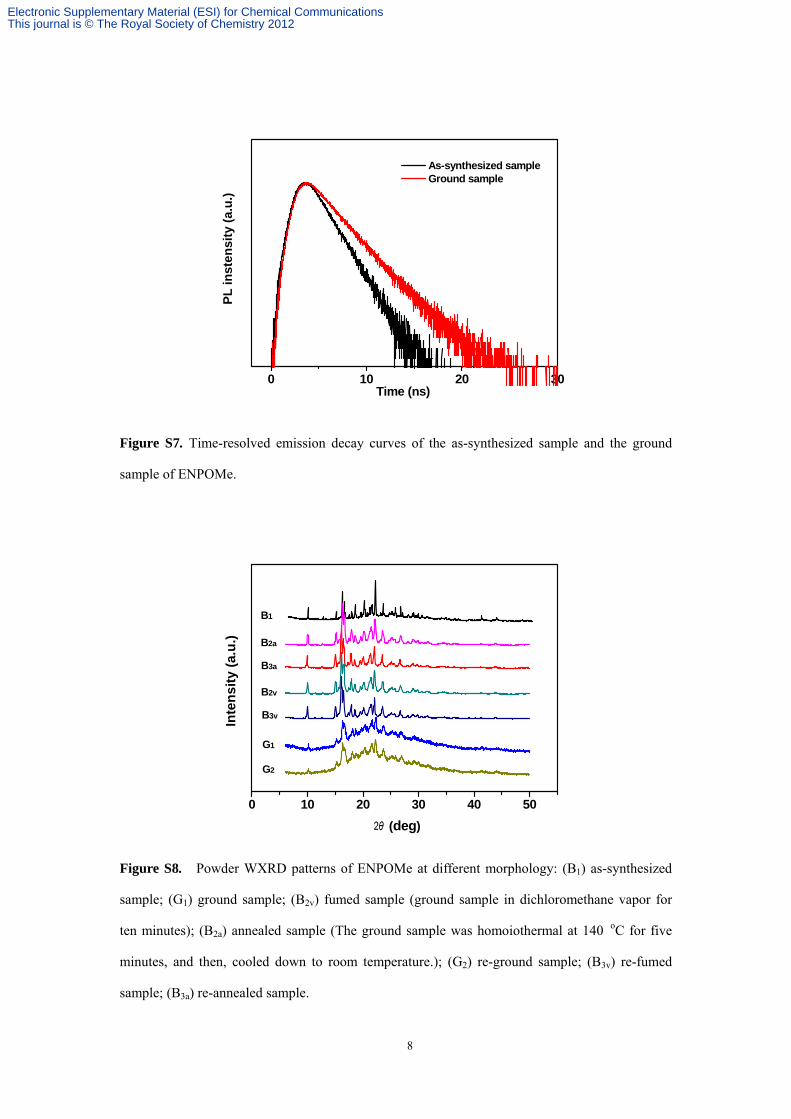
Figure S7. Time-resolved emission decay curves of the as-synthesized sample and the ground
sample of ENPOMe.
0 10 20 30 40 50
Inte
nsity
(a.u
.)
(deg)
G2
G1
B3v
B2v
B3a
B2a
B1
Figure S8. Powder WXRD patterns of ENPOMe at different morphology: (B1) as-synthesized
sample; (G1) ground sample; (B2v) fumed sample (ground sample in dichloromethane vapor for
ten minutes); (B2a) annealed sample (The ground sample was homoiothermal at 140 oC for five
minutes, and then, cooled down to room temperature.); (G2) re-ground sample; (B3v) re-fumed
sample; (B3a) re-annealed sample.
Electronic Supplementary Material (ESI) for Chemical CommunicationsThis journal is © The Royal Society of Chemistry 2012
9
350 400 450 500 550 600 650 700 750 800
0.0
0.2
0.4
0.6
0.8
1.0
Wavelength (nm)
I/I0
As-synthesis sample-370 nm As-synthesis sample-740 nm Ground sample-370 nm Ground sample-740 nm
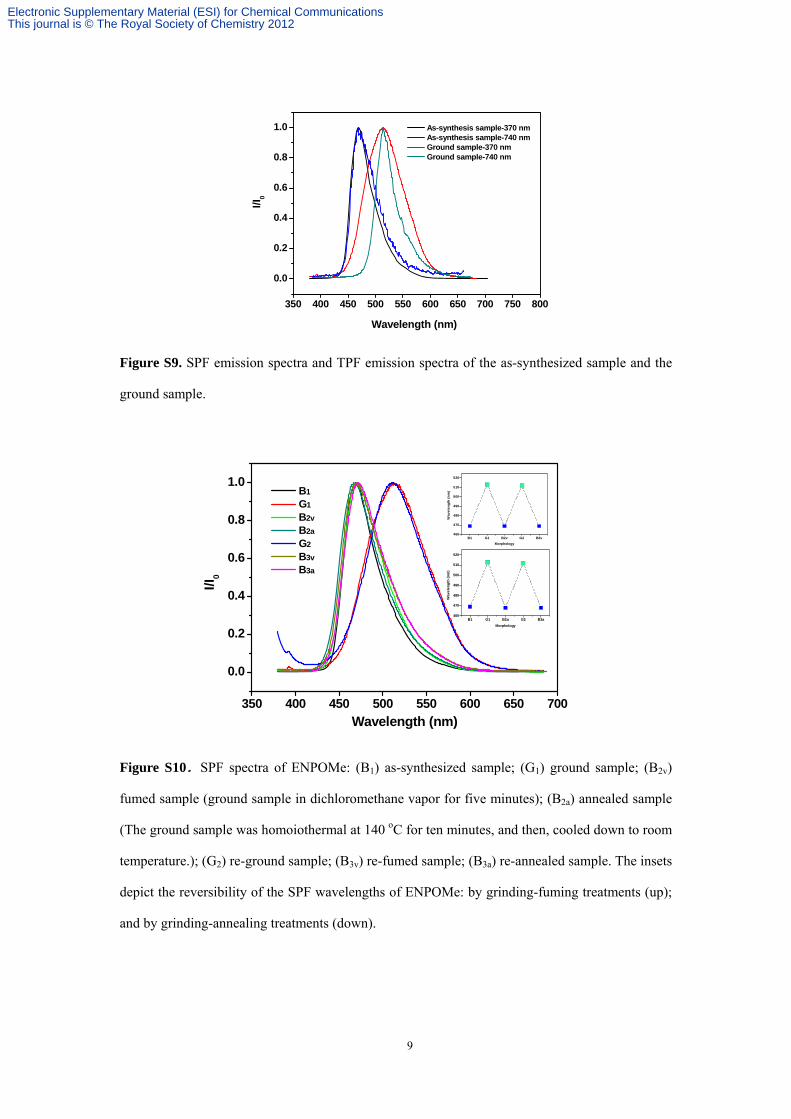
Figure S9. SPF emission spectra and TPF emission spectra of the as-synthesized sample and the
ground sample.
350 400 450 500 550 600 650 700
0.0
0.2
0.4
0.6
0.8
1.0
B1 G1 B2a G2 B3a460
470
480
490
500
510
520
Wav
elen
gth
(nm
)
Morphology
B1 G1 B2v G2 B3v460
470
480
490
500
510
520
Wav
elen
gth
(nm
)
Morphology
Wavelength (nm)
I/I0
B1 G1 B2v B2a G2 B3v B3a
Figure S10.SPF spectra of ENPOMe: (B1) as-synthesized sample; (G1) ground sample; (B2v)
fumed sample (ground sample in dichloromethane vapor for five minutes); (B2a) annealed sample
(The ground sample was homoiothermal at 140 oC for ten minutes, and then, cooled down to room
temperature.); (G2) re-ground sample; (B3v) re-fumed sample; (B3a) re-annealed sample. The insets
depict the reversibility of the SPF wavelengths of ENPOMe: by grinding-fuming treatments (up);
and by grinding-annealing treatments (down).
Electronic Supplementary Material (ESI) for Chemical CommunicationsThis journal is © The Royal Society of Chemistry 2012
10
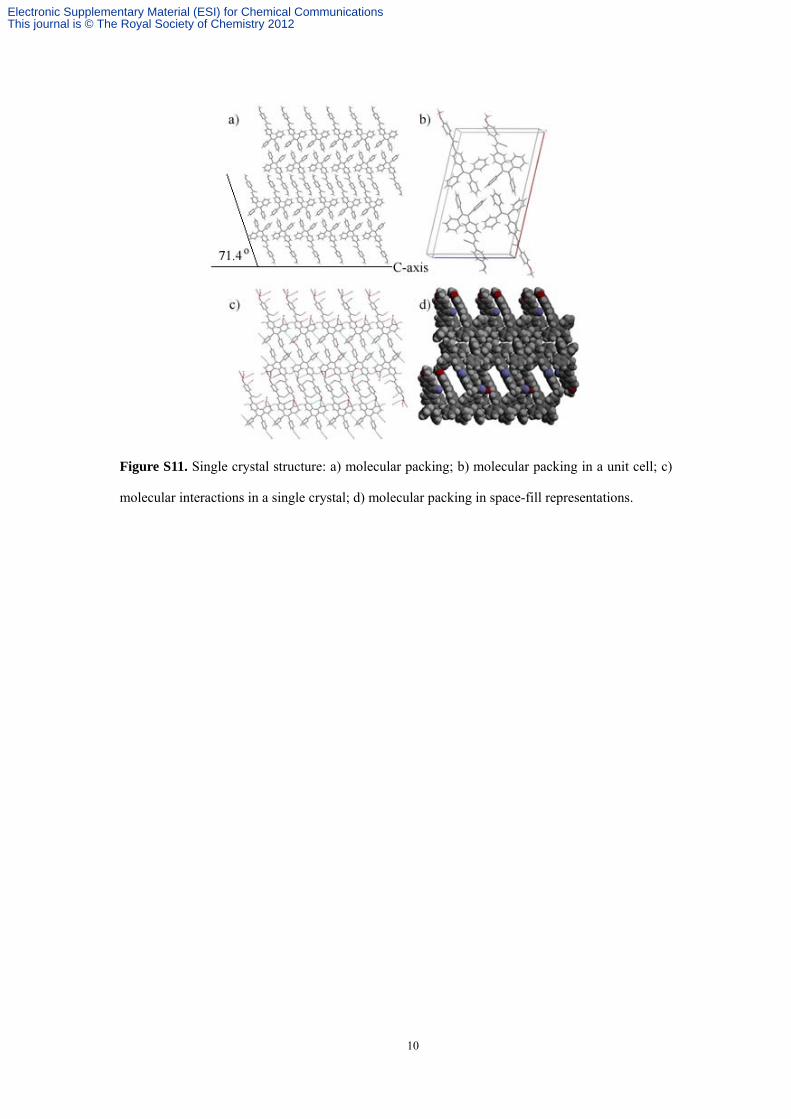
Figure S11. Single crystal structure: a) molecular packing; b) molecular packing in a unit cell; c)
molecular interactions in a single crystal; d) molecular packing in space-fill representations.
Electronic Supplementary Material (ESI) for Chemical CommunicationsThis journal is © The Royal Society of Chemistry 2012
11
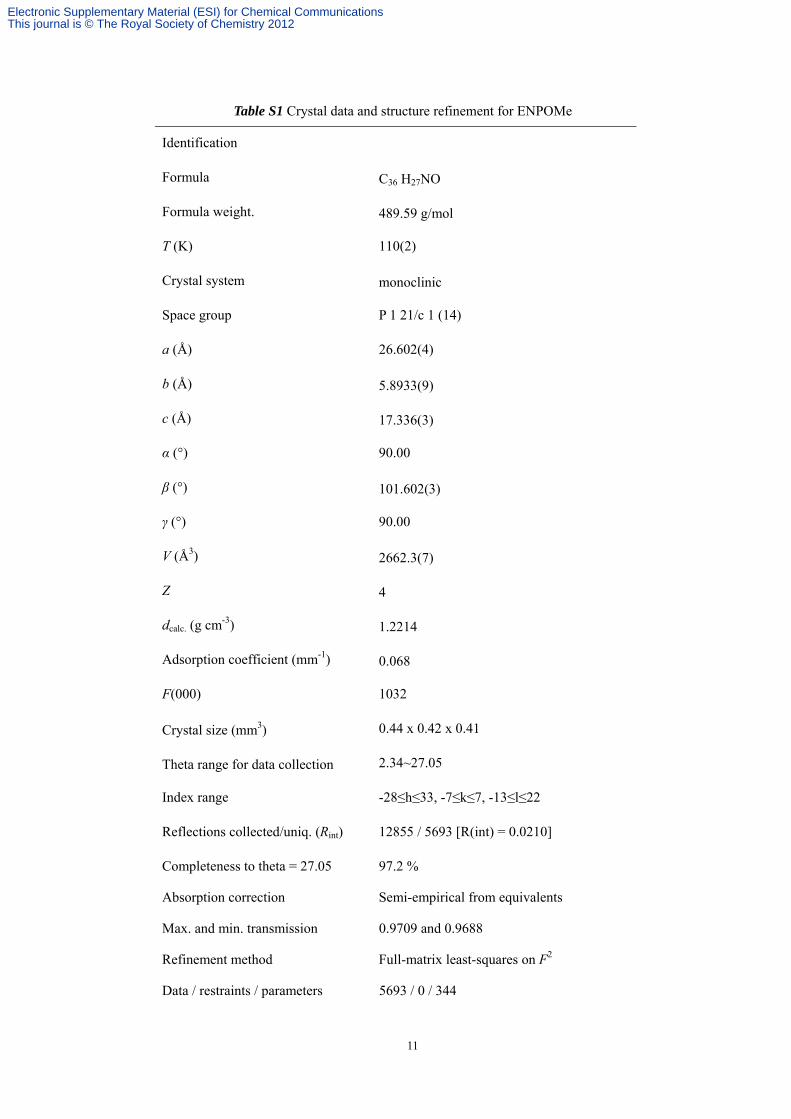
Table S1 Crystal data and structure refinement for ENPOMe
Identification
Formula C36 H27NO
Formula weight. 489.59 g/mol
T (K) 110(2)
Crystal system monoclinic
Space group P 1 21/c 1 (14)
a (Å) 26.602(4)
b (Å) 5.8933(9)
c (Å) 17.336(3)
α (°) 90.00
β (°) 101.602(3)
γ (°) 90.00
V (Å3) 2662.3(7)
Z 4
dcalc. (g cm-3) 1.2214
Adsorption coefficient (mm-1) 0.068
F(000) 1032
Crystal size (mm3) 0.44 x 0.42 x 0.41
Theta range for data collection 2.34~27.05
Index range -28≤h≤33, -7≤k≤7, -13≤l≤22
Reflections collected/uniq. (Rint) 12855 / 5693 [R(int) = 0.0210]
Completeness to theta = 27.05 97.2 %
Absorption correction Semi-empirical from equivalents
Max. and min. transmission 0.9709 and 0.9688
Refinement method Full-matrix least-squares on F2
Data / restraints / parameters 5693 / 0 / 344
Electronic Supplementary Material (ESI) for Chemical CommunicationsThis journal is © The Royal Society of Chemistry 2012
12
R1 (wR2)a, [I > 2sigma(I)] R1 = 0.0384, wR2 = 0.0899
R1 (wR2)a, (all data) R1 = 0.0569, wR2 = 0.0999
Goodness-of-fit on F2 1.027
Largest diff. peak and hole (e·Å-3) 0.250 and -0.186
aR1 = Σ⎥⎥ Fo⎥–⎥ Fc⎥⎥/Σ⎥ Fo⎥. b wR2 = [Σ[w(Fo2–Fc
2)2]/Σw(Fo2)2]1/2.
A
B
C
D E
F
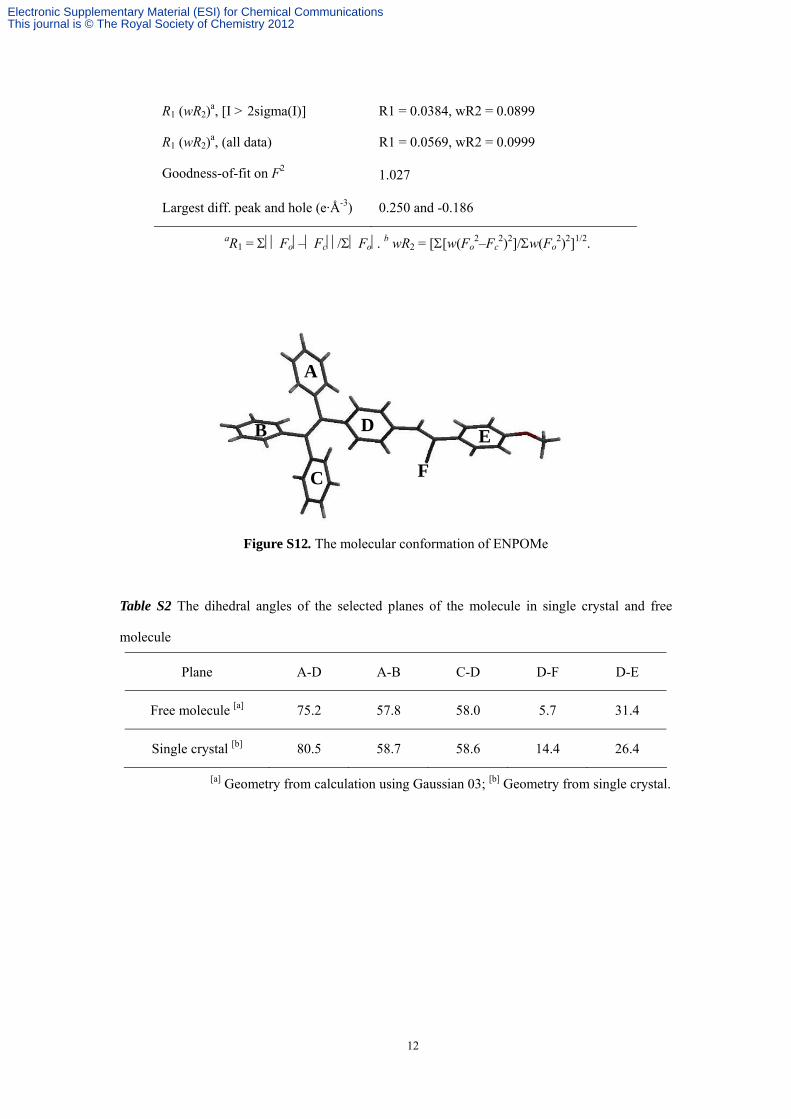
Figure S12. The molecular conformation of ENPOMe
Table S2 The dihedral angles of the selected planes of the molecule in single crystal and free
molecule
Plane A-D A-B C-D D-F D-E
Free molecule [a] 75.2 57.8 58.0 5.7 31.4
Single crystal [b] 80.5 58.7 58.6 14.4 26.4
[a] Geometry from calculation using Gaussian 03; [b] Geometry from single crystal.
Electronic Supplementary Material (ESI) for Chemical CommunicationsThis journal is © The Royal Society of Chemistry 2012
13
-15 -10 -5 0 5 10 15
0.94
0.95
0.96
0.97
0.98
0.99
1.00
Nor
mal
ized
Tra
nsm
itanc
e
Z(mm)
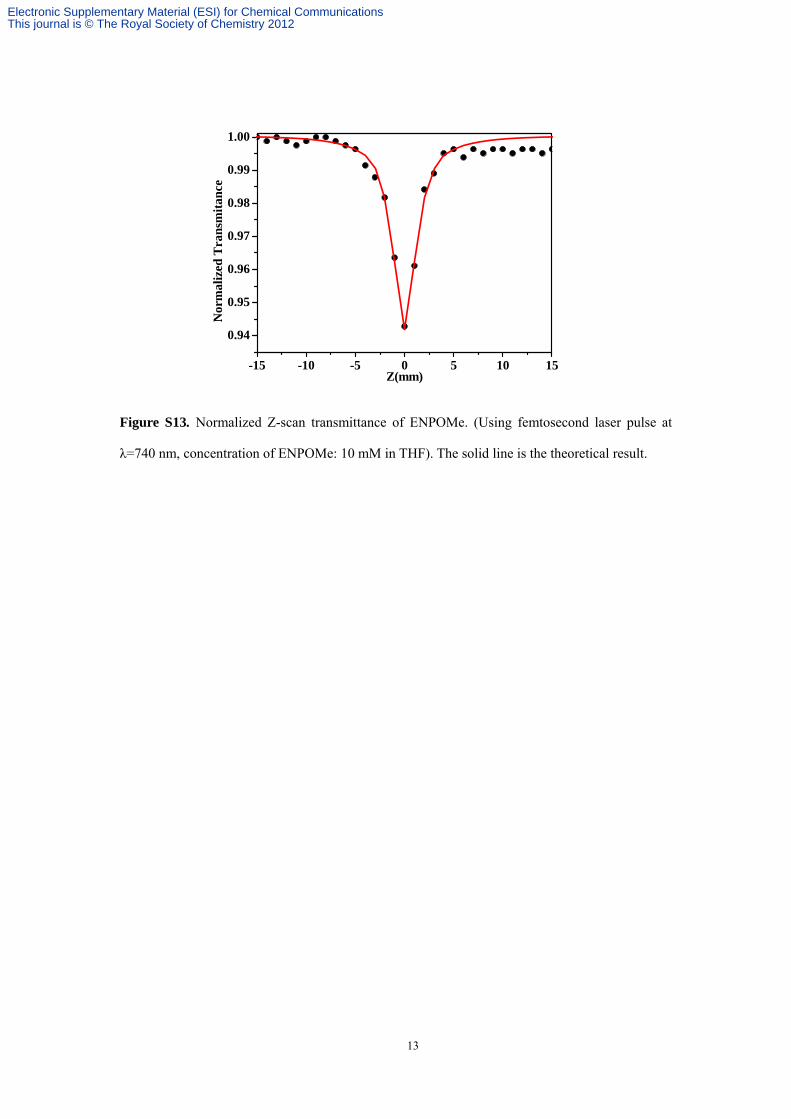
Figure S13. Normalized Z-scan transmittance of ENPOMe. (Using femtosecond laser pulse at
λ=740 nm, concentration of ENPOMe: 10 mM in THF). The solid line is the theoretical result.
Electronic Supplementary Material (ESI) for Chemical CommunicationsThis journal is © The Royal Society of Chemistry 2012
14
Structural information of ENPOMe
1H NMR
13C NMR
Electronic Supplementary Material (ESI) for Chemical CommunicationsThis journal is © The Royal Society of Chemistry 2012
15
MS
Instrument:DSQ(Thermo)Ionization Method: EID:\DSQ\DATA-LR\12\010903 1/9/2012 10:23:43 AM ENPOMe
010903 #206 RT: 2.54 AV: 1 NL: 3.12E7T: + c Full ms [45.00-600.00]
50 100 150 200 250 300 350 400 450 500 550m/z
0
5
10
15
20
25
30
35
40
45
50
55
60
65
70
75
80
85
90
95
100
Rel
ativ
e A
bund
ance
489
231
170265 412201 291 33971 47438057 31515291 445
FI-IR
Electronic Supplementary Material (ESI) for Chemical CommunicationsThis journal is © The Royal Society of Chemistry 2012
16
4000 3000 2000 100040
60
80
100
Tran
smitt
ance
(%)
Wavenumber (cm-1)
1600
1500
829
770
700
3017 2217
12501033
Electronic Supplementary Material (ESI) for Chemical CommunicationsThis journal is © The Royal Society of Chemistry 2012