Embed Size (px)
Citation preview

Electronics and Informatics techniques for Genetic
Analysis
Micrel Lab people involved
Elisa Ficarra
Carlotta Guiducci
Daniele Masotti
Christine Nardini
Claudio Stagni Degli Esposti

Collaborations
Scanning Force Microscopy Lab at Biochemistry Department-UniBo
STI Urbino DAUIN Politecnico di Torino STMicroelectronics INFN Ferrara La Sapienza Roma Biochemistry Department c/o S.Luigi
Hospital, University of Torino Computer Science of Stanford
University

Genetic AnalysisTo Determine the sequence of a strand of DNA
Sequencing (DNA analysis)
To understand the molecular bases of the (human) phenotype DNA structural properties analysis and DNA-protein
interaction investigation Expression Profiling (RNA and protein analysis) Biochemical pathways defining Genotyping (Statistic of the presence of Single base mutations
in a population)
To have information on the health of living being Diagnostics Therapeutic treatments Drug Development

Research themes
Point-of-care Electronic Systems for Genetic AnalysisCarlotta Guiducci - Claudio Stagni
Degli Esposti
Computational Biology Elisa Ficarra - Daniele Masotti -
Christine Nardini

Point-of-care Electronic Systems for Genetic Analysis
Genetic Analysis with microfabricated sensors
Electrical sensing of genetic-affinity reactions
Optical detection

Point-of-care Electronic Systems for Genetic Analysis
Point-of-care diagnostics
Analytical testing performed outside the physical facilities of the clinical laboratories
To enable the implementation of point-of-care genetic analysis for the detection of plant
pathogens, of genetically modified organisms in foods, of marker proteins for pathologies, by
developing technologies based on direct generation of electrical signals
Aim and scope of our research activity

Foundamental innovation in genetic analysis
Possibility of attach, localize and/or address receptors onto a substrate in a very precise and dense way
More simple efficient and precise analysis Micro-arrays: Microfabricated two-dimentional
structures for parallel analysis Multi-site detection (more fast and parallel) Miniaturized devices (less sample quantity and
reagent cost, mass production)

Genetic Analysis with microfabricated sensors
Implementation of a sensing method or a transduction
system
Systetic ChemistrySurface physical-chemistry
Analytical chemistryMicrofabrication tecnology
Substrate
Oligonucleotide of known sequence(PROBE)
Sample to test (TARGET)
Know-how

Advantages of electrical methods
Fundamental step towards the development of lab-on-a-chip technology and point-of-care
analysis
The measured signal is electrical
Signal measurement and processing can be integrated on the same chip

A metal/solution interface as an electrical structure
S S
(CH2)6 (CH2)6
G
G
T
G
C
C
A
C
G
A
C
G
G
T
G
C
C
A
C
G
A
C
G
G
T
G
C
C
A
C
G
A
C
G
G
T
G
C
C
A
C
G
A
C
G
G
T
G
C
C
A
C
G
A
C
G
G
T
G
C
C
A
C
G
A
C
S S
(CH2)6 (CH2)6
G
G
T
G
C
G
G
T
G
C
G
G
T
G
C
G
G
T
G
C
G
G
T
G
C
G
G
T
G
C
Thickness2 nm
Permittivity1.9
Thickness5.5 nm
[Kelley et al., 1998]
Permittivity 2.5
[Peterlinz et al., 1997, Yang et al.,
1997].

Electrical sensing of genetic-affinity reactions
Non Complementary
Probes
Complementary
Total capacitance variation: 52%
C
Guiducci et al. Biosensors and Bioelectronics (2004)

Microfabricated gold electrodes
STMicroelectronicsMicroelectrodes on silicon
2103 µm2
INFN FerraraMicroelectrodes on glass
104 µm2
Stagni et al. et al. Proc. of AISEM 2004

Low-cost materials for substrate
1 10 100 103
100
103
104
105
- Im
(Z)
(
)
f ( Hz )
DNA duplex
Oligonucleotides
Receptors
Experimental .1/ COx 2f
1 10 100 103
100
103
104
105
- Im
(Z)
(
)
f ( Hz )
DNA duplex
Oligonucleotides
Receptors
Experimental .1/ COx 2f
Analysis of new materials by means of Impedance Spectroscopy andFluorescence imaging
Guiducci et al. Proc. of Biosensors 2004

System on board for electrical DNA detection
EPSON
Atmega
DACADC
Electrodes
USERC++ programming
Interface and communication with DAC or ADC: RS232 serial
Sample rate: 60 Ksamples/sec with clock system at 8 MHz
Schematic Design based on datasheet and realization on board
N.B: in this case we have two -controller, one for the interface with a display, the second for the measure
-processors, DAC and ADC programmable by -processor, all mounted on a board with microelectrodes

Optical detection, in progress…
DNA detection by means of UV measurements with high senitiveintegrated UV sensors
Luo et al. Biophysical Chemistry 2001
Numbers of DNA layer

Research themes
Point-of-care Electronic Systems for Genetic Analysis
Carlotta Guiducci - Claudio Stagni Degli Esposti
Computational Biology Elisa Ficarra – Daniele Masotti – Christine Nardini

Computational Biology
Our Capabilities!
Techniques for Automated Analysis of DNA Molecules in Atomic Force Microscope Images
Clustering and Cluster Biological Evaluation of Gene Expression Data
Works in Progress Extraction of Clinical Information from Gene Expression
Data Modelling Gene Regulatory Networks siRNA Design for RNA silecing

Techniques for Automated Analysis of DNA Molecules in
Atomic Force Microscope Images
DNA Sizing and Molecular Profiles determination algorithm through a set of fully automated Image Processing steps
Development of Automated Algorithms for DNA Molecules Feature Analysis and Extraction
DNA Intrinsic Curvature profile computation using a fast heuristic technique Combinatorial Optimization Problem

MotivationImportance of DNA Sizing, Molecular Profile Determination
and DNA Curvature Analysis
Specific DNA target identification
Physical genome maps and genotyping construction
Transcription rules investigation
Analysis of DNA secondary structure transitions
DNA molecule structural properties investigation
DNA-protein interaction analysis

Atomic Force Microscopy (AFM)
Characteristiques and Properties
• Low amount of DNA samples (vs. Gel electrophoresis)
• Direct visualization of DNA molecules lower processing time (few minutes vs. 2 hours with gel electrophoresis )
• High resolution (from 2 to 20nm vs. Over 200nm with optical microscopy)
• High signal-to-noise ratio
• Direct visualization of DNA molecules without contrast-enhancing agents

ObjectivesAutomated Automated AAlgorithm for molecular profile determination lgorithm for molecular profile determination
and DNA sizing from AFM imagesand DNA sizing from AFM images High accuracy
High robustness w.r.t. changes on DNA curvature profiles
High speed
DNA secondary structural transitions analysis
Automated Automated AAlgorithm for DNA intrinsic curvature profile lgorithm for DNA intrinsic curvature profile
computation computation from from molecular profilemolecular profiless
Automated Molecular Profile determination through Molecular
Orientation detection

DNA Sizing and Molecular Profile Determination Algorithm
•Sequantial Image Processing Steps•Outputs:
•DNA length calculation•Molecule Profile Extraction and Smoothing (for DNA curvature and flexibility analysis)

Example of Experimental DNA Sizing Results
Crithidia fasciculata AFM images Characterized by a very high curvature region very irregular shapes DNA length computation gets harder because surrounding noise shadows DNA shapes

DNA Curvature Model Highly asymmetric form factor
Molecules can be idealized as one-dimensional curved line Curvature value
Intrinsic curvature• Nucleotide sequence-dependent, static contributions
Flexibility • Susceptibility to thermal deformation, dynamic thermal
contributions
)()()( 0 nfnCnC
• Filtering of Dynamic Contributions Averaging along the chain on a significant population of molecules flexibility contribution is null and the average of sampled curvature is equal to intrinsic curvature
)()()()( 00 nCnfnCnC

Curvature Reconstruction Algorithm
Four different DNA adsorbing modality on AFM surface Molecular face (two different ways due to Dna molecule planarity) Direction of sampling (difference due to DNA molecule asymmetry)
Four different curvature profile orientations from an AFM image with m equal molecules, v curvature values are sampled at regular intervals along each chain. Since all these curvature vectors have the same dimension we can define a curvature matrix C(mxv)
Representation of molecules in the matrix with the same orientation to evaluate the curvature average on corresponding points of the molecule.
The optimal configuration, all the molecules share the same orientation minimal value of curvature variance for each point, i.e. the minimal column variance in matrix of curvature C
Greedy Heuristic

Example of Experimental Curvature Profile Computation
EcoR V-EcoR V dimer intrisic curvature profile Theoretical curvature peak of 0.08 rads Deviation of 8.44nm, that is 1.3% of molecule length in the
location of the peaks w.r.t. the theoretical curvature profile Reconstructed intrinsic curvature profile well approximates the
theoretical one with a standard deviation in the regions of the peaks of 6.1E-3
Figure: Theoretical (dashed plot) and EcoRV-EcoRV reconstructed intrinsic curvature profile (solid plot)

Microarray Clustering Unsupervised learning technique In general, an NP-complete problem Examples
K-means, hierarchical, graph partitioning, self-organizing map,…
Mostly approximate algorithms May lose global patterns High-dimensional data
More difficult for a cluster to form Harder to find a cluster
Two-way clustering Cluster attributes as well
Subspace clustering Focus on subset of attributes

pCluster1 – metric and definition
x1 X2
y1 y2
JjyIixpScorepClusterJI ji ,,,,),(
pCluster: cluster which elements all have pScore smaller than a threshold
I
J
)2211
21
21
()( yxyx
yy
xxpScore
Two-way clustering algorithm Only 3 parameters are required:
MG, ME, ð
1Clustering by Pattern Similarity in Large Data Sets,H. Wang et Al,SIGMOD 2002

Enhanced pCluster Algorithm - flow Generation of PCTgenes: sets of all
pCluster of size 2 genes by any number of experiments (and viceversa with PCTexp)
Test for Well Shaped property, if this holds the PCT already contains the final solution in it
Depending on the former test, application of appropriate algorithm for clustering
Finds ALL pClusters in the matrix

Performances
Comparison with original pCluster (on syntetic data set)
0
500
1000
1500
2000
2500
3000
1k 2k 3k 4k 5k 6k 7k 8k 9k
Data size (#genes)
Av
g.
ru
nn
ing
tim
e (
sec.)
IBM
Our algorithm
0%10%20%30%40%50%60%70%80%90%
100%
Type 1 Type 3
Clustering
Transparency Test
PCT optimization
PCT generation
Case Ours IBM
1 5 5
2 21 21
3 102 102
4 167 167
5 65 65
6 372 207
7 572 210Running time breakdown
Number of clusters found
(Real data set, yeast)
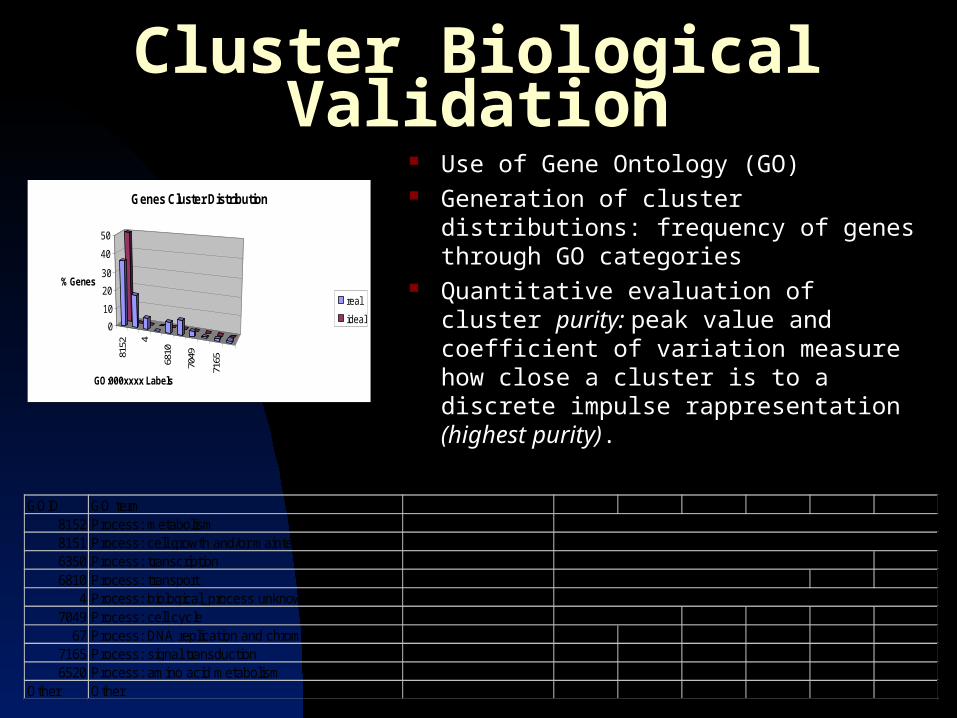
Cluster Biological Validation Use of Gene Ontology (GO) Generation of cluster distributions:
frequency of genes through GO categories
Quantitative evaluation of cluster purity: peak value and coefficient of variation measure how close a cluster is to a discrete impulse rappresentation (highest purity).
8152 4
6810
7049
7165
0
10
20
30
40
50
% Genes
GO:000xxxx Labels
Genes Cluster Distribution
real
ideal
GOID GO term Frequency Gene(s)8152 Process: metabolism 36 out of 50 genes, 72% RPS8A SSA3 RPL32 RPS9B DER1 YBP1 PBN1 HEX3 PRP9 RPL31A RPP1A RPS16B RPL35B TPI1 RPS13 CTH1 SIR4 PRP42 SNU56 YAP6 SUR2 TCM10 ESC2 SSN2 RPS17B UTP6 RPS18A VPS3 HYP2 RPL23B RAD3 FAB1 NUT1 CDC43 GOD1 SRB58151 Process: cell growth and/or maintenance 18 out of 50 genes, 36% SSA3 VAC17 HEX3 MPH2 GSG1 NUM1 SEC7 SIR4 SBE2 ESC2 RPS17B UTP6 VPS3 YEL006W RAD3 FAB1 CDC43 GOD16350 Process: transcription 8 out of 50 genes, 16% CTH1 SIR4 YAP6 ESC2 SSN2 RAD3 NUT1 SRB56810 Process: transport 6 out of 50 genes, 12% SSA3 MPH2 GSG1 SEC7 VPS3 YEL006W
4 Process: biological_process unknown 6 out of 50 genes, 12% YCR001W YDR109C FIN1 YER128W YGL085W YGL250W7049 Process: cell cycle 3 out of 50 genes, 6% GSG1 NUM1 RAD3
67 Process: DNA replication and chromosome cycle 1 out of 50 genes, 2% NUM17165 Process: signal transduction 1 out of 50 genes, 2% CDC436520 Process: amino acid metabolism 0 out of 50 genes, 0% none
Other Other 1 out of 50 genes, 2% SNG1

Results
Comparison between biclusters1 and delta-biclusters2
Aggiungi cit + plot + statistics
p #563 bi #46 p #563 bi #46 p #563 bi #46
peak;peak* 0.76;0.77 0.71;0.72 0.79;0.79 0.55;0.56 0.76;0.76 0.66;0.66
V;V* 169.3;175.8 139.8;138.8 180.6;180.6 90.3;91.8 186.5;189.9 122.8;123.1
Biological Process Molecular Function Cellular Component
epC C&C epC C&C epC C&C
peak 0,8 0,7 0,8 0,6 0,8 0,7
Coeff. Variation 169.3 139.8 180.6 90.3 186.5 122.8
0
1020
3040
506070
80
% Genes
8152 8151 4 7165 OtherN.y.A.
Category Label GO:000
Biological Process
p #563
bi #46
0
10
20
30
40
50
60
70
% Genes
5554 51983824305285215OtherN.y.A.
Category Label GO:000
Molecular Function
p #563
bi #46
0102030405060708090
% Genes
5737 8372 5634 Other N.y.A.
Category Label GO:000
Cellular Component
p #563
bi #46
Comparison between high overlapping cluster(C&C)2 and enhanced pCluster (epC)
2Biclustering of Expression Data, Y. Cheng, G. M. Church, ISMB'00, 2000

Work in progress (Microarray Clustering)
Clinical genomic: introduction of clinical information in the gene expression matrix
Goal:
Diagnose diseases with the accuracy of the genetic pattern through clinical information

Work in Progress (Gene Networks) siRNA Design for RNA interference to
systematic analysis of gene expression and function
therapeutic gene silencing
Modelling Gene Regulatory Networks defining gene function defining biochemical pathways
through network mathematical models design and microarray screening of RNAi knockouts
Goals: Drug Development Therapeutic treatment
Cancer HIV Viral infection Parasitic infection