Embed Size (px)
Citation preview
Elevated hematocrit enhances platelet accumulation following vascular injury Running title: Elevated hematocrit promotes arterial thrombosis Bethany L. Walton1, Marcus Lehmann2, Tyler Skorczewski3, Lori A. Holle1, Joan D. Beckman4, Jeremy A. Cribb5, Micah J. Mooberry4, Adam R. Wufsus2, Brian C. Cooley6, Jonathan W. Homeister1, Rafal Pawlinski4,6, Michael R. Falvo5, Nigel S. Key4,6, Aaron L. Fogelson7, Keith B. Neeves2,8, Alisa S. Wolberg1,6
1Department of Pathology and Laboratory Medicine, University of North Carolina at Chapel Hill,
Chapel Hill, NC 2Department of Chemical and Biological Engineering, Colorado School of Mines, Golden, CO 3Department of Mathematics and Statistics, Cornell College, Mount Vernon, Iowa 4Department of Medicine, Division of Hematology/Oncology, University of North Carolina at Chapel
Hill, NC 5Department of Physics and Astronomy, University of North Carolina at Chapel Hill, Chapel Hill, NC 6McAllister Heart Institute, University of North Carolina at Chapel Hill, Chapel Hill, NC 7Departments of Mathematics and Bioengineering, University of Utah, Salt Lake City, Utah
8Pediatrics, University of Colorado-Denver, Aurora, CO Address correspondence to: Alisa S. Wolberg, Ph.D. Department of Pathology and Laboratory Medicine University of North Carolina at Chapel Hill 819 Brinkhous-Bullitt Building, CB #7525 Chapel Hill, NC 27599-7525 Phone: (919) 962-8943; Fax: (919) 966-6718 Email: [email protected] Abstract word count: 237 Manuscript word count (Introduction, Methods, Results, Discussion: 4052 Figures: 6 (2 black & white, 4 color) Tables: 2 References: 61 Scientific category: Thrombosis and Hemostasis
Blood First Edition Paper, prepublished online March 1, 2017; DOI 10.1182/blood-2016-10-746479
Copyright © 2017 American Society of Hematology
For personal use only.on April 5, 2017. by guest www.bloodjournal.orgFrom

2
KEY POINTS
1) Elevated hematocrit independently promotes arterial thrombus formation.
2) During arterial thrombosis, elevated hematocrit enhances platelet accumulation at the site of vessel
injury.
For personal use only.on April 5, 2017. by guest www.bloodjournal.orgFrom
3
ABSTRACT
Red blood cells (RBCs) demonstrate procoagulant properties in vitro, and elevated hematocrit is
associated with reduced bleeding and increased thrombosis risk in humans. These observations suggest
RBCs contribute to thrombus formation. However, effects of RBCs on thrombosis are difficult to assess
because humans and mice with elevated hematocrit typically have co-existing pathologies. Using an
experimental model of elevated hematocrit in healthy mice, we measured effects of hematocrit in two in
vivo clot formation models. We also assessed thrombin generation, platelet-thrombus interactions, and
platelet accumulation in thrombi ex vivo, in vitro, and in silico. Compared to controls, mice with
elevated hematocrit (RBCHIGH) formed thrombi at a faster rate and had a shortened vessel occlusion time.
Thrombi in control and RBCHIGH mice did not differ in size or fibrin content, and there was no
difference in levels of circulating thrombin-antithrombin complexes. In vitro, increasing the hematocrit
increased thrombin generation in the absence of platelets; however, this effect was reduced in the
presence of platelets. In silico, direct numerical simulations of whole blood predicted elevated
hematocrit increases the frequency and duration of interactions between platelets and a thrombus. When
human whole blood was perfused over collagen at arterial shear rates, elevating the hematocrit increased
the rate of platelet deposition and thrombus growth. These data suggest RBCs promote arterial
thrombosis by enhancing platelet accumulation at the site of vessel injury. Maintaining a normal
hematocrit may reduce arterial thrombosis risk in humans.
KEYWORDS
Erythrocytes, arterial thrombosis, platelet margination, thrombin-antithrombin complexes, tissue factor,
collagen, erythrocytosis
For personal use only.on April 5, 2017. by guest www.bloodjournal.orgFrom
4
INTRODUCTION
Red blood cells (RBCs) are the most abundant cells in blood. Normal RBC numbers range from 4.2-
to-6.1×10⁹/mL in humans; males have slightly higher levels than females. RBCs are primarily known
for their hemoglobin-mediated role in oxygen transport. However, a growing body of evidence suggests
RBCs have biochemical and biophysical properties that may contribute to thrombosis. First, RBCs are
the principal determinant of blood viscosity, an established risk factor for thrombosis.1 Blood viscosity
increases non-linearly with increased hematocrit.2,3 Consequently, elevated hematocrit, even within a
clinically-relevant range (40-60%), increases blood viscosity at both arterial and venous shear rates.4
Second, simulations and experimental studies using models of intact (uninjured) arteries suggest RBCs
enrich the near-wall region with platelets (margination).5,6 Third, RBCs enhance platelet αIIbβ3 activation
and P-selectin exposure in response to agonists (e.g., collagen, thrombin).7-9 Fourth, platelet
accumulation on excised subendothelial matrices increases with increasing hematocrit (10-70%) at
arterial shear rates.10 Finally, RBCs and RBC-derived microvesicles have exposed phosphatidylserine on
their outer membrane and can support thrombin generation in vitro.11-18 Overall, these studies support
the hypothesis that elevated RBCs can directly enhance thrombosis. However, which, if any, of these
pathways contribute to thrombosis in vivo is unclear. Determining the contribution of RBCs to
coagulation in vivo is clinically important because elevated hematocrit is an independent risk factor for
cardiovascular disease and cardiovascular-related deaths.19-24 Thus, increased understanding of the
relationship between hematocrit and thrombosis is needed to guide clinical strategies.
Previous studies in animal models have examined the pathophysiologic effects of elevated
hematocrit in JAK 2V617F-induced polycythemia vera (PV) or erythrocytosis mediated by endogenous
overproduction of erythropoietin.25-28 Findings from these studies expose complex, and sometimes
discordant, effects of hematocrit on coagulation and failed to reveal a clear relationship between
hematocrit and thrombosis. For example, a mouse model of JAK 2V617F-induced PV exhibits a
prothrombotic phenotype following FeCl3 injury to mesenteric vessels, but an apparent paradoxical
increase in bleeding following tail transection.27 However, these mice are deficient in platelet GPVI and
have reduced plasma von Willebrand factor multimers27, making it difficult to assess the contribution of
elevated hematocrit to thrombosis. Mice genetically-engineered to overexpress human erythropoietin
also show increased bleeding in a tail bleeding model.26 However, these animals have a markedly
increased hematocrit (80-85%) not seen in humans, and the increased bleeding may be explained by a
For personal use only.on April 5, 2017. by guest www.bloodjournal.orgFrom
5
reduction in plasma volume.26 Erythropoietin-infused mice with less dramatically elevated hematocrit
(60±5.5%) do not differ from controls in a FeCl3-induced mesentery thrombosis model.27 However,
since erythropoietin has downstream effects on multiple cell types29-32, it is also difficult to assess
specific effects of elevated hematocrit with this approach.
Herein, we analyzed the effect of RBCs on thrombus formation in an experimental model of elevated
hematocrit in healthy mice. Compared to controls, increased hematocrit shortened the time to carotid
artery occlusion and shortened the clotting time following tail transection. Ex vivo, in silico, and in vitro
analyses suggest this effect did not stem from increased thrombin generation, but rather, was associated
with increased frequency of platelet-thrombus interactions, leading to accelerated platelet accumulation
and more rapid thrombus growth.
For personal use only.on April 5, 2017. by guest www.bloodjournal.orgFrom
6
METHODS
Proteins and Materials are detailed in Supplemental Materials.
Mouse model of elevated hematocrit. Procedures were approved by the University of North Carolina
at Chapel Hill Institutional Animal Care and Use Committee. Whole blood was collected from healthy,
anesthetized 6-to-8-week old male and female C57Bl/6 mice via inferior vena cava venipuncture into
3.2% sodium citrate (10% v/v, final). Blood was centrifuged (150xg, 10 min) to separate RBCs from
platelet-rich plasma (PRP). RBCs were re-suspended in sterile citrate-glucose-saline (1.29 mM sodium
citrate, 3.33 mM glucose, 124 mM NaCl, pH 7.2) and washed by centrifugation (3X 400xg, 5 min).
Washed RBCs were re-suspended in sterile HEPES-buffered saline (20 mM N-2-
hydroxyethylpiperazine-N’-2-ethane-sulfonic acid, 150 mM NaCl, pH 7.4 [HBS]) and centrifuged
(400xg, 10 min) to pack RBCs. RBCs were counted (HV950FS Hemavet cell counter, Drew Scientific,
Dallas, TX) and the hematocrit adjusted to 70%. Recipient 6-to-8-week old male C57Bl/6 mice were
anesthetized, injected with packed RBCs via retro-orbital plexus (~250 µL), and allowed to recover.
After 24 hours, blood was drawn from the inferior vena cava for hematological analysis or animals were
subjected to thrombosis models (separate mice). Methods for blood smears, flow cytometry, thrombin-
antithrombin complex (TATc), and whole blood viscosity measurements are detailed in Supplemental
Materials.
Mouse models of clotting. The FeCl3 injury model was performed as described.33,34 Briefly, 6-to-8-
week old male C57Bl/6 mice were anesthetized. The right common carotid artery was exposed, dried,
and treated with FeCl3 (10%, 0.5x0.5-mm filter paper, 2 min). Blood flow was monitored auditorily by
Doppler ultrasonic flow probe. Time to vessel occlusion (TTO) was the time between FeCl3
administration and lack of flow for 1 min. Doppler tracings recorded for a subset of mice were used to
determine thrombus onset time (inflection point when blood flow began to decrease and resulted in
vessel occlusion) and thrombus formation rate (maximum rate of decrease in blood flow [min-1]
following the thrombus onset time). Mice that did not experience carotid occlusion were omitted from
onset and rate analysis because they did not form defined thrombi.
Tail transection assays were performed as described in Supplemental Materials.
For personal use only.on April 5, 2017. by guest www.bloodjournal.orgFrom
7
Phlebotomy. Blood was drawn from healthy, consenting human donors in accordance with the
Declaration of Helsinki and University of North Carolina at Chapel Hill and University of Colorado at
Boulder Institutional Review Boards. Donors had not ingested aspirin for ≥5 days prior to phlebotomy.
Blood was collected via antecubital venipuncture into 0.105 M sodium citrate, pH 5.5 (10% v/v, final).
Thrombin generation in reconstituted human whole blood. Thrombin generation was measured
using whole blood calibrated automated thrombography15 as detailed in Supplemental Materials.
Computational modeling. Simulations of human whole blood flow driven by a pressure gradient
through a 50-µm channel were conducted with a custom Lattice-Boltzmann Immersed Boundary method
code.35-37 For each simulation, the channel was partially occluded by a preformed thrombus of specified
shape and size. The pressure gradient was set to achieve a wall shear rate of approximately 1100 sec-1.
At a sequence of times, the fluid velocity field was computed, accounting for mechanical forces
generated by numerous deformable RBCs and a smaller number of less deformable platelets.
Rheological properties of the RBC suspension emerge from the simulations. Trajectories through space
of 700 points on each RBC surface and 100 points on each platelet surface were tracked as functions of
time, thus determining each cell’s location, orientation, and deformation. Simulations were conducted
for hematocrits of 40% and 60%, for small (base 44 µm, top surface 34 µm, height 7.2 µm) and large
(base 44 µm, top surface 24 µm, height 11.5 µm) thrombi. For each case, a RBC distribution at
statistical equilibrium was pre-computed and then 10 flow simulations were carried out starting with this
RBC distribution and with a platelet placed at a randomly-chosen position in the near-wall RBC-
depleted zone 14-44 µm upstream of the thrombus. Simulation results were processed using custom
MATLAB scripts.
Microfluidic model with reconstituted whole blood. Fibrillar collagen (500 µg/mL) was patterned in
200-µm spots onto clean glass, as described.38 Human whole blood was separated into PRP and RBCs
by centrifugation (200xg, 20 min) and reconstituted to 45 and 60% hematocrits. Reconstituted aliquots
were labeled with DiOC6 and Alexa Fluor 555-labeled fibrinogen (1 µM and 56 µg/mL, final
concentrations, respectively) at 37°C for 15 min. Labeled blood was recalcified with buffer (75 mM
CaCl2 and 37 mM MgCl2 in HBS, 9:1 flow rate ratio) using a continuous microfluidic mixer39 upstream
of a custom PDMS flow chamber (height 51 µm, width 500 µm), and perfused over collagen (750 sec-1,
For personal use only.on April 5, 2017. by guest www.bloodjournal.orgFrom
8
15 min). Final hematocrits were 41% and 54%. Total thrombus size, fibrin formation, and platelet
accumulation were captured by relief contrast and epifluorescence microscopy (Olympus IX81, 20X
NA=0.45, λex/λem 475/505, 545/580, at 6 frames/min). Thrombus area fraction, fibrin formation, and
platelet accumulation were measured as described.39
Statistical methods. Descriptive statistics (mean, median, standard deviation [SD]) were calculated.
Groups were compared using Student’s t-tests (normally distributed data using Lilliefors test for
normality) or Wilcoxon-Mann-Whitney rank sum tests (non-normally distributed data) in Kaleidagraph
version 4.1.3 (Synergy Software, Reading, PA). For viscosity experiments, viscosity and shear rate were
logarithmically-transformed and then analyzed using a linear model. For microfluidics experiments, data
were analyzed by paired t-test.
For personal use only.on April 5, 2017. by guest www.bloodjournal.orgFrom
9
RESULTS
Experimental model of elevated hematocrit in mice. To study the effect of elevated hematocrit in vivo,
we used an experimental model in which we raised the hematocrit in healthy mice with fresh, washed
RBCs from healthy donor mice. Complete blood counts showed RBCHIGH mice had an elevated
hematocrit compared to control mice (P<0.0001, Figure 1A, Table I). Levels of neutrophils and
monocytes were similar in controls and RBCHIGH mice (Figure 1B-C, Table I). Platelet levels were
slightly lower in RBCHIGH mice compared to controls (Figure 1D, Table I), but remained in the normal
range. Blood smears showed normal morphology of washed RBCs (Figure 1E, left) and RBCs from
control mice (Figure 1E, middle) and RBCHIGH mice (Figure 1E, right). Consistent with prior
reports11,12,40,41, less than 1% of packed RBCs or circulating RBCs in control or RBCHIGH mice had
exposed phosphatidylserine (Figure 1F). Plasmas isolated from control and RBCHIGH mice had similar
circulating TATc (3.7±0.5 and 2.2±1.3 ng/mL, respectively, mean±SD). As expected, whole blood from
RBCHIGH mice was more viscous than whole blood from control mice over a range of shear rates (30-
2300 sec-1, Figure 1G), and blood flow was slightly, though non-significantly, slower in RBCHIGH mice
versus controls (1457.9±295.0 versus 2177.9±1230.6 Hz, respectively, mean±SD). Together, these data
establish a model of elevated hematocrit in otherwise healthy mice.
Compared to controls, RBCHIGH mice have a faster time to artery occlusion and shorter tail
bleeding time. To determine the effect of elevated hematocrit on thrombosis, we first subjected control
and RBCHIGH mice to the FeCl3/carotid artery thrombosis model. Compared to controls, RBCHIGH mice
had a significantly shorter TTO (13.2±6.6 versus 5.3±0.9 min, respectively, mean±SD; 12.7(13.9) versus
5.4(2.6) min, respectively, median(range), P<0.001, Figure 2A). At the time when 50% of control mice
had complete vessel occlusion, 100% of RBCHIGH mice had an occluded vessel. A separate experiment
in which control mice were compared to mice injected with RBC wash supernatant (RBCwash) showed
no difference in TTO (10.9±7.1 versus 8.8±5.7 min for control and RBCwash mice, respectively,
mean±SD ; 7.1(15) versus 7.3(15.8) min, respectively, median(range), P=0.87, N=6/group), indicating
the shortened TTO in RBCHIGH mice was not caused by RBC releasates during RBC preparation.
Doppler tracings indicated the thrombus onset time for RBCHIGH mice was not significantly different
from control mice (Figure 2B), but the thrombus formation rate was significantly faster (0.020±0.006
versus 0.012±0.003 min-1, respectively, mean±SD, P<0.05, Figure 2C).
For personal use only.on April 5, 2017. by guest www.bloodjournal.orgFrom
10
To test whether elevated hematocrit promoted clotting in a second in vivo model, we subjected
control and RBCHIGH mice to a tail transection assay. Elevated hematocrit did not shorten the clotting
time under normal conditions, likely due to the already very short clotting time (median ~88 sec).
However, when mice were infused with heparin to prolong the clotting time, RBCHIGH mice had a
shorter clotting time than control mice (P<0.05, Figure 2D). Together, data from these two models
suggest elevated hematocrit accelerates clot formation in vivo.
Thrombi from control and RBCHIGH mice do not differ in size or fibrin content. To determine how
elevated hematocrit accelerates thrombosis, we first excised the occluded carotid artery from a subset of
mice subjected to FeCl3 injury. Both control and RBCHIGH mice had fully occlusive thrombi that were
similar in size (Figure 3A,B). Thrombi from both control and RBCHIGH mice were primarily composed
of proteinaceous material with sparse, small islands of RBCs, and showed similar fibrin staining
(amount and intensity, Figure 3A). These data suggest elevated hematocrit does not increase thrombus
size or fibrin content.
Thrombin generation does not differ in control and RBCHIGH mice in vivo. We then tested the
hypothesis that RBCHIGH mice had enhanced activation of coagulation following FeCl3 injury. We drew
blood from mice 5 min after artery occlusion and measured TATc in plasma. TATc were similar in
control and RBCHIGH mice (7.1±2.8 and 9.8±5.3 ng/mL, respectively, mean±SD, P=0.32, Figure 3C),
and circulating TATc levels did not correlate with hematocrit (Figure 3D). These data suggest elevated
levels of normal RBCs do not promote thrombus formation by increasing thrombin generation.
Effect of RBCs thrombin generation depends on the platelet concentration. The observation that
RBCHIGH mice did not have increased circulating TATc suggested elevated RBCs did not augment
thrombin generation during arterial thrombosis in mice. To examine the relative contribution of RBCs
and platelets to thrombin generation, we isolated and then reconstituted plasma, platelets, and RBCs
from healthy humans to levels indicated in Figure 4. We then triggered coagulation with tissue factor
and recalcification and measured thrombin generation by whole blood calibrated automated
thrombography. In the absence of platelets, increasing hematocrit increased the thrombin generation rate,
peak, and endogenous thrombin potential (Figure 4, Table II). This finding is consistent with prior
studies12,13,15, and is thought to reflect prothrombin cleavage on the surface of phosphatidylserine-
For personal use only.on April 5, 2017. by guest www.bloodjournal.orgFrom
11
expressing RBCs.12 However, in reactions with 200x106 platelets/mL, hematocrit had less effect on
thrombin generation (Figure 4, Table II), and in reactions with 450x106 platelets/mL, there was no effect
of hematocrit on thrombin generation (Figure 4, Table II). Increased thrombin generation was detected
in control reactions with elevated prothrombin (data not shown), indicating the lack of increased
thrombin detected was not due to fluorogenic substrate consumption. Together with the lack of
increased circulating TATc in RBCHIGH mice (Figure 3C), these data suggest that in mice and humans
with normal or elevated platelet levels, normal RBCs do not enhance thrombin generation during arterial
thrombus formation.
A computational model suggests elevated hematocrit increases the time that platelets spend in
proximity to a thrombus. Direct numerical simulations of RBCs and platelets near a porous thrombus
show RBCs strongly influence platelet motion and orientation.37 Since arterial thrombi are platelet-rich,
we then tested the hypothesis that the prothrombotic effect of elevated hematocrit was mediated by
enhanced interactions of flowing platelets with the thrombus. We conducted in silico simulations of
whole blood flow at 40 and 60% hematocrit, in both the absence and presence of small and large porous
thrombi. Comparisons with and without thrombi enabled us to evaluate effects of interstitial velocity on
platelet behavior.
Figure 5A-D shows the instantaneous configuration and time-averaged distribution of RBCs and
platelets resulting from simulations at 40 and 60% hematocrit. These data reveal a zone along a straight
wall in which RBC concentrations were reduced and platelet concentrations were enhanced, and that this
near-wall zone was narrower for 60% than 40% hematocrit (Figure 5A,B). The zone’s width was also
smaller for 60% than 40% hematocrit both upstream of (1.0 versus 3.0 µm, respectively) and over (0.28
versus 1.28 µm, respectively) a small thrombus (Figures 5C,D). Results were similar in simulations with
larger thrombi (data not shown). This decreased near-wall zone resulted from increased interstitial
velocity within the porous thrombus versus the solid wall. Narrowing of this zone pushed platelets close
to the thrombi, so that platelets spent more time in proximity to the thrombus than to a comparable
segment of flat vessel wall; i.e., at 40% hematocrit, for the same trajectory length (44 µm), platelets
spent 11.5 msec within 0.5 µm of the porous thrombus versus only 3.1 msec near the solid wall.
Figure 5E-H shows a sequence of snapshots every 2 msec of a representative platelet's position near
small (Figure 5E,F) and large (Figure 5G,H) thrombi. For the small thrombus, the average time the
platelet spent within 0.5 µm of the thrombus was greater for 60% hematocrit than 40% hematocrit
For personal use only.on April 5, 2017. by guest www.bloodjournal.orgFrom
12
(29.5±26.6 msec versus 11.5±10.0 msec, respectively, mean±SD). Trends for the larger thrombus were
similar, but interactions were even longer and showed a greater difference between hematocrits
(41.0±39.4 versus 15.4±9.5 msec, mean±SD). Consistent with previous studies37, interactions in both
cases were particularly frequent and prolonged near the upstream face of the thrombus. A linear fit of
mean platelet interaction times with the small thrombus for 40% and 60% hematocrits predicts an
increase of ~55% in the mean interaction time for a 47% hematocrit. The analogous calculation for the
large thrombus predicts an increase of 58%. These predicted values from the simulations agree well with
the 67% increase in mean thrombus growth rate observed in vivo for 47% versus 40% hematocrit.
Together, these data suggest elevated hematocrit enhances platelet contact with a thrombus in flowing
blood, and that the frequency of these interactions increases with thrombus growth.
Elevated hematocrit increases the rate of platelet accumulation on collagen at an arterial shear
rate. Finally, to directly compare the effect of hematocrit on fibrin formation and platelet accumulation,
we used an in vitro microfluidic model to visualize and measure thrombus growth on 200-µm collagen
spots at an arterial shear rate (750 sec-1). Consistent with the in vivo findings and predictions from in
silico simulations, elevated hematocrit significantly accelerated thrombus growth (Figure 6A,B),
exposing a direct, prothrombotic effect of increased hematocrit on thrombus formation. The sensitivity
of these in vitro experiments to very early thrombus formation also revealed a small, but significant,
shortening of the lag time to thrombus initiation that was not detectable in the in vivo experiments. This
reduction in lag time is consistent with in silico predictions of enhanced margination at higher
hematocrit near a straight, non-porous wall (Figure 5A,B). There was no measurable effect of hematocrit
on fibrin deposition (data not shown), consistent with in vivo and in vitro findings indicating little-to-no
effect of elevated hematocrit on thrombin generation or fibrin formation at normal platelet counts.
Notably, however, Figure 6C illustrates a moderate, though significant, effect of hematocrit on the rate
of platelet accumulation in the thrombus. This finding is consistent with predictions from the
computational model suggesting elevated hematocrit increases the frequency and duration of platelet-
thrombus interactions, and therefore, the likelihood that these interactions will result in platelet
accumulation in the thrombus. Collectively, these data suggest elevated hematocrit promotes platelet
interactions with a forming thrombus, leading to faster platelet accumulation and accelerated thrombus
growth.
For personal use only.on April 5, 2017. by guest www.bloodjournal.orgFrom
13
DISCUSSION
Although RBCs have procoagulant properties in vitro, effects of RBCs on thrombosis in vivo are
difficult to assess because humans and mice with elevated hematocrit typically have co-existing
pathologies. Herein, we used an experimental model of elevated hematocrit in healthy mice and showed
these mice have accelerated arterial thrombus formation and a shortened tail transection clotting time.
Elevated hematocrit did not enhance thrombin generation or fibrin deposition in vivo or in vitro in the
presence of normal numbers of platelets. However, elevated hematocrit increased the frequency of
platelet interactions with thrombi in silico, and accelerated the rate of platelet accumulation in thrombi
in a microfluidic-based model of thrombus formation. Collectively, these findings suggest RBCs
independently promote arterial thrombosis and show this occurs via a platelet-dependent increase in
thrombus growth.
Epidemiologic studies of healthy humans associate elevated hematocrit with thrombosis, and suggest
increased risk exists at even moderately-elevated baseline hemoglobin/hematocrit levels. In a large
prospective cohort analysis (>8,000 subjects), incidence of myocardial infarction (MI), coronary
insufficiency, or coronary heart disease deaths was more than double in individuals with high hematocrit
(>49%) compared to individuals with low hematocrit (<42%).19 Likewise, the Framingham study
followed >5,000 men and women (30-62 years old) over 34 years and showed that compared to
individuals in the mid-hematocrit quintile, young men and women in the highest quintile (men ≥49%,
women ≥46%) had an increased risk of death from cardiovascular disease.21 Similarly, in the British
Regional Heart Study involving >7,700 men, risk of major ischemic heart disease events was increased
by 30% at hematocrit >46%, compared to those below this cut-off.22 Additional longitudinal studies of
young men showed that a high hematocrit at baseline was associated with 1.4-to-1.9-fold increased risk
of MI during the follow-up period.20,24 In most of these studies, the association with thrombosis was
independent of other cardiovascular risk factors, including smoking, itself a recognized cause of
elevated hematocrit.
Increased hematocrit has also been implicated in thrombosis associated with a number of
erythrocytotic disorders including PV, Chuvash polycythemia, and erythropoietin-induced
erythrocytosis. In PV, risk of cardiovascular death and major thrombosis is significantly reduced by
maintaining the hematocrit <45%, compared to 45-50%.42 However, determining specific prothrombotic
effects of hematocrit in these patients is complicated by the underlying disease pathophysiology.
For personal use only.on April 5, 2017. by guest www.bloodjournal.orgFrom
14
Together with older studies, our findings provide biophysical mechanisms that may explain these
observations: elevated hematocrit increases the duration and frequency of platelet-thrombus interactions.
In contrast to most computational studies of margination in long, straight tubes35,43-46, our model
includes the perturbation of blood flow by a thrombus penetrating into the lumen. Importantly, like
thrombi in vivo47, the thrombi in our in silico model are porous, allowing for interstitial flow through the
thrombus interior. The magnitude of interstitial flow increases with hematocrit, ultimately pushing
platelets closer to the surface, while reducing tumbling. As a result, platelets are in close proximity to
the thrombus for longer times, increasing the probability of receptor-ligand bond formation. Related in
silico studies show that even at a hematocrit of 10%, RBCs enhance platelet deposition in stenosed
vessels, in part by reducing the distance between a platelet and a non-porous thrombus.48 Effects of
elevated hematocrit on platelet accumulation in our assays were significant but moderate, consistent
with the moderately increased risk observed in epidemiologic studies.19-21,24 Notably, the premise that
elevated hematocrit promotes thrombosis via platelet-dependent mechanisms is consistent with clinical
findings that platelet antagonism reduces cardiovascular death, non-fatal MI, and stroke in patients with
PV.49 Thus, these data may provide rationale for the efficacy of platelet inhibition strategies in patients
with elevated hematocrit and increased thrombosis risk.
Since RBCs can support thrombin generation12-15, the observation that elevated hematocrit did not
increase circulating TATc was somewhat surprising. However, the dependence of arterial thrombosis on
platelet function50 and scarcity of RBCs in the thrombus (Figure 3A) suggest phosphatidylserine
expressed by normal RBCs does not substantively augment local thrombin generation during arterial
thrombosis. However, RBCs may enhance thrombin generation in certain clinical situations. For
example, patients with thrombocytopenia51 or increased numbers of circulating phosphatidylserine-
positive RBCs (e.g., sickle cell disease, β-thalassemia, or PV)40,52-55 may demonstrate clinically-
meaningful, RBC-mediated thrombin generation. Indeed, in patients with sickle cell disease, numbers of
circulating phosphatidylserine-positive RBCs correlate with circulating prothrombin fragment 1.2.52 In
addition, RBCs may support thrombin generation in venous thrombi, where the RBC content is higher
than in arterial thrombi. Further studies are warranted to evaluate the effects of elevated hematocrit in
these situations. Our approach to raise the hematocrit in mice with RBCs harvested from other mice is
exploitable for investigating these situations, as well as the effect of RBCs with biophysical and/or
biochemical abnormalities, including sickled RBCs, in future studies.
For personal use only.on April 5, 2017. by guest www.bloodjournal.orgFrom
15
This study has potential limitations. First, mice differ from humans in vascular dimensions, size of
RBCs and platelets, number of platelets, and blood rheology. However, our data demonstrate consistent,
prothrombotic effects of elevated hematocrit in both murine and human experimental systems. Second,
although FeCl3 is a common agent for inducing thrombosis in animal models, ferric ions cause charge-
suppression of plasma proteins and blood cells leading to initial adhesion of blood cells, including RBCs,
to the endothelium by non-biological mechanisms.56-60 However, subsequent propagation of thrombus
into the vessel lumen, including platelet accumulation and thrombus growth, is still thought to
recapitulate key aspects of arterial thrombus formation.57,60 Moreover, results were supported by
independent experimental systems in vivo (tail transection), in silico (simulation), and in vitro
(microfluidics). Third, our findings are limited to mildly elevated hematocrit. In future studies, it may be
useful to examine the relationship between hematocrit and thrombosis across a broader range. Such
studies may identify a non-linear, and even J-shaped21, response to hematocrit. For example, in
situations where hematocrit elevation is extreme such as in patients with cyanotic congenital heart
disease, hyperviscosity may paradoxically manifest as a bleeding tendency61, an association that can also
be seen in mice with extremely high hematocrits26. Thus, the relationship between thrombosis and
elevated hematocrit/hemoglobin may be complex and dependent on the mechanism and degree of
erythrocytosis. Finally, our study does not address potential effects of chronically-elevated hematocrit,
in which additional systemic effects may also impact thrombosis.
In summary, our data suggest elevated hematocrit promotes arterial thrombosis. Effects are
independent of thrombin generation, but associated with accelerated platelet accumulation within the
thrombus. These findings suggest maintaining a normal hematocrit or reducing platelet function in
patients with elevated hematocrit may reduce arterial thrombosis risk.
For personal use only.on April 5, 2017. by guest www.bloodjournal.orgFrom
16
ACKNOWLEDGEMENTS
The authors thank Dr. Erica Sparkenbaugh for advice, James R. Byrnes for reading the manuscript, and
Kenzie S. McConnell for assistance with data processing.
AUTHORSHIP
Contributions: B.L.W. designed and performed experiments, analyzed and interpreted the data, and
wrote the manuscript; M.L., T.S., L.A.H., J.D.B., J.A.C., M.J.M., A.R.W. and B.C.C. performed
experiments and analyzed and interpreted the data; R.P. designed experiments; J.W.H. and M.R.F.
analyzed and interpreted the data; N.S.K., A.L.F., K.B.N., and A.S.W. designed the research, analyzed
and interpreted the data, and wrote the manuscript. All authors reviewed and approved the manuscript.
Conflict-of-interest: The authors declare no competing financial interests.
FUNDING
This study was supported by funding from the National Institutes of Health (R56HL094740 and
R01HL126974 to A.S.W., 1UL1TR001111 to NC TraCS/A.S.W., T32HL069768 and T32HL007149 to
the University of North Carolina, R01HL120728 to K.B.N. and A.L.F., and R01HL126864 to A.L.F.),
National Science Foundation CAREER Award (CBET-1351672 to K.B.N.) and grant (DMS-1521748 to
A.L.F.), American Heart Association (14GRNT20410094 to K.B.N.), and by the National Center for
Advancing Translational Sciences (NCATS).
For personal use only.on April 5, 2017. by guest www.bloodjournal.orgFrom
17
REFERENCES
1. Lowe GD, Lee AJ, Rumley A, Price JF, Fowkes FG. Blood viscosity and risk of cardiovascular
events: the Edinburgh Artery Study. Br J Haematol. 1997;96:168-173.
2. Pries AR, Neuhaus D, Gaehtgens P. Blood viscosity in tube flow: dependence on diameter and
hematocrit. Am J Physiol. 1992;263:H1770-1778.
3. Merrill EW. Rheology of Blood. Physiological Reviews. 1969;49:863-888.
4. Kwaan HC, Wang J. Hyperviscosity in polycythemia vera and other red cell abnormalities. Semin
Thromb Hemost. 2003;29:451-458.
5. Grabowski EF, Yam K, Gerace M. Evaluation of hemostasis in flowing blood. Am J Hematol.
2012;87 Suppl 1:S51-55.
6. Fogelson AL, Neeves KB. Fluid mechanics of blood clot formation. Annu Rev Fluid Mech.
2015;47:377-403.
7. Silvain J, Pena A, Cayla G, et al. Impact of red blood cell transfusion on platelet activation and
aggregation in healthy volunteers: results of the TRANSFUSION study. Eur Heart J. 2010;31:2816-
2821.
8. Santos MT, Valles J, Marcus AJ, et al. Enhancement of platelet reactivity and modulation of
eicosanoid production by intact erythrocytes. A new approach to platelet activation and recruitment.
J Clin Invest. 1991;87:571-580.
9. Valles J, Santos MT, Aznar J, et al. Platelet-erythrocyte interactions enhance alpha(IIb)beta(3)
integrin receptor activation and P-selectin expression during platelet recruitment: down-regulation
by aspirin ex vivo. Blood. 2002;99:3978-3984.
10. Turitto VT, Weiss HJ. Red blood cells: their dual role in thrombus formation. Science.
1980;207:541-543.
11. Kuypers FA, Lewis RA, Hua M, et al. Detection of altered membrane phospholipid asymmetry in
subpopulations of human red blood cells using fluorescently labeled annexin V. Blood.
1996;87:1179-1187.
12. Whelihan MF, Zachary V, Orfeo T, Mann KG. Prothrombin activation in blood coagulation: the
erythrocyte contribution to thrombin generation. Blood. 2012;120:3837-3845.
13. Peyrou V, Lormeau JC, Herault JP, Gaich C, Pfliegger AM, Herbert JM. Contribution of
erythrocytes to thrombin generation in whole blood. Thromb Haemost. 1999;81:400-406.
For personal use only.on April 5, 2017. by guest www.bloodjournal.orgFrom
18
14. Horne MK, 3rd, Cullinane AM, Merryman PK, Hoddeson EK. The effect of red blood cells on
thrombin generation. Br J Haematol. 2006;133:403-408.
15. Ninivaggi M, Apitz-Castro R, Dargaud Y, de Laat B, Hemker HC, Lindhout T. Whole-blood
thrombin generation monitored with a calibrated automated thrombogram-based assay. Clin Chem.
2012;58:1252-1259.
16. van Beers EJ, Schaap MC, Berckmans RJ, et al. Circulating erythrocyte-derived microparticles are
associated with coagulation activation in sickle cell disease. Haematologica. 2009;94:1513-1519.
17. Rubin O, Delobel J, Prudent M, et al. Red blood cell-derived microparticles isolated from blood
units initiate and propagate thrombin generation. Transfusion. 2013;53:1744-1754.
18. Mooberry MJ, Bradford R, Hobl EL, Lin FC, Jilma B, Key NS. Procoagulant microparticles promote
coagulation in a factor XI-dependent manner in human endotoxemia. J Thromb Haemost.
2016;14:1031-1042.
19. Sorlie PD, Garcia-Palmieri MR, Costas R, Jr., Havlik RJ. Hematocrit and risk of coronary heart
disease: the Puerto Rico Health Program. Am Heart J. 1981;101:456-461.
20. Erikssen G, Thaulow E, Sandvik L, Stormorken H, Erikssen J. Haematocrit: a predictor of
cardiovascular mortality? J Intern Med. 1993;234:493-499.
21. Gagnon DR, Zhang TJ, Brand FN, Kannel WB. Hematocrit and the risk of cardiovascular disease--
the Framingham study: a 34-year follow-up. Am Heart J. 1994;127:674-682.
22. Wannamethee G, Shaper AG, Whincup PH. Ischaemic heart disease: association with haematocrit in
the British Regional Heart Study. Journal of epidemiology and community health. 1994;48:112-118.
23. Sabatine MS, Morrow DA, Giugliano RP, et al. Association of hemoglobin levels with clinical
outcomes in acute coronary syndromes. Circulation. 2005;111:2042-2049.
24. Toss F, Nordstrom A, Nordstrom P. Association between hematocrit in late adolescence and
subsequent myocardial infarction in Swedish men. Int J Cardiol. 2013;168:3588-3593.
25. Paffett-Lugassy N, Hsia N, Fraenkel PG, et al. Functional conservation of erythropoietin signaling in
zebrafish. Blood. 2007;110:2718-2726.
26. Shibata J, Hasegawa J, Siemens HJ, et al. Hemostasis and coagulation at a hematocrit level of 0.85:
functional consequences of erythrocytosis. Blood. 2003;101:4416-4422.
27. Lamrani L, Lacout C, Ollivier V, et al. Hemostatic disorders in a JAK2V617F-driven mouse model
of myeloproliferative neoplasm. Blood. 2014;124:1136-1145.
For personal use only.on April 5, 2017. by guest www.bloodjournal.orgFrom
19
28. Strassel C, Kubovcakova L, Mangin PH, et al. Haemorrhagic and thrombotic diatheses in mouse
models with thrombocytosis. Thromb Haemost. 2015;113:414-425.
29. Broxmeyer HE. Erythropoietin: multiple targets, actions, and modifying influences for biological
and clinical consideration. J Exp Med. 2013;210:205-208.
30. Brines M, Cerami A. Discovering erythropoietin's extra-hematopoietic functions: biology and
clinical promise. Kidney international. 2006;70:246-250.
31. Choi D, Schroer SA, Lu SY, et al. Erythropoietin protects against diabetes through direct effects on
pancreatic beta cells. J Exp Med. 2010;207:2831-2842.
32. Hand CC, Brines M. Promises and pitfalls in erythopoietin-mediated tissue protection: are
nonerythropoietic derivatives a way forward? Journal of investigative medicine : the official
publication of the American Federation for Clinical Research. 2011;59:1073-1082.
33. Machlus KR, Cardenas JC, Church FC, Wolberg AS. Causal relationship between
hyperfibrinogenemia, thrombosis, and resistance to thrombolysis in mice. Blood. 2011;117:4953-
4963.
34. Walton BL, Getz TM, Bergmeier W, Lin F-C, Uitte de Willige S, Wolberg AS. The fibrinogen
gammaA/gamma' isoform does not promote acute arterial thrombosis in mice. J Thromb Haemost.
2014;12:680-689.
35. Crowl L, Fogelson AL. Analysis of mechanisms for platelet near-wall excess under arterial blood
flow conditions. J Fluid Mech. 2011;676:348-375.
36. Crowl LM, Fogelson AL. Computational model of whole blood exhibiting lateral platelet motion
induced by red blood cells. International journal for numerical methods in biomedical engineering.
2010;26:471-487.
37. Skorczewski T, Erickson LC, Fogelson AL. Platelet motion near a vessel wall or thrombus surface in
two-dimensional whole blood simulations. Biophys J. 2013;104:1764-1772.
38. Rana K, Timmer BJ, Neeves KB. A combined microfluidic-microstencil method for patterning
biomolecules and cells. Biomicrofluidics. 2014;8:056502.
39. Lehmann M, Wallbank AM, Dennis KA, et al. On-chip recalcification of citrated whole blood using
a microfluidic herringbone mixer. Biomicrofluidics. 2015;9:064106.
40. Wood BL, Gibson DF, Tait JF. Increased erythrocyte phosphatidylserine exposure in sickle cell
disease: flow-cytometric measurement and clinical associations. Blood. 1996;88:1873-1880.
For personal use only.on April 5, 2017. by guest www.bloodjournal.orgFrom
20
41. Gilson CR, Kraus TS, Hod EA, et al. A novel mouse model of red blood cell storage and
posttransfusion in vivo survival. Transfusion. 2009;49:1546-1553.
42. Marchioli R, Finazzi G, Specchia G, et al. Cardiovascular events and intensity of treatment in
polycythemia vera. N Engl J Med. 2013;368:22-33.
43. Kumar A, Graham MD. Mechanism of margination in confined flows of blood and other
multicomponent suspensions. Phys Rev Lett. 2012;109:108102.
44. Reasor DA, Jr., Mehrabadi M, Ku DN, Aidun CK. Determination of critical parameters in platelet
margination. Ann Biomed Eng. 2013;41:238-249.
45. Zhao H, Shaqfeh ES. Shear-induced platelet margination in a microchannel. Physical review E,
Statistical, nonlinear, and soft matter physics. 2011;83:061924.
46. Vahidkhah K, Diamond SL, Bagchi P. Platelet dynamics in three-dimensional simulation of whole
blood. Biophys J. 2014;106:2529-2540.
47. Stalker TJ, Welsh JD, Tomaiuolo M, et al. A systems approach to hemostasis: 3. Thrombus
consolidation regulates intrathrombus solute transport and local thrombin activity. Blood.
2014;124:1824-1831.
48. Wang W, Diacovo TG, Chen J, Freund JB, King MR. Simulation of platelet, thrombus and
erythrocyte hydrodynamic interactions in a 3D arteriole with in vivo comparison. PLoS One.
2013;8:e76949.
49. Landolfi R, Marchioli R, Kutti J, et al. Efficacy and safety of low-dose aspirin in polycythemia vera.
N Engl J Med. 2004;350:114-124.
50. Ruggeri ZM. Platelets in atherothrombosis. Nat Med. 2002;8:1227-1234.
51. Khorana AA, Francis CW, Blumberg N, Culakova E, Refaai MA, Lyman GH. Blood transfusions,
thrombosis, and mortality in hospitalized patients with cancer. Arch Intern Med. 2008;168:2377-
2381.
52. Setty BN, Rao AK, Stuart MJ. Thrombophilia in sickle cell disease: the red cell connection. Blood.
2001;98:3228-3233.
53. Fujita H, Sakuma R, Tomiyama J, et al. Increased phosphatidylserine exposure on the erythrocyte
membrane in patients with polycythaemia vera. Br J Haematol. 2011;152:238-240.
54. Borenstain-Ben Yashar V, Barenholz Y, Hy-Am E, Rachmilewitz EA, Eldor A. Phosphatidylserine
in the outer leaflet of red blood cells from beta-thalassemia patients may explain the chronic
hypercoagulable state and thrombotic episodes. Am J Hematol. 1993;44:63-65.
For personal use only.on April 5, 2017. by guest www.bloodjournal.orgFrom
21
55. Yasin Z, Witting S, Palascak MB, Joiner CH, Rucknagel DL, Franco RS. Phosphatidylserine
externalization in sickle red blood cells: associations with cell age, density, and hemoglobin F. Blood.
2003;102:365-370.
56. Barr JD, Chauhan AK, Schaeffer GV, Hansen JK, Motto DG. Red blood cells mediate the onset of
thrombosis in the ferric chloride murine model. Blood. 2013;121:3733-3741.
57. Ciciliano JC, Sakurai Y, Myers DR, et al. Resolving the multifaceted mechanisms of the ferric
chloride thrombosis model using an interdisciplinary microfluidic approach. Blood. 2015;126:817-
824.
58. Woollard KJ, Sturgeon S, Chin-Dusting JP, Salem HH, Jackson SP. Erythrocyte hemolysis and
hemoglobin oxidation promote ferric chloride-induced vascular injury. J Biol Chem.
2009;284:13110-13118.
59. Schoenwaelder SM, Jackson SP. Ferric chloride thrombosis model: unraveling the vascular effects
of a highly corrosive oxidant. Blood. 2015;126:2652-2653.
60. Neeves KB. Physiochemical artifacts in FeCl3 thrombosis models. Blood. 2015;126:700-701.
61. Jensen AS, Johansson PI, Idorn L, et al. The haematocrit--an important factor causing impaired
haemostasis in patients with cyanotic congenital heart disease. Int J Cardiol. 2013;167:1317-1321.
For personal use only.on April 5, 2017. by guest www.bloodjournal.orgFrom
22
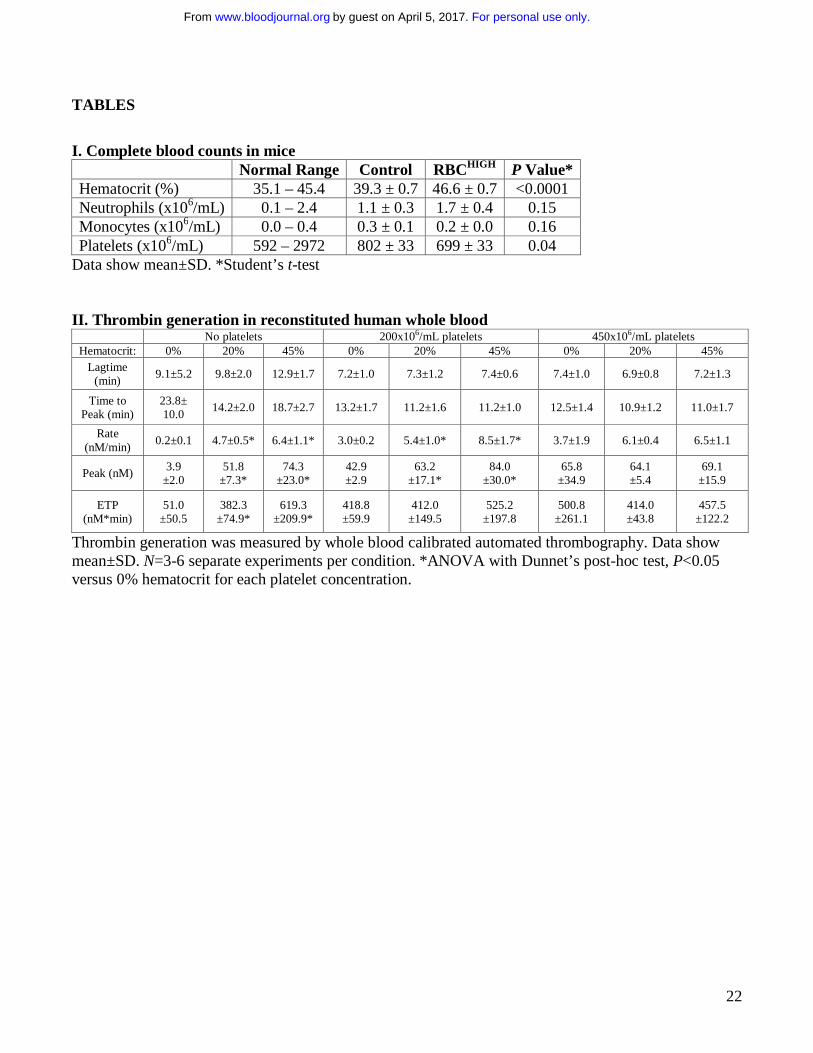
TABLES
I. Complete blood counts in mice Normal Range Control RBCHIGH P Value* Hematocrit (%) 35.1 – 45.4 39.3 ± 0.7 46.6 ± 0.7 <0.0001 Neutrophils (x106/mL) 0.1 – 2.4 1.1 ± 0.3 1.7 ± 0.4 0.15 Monocytes (x106/mL) 0.0 – 0.4 0.3 ± 0.1 0.2 ± 0.0 0.16 Platelets (x106/mL) 592 – 2972 802 ± 33 699 ± 33 0.04
Data show mean±SD. *Student’s t-test II. Thrombin generation in reconstituted human whole blood
No platelets 200x106/mL platelets 450x106/mL platelets Hematocrit: 0% 20% 45% 0% 20% 45% 0% 20% 45%
Lagtime (min)
9.1±5.2 9.8±2.0 12.9±1.7 7.2±1.0 7.3±1.2 7.4±0.6 7.4±1.0 6.9±0.8 7.2±1.3
Time to Peak (min)
23.8± 10.0
14.2±2.0 18.7±2.7 13.2±1.7 11.2±1.6 11.2±1.0 12.5±1.4 10.9±1.2 11.0±1.7
Rate (nM/min)
0.2±0.1 4.7±0.5* 6.4±1.1* 3.0±0.2 5.4±1.0* 8.5±1.7* 3.7±1.9 6.1±0.4 6.5±1.1
Peak (nM) 3.9
±2.0 51.8
±7.3* 74.3
±23.0* 42.9 ±2.9
63.2 ±17.1*
84.0 ±30.0*
65.8 ±34.9
64.1 ±5.4
69.1 ±15.9
ETP (nM*min)
51.0 ±50.5
382.3 ±74.9*
619.3 ±209.9*
418.8 ±59.9
412.0 ±149.5
525.2 ±197.8
500.8 ±261.1
414.0 ±43.8
457.5 ±122.2
Thrombin generation was measured by whole blood calibrated automated thrombography. Data show mean±SD. N=3-6 separate experiments per condition. *ANOVA with Dunnet’s post-hoc test, P<0.05 versus 0% hematocrit for each platelet concentration.
For personal use only.on April 5, 2017. by guest www.bloodjournal.orgFrom
23
FIGURES
Figure 1. Model of elevated hematocrit in mice. RBCs from “donor” mice were injected into
“recipient” mice (RBCHIGH) via retro-orbital plexus. After 24 hours, blood was drawn from RBCHIGH
and control (un-infused) mice. Complete cell counts indicate (A) elevated hematocrit, but normal (B)
neutrophil, (C) monocyte, and (D) platelet numbers. In A-D each dot is a separate mouse, lines indicate
median values, and boxes represent the normal range. (E) Blood smears of washed RBCs and whole
blood from control and RBCHIGH mice indicate normal RBC morphology. (F) Flow cytometry indicates
normal phosphatidylserine exposure on washed RBCs and RBCs isolated from control and RBCHIGH
mice. Bars indicate mean±SD, N=3. (G) Viscosity measurements show RBCHIGH mice (closed circles)
have significantly increased viscosity (Pascal-seconds, Pa.s) at low and high shear compared to control
mice (open circles). Symbols show mean±SD, N=3-5/group.
Figure 2. Compared to control mice, RBCHIGH mice have a shortened time to vessel occlusion. (A-
D) Control and RBCHIGH mice were subjected to FeCl3-induced carotid artery thrombosis. (A) Time to
vessel occlusion. When vessels did not occlude, time to occlusion was recorded as 20 min (3 control
mice). (B) Onset and (C) rate of thrombus formation in control (un-infused) and RBCHIGH mice. (D)
Control and RBCHIGH mice were treated with saline (baseline) or heparin and then subjected to tail
transection. Each dot or box is a separate mouse, boxes with stars represent mice that did not form clots.
Lines indicate median values, Wilcoxon 1-tailed comparison.
Figure 3. Following FeCl3 injury, control and RBCHIGH mice have similar thrombus morphology
and similar levels of circulating thrombin-antithrombin complexes (TATc). (A-B) Thrombi from a
subset of mice subjected to FeCl3-induced carotid artery thrombosis were excised, fixed in 10% formalin,
transferred to 70% ethanol, and analyzed. (A) Hematoxylin and eosin (H&E) staining (upper panels) and
immunohistochemistry for fibrin (brown staining, lower panels). Scale bars indicate 500 µm. (B)
Thrombus size was determined by measuring pixel area of the thrombus within the vessel. (C) TATc
were measured by ELISA in plasmas from control (un-infused) and RBCHIGH mice following FeCl3-
induced artery occlusion. (D) Relationship between hematocrit and TATc levels measured after FeCl3-
induced artery occlusion in control (open circles) and RBCHIGH (closed circles) mice. In B-D, each dot is
a separate mouse. In B-C, horizontal lines indicate medians.
For personal use only.on April 5, 2017. by guest www.bloodjournal.orgFrom
24
Figure 4. The effect of RBCs on thrombin generation depends on the endogenous platelet
concentration. Thrombin generation in reconstituted whole blood with varying hematocrit (HCT) and
platelets (Plts) was analyzed by calibrated automated thrombography. Hematocrits above 45% interfered
with the thrombin generation assay and could not be measured reproducibly. N=3-6 per condition, bars
represent mean peak thrombin±SD. *P<0.05, **P<0.005.
Figure 5. A computational model suggests elevated hematocrit increases the time that platelets
spend in proximity to a thrombus. Simulations of whole blood flow with 40% (A, C, E, G) and 60%
(B, D, F, H) hematocrit were conducted as described in Methods. (A-B) Snapshots showing
instantaneous positions of RBCs (red) and platelets (black) for (A) 40% and (B) 60% hematocrit in
flowing blood indicate RBCs are less prevalent close to vessel walls and platelets are more prevalent in
this near-wall RBC-depleted zone. (C-D) Time-average RBC distribution for flow past a small thrombus
(filled circles) in (C) 40% and (D) 60% hematocrit. The near-wall depleted zone is narrower in higher
hematocrit. Scale indicates relative RBC distribution. (E-H) Time-dependent progression (2-msec
intervals) of an individual platelet (blue) over a small or large thrombus (black circles): (E) 40%
hematocrit, small thrombus, (F) 60% hematocrit, small thrombus, (G) 40% hematocrit, large thrombus,
(H) 60% hematocrit, large thrombus. For both the small and large thrombus, the platelet spends
substantially more time near the thrombus for 60% hematocrit than for 40% hematocrit. Bars indicate 10
µm.
Figure 6. Elevated hematocrit increases the rate of platelet accumulation on collagen at an arterial
shear rate. Reconstituted whole blood was perfused over type I collagen at 750 sec-1. (A)
Representative images of thrombus surface coverage and platelet fluorescence 1.5 min after initiation of
flow. Scale bar indicates 50 µm. (B) Average thrombus area (normalized to collagen spot area as
fractional surface coverage) and individual thrombus lag times and rates for all experiments. (C)
Average platelet accumulation (integrated fluorescence intensity units [IFU] of DiOC6-labeled platelets)
and individual platelet lag times and rates for all experiments. N=7 independent donors per condition.
Values show mean±SD for 41% (open circles) and 54% (closed circles) hematocrit, lines indicate paired
data for individual blood donors.
For personal use only.on April 5, 2017. by guest www.bloodjournal.orgFrom
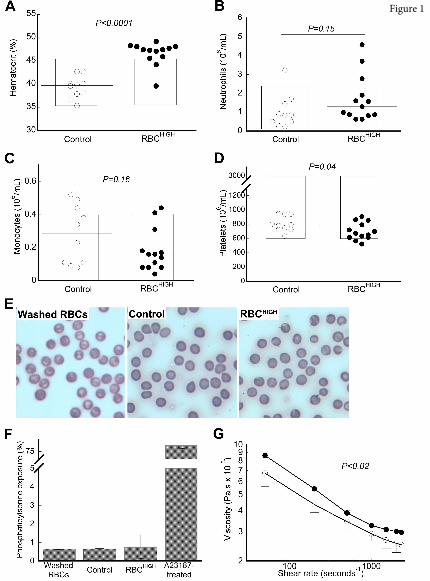
Figure 1
For personal use only.on April 5, 2017. by guest www.bloodjournal.orgFrom
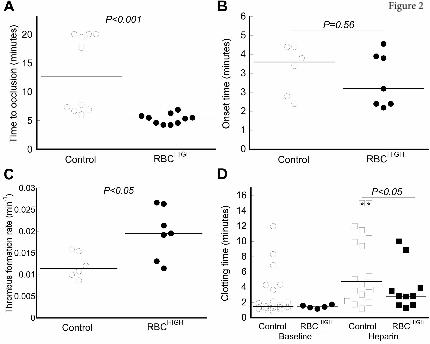
Figure 2
For personal use only.on April 5, 2017. by guest www.bloodjournal.orgFrom
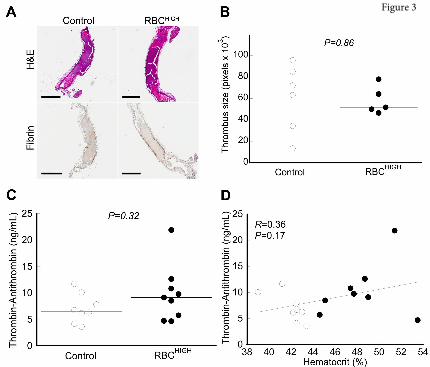
Figure 3
For personal use only.on April 5, 2017. by guest www.bloodjournal.orgFrom
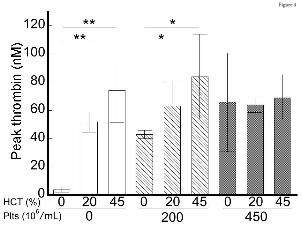
Figure 4
For personal use only.on April 5, 2017. by guest www.bloodjournal.orgFrom
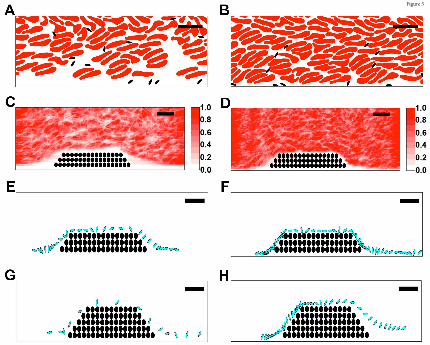
Figure 5
For personal use only.on April 5, 2017. by guest www.bloodjournal.orgFrom
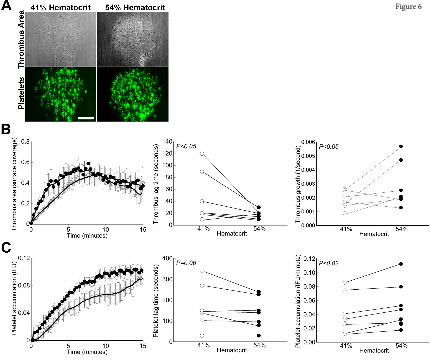
Figure 6
For personal use only.on April 5, 2017. by guest www.bloodjournal.orgFrom
doi:10.1182/blood-2016-10-746479Prepublished online March 1, 2017;
Michael R. Falvo, Nigel S. Key, Aaron L. Fogelson, Keith B. Neeves and Alisa S. WolbergCribb, Micah J. Mooberry, Adam R. Wufsus, Brian C. Cooley, Jonathan W. Homeister, Rafal Pawlinski, Bethany L. Walton, Marcus Lehmann, Tyler Skorczewski, Lori A. Holle, Joan D. Beckman, Jeremy A. injuryElevated hematocrit enhances platelet accumulation following vascular
http://www.bloodjournal.org/site/misc/rights.xhtml#repub_requestsInformation about reproducing this article in parts or in its entirety may be found online at:
http://www.bloodjournal.org/site/misc/rights.xhtml#reprintsInformation about ordering reprints may be found online at:
http://www.bloodjournal.org/site/subscriptions/index.xhtmlInformation about subscriptions and ASH membership may be found online at:
digital object identifier (DOIs) and date of initial publication. indexed by PubMed from initial publication. Citations to Advance online articles must include final publication). Advance online articles are citable and establish publication priority; they areappeared in the paper journal (edited, typeset versions may be posted when available prior to Advance online articles have been peer reviewed and accepted for publication but have not yet
Copyright 2011 by The American Society of Hematology; all rights reserved.Hematology, 2021 L St, NW, Suite 900, Washington DC 20036.Blood (print ISSN 0006-4971, online ISSN 1528-0020), is published weekly by the American Society of
For personal use only.on April 5, 2017. by guest www.bloodjournal.orgFrom