Embed Size (px)
Citation preview
HAL Id: hal-02400693https://hal.archives-ouvertes.fr/hal-02400693
Submitted on 5 Jun 2020
HAL is a multi-disciplinary open accessarchive for the deposit and dissemination of sci-entific research documents, whether they are pub-lished or not. The documents may come fromteaching and research institutions in France orabroad, or from public or private research centers.
L’archive ouverte pluridisciplinaire HAL, estdestinée au dépôt et à la diffusion de documentsscientifiques de niveau recherche, publiés ou non,émanant des établissements d’enseignement et derecherche français ou étrangers, des laboratoirespublics ou privés.
Elevational filtering and the evolution of planthoppers(Hemiptera, Fulgoromorpha) in Papua New Guinea
Paul Chatelain, Maxime Le Cesne, Marianne Elias, Eric Guilbert, AdelineSoulier-perkins
To cite this version:Paul Chatelain, Maxime Le Cesne, Marianne Elias, Eric Guilbert, Adeline Soulier-perkins. Eleva-tional filtering and the evolution of planthoppers (Hemiptera, Fulgoromorpha) in Papua New Guinea.Biotropica, Wiley, 2020, 52 (2), pp.313. �10.1111/btp.12710�. �hal-02400693�

PUBLISHED IN BIOTROPICA AS
Chatelain P, Le Cesne M, Elias M, Guilbert E, Soulier-Perkins A. 2020. Elevational filtering and the evolution of planthoppers (Hemiptera, Fulgoromorpha) in Papua New Guinea. Biotropica, 52(2):313-322, doi: 10.1111/btp.12710
Elevational filtering and the evolution of planthoppers (Hemiptera, Fulgoromorpha)
in Papua New Guinea
Chatelain Paul1, Le Cesne Maxime1, Elias Marianne2, Guilbert Eric1, Soulier-Perkins Adeline1
1Muséum national d’Histoire naturelle, Mécanismes adaptatifs et évolution, MECADEV-
UMR 7179 MNHN-CNRS, 57 rue Cuvier, CP 50, F-75005 Paris, France
2Muséum national d’Histoire naturelle, Institut de Systématique, Evolution, Biodiversité,
ISYEB- MNHN-CNRS-EPHE-Sorbonne Université Université des Antilles, 57 rue Cuvier, CP
50, F-75005 Paris, France
Abstract
Along elevational gradients, phylogenetic relatedness patterns constitute a considerable
source of information, and may shed light on ecological processes that structure
communities. This study focuses on community phylogenetic structure of planthoppers,
specifically the species-rich and abundant Fulgoromorpha families (Hemiptera,
Auchenorrhyncha), Cixiidae and Derbidae+Achilidae, along an elevational gradient on
Mount Wilhelm (Papua New Guinea). In order to assess the factors driving planthoppers
community composition, we recorded abundance data for planthoppers species at each
elevation and we generated a molecular phylogeny of the local species, using Bayesian
Inference. We analyzed 168 individuals representing 59 local morphospecies. Using a fully
resolved and well-supported phylogeny, we then investigated the phylogenetic structure of
the communities by performing a Spatial Analysis of Community Diversity. We show that
Cixiidae are phylogenetically clustered along the elevational gradient, whereas
Derbidae+Achilidae harbour a random structure, suggesting that local adaptation to
elevation shapes community structure of Cixiidae, but not that of Derbidae+Achilidae. Our
findings highlight the importance of phylogenies in the study of tropical elevational
gradients.
Key words: Achilidae; Cixiidae; community diversity; Derbidae; elevational gradient;
phylogenetic patterns; planthoppers; tropical rainforest

TROPICAL RAINFORESTS ARE GENERALLY RECOGNIZED AS BEING PART OF THE MOST BIODIVERSE
TERRESTRIAL ECOSYSTEMS ON EARTH, but they are also among the most threatened by human
land use. In order to maintain this tropical biodiversity, primary forests have to be kept in the
best state possible since there is no substitute (Gibson et al. 2011). Those diverse ecosystems can
be properly protected and managed only if the fauna and flora that compose them are better
known and if the underlying evolutionary processes, such as local adaptation and ecological
interactions, are documented and disentangled. As stated by Dioum in 1968 "In the end we will
conserve only what we love, we will love only what we understand, and we will understand only
what we are taught". However human activity and land use is not the only threat for biodiversity.
Climatic changes drastically impact biodiversity and tropical communities appear to be more
sensitive to temperature increases compared with temperate communities, especially in montane
environments because of sharp environmental variations over short spatial scales (Sheldon et al.
2011). Elevational gradients therefore represent an appropriate system for evaluating the
structure of species assemblages in a variable environment (see Graham et al. 2014), which in
turn may shed light on community response to environmental changes.
Elevational gradients have been widely studied (Rahbek 1995, 2005; McCain & Grytnes 2010;
Sanders et al. 2003; Mouquet et al., 2012; Manel et al. 2014; Lessard et al. 2016; Chatelain et al.
2018; Lefebvre et al. 2018), but incorporating phylogenetic information now allows to shed light
on specific processes that shape the structure of communities along such gradients (Graham &
Fine 2008; Graham et al. 2009; Pellissier et al. 2013; Chazot et al. 2014; Manel et al. 2014;
Lessard et al. 2016). Indeed, over the last two decades, phylogenetic information has been
increasingly incorporated into community ecology studies, either as a proxy for species’
ecological traits (ecophylogenetics, Webb et al. 2002, Cavender-Bares et al. 2009), to correct for
non-independence of co-occurring species in the analyses of species’ traits (e. g., Losos et al.
2003) or to detect particular patterns, such as phylogenetically non-random extinctions in
communities driven by climate changes (Thuiller et al. 2011). Species assemblages may be
mediated by random processes, such as dispersal, extinction and drift, and adaptive processes,
such as local adaptation or interactions with other species, which are themselves mediated by
traits. In practice, it is often difficult to know which traits are involved in such adaptive
processes. Ecophylogenetics (Webb et al. 2002) attempts to circumvent those limitations. The
rationale of ecophylogenetics is that, if traits are phylogenetically conserved, phylogenetic
structure should reflect trait structure, and therefore should inform on underlying processes that
shape community structure. If the main process acting on community structure is local
adaptation, leading to environmental filtering (i. e., the fact that only species with specific
adaptations can live in a given environment), co-occurring species are expected to share multiple
traits involved in local adaptation, and therefore to be more closely related than non-co-occurring
species. Such phylogenetic pattern is called phylogenetic clustering (Webb et al. 2002).
Conversely, if local adaptation is not important (for instance, at a scale where there is little
variation in environmental conditions) but competition between species is the main driver of
community structure, resulting in mutual competitive exclusion among species that use the same
resources, co-occurring species are expected to differ in many traits related to resource use, and
therefore to be less closely related than non-co-occurring species. Such phylogenetic pattern is
called phylogenetic overdispersion (Webb et al. 2002). Ecological processes can therefore be
inferred from phylogenetic patterns. Caution must be taken, however, because in some cases,
such as adaptive radiations across an environmental gradient, adaptive traits are not
phylogenetically conserved, and community phylogenetic overdispersion reflects adaptive
radiation (and therefore adaptation to a range of environmental conditions) rather than
competition. Here we use an ecophylogenetic approach to infer the main processes that shape
Hemiptera Fulgoromorpha insect community structure along an elevational gradient in Papua
New Guinea, on the Mount Wilhelm (4,509 meters high).
Papua New Guinea (PNG) is one of the countries with most preserved landscape, since three
quarters of the land are covered by native forest. It is one of the less explored areas in the world,
where biodiversity is suspected to be richest. In PNG, village communities own 97% of the land.
As such, they are important decision makers in the preservation on their lands. In Wanang and
Mount Wilhelm villages, ten clans have decided to be involved in conservation projects instead
of logging. Fieldwork for the present study was done on their lands. This study, on Hemiptera
Fulgoromorpha, is part of a large sampling effort to describe and analyze biodiversity patterns in
multiple organisms in the mount Wilhelm (Leponce et al. 2016).
Hemiptera Fulgoromorpha is a diverse group of phytophagous insects that depends on plant
species it feeds on. They have modified mouthparts allowing them to pierce and suck the sap of
the plant for most of them. Fulgoromorpha do not undergo complete metamorphosis and as such
the nymphs resemble the adults and generally have a similar diet. These insects feed and live on
their hostplants. Some are polyphagous and have a large range of possible hostplants but many
Fulgoromorpha depend on a few hostplants and can be highly specialized, thereby incurring a
strong dependence to the biotope in which their hostplants can be found. As such,
Fulgoromorpha species assemblages may vary with vegetation profile along environmental
gradient. In addition, hostplant use can incur competition among species, which may also impact
structure of species assemblages. Here we attempt to disentangle the impact of environmental
filtering (due to local adaptation) and competition by applying ecophylogenetics to
Fulgoromorpha communities from the Mount Wilhelm. Specifically, 1) if the phylogenetic
structure of communities is clustered (i. e., if co-occurring species are more closely related than
expected at random), this may indicate environmental filtering, possibly driven by elevation and
co-varying factors, such as vegetation; 2) if the phylogenetic structure of communities is
overdispersed (i. e., if co-occurring species are less closely related than expected at random), this
may indicate competitive exclusion; 3) if phylogenetic structure does not depart from neutral
expectation, no conclusion can be drawn. Indeed, such neutral structure could stem from neutral
processes, from competitive exclusion and environmental filtering cancelling out each other, or
simply from a lack of statistical power.
MATERIAL AND METHODS
STUDY SITES.—Fieldwork was conducted along an elevational transect following the east slope of
Mount Wilhelm in Papua New Guinea (5°44’14.89’’S, 145°19’56.13’’E to 5°47’27.23’’S,
145°3’29.58’’E). The elevational range extends from 200 to 3700 m, which represents the limit
of the forest. The vegetation zonation along the mountain slope shows successive flora profiles
and corresponds to changes in humidity and temperature. As described in Leponce et al. (2016),
the temperature decreased linearly, dropping 5.4 °C per 1000 m of increase in elevation, so the
mean temperature ranged between 27.4°C at 200 m and 8.6°C at 3700 m during the collecting
period. Under 1000 m, the rainfall is generally greater than 4000 mm/year and a mixed lowland
forest is observed where the Dipterocarpaceae are found (Appanah 1998) along with Fagaceae,
Nothofagaceae, Lauraceae, Cunoniaceae, Myristicaceae (Leponce et al. 2016). Between 1000
and 2500 m, the Lauraceae and Fagaceae tend to dominate. Then the Podocarpaceae become
increasingly abundant from 2500 to 3000 m. Finally, above 3000 m, the rainfall is less than 3400
mm/year and then the Cyatheaceae dominate with a few emerging Podocarpaceae and shrubs,
then appears a grassland above the tree line, around 3800 m.
INSECT SURVEY.—Insects were collected by malaise traps between October, 16th and November,
1st 2012 for the elevations 2200 m up to 3700 m, and between October, 25th and November, 10th,
2012 for the elevations 200 m up to 1700 m (Leponce et al. 2016). Eight elevations were
sampled every 500 meters along the elevational transect (from 200 m to 3700 m), and 4 traps
were positioned at each elevation, totalizing 32 collecting points covering the gradient.
Specimens were collected daily and preserved in 90% ethyl alcohol. The material was sorted to
family level for hemipteran suborder Auchenorrhyncha. A total of 3318 specimens representing
596 morphospecies were sorted.
To study the phylogenetic structure of communities we focused on the three most
abundant and rich planthoppers families (Auchenorrhyncha, Fulgoromorpha): Cixiidae,
Derbidae, and Achilidae respectively with 179, 116 and 72 specimens. All these collected
specimens were identified to morphospecies and their abundances were registered, yielding a
total dataset of 134 morphospecies for 367 individuals.
ALTITUDE RICHNESS ESTIMATIONS.—An estimation of the morphospecies richness at each
altitude was performed in order to evaluate how representative our sampling was, We used for
each altitude the number of specimens collected for each morphospecies. An individual-based
abundance rarefaction curve for each elevation (see Colwell et al. 2012) was performed, using
iNExtPD package in R (Hsieh et al. 2016). The S(obs), richness observed and S(est) richness
estimated are provided (using Chao1 estimator).
PHYLOGENY.—Two phylogenetic analyses were conducted, one containing all taxa for which we
obtained at least one molecular marker and a second, more restrictive, with at least two markers
obtained for each terminal. The analyses included respectively 118 and 65 terminals, comprising
112 and 59 of the 134 morphospecies species collected along the gradient, 2 specimens identified
at family level, a Tropiduchidae and a Meenoplidae (in-group), and Cicadella viridis,
Hindoloides bipunctata, Huaina inca, Locris rubra, (out-group). Sequences were imported from
GenBank for the four known species of the out-group (see Table 1 for accession numbers). We
used three molecular markers, namely the Cytochrome Oxydase subunit 1 (CO1, 658 bp), the
ribosomal 18S subunit (18S, 1359 bp) which was obtained with two set of primers and Histone 3
(H3, 340 bp), totalizing 2357 bp to generate a phylogeny.
DNA was extracted from one of the specimen legs and abdomen if needed, using
DNAeasy Tissue Kit (Qiagen Inc., Hilden, Germany) and according to manifacturer’s protocole.
Markers were obtained by PCR using either Taq Core Kit (Qiagen) and Taq-&-Load Mastermix
(MP Biomedicals Inc., Europe). The PCR cycling program includes an initial denaturation at
94°C for 10 min, denaturation of 30–40 cycles for 30s at 94°C, annealing for 30s at 45–52°C
depending of the primer set (see table 1), extension for 45s at 72°C, and a final extension for 10
min at 72°C. All PCR reactions included negative controls to detect any possible contamination.
Sequences were cleaned using Codoncode Aligner 6.0.2. They were aligned using
MAFFT v7.2015 (Katoh & Standley 2013) for non-coding sequences such as 18S and Muscle
3.8 (Edgar 2004) for coding sequences such as CO1 and H3.
Bayesian phylogenetic inferences were performed with BEAST v1.8.2 (Drummond & Rambaut
2007), using the following parameters: Birth-death process, a lognormal uncorrelated relaxed
clock, HKY model of substitution. Molecular data were partitioned by markers, each marker
being independent. Best substitution models were inferred using JMODELTEST 2.1.6 (Darriba
et al. 2012), and GTR+I+G was selected on the basis of AIC for all partitions. We ran a
100.000.000 chain length and applied a 25% burn-in.
SPATIAL ANALYSIS OF COMMUNITY DIVERSITY.—A spatial analysis of community diversity was
conducted with the spacodiR package in R (Hardy & Senterre, 2007, Hardy 2010, Eastman et al.
2011). The principle is that community phylogenetic structure can shed light on underlying
processes that shape those communities, such as environmental filtering and competition, by
assuming that the phylogeny of species is a proxy for traits involved in such ecological
processes. Phylogenetic variance is partitioned into α (within sites) and β (among sites)
component and tested using tree randomization and permutation tests (Hardy 2008). Four indices
expressing community differentiation among sites for species identity (Ist) and species
phylogeny (Pst, P*st and Πst) were calculated. Each index is calculated in the same way: (α-
component – β-component) / α-component. Ist measures the probability that two randomly
picked individuals belong to distinct species, and therefore corresponds to species turnover; Pst
is the mean phylogenetic distance between individuals; P*st is the mean phylogenetic distance
between individuals of distinct species; P*st > 0 indicates that communities are phylogenetically
clustered, which is consistent with habitat filtering, while P*st<0 indicates that communities are
phylogenetically overdispersed, which could be the result of similarity-limiting processes, such
as competition. Πst is the mean phylogenetic distance between species, without abundances
information and therefore analogue to Pst (Hardy & Senterre, 2007; Hardy & Jost, 2008). We
also used an additional metric, the Phylogenetic Abundance Deviation (PAD) (Hardy, 2008);
PAD = 1 – mean phylogenetic distance between distinct species weighted by the product of their
global abundances / mean phylogenetic distance between all sampled species. PAD describes
how species abundances are distributed across the phylogenetic tree.
To test the significance of the indices, we used permutation tests on the phylogeny (2-
sided test, 999 randomizations, Hardy 2008), permuting all sampled species 1) on the whole
phylogeny and 2) for two specified nodes: Cixiidae and Derbidae+Achilidae, in order to evaluate
their respective contribution to the whole signal. Those tests were done to statistically
discriminate random and clustering/overdispersion distributions. As the phylogenetic structure
can be due to elevational as well as geographical distance between sites, we also performed
Partial Mantel tests in order to disentangle the effects of elevational and geographic distances
between sites. Permutations were conducted with spacodiR and Partial Mantel tests were
conducted with R version 3.1.1 (R Core Team, 2014). Finally, Faith’s phylogenetic diversity
index PD (Faith 1992) was calculated for each site along with the mean pairwise phylogenetic
distance (MPD, see Webb et al. 2002).
RESULTS
This study targets three of the most numerous families in terms of specimens and morphospecies
for the Fulgoromorpha, the Cixiidae, Derbidae and Achilidae. After extraction of DNA from 134
specimens representing 134 morphospecies and performed amplification and sequencing for the
three markers selected 18S, CO1 and H3, we retained two sets of morphospecies. The first one
contained 112 morphospecies for which we obtained at least 1 marker and the second set
contained 59 species for which we obtained at least 2 of the 3 markers. The phylogenetic
analyses with the two sets of species resulted in two trees that have comparable topologies
despite some slight differences. However, for the 118 (112 + 6) taxa tree neither the Cixiidae,
Achilidae or Derbidae appear as monophyletic lineages whereas for the 65 (59 + 6) taxa tree, the
Cixiidae are clearly monophyletic. Here we present the results based on the phylogeny
containing 65 terminals, since it is better supported (Figure 1). Sites elevation, locations and
species richness observed and estimated are given in Table 2. We provide in the supplementary
information the less robust 118 terminals phylogeny along with the results obtained when using
it for the spatial analysis of community diversity (Figure 2 and Tables 5 and 6). These results are
very similar to those obtained for the 65 terminals phylogeny.
Estimated richness roughly decreases with elevation from 700m to 3700m. it peaks at elevations
between 700 and 1200m, followed by 200m, elevations between 1700 and 3200m, and is lowest
at 3700m. Estimated richness differs mainly from observed richness by a higher value at 200m,
probably due to bigger abundances sampled. Faith’s PD tends to decrease with elevations (Table
2), with three classes of values (PD>200 below 2200m, 100<PD<200 between 2200m and
3200m, and PD<50 above 3700m). This pattern is partly driven by species richness (PD
mechanically increases as more species are added). MPD shows high values for 2200m, 2700m,
and 3700m for which species richness is low. The rarefaction curves obtained for each elevation
showed an asymptotic trend for elevation above 1700m (Figures 3, in the supplementary
information).
PHYLOGENETIC ANALYSIS.—The in-group in the phylogeny is divided in two main clades, one
that includes all the Cixiidae, another that groups the Derbidae and the Achilidae, except the
terminal Derbidae 44, which is found basal to the two main clades (Figure 1). The position of the
terminal Derbidae 44 is dubious and not expected. In the second clade, the Derbidae and the
Achilidae form two clades, except for one Achilidae (Achilidae 58) that is basal to both clades.
The Meenoplidae specimen is also found basal and sister to all Derbidae + Achilidae to the
exclusion of Derbidae 44. The Tropiduchidae is included in the clade Derbidae + Achilidae and
sister to the terminal Achilidae 89. The position of the Meenoplidae, the Tropiduchidae and the
distribution of Achilidae and Derbidae are however congruent with the known phylogenetic
relationships within Hemiptera for the sub-order Fulgoromorpha (Urban & Cryan 2007), as
Achilidae and Derbidae are not monophyletic and the relationships between these groups remain
unclear. The Cixiidae appear monophyletic, like in Urban & Cryan’s phylogeny (2007).
In the two main clades the terminals show two different distributions according to the elevational
range. The sister morphospecies of Achilidae + Derbidae tend to inhabit different elevational
ranges, whereas the sister morphospecies of Cixiidae tend to share the same elevational range. At
least four minor clades show this trend.
COMMUNITY PHYLOGENETIC STRUCTURE.—Across the entire dataset, the probability that two
individuals from the same site belong to distinct species is Diα = 0.8157, the probability that two
individuals from different sites belong to distinct species is Diβ = 0.9910. Ist is 0.1769 meaning
that individuals from the same species are found more often in the same sites than in different
sites (species clustering).
The mean phylogenetic distance between individuals from the same site is Dpα =
27.9510, the mean phylogenetic distance between individuals from different sites is Dpβ =
39.3906. Pst is 0.2904 (p=0.0230), meaning that phylogenetic proximity between individuals is
globally higher within sites than among sites (phylogenetic clustering).
The mean phylogenetic distance between individuals of distinct species from the same site is
Dp*α = 33.3009, the mean phylogenetic distance between individuals of distinct species from
different sites is Dp*β = 39.7030. P*st is 0.1612 (p= 0.0150), meaning that phylogenetic
proximity between individuals of distinct species is globally higher within sites than among sites.
The mean phylogenetic distance between species from the same site is DELTAα = 36.8037, the
mean phylogenetic distance between species from different sites is DELTAβ = 40.0013. Πst is
0.0799 (p=0.1470), meaning that phylogenetic proximity between species is globally higher
within sites than among sites, but not significantly so.
Only Pst and P*st differ statistically from the simulated values (Table 3) for the whole
sample. For each clade taken individually, Pst is significantly different for Cixiidae, (0.2503,
p=0.0390) but not for Achilidae + Derbidae (0.2809, p=0.3270). So the phylogenetic clustering
detected in the entire dataset is driven by Cixiidae.
The phylogenetic abundance deviation for each case is positive, meaning that abundances
are phylogenetically clustered even if the values are low (Table 3).
ELEVATIONAL FILTERING.—Partial Mantel tests for Pst and P*st values were performed to test for
correlations between elevational distances and pairwise Pst and P*st while accounting for
geographic distances, and vice-versa. No significant correlations were found for the whole
phylogeny (Table 4) between phylogenetic distances and elevational or geographic distance. So
we could not discriminate the effects of elevational and geographic distances. However,
phylogenetic distances were significantly correlated with elevation for Cixiidae but not with
geographic distance, when geography (resp. elevation) is accounted for. In Derbidae+Achilidae
correlations are not significant.
Hence, the phylogenetic clustering can be interpreted as an elevational filtering acting on
Cixiidae but not on Derbidae + Achilidae.
DISCUSSION
In this study, we generated a phylogeny of the Cixiidae, Derbidae and Achilidae collected along
an elevational gradient in the Mount Wilhelm, PNG, to infer the processes that shape species
assemblages from phylogenetic patterns. We selected those three families because they were the
three most abundant and species-rich Fulgoromorpha groups represented in the collected
material (Le Cesne et al. 2015). Therefore, we could expect them to be numerous enough to
bring to light a pattern within the phylogenetic structure if any was to be observed. It was all the
more essential to make such a choice as the collecting time in the field was limited and the
diversity collected was only partially representative of the species number living along this
altitudinal gradient. The tree topologies obtained with the two sets of data (with at least one
marker, and with at least two markers) were similar, and led to similar results.
PHYLOGENY OF MOUNT WILHELM SPECIES AND FULGOROMORPHA SYSTEMATICS.—According to
the current systematics of Fulgoromorpha, Cixiidae and their sister group Delphacidae are basal
to Fulgoromorpha (Bourgoin et al. 1997; Urban & Cryan 2007). The next branch leads to
Meenoplidae+Kinnaridae, then to Derbidae, Achilidae and Achilixiidae, for which the
relationships are still unclear, while Tropiduchidae appear within the most recent lineages of the
Fulgoromorpha (Urban & Cryan 2007). Our results, in terms of tree topology and relationships
among the Fulgoromorpha, fit well with the current systematics (Urban & Cryan 2007). While
monophyly of Cixiidae is confirmed, the Achilidae and the Derbidae are not monophyletic in our
phylogeny. The position of the Meenoplidae terminal as sister to the clade Achilidae+Derbidae
(except for the Derbidae 44) is congruent with the results of Urban & Cryan (2007). The position
of the Tropiduchidae included in a clade of Achilidae is not expected but could logically result
from the taxon set, which lacks representatives of other groups of Fulgoromorpha.
PHYLOGENETIC CLUSTERING IN CIXIIDAE AND ELEVATIONAL FILTERING.—We found an overall
pattern of phylogenetic clustering in our Fulgoromorpha dataset, but this was in fact driven by
the Cixiidae. The phylogenetic structure of Derbidae+Achilidae did not depart from random
expectation. Examination of the phylogenetic structure in relation with elevation further showed
that the phylogenetic clustering found in Cixiidae was likely due to elevational filtering, whereby
closely related species, which likely share many traits involved in adaptation to elevation-
dependant conditions, such as vegetation and temperature, tend to co-occur within elevational
bands. The contrasting results between Cixiidae and Derbidae+Achilidae may stem from
different life-histories, with different dependence on elevation. Among the Fulgoromorpha
Cixiidae is one of the largest family, most diverse in the warm-temperate and tropical regions but
that can reach the Arctic Circle for a few species (Bartlett et al. 2018). Nymphs are sub-terranean
root-feeders and adults are usually found above ground on various dicotyledonous and often
woody plants. The host range of nymphs may in fact be narrower than for the adults, simply
because of roots accessibility (Nickel 2003) but compared to other families of Fulgoromorpha
the percentage of polyphagous species is higher (Holzinger et al. 2002). However a better
knowledge of host plants is only available for species from Europe, New Zealand and North
America. For the tropics most of the Cixiidae host plants remain unknown except for some
occasional study such as Attié et al. (2008) in the Mascarene Islands. In the Mascarene
archipelago, host plant preferences present a disparity between islands and the Cixiidae can be
mainly monophagous and linked to Rubiaceae. The Derbidae are the third largest family of
Fulgoromorpha and are much more diverse in tropical than in temperate regions (Bartlett et al.
2018). Immatures are believed to be subterranean fungus feeders. Similarly to the Achilidae, the
biological importance of adult host associations is not clear. The Achilidae are diverse in the
tropics but are also common at higher latitudes and elevations (O’Brien 2002). The central
European species are reported to live, as nymphs and adults, in fissures and under the bark of
dead tree trunks, feeding on hyphae of fungi (Wilson et al., 1994; O’Brien 2002; Nickel 2003).
Although the degree of host specialisation is unknown in our groups in Mount Wilhelm,
difference in host use (plant roots for nymphs of Cixiidae versus fungal hyphae for Achilidae and
Derbidae) could explain the contrasted phylogenetic patterns detected in those groups, and this
deserves closer investigation in the future.
Other organisms show varying patterns of phylogenetic structure in both temperate and
tropical ecosystems, and one of the main drivers put forward is temperature. Machac et al. (2011)
studied phylogenetic patterns of ant species assemblages along an elevation gradient in three
temperate montane systems, documenting contrasting patterns of overdispersion – suggesting
competition – in ant communities at higher elevations, and clustering at lower elevations,
suggesting environmental filtering likely driven by temperature in this case. Temperature is also
one of the most important parameters segregating community assemblages in the temperate Alp
Mountains for pollinating Diptera (Lefebvre et al. 2018) and for butterflies (Pellissier et al.
2013). In both cases higher elevations entail lower temperatures that filter community
assemblages, leading to the presence of closely related species. Similar results have been found
with Angiosperm species assemblages in Changbaishan (China) (Qian et al. 2014). Similarly,
Lessard et al. (2016) found that in hummingbird communities across South America
temperature—but not precipitation or dispersal limitation—acts as the main regional filter of
assemblage structure.
The main structuring forces may vary depending on the elevation considered. In bee
communities along an elevational gradient in the Alps in Germany, species assemblages at high
elevations is dominated by environmental filtering effect, whereas the relative importance of
competition increases at low elevations (Hoiss et al. 2012). In tropical habitats, Graham et al.
(2009) and Pellissier et al. (2012) found that hummingbird and bumblebee communities,
respectively, tended to be phylogenetically clustered at high elevations and overdispersed at low
elevations, while Chazot et al. (2014) found that phylogenetic clustering increased with elevation
in neotropical butterfy communities. Furthermore, in their study involving several taxa, Bryant et
al. (2008) found that microbial communities were phylogenetically clustered over all elevations,
whereas plants tended to be increasingly phylogenetically overdispersed at higher elevations.
The contrasting results reported in these studies suggest that different taxa have different
thresholds at which abiotic factors have a filtering effect (Machac et al 2011). For instance,
because butterflies are of tropical origin and tend to show climatic niche conservatism (Hawkins
2010), only a restricted number of lineages have adapted to colder environments and are able to
survive at high elevations, as shown in Pellissier et al. (2013) and Chazot et al. (2014).
The diversity of results among studies, and even within studies, suggests that no single
mechanism is responsible for all elevational diversity gradients (Sanders & Rahbek 2012).
CONCLUSION
Our study shows phylogenetic clustering with elevation for the Cixiidae, perhaps driven by tight
interactions of species in this family to hostplant along the elevational gradient. We cannot rule

out that other factors, such as temperature or precipitations, are also playing a role in filtering
species assemblages. Since plants are almost unknown in the targeted region a good proxy would
be to analyze adaptive traits such as rostrum morphology, as species sharing similar traits are
expected to compete for similar resources (Weiher & Keddy 1995). Although we hope this work
should stimulate further studies, it is only a first (but necessary) step towards a greater
understanding of tropical diversity patterns and the underlying processes that shape insect
communities. Clearly, a more thorough taxonomic knowledge is urgent and needed if we want to
be able to manage all taxonomic levels and elaborate evolutionary scenarios.
AKNOWLEDGEMENTS
We are in debt to the Department of Environment and Conservation of Papua New Guinea,
which allowed us to export under the permit number 012297 the specimens collected during the
field session that was conducted under the framework of “Our Planet Reviewed Papua-New-
Guinea 2012–2013” supported by Pro-Natura International, the National Museum of Natural
History (MNHN, France), the Institut de Recherche pour le Développement (IRD, France) in
partnership with the Royal Belgian Institute of Natural Sciences, the New Guinea Binatang
Research Center, the University of Papua New Guinea, and the Divine Word University of
Madang and with core funding of Prince Albert II of Monaco Foundation, the Stavros Niarchos
Foundation, the Total Foundation, the Fondation d’entreprise EDF, the Fonds Pacifique,
Spiecapag, Entrepose Contracting, the New-Caledonia Government, the Reef Foundation and the
Belgian National Lottery. Funds were provided for the master 2 allowance and the molecular
work throughout the ATM Génomique et Collections under the project “Structuration des
communautés d’Hémiptères en Papouasie-Nouvelle-Guinée”. Thank you to Thiffaine Devaux,
who conducted part of the molecular work. Last but not least, a special thanks to Maurice
Leponce and Vojtech Novotny without whom the fieldwork would not have been possible.
LITERATURE CITED
APPANAH, S. 1998. Chapter 8: Management of natural forests. In: S. Appanah & J. M. Turnbull
(Eds). A review of Dipterocarps: Taxonomy, ecology and silviculture, 220 pp. 133–149.
Center for International Forestry Research, Bogor, Indonesia.
ATTIÉ, M., T. BOURGOIN, J. VESLOT AND A. SOULIER-PERKINS. 2008. Patterns of trophic
relationships between planthoppers (Hemiptera: Fulgoromorpha) and their host plants on the
Mascarene Islands. J. Nat. Hist., 42: 1591–1638
BARTLETT, C. R., L. L. DEITZ, D. A. DMITRIEV, A. F. SANBORN, A. SOULIER-PERKINS & M.S.
WALLACE. 2018. Chapter 19: The diversity of the true Hoppers (Hemiptera:
Auchenorrhyncha). In R.G. Foottit & P.H. Adler (Eds). Insect Biodiversity: Science and
Society volume II, 987 pp. 501–590. John Wiley & Sons Ltd., New York, US.
BOURGOIN, T., J. D. STEFFEN-CAMPBELL AND B. C. CAMPBELL. 1997. Molecular phylogeny of
Fulgoromorpha (Insecta, Hemiptera, Archaeorrhynca). The enigmatic Tettigometridae:
Evolutionary affiliations and Historical biogeography. Cladistics 13: 207–224.
BRYANT, J. A., C. LAMANNA, H. MORLON, A. J. KERKHOFF, B. J. ENQUIST, AND J. L. GREEN.
2008. Microbes on mountainsides: contrasting elevational patterns of bacterial and plant
diversity. ! Proc. Natl Acad. Sci. USA 105: 11505 –11511.
CAVENDER-BARES, J., K. KOZAK, P. V. A. FINE AND S. W. KEMBEL. 2009. The merging of
community ecology and phylogenetic biology. Ecol. Lett. 12: 693 –715
CHATELAIN, P., A. PLANT, A. SOULIER-PERKINS, AND C. DAUGERON. 2018. Diversity increases
with elevation: empidine dance flies (Diptera, Empididae) challenge a predominant pattern.
Biotropica 50: 633–640. DOI 10.1111/btp.12548
CHAZOT, N., K. R. WILLMOTT, P. G. SANTACRUZ ENDARA, A.TOPOROV, R. I. HILL, C. D. JIGGINS
AND M. ELIAS 2014. Mutualistic Mimicry and Filtering by Altitude Shape the Structure of
Andean Butterfly Communities. Am. Nat. 183: 26–39.
COLGAN, D. J., A. MCLAUCHLAN, G. D. F. WILSON, S. LIVINGSTON, G. D. EDGECOMBE, J.
MACARANAS, G. CASSIS, AND M. R. GRAY. 1998. Histone H3 and U2 snRNA sequences and
arthropod molecular evolution. Aust. J. Zool. 46: 419–437.
COLWELL, R.K., A. CHAO, N. J. GOTELLI, S.-Y. LIN, C. X. MAO, R. L. CHAZDON AND J. T.
LONGINO. 2012. Models and estimators linking individual-based and sample- based
rarefaction, extrapolation and comparison of assemblages. J. Plant Ecol. 5: 3–21.
DARRIBA, D., G. L. TABOADA, R. DOALLO AND D. POSADA. 2012. jModelTest 2: more models,
new heuristics and parallel computing. Nat. Methods, 9: 772.
DIOUM, B. 1968. Paper presented at the General Assembly of the International Union for the
Conservation of Nature and Natural Resources, New Delhi. Seattle Public Library Archive.
DRUMMOND, A. J., AND A. RAMBAUT. 2007. BEAST: Bayesian evolutionary analysis by
sampling trees. BMC Evolutionary Biol. 7: 214.
EASTMAN, J.M., PAINE, C.E.T. AND O. HARDY, 2011. spacodiR: structuring of phylogenetic
diversity in ecological communities. Bioinformatics 27: 2437–2438.
EDGAR, R. C. 2004. MUSCLE: multiple sequence alignment with high accuracy and high
throughput. Nucleic Acids Res. 32: 1792–97.
FAITH, D. 1992. Conservation evaluation and phylogenetic diversity. Biol. Conserv. 61(1): 1–10.
FOLMER, O, M. BLACK, W. HOEH, R. LUTZ AND R. VRIJENHOEK. 1994. DNA primers for
amplification of mitochondrial cytochrome c oxidase subunit I from diverse metazoan
invertebrates. Mol. Mar. Biol. Biotechnol. 3: 294–9.
GIBSON, L., T. M. LEE, L. P. KOH, B. W. BROOK, T. A. GARDNER, J. BARLOW, C. A. PERES, C. J.
A. BRADSHAW, W. F. LAURANCE, T. E. LOVEJOY AND N. S. SODH. 2011. Primary forests are
irreplaceable for sustaining tropical biodiversity. Nature 478: 378–383.
GRAHAM, C. H. AND P. V. A. FINE. 2008. Phylogenetic beta diversity: linking ecological and
evolutionary processes across space in time. Ecol. Lett. 11: 1265–1277.
GRAHAM, C. H., PARRA, J. L., RAHBEK, C. AND J. A. MCGUIRE. 2009. Phylogenetic structure in
tropical hummingbird communities. Proc. Natl Acad. Sci. USA 106: 19673–19678.
GRAHAM, C., A. CARNAVAL, C. D. CADENA, K. ZAMUDIO, T. ROBERTS, J. L. PARRA, C. MCCAIN,
R. BOWIE, C. MORITZ, S. BAINES, C. SCHNEIDER, J. VANDERWAL, C. RAHBEK, K. KOZAK, AND
N. SANDERS. 2014. The origin and maintenance of montane diversity: integrating evolutionary
and ecological processes. Ecography 37: 711–719.
HARDY, O. J. 2008. Testing the spatial phylogenetic structure of local communities: statistical
performances of different null models and test statistics on a locally neutral community. J.
Ecol. 96: 914–926.
HARDY, O. j. 2010. SPACoDi 0.10: a program for Spatial & Phylogenetic Analysis of
Community Diversity. http://ebe.ulb.ac.be/ebe/Software.html
HARDY, O. J. AND B. SENTERRE. 2007. Characterizing the phylogenetic structure of communities
by an additive partitioning of phylogenetic diversity. J. Ecology 95: 493–506.
HARDY, O. J. AND L. JOST. 2008. Interpreting and estimating measures of community phylogenetic
structuring. J. Ecol. 96: 849–852.
HAWKINS, B. A. 2010. Multiregional comparison of the ecological and phylogenetic structure of
butterfly species richness gradients. J. Biogeogr. 37: 647–656.
HOISS, B., J. KRAUSS, S. G. POTTS, S. ROBERTS, AND I. STEFFAN-DEWENTER. 2012. Altitude acts
as an environmental filter on phylogenetic composition, traits and diversity in bee
communities. Proc. R. Soc. B Biol. Sci. 279: 4447–4456.
HOLZINGER, W. E., A. F. EMELJANOV AND I. KAMMERLANDER. 2002. The family Cixiidae
Spinola, 1839 (Hemiptera: Fulgoromorpha) - a review. Denisia 4: 113–138.
HSIEH, T. C., K. H. MA AND A. CHAO. 2016. iNEXT: an R package for rarefaction and
extrapolation of species diversity (Hill numbers) Methods Ecol. Evol. 7: 1451–1456.
KATOH, K. AND D. M. STANDLEY. 2013. MAFFT multiple sequence alignment software version 7
: improvements in performance and usability. Mol. Biol. Evol. 30:772–780.
LE CESNE, M., S. W. WILSON AND A. SOULIER-PERKINS. 2015. Elevational gradient of Hemiptera
(Heteroptera, Auchenorrhyncha) on a tropical mountain in Papua New Guinea. PeerJ, 3:e978;
DOI 10.7717/peerj.978
LEFEBVRE, V., C. VILLEMANT, C. FONTAINE AND C. DAUGERON. 2018. Altitudinal, temporal and
trophic partitioning of flower-visitors in Alpine communities. Sci. Rep. 8: 4706.
DOI:10.1038/s41598-018-23210-y
LEPONCE M., V. NOVOTNY , O. PASCAL, T. ROBILLARD, F. LEGENDRE, C. VILLEMANT, J.
MUNZINGER, J.-F. MOLINO, R. DREW, F. ODEGAARD, J. SCHMIDL, A. TISHECHKIN, K. SAM, D.
BICKEL, C. DAHL, K. DAMAS, T. M. FAYLE, B. GEWA, J. JACQUEMIN, M. KELTIM, P. KLIMES,
B. KOANE, J. KUA, A. MANTILLERI, M. MOGIA, K. MOLEM, J. MOSES, H. NOWATUO, J.

ORIVEL, † J.-F. PINTAUD, ROISIN Y., L. SAM, B. SIKI , L. SOLDATI, A. SOULIER-PERKINS, S.
TULAI, J. YOMBAI, C. WARDHAUGH AND Y. BASSET. 2016. Land module of Our Planet
Reviewed - Papua New Guinea: aims, methods and first taxonomical results, 11-48. In:
Insects of Mount Wilhelm Papua New Guinea. Robillard T., Legendre F., Villemant C. &
Leponce M. (eds), Mémoires du muséum national d’Histoire naturelle, Tome 209, Paris,
France, 573p.
LESSARD, J. P., B. G. WEINSTEIN, M. K. BORREGAARD, K. A. MARSKE, D. R. MARTIN, J. A.
MCGUIRE, J. L. PARRA, C. RAHBEK, AND C. H. GRAHAM. 2016. Process-Based Species Pools
Reveal the Hidden Signature of Biotic Interactions Amid the Influence of Temperature
Filtering. Am. Nat. 187: 75–88.
LOSOS, J. B., M. LEAL, R. E. GLOR, K. DE QUEIROZ, P. E. HERTS, L. RODRIGUEZ SCHETTINO, A. C.
LARA, T. R. JACKMAN AND A. LARSON. 2003. Niche lability in the evolution of a Caribbean
lizard community. Nature 424(6948): 542–545.
MACHAC, A., M. JANDA AND R. R. DUNN. 2011. Elevational gradients in phylogenetic structure
of ant communities reveal the interplay of biotic and abiotic constraints on diversity.
Ecography 34: 364–71. doi: 10.1111/j.1600-0587.2010.06629.x
MANEL S., R. COUVREUR, F. MUNOZ, O. HARDY, P. COUTERON AND B. SONKE. 2014.
Characterizing the phylogenetic tree community structure of a protected tropical rain forest
area in Cameroon. Plos One, 6:e98920.
MCCAIN, C. M. AND J. GRYTNES. 2010. Elevational gradients in species richness. In R. Jonsson
(Ed.), Encyclopedia of life sciences. John Wiley and Sons, pp. 1–10.
MOUQUET, N., V. DEVICTOR, C. N. MEYNARD, F. MUNOZ, L. F. BERSIER, J. CHAVE, P. COUTERON,
A. DALECKY, C. FONTAINE, D. GRAVEL, O. J. HARDY, F. JABOT, S. LAVERGNE, M. LEIBOLD, D.
MOUILLOT, T. MÜNKEMÜLLER, S. PAVOINE, A. PRINZING, A. S. L. RODRIGUES, R. P. ROHR, E.
THÉBAULT AND W. THUILLER. 2012. Ecophylogenetics: advances and perspectives. Biol. Rev.
87: 769–785.
NICKEL, H. 2003. The Leafhoppers and Planthoppers of Germany (Hemiptera,
Auchenorrhyncha): Patterns and Strategies in a Highly Diverse Group of Phytophagous
Insects, 460 pp. Pensoft Publishers, Sofia, Bulgaria.
O’BRIEN, L. B. 2002. The wild wonderful world of Fulgoromorpha. Denisia 4: 83–102.
PELLISSIER, L, N. ALVAREZ, A. ESPÍNDOLA, J. POTTIER, A. DUBUIS, J. N. PRADERVAND AND A.
GUISAN. 2013. Phylogenetic alpha and beta diversities of butterfly communities correlate with
climate in the western Swiss Alps. Ecography. doi:10.1111/j.1600-0587.2012.07716.x.
PELLISSIER, L., K. FIEDLER, C. NDRIBE, A. DUBUIS, J. N. PRADERVAND, A. GUISAN AND S.
RASMANN. 2012. Shifts in species richness, herbivore specialization, and plant resistance
along elevation gradients. Ecol. Evol. 2: 1818–1825.
QIAN, H., H. ZHANQING AND J. ZHANG. 2014 Phylogenetic structure and phylogenetic diversity of
angiosperm assemblages in forests along an elevational gradient in Changbaishan, China. J.
Plant Ecol. 7: 154–165. doi:10.1093/jpe/rtt072
R CORE TEAM. 2014. R: A language and environment for statistical computing. R Foundation for
Statistical Computing, Vienna, Austria.
RAHBEK, C. 1995. The elevational gradient of species richness: a uniform pattern? Ecography 18:
200–205.
RAHBEK, C. 2005. The role of spatial scale and the perception of large-scale species richness
patterns. Ecol. Lett. 8: 224–239.
SANDERS, N. J. AND C. RAHBEK. 2012. The patterns and causes of elevational diversity gradients.
Ecography 35: 1–3.
SANDERS, N. J., J. MOSS AND D. WAGNER. 2003. Patterns of ant species richness along
elevational gradients in an arid ecosystem. Glob. Ecol. Biogeogr. 12: 93–102.
SHELDON, K. S., S. YANG AND J. J. TEWKSBURY. 2011. Climate change and community
disassembly: impacts of warming on tropical and temperate montane community structure.
Ecol. Lett. 14: 1191–1200. doi: 10.1111/j.1461-0248.2011.01689.x
THUILLER, W., S. LAVERGNE, C. ROQUET, I. BOULANGEAT AND M. B. ARAUJO. 2011.
Consequences of climate change on the Tree of Life in Europe. Nature 470: 531–534.
URBAN, J. M., AND J. R. CRYAN. 2007. Evolution of the planthoppers (Insecta: Hemiptera:
Fulgoroidea). Mol. Phyl. Evol. 42: 556–572.
WEBB, C. O., D. D. ACKERLY, M. A. MCPEEK AND M. J. DONOGHUE. 2002. Phylogenies and
community ecology. Annu. Rev. Ecol. Evol. Syst. 33:475-505.
WEIHER, E. AND P. A. KEDDY. 1995. Assembly rules, null models, and trait dispersion – new
questions front old patterns. Oikos 74: 159–164.
WILSON, S.W., R. F. DENNO, C. MITTER, AND M. R. WILSON. 1994. Evolutionary patterns of host
plant use by delphacid planthoppers and their relatives (Chapter 1). In R. F. Denno and T. J.
Perfect (Eds). Planthoppers: their ecology and management 7–113. Chapman and Hall, Inc,
New York, US.
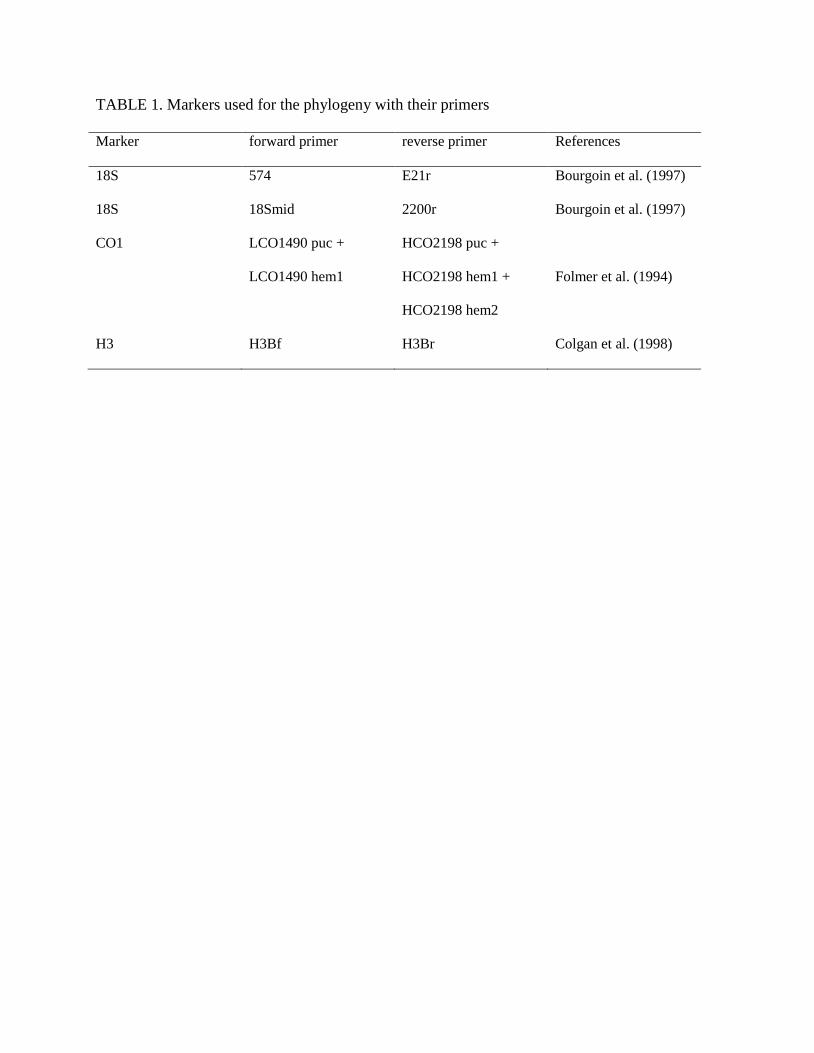
TABLE 1. Markers used for the phylogeny with their primers
Marker forward primer reverse primer References
18S 574 E21r Bourgoin et al. (1997)
18S 18Smid 2200r Bourgoin et al. (1997)
CO1 LCO1490 puc +
LCO1490 hem1
HCO2198 puc +
HCO2198 hem1 +
HCO2198 hem2
Folmer et al. (1994)
H3 H3Bf H3Br Colgan et al. (1998)
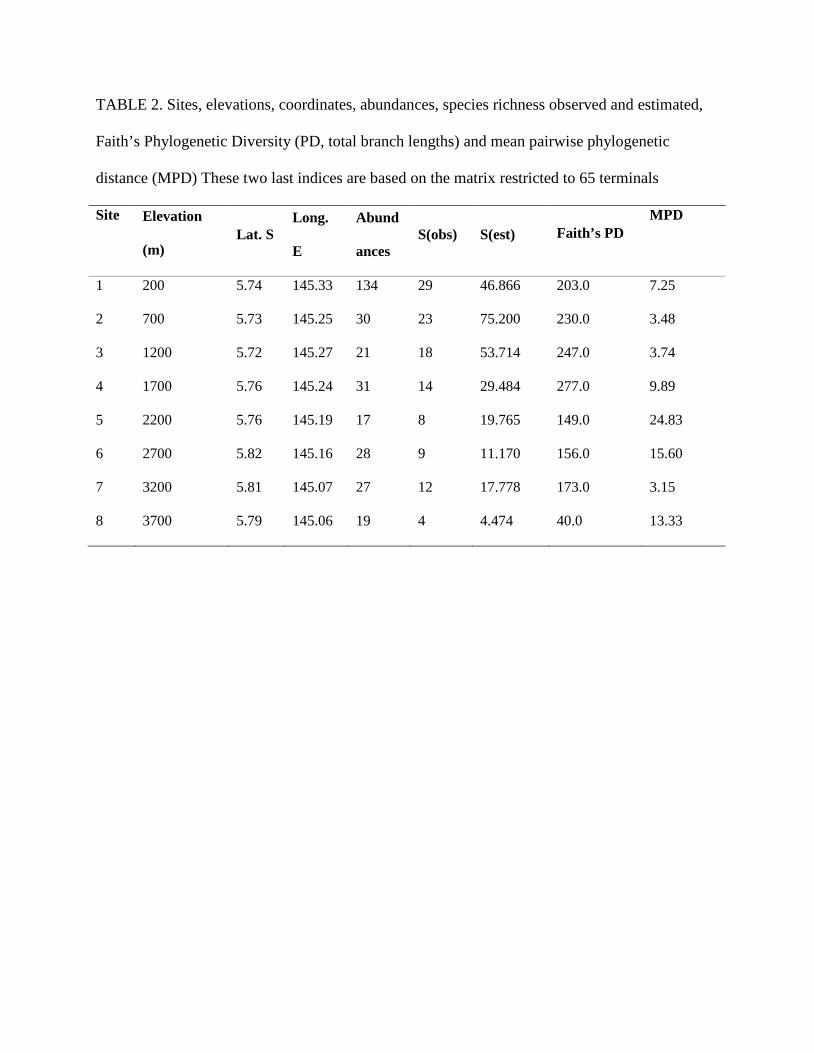
TABLE 2. Sites, elevations, coordinates, abundances, species richness observed and estimated,
Faith’s Phylogenetic Diversity (PD, total branch lengths) and mean pairwise phylogenetic
distance (MPD) These two last indices are based on the matrix restricted to 65 terminals
Site Elevation
(m) Lat. S
Long.
E
Abund
ances S(obs) S(est) Faith’s PD
MPD
1 200 5.74 145.33 134 29 46.866 203.0 7.25
2 700 5.73 145.25 30 23 75.200 230.0 3.48
3 1200 5.72 145.27 21 18 53.714 247.0 3.74
4 1700 5.76 145.24 31 14 29.484 277.0 9.89
5 2200 5.76 145.19 17 8 19.765 149.0 24.83
6 2700 5.82 145.16 28 9 11.170 156.0 15.60
7 3200 5.81 145.07 27 12 17.778 173.0 3.15
8 3700 5.79 145.06 19 4 4.474 40.0 13.33
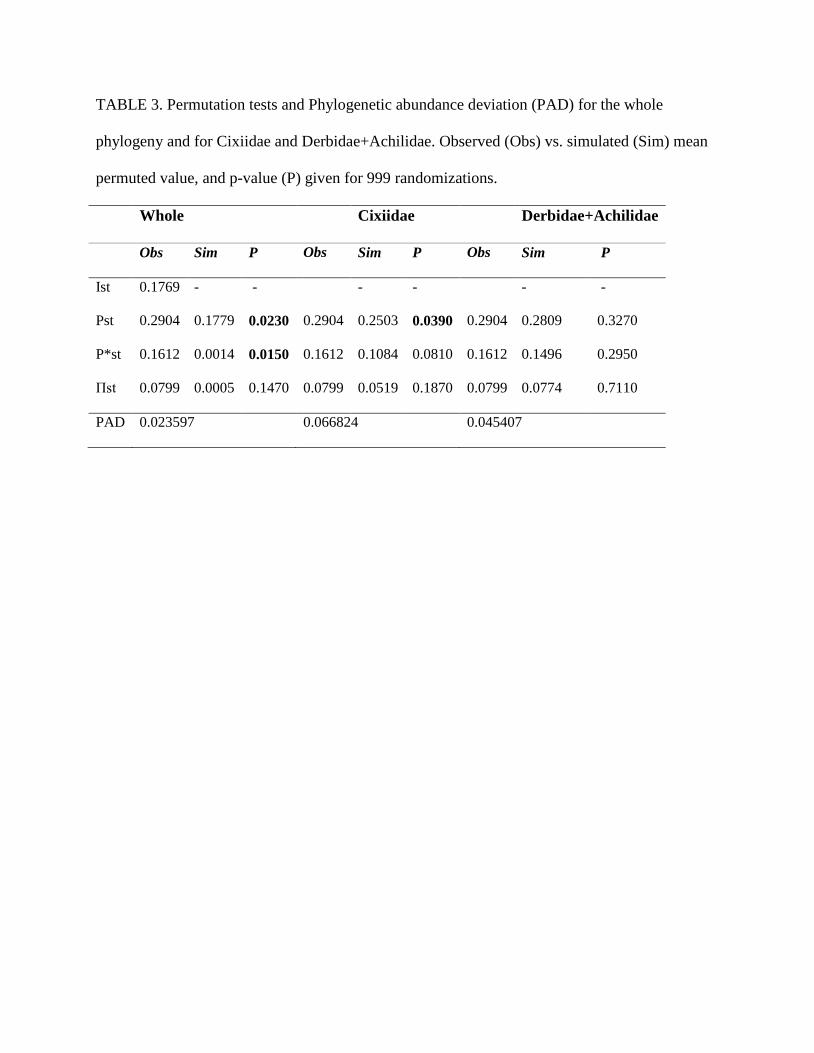
TABLE 3. Permutation tests and Phylogenetic abundance deviation (PAD) for the whole
phylogeny and for Cixiidae and Derbidae+Achilidae. Observed (Obs) vs. simulated (Sim) mean
permuted value, and p-value (P) given for 999 randomizations.
Whole Cixiidae Derbidae+Achilidae
Obs Sim P Obs Sim P Obs Sim P
Ist 0.1769 - - - - - -
Pst 0.2904 0.1779 0.0230 0.2904 0.2503 0.0390 0.2904 0.2809 0.3270
P*st 0.1612 0.0014 0.0150 0.1612 0.1084 0.0810 0.1612 0.1496 0.2950
Πst 0.0799 0.0005 0.1470 0.0799 0.0519 0.1870 0.0799 0.0774 0.7110
PAD 0.023597 0.066824 0.045407
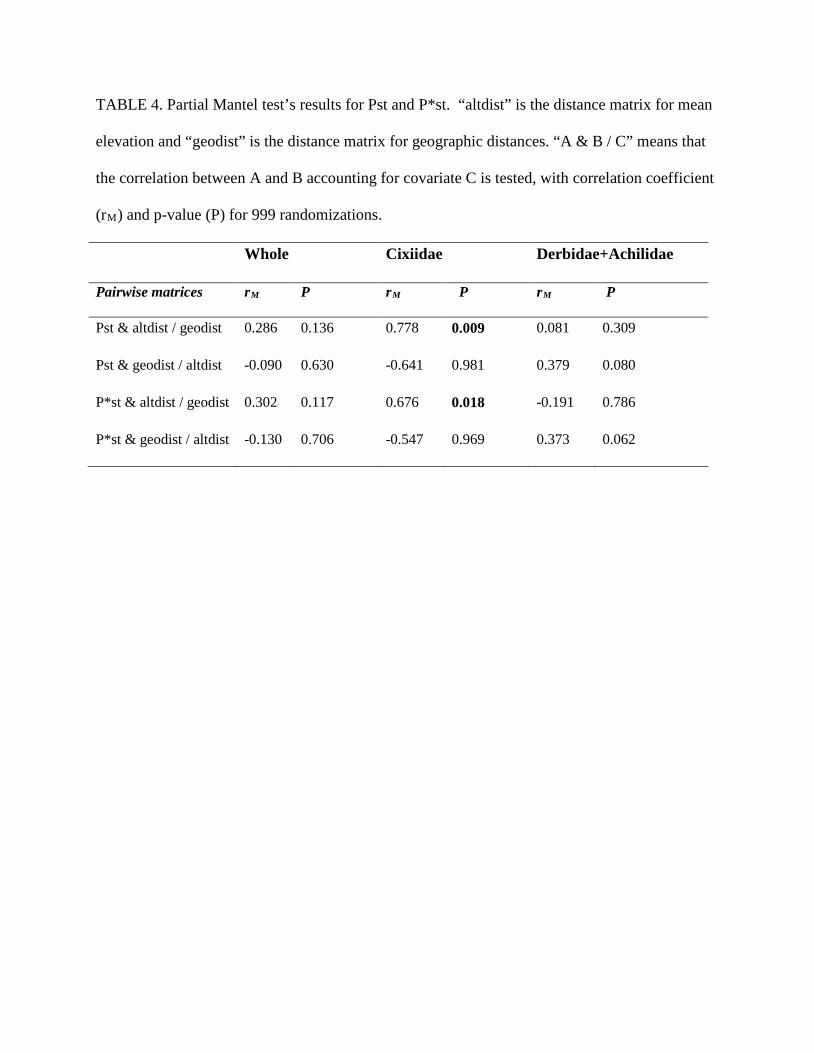
TABLE 4. Partial Mantel test’s results for Pst and P*st. “altdist” is the distance matrix for mean
elevation and “geodist” is the distance matrix for geographic distances. “A & B / C” means that
the correlation between A and B accounting for covariate C is tested, with correlation coefficient
(rM) and p-value (P) for 999 randomizations.
Whole Cixiidae Derbidae+Achilidae
Pairwise matrices rM P rM P rM P
Pst & altdist / geodist 0.286 0.136 0.778 0.009 0.081 0.309
Pst & geodist / altdist -0.090 0.630 -0.641 0.981 0.379 0.080
P*st & altdist / geodist 0.302 0.117 0.676 0.018 -0.191 0.786
P*st & geodist / altdist -0.130 0.706 -0.547 0.969 0.373 0.062
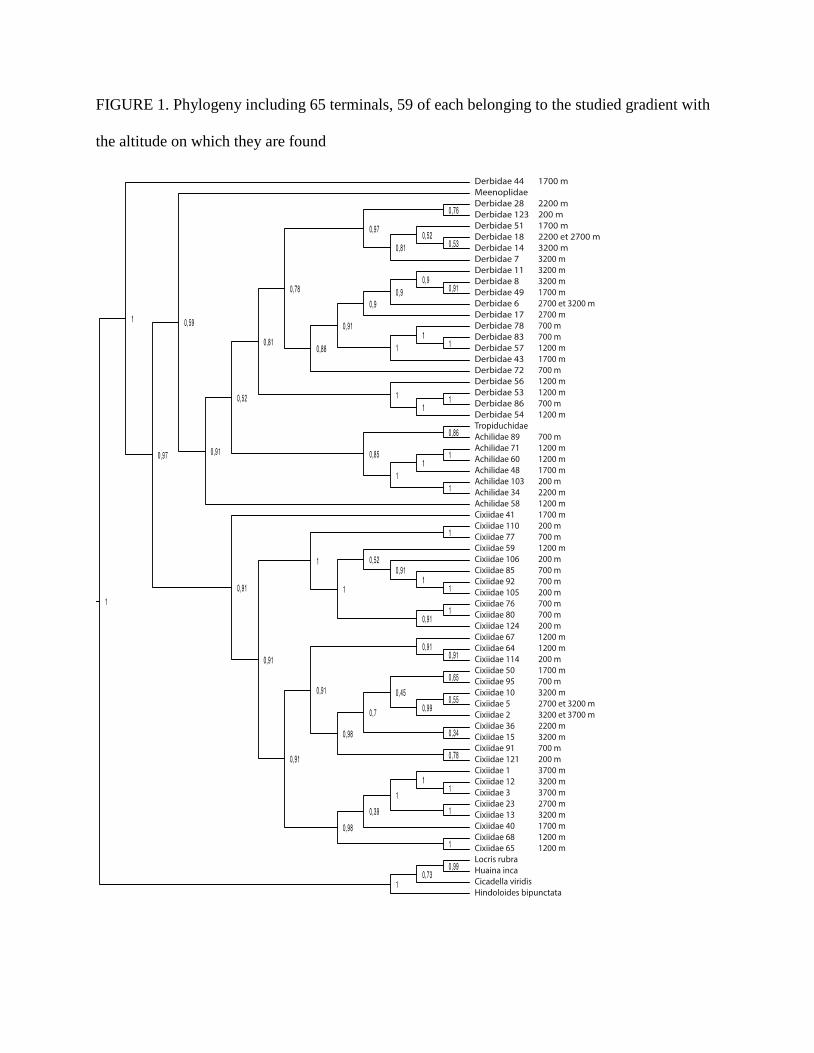
FIGURE 1. Phylogeny including 65 terminals, 59 of each belonging to the studied gradient with
the altitude on which they are found
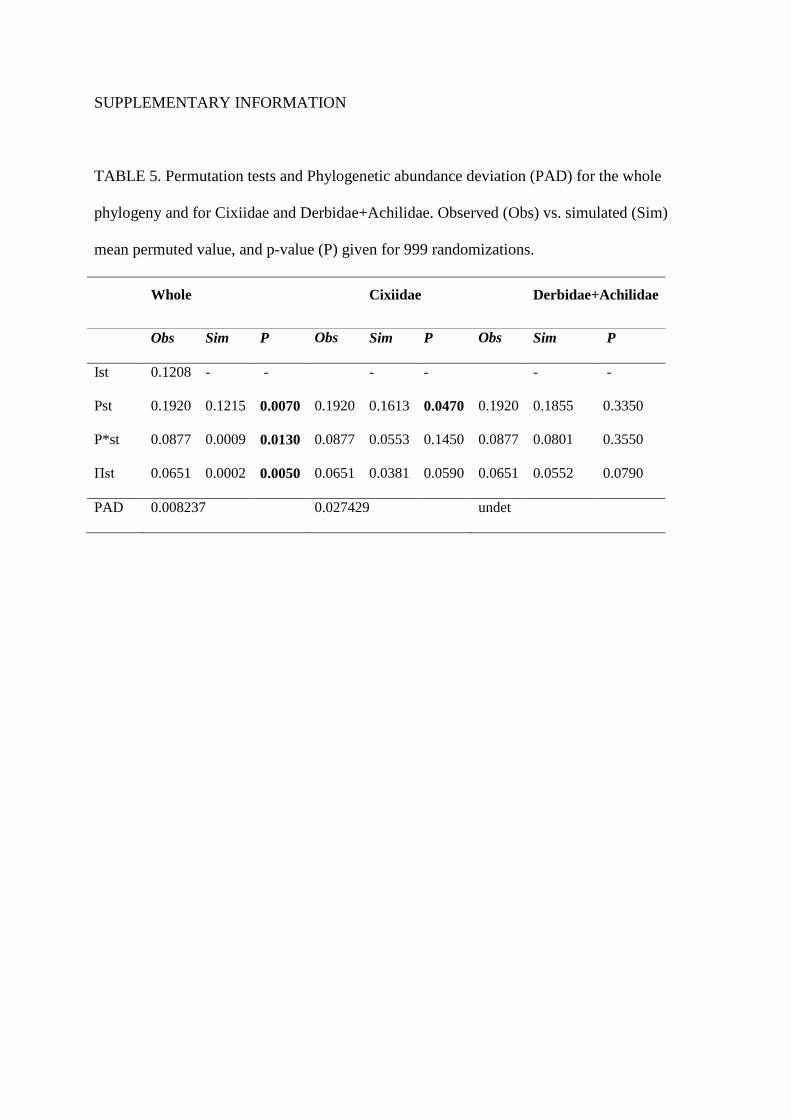
SUPPLEMENTARY INFORMATION
TABLE 5. Permutation tests and Phylogenetic abundance deviation (PAD) for the whole
phylogeny and for Cixiidae and Derbidae+Achilidae. Observed (Obs) vs. simulated (Sim)
mean permuted value, and p-value (P) given for 999 randomizations.
Whole Cixiidae Derbidae+Achilidae
Obs Sim P Obs Sim P Obs Sim P
Ist 0.1208 - - - - - -
Pst 0.1920 0.1215 0.0070 0.1920 0.1613 0.0470 0.1920 0.1855 0.3350
P*st 0.0877 0.0009 0.0130 0.0877 0.0553 0.1450 0.0877 0.0801 0.3550
Πst 0.0651 0.0002 0.0050 0.0651 0.0381 0.0590 0.0651 0.0552 0.0790
PAD 0.008237 0.027429 undet
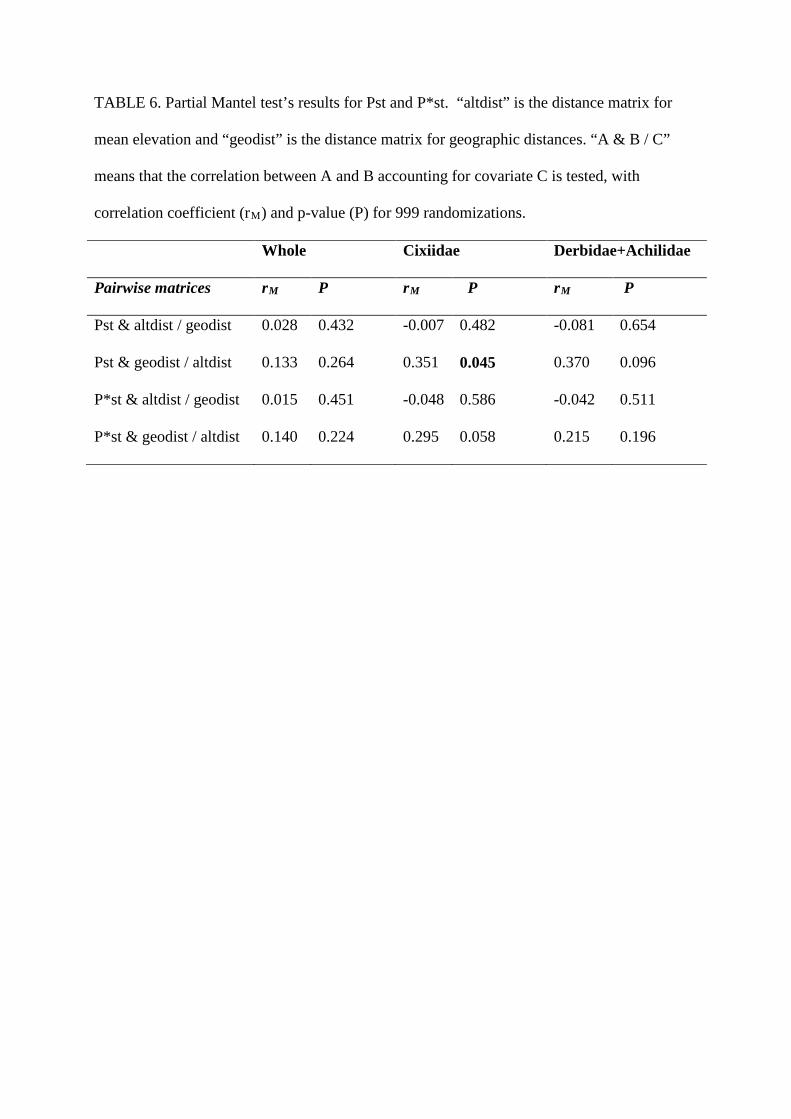
TABLE 6. Partial Mantel test’s results for Pst and P*st. “altdist” is the distance matrix for
mean elevation and “geodist” is the distance matrix for geographic distances. “A & B / C”
means that the correlation between A and B accounting for covariate C is tested, with
correlation coefficient (rM) and p-value (P) for 999 randomizations.
Whole Cixiidae Derbidae+Achilidae
Pairwise matrices rM P rM P rM P
Pst & altdist / geodist 0.028 0.432 -0.007 0.482 -0.081 0.654
Pst & geodist / altdist 0.133 0.264 0.351 0.045 0.370 0.096
P*st & altdist / geodist 0.015 0.451 -0.048 0.586 -0.042 0.511
P*st & geodist / altdist 0.140 0.224 0.295 0.058 0.215 0.196
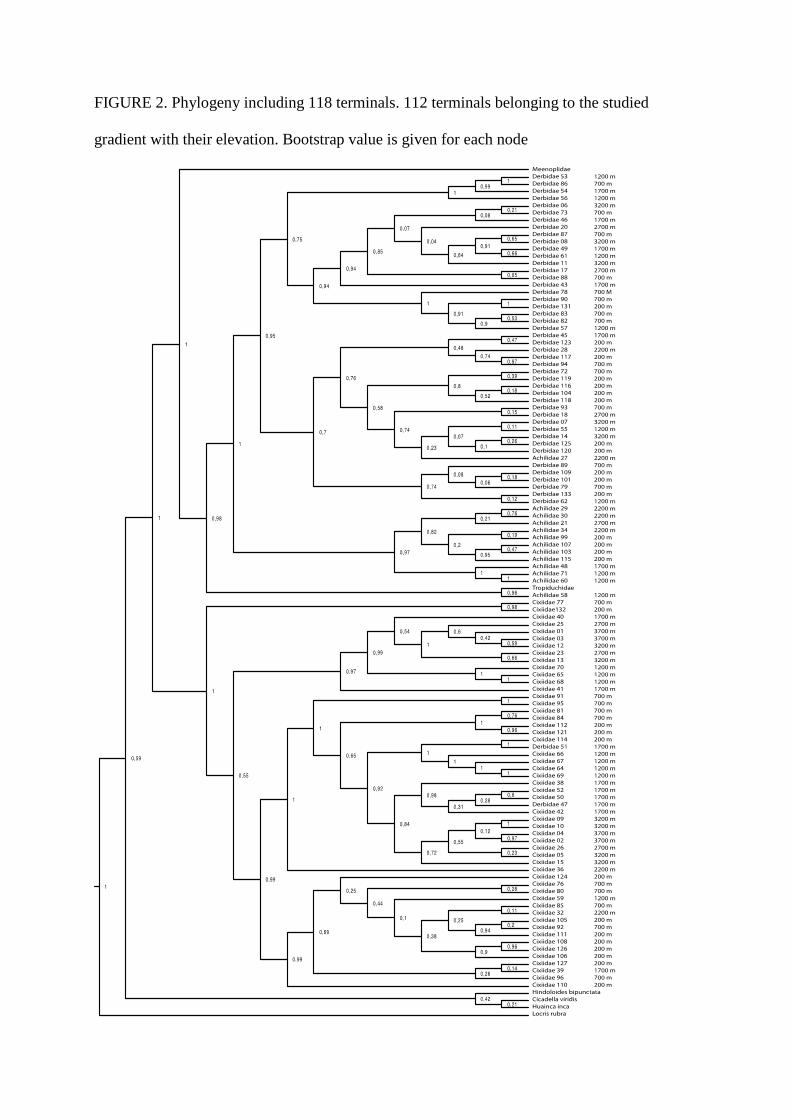
FIGURE 2. Phylogeny including 118 terminals. 112 terminals belonging to the studied
gradient with their elevation. Bootstrap value is given for each node
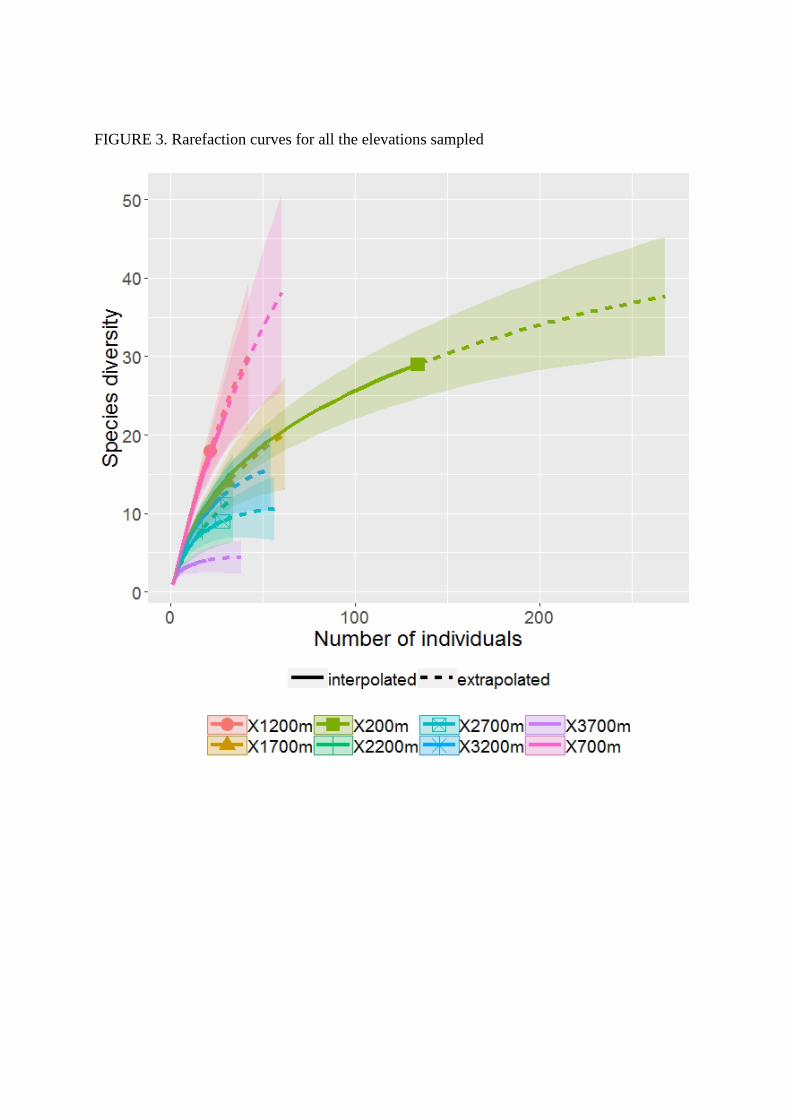
FIGURE 3. Rarefaction curves for all the elevations sampled