Embed Size (px)
Citation preview
ELL SURVEY PART I Selected Excerpts
Bilingual, Immigrant and Refugee Director’s Meeting Seattle, Washington
Gabriela Uro and Alejandra Barrio May 2011
• Data for 65 districts - includes district responses and NCES data
• ELLs comprised 16% – 17% of student enrollment in our districts from SY2007-08 to SY2009-10. (See Table 1, page 3)
• ELL enrollment has remained relatively stable over this 3 year period
• Most districts experienced a 2 percentage point fluctuation in their ELL enrollment.
• Districts experiencing the largest change in ELL percentage: Providence (5.5 percent point increase) and Chicago (5.7 percent point decrease) (See Table 2, page 4)
ELL Enrollment ELL Percentages and Changes in Enrollment
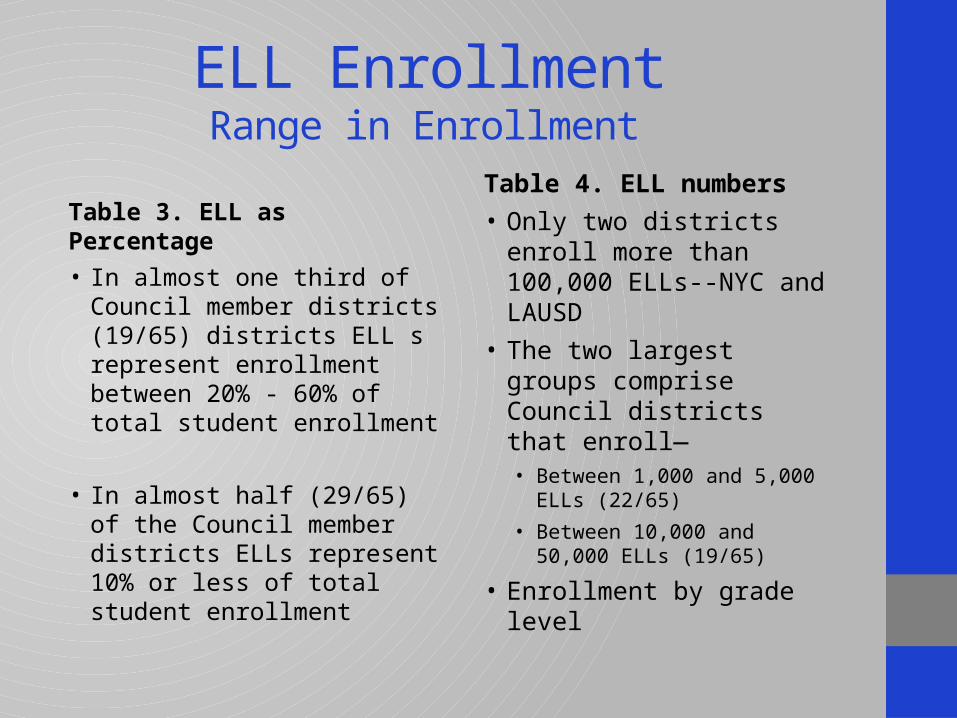
Table 3. ELL as Percentage• In almost one third of Council
member districts (19/65) districts ELL s represent enrollment between 20% - 60% of total student enrollment
• In almost half (29/65) of the
Council member districts ELLs represent 10% or less of total student enrollment
Table 4. ELL numbers• Only two districts enroll more
than 100,000 ELLs--NYC and LAUSD
• The two largest groups comprise Council districts that enroll—• Between 1,000 and 5,000 ELLs
(22/65)• Between 10,000 and 50,000 ELLs
(19/65)
• Enrollment by grade level
ELL Enrollment Range in Enrollment

Total Students
Total Non-ELLs
Total ELLs
Students in Special Ed.
Non-ELLs in Special ED
ELLs in Special Ed.
2007-08 4,381,299 3,545,381 845,376 543,536 439,525 104,011
2008-09 4,376,267 3,549,446 835,918 553,674 446,316 107,358
2009-10 4,343,543 3,516,722 826,821 563,725 449,661 114,064
Change from 07-08 to 09-10 -37,756 -28,659 -18,555 +20,189 +10,136 +10,053
• Overall enrollment decreased in these districts 29,000 fewer Non-ELLs and 19,000 fewer ELLs.
• However, the number of ELLs and Non-ELLs classified as requiring special education services increase in these districts 10,000 more Non-ELLs and 10,000 ELLs in Special Education
Number of ELLs identified as requiring Special Education Services (33 districts)
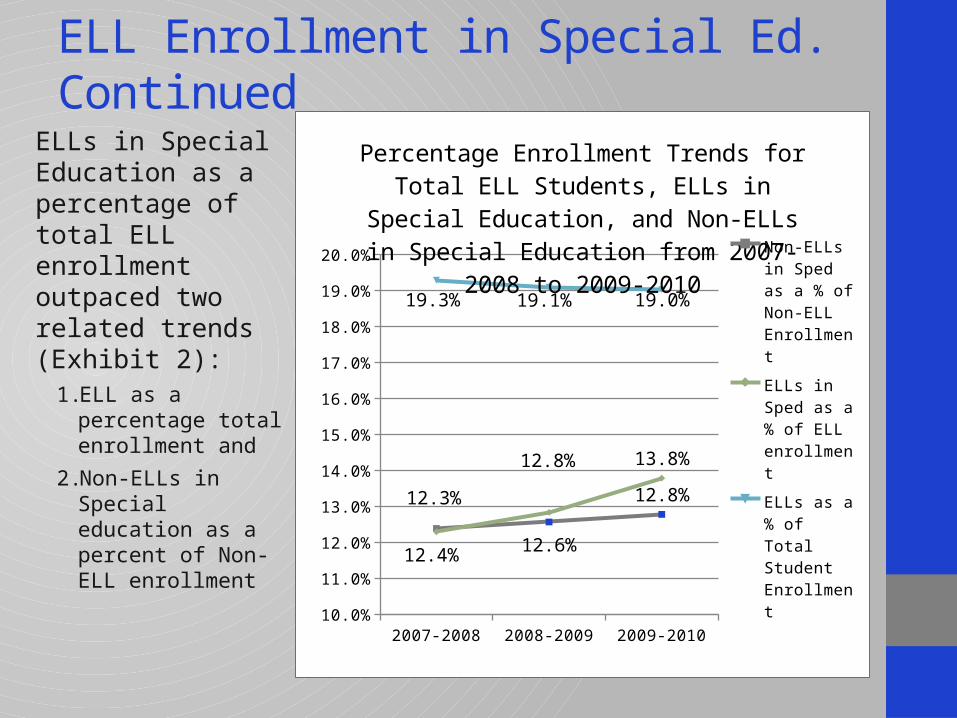
ELLs in Special Education as a percentage of total ELL enrollment outpaced two related trends (Exhibit 2):
1. ELL as a percentage total enrollment and
2. Non-ELLs in Special education as a percent of Non-ELL enrollment
ELL Enrollment in Special Ed. Continued
2007-2008 2008-2009 2009-201010.0%
11.0%
12.0%
13.0%
14.0%
15.0%
16.0%
17.0%
18.0%
19.0%
20.0%
12.4% 12.6%
12.8%12.3%
12.8% 13.8%
19.3% 19.1% 19.0%
Percentage Enrollment Trends for Total ELL Students, ELLs in Special Education, and Non-ELLs in Special Education from 2007-2008 to
2009-2010
Non-ELLs in Sped as a % of Non-ELL Enrollment
ELLs in Sped as a % of ELL enrollment
ELLs as a % of Total Student Enrollment
Risk ratio – likelihood that an ELL would be classified with a disability compared to Non-ELL students. • 1:1 risk ratio = ELLs and Non-ELLs
have the same likelihood of being eligible for Special Education services
• Risk ratio of 2 = ELLs are twice as likely as Non-ELLs to be classified as requiring special education services
• Risk ratio of 0.5 = ELLs are half as likely as Non-ELLs to be classified as requiring special education services
A risk ratio above 2 or below 0.5 is cause for concern--• Three out of 4 reporting
districts had a risk ratio above 0.5 and below 2
• 6 districts had a risk ratio below 0.5
• 1 district had a risk ratio above 2
ELL’s representation in Special Education
English Proficiency Levels for the 2009-2010 School Year
• Exhibit 6 provides a graphic representation of a Sample District’s total K-5 ELLs at each Level of English proficiency disaggregated by
• Those who have been in program for 3 to 5 years
• Those who have been in program for more than five years
• Does not include ELLs who have been in program for less than 3 years
36 districts provided data on English proficiency levels for ELLs disaggregated by the number of years that these ELLs have been participating in programs by the 2009-2010 school year.

What percentage of ELLs at level 1 ELP have been in program for more than 5 years?
Level 1 Level 2 Level 3 Level 4 Level 5
3-5 yrs 0.1216287678477
0.31037037037037
0.509873899595527
0.53695652173913
0.472906403940887
More than 5 yrs
0.0237969328397673
0.0559259259259259
0.0875565072567214
0.0478260869565218
0.0197044334975369
5%15%25%35%45%55%
Number of K-5 ELLs by Years in Program as a Percentage of Total ELLs at Each Proficiency
Level
Perc
enta
ge o
f Eac
h Le
vel
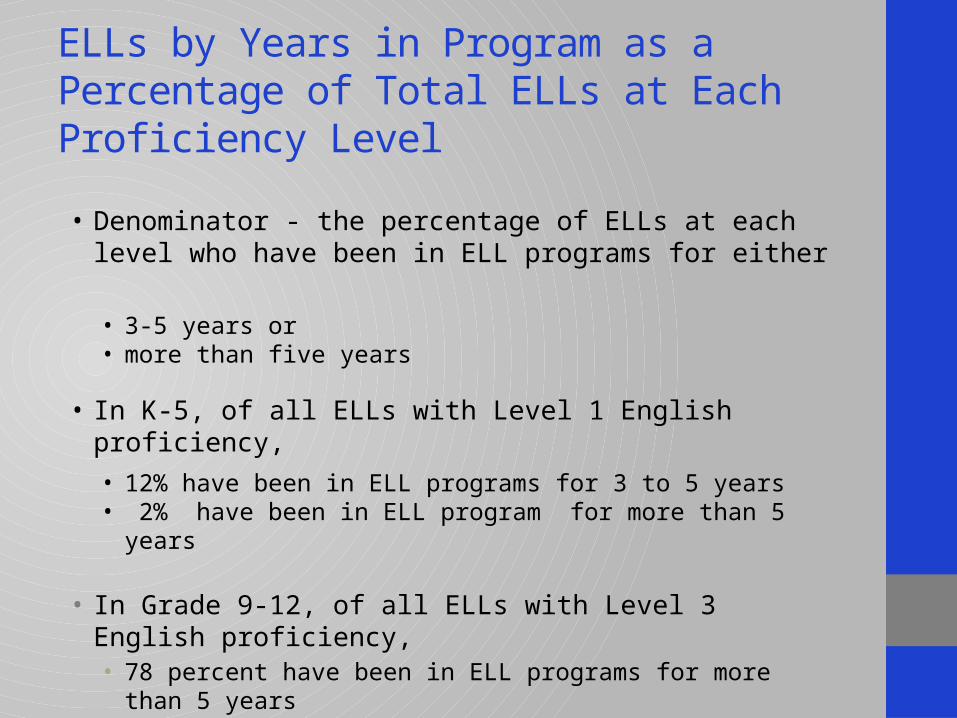
ELLs by Years in Program as a Percentage of Total ELLs at Each Proficiency Level
• Denominator - the percentage of ELLs at each level who have been in ELL programs for either • 3-5 years or • more than five years
• In K-5, of all ELLs with Level 1 English proficiency,• 12% have been in ELL programs for 3 to 5 years • 2% have been in ELL program for more than 5 years
• In Grade 9-12, of all ELLs with Level 3 English proficiency,• 78 percent have been in ELL programs for more than 5 years• 15 percent have been in ELL programs for 3-5 years
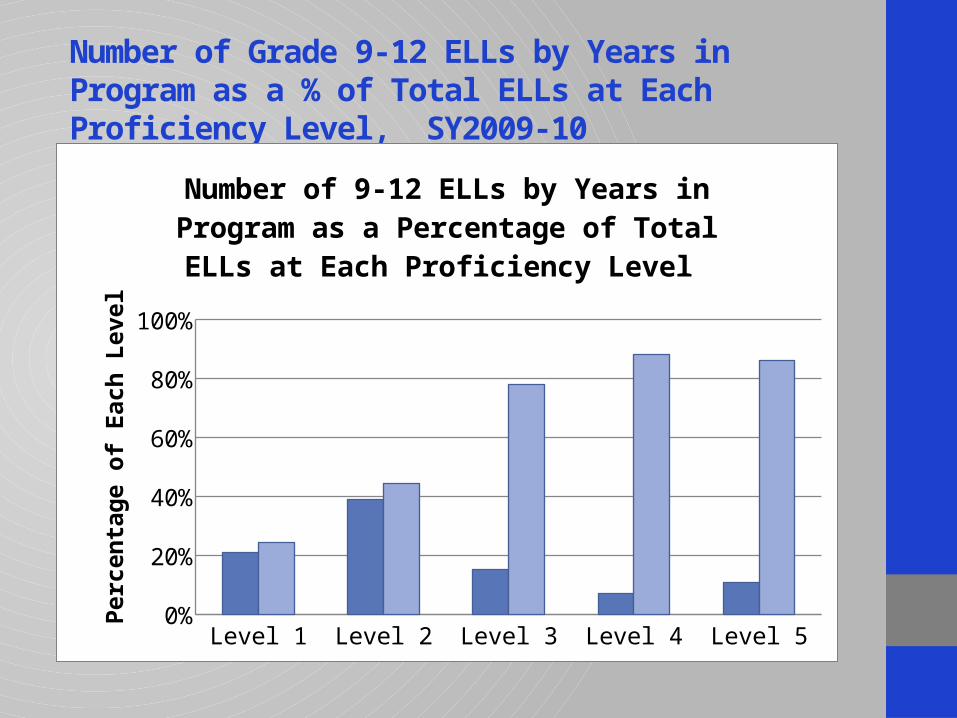
Number of Grade 9-12 ELLs by Years in Program as a % of Total ELLs at Each Proficiency Level, SY2009-10
Level 1 Level 2 Level 3 Level 4 Level 5
3-5 yrs 0.20952380952381
0.390191897654584
0.153117600631413
0.0710194730813288
0.107758620689655
More than 5 yrs
0.242857142857143
0.445628997867804
0.779005524861878
0.883161512027492
0.862068965517241
5%
25%
45%
65%
85%
Number of 9-12 ELLs by Years in Program as a Percentage of Total ELLs at Each Proficiency Level
Perc
enta
ge o
f Eac
h Le
vel

What is the percentage distribution across ELP levels for ELLs in program for more than 5 years?
• A total of 4,638 ELLs in Grades K-5 were in the district’s ELL program for 3-5 years, of which--• 5 percent were at Level 1
• 46 percent were at Level 3 English proficiency
• A total of 682 ELLs in Grades K-5 were in ELL programs for more than 5 years, of which-• 54 percent were at Level 3
• 22 percent were at Level 2 of English proficiency
3-5 yrs More than 5 yrs
Level 1 0.0495903406640793
0.0659824046920821
Level 2 0.180681328158689
0.221407624633431
Level 3 0.462052608883139
0.539589442815249
Level 4 0.266278568348426
0.161290322580645
Level 5 0.0413971539456662
0.0117302052785924
5%15%25%35%45%55%
Number of K - 5 ELLs by Level as a Percentage of Total ELLs by Years in Program
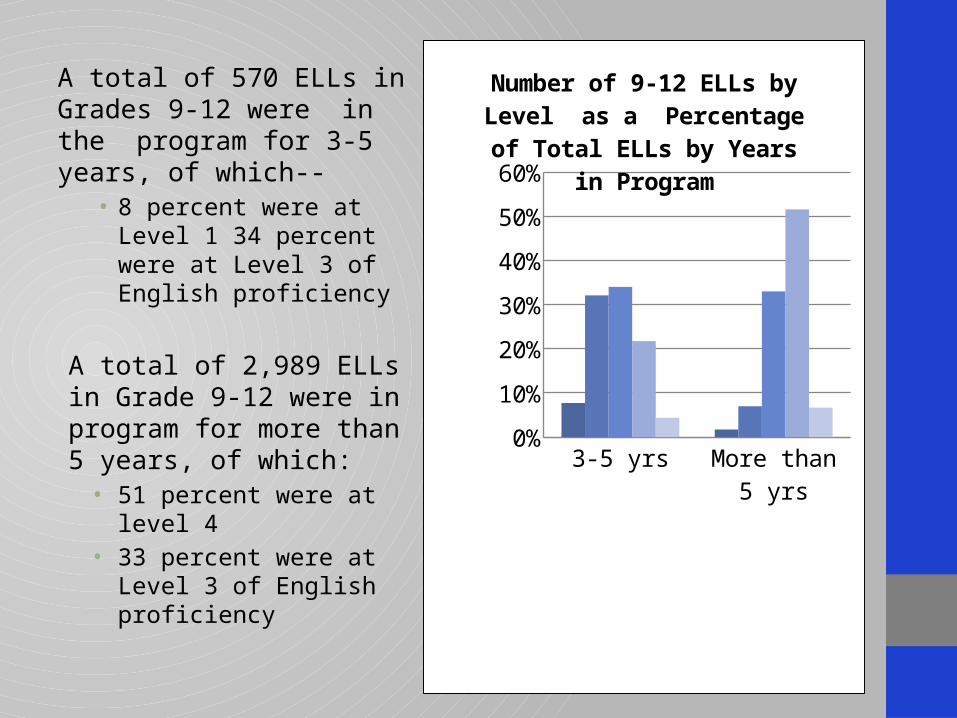
A total of 570 ELLs in Grades 9-12 were in the program for 3-5 years, of which--
• 8 percent were at Level 1 34 percent were at Level 3 of English proficiency
A total of 2,989 ELLs in Grade 9-12 were in program for more than 5 years, of which:• 51 percent were at level 4• 33 percent were at Level 3
of English proficiency
3-5 yrs More than 5 yrs
Level 1 0.0771929824561404
0.01706256273001
Level 2 0.321052631578947
0.0699230511876882
Level 3 0.340350877192983
0.330210772833724
Level 4 0.217543859649123
0.515891602542657
Level 5 0.043859649122807
0.0669120107059217
5%
15%
25%
35%
45%
55%
Number of 9-12 ELLs by Level as a Percentage of Total ELLs by Years
in Program

NAEP Achievement
NAEP Reading and Mathematics results for National Public (NP) and Large City (LC)
Common assessment allows for comparisons across Council member districts
LC sample captures 82 percent of Council membership Period analyzed—2005 to 2011 Focus: percent of students performing at or above Proficient
(NAEP reports on Basic, Proficient and Advanced)

Sample Findings on NAEPAchievement gap widens due to rising scores for Non-ELLs and little progress for ELLs (both NP and LC)• In both Reading and Mathematics, non-ELLs see a steady rise in
performance• ELL achievement lags that of Non-ELLs—about 20 percentage points• Gaps widen for both subjects in both Grade 4 and 8
NAEP Achievement for Formerly ELLs in Grade 4 show positive signs• In both Reading and Mathematics Formerly ELLs almost reach
parity with Non-ELLs on Grade 4 NAEP• In Grade 8, Formerly ELLs do not keep up with Non-ELL progress
on NAEP in both Reading and Math
Instructional Staff• Total aggregate figures (Tables 10 page 26, and 12 page 27)• District by district figures (Tables 11 page 27, and 14 page 28)• Analysis focused on quantitative patterns• Interest in qualitative (state laws, requirements, negotiated
agreements, etc.)?
Troubleshooting & Options1) Reconciling discrepancies of data among different sources—• Council’s ELL Survey—self-reported, NCES and district
websites• Council’s Beating the Odds—NCES, district and state
websites2) ELL enrollment data—other displays, analyses3) Grade level disaggregation
a) By grade levelb) By grade spanc) By school level (elementary, secondary)d) As defined by state
Troubleshooting & Options
4) Grade Level Disaggregation as determined in (2) for—
a) Achievement
b) Teacher assignments/qualifications
c) Other
5) Achievement Data Analysisd) English Proficiency (State, WIDA, etc.)
e) State Assessments
f) Other nationally normed common assessments (SAT-10, Aprenda, etc.)
a)6) OCR data—school experiencea)In-house analyses and comparisons